Modeling the Effect of Desert Urbanization on Local Climate and Natural Dust Generation: A Case Study for Erbil, Iraq

1
School for Engineering of Matter, Transport, and Energy, Arizona State University, Tempe, AZ 85281, USA
2
Department of Mechanical Engineering, College of Engineering, University of Duhok, Zakho Street 38, Duhok 1006 AJ, Kurdistan Region 42001, Iraq
*
Authors to whom correspondence should be addressed.
Urban Sci. 2020, 4(4), 46; https://doi.org/10.3390/urbansci4040046
Submission received: 13 August 2020
/
Revised: 9 September 2020
/
Accepted: 25 September 2020
/
Published: 28 September 2020
Abstract
:This study uses a suite of meteorological and land-surface models to quantify the changes in local climate and surface dust fluxes associated with desert urbanization. Formulas connecting friction velocity and soil moisture to dust generation are used to quantify surface fluxes for natural wind-blown dust. The models are used to conduct a series of simulations for the desert city of Erbil across a period of rapid urbanization. The results show significant nighttime warming and weak but robust daytime cooling associated with desert urbanization. A slight reduction in near-surface wind speed is also found in the areas undergoing urbanization. These findings are consistent with previous empirical and modeling studies on other desert cities. Numerical models and empirical formulas are used to produce climatological maps of surface dust fluxes as a function of season, and for the pre- and post-urbanization eras. This framework can potentially be used to bridge the gap in observation on the trends in local dust generation associated with land-use changes and urban expansions.
1. Introduction
The rapid urban expansion that occurred in desert and semi-arid regions in the past decades has profound impacts on the environment and sustainability [1]. Those dry regions, while already under high environmental stress, have also seen an acceleration of population growth ([1,2]) that compounds the difficulty of mitigating the environmental impacts. For scientists and stakeholders, it is a major challenge to quantify the changes in critical environmental variables associated with desert urbanization.
Land-use changes associated with desert urbanization affect local weather, water resources, even air quality. Some of those effects are specific to desert cities. For example, while many non-desert cities experience warming in both daytime and nighttime, a weak but robust daytime cooling is known for desert cities from observation ([3,4,5,6,7]) and numerical modeling ([8,9]). The arid land surface surrounding a desert city is an ideal ground for the generation of wind-blown dust. The dust fluxes vary with soil moisture and the strength of near-surface turbulence, both of which are affected by urbanization. This aspect has received less attention compared to the effect of temperature. This study aims to use a system of numerical models to quantify the changes in temperature, wind, and natural dust generation associated with desert urbanization.
While long-term observations for surface temperature are available for a small number of desert cities (e.g., [3,4]), similar observations of atmospheric wind and surface dust fluxes are generally lacking for determining the changes in these quantities due to urbanization. Given the limited availability of observations, numerical simulation has been increasingly adopted as an alternative approach for quantifying the effects of urbanization beyond warming and cooling. For example, the changes in wind and diurnal circulation due to urbanization were simulated by [10] for a non-desert city, and [8] for a desert city. These studies did not quantify dust generation. This work adopts the framework of numerical modeling, close to the setting of [8], but further expands it by connecting the meteorological and soil variables to the parameters that determine the surface dust fluxes.
The expanded modeling system combines a meteorological model and a land surface model to simulate local wind, temperature, precipitation, and the evolution of soil moisture. These quantities are used as inputs to a set of empirical formulas to quantify natural dust fluxes for pre- and post-urbanization eras. While the approach of combining similar empirical formulas to a meteorological model for the evaluation of dust fluxes has been used before, previous studies (e.g., [11,12]) used it only for short-term weather and air quality forecasts, while this study adopts it for long simulations under land-use changes in the context of desert urbanization.
To test the modeling system, the suite of numerical models is applied to the city of Erbil in northern Iraq. It is a relatively isolated desert city that has undergone a rapid expansion in the turn of the 21st century ([7,13]). The city was chosen for the first test of the modeling system because of its relatively simple landscape; its urban and suburban areas include only a few types of land cover, and the surrounding region has uncomplicated terrains. Moreover, the city has relatively few high-rise structures but is dominated by low-rise buildings of uniform impervious material ([13,14]). This allows a relatively simple setting of urban land cover in the numerical models, which allows a clearer analysis and interpretation of the model output. By comparing the numerical simulations for Erbil under pre- and post-urbanization conditions, we determine the local climate change and the related change in surface dust fluxes induced by urbanization. The relations between local meteorological conditions and dust fluxes are also analyzed.
Although we focus on the simulation for only one city, the modeling framework developed in this study can be applied to other desert cities. The outlook for applications and future generalizations of the modeling system will also be discussed.
2. Numerical Models and Methodology
2.1. Meteorological Model and Boundary Conditions
The numerical simulations in this work use a suite of models: (i) a meso-scale meteorological model that is used to simulate local wind, temperature, and precipitation; (ii) a land surface model that computes the interaction between the land surface and the atmosphere, and the evolution of soil moisture; (iii) a turbulence model that conveys the information of large-scale meteorological fields into the intensity of near surface turbulence; (iv) an empirical model that relates turbulence parameters and soil moisture to dust fluxes. In general, airborne dust can be produced by natural and anthropogenic processes. Due to a lack of pollution inventory for industrial dust generation over desert cities, this study considers only natural wind-blown dust.
Meteorological modeling at urban scale was carried out using the Weather Research and Forecasting (WRF) model [15], Version 3.3.1. All other components of the suite of models are either embedded in WRF or are implemented as extensions to it.
We used nesting of grids in WRF to allow a higher spatial resolution over the target urban area, which is placed in the innermost domain of the model. This domain is nested within larger domains with successively coarser resolutions. To prevent climate drift in seasonal simulations, the lateral boundary conditions for the outermost domain are constrained by large-scale observations from global analysis, specifically the National Centers for Environmental Prediction (NCEP) Final (FNL) data. This is done broadly in the context of dynamical downscaling ([16,17,18,19,20]).
To process the interaction among the atmosphere, land surface, and sub-surface soil layers, the Noah land surface model [21] was activated within WRF. It calculates the surface fluxes of heat, moisture, and momentum, and simulates the evolution of soil moisture according to a diffusion process and the source and sink due to precipitation and evaporation. The soil moisture at surface will be a key parameter for later calculations of dust fluxes.
Further embedded in the land-surface model is an Urban Canopy Model (UCM), which was also activated in our simulations to modify the surface energy balance and exchanges of fluxes over urban areas. We choose the single-layer UCM developed by [22,23]. The UCM allows users to set urban parameters, such as building heights, roughness length above urban canyons (for momentum equation), urban fraction, and heat capacity of the material in the built environment. Since the details of these parameters over the history of urbanization are not easily obtained, we use a relatively generic setting similar to that in [8] and [9] for desert cities. For example, building height, urban fraction, and heat capacity of roofs were chosen to be 7.5 m, 0.9, and 1 × 10⁶ J/m3K, respectively. The effects of more complicated spatial arrangements of urban buildings on temperature (e.g., [24,25]) are not considered.
The dynamical core of WRF produces meso-scale meteorological fields at the model grid, which is still too coarse in the boundary layer to resolve turbulence. Since the strength of turbulence, in terms of friction velocity u*, at near-surface is relevant to the calculation of dust fluxes, we also activated a turbulence model embedded in WRF to compute eddy momentum and heat fluxes due to subgrid-scale turbulence. For this purpose, we selected the YSU Non-local-K scheme ([26,27]).
2.2. Calculation of Surface Dust Fluxes
For natural wind-blown dust, surface dust fluxes generally depend on the strength of turbulence, soil moisture, and the type of soil at the surface. These relations were previously determined in laboratory experiments. Our approach is to synthesize existing empirical formulas into a form that can be used to connect WRF model output to dust fluxes. This approach is inspired by the previous study in [12], which used the framework to perform short-term predictions of air pollution. Related surveys can be found in [11,12].
Based on the experimental works of [28,29,30], the vertical mass flux (Df) for dust particles with a radius less than 10µm is expressed as a function of turbulent friction velocity u*,
where is a threshold value, given below, and R is a fractional parameter that depends on land-surface types, as given in Table 1 (compiled after [11,12]) for the USGS 24-category land-cover classification used in WRF.
The threshold value of friction velocity in Equation (1) depends on surface roughness and soil moisture. With a wet surface, a greater strength of turbulence is required to blow dust off the surface. Synthesizing empirical relations developed by [30,31,32], we first compute a baseline value for as
where is the surface roughness length, which depends on the land-surface type, as given in Table 1. Then, the threshold value, , is computed by
where w is the volumetric soil moisture, and where C is the fractional content of clay in the soil. In our simulations, we simplify the determination of by assuming a 50% clay content, which gives a fixed value of . The formulas from the laboratory experiments do not provide the detailed size distribution of the dust. Thus, we restrict the calculations to the bulk (total) dust fluxes.
3. Setup of Numerical Simulations for Erbil
3.1. The Focus Location and Model Domain
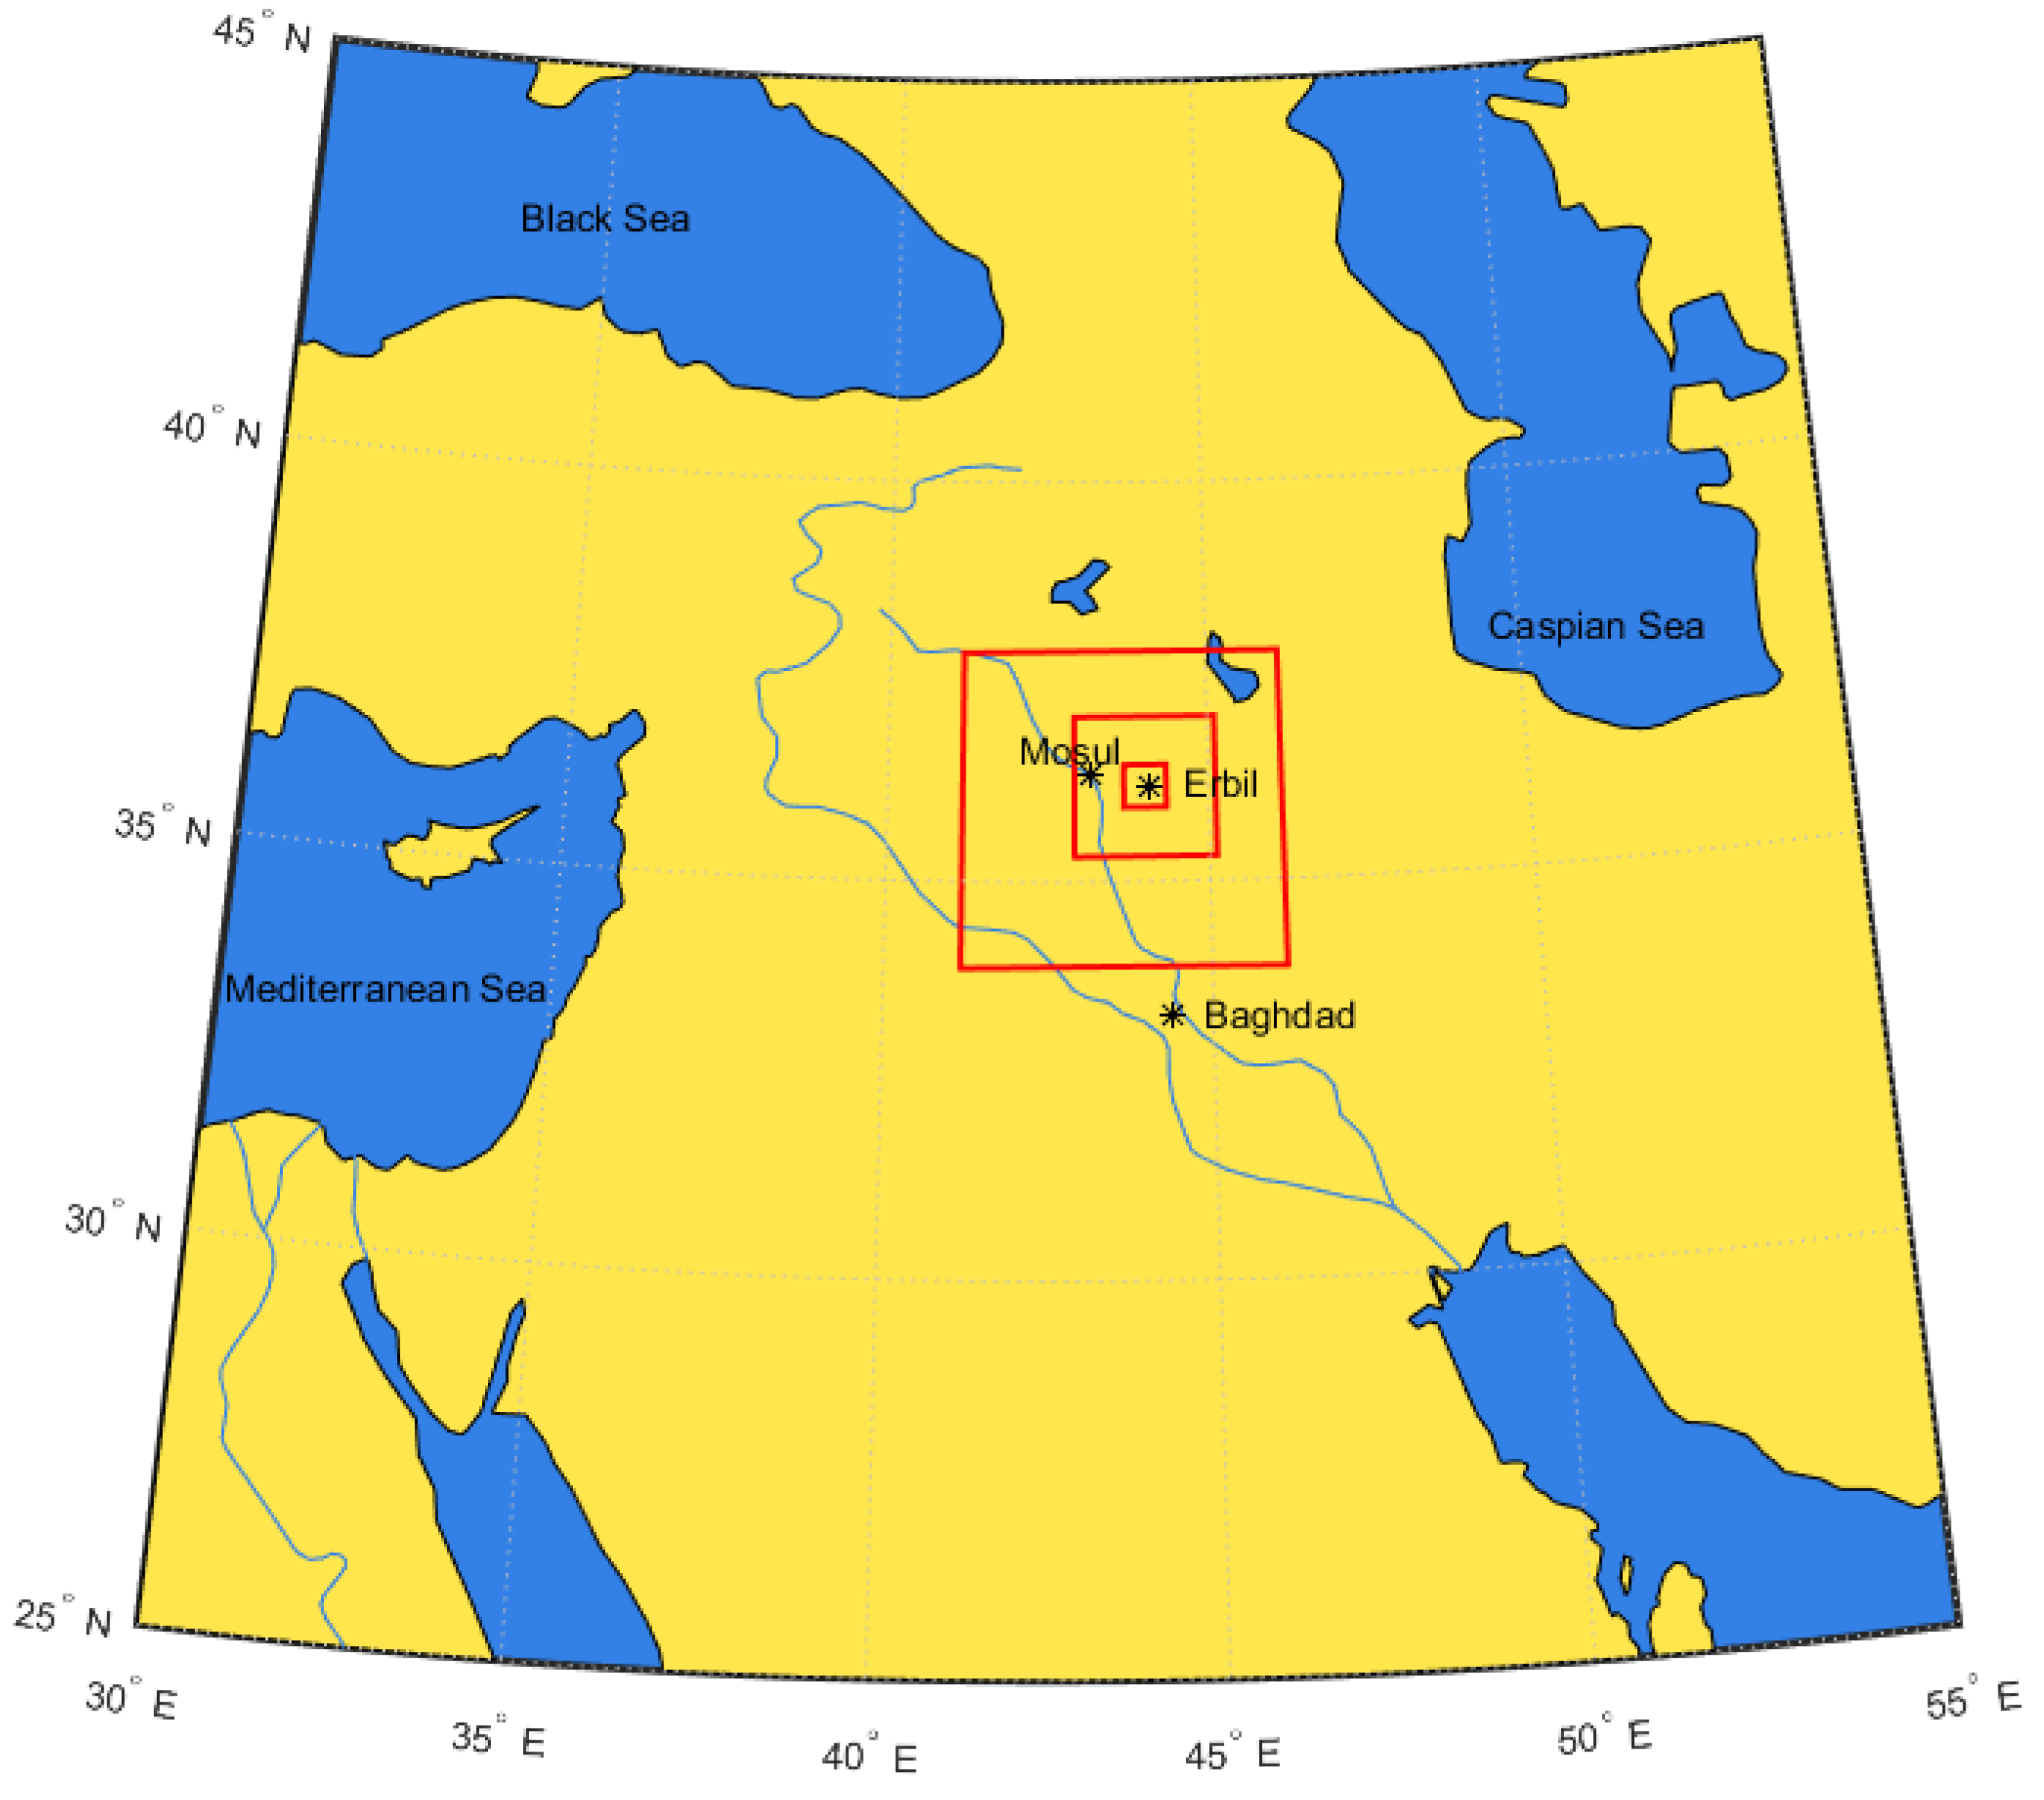
We tested the numerical framework by applying it to a desert city that has undergone a rapid expansion in recent decades. Furthermore, to facilitate a clear interpretation of the numerical results, we chose a city that (i) has a clearly defined boundary and is surrounded by relatively simple pre-urbanization land cover, and (ii) is located over smooth topography so as to minimize the effect of complex terrains. Based on those considerations, we selected Erbil in northern Iraq (centered at approximately 36.2° N and 44.09° E) as the target city. The city and its surrounding region are placed in the innermost domain of WRF. It is nested within two more sets of coarser grids. The nested domains are shown in Figure 1. The horizontal resolutions of the innermost, intermediate, and outermost domain are 1 km, 5 km, and 25 km, respectively. The linear dimensions of the three domains are approximately 60 km, 300 km, and 1500 km. (The innermost domain consists of 60 × 60 grid boxes, each with the size of 1 km × 1 km.) Twenty-eight terrain-following vertical levels (the “η-levels” in WRF) are used in all three domains, with the pressure at top of the model set to p = 50 mb (5000 Pa).
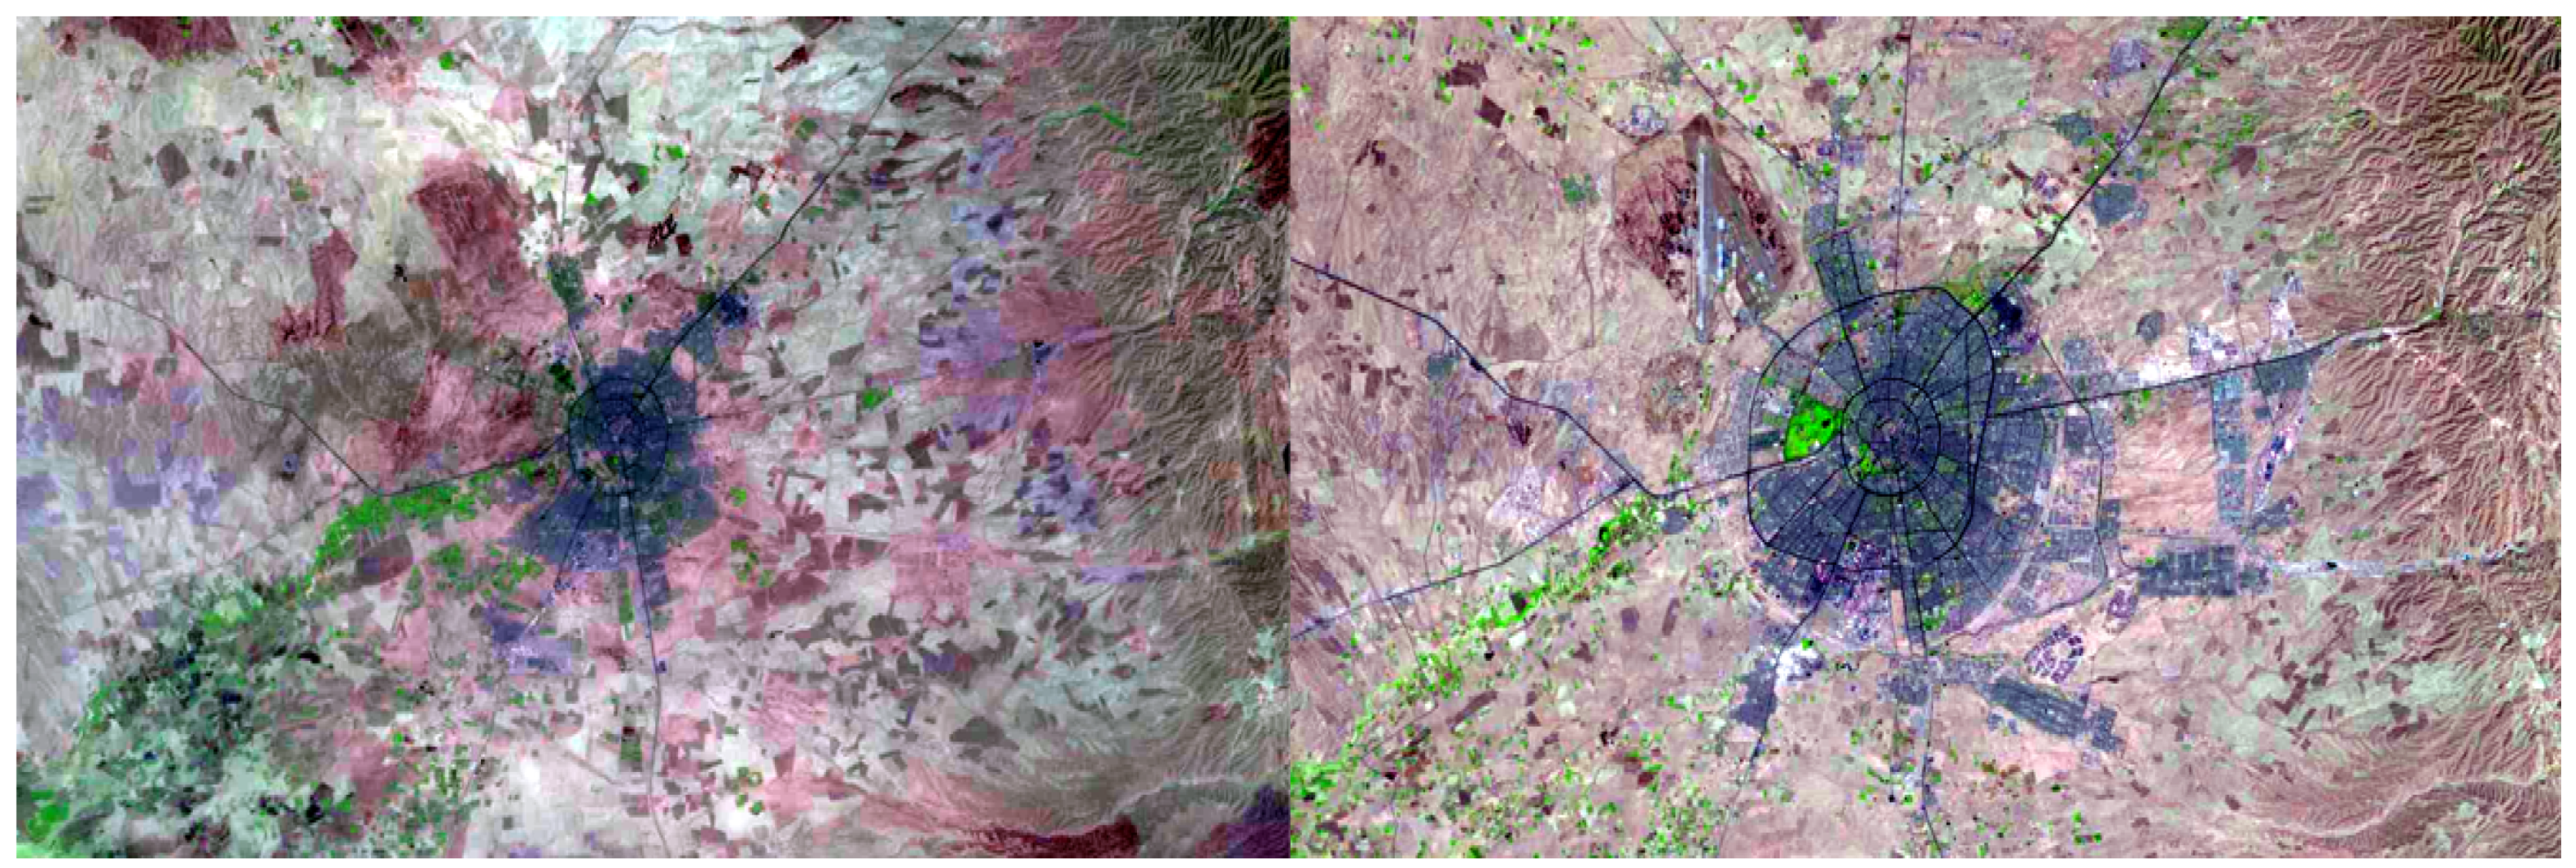
Figure 2 shows the images from Landsat satellite observation of the city of Erbil and its vicinity in 1987 (left) and 2011 (right). The dark gray pixels correspond to urban land cover. This shows that rapid urban expansion occurred between 1987 and 2011. We chose the land-use maps from these two years to define the pre- and post-urbanization eras in WRF simulations.
Urban expansion over Erbil was generally associated with a conversion from arid types of land to a simple urban-type of land, the latter dominated by concrete and low-rise buildings ([13,14]). This justifies our choice of using a relatively simple urban land type (see Section 3.2) to represent all “urban” grid cells in WRF. Moreover, the relatively low building heights justify our choice of using the setting of 7.5 m as average building height in the Urban Canopy Model.
3.2. Land-Use Land-Cover Maps
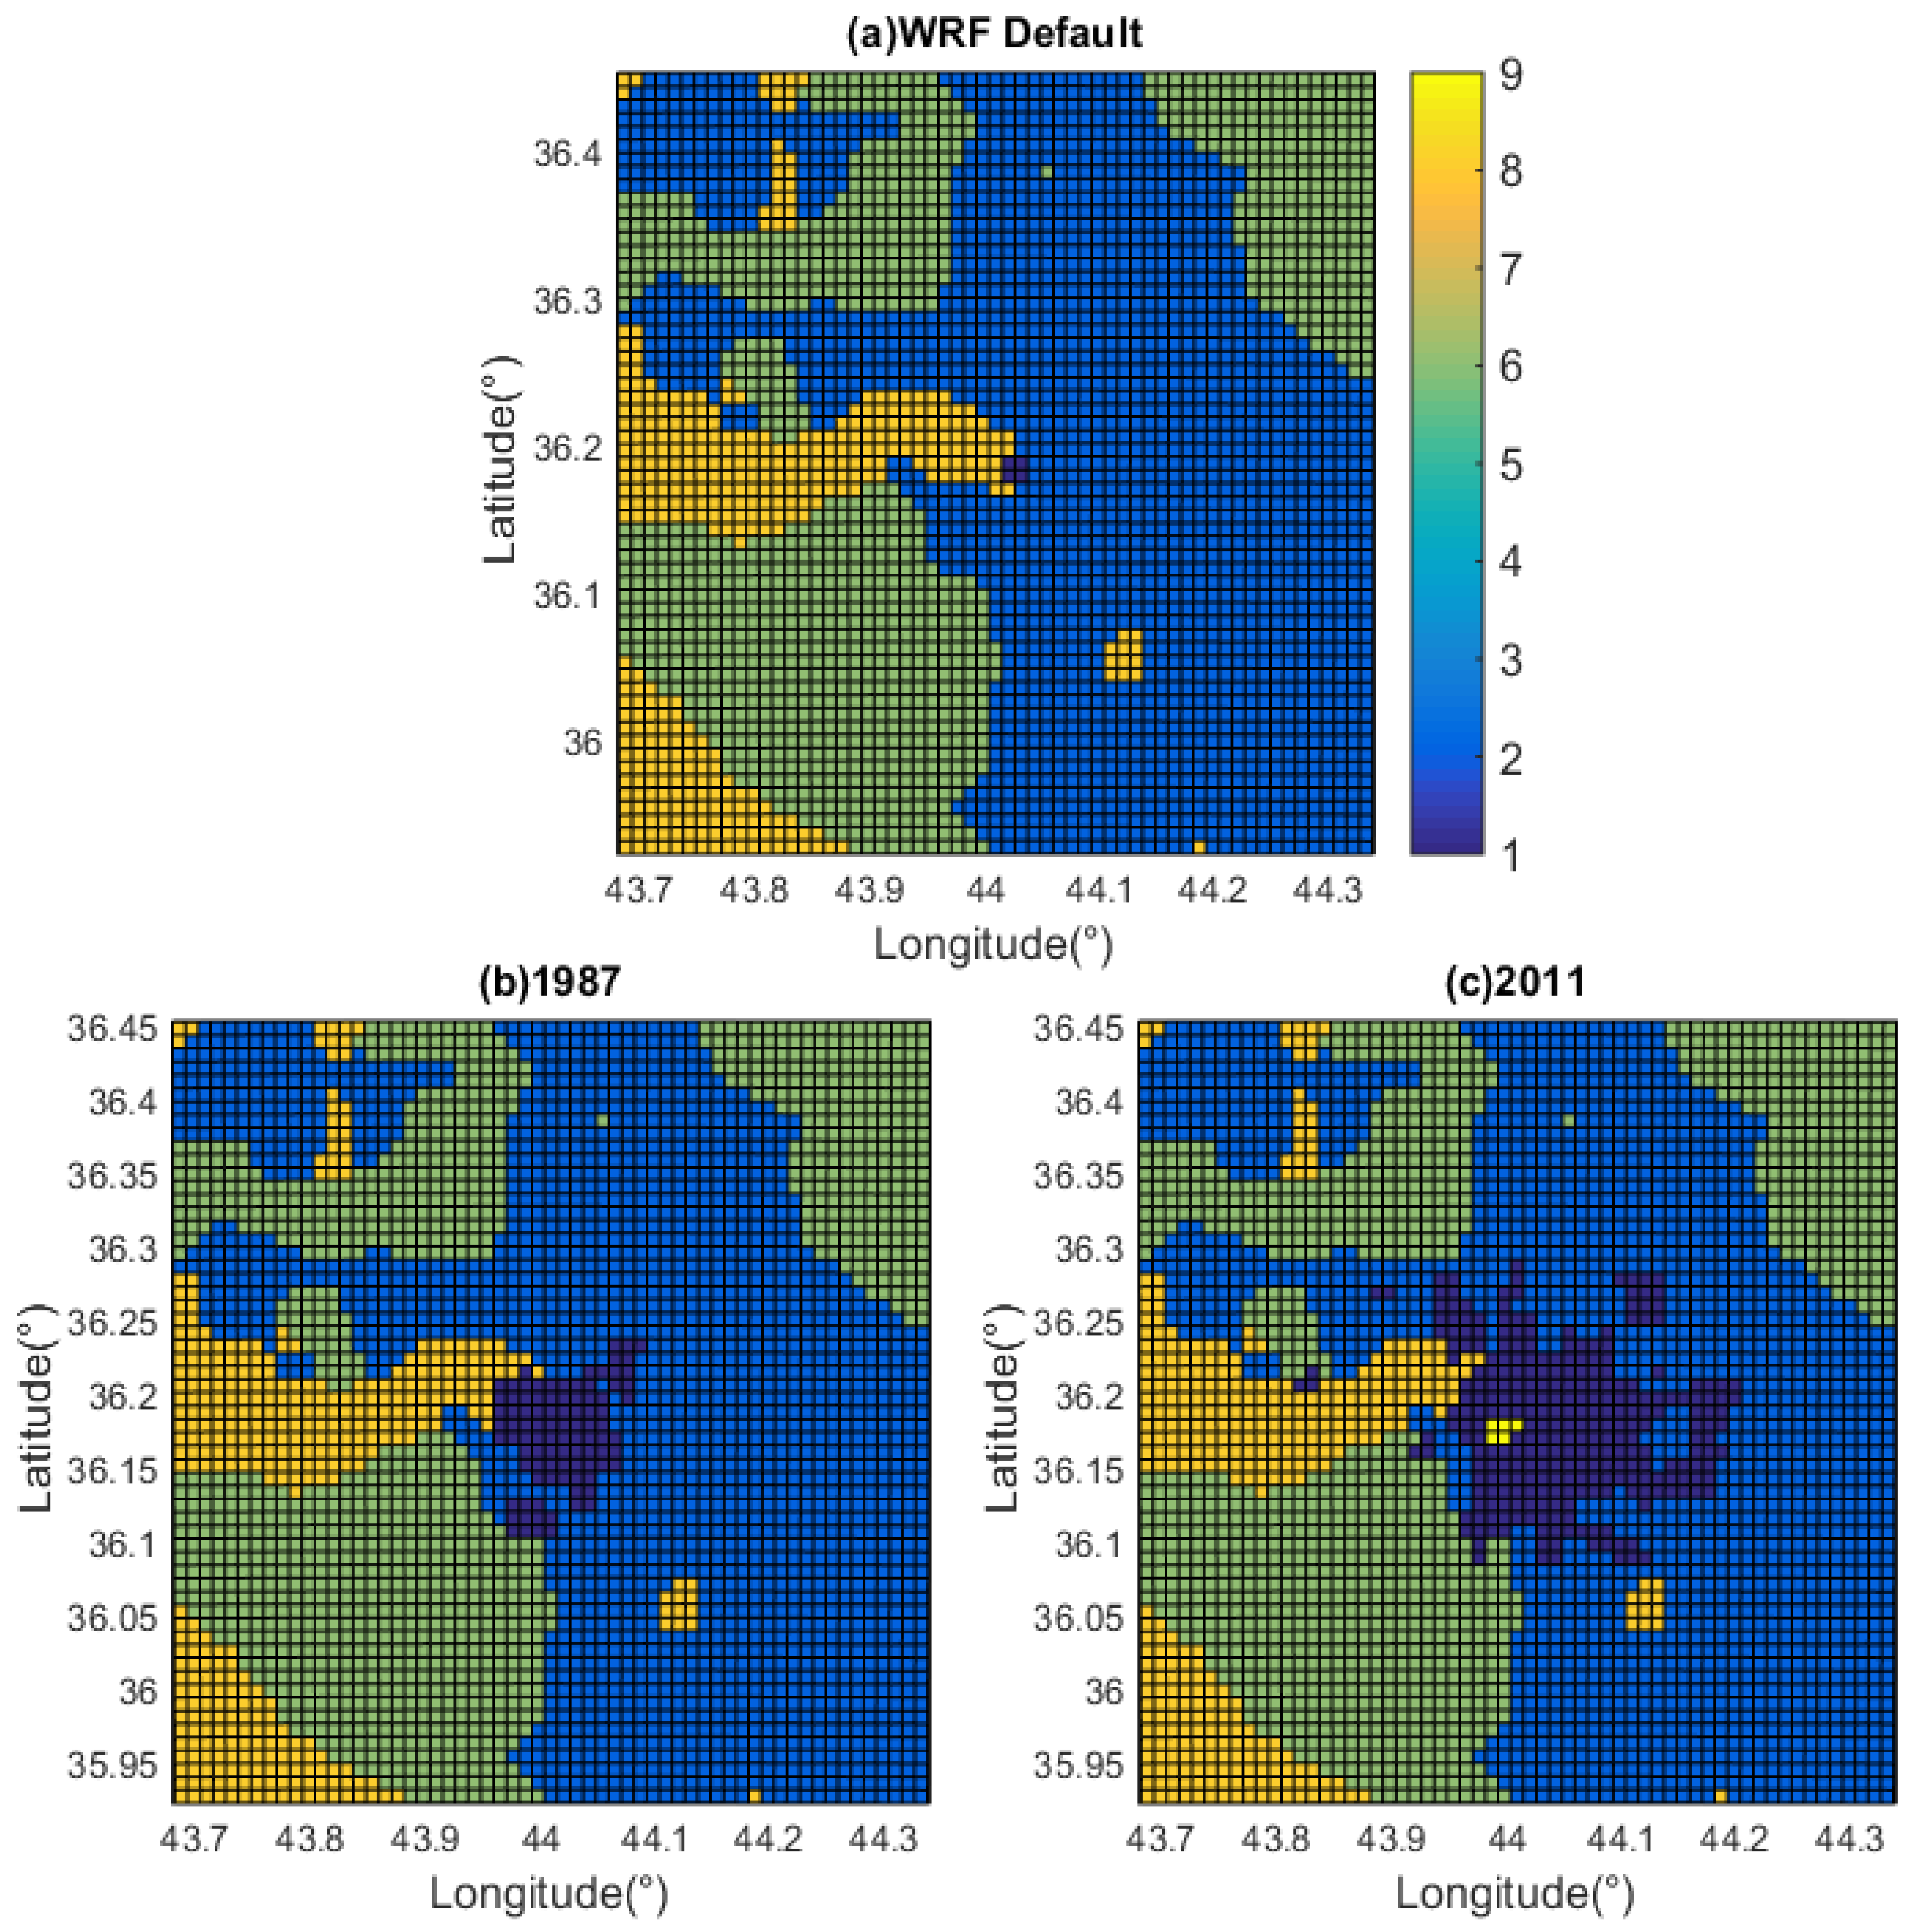
The default land-use map in the WRF package is generic (i.e., it is not associated with a specific era but was synthesized from multiple sources across different times) and contains very little urban-type land surfaces associated with the real city of Erbil. Figure 3a shows this default land-use map over the innermost domain of WRF, with urban land-cover marked by a dark blue color. Each grid cell in Figure 3a is 1 km × 1 km. Erbil is located at the center of the domain. Using Landsat observations archived at U.S. Geological Survey ([33]) and municipal maps of Erbil (extracted from [14]) from the pre- and post-urbanization eras, we created realistic land-use maps over Erbil and its vicinity for “1987” and “2011”, shown in Figure 3b,c, which were used to override the default map in WRF. This was applied only to the city and its vicinity. Elsewhere, the default land-use map in WRF was retained. This design is consistent with our idea of running “twin experiments”, explained below, with the only difference between the two runs coming from the surface boundary condition related to urbanization.
Figure 3b,c show that the urban type of land (dark blue) expanded significantly from 1987 (~94 km2) to 2011 (~284 km2). This detail of land-use change is well resolved by the 1 km × 1 km grid (imposed in the background of Figure 3a–c) in the innermost domain of WRF. A few bright yellow grid boxes that emerge in western Erbil in 2011 are associated with a new park that was constructed between 1987 and 2011. There, the land-surface type is mixed grassland and shrubland instead of urban. The non-urban area to the east of Erbil is dominated by dry cropland (blue in Figure 3) with a greater potential of dust generation in contrast to the cropland/woodland (green) and shrubland (tan) that dominate the non-urban areas to the west of Erbil.
3.3. Lateral Boundary Conditions and Dynamical Downscaling
With the model domain and land-surface boundary conditions given in the preceding sections, we conducted a series of numerical simulations in the manner of “twin experiments”. To extract the effect of urbanization, a pair of runs were performed with identical external forcing (seasonally and diurnally-varying solar radiation) and boundary conditions, except the land-use map in the surface boundary condition. For this purpose, the lateral boundary conditions were constructed from the large-scale observations for a generic year, chosen as 2000. Hereafter, the two runs named “1987” and “2011” in a twin experiment refer to the simulations with the same generic lateral boundary conditions but with the land-use map in WRF replaced by those from 1987 and 2011, respectively. With this setup, one can attribute the difference between the two runs to the effect of urbanization through the changes in the surface boundary conditions.
Since local climate and dust generation vary with season, we conducted two runs for each of the 1987 and 2011 cases. The “summer” simulation lasted for 30 days in the month of July (from July 1 to 30), and the “winter” simulation for 30 days in the month of January (from January 1 to 30), as summarized in Table 2. In each of the month-long simulations, the lateral boundary conditions for the outermost domain were constrained by four daily observations from global analysis, using the FNL data set. The output of major meteorological variables (e.g., temperature and precipitation), friction velocity produced by the turbulence model, and soil moisture produced by the land-surface model were all saved at 3-h intervals. Each run has a total of 240 3-hourly outputs which are used for further analyses.
4. Results
4.1. Cross Validation with Reanalysis
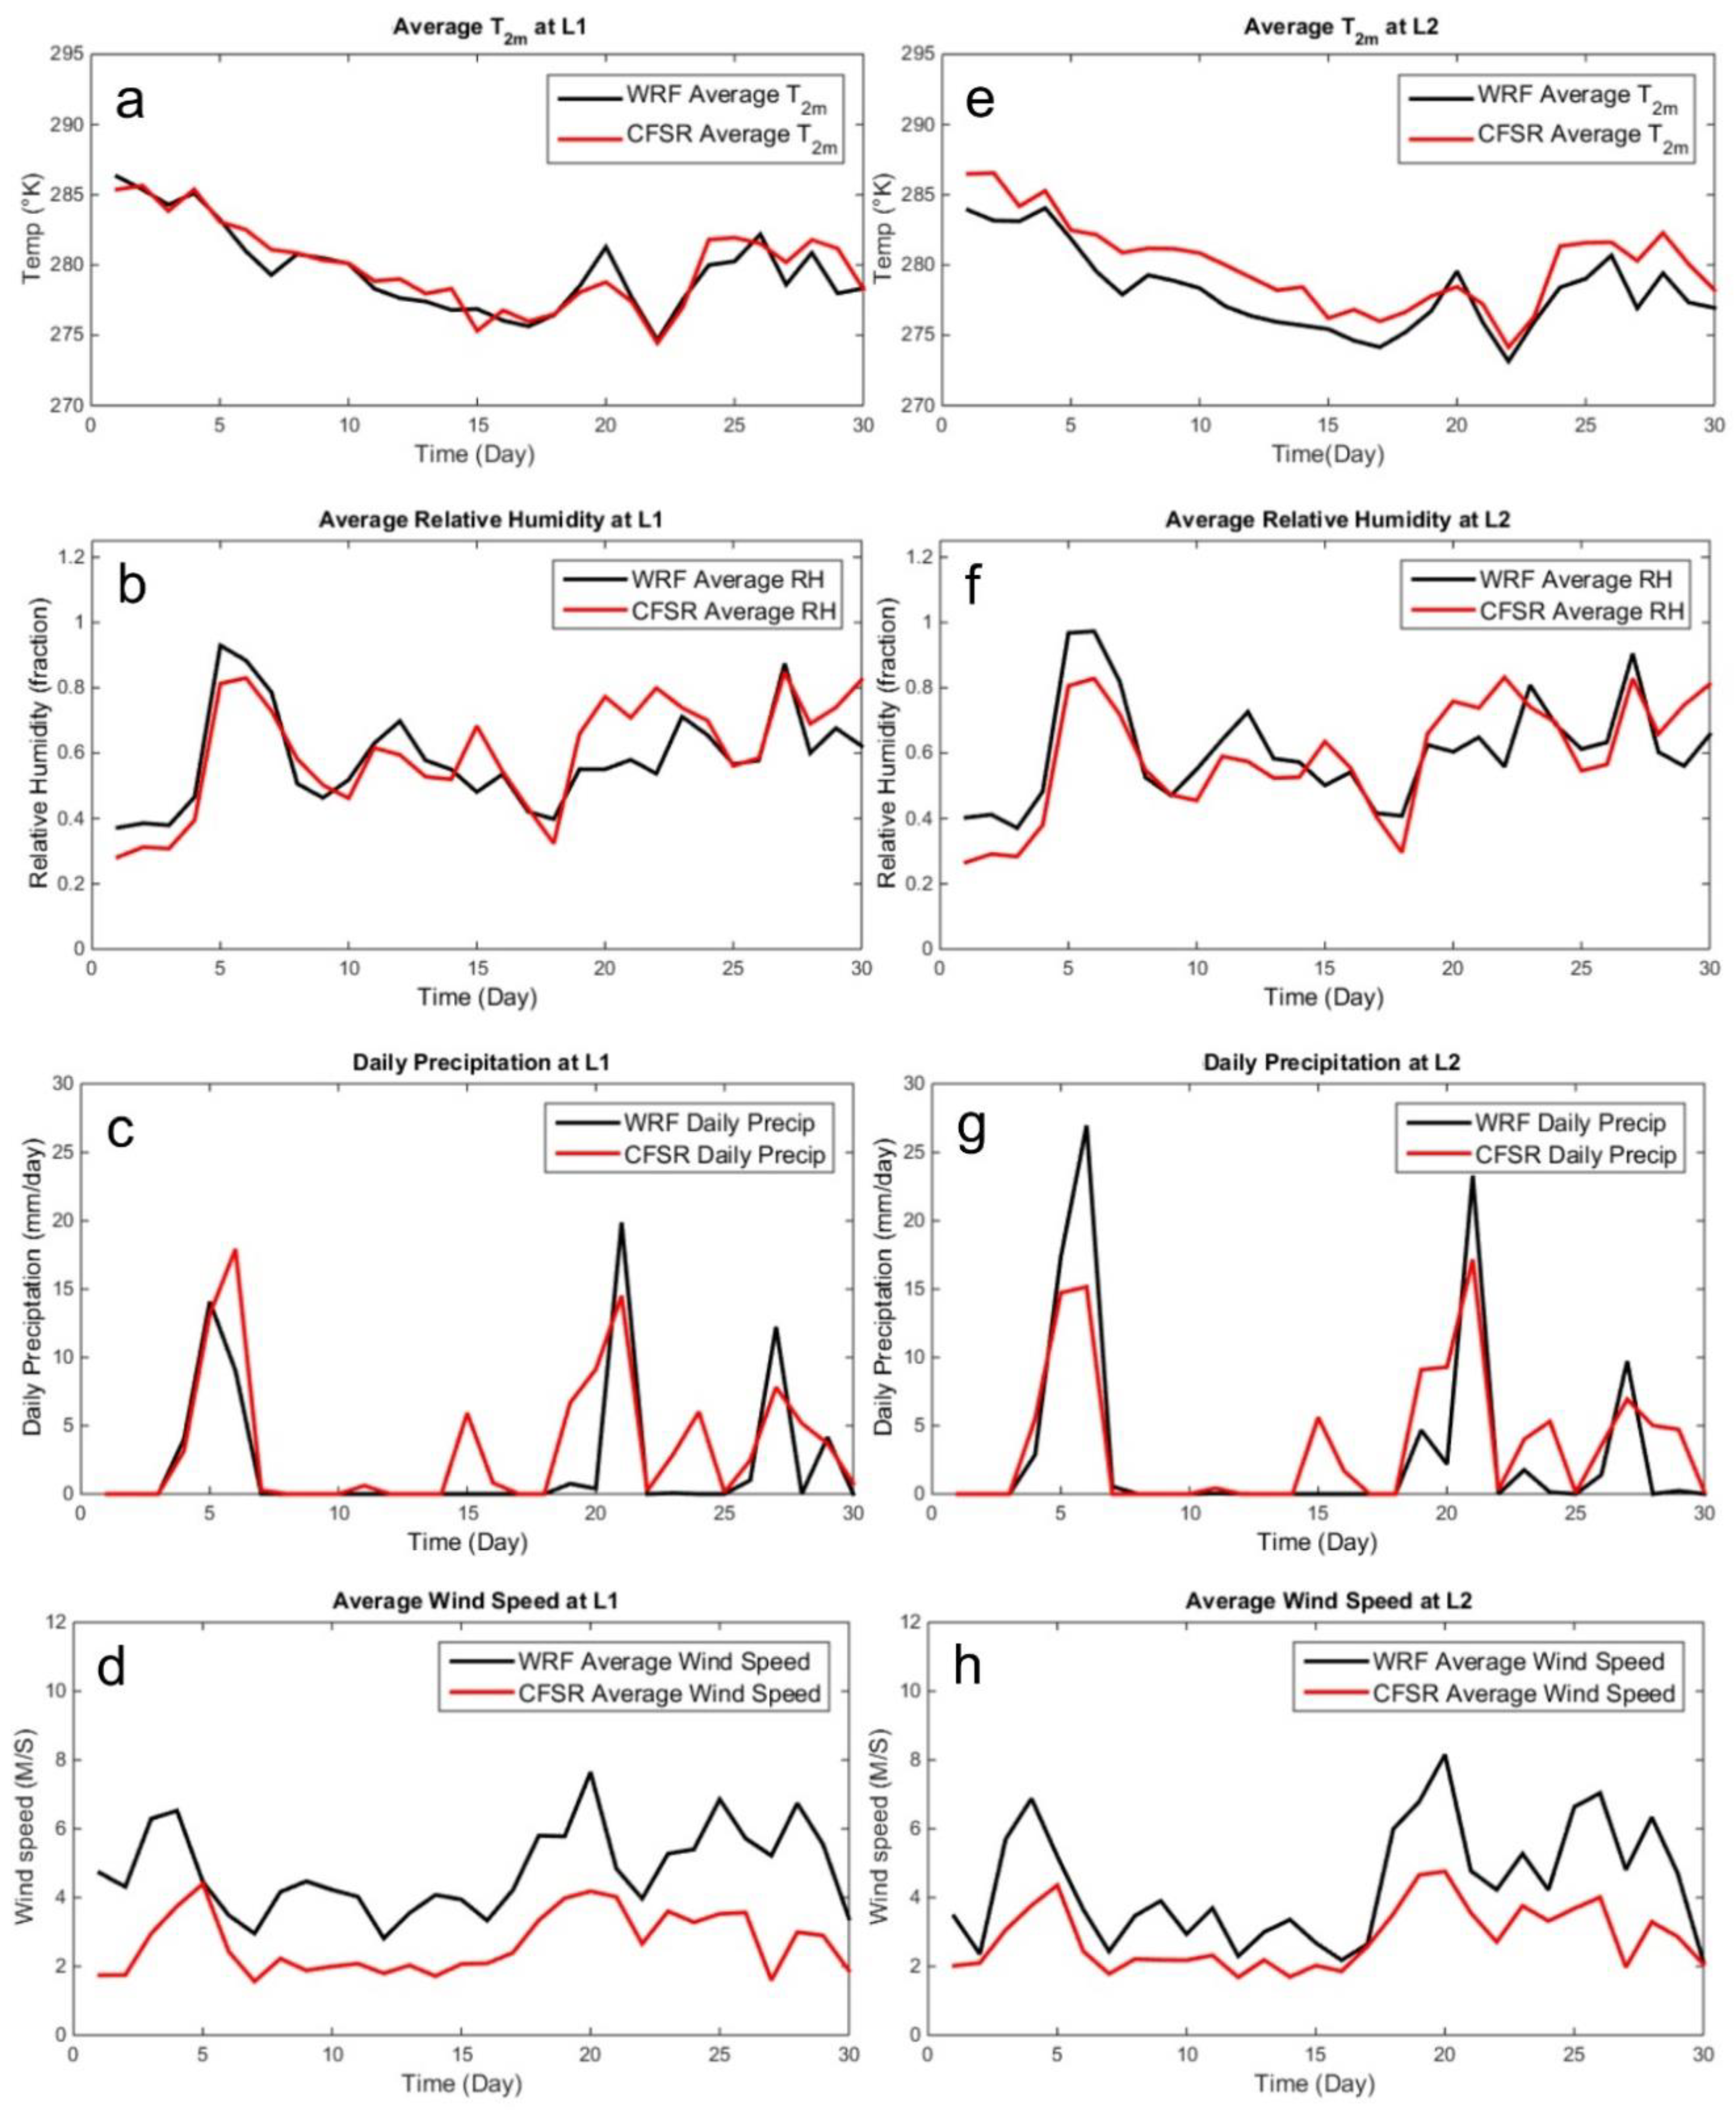
Climate studies over desert cities have long been hindered by a lack of reliable observational networks, particularly at the sub-meso and urban scales. This motivated us to develop a numerical modeling framework as a complementary tool for research. Nevertheless, we will briefly compare a basic simulation for the Erbil region with reanalysis, which is treated as the best available (if heavily interpolated) representation of the raw observation. We focus on thermodynamic variables, as the velocity field generally has strong spatial and temporal variations at the sub-mesoscale which would not be properly represented in reanalysis. Using Climate Forecast System Reanalysis (CFSR) data [34] as the basis, we selected two grid locations closest to Erbil: L1 at (36.06° N and 43.75° E), and L2 at (36.06° N and 44.06° E). L2 is approximately 10 km south of Erbil; L1 is at the same latitude as L2 but 25 km west of it. Since the resolution of the WRF model is higher that of the reanalysis, for the comparison to the latter, we took the average of the model output over multiple WRF grid points surrounding L1 and L2, respectively.
Figure 4 compares the daily values from the CFSR reanalysis (red) and the WRF simulation (black) for L1 (left column) and L2 (right column) over the month of January 2000. In each column, top to bottom, are 2 m air temperature, relative humidity, daily rainfall, and 10 m wind speed. For temperature and humidity, the WRF simulation is consistent with CFSR in the temporal variation. For precipitation, strong events are present in both WRF and CFSR, while discrepancies are seen for some weak events. Note that precipitation in the reanalysis is not directly constrained by observation but is generated by the global model which depends on physical parameterization. A more notable systematic difference between WRF and CFSR is in the 10 m wind speed, with CFSR having a lower magnitude. Nevertheless, consistency is still found in the temporal variation (timing of occurrences of maximum wind speed) between the two. Like precipitation, velocity in the surface boundary layer is not directly constrained by observation in reanalysis. Given that the CFSR global model has a lower resolution than in the WRF model, it is not surprising that events with maximum wind gusts are smoothed out and more muted in the former.
The overall consistency between the time series from WRF and CFSR reanalysis affirms the soundness of our setup of time-varying boundary conditions for dynamical downscaling. To more accurately assess the differences in the details for precipitation and surface wind speed, we would require local observational data at the sub-meso and urban scale, which we hope will become available in the future.
4.2. Effect of Urbanization on Meteorological Fields
Previous numerical studies on the effect of desert urbanization have focused on surface air temperature. The well-known “urban heat island” effect was shown to generally hold for desert cities in nighttime, although this is accompanied by weak daytime cooling ([8,9]).
To compare with previous studies, Figure 5 shows the 3-hourly time series of 2 m air temperature, averaged over the grid boxes where urbanization occurred between 1987 and 2011, for the 1987 and 2011 simulations. Figure 5a,b are for January and July, respectively, and the runs with the 1987 and 2011 land-cover are colored in black and red, respectively. In both figures, even on a day-to-day basis, one observes a systematic increase in nighttime temperature from 1987 to 2011 while the temperature difference is smaller in daytime. (Nevertheless, daytime cooling can be identified more clearly after monthly average, as shown below). This is consistent with the findings from previous studies for different desert cities (e.g., [3,4,8,9]).
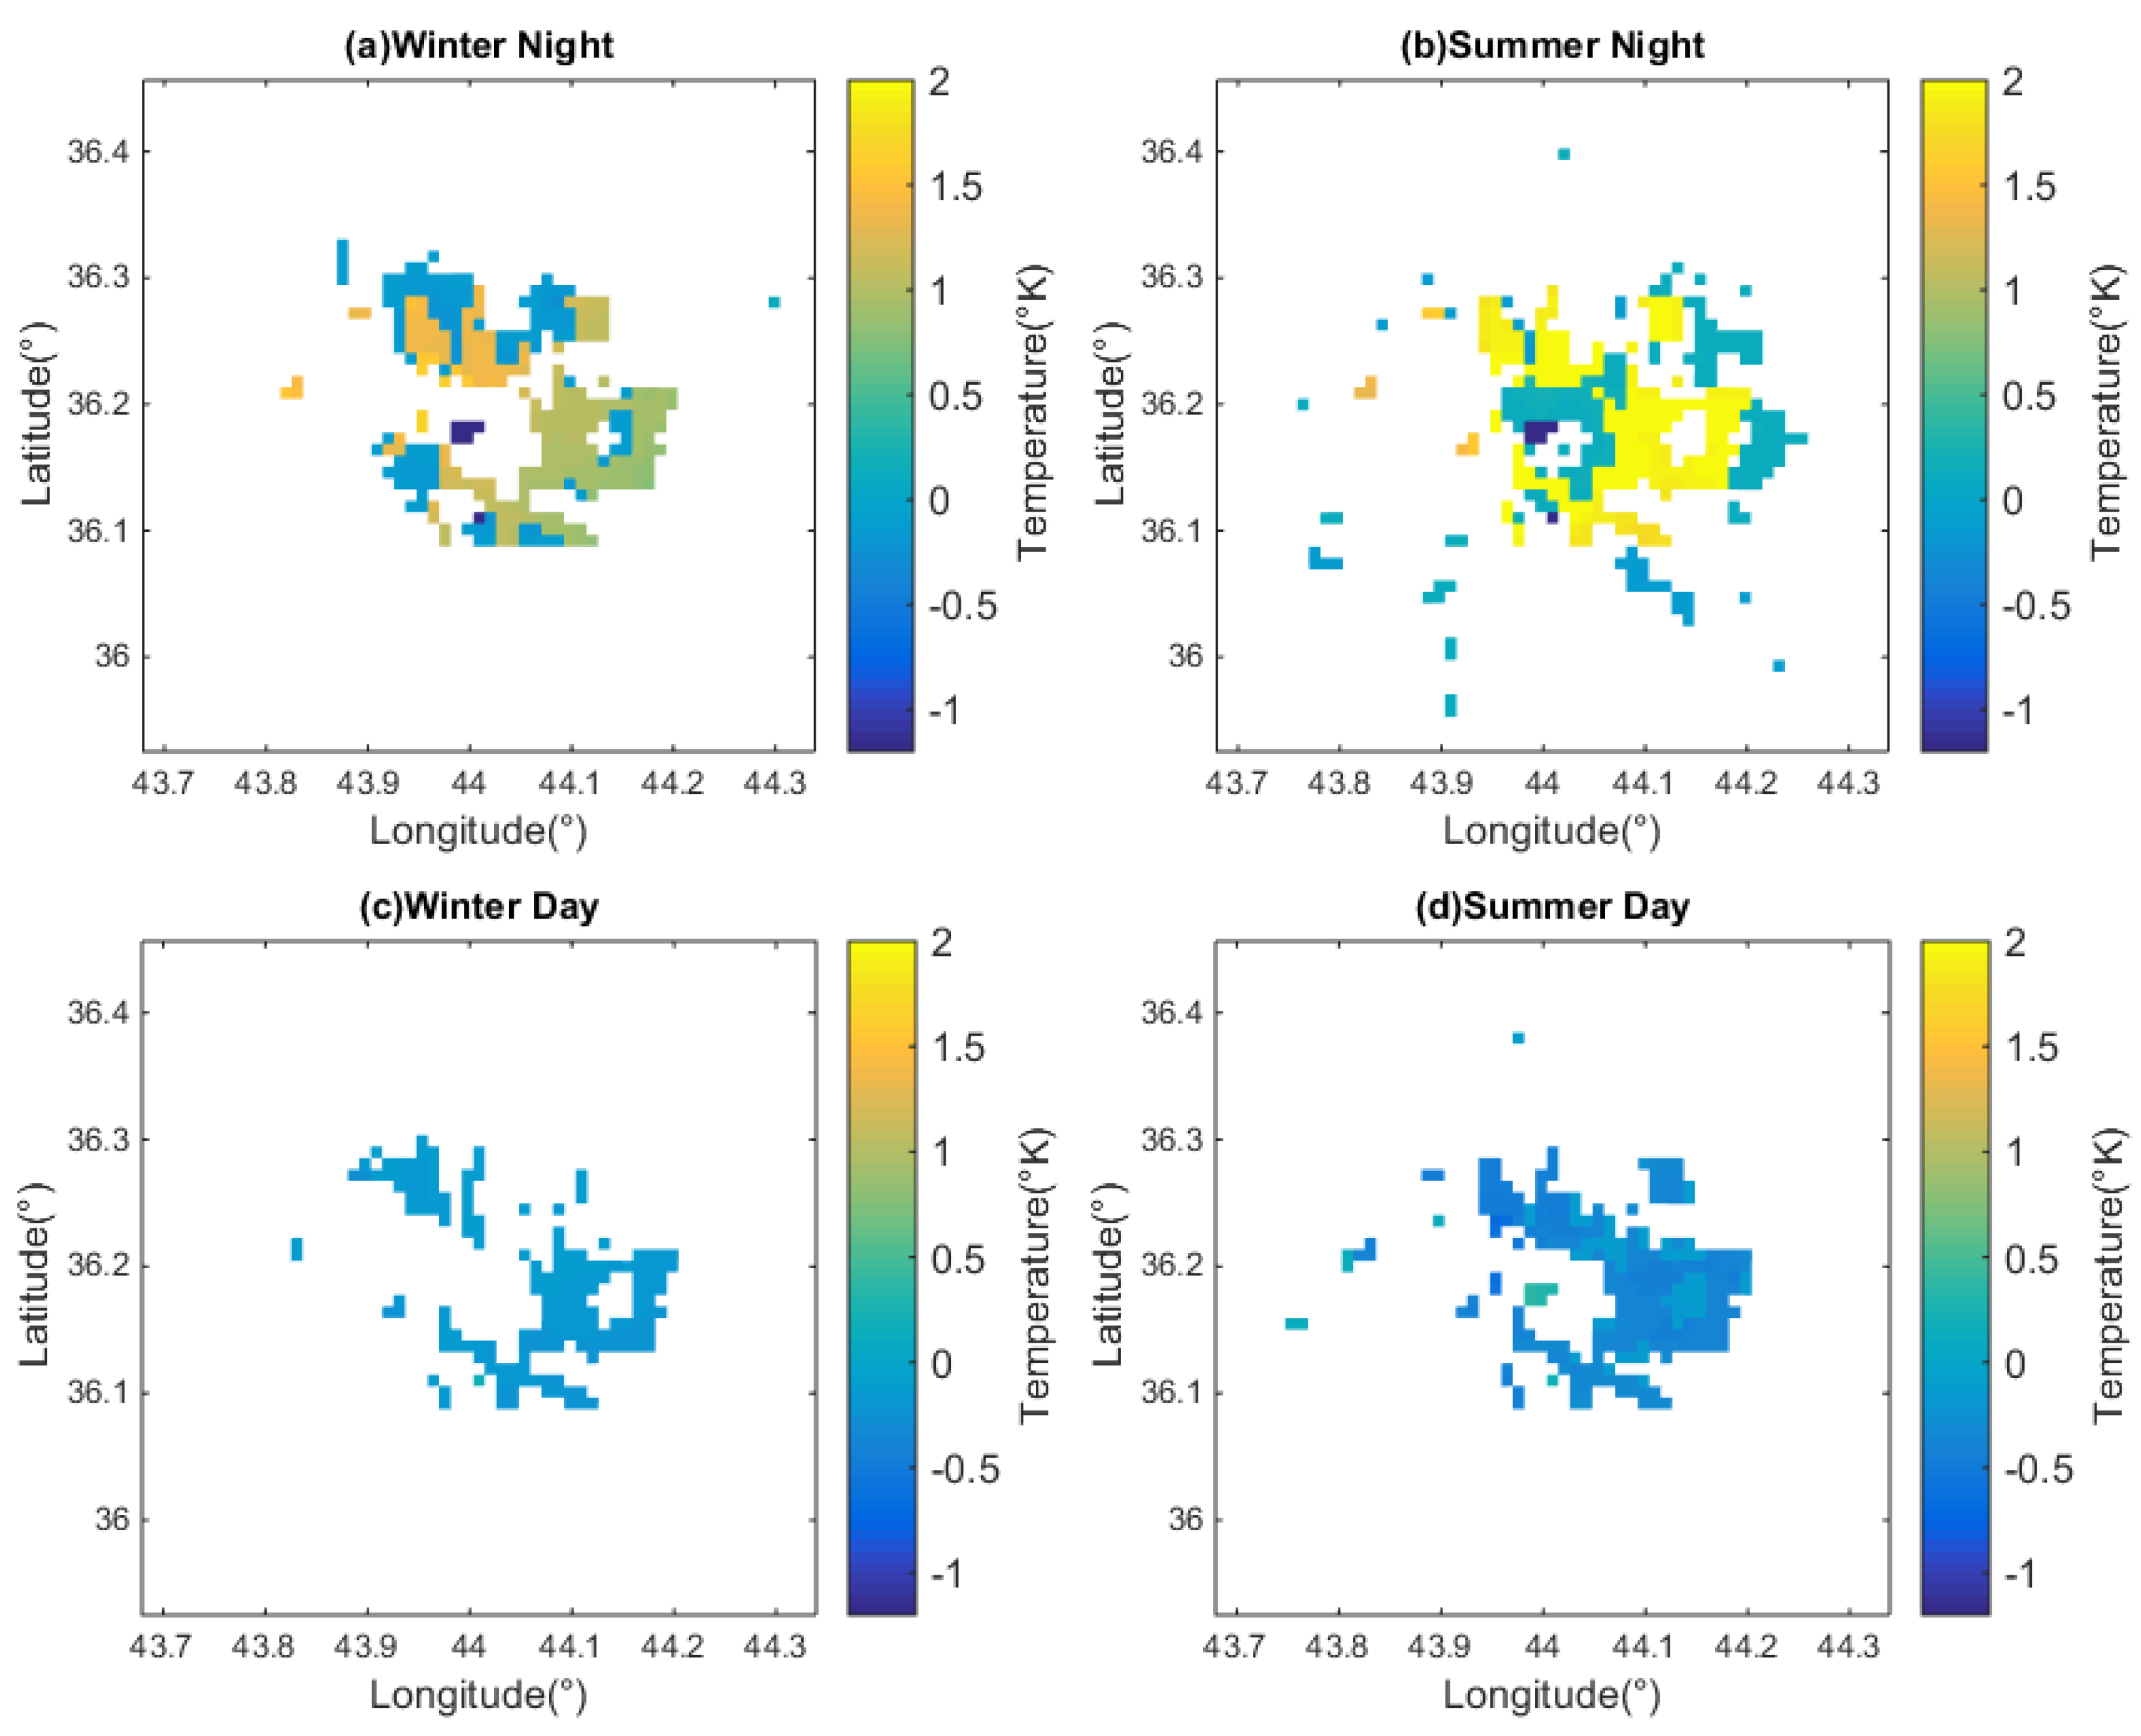
Figure 6a,b show the maps of the difference, defined as “2011 minus 1987”, in nighttime 2 m air temperature averaged over the entire month of January and July, respectively. Warming over the newly established urban area is readily identified in both plots, with a magnitude of warming at 1.5 °C and 2 °C for winter and summer, respectively. (Here, we use the average of midnight and 3 a.m. local time to define “nighttime”, as the maximum of nighttime warming usually occurs in early morning).
Figure 6c,d are similar to Figure 6a,b but for the temperature difference in daytime (defined as the average of noon and 3 p.m.). A weak but robust signal of daytime cooling (0.25 °C and 0.45 °C for winter and summer, respectively) due to urbanization is found over the newly established urban areas. The pattern of “strong warming in nighttime and weak cooling in daytime” occurs in both winter and summer, but with the signal stronger in summer. Overall, these findings are consistent with previous numerical studies on desert urbanization. Furthermore, note that anthropogenic effects, such as increased irrigation within the city, or anthropogenic production of heat, are not explicitly included in our study. As explained by [8,9], daytime cooling in the type of simulations we performed arises mainly from an increased effective surface area over the city (due to presence of buildings; equivalent to the “shadow effect”).
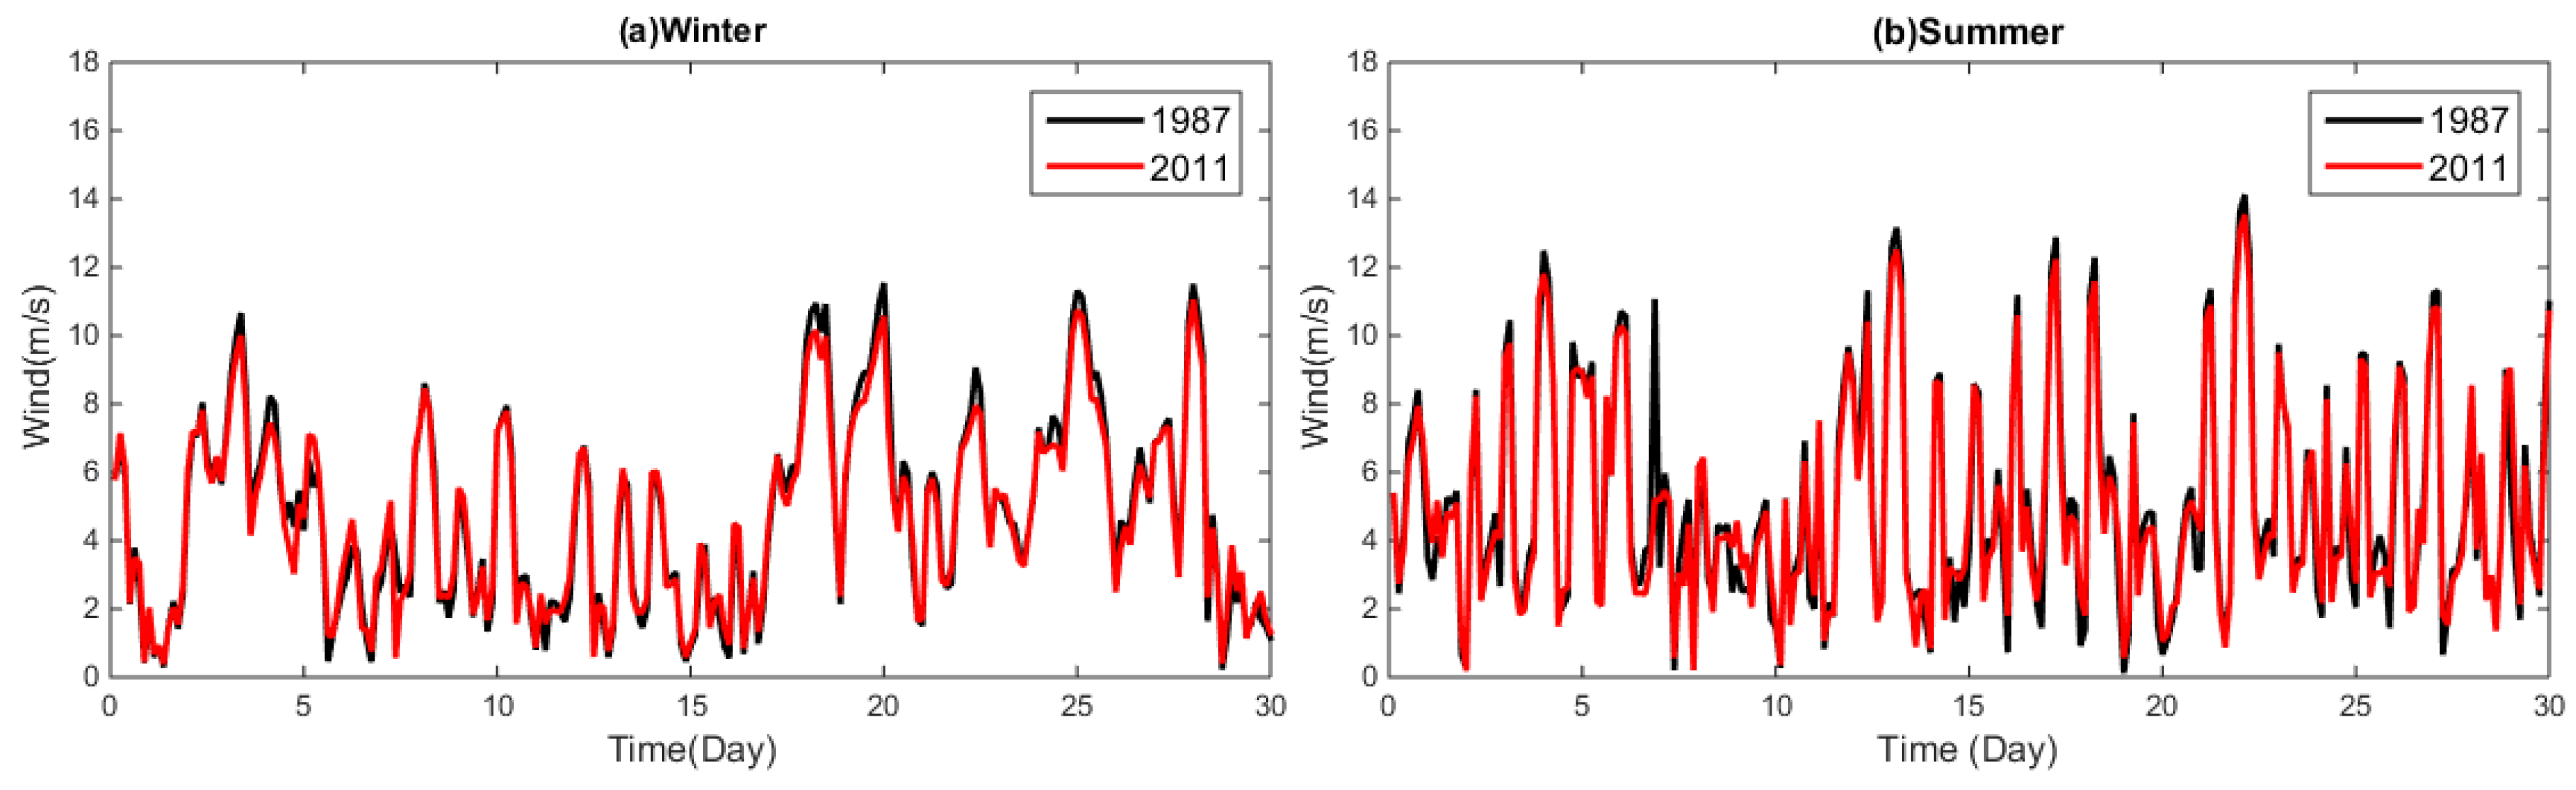
A relatively small number of studies have examined the effect of urbanization on the near-surface winds. A previous study [8] found a reduction in the strength of diurnal circulation over Las Vegas (a desert city) due to urbanization, while another study [35] found a similar reduction in low-level wind speed over a tropical non-desert city of Muar, Malaysia. The changes in wind field could, in turn, affect the temperature by altering the “ventilation effect” [8]. To compare with existing works, Figure 7 shows the 3-hourly time series of the 10 m wind speed averaged over the area that underwent urbanization, in the same format as Figure 5. Figure 7a,b are for winter and summer, respectively, and black and red curves are for the 1987 and 2011 cases, respectively. From the figure, one observes a slight downward shift of wind speed from 1987 to 2011. This reduction in wind speed can be more clearly identified in the maps of the monthly mean, as shown in Figure 8 (in the same format as Figure 6). It is found that urbanization leads to a reduction in surface wind speed in both winter and summer, and both daytime and nighttime. This is similar to the findings of the numerical study by [8] for Las Vegas.
4.3. Surface Dust Fluxes
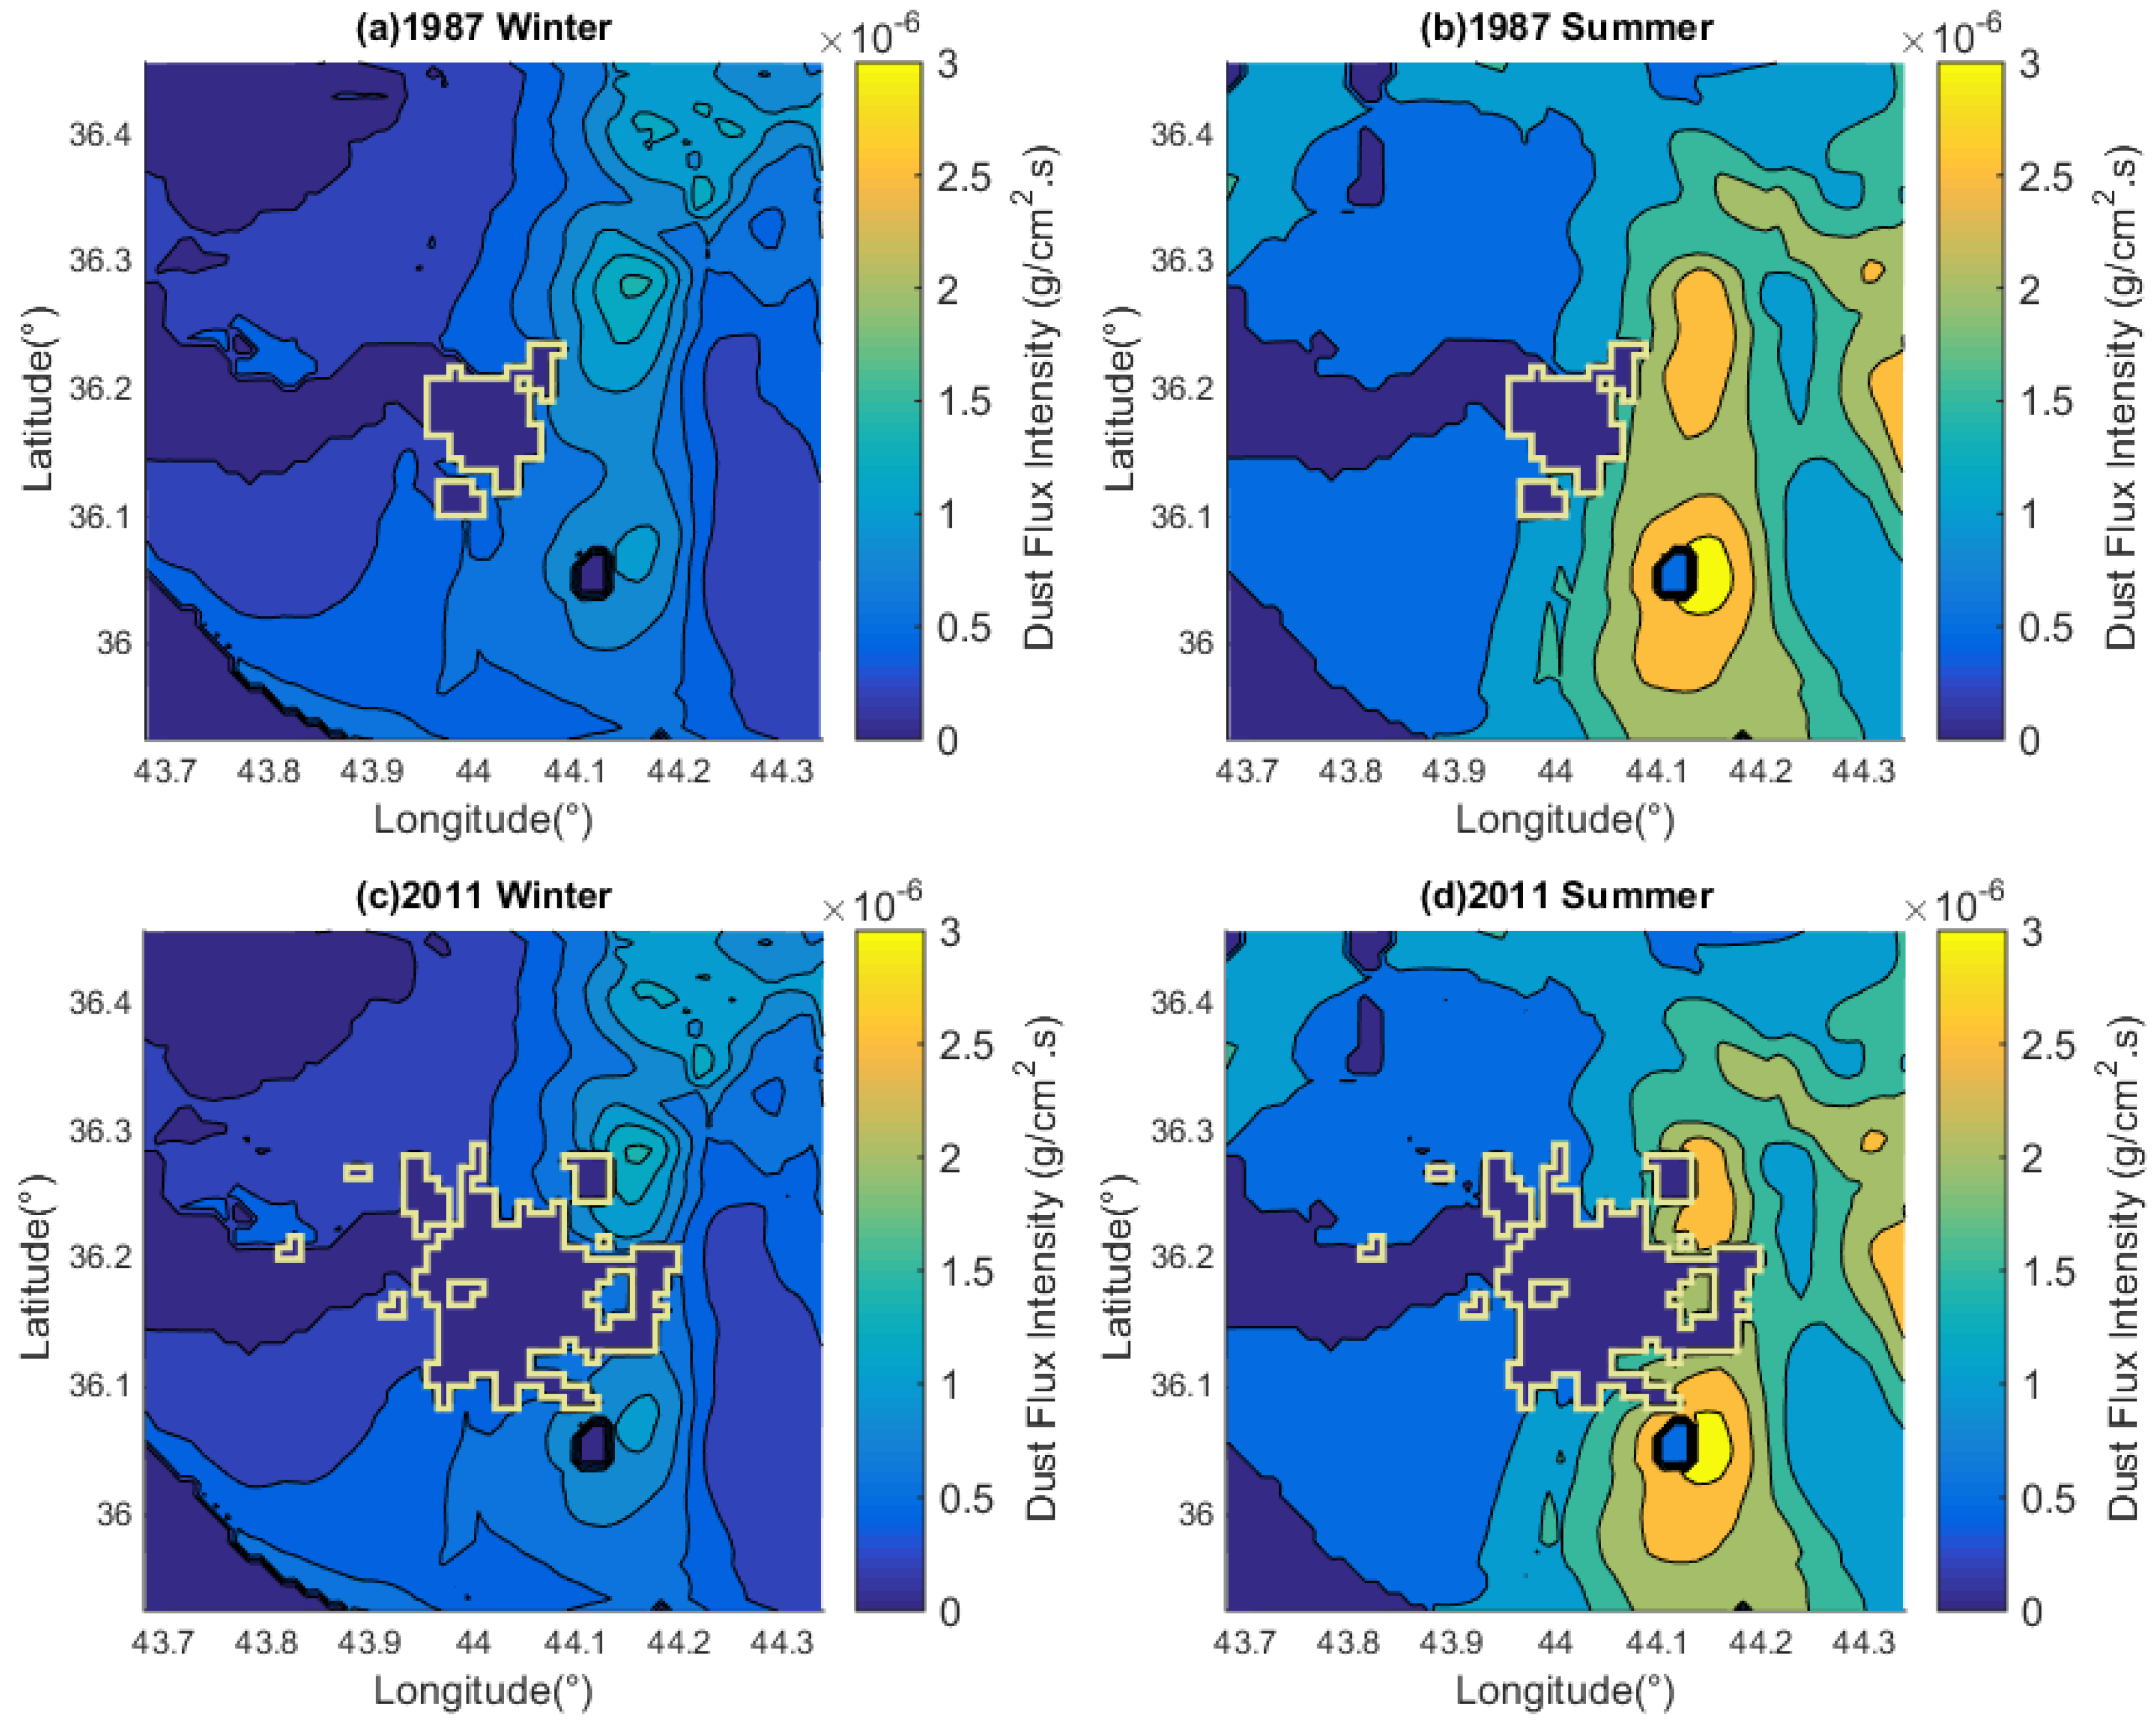
Using the empirical formulas in Section 2.2, the 3-hourly outputs of friction velocity u* and soil moisture w from the WRF simulations were used to compute the surface dust fluxes over the innermost model domain. Figure 9a,b show the maps of monthly cumulative dust fluxes from the 1987 case for winter and summer, respectively. The outline of the border of urban areas of Erbil in 1987 is superimposed to the maps. Figure 9c,d are similar to Figure 9a,b but for the 2011 case.
As expected, the conversion from arid-type natural land to urban-type land leads to suppression of dust generation; in Figure 9, the areas with minimum dust fluxes are those covered by urban land. Nevertheless, after urban expansion, more people are now living closer to the “hot spots” just outside the city limit where strong dust generation occurs. These hot spots for dust generation are located mainly to the west of the city, where the dominant land surface type is dry cropland (see Figure 3b,c). To the east of the city, where land cover is dominated by cropland/woodland and shrubland, dust fluxes are relatively weak. This is due to those two land surface types having less clay content (thus, greater values of the reduction parameter R in Table 1; both have R = 0.7, compared to R = 0.4 for dry cropland).
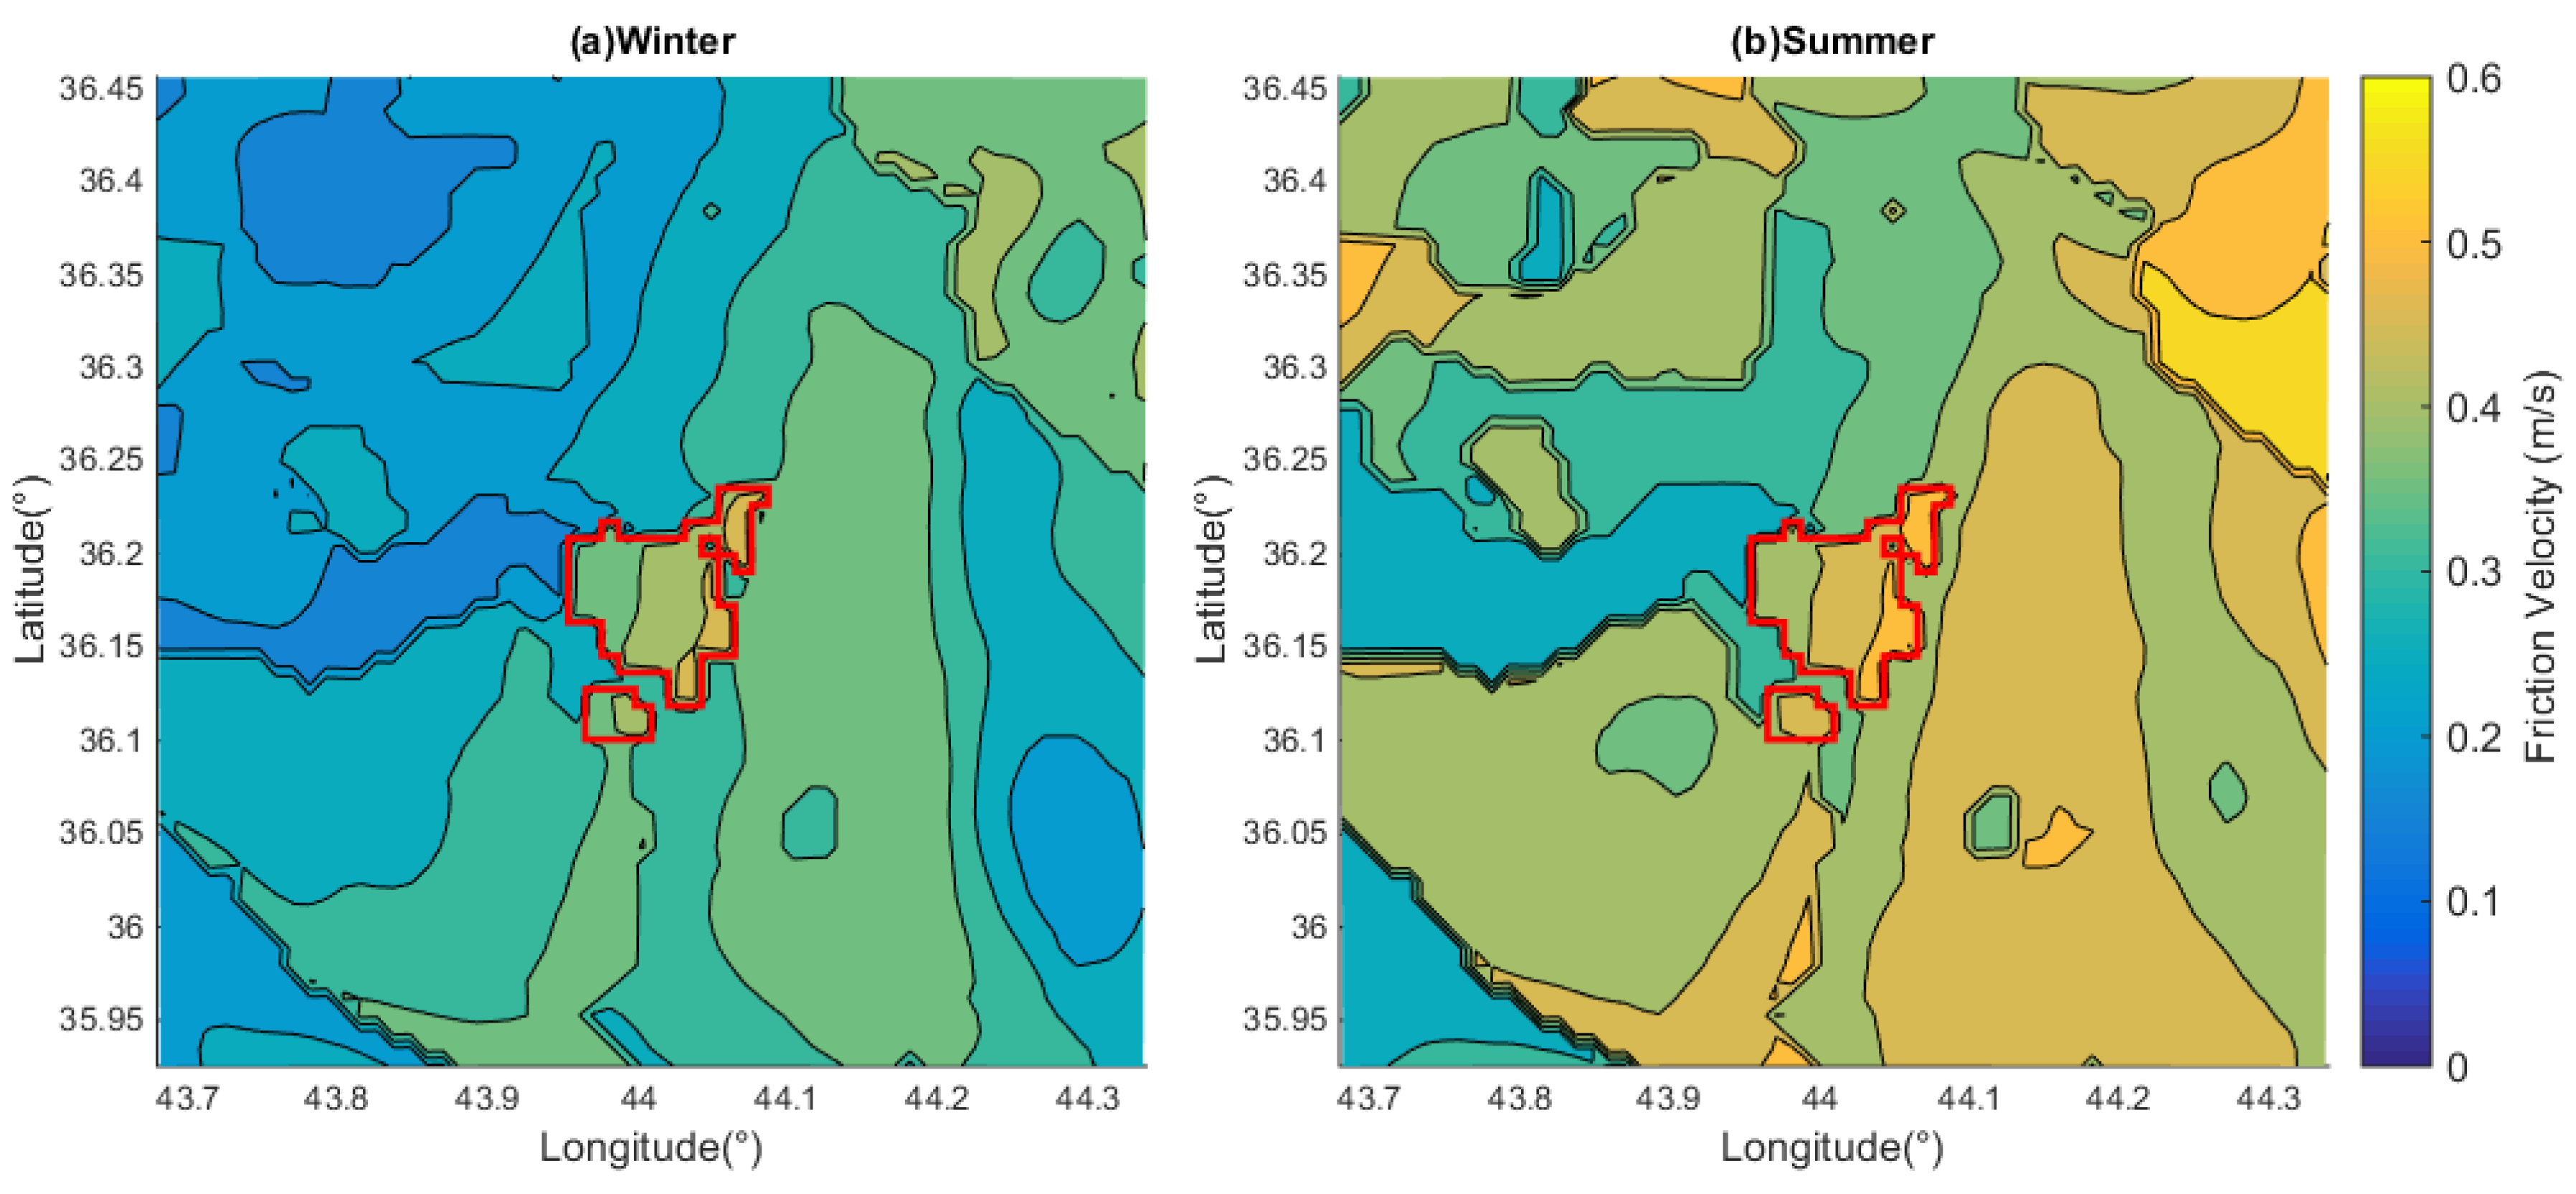
Another reason for the stronger dust production to the east of Erbil is that a condition of stronger turbulent generally persists in that region. Figure 10 shows the monthly mean of friction velocity u* from WRF simulations for the 1987 case, for January and July. Both seasons exhibit a clear contrast in friction velocity which is stronger in the east and weaker in the west. Over the hot spots for dust generation, the dust fluxes have greater values in summer. This is due to both a higher friction velocity and drier land surface in summer.
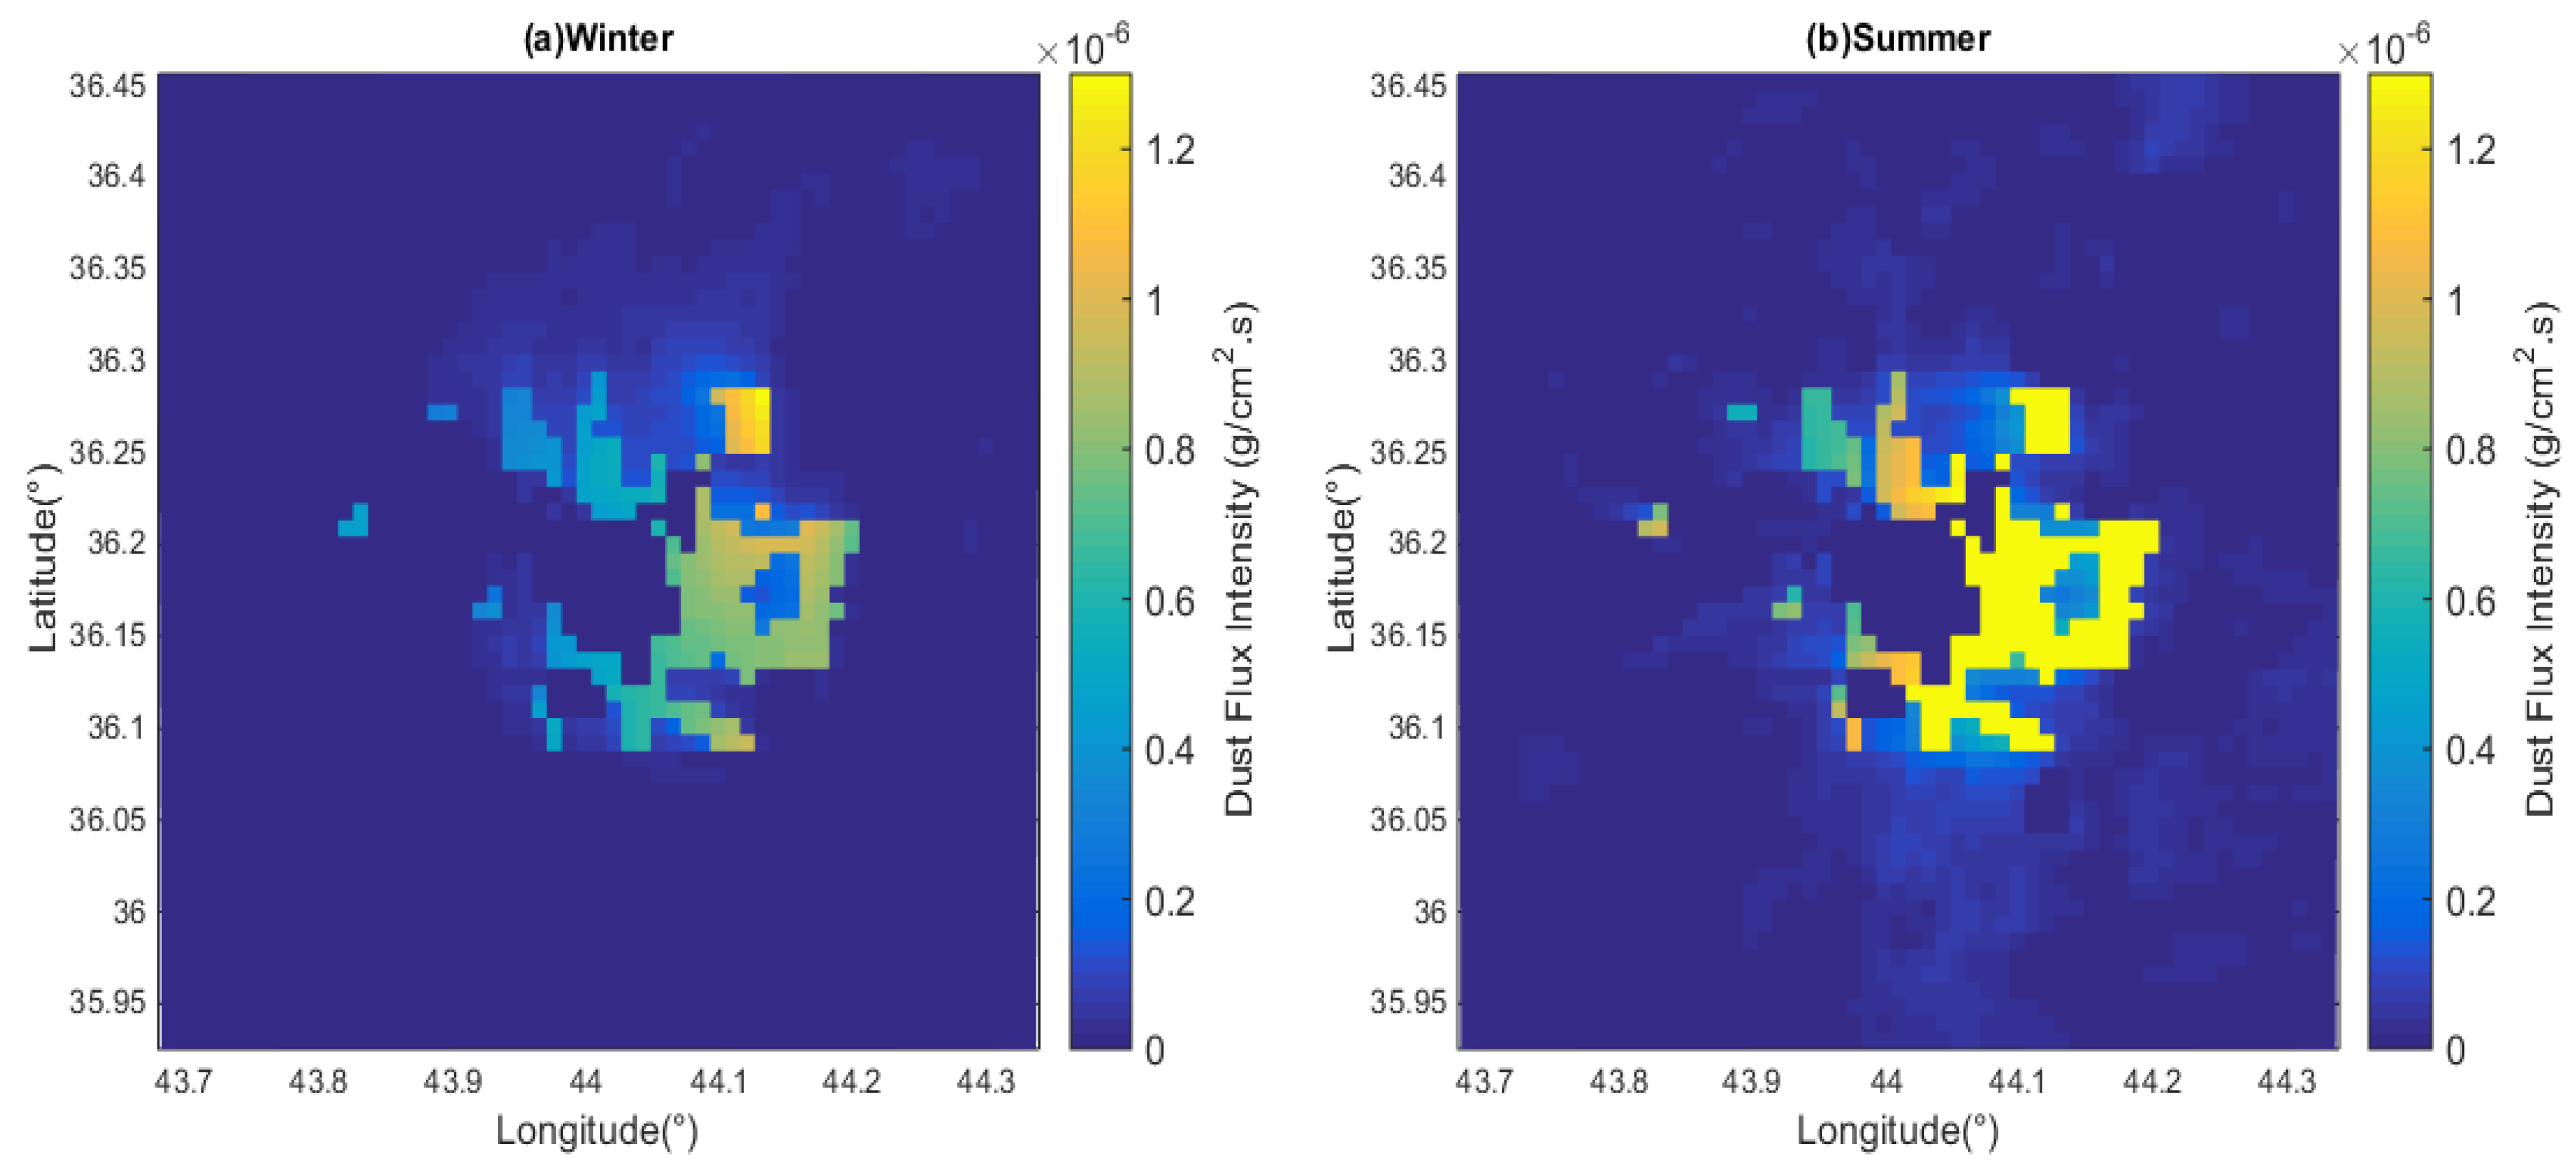
Figure 11 shows the difference in the cumulative dust fluxes between 1987 and 2011 for winter and summer. For this particular set of maps, since dust generation is suppressed over the newly established urban areas in 2011, we used the reverse definition of “1987 minus 2011” to define the difference. (Thus, a positive value means more dust generation in 1987). As expected, the areas with positive differences in dust generation approximately coincide with those that underwent urbanization between 1987 and 2011. Nevertheless, even within those areas, there are nontrivial spatial variations in the magnitude of the differences. This illustrates the usefulness of the meteorological model simulations, as the spatial variations of meteorological fields help create these detailed patterns.
4.4. Influence of Meteorological Conditions on Dust Generation
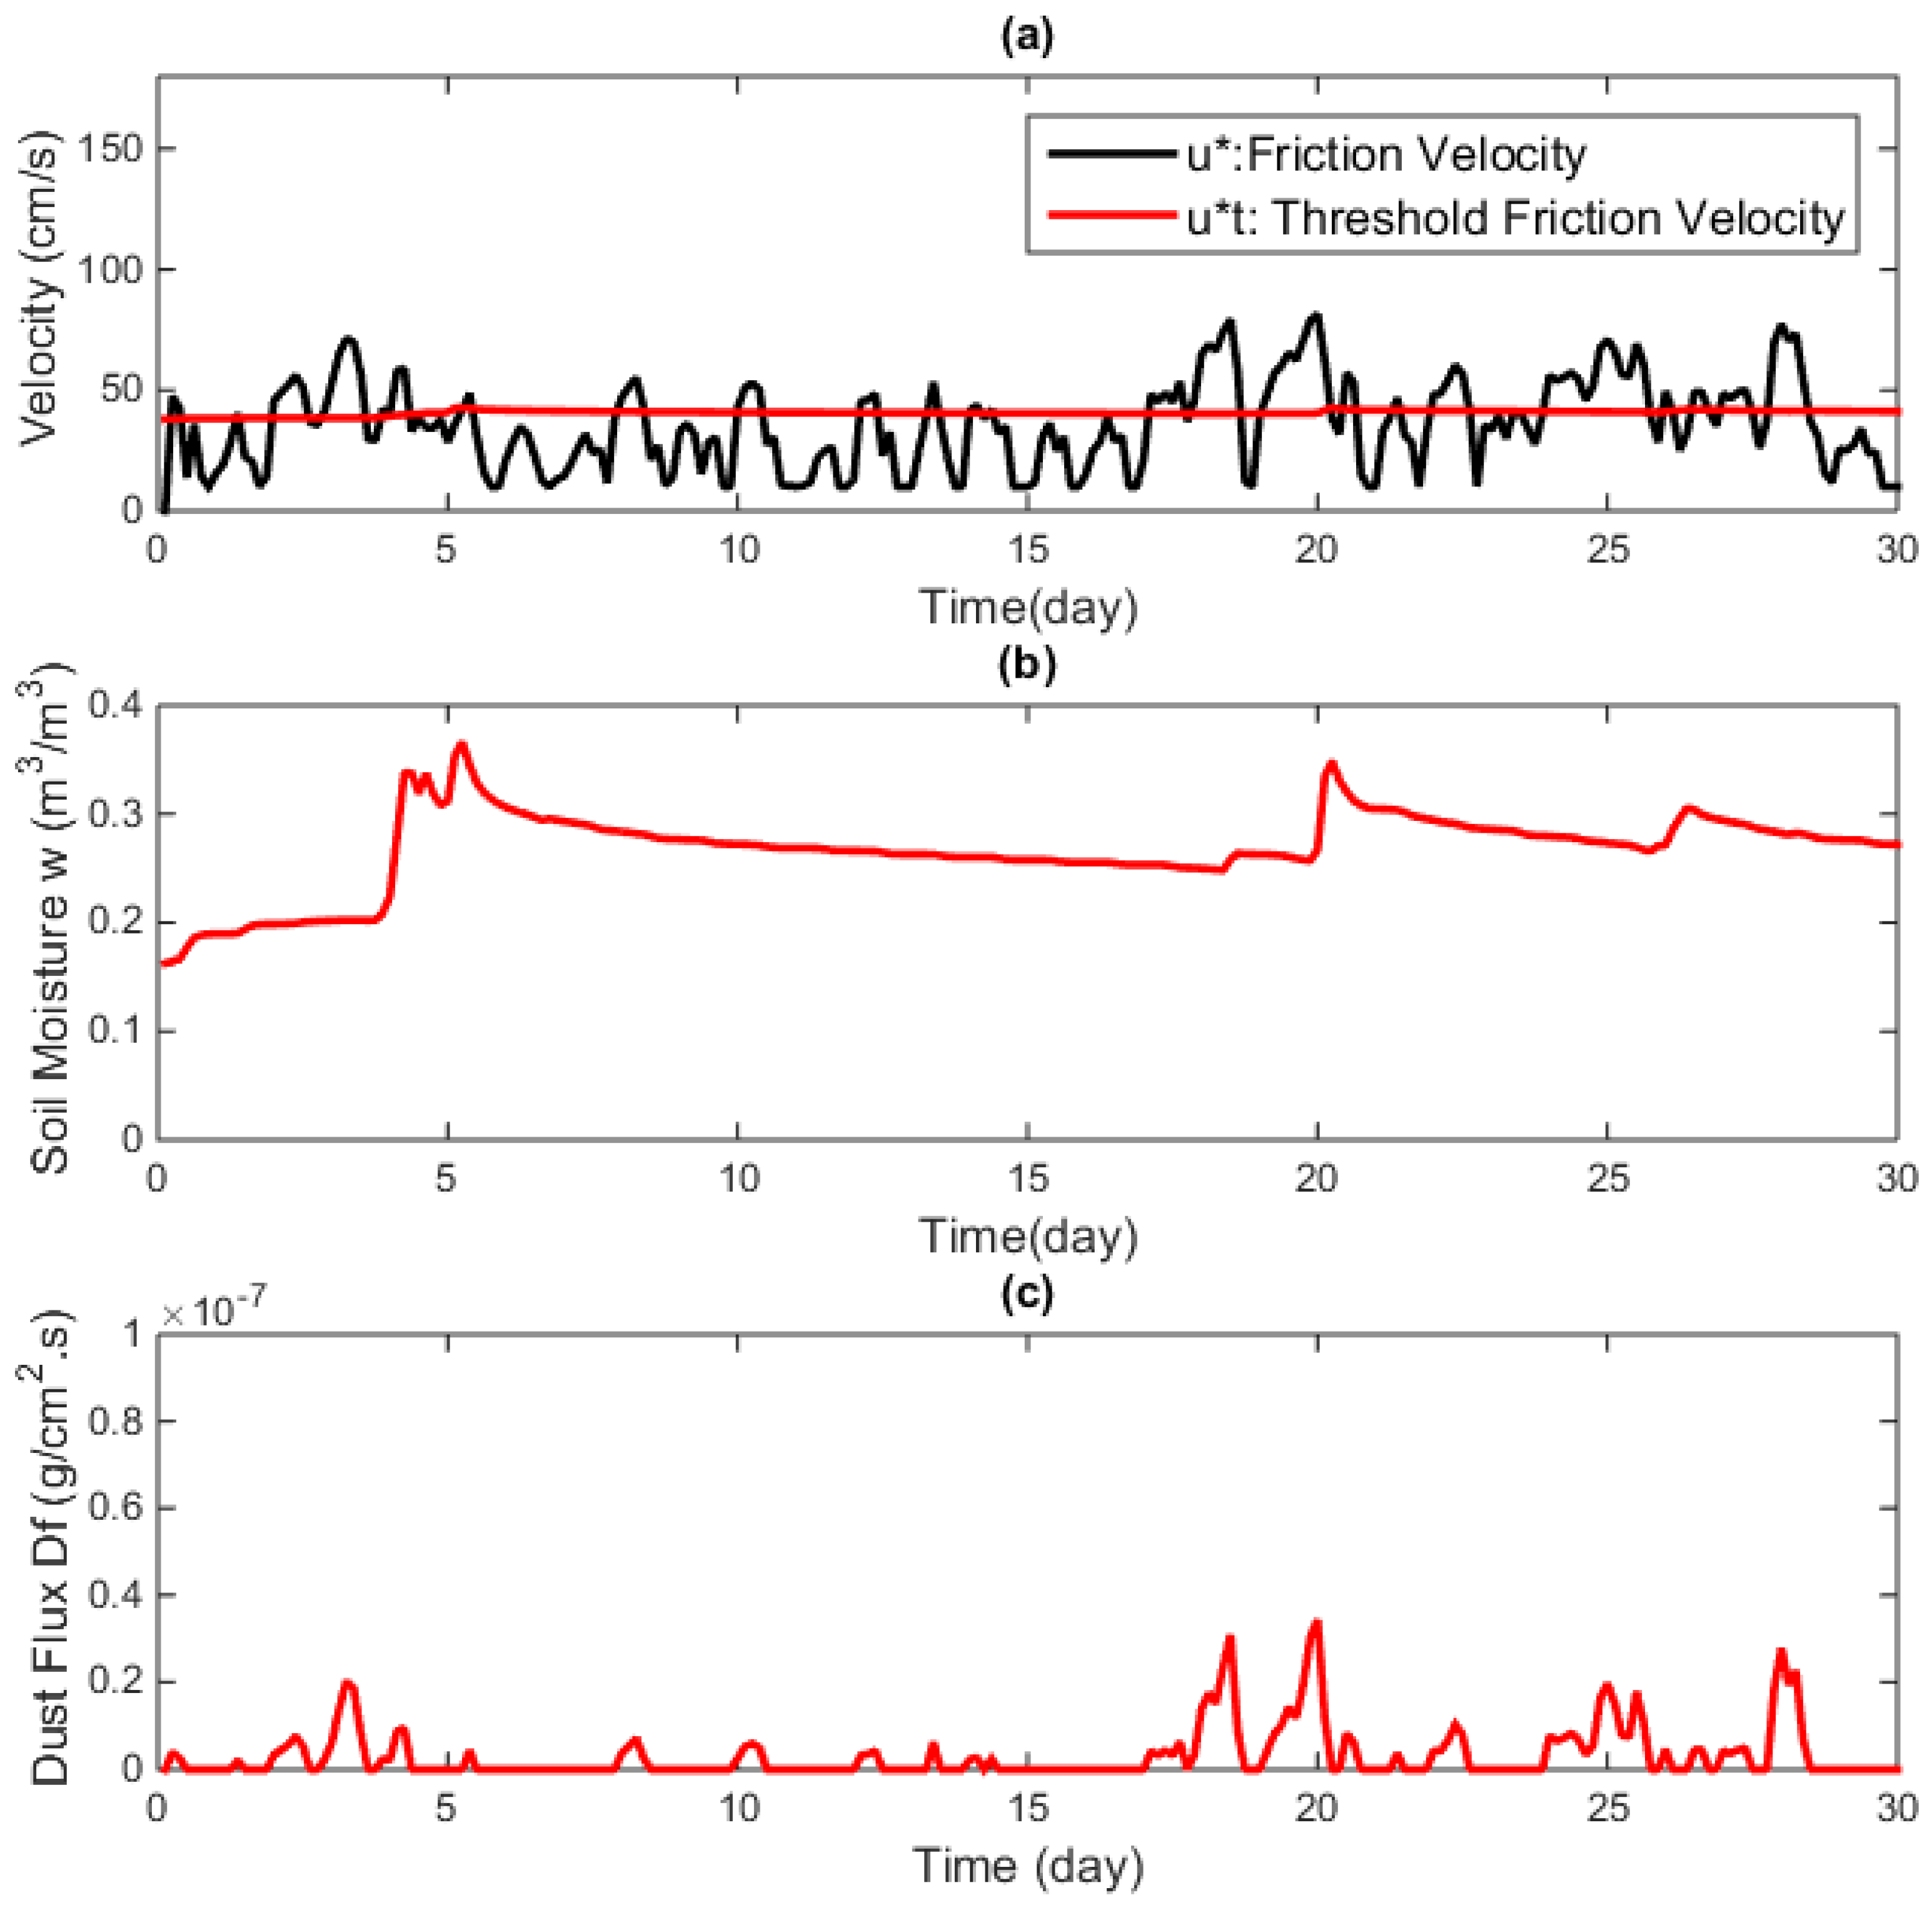
The empirical formulas for dust generation given in Section 2.2 quantify the impact of meteorological conditions on the dust fluxes. Qualitatively, over the same type of land surface, dust fluxes increase under stronger turbulence and lower soil moisture. To illustrate how the two factors influence the dust fluxes under arid climate over Erbil, we constructed time series of relevant variables at a selected WRF grid box located at approximately (44.09° E, 36.17° N), which is at the edge of Erbil where the land turned from non-urban in 1987 to urban in. Figure 12a shows the 3-hourly time series, from the January 1987 case, of friction velocity (u*, black) along with the threshold value (, red) for dust production. Figure 12b shows the time series of soil moisture. The few upticks of soil moisture correspond to events of precipitation. Figure 12c shows the local dust fluxes (Df).
From Figure 12, the local u* frequently exceeds the threshold value that triggers dust production. While the threshold of u* increases with soil moisture, this effect is minor, as the red curve in Figure 12a only goes up slightly with the upticks in soil moisture. This is due to the fact that the surface over the desert is generally very dry. Even when it rains, soil moisture only goes up slightly and quickly drops back to the baseline dry value. As such, dust generation is largely controlled by the friction velocity. The story is similar in summer (not shown). In fact, at the same location, it hardly rains throughout the month of July, and the time series of soil moisture and threshold value of u* would remain flat all month. The friction velocity is generally greater in summer, corresponding to a greater value of the dust flux.
5. Concluding Remarks
This study uses a suite of meteorological and land-surface models to quantify the effects of urbanization on local climate and surface dust fluxes for an isolated desert city. From a set of simulations for Erbil, Iraq, a general pattern of significant nighttime warming and weak but robust daytime cooling associated with urbanization was found in 2 m air temperature. Urbanization also leads to a slight reduction of near-surface wind speed at both daytime and nighttime. These effects exist in both winter and summer, with the temperature effect stronger in summer. These conclusions are consistent with, and further strengthen, the results from previous numerical modeling studies on desert urbanization.
The new aspect of modeling accomplished in this work is a further connection of meteorological and soil variables to a set of empirical formulas for quantifying surface dust fluxes. Using friction velocity and soil moisture from the meteorological model as the main input parameters, the empirical formulas produce climatological maps of surface dust fluxes as a function of season, for the pre- and post-urbanization eras. Since field observations of dust fluxes are not available for Erbil, the results from the numerical simulations serve as the virtual observations from which we gain the first estimate of the effect of urbanization on dust, and further insights into the interaction between meteorological conditions and dust generation over the desert city. In particular, for the case of Erbil, it was found that the dust fluxes are controlled mainly by the strength of near-surface turbulence, while soil moisture plays a relatively minor role.
The modeling system tested in this work is general enough that it can be readily adopted for quantifying the effect of urbanization for other cities. The required inputs from local stakeholders for a specific city are the land-use maps in the surface boundary condition and the urban parameters (building height, fraction of urban-type surface, etc.) in the urban canopy model. The modeling system can be used to evaluate not only the difference between past and present climate states, but also the difference between present and future given a projection of future land-use changes based on city planning.
For future improvements of the system, note that the existing empirical formulas for computing dust fluxes only return the bulk mass flux for all particles with radius <10 μm. If refined formulas with additional information on dust size distribution become available from updated laboratory experiments, such formulas can be readily inserted into our framework as an upgrade. Knowing the spectrum of dust particles will be useful for computing the transport of dust by the local atmospheric circulation, another component that can be added to the system in future developments.
Author Contributions
Conceptualization, S.T.T. and H.-P.H.; methodology, S.T.T. and H.-P.H.; software, S.T.T. and H.-P.H.; validation, H.-P.H.; formal analysis, S.T.T.; investigation, S.T.T.; resources, S.T.T. and H.-P.H.; data curation, S.T.T.; writing—original draft preparation, S.T.T.; writing—review and editing, H.-P.H.; visualization, S.T.T. and H.-P.H.; project administration, S.T.T. and H.-P.H. All authors have read and agreed to the published version of the manuscript.
Funding
This research received no external funding.
Acknowledgments
This paper is based, in part, on the PhD dissertation (Arizona State University, 2019) of the first author, who thanks ASU Graduate College for providing a Completion Fellowship which helped the timely completion of his PhD study. The authors thank anonymous reviewers for useful comments.
Conflicts of Interest
The authors declare no conflict of interest.
References
- United Nations Environment Programme (UNEP). Global Deserts Outlook; United Nations Environment Programme (UNEP): Nairobi, Kenya, 2006; p. 164. Available online: https://www.unenvironment.org/resources/report/global-deserts-outlook (accessed on 1 July 2020).
- United Nations Department of Economic and Social Affairs. World Population Prospects; United Nations Department of Economic and Social Affairs: New York, NY, USA, 2018; p. 126. Available online: https://population.un.org/wup/Publications/Files/WUP2018-Report.pdf (accessed on 1 July 2020).
- Brazel, A.; Gober, P.; Lee, S.J.; Grossman-Clarke, S.; Zehnder, J.; Hedquist, B.; Comparri, E. Determinants of changes in the regional urban heat island in metropolitan Phoenix (Arizona, USA) between 1990 and 2004. Clim. Res. 2007, 33, 171–182. [Google Scholar] [CrossRef] [Green Version]
- Miller, J.A. Urban and regional temperature trends in Las Vegas and southern Nevada. J. Ariz. Nev. Acad. Sci. 2011, 43, 27–39. [Google Scholar] [CrossRef]
- Fan, C.; Myint, S.W.; Kaplan, S.; Middel, A.; Zheng, B.; Rahman, A.; Huang, H.-P.; Brazel, A.; Blumberg, D.G. Understanding the impact of urbanization on Surface Urban Heat Islands—A longitudinal analysis of the oasis effect in subtropical desert cities. Remote Sens. 2017, 9, 672. [Google Scholar] [CrossRef] [Green Version]
- Lazzarini, M.; Marpu, P.R.; Ghedira, H. Temperature-land cover interactions: The inversion of urban heat island phenomenon in desert city areas. Remote Sens. Environ. 2013, 130, 136–152. [Google Scholar] [CrossRef]
- Rasul, A.; Balzter, H.; Smith, C. Spatial variation of the daytime Surface Urban Cool Island during the dry season in Erbil, Iraqi Kurdistan, from Landsat 8. Urban Clim. 2015, 14, 176–186. [Google Scholar] [CrossRef] [Green Version]
- Kamal, S.; Huang, H.-P.; Myint, S. The influence of urbanization on the climate of the Las Vegas Metropolitan area: A numerical study. J. Appl. Meteorol. Climatol. 2015, 54. [Google Scholar] [CrossRef]
- Kamal, S.; Huang, H.-P.; Myint, S. Numerical simulations to quantify the diurnal contrast in local climate trend induced by desert urbanization. Environ. Syst. Decis. 2017, 13. [Google Scholar] [CrossRef]
- Kusaka, H.; Hara, M.; Takane, Y. Urban climate projection by the WRF Model at 3 km horizontal grid increment: Dynamical downscaling and predicting heat stress in the 2070′s August for Tokyo, Osaka, and Nagoya Metropolises. J. Meteorol. Soc. Jpn. 2012, 90B, 47–63. [Google Scholar] [CrossRef] [Green Version]
- Park, S.; In, H. Parameterization of dust emission for the simulation of the yellow sand (Asian dust) event observed in March 2002 in Korea. J. Geophys. Res. 2003, 108, 4618. [Google Scholar] [CrossRef]
- Choi, Y.-J.; Fernando, H. Implementation of a windblown dust parameterization into MODELS-3/CMAQ: Application to episodic PM events in the US/Mexico border. Atmos. Environ. 2008, 42, 6039–6046. [Google Scholar] [CrossRef]
- Rasul, A. Remote Sensing of Surface Urban Cool and Heat Island Dynamics in Erbil, Iraq, between 1992 and 2013. Ph.D. Thesis, University of Leicester, Leicester, UK, 2016. [Google Scholar]
- Faqe-Ibrahim, G. Urban Expansion Monitoring Utilizing Remote Sensing Tools in Erbil City-Kurdistan Region. Master’s Thesis, Soran University, Erbil, Iraq, 2013. [Google Scholar]
- Skamarock, W.; Klemp, J.; Dudhia, J.; Gill, D.; Barker, D.; Duda, M.; Powers, J. A Description of the Advanced Research WRF Version 3; National Center for Atmospheric Research: Boulder, CO, USA, 2008. [Google Scholar]
- Caldwell, P.; Chin, H.-N.; Bader, D.; Bala, G. Evaluation of a WRF dynamical downscaling simulation over California. Clim. Chang. 2009, 95, 499–521. [Google Scholar] [CrossRef] [Green Version]
- Heikkila, U.; Sandvik, A.; Sorteberg, A. Dynamical downscaling of ERA-40 in complex terrain using the WRF regional climate model. Clim. Dyn. 2011, 37, 1551–1564. [Google Scholar] [CrossRef] [Green Version]
- Pan, L.; Chen, S.; Cayan, D.; Hart, M.; Zhang, Q.; Liu, Y.; Wang, J. Influence of climate change on the California and Nevada regions revealed by a high-resolution dynamical downscaling study. Clim. Dyn. 2011, 37, 2005–2020. [Google Scholar] [CrossRef] [Green Version]
- Sharma, A.; Huang, H.-P. Regional climate simulation for Arizona: Impact of resolution on precipitation. Adv. Meteorol. 2012. [Google Scholar] [CrossRef] [Green Version]
- Lind, P.; Lindstedt, D.; Kjellström, E.; Jones, C. Spatial and temporal characteristics of summer precipitation over Central Europe in a suite of high-resolution climate models. J. Clim. 2016, 29, 3501–3518. [Google Scholar] [CrossRef] [Green Version]
- Chen, F.; Kusaka, H.; Borndtein, J.; Ching, J. The integrated WRF/urban modelling system: Development, evaluation, and applications to urban environmental problems. Int. J. Climatol. 2011, 273–288. [Google Scholar] [CrossRef]
- Kusaka, H.; Kondo, H.; Kikegawa, Y.; Kimura, F. A simple single-layer urban canopy model for atmospheric models: Comparison with multi-layer and slab models. Bound.-Layer Meteor. 2001, 101, 329–358. [Google Scholar] [CrossRef]
- Kusaka, H.; Kimura, F. Coupling a single-layer urban canopy model with a simple atmospheric model: Impact on urban heat island simulation for an idealized case. J. Meteor. Soc. Jpn. 2004, 82, 67–80. [Google Scholar] [CrossRef] [Green Version]
- Myint, S.W.; Zheng, B.; Talen, E.; Fan, C.; Kaplan, S.; Middel, A.; Smith, M.; Huang, H.-P.; Brazel, A. Does the spatial arrangement of urban landscape matter? Examples of urban warming and cooling in Phoenix and Las Vegas. Ecosyst. Health Sustain. 2015, 1, art15. [Google Scholar] [CrossRef]
- Zheng, B.; Myint, S.W.; Fan, C. Spatial configuration of anthropogenic land cover impacts on urban warming. Landsc. Urban Plan. 2014, 130, 104–111. [Google Scholar] [CrossRef]
- Hong, S.-Y.; Pan, H. Nonlocal boundary layer vertical diffusion in a medium-range forecast model. Mon. Weather Rev. 1996, 124, 2322–2339. [Google Scholar] [CrossRef] [Green Version]
- Hong, S.-Y.; Noh, Y. A New vertical diffusion package with an explicit treatment of entrainment processes. Mon. Weather Rev. 2005, 134, 2318–2341. [Google Scholar] [CrossRef] [Green Version]
- Laurent, B.; Marticorena, B.; Bergametti, G. Modelling mineral dust emissions. Earth Environ. Sci. 2009. [Google Scholar] [CrossRef]
- Westphal, D.; Toon, O.; Carlson, T. A Two-Dimensional numerical investigation of the dynamics and microphysics of Saharan dust storms. J. Geophys. Res. 1987, 92, 3027–3049. [Google Scholar] [CrossRef]
- Marticorena, B.; Bergametti, G.; Gillette, D.; Belnap, J. Factors controlling threshold friction velocity in semiarid and arid areas of the United States. J. Geophys. Res. 1997, 102, 23277–23287. [Google Scholar] [CrossRef]
- Fecan, F.; Marticorena, B.; Bergametti, G. Parameterization of the increase of the Aeolian erosion threshold wind friction velocity due to soil moisture for arid and semi-arid areas. Ann. De Geophys. 1999, 17, 149–157. [Google Scholar] [CrossRef] [Green Version]
- Gong, S.; Zhang, X.; Zhao, T.; Mckendry, I.; Jaffe, D.; Lu, N. Characterization of soil dust aerosol in China and its transport and distribution during 2001 ACE-Asia: 2. Model simulation and validation. J. Geophys. Res. 2003, 108. [Google Scholar] [CrossRef]
- USGS LandsatLook. Available online: www.landlook.usgs.gov (accessed on 16 November 2017).
- Saha, S.; Moorthi, S.; Pan, H.-L.; Wu, X.; Wang, J.; Nadiga, S.; Tripp, P.; Kistler, R.; Woollen, J.; Behringer, D.; et al. The NCEP Climate Forecast System Reanalysis. Bull. Am. Meteorol. Soc. 2010, 91, 1015–1057. [Google Scholar] [CrossRef]
- Rajagopalan, P.; Lim, K.; Jamei, E. Urban heat island and wind flow characteristics of a tropical city. Sol. Energy 2014, 107, 159–170. [Google Scholar] [CrossRef]
Figure 1.
The three nested domains used for the simulations for Erbil city, which is located at the center of the innermost domain.
Figure 1.
The three nested domains used for the simulations for Erbil city, which is located at the center of the innermost domain.

Figure 2.
Landsat satellite images for the city of Erbil and its vicinity in 1987 (left) and 2011 (right). For reference, in each panel, the (longitude, latitude) of the upper left corner is (43°29′ E, 36°59′ N), and lower right corner (45°03′ E, 35°06′ N). (Generated from data archived at U.S. Geological Survey [33]).

Figure 3.
The land-use map over the innermost domain of Weather Research and Forecasting (WRF). (a) The default map in WRF Geogrid database. (b) Land-use map for 1987 constructed from satellite images and local surveys. (c) Similar to (b) but for 2011. The LULC categories shown are 1: dark blue, urban; 2: blue, dry cropland; 6: green, cropland/woodland; 8: tan, shrubland; 9: bright yellow, mixed shrubland/grassland.

Figure 4.
Left column: time series of daily-averaged values of (a) 2m air temperature, (b) relative humidity, (c) daily precipitation, and (d) 10 m wind speed, at the location L1, over the month of January 2000. Black and red curves in each panel are from WRF and CFSR, respectively. Right column: Panels (e–h) are arranged in the same manner as (a–d) in the left column but for the location L2.

Figure 5.
Time series of 2 m air temperature averaged over the grid boxes in the Erbil region that underwent urbanization. Shown are the 3-hourly model outputs over a 1-month period. The lateral boundary conditions are from 2000, and red and black are for the simulations using 2011 and 1987 land-use maps, respectively. (a) Winter (January); (b) summer (July).
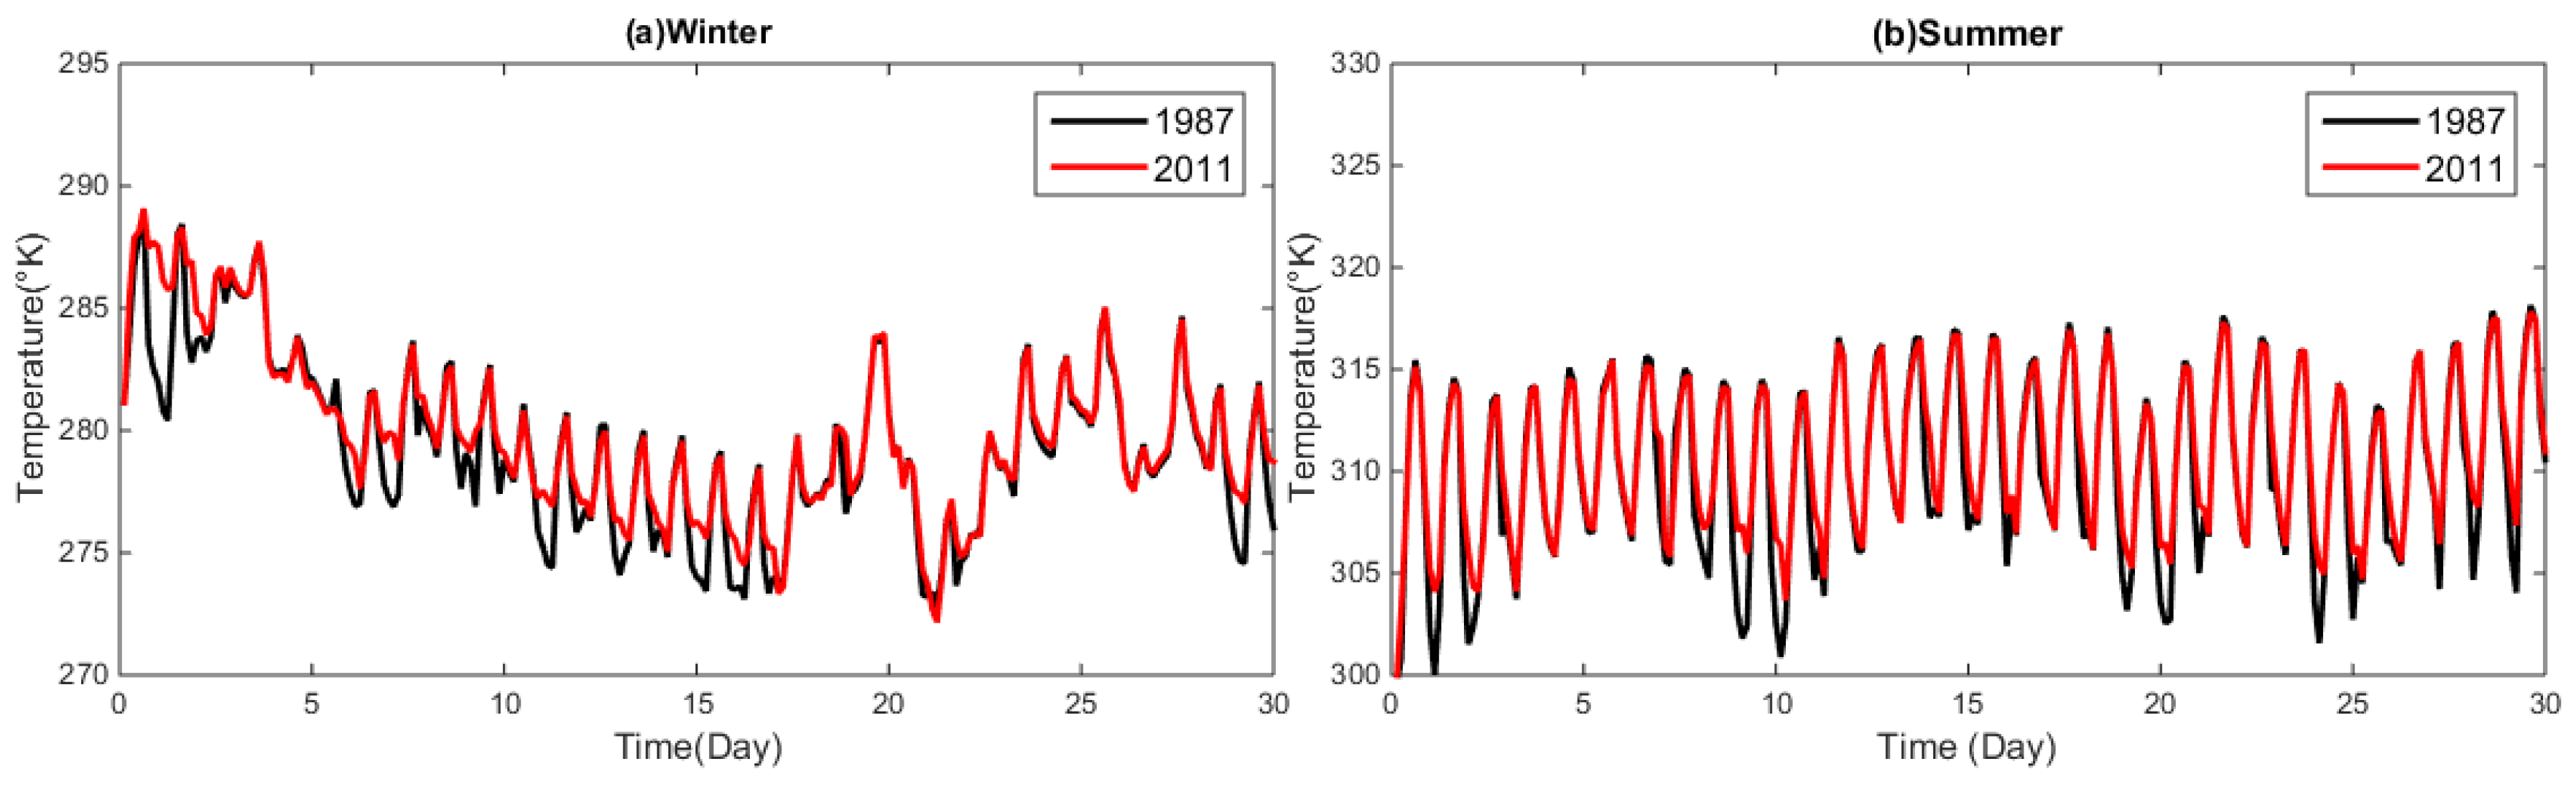
Figure 6.
The difference in 2 m temperature, defined as “2011 case minus 1987 case”, that represents the effect of urbanization. Shown are the monthly averages over Erbil and its vicinity. Panel (a,b) are the nighttime temperatures for winter and summer, respectively. Panel (c,d) are the daytime temperatures for winter and summer, respectively.

Figure 7.
Time series of surface wind speed at 10 m height averaged around Erbil. Shown are the 3-hourly values over a month. The black and red curves are for the 1987 and 2011 cases, respectively. (a) Winter (January); (b) summer.
Figure 7.
Time series of surface wind speed at 10 m height averaged around Erbil. Shown are the 3-hourly values over a month. The black and red curves are for the 1987 and 2011 cases, respectively. (a) Winter (January); (b) summer.

Figure 8.
The differences in 10 m wind speed. Panels (a–d) are arranged in the same manner as their counterparts in Figure 6. All four panels show a slight reduction in the wind speed on the order of 0.25–0.5 m/s.
Figure 8.
The differences in 10 m wind speed. Panels (a–d) are arranged in the same manner as their counterparts in Figure 6. All four panels show a slight reduction in the wind speed on the order of 0.25–0.5 m/s.
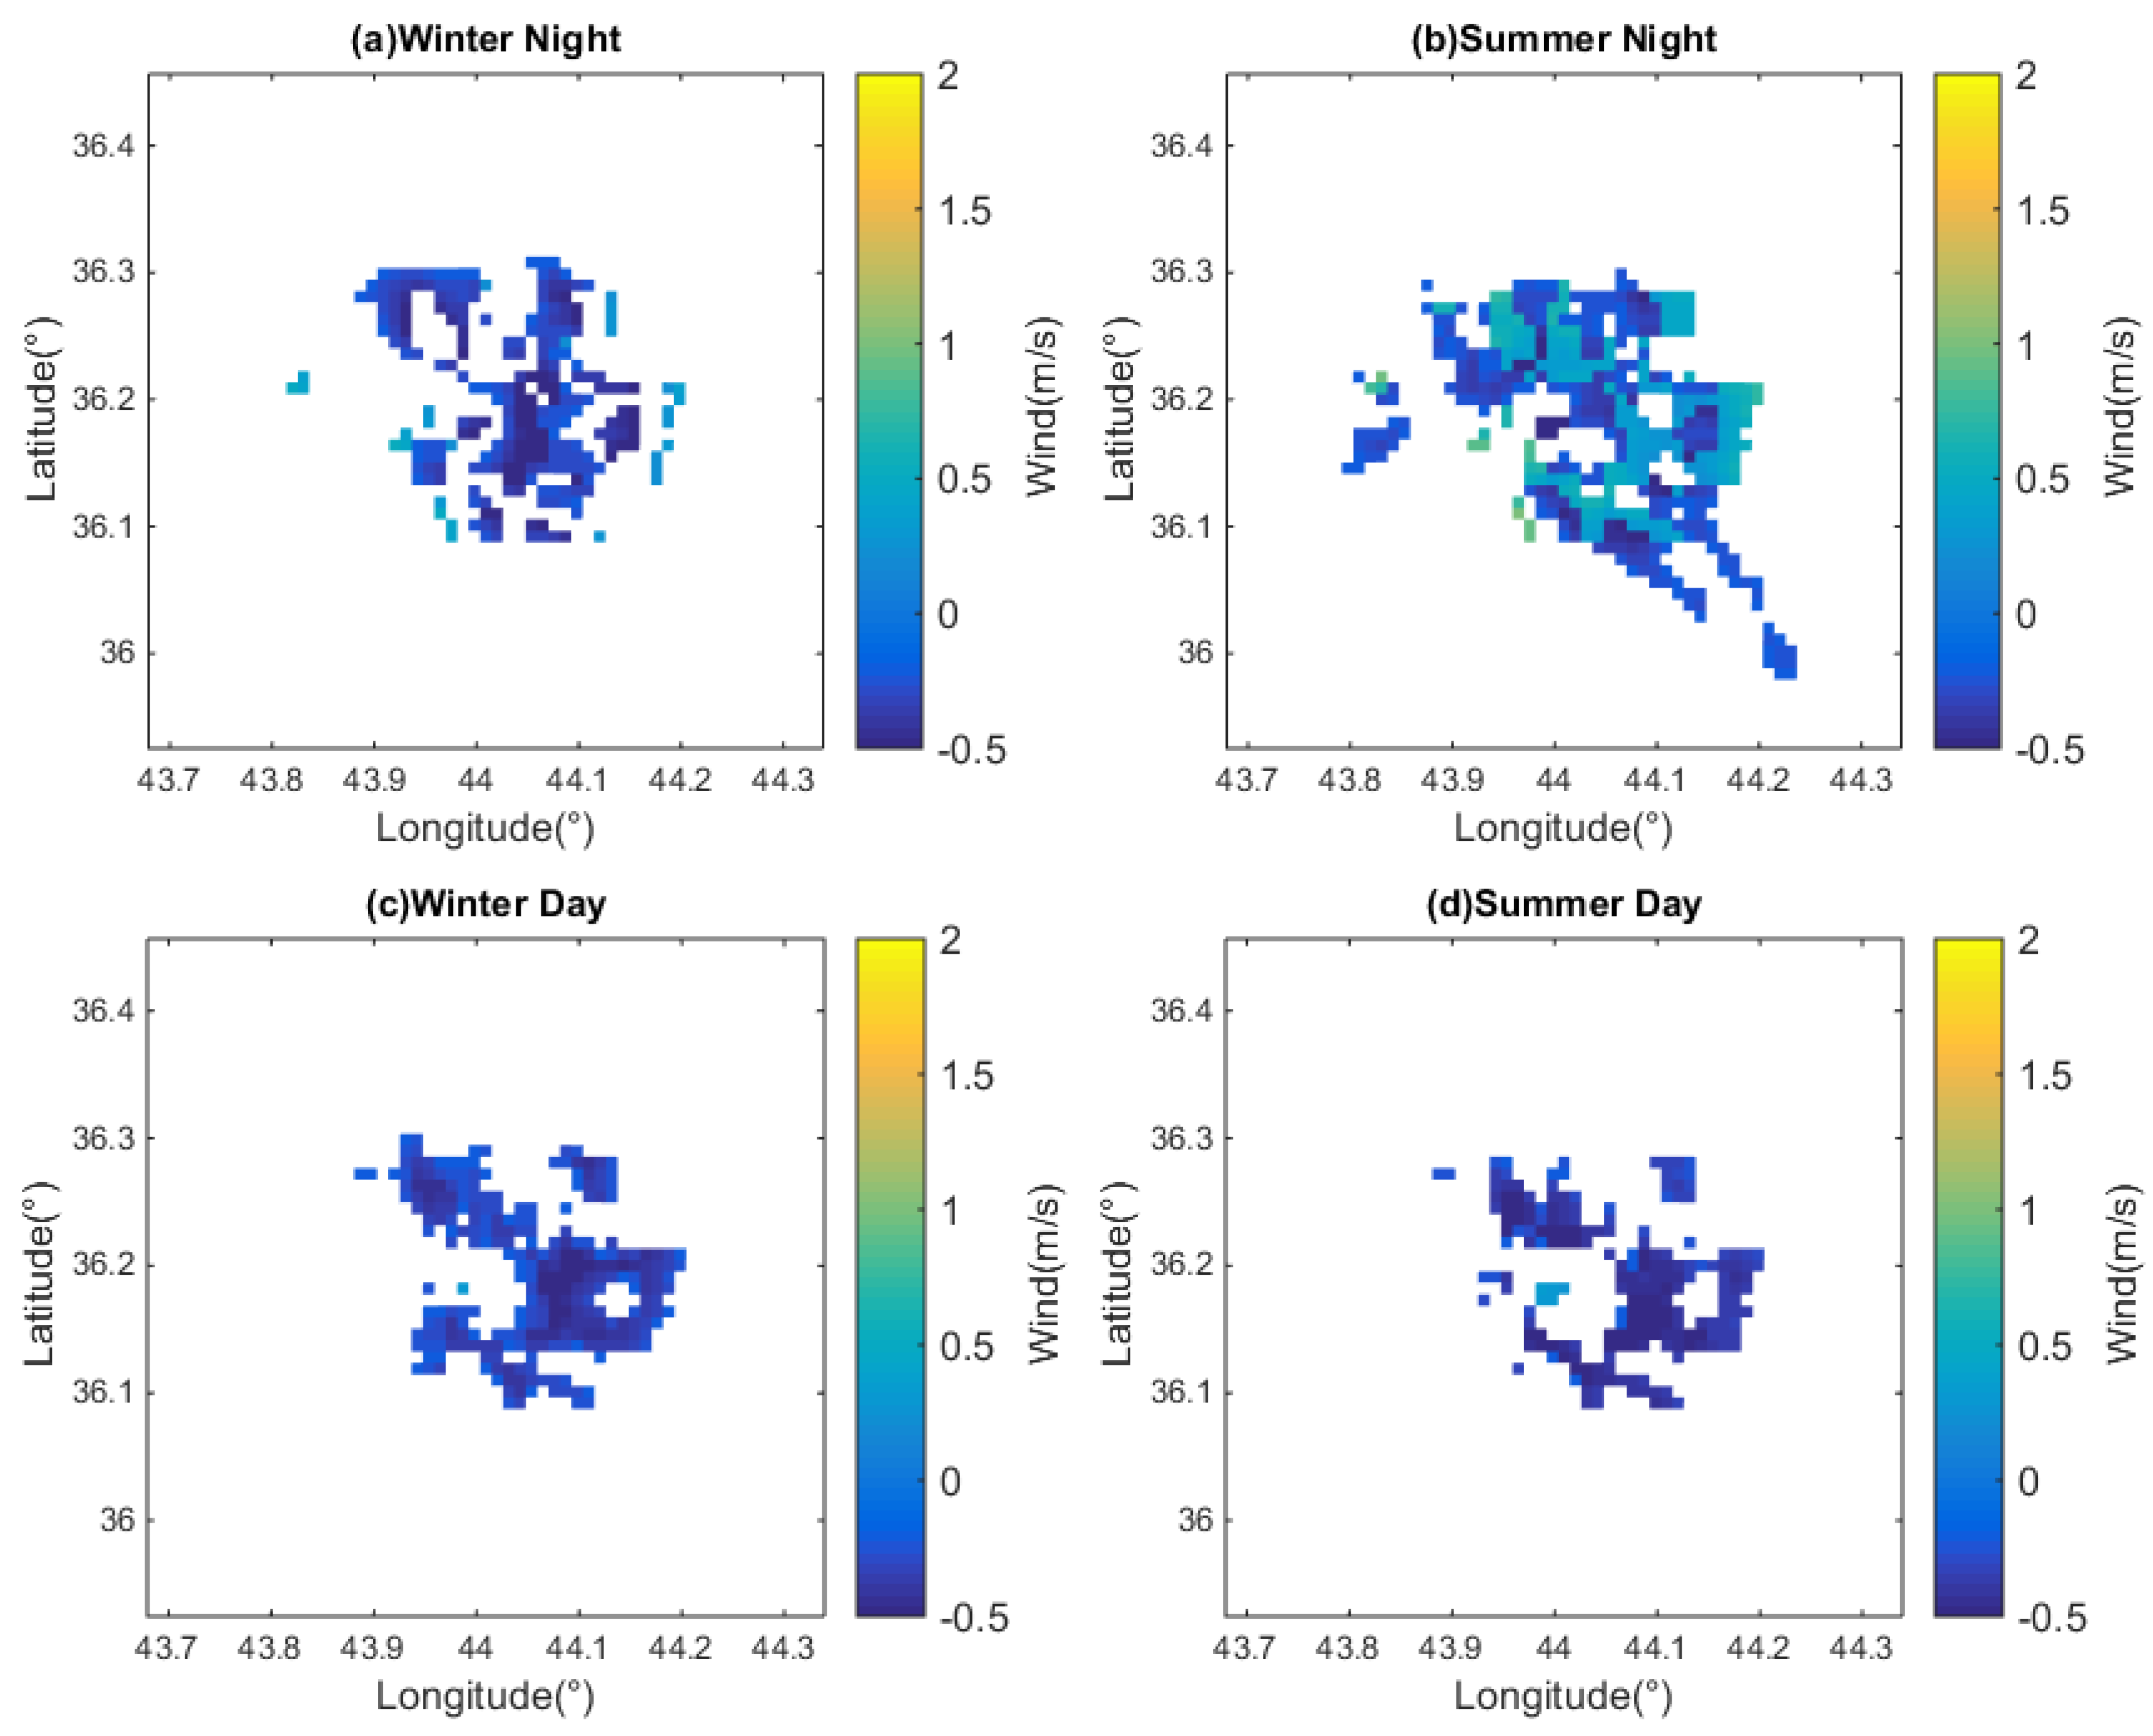
Figure 9.
Cumulative dust flux (g/cm2 s) over a 30-day period. Panel (a,b) are from the 1987 case, for winter (January) and summer (July), respectively. The border of the urban area in 1987 is marked in light yellow. Panel (c,d) are similar to (a,b) but from the 2011 case. The border of the urban area in 2011 is marked in light yellow.

Figure 10.
The monthly mean of friction velocity (u*) over the region in the vicinity of Erbil. Red lines represent the border of the urban region in 1987. (a) January. (b) July.
Figure 10.
The monthly mean of friction velocity (u*) over the region in the vicinity of Erbil. Red lines represent the border of the urban region in 1987. (a) January. (b) July.

Figure 11.
The difference in the monthly cumulative dust flux, defined as “1987 case minus 2011 case”. Positive means more dust is produced in the 1987 case. (a) Winter (January); (b) summer (July).
Figure 11.
The difference in the monthly cumulative dust flux, defined as “1987 case minus 2011 case”. Positive means more dust is produced in the 1987 case. (a) Winter (January); (b) summer (July).

Figure 12.
Three-hourly time series over 30 days in January (case 1987) at the location of (44.09° E, 36.17° N) for (a) black: friction velocity, u*; red: the threshold of friction velocity for dust generation, u*t (in cm/s). (b) Soil moisture w (m3/m3). (c) Dust flux (g/m2.s).
Figure 12.
Three-hourly time series over 30 days in January (case 1987) at the location of (44.09° E, 36.17° N) for (a) black: friction velocity, u*; red: the threshold of friction velocity for dust generation, u*t (in cm/s). (b) Soil moisture w (m3/m3). (c) Dust flux (g/m2.s).


Table 1.
U.S. Geological Survey land-use land-cover (LULC) categories and the corresponding surface roughness length (Z0) and dust emission reduction factor (R). The data are compiled after [11] and [12].
| No. | Description | Z0(cm) | Reduction Factor (R) |
|---|---|---|---|
| 1 | Urban and built-up land | 100 | 1.0 |
| 2 | Dry cropland and pasture | 2 | 0.4 |
| 3 | Irrigated cropland and pasture | 2 | 0.6 |
| 4 | Mixed dry/irrigated cropland and pasture | 2 | 0.5 |
| 5 | Cropland/grassland | 2 | 0.5 |
| 6 | Cropland/woodland | 2 | 0.7 |
| 7 | Grassland | 2 | 0.6 |
| 8 | Shrubland | 3 | 0.7 |
| 9 | Mixed shrub/grassland | 3 | 0.75 |
| 10 | Savanna | 2 | 0.8 |
| 11 | Deciduous broadleaf forest | 5 | 0.9 |
| 12 | Deciduous needleleaf forest | 5 | 0.9 |
| 13 | Evergreen broadleaf forest | 5 | 0.9 |
| 14 | Evergreen needleleaf forest | 5 | 0.9 |
| 15 | Mixed forest | 5 | 0.9 |
| 16 | Water | 0.1 | 1.0 |
| 17 | Herbaceous wet land | 0.2 | 1.0 |
| 18 | Wooded wet land | 0.3 | 1.0 |
| 19 | Barren or sparsely vegetated land | 1 | 0.1 |
| 20 | Herbaceous tundra | 0.3 | 1.0 |
| 21 | Wooded tundra | 0.3 | 1.0 |
| 22 | Mixed tundra | 0.2 | 1.0 |
| 23 | Bare ground tundra | 0.1 | 1.0 |
| 24 | Snow or ice | 0.1 | 1.0 |
Table 2.
A summary of the main WRF simulations.
| Run # | Land-Use Land-Cover for Surface B.C. | Lateral B.C. at the Outermost Domain | Output Frequency (h) | Duration (Days) |
|---|---|---|---|---|
| 1 | Erbil 1987 | 6-hourly FNL January 2000 | 3 | 30 |
| 2 | Erbil 2011 | 6-hourly FNL January 2000 | 3 | 30 |
| 3 | Erbil 1987 | 6-hourly FNL July 2000 | 3 | 30 |
| 4 | Erbil 2011 | 6-hourly FNL July 2000 | 3 | 30 |
© 2020 by the authors. Licensee MDPI, Basel, Switzerland. This article is an open access article distributed under the terms and conditions of the Creative Commons Attribution (CC BY) license (http://creativecommons.org/licenses/by/4.0/).
Share and Cite
MDPI and ACS Style
Tahir, S.T.; Huang, H.-P. Modeling the Effect of Desert Urbanization on Local Climate and Natural Dust Generation: A Case Study for Erbil, Iraq. Urban Sci. 2020, 4, 46. https://doi.org/10.3390/urbansci4040046
AMA Style
Tahir ST, Huang H-P. Modeling the Effect of Desert Urbanization on Local Climate and Natural Dust Generation: A Case Study for Erbil, Iraq. Urban Science. 2020; 4(4):46. https://doi.org/10.3390/urbansci4040046
Chicago/Turabian StyleTahir, Sherzad T., and Huei-Ping Huang. 2020. "Modeling the Effect of Desert Urbanization on Local Climate and Natural Dust Generation: A Case Study for Erbil, Iraq" Urban Science 4, no. 4: 46. https://doi.org/10.3390/urbansci4040046