Article

Integrating Data-Driven and Participatory Modeling to Simulate Future Urban Growth Scenarios: Findings from Monastir, Tunisia

1
Institute for Environment and Human Security (UNU-EHS), United Nations University, Platz der Vereinten Nationen 1, 53113 Bonn, Germany
2
Department of Geography, Ludwig-Maximilians-Universität München (LMU), Luisenstraße 37, 80333 Munich, Germany
3
Industrieanlagen-Betriebsgesellschaft mbH (IABG mbH), Einsteinstr. 20, 85521 Ottobrunn, Germany
4
Municipality of Monastir, Municipalité de Monastir, Avenue Habib Bourguiba, 5019 Monastir, Tunisia
*
Author to whom correspondence should be addressed.
Urban Sci. 2020, 4(1), 10; https://doi.org/10.3390/urbansci4010010
Submission received: 2 December 2019 / Revised: 19 February 2020 / Accepted: 24 February 2020 / Published: 27 February 2020

Abstract

:
Current rapid urbanization trends in developing countries present considerable challenges to local governments, potentially hindering efforts towards sustainable urban development. To effectively anticipate the challenges posed by urbanization, participatory modeling techniques can help to stimulate future-oriented decision-making by exploring alternative development scenarios. With the example of the coastal city of Monastir, we present the results of an integrated urban growth analysis that combines the SLEUTH (slope, land use, exclusion, urban extent, transportation, and hill shade) cellular automata model with qualitative inputs from relevant local stakeholders to simulate urban growth until 2030. While historical time-series of Landsat data fed a business-as-usual prediction, the quantification of narrative storylines derived from participatory scenario workshops enabled the creation of four additional urban growth scenarios. Results show that the growth of the city will occur at different rates under all scenarios. Both the “business-as-usual” (BaU) prediction and the four scenarios revealed that urban expansion is expected to further encroach on agricultural land by 2030. The various scenarios suggest that Monastir will expand between 127–149 hectares. The information provided here goes beyond simply projecting past trends, giving decision-makers the necessary support for both understanding possible future urban expansion pathways and proactively managing the future growth of the city.

1. Introduction

The 21st century is the century of cities. While in 1950 only 761 million people lived in cities, the urban population grew to 4.2 billion in 2018, accounting for more than half of the world’s population [1]. According to the United Nations, this percentage is likely to grow significantly in decades to come. The recently published World Urbanization Prospects estimates that by 2050, almost 70% of the world’s population will be urban, with the fastest growth taking place in Africa and Asia [1]. Cities are the hubs of economic development, technological innovation, and entrepreneurship. They also provide a multitude of services to inhabitants (e.g., adequate housing, health care, social services, education, and infrastructure) that are often lacking or scarce in rural areas [2]. Over the past decades, urbanization has been a driver of economic development and poverty reduction in many places around the world [3]. Hence, in an increasingly urban world, the successful management of current and future urban growth has direct implications for sustainable development, as encapsulated by Sustainable Development Goal (SDG) 11 (Sustainable Cities and Resilient Communities), which commits to making cities inclusive, safe, resilient, and sustainable. However, meeting these commitments under SDG 11 remains a challenging task, given that the most rapid urbanization in coming decades will occur in low-income and lower-middle-income countries, where adequate capacity and resources to manage such a rapid transformation are in short supply. Furthermore, cities in these countries are often growing in places highly exposed to environmental- and climate change-related hazards, which poses additional challenges for sustainable development [4]. Therefore, sustainable policies and strategies for planning and managing urban growth are needed to ensure that the benefits of urbanization are leveraged and shared.
Historically, human decisions on urban planning are often based on mental scenarios for desired/undesired future events [5]. However, modern technology has enabled us to materialize such layouts through modeling. The resultant simulations can support a detailed analysis of possible alternative outcomes and can help to plan the urban future accordingly. Thus, future projections and scenarios of urban growth can bolster the planning process by offering local governments the possibility to anticipate future challenges and facilitate the sustainable planning of possible urban futures [6]. Urban growth modeling provides tremendous opportunities for such tasks and draws on several decades of model development, with the earliest models dating back to the late 1960s [7]. Urban growth models can support urban planning by providing useful insights into the spatial evolution of cities. However, urban growth is a process that depends on a complex set of environmental, physical, and societal variables. Multiple interactions between these variables can steer urban expansion (or contraction) in different spatially-explicit directions. Therefore, purely data-driven models that rely on a historical series of quantifiable physical variables may not be sufficient to produce a holistic and complex representation of urban processes. The inclusion of local stakeholders in model development allows the introduction of profound assumptions grounded in the local context. These assumptions can help to explore alternative spatial evolutions of the city and to ensure that local issues (e.g., different development scenarios or policy choices) are adequately represented in the subsequent tools [8]. Efforts to simulate urban growth at the global scale (e.g., [9,10,11]) and high-income countries [11,12] are well documented in the literature. Applications in low and lower-middle-income countries are also becoming more frequent [13]. However, the majority of urban growth simulations at the local level are based on data-driven approaches and associated scientific assumptions [8], and often do not take into account relevant social, economic, or political drivers of growth, which cannot be represented through quantitative data. Nor do they sufficiently consider the participation of relevant local stakeholders in model development. The inclusion of relevant stakeholders in the design and construction of such models is of utmost importance to (i) ensure the consideration of local conditions in model development, (ii) increase trust in model outputs, and (iii) facilitate the mainstreaming of these outputs into local urban planning and management. Such inclusion is even more relevant in developing countries, where urbanization processes are extremely dynamic and dependent on a combination of social, economic, and governance-related factors that can be only partially captured by purely data-driven approaches [14].
The present study addresses some of the above-mentioned gaps by presenting a participatory modeling application to simulate future urban growth of the city of Monastir, Tunisia. Through the visualization of alternative urban futures for the city (co-developed in a participatory process with local stakeholders), the study tests and evaluates the outcomes of rival urban policies under different socio-economic conditions. The article presents future urban growth simulations (2030) for: (1) a business-as-usual (BaU) prediction and (2) four alternative scenarios derived from participatory scenario workshops. Additionally, it discusses the advantages of integrating a data-driven approach with a participatory scenario design.

2. Materials and Methods
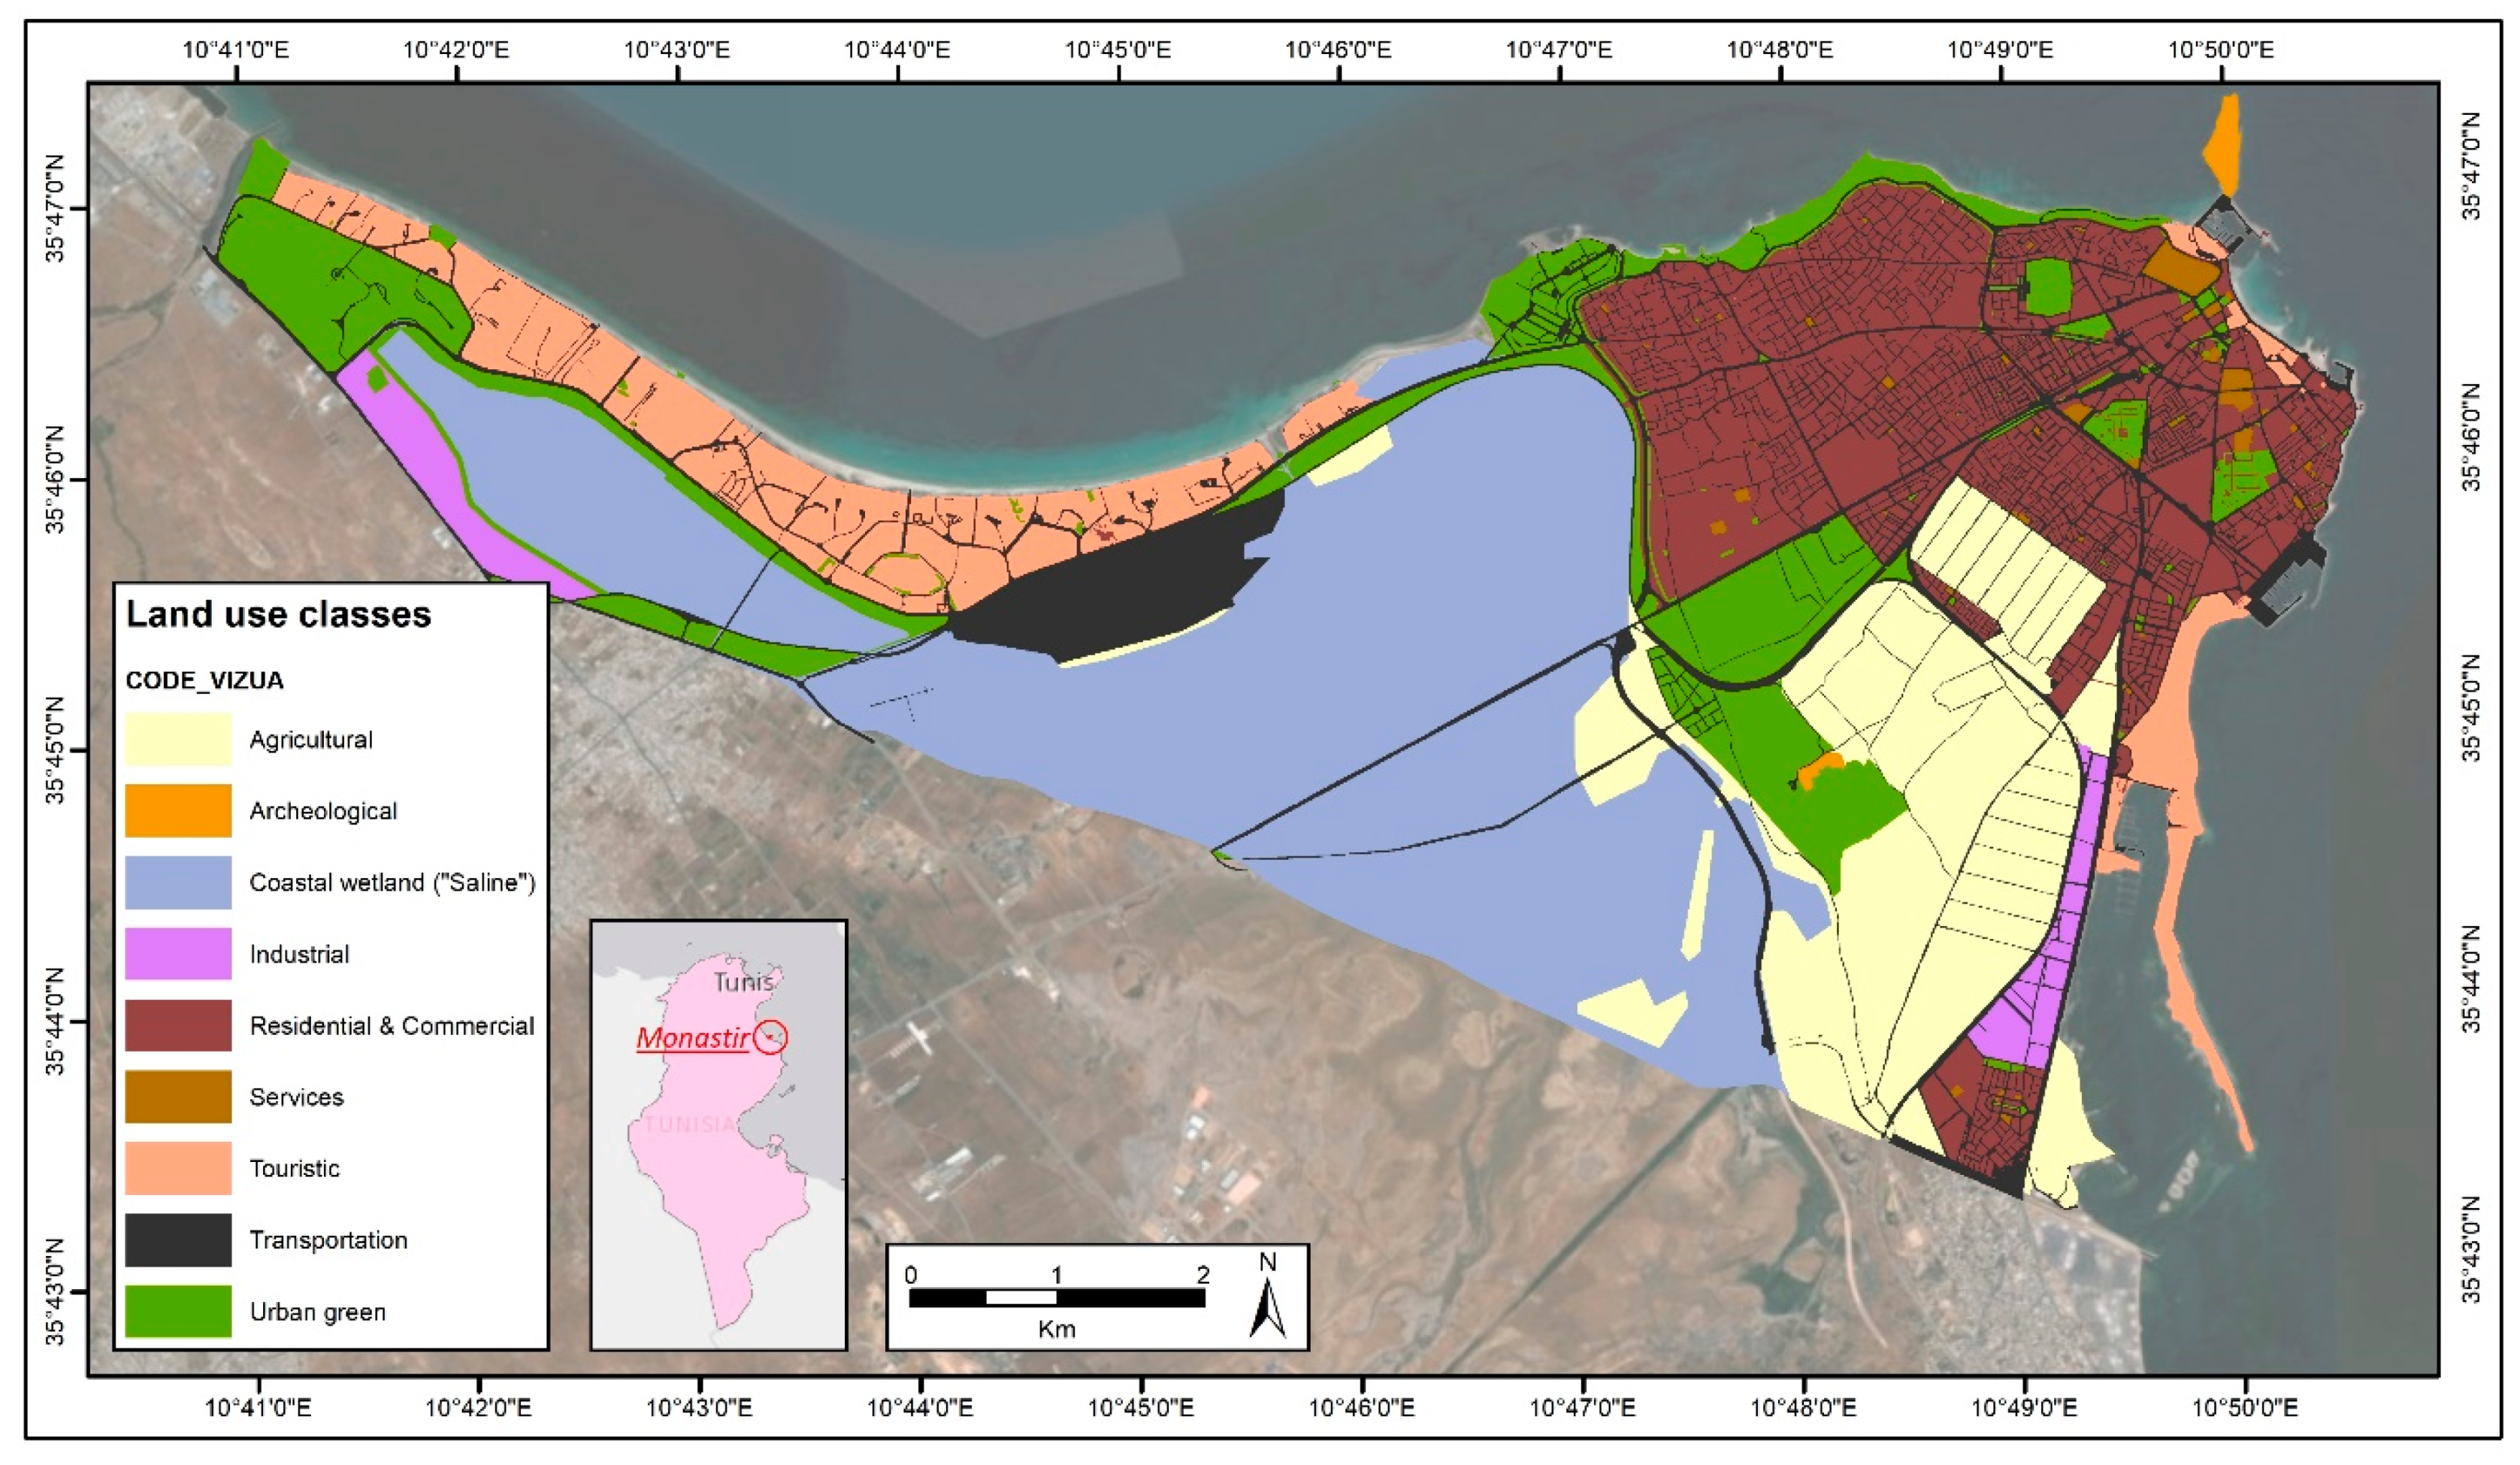
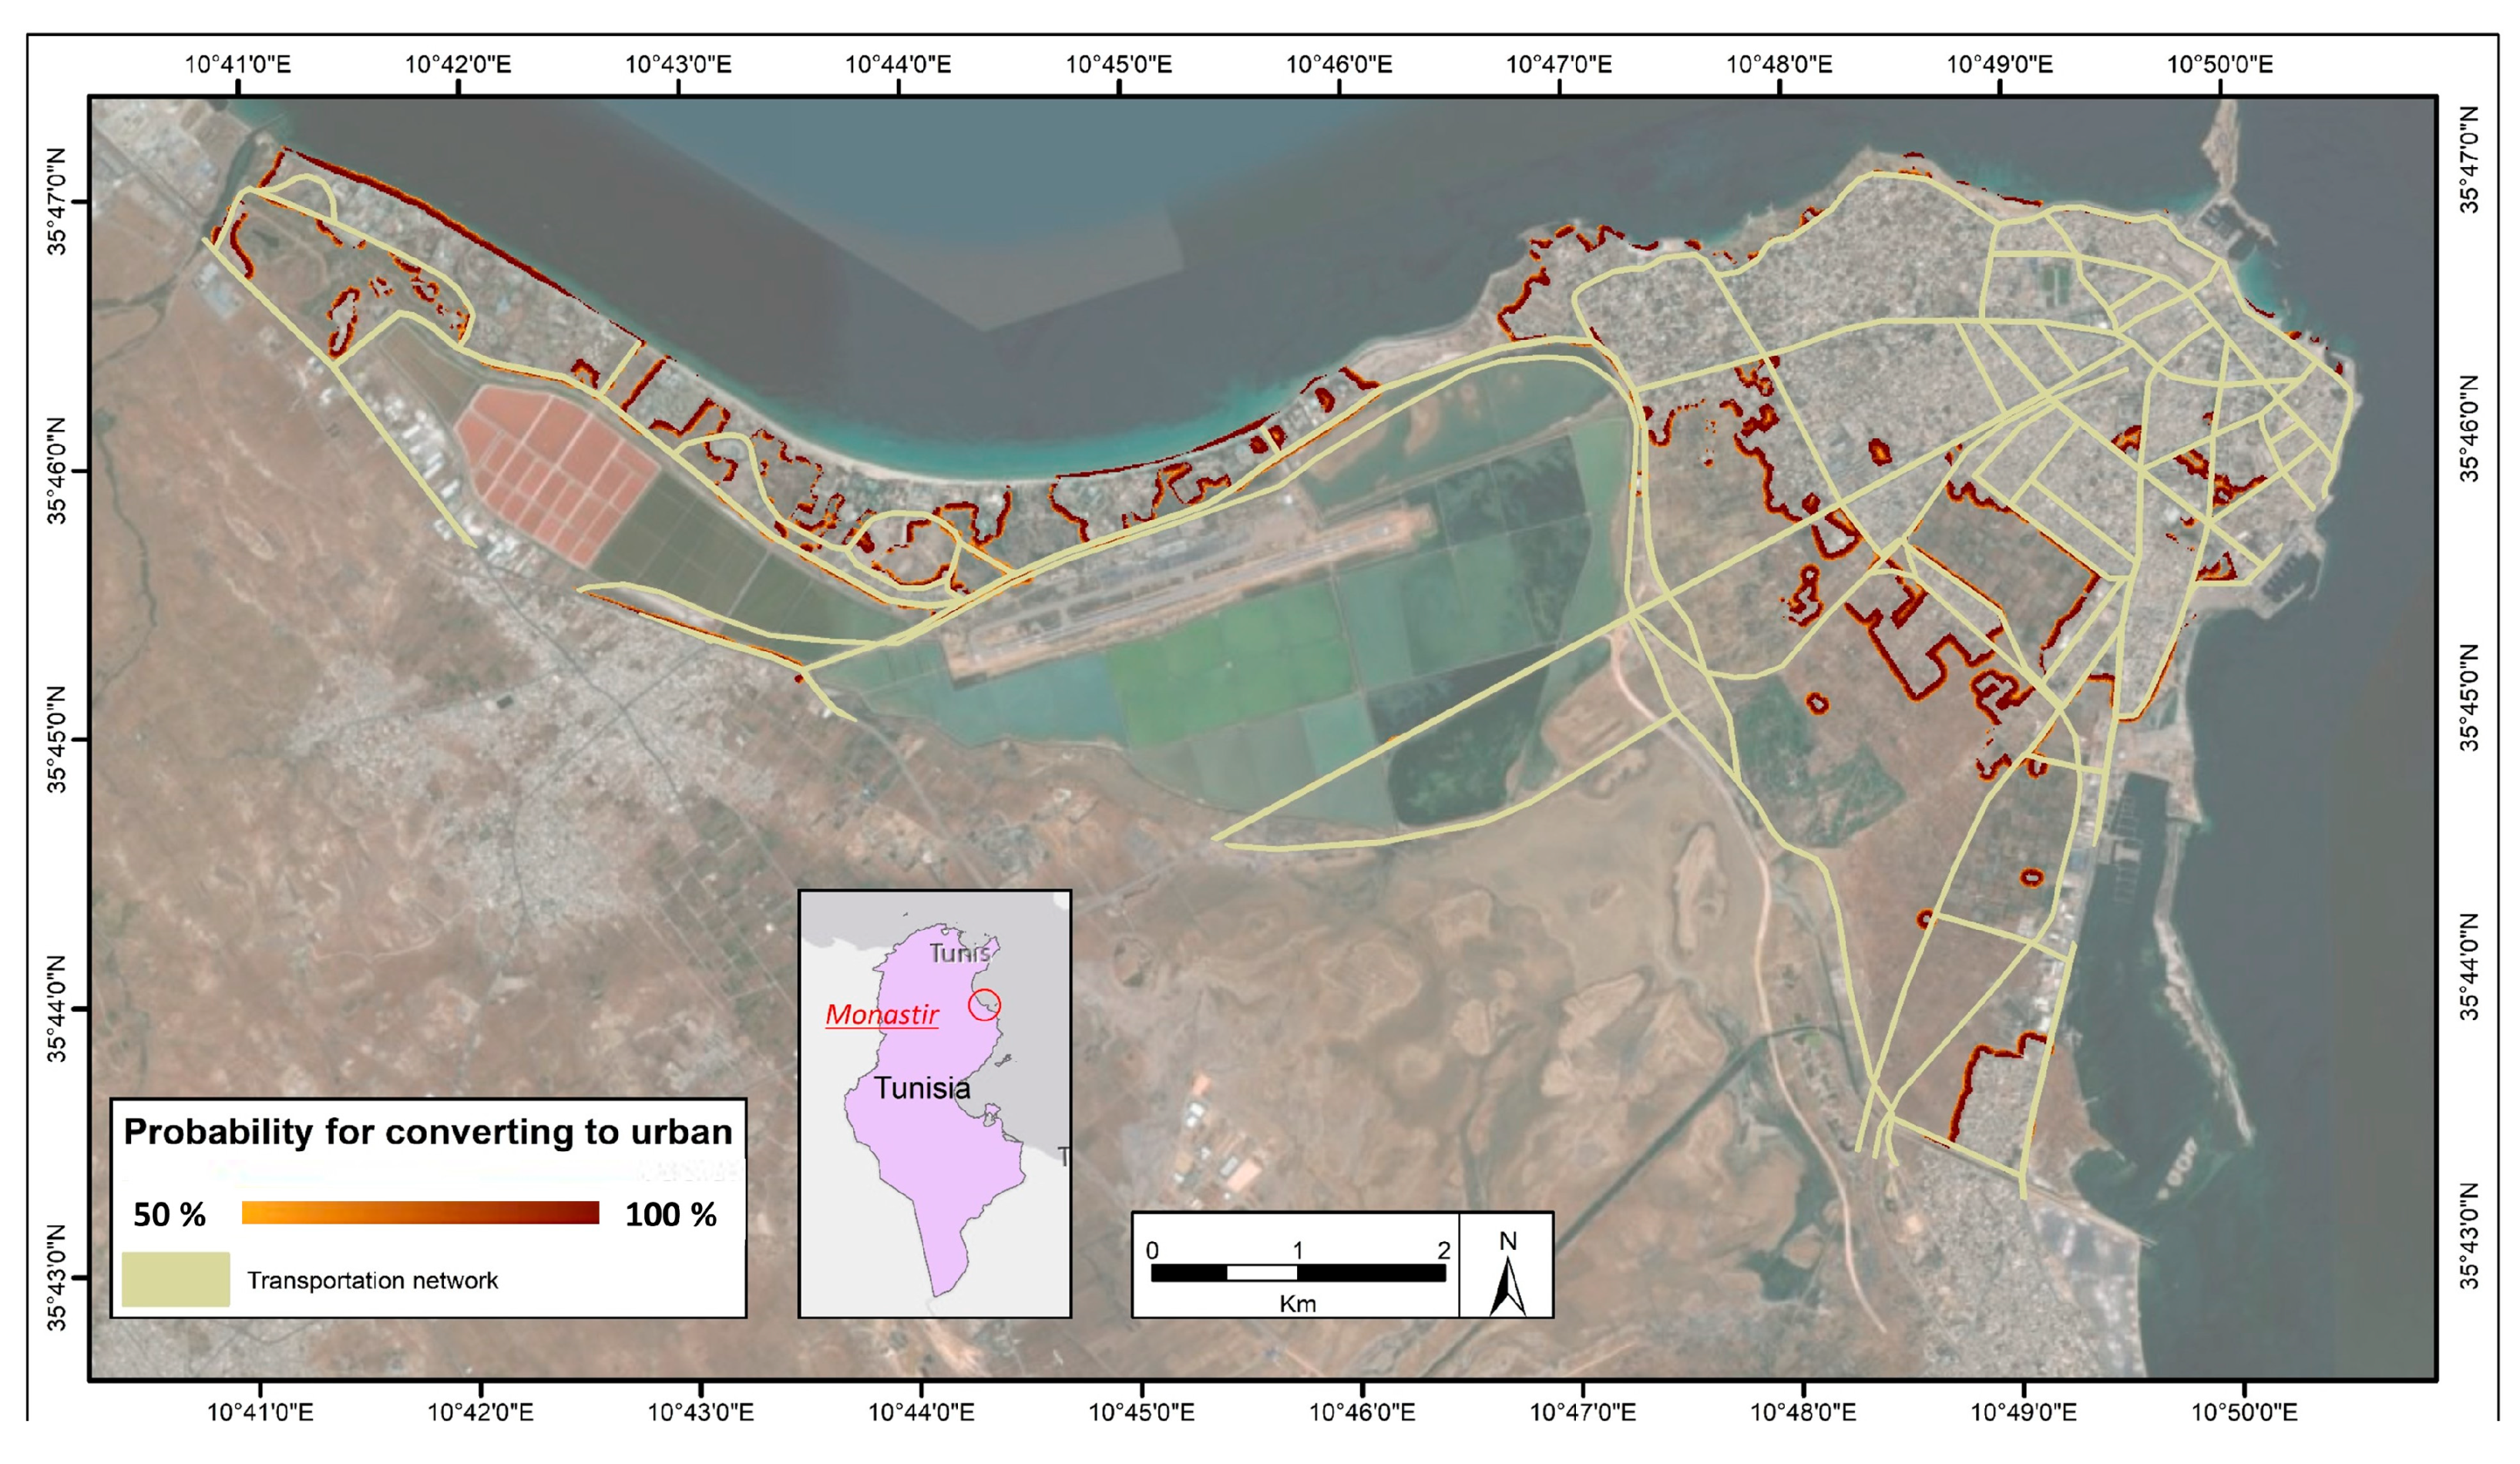
2.1. Study Area

Monastir is a mid-sized coastal city in central Tunisia. It occupies a peninsula on a semi-flat plain surrounded by the Mediterranean Sea from the North and East (Figure 1). The city has seven districts covering a total area of 5010 ha. Across the city, land use is primarily divided between agricultural (11.48%), industrial (5.34%), touristic (11.03%), urban green (21.74%), residential and commercial (14.84%), saline (32.19%), services (0.59%), and transportation (2.79%) [15]. Monastir is the capital of the Governorate, and national plans are in place to transform the Governorate into an urban development pole [15]. The city has witnessed rapid population growth (28.6%) since 2004, reaching 104,535 residents in 2014 [16]. The political change after the political turmoil (Dec 2010–Jan 2011) led to a temporal recession in the economic growth and weakened planning enforcement that led to informal urban growth. It is expected that the city will attract further growth in the future due to internal migration from the rural inland regions, due to its comparably attractive economic prosperity and better access to resources [15].

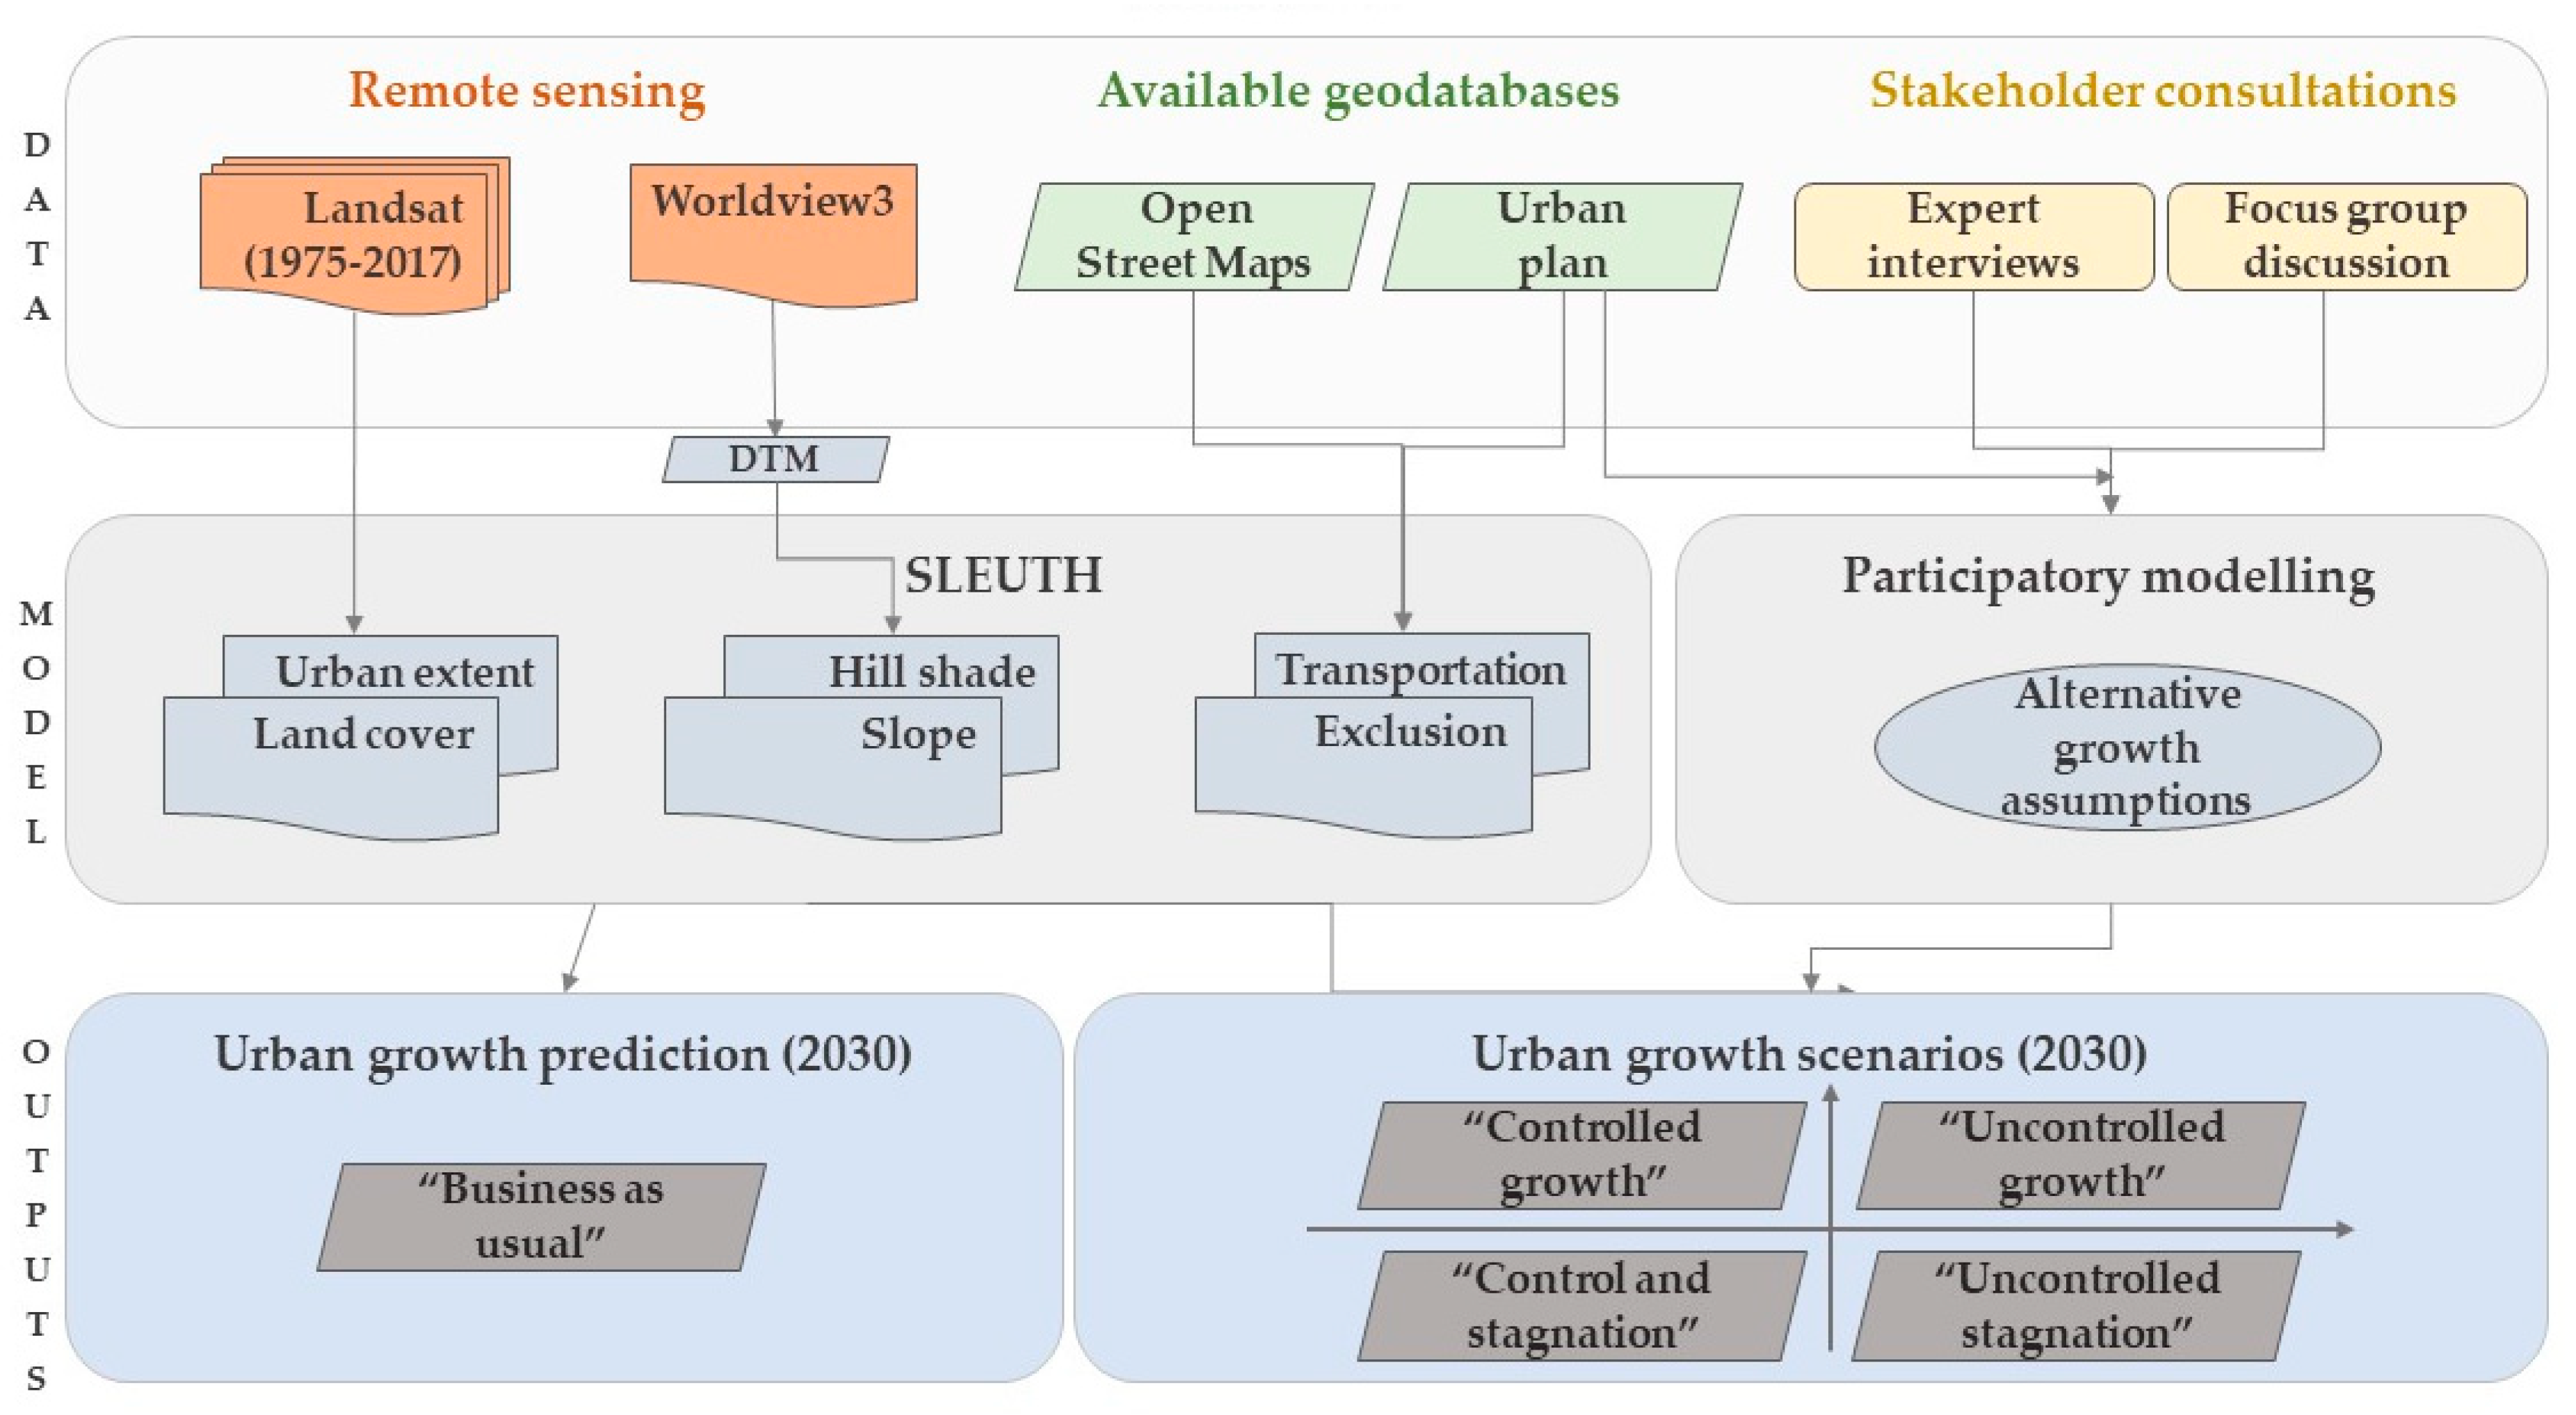
2.2. Simulating Urban Growth until 2030

An integrated approach that combines participatory scenario development and data-driven modeling based on multi-temporal remote sensing data was applied to simulate future urban growth until 2030 at a spatial resolution of 30 meters (Figure 2). Next, for a BaU prediction, four alternative scenarios of future urban growth were developed in a participatory process with relevant stakeholders and simulated using the SLEUTH (slope, land use, exclusion, urban extent, transportation, and hill shade) urban growth model.

2.2.1. SLEUTH Urban Growth Model

The SLEUTH model is a cellular automaton (CA) model developed by the United States Geological Survey (USGS) in 1996 and implemented in more than 50 cities globally [17]. The model is based on extracting the urban growth patterns of an area from historical data and then using these patterns to simulate different potential future growth scenarios. The SLEUTH model was selected as it has a grid-based structure, which makes the model naturally compatible with remote sensing data, often the leading source for information in data-scarce environments. The model simulates urban growth by giving a probability of urbanization based on a set of growth rules [11]. SLEUTH considers four types of growth: (1) “Spontaneous” (i.e., the formation of a built-up zone without descent from another urban body), (2) “New spreading center” (i.e., the formation of urban centers from the spontaneous growth zones), (3) “Edge” (i.e., growth from old and new urban centers), and (4) “Road-influenced” (i.e., urban extension along the transportation network). SLEUTH represents the growth types within five model control parameters: diffusion, breed, spread, slope resistance, and road gravity [18,19]. The SLEUTH model was used to conduct a retrospective analysis of the historical growth patterns of an area to predict future urban growth.

Data Acquisition and Pre-Processing

The model requires six primary input datasets: slope, land use, exclusion, urban, transport, and hill-shade. Table 1 gives an overview of the datasets and sources used for the analysis.

SLEUTH Calibration

Calibration is the learning stage of a prediction model based on the present data. It forms the most critical and intricate phase of a SLEUTH urban model. The alignment utilizes the spatial data of the past (here: remote sensing information for the period 1975–2017) to conjecture the present as a “well known future”. By looking at the model forecasts and the reality, it is possible to change the adjustment procedure to improve the model’s capacity to duplicate reality [19,20]. For our application, the SLEUTH model in the “calibration” mode was trained to derive the characteristics of Monastir’s urban area with a set of growth patterns extracted from historical remote sensing data. The calibration uses a Monte Carlo simulation to estimate the five SLETUH coefficients. It implements three consecutive phases on different data scales: coarse (100 m), fine (50 m), and final (30 m) calibration, where each stage produces 13 measures for the “goodness of fit” [19]. The Lee–Sallee index is the principal measure used due to its ability to assess the spatial fit [21]. The metric is the ratio of the intersection and the union of the simulated and actual urban areas in the control years [21]. The three successive phases are used to gradually narrow the range of coefficients based on the calibration outcomes of the previous stage. The execution started with the first phase, the “coarse calibration,” and used the whole range of coefficients from 0 to 100, with a step of 25 units for the five model parameters. The range of best-fit values resulting from the first stage was used to narrow down the scope for the second phase “fine calibration”, using a step of 5 units. Finally, the range of best-fit values from the second phase was used in the third step of calibration, using a step increment of 1 unit [17]. The set of parameters after the final calibration phase represents the intrinsic historical characteristics of the urban growth of Monastir.

Data-Driven Business-as-Usual (BaU) Prediction

This application mode was based purely on the historical past urban growth of the city from remote sensing and the urban city plan [22]. The plan is a public document prepared every 10 years based on the national land use plan within the administrative boundaries. This document is the planning guide of the city and is used by the local government to issue building authorizations. The study started by analyzing land use/land cover (LULC) changes over different time-steps. The analysis enables the model to explore the relationships between observed urban growth patterns and a set of physical driving factors, such as transportation arteries or terrain properties. In a later stage, the model can replicate the historical patterns to estimate future development. The urban city plan was used to determine the land cover classes excluded from the conversion to urban (e.g., coastal wetlands, airport).

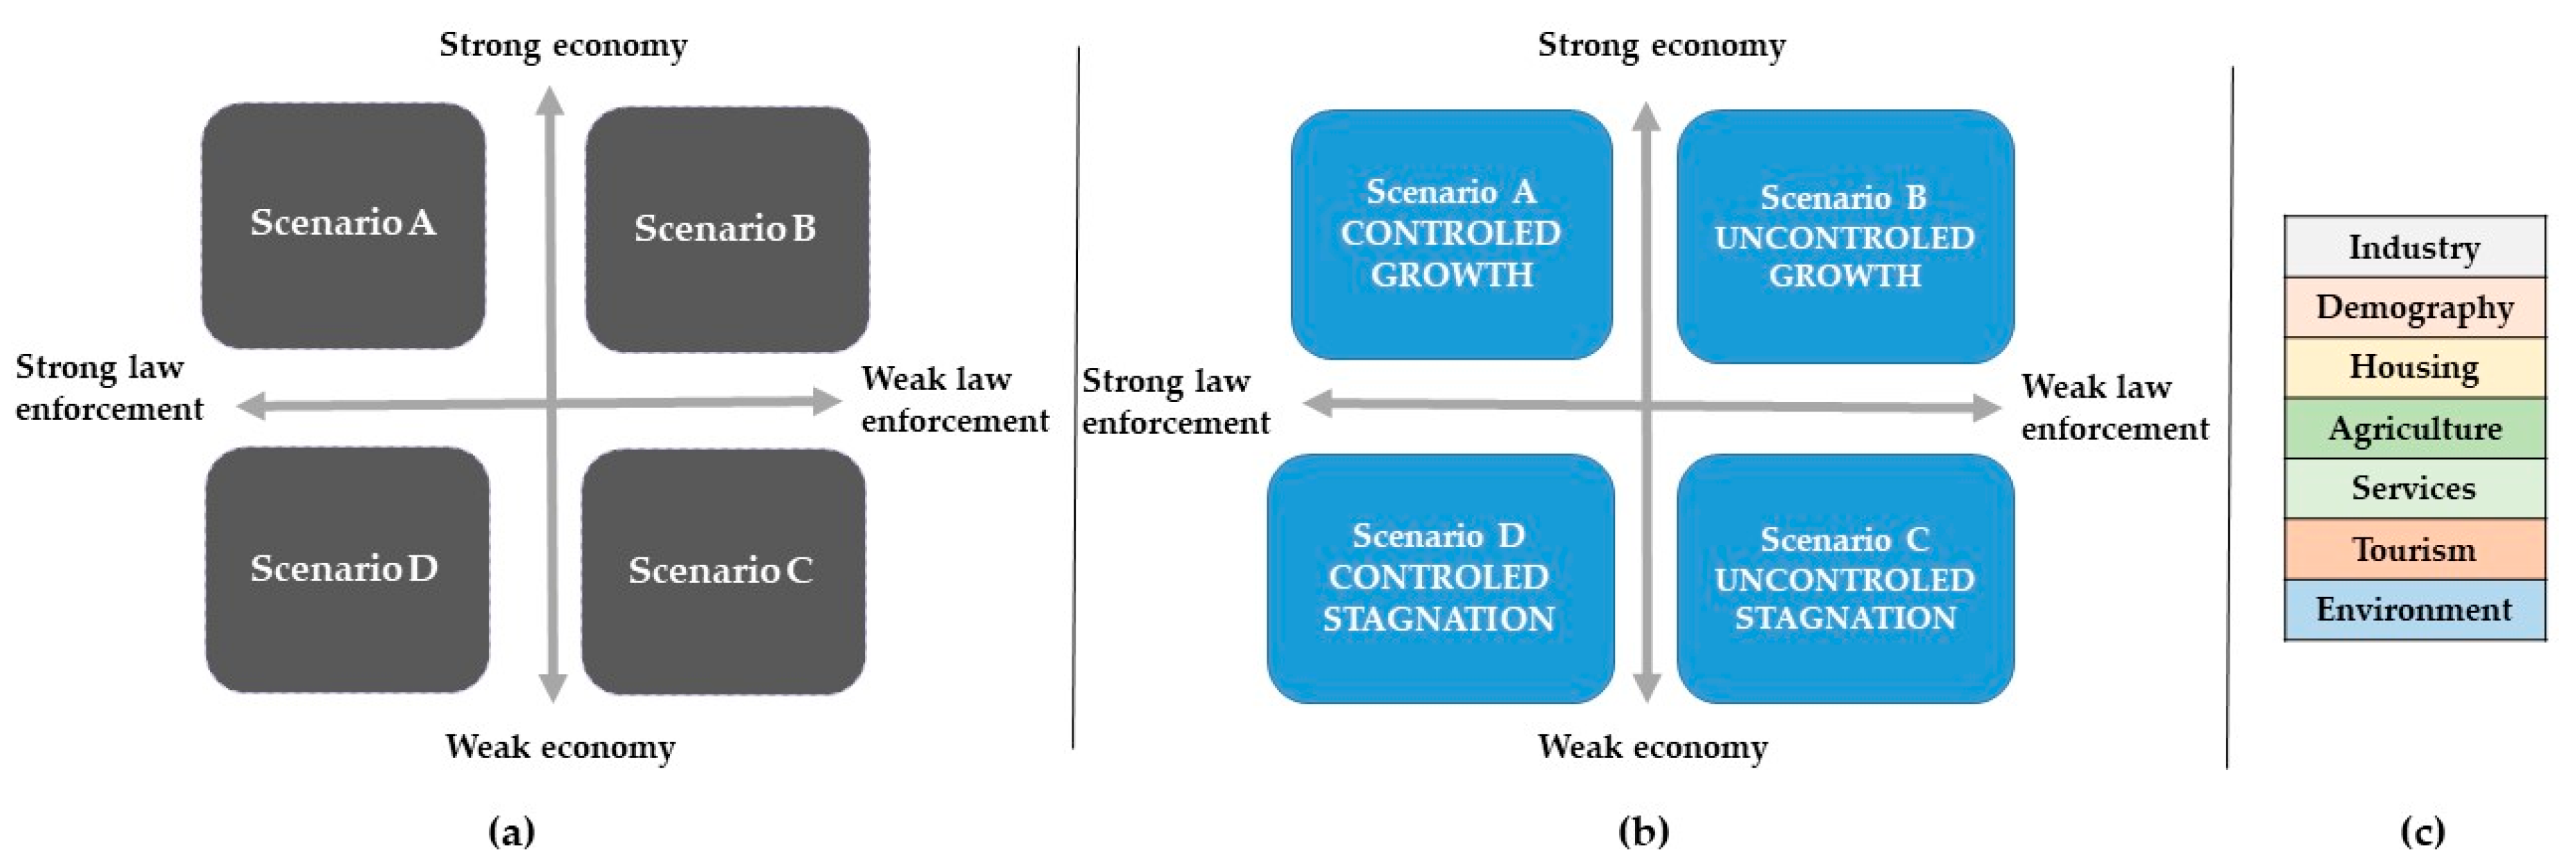
2.2.2. Participatory Scenario Development

A multi-step participatory modeling approach was implemented to generate plausible and relevant scenario assumptions for modeling future scenarios alternative to the BaU scenario, incorporating stakeholder consultations during different phases of the model development. Through this approach, it was possible to complement the data-driven projection of the urban growth of Monastir with a set of four alternative urban growth scenarios, representative of the different scenarios identified by the stakeholders.
Two participatory scenario workshops were conducted in October 2017 and May 2018 in the municipal premises of Monastir. Relevant stakeholders, with proven expertise in the city’s growth dynamics, were selected in collaboration with the municipal urban planners (a partner in the project consortium). In total, 30 local stakeholders participated in the workshops, including representatives of local government, regional government, and civil society.
During the first scenario workshop, the development of qualitative and stakeholder-led scenarios on urban expansion trends in Monastir drew upon a method created by the United Nations University (UNU-EHS) in the Belmont-Forum funded project “Transformation and Resilience in the Urban Coast” (TRUC) [23]. Firstly, workshop participants were asked to highlight what they perceived to be the most critical drivers of past urban growth and to provide a brief explanation to the group. Secondly, a four-dimensional scenario space was co-created, where “scenario” in this context is a description of a possible alternative future state. The literature shows that for both participatory processes and communication purposes, it is challenging to combine more than two significant axes of overarching trends [24]. Hence a four-quadrant (or two axes) scenario space was identified based on the axes considered by the participants as decisive for shaping possible future urban development trajectories in the city. Next, the workshop included a short survey to evaluate the attractiveness of different LULC classes (e.g., bare land vs. agricultural areas) for future urban growth.
The second scenario workshop aimed to: (1) present and critically reflect on the preliminary model prediction; (2) define the primary sectors that shape the development of the city (e.g., housing, industry, tourism); and (3) integrate additional local knowledge into the alternative scenarios. Besides the project partners, local stakeholders from the main sectors involved in the development of the city participated in the workshop. The outcomes of the workshops and the subsequent bilateral meetings were then used as inputs for the simulations of future urban growth.

2.2.3. Integrating Participatory and Data-Driven Modeling

The integration between the participatory scenarios development and the data-driven SLEUTH urban growth model led to a hybrid application that generated different scenarios. The study used the participatory approach from the second workshop to create an exclusion map for each scenario. The maps representing the exclusion layers of the model formed the principal means for generating the four alternative future scenarios.
The study applied the four designed scenarios through creating corresponding user-defined maps, one for each scenario, as layers that designate where development is expected to occur in the future. Thus, the exclusion layers served to simulate the different realities based on the local expectations of change in the attractiveness or repulsion of the different regions. The local expertise, during the second workshop, was the principal source for delineating growth-prone areas and estimating their weights on a scale from 0 to 100, whereby 0 represents highly attractive regions, 50 is neutral, and 100 represents land excluded from development (see the associated Supplementary Materials).

3. Results

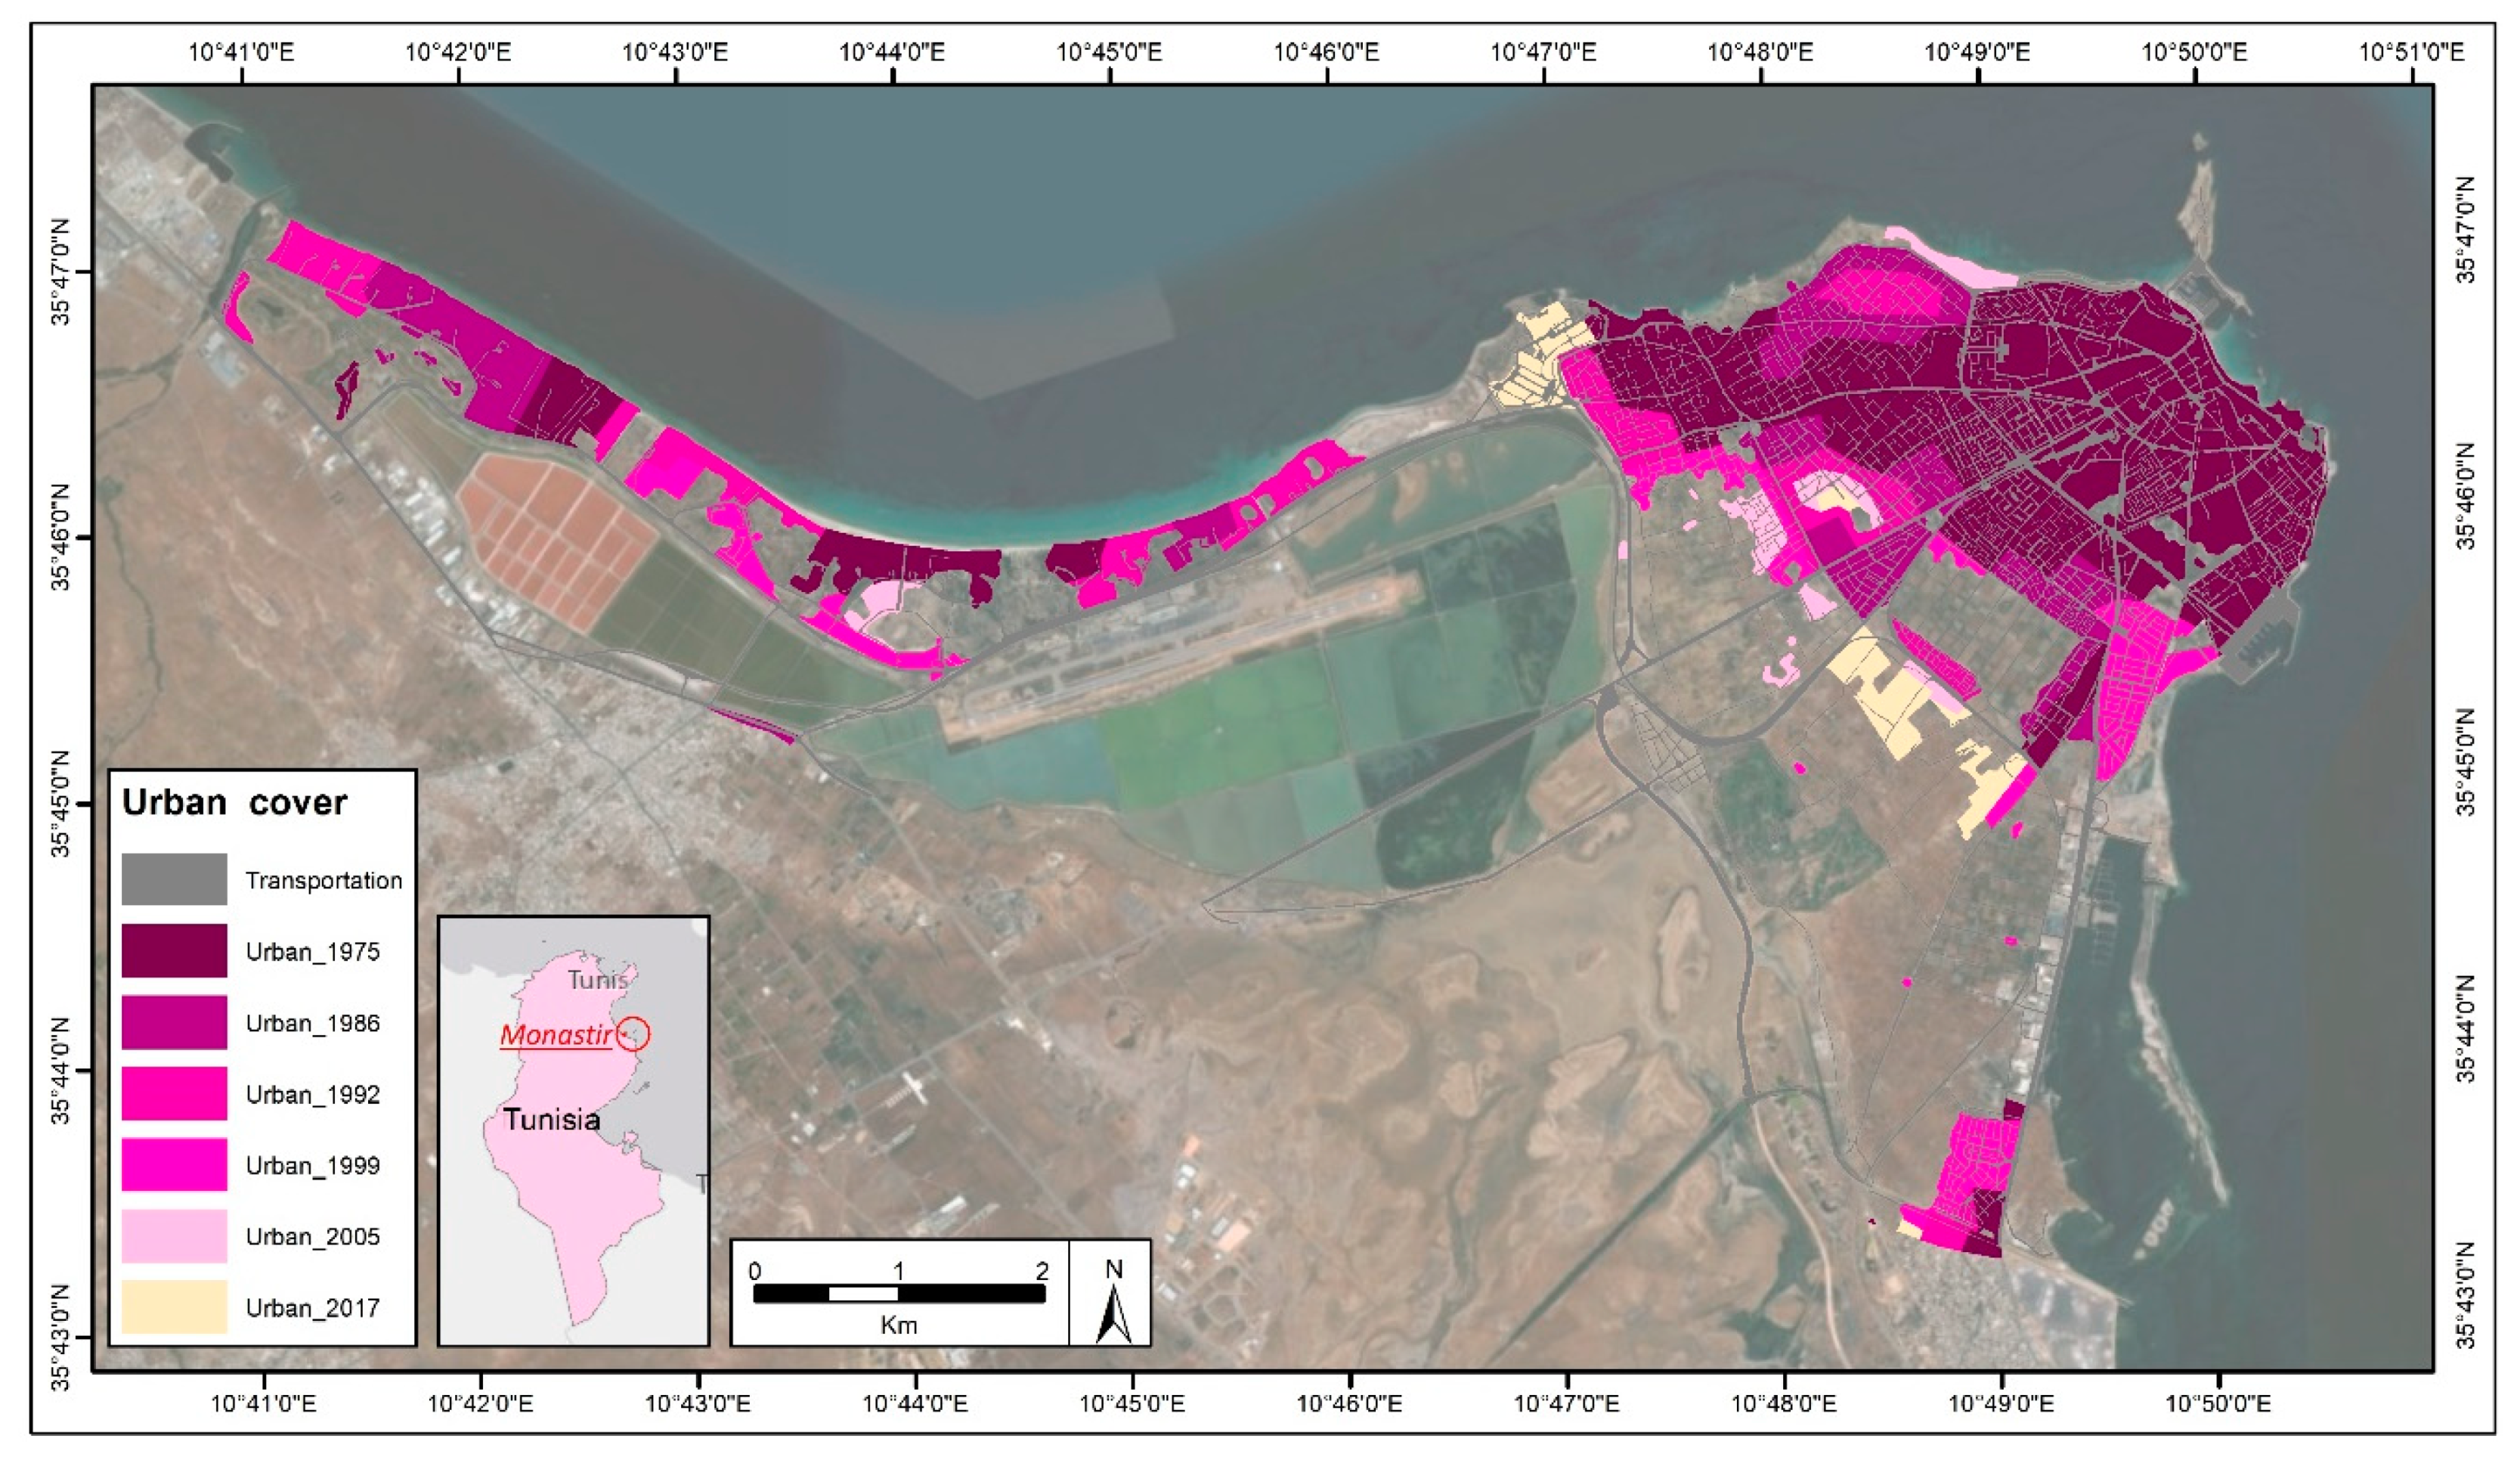
3.1. Past Urban Growth from 1975 to 2017

Thirteen Landsat scenes (1975–2017) were analyzed to delineate the city’s urban expansion (see the Supplementary Materials); however, only six layers were used to produce Figure 3 for the sake of change visualization. The historical analysis shows that the size of the urban area has increased by ~98.9% (Figure 3). This period of urban growth coincided with a rise of economic activities, from growth of industry in the south, to a rise in touristic facilities built along the northern coast. The analysis shows that urban growth was very high between 1975 and 1999 due to the availability of non-urban land, mainly at the expense of agricultural and urban green areas within the city.
The urban development in the 13 analyzed scenes was used to carry out the model calibration. Table 2 shows the coefficients achieved for the diffusion, breed, spread, slope, and road gravity in the current study.
The modeling outputs indicate that the spread parameter is the principal factor behind urban growth in Monastir. With the high value of 73 (on a scale from 0 to 100), the spreading coefficient indicates that edge growth is the dominant growth pattern for Monastir. Other coefficients such as road gravity and slope are also significant for the city, but have relatively lower influence. For instance, the road network has a definite impact on the urban growth patterns of the city. Nevertheless, the spontaneous and diffusion growths do not characterize Monastir’s urban patterns for the studied period, as the scores of these two variables were negligible. Furthermore, the analysis yielded a Lee–Sallee index score of 0.61 (on a scale from 0 to 1), which is considered satisfying when compared to related studies [25] (see the Supplementary Materials for further details on the model performance in comparison with similar literature applications).

3.2. Scenario Framework

Figure 4 shows the scenario framework that was co-designed with relevant stakeholders during the first scenario workshop. Two overarching factors were perceived as decisive for shaping possible future urban development trajectories in the city: economic growth and law enforcement. The former was justified as Monastir is considered an investment center and the capital of the governorate, while the latter is a critical issue for urban sprawl in the city, most notably with regards to the compliance with urban planning and building regulations, e.g., the question of whether areas protected on paper will de facto also be kept free of development. The uncertainty around, and importance of, law enforcement has been enhanced after the political changes that followed the 2011 political revolution. The two axes identified for the city’s urban growth trajectories are hence (1) strong vs. weak economic growth and (2) strong vs. weak law enforcement. These two axes are combined to span a quadratic scenario space, as shown in Figure 4a. Each quadrant in the scenario space denotes a family of scenarios. Each quadrant was subsequently filled with a development pathway, as summarized in Figure 4b by an explanatory title. The different scenarios were represented through the primary sectors (Figure 4c): industry, agriculture, tourism, environment, housing, services, and demography. In a next step, seven bilateral meetings were held to refine the sector-based assumptions with representatives of different local authorities. The future spatial extension of each sector considered the pathways of the city’s development and the assumptions from both the municipality planners and stakeholders to represent the four alternative scenarios. The suggested changes defined the spatial margins associated with quantified levels of attractiveness, which enabled the differentiation among the scenarios.

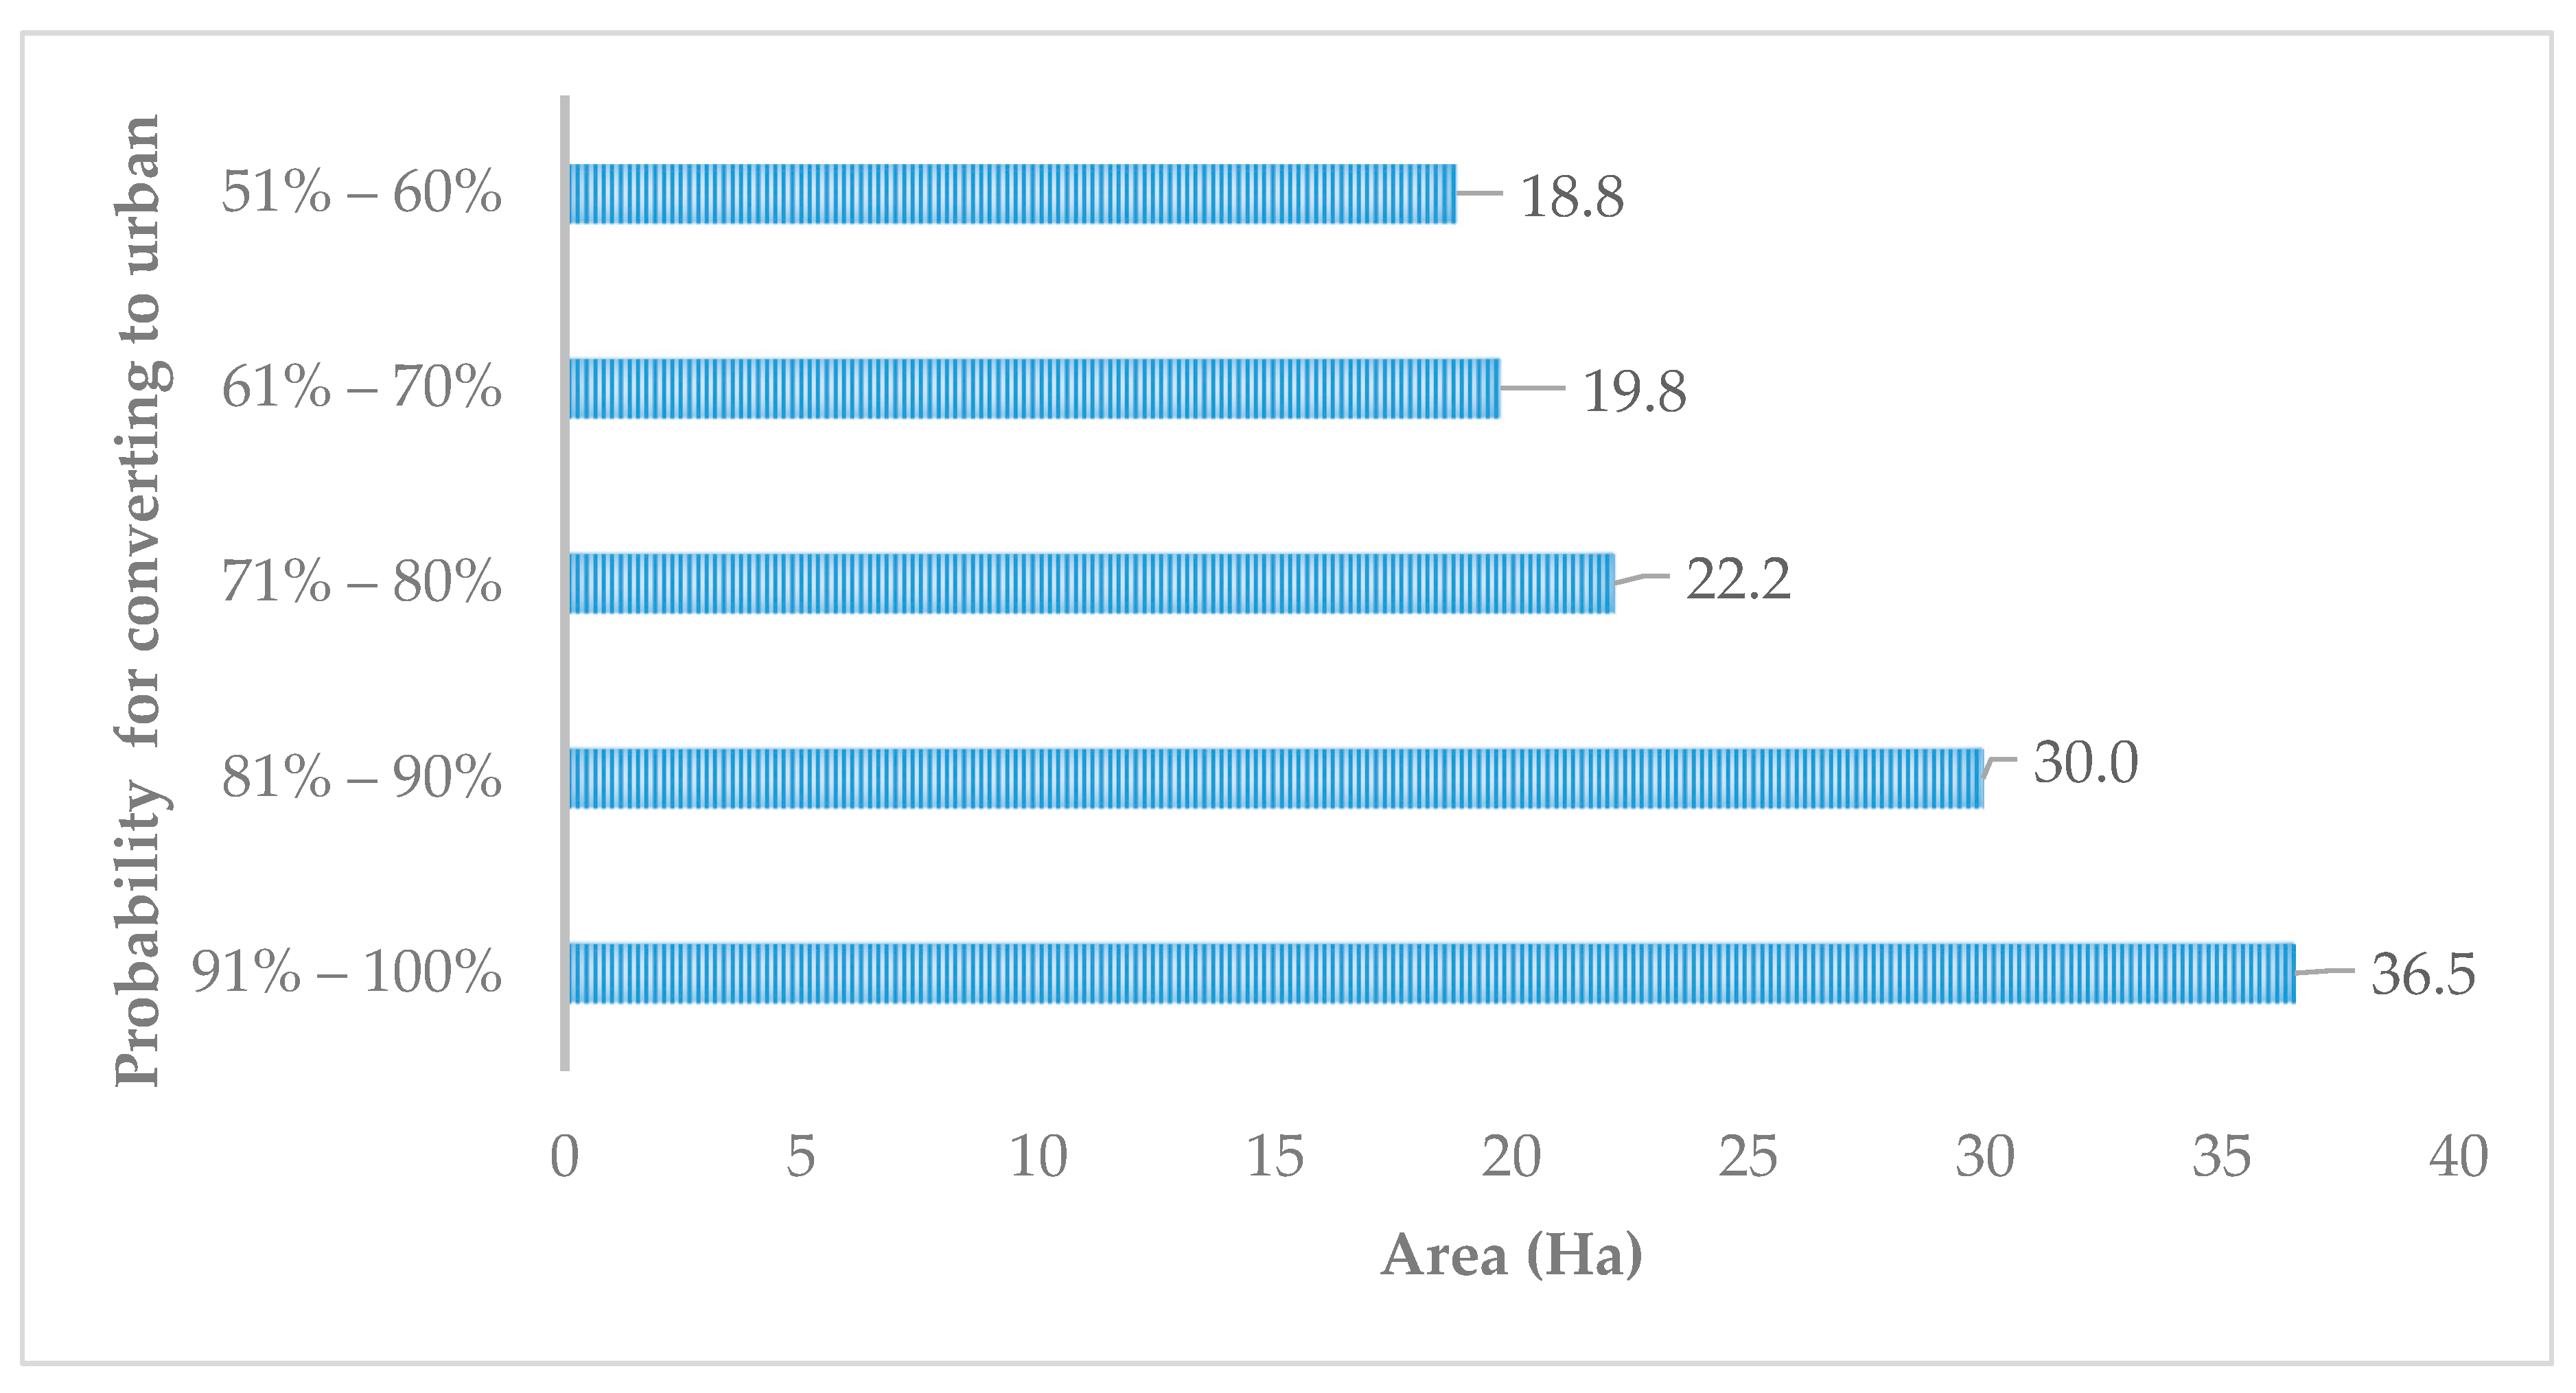
3.3. Future Urban Growth until 2030

Figure 5 shows the projected increase in urban areas (in hectares) from 2017 to 2030 for the BaU prediction as well as for the four alternative scenarios. The outputs show that the city would need 127 ha of potential land for urban growth in the BaU prediction if historical growth patterns continue (Figure 6). The analysis also shows that the highest growth is to be expected under scenario B, “uncontrolled growth”, which makes sense given that under this scenario high economic growth in the city would attract further immigration while at the same time weak law enforcement could lead to further expansion of the city outside of its boundaries.
The results from the simulations show no drastic modifications to the city structure by 2030, with a maximum difference of 17.3% (22 ha) between the highest and lowest of the five scenarios, namely BaU and Scenario B (Figure 5).
As an example of the simulation’s probabilistic results, Figure 7 shows the spatial need in hectares for the urban expansion in 2030 according to the BaU prediction by creating five categories of the likelihood of growth (51–60%, 61–70%, 71–80%, 81–90%, and 91–100%).
The quantitative analysis of the generated "probabilistic layers" reveals that urban cover would continue to extend until 2030 at different rates for the five simulations. The relative stagnation in urban growth after 2005 is expected to change gradually in the next few years. In particular, urban growth will be faster in certain parts of the city due to various factors, mainly land availability. The observed similarity of the growth trends in the simulations highlights the tendency for local land cover changes, particularly in the southern neighborhoods of Monastir. Out of the five simulations created, in both the BaU prediction and Scenario D (weak economic growth with strong law enforcement) Monastir would continue its current slow spatial expansion. Furthermore, these scenarios seem to favor land protection and more managed urban growth in the study area.

4. Discussion and Conclusions

This study presents an innovative urban growth simulation that combines traditional data-driven SLEUTH urban growth modeling with participatory stakeholder involvement to simulate possible future scenarios of Monastir’s urban expansion until 2030. The outcomes of the model display a decent performance through an efficient extraction of past growth patterns for future projection [23,26,27]. In addition, the results are presented in easy-to-understand visualizations for the benefit of end users.
Despite these achievements, the presented analysis is not without some limitations. The main drawbacks of the model are the tendency to consider physical over socio-economic parameters of change. Another primary limitation of the model is its computation complexity, which limits its scalability. Moreover, the model did not take into account projections of population and economic growth but used the defined physical historic expansion patterns to project future scenarios. Besides this, the model’s spatial and temporal stationarity also constrain its certainty for long-term prediction (beyond the planning cycle of 2030). Lastly, significant literature studies highlighted that decision-makers tend to misinterpret scenarios through ignoring their uncertainties, which can raise difficulties in communicating the outcomes of future urban growth [28,29,30].
Nevertheless, this study has attempted to address these limitations. For instance, the novelty of using a participatory approach with local stakeholders reduced the chance of excluding critical (physical) variables for the urban growth simulation, thus improving the representativeness of the model compared to classic data-driven approaches. Moreover, in order to increase the utility of the final product for future land-use policies, Monastir’s official urban planners were involved in the development of the urban growth model. Their participation greatly enhanced the validity of the model for policy-making and ensured improved communication and interpretation of the outcomes. The planners’ perspective was further reflected in the decision to restrict the time range of the application to the duration of the current city plan, thus containing the model’s uncertainty (which would be higher in long-term simulations) and therefore improving its applicability for future-oriented planning. Moreover, the inclusion of relevant stakeholders in the definition of the model proved to be an opportunity to spread awareness about the potential of spatial modeling as a tool for local practitioners of different fields, which the authors hope will lead to future updates of the assessment and the development of local capacities.
In this regard, two significant potential improvements to current applications of the future urban growth model are acknowledged. First, although the application integrated the expectations of local sector-planners to create different scenarios, considerable progress would be made by testing potential alternative sector-based policies and plans and compare their impacts on city growth. Second, while the study addressed the combined urban classes, a potential prospect for future applications would be to estimate the individual growth of the various urban sectors (e.g., residential, commercial, touristic, and industrial).
In conclusion, by integrating a data-driven projection of possible future urban growth with city development pathways derived from participatory workshops, this study shows how and where the city of Monastir could potentially grow until 2030 under alternative scenarios. The analysis reveals that future-oriented growth modeling can play an essential role in testing the effectiveness of potential policies, and can provide vital information to guide the work of local urban planners towards more sustainable urban growth.

Supplementary Materials

The following are available online at https://www.mdpi.com/2413-8851/4/1/10/s1: Table S1. Assumptions for spatially represented sectors in the four alternative scenarios; Table S2. Calibration results showing the model performance compared to similar studies through five coefficients and the validation measure (Lee–Sallee) [21,22,26,31,32,33]; Table S3. Information on the World View 3 data used to derive the Digital Terrain Model; Table S4. Information on the satellite data used for extracting the urban land cover.

Author Contributions

Conceptualization, M.H. (Mostapha Harb) and M.H. (Michael Hagenlocher); methodology, M.H. (Mostapha Harb) and M.G.; software, M.H. (Mostapha Harb) and E.K.; validation, S.A. and M.H. (Mostapha Harb); formal analysis, M.H. (Mostapha Harb) and D.C.; investigation, A.B.F. and K.B.K.; resources, B.C., S.A. and H.B.; data curation, M.H. (Mostapha Harb) and E.K.; writing—original draft preparation, M.H. (Mostapha Harb), M.H. (Michael Hagenlocher), and H.S.; writing—review and editing, M.H. (Michael Hagenlocher) and H.S.; visualization, D.C. and M.H. (Mostapha Harb); supervision, M.G. and M.H. (Michael Hagenlocher); project administration, F.B.; funding acquisition, F.B., M.H. (Michael Hagenlocher) and M.G. All authors have read and agreed to the published version of the manuscript.

Funding

The research is part of the project UD-RASP (grant no. ECHO/SUB/2016/740186/PREV19) funded by the European Commission Directorate-General for European Civil Protection and Humanitarian Aid Operations (DG ECHO).

Conflicts of Interest

The authors declared no potential conflicts of interest with respect to the research, authorship, and/or publication of this article.

References

  1. UN-DESA United Nationss Department of Economic and Social Affairs-Population Division. Available online: https://esa.un.org (accessed on 10 May 2019).
  2. Hall, P. The City of Theory. In Cities of Tomorrow: An Intellectual History of Urban Planning and Design since 1880; John Wiley & Sons: West Sussex, UK, 2014; ISBN 978-1-118-45647-7. [Google Scholar]
  3. Urbanization and development. Emerging Futures: World Cities Report 2016; United Nations Human Settlements Programme: Nairobi, Kenya, 2016. [Google Scholar]
  4. Garschagen, M.; Romero-Lankao, P. Exploring the relationships Between Urbanization Trends and Climate Change Vulnerability. Clim. Chang. 2015, 133, 37–52. [Google Scholar] [CrossRef]
  5. Lynch, K. Growth and Conservation. In A Theory of Good City Form; The MIT Press: Cambridge, MA, USA, 1984; ISBN 10: 0262620464. [Google Scholar]
  6. Ratcliffe, J.; Krawczyk, E. Imagineering city futures: The use of prospective through scenarios in urban planning. Futures 2011, 43, 642–653. [Google Scholar] [CrossRef]
  7. Li, X.; Gong, P. Urban growth models: Progress and perspective. Sci. Bull. 2016, 61, 1637–1650. [Google Scholar] [CrossRef]
  8. Houet, T.; Marchadier, C.; Bretagne, G.; Moine, M.P.; Aguejdad, R.; Viguié, V.; Bonhomme, M.; Lemonsu, A.; Avner, P.; Hidalgo, J.; et al. Combining narratives and modelling approaches to simulate fine scale and long-Term urban growth scenarios for climate adaptation. Environ. Model. Softw. 2016, 86, 1–13. [Google Scholar] [CrossRef]
  9. Seto, K.C.; Parnell, S.; Elmqvist, T. A global outlook on urbanization. In Urbanization, Biodiversity and Ecosystem Services: Challenges and Opportunities; Springer: Dordrecht, The Netherlands, 2013. [Google Scholar]
  10. Hall, P.; Pfeiffer, U. Urban Growth and Change. In Urban Future 21: A Global Agenda for Twenty-First Century Cities; Routledge: London, UK, 2013; pp. 113–133. [Google Scholar]
  11. Rienow, A.; Goetzke, R. Supporting SLEUTH–Enhancing a cellular automaton with support vector machines for urban growth modeling. Comput. Environ. Urban Syst. 2015, 49, 66–81. [Google Scholar] [CrossRef]
  12. Chaudhuri, G.; Clarke, K. The SLEUTH land use change model: A review. Environ. Resour. Res. 2013, 1, 88–105. [Google Scholar] [CrossRef]
  13. Saxena, A.; Jat, M.K. Capturing heterogeneous urban growth using SLEUTH model. Remote Sens. Appl. Soc. Environ. 2019, 13, 426–434. [Google Scholar] [CrossRef]
  14. Overmars, K.P.; Verburg, P.H.; Veldkamp, T. Comparison of a deductive and an inductive approach to specify land suitability in a spatially explicit land use model. Land Use Policy 2007, 24, 584–599. [Google Scholar] [CrossRef]
  15. Monastir Urban City, Plan Rapport de présentation du Plan d’Aménagement Urbain de la Commune de Monastir. 2013. Available online: www.courdescomptes.nat.tn (accessed on 19 February 2020).
  16. Statistiques Tunisie. The National Institute of Statistics. Available online: http://www.ins.tn (accessed on 15 June 2019).
  17. Project Gigalopolis. The National Center for Geographic Information and Analysis. Available online: http://www.ncgia.ucsb.edu/projects/gig/Pub/pubs.htm (accessed on 15 August 2019).
  18. Solecki, W.D.; Oliveri, C. Downscaling climate change scenarios in an urban land use change model. J. Environ. Manag. 2004, 72, 105–115. [Google Scholar] [CrossRef]
  19. Clarke-Lauer, M.D.; Clarke, K.C. Evolving simulation modeling: Calibrating SLEUTH using a genetic algorithm. In Proceedings of the 11th International Conference on GeoComputation, London, UK, 20–22 July 2011. [Google Scholar]
  20. KantaKumar, L.N.; Sawant, N.G.; Kumar, S. Forecasting urban growth based on GIS, RS and SLEUTH model in Pune metropolitan area. Int. J. Geomat. Geosci. 2011, 2, 568–579. [Google Scholar]
  21. Hui-Hui, F.; Hui-Ping, L.; Ying, L.U. Scenario prediction and analysis of urban growth using SLEUTH model. Pedosphere 2012, 22, 206–216. [Google Scholar] [CrossRef]
  22. Rafiee, R.; Mahiny, A.S.; Khorasani, N.; Darvishsefat, A.A.; Danekar, A. Simulating urban growth in Mashhad City, Iran through the SLEUTH model (UGM). Cities 2009, 26, 19–26. [Google Scholar] [CrossRef]
  23. Garschagen, M.; Birkmann, J. Qualitative Vulnerability and Adaptation Scenarios at Local Level–A Participatory-Approach. 2014. Available online: https:www.researchgate.net/publication/338792686 (accessed on 5 June 2018).
  24. Solecki, W.; Link, H.; Garschagen, M. Risk management and adaptation transitions in New York City. J. Extrem. Events 2016. [Google Scholar] [CrossRef]
  25. Jantz, C.A.; Goetz, S.J.; Donato, D.; Claggett, P. Designing and implementing a regional urban modeling system using the SLEUTH cellular urban model. Comput. Environ. Urban Syst. 2010, 34, 1–16. [Google Scholar] [CrossRef]
  26. Harb, M.; Hagenlocher, M.; Cotti, D.; Krätzschmar, E.; Baccouche, H.; Ben Khaled, K.; Bellert, F.; Chebil, B.; Ben Fredj, A.; Ayed, S.; et al. Simulating future urban expansion in Monastir, Tunisia, as an input for the development of future risk scenarios. J. Geogr. Inf. Sci. 2019, 7, 3–9. [Google Scholar] [CrossRef]
  27. Yin, H.; Kong, F.; Yang, X.; James, P.; Dronova, I. Exploring zoning scenario impacts upon urban growth simulations using a dynamic spatial model. Cities 2018, 81, 214–229. [Google Scholar] [CrossRef] [Green Version]
  28. Yeh, A.G.O.; Li, X. Errors and uncertainties in urban cellular automata. Comput. Environ. Urban Syst. 2006, 30, 10–28. [Google Scholar] [CrossRef]
  29. Goodspeed, R. Scenario Planning Evaluation Research. In An Evaluation Framework for the Use of Scenarios in Urban Planning; Lincoln Institute of Land Policy: Cambridge, MA, USA, 2017; pp. 6–9. [Google Scholar]
  30. Batisani, N.; Yarnal, B. Uncertainty awareness in urban sprawl simulations: Lessons from a small US metropolitan region. Land Use Policy 2009, 26, 178–185. [Google Scholar] [CrossRef]
  31. Silva, E.A.; Clarke, K.C. Calibration of the SLEUTH urban growth model for Lisbon and Porto, Portugal. Comput. Environ. Urban Syst. 2002, 26, 525–552. [Google Scholar] [CrossRef]
  32. Oguz, H.; Klein, A.G.; Srinivasan, R. Using the SLEUTH urban growth model to simulate the impacts of future policy scenarios on urban land use in the Houston-Galveston-Brazoria CMSA. Res. J. Soc. Sci. 2007, 2, 72–82. [Google Scholar]
  33. Hua, L.; Tang, L.; Cui, S.; Yin, K. Simulating urban growth using the Sleuth Model in a coastal peri-Urban district in China. Sustainability 2014, 6, 3899–3914. [Google Scholar] [CrossRef] [Green Version]
Figure 1. Location and main land cover classes of Monastir, Tunisia.
Urbansci 04 00010 g001
Figure 2. Participatory urban growth model workflow for simulating future urban growth until 2030.
Urbansci 04 00010 g002
Figure 3. Urban development from 1975 to 2017 based on multi-temporal remote sensing data.
Urbansci 04 00010 g003
Figure 4. The development of the scenario space (a), and the scenarios (b), and the primary sectors for the city urban expansion (c).
Urbansci 04 00010 g004
Figure 5. Urban growth scenarios for Monastir until 2030, for areas with a 0.5 probability of conversion to urban. BaU: business-as-usual.
Urbansci 04 00010 g005
Figure 6. Probabilistic layer for urban growth in the peri-urban areas under the BaU simulation.
Urbansci 04 00010 g006
Figure 7. Potential area requirements for urban growth in Monastir by 2030, according to the BaU prediction.
Urbansci 04 00010 g007
Table 1. Input datasets for the SLEUTH (slope, land use, exclusion, urban extent, transportation, and hill shade) model.
SourceFormat and Year
SlopeThe layer was derived from the Digital Terrain Model (DTM) extracted from 2017 high-resolution satellite imageries (World View 3) using stereoscopic techniques (see the Supplementary Materials). The slope was used to determine the influence of the elevation gradient on the urban expansion following the guidelines by the National Center for Geographic Information and Analysis (NCGIA) [17].Raster data 2017
Land useThe land use/land cover (LULC) layers were extracted from Landsat imageries for the period 1975 to 2017 following the European Urban Atlas standard (see the Supplementary Materials). The scenes were classified based on the LULC classes that best describe the urban setting in Monastir (e.g., agricultural, coastal wetland, green urban areas, industrial, residential and commercial, touristic, and transportation network).Raster data from: 1975, 1981, 1984, 1986, 1990, 1992, 1999, 2002, 2005, 2008, 2011, 2014, 2017
ExclusionThe exclusion layers for the different simulations were derived from the local city plans with inputs from stakeholder workshops and consultations to define prospect of areas being converted into residential urban areas by 2030.Raster layer derived mainly from the land use data of 2017
UrbanThis layer represents the urban residential extent according to the historical data derived from 13 Landsat scenes for the period 1975–2017.Urban classes raster layers from the land use data: 1975, 1981, 1984, 1986, 1990, 1992, 1999, 2002, 2005, 2008, 2011, 2014, 2017
TransportThe evolution of the transportation network was manually digitized from Landsat data for the period 1975–2017 and validated using archived aerial imageries for the years 1984 and 2005.Raster layer from the land use data: 1975, 1981, 1986, 1992, 2005, 2011, 2017
Hill shadeThe layer was generated from a 5 × 5 m cell size. DTM served for data visualization. Raster data 2017
Table 2. Final calibration parameters for Monastir.
DiffusionBreedSpreadSlopeRoad Gravity
Parameters11732534

