1. Introduction
The pharmaceutical industry operates under strict international regulatory frameworks that require all processes involved in drug production, from research to manufacturing, control, and quality assurance, to be properly documented, standardized, trained, qualified, and validated [
1,
2,
3]. This level of rigor aims to ensure the efficacy, safety, and quality of pharmaceutical products, minimizing risks to patients and ensuring compliance with good manufacturing practices (GMPs) [
4].
In this context, environmental control becomes a fundamental pillar, particularly in cleanrooms used for the manufacturing of non-sterile solid, liquid, and semisolid pharmaceutical dosage forms [
4]. These areas require specific environmental conditions that minimize the presence of viable and non-viable particles, which are achieved through carefully designed and well-maintained qualified air systems [
4,
5]. Heating, ventilation, and air conditioning (HVAC) systems for critical areas must ensure stable parameters for temperature, relative humidity, differential pressure, airflow directionality, and air velocity, all of which are essential to maintaining the required cleanliness classification [
4].
The design, installation, and validation of these systems, and consequently of the high-efficiency particulate air (HEPA) and ultra-low penetration air (ULPA) filters that support them, are regulated by international standards such as ISO 14644-4 [
6]. This standard establishes the technical criteria for classifying clean areas, controlling differential pressures, defining air renewal rates, and verifying system performance under both dynamic and static conditions. In addition, validated cleaning and disinfection protocols must be applied to minimize the generation and accumulation of contaminants [
7,
8].
A critical aspect of maintaining a controlled environment is managing variables such as personnel entry, materials, equipment, and ongoing operations, as all of these elements can alter environmental conditions [
9,
10]. Human presence is a significant source of particle generation; therefore, the use of low-emission technical garments, safe entry procedures, and the limitation of unnecessary movements inside the cleanroom are essential [
8].
The correct pressure gradient between areas with different classifications is another essential component, as it prevents the ingress of particles from less clean zones into critical areas. ISO 14644-4 recommends differential pressures between 5 and 20 Pa, depending on process requirements [
11,
12]. However, this gradient can be affected by various conditions, such as pressure drops across filters, blockages, poor duct design, or excessive personnel, all of which pose a risk to maintaining the room classification [
13].
Recent studies have shown that even small variations in the supplied air volume, air change rate, or airflow velocity can generate turbulence or stagnant air zones, which directly affect environmental quality [
14,
15]. Research using computational fluid dynamics (CFD) has confirmed that the strategic placement of return grilles and the room geometry are key factors in preventing particle recirculation, in some cases allowing efficiency optimization without the need for excessively high air renewal rates [
16]. It has also been demonstrated that personnel movement generates aerodynamic disturbances that can compromise the protection of critical zones if recovery times are not immediate, which underscores the importance of validating the system under dynamic conditions rather than solely static ones [
17]. Additionally, variables such as air renewal rate, recovery times, and HEPA and ULPA filter integrity must be regularly evaluated to ensure the system’s continuous performance, balancing contamination control with energy efficiency [
18,
19,
20].
The validation of a qualified air system must be carried out in three fundamental stages: installation qualification (IQ), operational qualification (OQ), and performance qualification (PQ). Each stage evaluates different aspects of the system, including its construction in accordance with the design, its behavior under normal operating conditions, and its ability to maintain the established cleanliness levels over time [
21]. In this way, validating climate control systems in the pharmaceutical industry provides documented evidence of the system’s ability to reproducibly maintain critical environmental parameters, acting as a primary containment barrier to ensure the quality, safety, and efficacy of products [
22]. This process is based on scientific principles of engineering, microbiology, and physical chemistry.
Although international regulatory frameworks such as ISO 14644 and Good Manufacturing Practices establish robust criteria for the design and validation of HVAC systems in cleanrooms, several recent studies have demonstrated that conventional validation schemes present important limitations when evaluated under real operating conditions. In particular, the reliance on static, point-in-time sampling tends to underestimate the true dynamics of particle generation and transport during production processes, thereby restricting the representativeness of continuous environmental control.
Zhang et al. (2022) experimentally demonstrated that human activity is one of the main sources of particle generation in cleanrooms, with emission rates 10 to 27 times higher under dynamic conditions than “At rest”, depending on activity intensity and ventilation configuration. These findings indicate that classification methods based solely on at-rest conditions do not adequately capture the transient contamination peaks that occur during routine operation, which pose the greatest risk to product quality [
23].
Similarly, Yang et al. (2021), through field studies in pharmaceutical cleanrooms, confirmed that operational variables such as personnel density, door opening frequency, and production load directly influence particle concentrations, generating systematic fluctuations that are not attributable to mechanical instability of the HVAC system. This demonstrates that interannual variations observed in longitudinal studies should not be interpreted solely as control failures, but rather as dynamic system responses to real use conditions [
20].
In addition, the systematic review by Bhattacharya et al. (2023) highlights that stochastic factors, including personnel movement, room geometry, air distribution patterns, and equipment density, can generate stagnation and recirculation zones that are not easily detected by conventional point sampling schemes. These microenvironments represent potential risks for particle and microbial accumulation, even when average values comply with regulatory limits, reinforcing the need for validation approaches that incorporate dynamic airflow behavior [
24].
Within this context, the results of the present study are particularly relevant, as they document the sustained performance of an ISO 8 HVAC system over a ten-year period under real operating conditions. This allowed identification of how increases in production load, infrastructure upgrades, and extended maintenance intervals impact environmental metrics without compromising system integrity. This longitudinal approach provides empirical evidence that complements current regulatory models and offers a practical reference for environmental risk management in non-sterile pharmaceutical formulation facilities.
Within this framework, the present study aims to provide a detailed account of the operational performance and validation process of an ISO 8 (Class 100,000) qualified air system in a pharmaceutical company certified in Good Manufacturing Practices (GMPs) and dedicated to the production of non-sterile compounded formulations, using systematically collected data from annual qualification reports over a ten-year period (2014–2024). The study examines the complete lifecycle of the system, including design, installation, initial qualification, continuous operation, environmental monitoring, verification of cleaning and disinfection protocols, and annual third-party validations with certified traceability. Within this context, the study addresses the following research question: What limitations exist in current validation methods for ISO 8 cleanroom air systems? How do human variability, changes in operational load, and potential airflow dead zones affect the representativeness of continuous environmental quality monitoring? To what extent can longitudinal documentation assess the system’s effectiveness in maintaining required environmental conditions and support informed decision-making in environmental control and quality assurance? By addressing these questions, the study provides a technical reference based on real-world evidence, useful to engineers, pharmaceutical chemists, and quality assurance professionals involved in the design, qualification, and regulatory compliance management of cleanroom environments, and demonstrates the system’s sustained performance over time.
The system was originally designed and constructed in accordance with ISO 14644-4:2001 [
6], which primarily focused on the initial design, construction, and installation qualification of cleanrooms and associated controlled environments. With the release of ISO 14644-4:2022 [
25], updated requirements emphasize a more comprehensive lifecycle approach, including risk-based design considerations, detailed operational procedures, and enhanced strategies for contamination control, airflow management, and verification under both static and dynamic conditions. Accordingly, the verification of current compliance and the contamination control strategies for the system have been aligned with the 2022 standard. This work documents the technical and regulatory compliance of the air system while simultaneously analyzing the impact of human factors and operational variables on environmental quality. It provides practical and scientific evidence to support and strengthen quality management practices in national and international pharmaceutical manufacturing.
2. Materials and Methods
2.1. Background
Cleanrooms are controlled environments designed to strictly limit the concentration of airborne suspended particles and other potential physical, chemical, and biological contaminants [
26,
27]. The classification of these spaces is primarily governed by the international standard ISO 14644-1, which establishes quantitative limits based on the number and size of particles present per cubic meter of air [
6]. These limits allow for the assignment of a specific cleanliness level that ensures the suitability of the environment for processes with stringent requirements.
The standard defines nine cleanliness classes (ISO 1 to ISO 9), with ISO 1 being the most stringent and ISO 9 the least restrictive. Although ISO 9 represents the upper limit within the standard, the air in an ISO 9-classified room still exhibits superior quality compared to a conventional indoor environment, such as an office or a general hospital area. This classification range provides a flexible framework for adapting the cleanroom’s design and operational requirements to the process’s criticality [
28,
29].
In industrial practice, ISO 7 and ISO 8 cleanroom classes are the most commonly implemented in sectors such as the pharmaceutical, biotechnology, and medical device industries, as they provide an appropriate level of contamination control for most non-sterile manufacturing and packaging processes or for preparatory activities, balancing operational costs with product safety. ISO 7 rooms are typically used for areas supporting aseptic operations, while ISO 8 rooms are frequently used in entry vestibules and lower-criticality zones, such as material-washing areas or controlled-access corridors. In contrast, highly sensitive environments such as microelectronics production or the preparation of sterile injectable medications may require conditions equivalent to ISO 5 or higher, where particle limits are extremely low, and the validation of ventilation system performance becomes critical due to the need to maintain unidirectional airflow to protect the exposed product.
Table 1 presents the classification of cleanrooms according to ISO Classes 1 to 9, indicating the maximum allowable number of particles per cubic meter of air for each class.
Historically, the classification of cleanrooms in the United States and Canada was based on Federal Standard 209E (FS 209E), which defined particle limits for particles ≥ 0.5 μm per cubic foot of air. This system included categories ranging from Class 1, representing maximum cleanliness, to Class 100,000, the least stringent. The standard was officially cancelled by the U.S. General Services Administration (GSA) in November 2001. With the adoption of ISO 14644-1 in 1999, FS 209E was formally withdrawn in 2001. Nevertheless, its designations continue to be widely used in technical literature and in some regulatory frameworks due to their prior widespread adoption and the approximate equivalence they can be shown to have with ISO classes. For example, ISO 7 corresponds approximately to Class 10,000 and ISO 8 to Class 100,000, which facilitates understanding of cleanliness levels without requiring immediate complex conversions.
ISO 14644-4 is part of the ISO 14644 family of standards that regulate cleanrooms and associated controlled environments, providing the framework required to ensure compliance beginning with the physical infrastructure. While ISO 14644-1 focuses on air classification based on particle concentration, ISO 14644-4:2022 (the latest edition) establishes the principles for the design, construction, and start-up of cleanrooms and controlled environments. This standard provides guidance for comprehensive lifecycle planning of a cleanroom, covering stages from project conception to initial installation qualification. In particular, ISO 14644-4:2022 defines technical criteria related to architectural and structural design (area layout, personnel and material flows, differential pressure control, finishes, and construction materials compatible with cleaning and decontamination), engineering systems (HVAC, HEPA and ULPA filtration, temperature, humidity, pressure, and ventilation control), and contamination control (minimization of particles and bioaerosols, management of airflow patterns, prevention of turbulence and stagnant zones) through the use of airlocks and pressure cascades that ensure proper zone segregation. Commissioning and initial qualification activities are also addressed, including performance testing that demonstrates compliance with design requirements before operations begin, which links directly with ISO 14644-3, the standard governing test methods.
The importance of ISO 14644-4 lies in its ability to specify the required final state of cleanliness by comprehensively addressing design and construction as critical determinants of a cleanroom’s ability to achieve and maintain its classification, thereby minimizing cross-contamination risks from the conceptual phase onward. Additionally, its approach supports integrating the cleanroom into applicable regulatory frameworks across multiple sectors, including pharmaceutical, biotechnology, electronics, and healthcare, ensuring operational efficiency and both product and patient or user safety under quality-by-design principles.
2.2. Qualified Cleanroom Air System
The present study was conducted at a pharmaceutical company certified under good preparation practices (GPP), with the objective of validating a Class 100,000 (ISO 8)- qualified air system in accordance with the requirements of the international standard ISO 14644-4 [
6]. The methodology employed was based on direct collaboration among the researchers, the system supplier, and the pharmaceutical company, which enabled participation in the design, manufacturing, installation, assembly, qualification, validation, and continuous operation of the qualified air system. Once the installation phases and initial tests were completed, the system was subjected to a certification process carried out by an accredited third-party using equipment, procedures, and personnel traceable to the Superintendence of Industry and Commerce (SIC) of Colombia, over a ten-year period of systematic observation and maintenance.
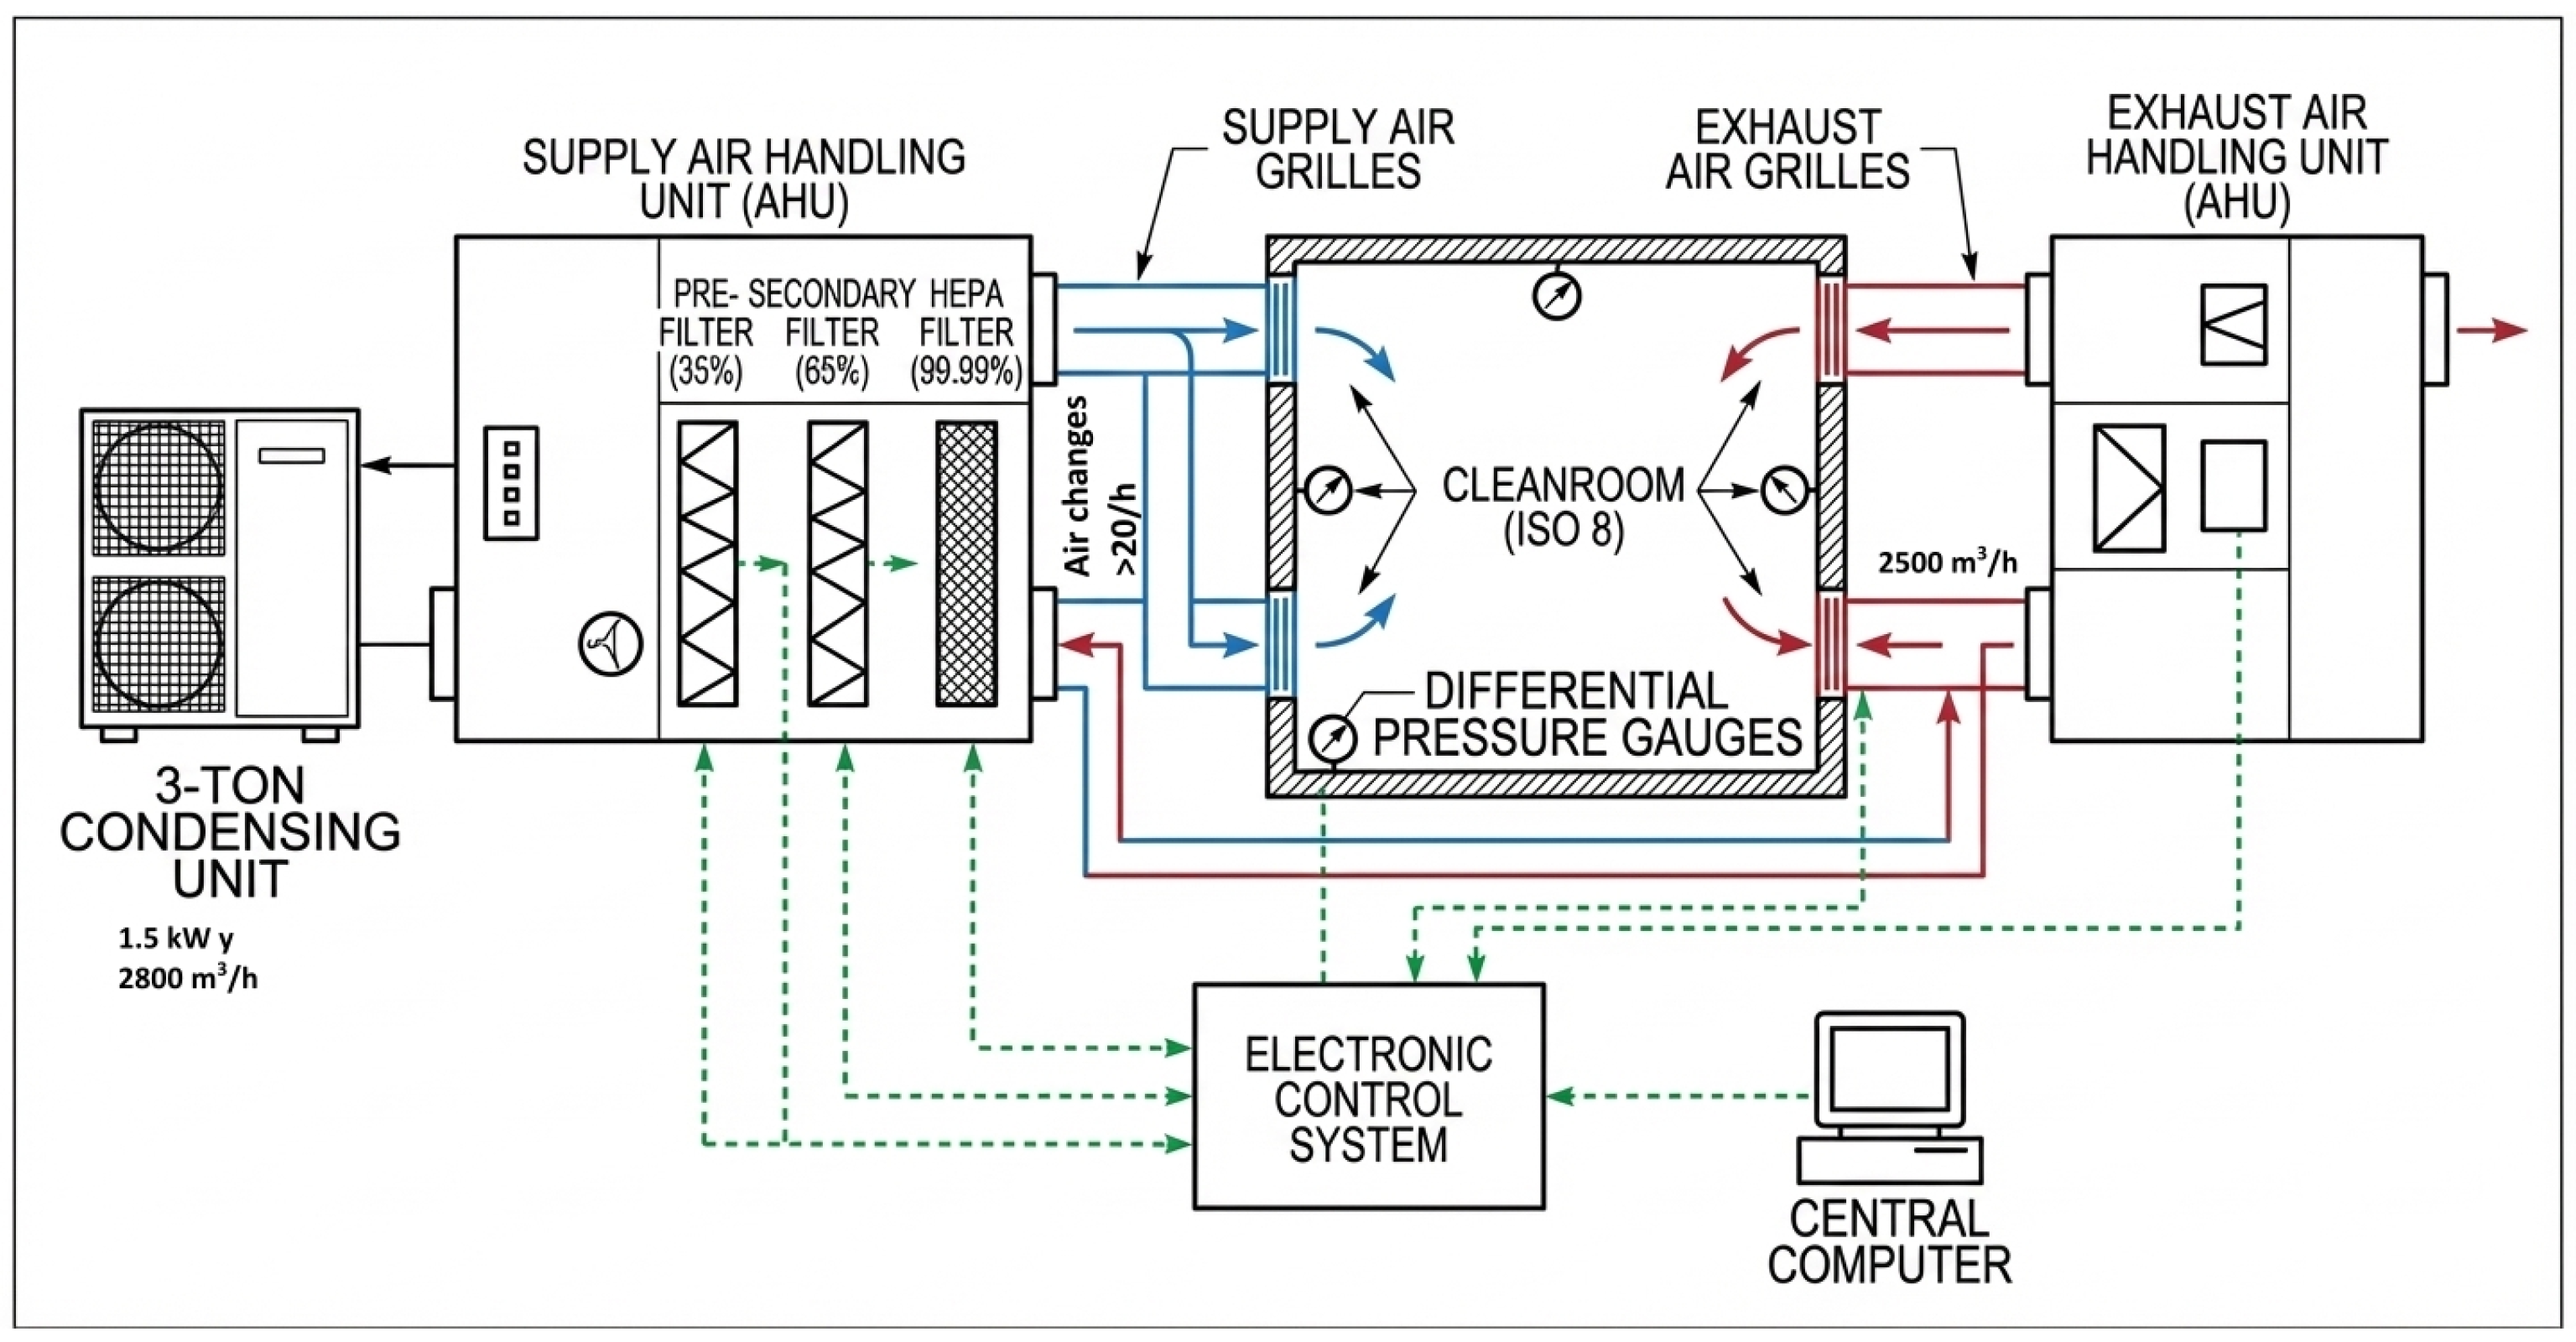
The first phase consisted of the design of the qualified air system shown in
Figure 1, which included a supply air handling unit, an exhaust air handling unit, a 3-ton condensing unit, filter banks with efficiencies of 35%, 65%, and 99.99%, supply and exhaust grilles, differential pressure gauges, and an electronic control system connected to a central computer. This configuration was designed to ensure the required technical parameters of pressure, airflow, temperature, humidity, and filtration that guarantee compliance with the ISO 8 cleanroom classification. The design was documented through technical drawings, functional diagrams, specification lists, and energy requirement sheets, all prepared in accordance with the applicable international standards.
Subsequently, during the manufacturing phase, the air handling units were constructed using galvanized steel sheets coated with electrostatic epoxy powder paint, while the internal structures were fabricated in SAE 304 stainless steel. This selection of materials ensures durability, corrosion resistance, and ease of cleaning, which are essential criteria in pharmaceutical production environments according to the sanitary design guidelines for cleanrooms established in WHO Technical Report Series No. 961, Annex 5, 2011 [
31].
The installation and assembly of the qualified air system involved the physical and functional integration of all system components in accordance with the technical requirements established during the design phase. Electrical tests, wiring connections, fuse installation, control system configuration, software setup, and initial sensor calibration were performed as part of this stage. In addition, all corresponding technical documentation was developed, including operation manuals, installation procedures, component lists, maintenance, calibration and validation protocols, as well as standard operating procedures for cleaning, start up, shutdown, and system monitoring [
32].
The installation qualification verified the correct placement of the equipment, the conformity of the materials, compliance with technical specifications, and the functionality of the main components. This phase also included a detailed equipment list, a description of system functions, wiring schematics, identification of deviations, and installation conclusions. The process then advanced to operational qualification, which consisted of testing under normal and stress operating conditions to ensure system stability. Variables such as temperature, differential pressure, airflow velocity, alarm activation, and the integrity of the filtration system were evaluated.
In the performance qualification stage, the system was tested under actual operating conditions with personnel present, equipment running, and production materials in place. Non-viable particle counts were performed for particle sizes of 0.5 μm, 1.0 μm, and 5.0 μm per cubic meter of air, along with recovery tests following system interruptions to assess the environment’s ability to return to controlled conditions. These tests reflected the system’s behavior in routine scenarios and validated its effectiveness in maintaining an environment that meets regulatory requirements.
In parallel, rigorous cleaning and disinfection protocols for cleanrooms were implemented and validated. These protocols included the disinfection of utensils, equipment, and garments, the rotation of disinfectants to prevent microbial resistance, and the scheduled cleaning of critical surfaces. These activities were essential to preserve ISO 8 classification during routine operations.
2.3. Validation of the Qualified Air System
The validation of the qualified air system, as part of the organization’s validation master plan, was conducted by an independent third-party accredited by the Superintendence of Industry and Commerce of Colombia (SIC). This process included measuring airflow rate and air change per hour, viable and non-viable particle counts, verifying HEPA filter integrity, pressure balancing between areas, and assessing temperature and humidity gradients.
The validation was renewed annually in accordance with an established program, with documented evidence available for regulatory audits. To perform the HVAC system validations, certified equipment traceable to the National Institute of Standards and Technology (NIST) was used, including the Particles Plus non-viable particle counter (model Handheld 8303, Particles Plus Inc., Stoughton, MA, USA), employed for determining airborne particle concentration; the Air Data Multimeter (ADM-860, Shortridge Instruments Inc., Scottsdale, AZ, USA), used for measuring air velocity, airflow rate, differential pressure, absolute pressure, and temperature; and the ATI photometer, (model 2H, Air Techniques International, Owings Mills, MD, USA), together with a PAO-4 aerosol generator, (model TDA-4B, Air Techniques International, Owings Mills, MD, USA), used to perform HEPA filter integrity testing.
All equipment had valid calibration certificates, ensuring the reliability and traceability of the results obtained during the validation process. These tests were performed in accordance with the ISO 14644 series of standards, applying standardized methodologies.
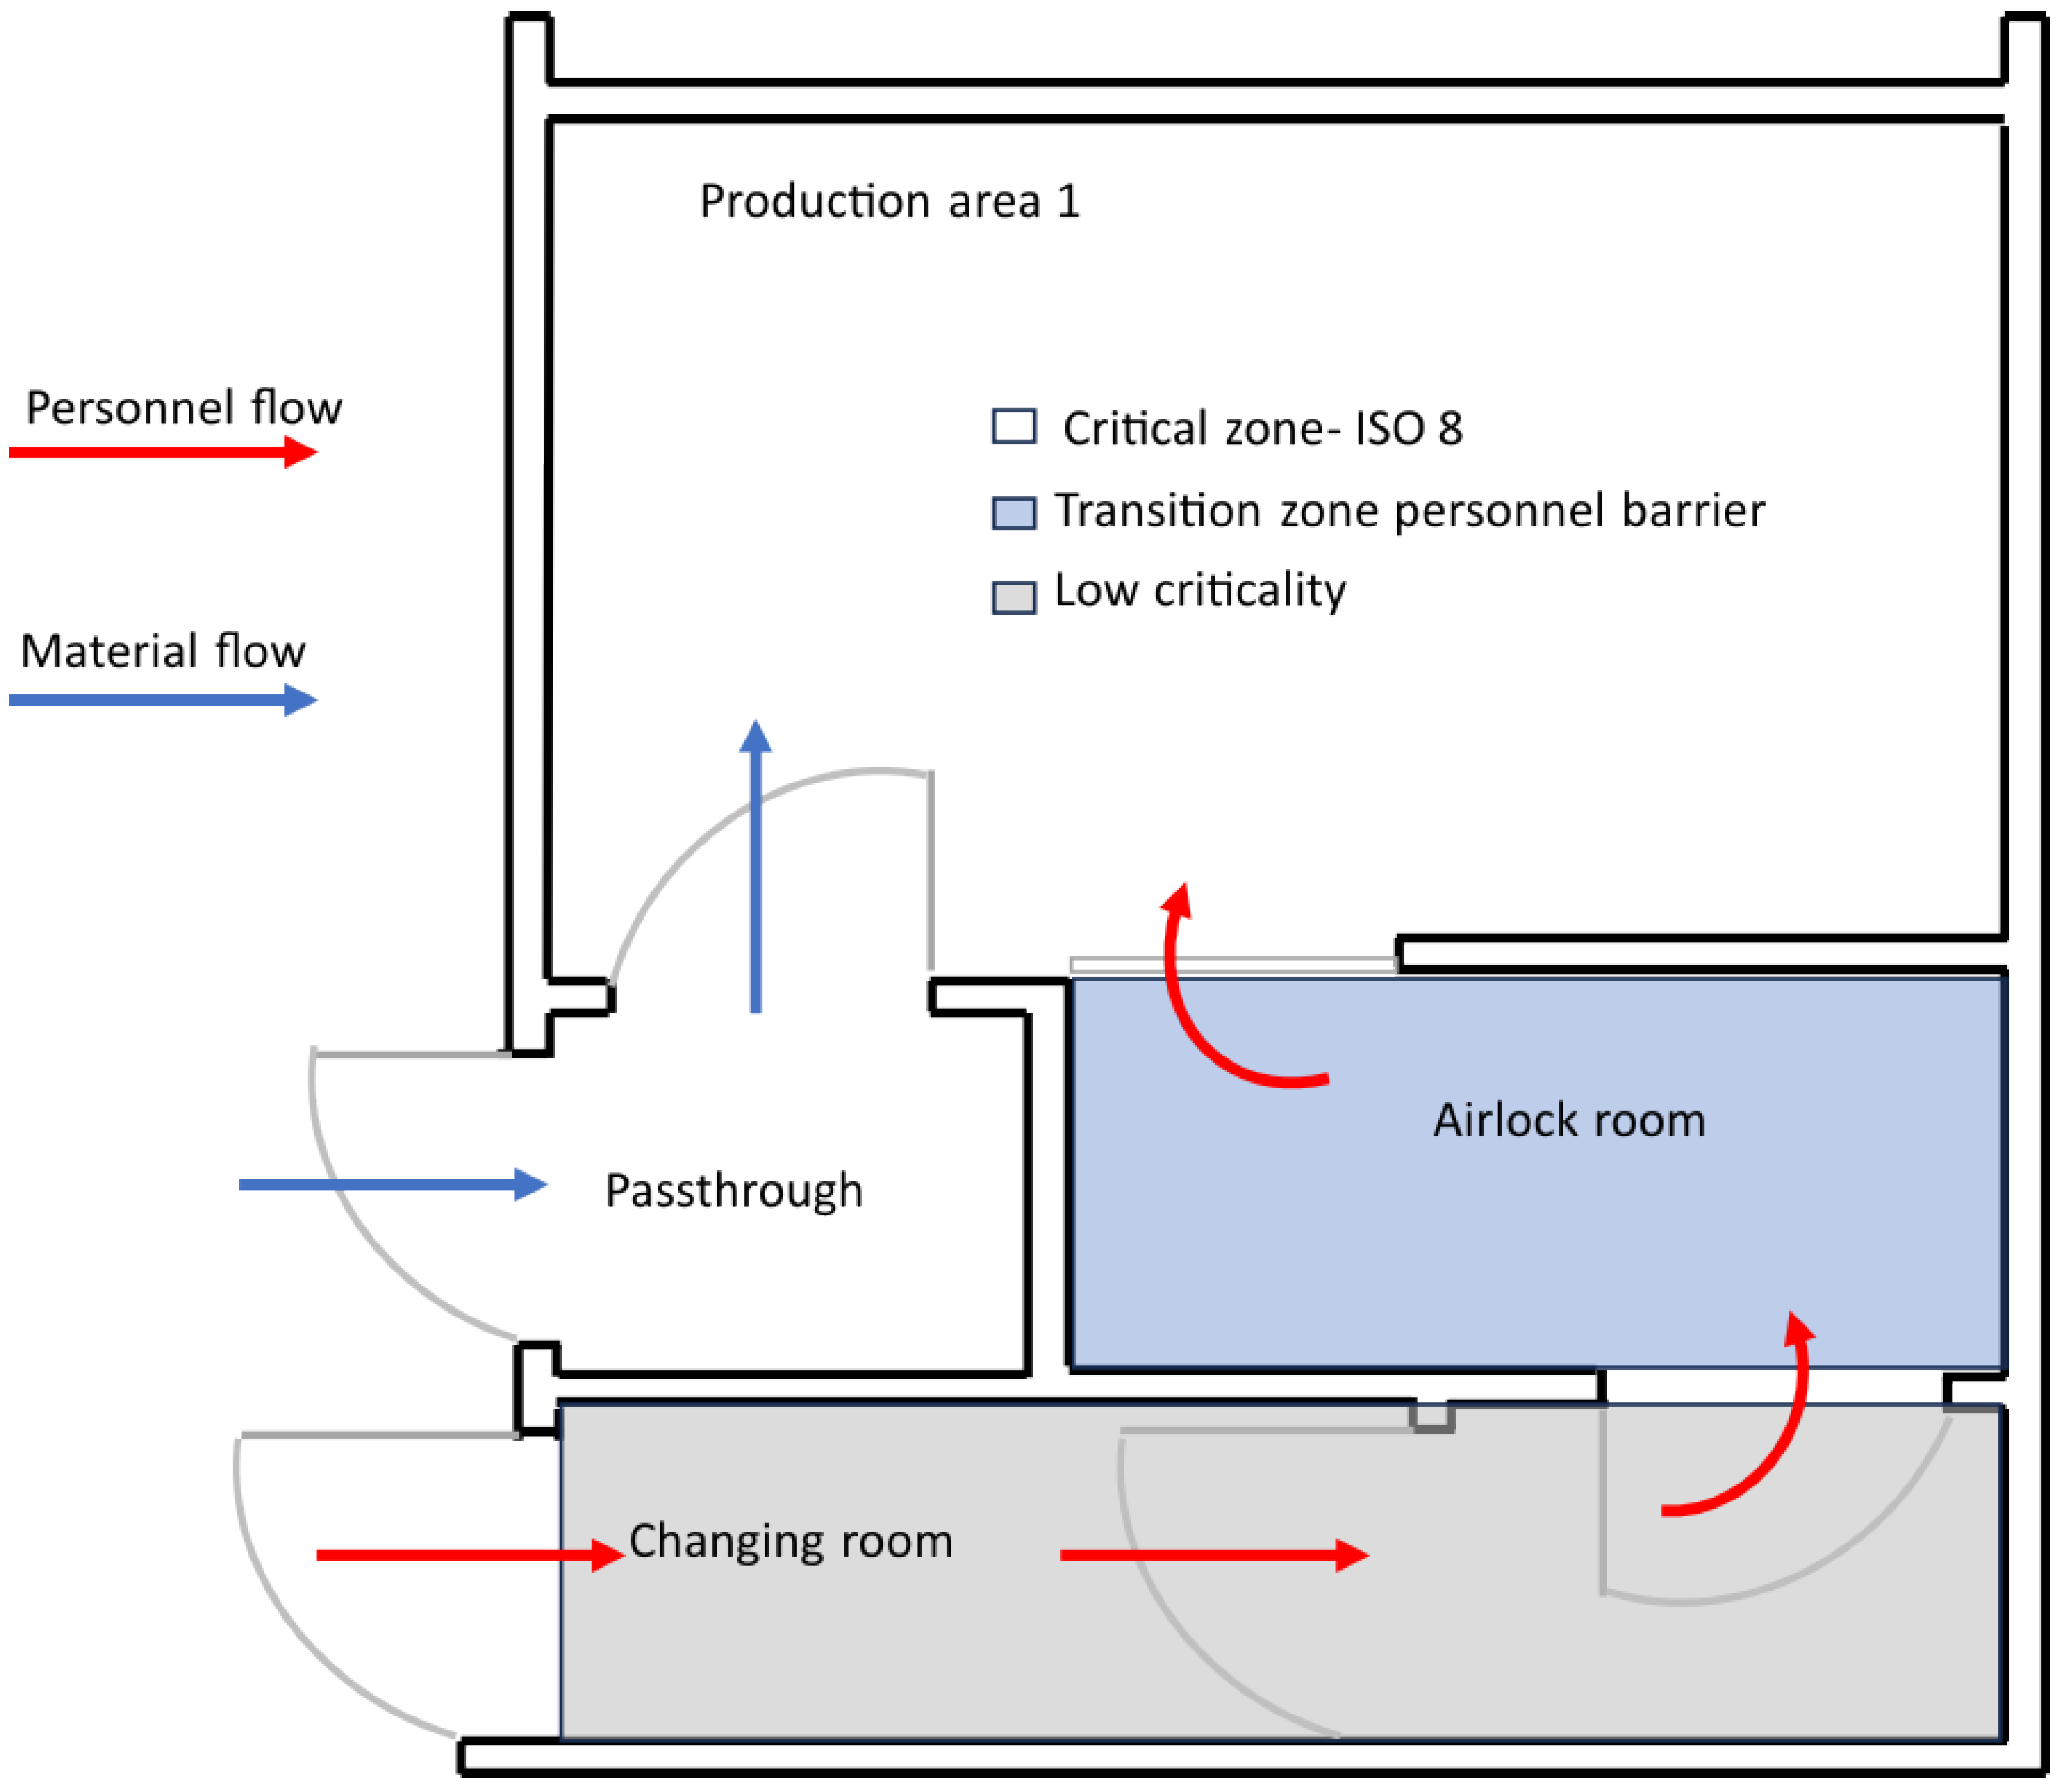
Figure 2 presents a diagram illustrating the layout and classification of the critical areas within the pharmaceutical company designated for the preparation of magistral products. Personnel flow begins in the gowning area, where a change of garments is performed to minimize the introduction of contaminants, and continues to the handwashing area, ensuring an additional level of disinfection before entering higher-criticality zones. From there, personnel proceed to the airlock, which functions as a positive-pressure barrier to prevent cross-contamination. Finally, access is granted to Production Area 1, where the compounding of magistral formulations is carried out. The design also includes a pass-through for material transfer.
The calculation of air changes in critical rooms and controlled areas, according to ISO standards, is a key parameter for ensuring air quality in spaces such as laminar flow cabinets and biological safety cabinets. This calculation determines the number of air volume renewals (
n) per hour (1/h) within a given space, ensuring appropriate cleanliness and safety conditions, as described in Equation (
1).
where
is the total supplied air flow (m
3/h), and
represents the net room air volume (m
3), calculated by subtracting the volume occupied by fixed equipment and furniture from the gross architectural volume. This adjustment ensures a precise determination of air changes per hour (ACH), as it accounts only for the air available for circulation and filtration. Using net volume rather than total geometric volume provides a more accurate assessment of the HVAC system’s effectiveness in maintaining the target air quality, particularly in ISO 8 environments, where even minor deviations in airflow distribution can affect particle removal and contamination control. This approach aligns with standard cleanroom design practices and enhances the representativeness of environmental monitoring and system validation metrics.
First, the room volume is determined by multiplying its length, width, and height. Next, the air supply or exhaust flow rate is measured using an AirData Multimeter (ADM-860, Shortridge Instruments, Inc., Scottsdale, AZ, USA), which evaluates only the fresh, filtered air entering through the supply grilles. Critical measurement points are pre-identified on a plan, based on user-defined criteria, to target the most sensitive zones. At each point, four measurements are taken and averaged, and these averages are compared across all points to assess airflow uniformity. Each reported value represents the average of 16 points measured simultaneously using the Velgrid accessory (Shortridge Instruments, Inc., Scottsdale, AZ, USA). The VelGrid is a 12 square, 16-point grid for measuring average airflow over coils, filters, fume hoods, and cleanroom surfaces. Measurements are performed 10 cm from the air supply grilles, and if any velocities fall outside the specified range, the grilles are adjusted where system design permits.
Once the airflow and room volume are determined, the air changes per hour (ACH) are calculated using the formula: the supply airflow in cubic meters per hour divided by the room volume in m3, providing the hourly air change rate. According to ISO 14644, the minimum requirement for all critical locations is more than 20 ACH, ensuring proper air renewal and maintaining optimal cleanliness and biosafety conditions in the qualified area.
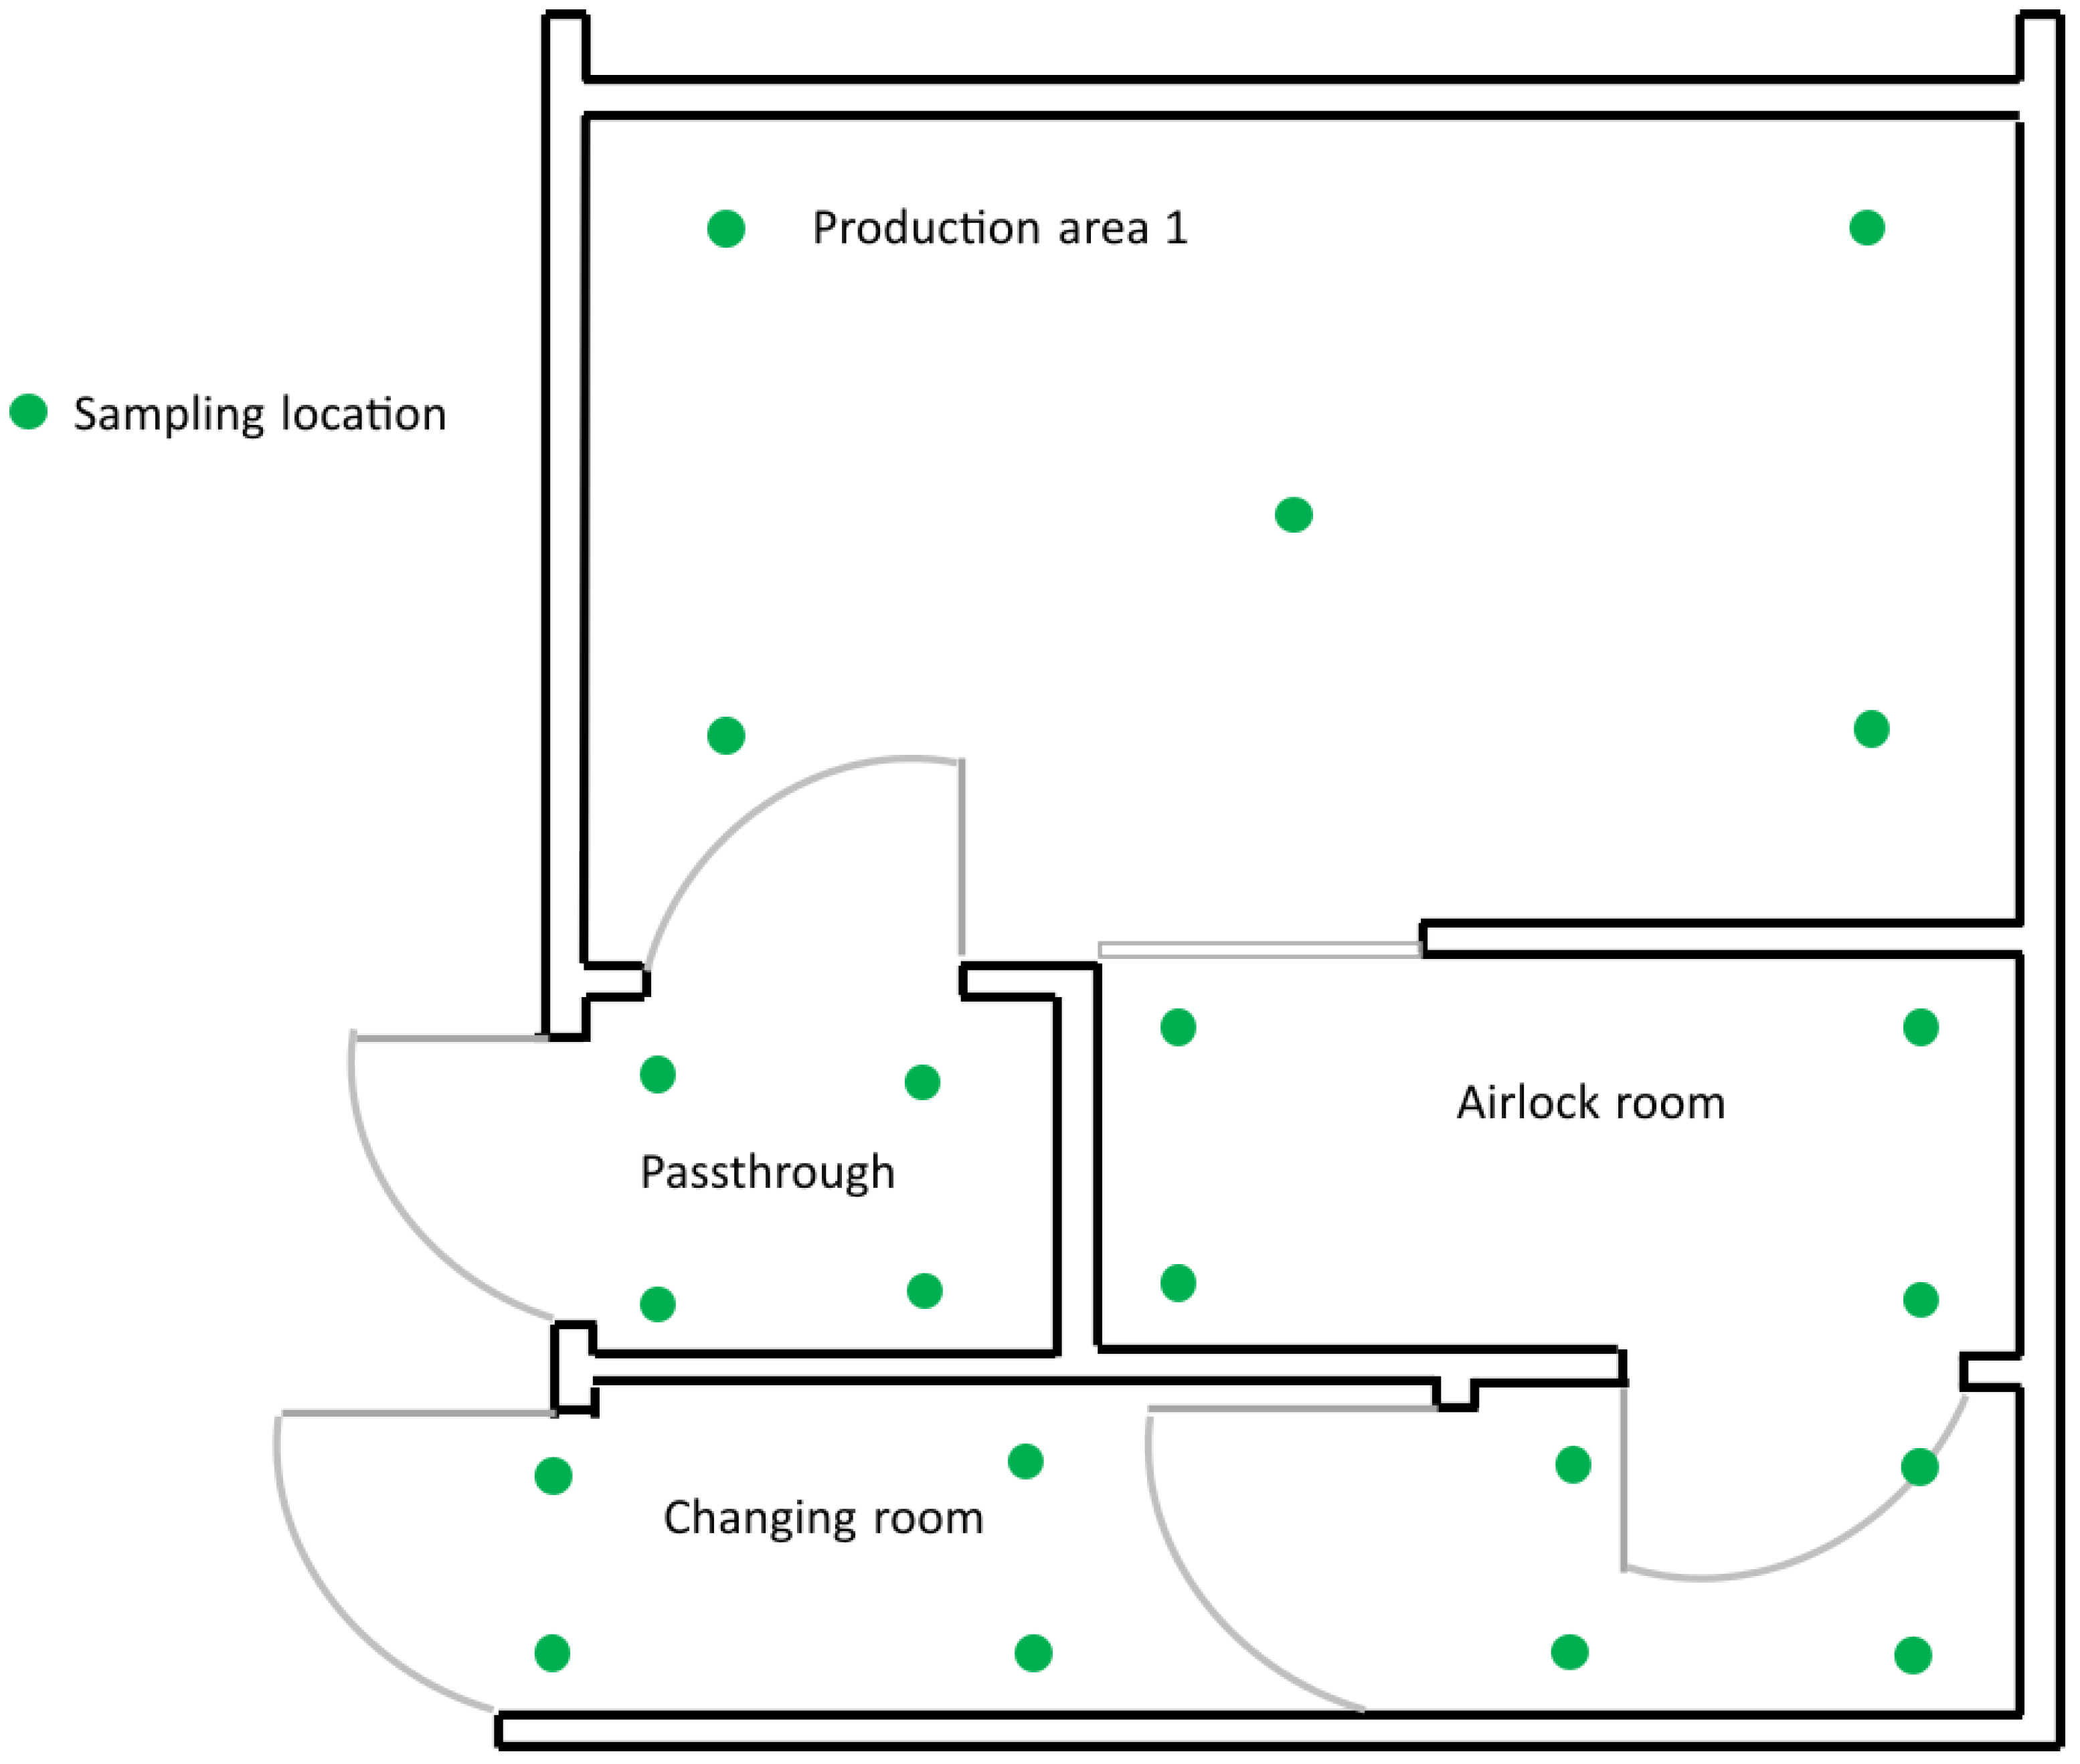
Non-viable particle monitoring in the cleanroom was conducted in accordance with ISO 14644-1, which defines maximum allowable particle concentrations per cubic meter of air according to cleanroom class. To ensure representative sampling, multiple measurement points were uniformly distributed throughout the area, considering room volume and working height. Measurements were performed under two defined occupancy states: “At rest”, where the HVAC system operates at full capacity with all installed equipment but no personnel or ongoing production activities, and “At work”, corresponding to normal operation with personnel present and active compounding processes. These conditions allow assessment of both the baseline system performance and its behavior under realistic operational stress. Each sampling point was clearly identified and documented, and the results were evaluated against the particle limits established by ISO 14644-1, providing a rigorous and reproducible representation of environmental cleanliness throughout the cleanroom.
Figure 3 shows the room layout and the locations of the sampling points, clearly documenting where measurements were taken and ensuring the representativeness of the collected data.
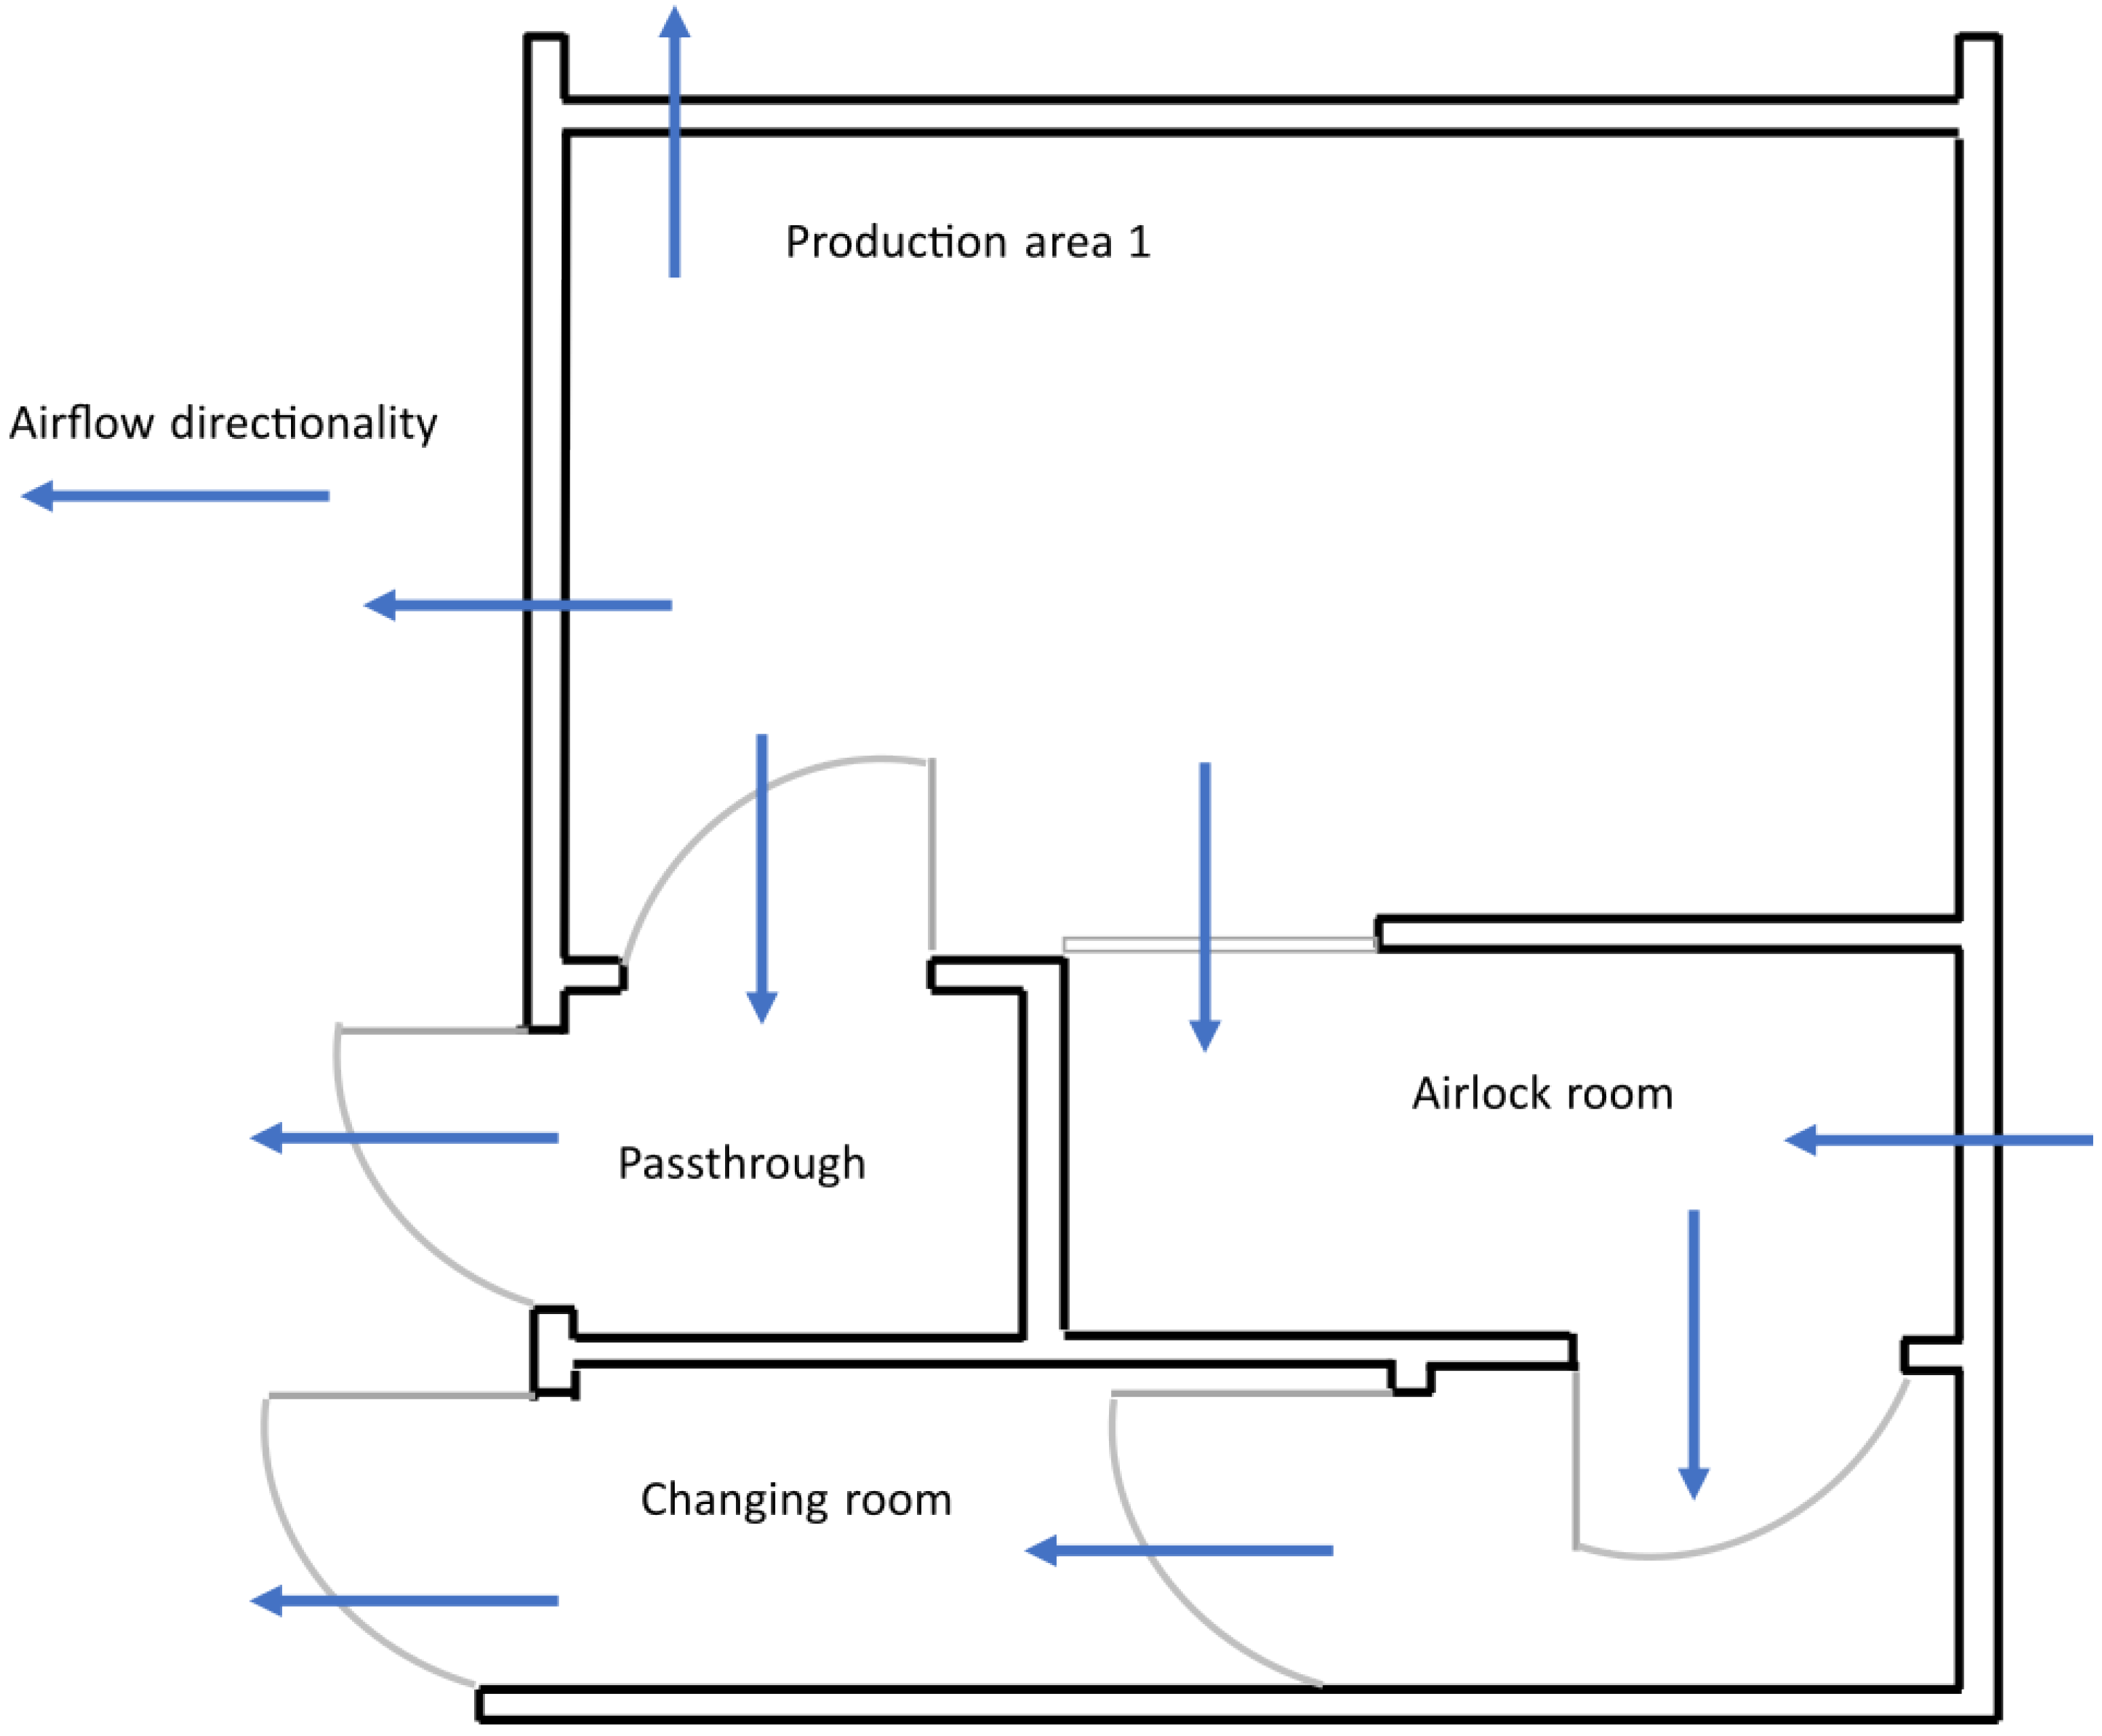
Airflow directionality in the cleanroom is a critical factor for maintaining cleanliness and minimizing cross-contamination. According to the principles of ISO 14644, air must move from lower-risk areas toward higher-risk areas through controlled laminar flow, ensuring that particles generated in one zone do not contaminate others. To maintain this directionality, differential pressures between adjacent environments are monitored; typically, critical areas are maintained at positive pressure relative to less critical areas, with typical ranges of 10 to 15 Pa depending on the requirements of the qualified area.
Figure 4 illustrates the airflow patterns and typical differential pressures between the different zones within the cleanroom.
HEPA filter evaluation in the classified air areas was conducted in accordance with ISO 14644-3 through integrity testing to verify performance. Specialized equipment was used, including a photometer (ATI, model 2H, Air Techniques International, Owings Mills, MD, USA) and a PAO-4 particle generator (model TDA-4B, Air Techniques International, Owings Mills, MD, USA), which allows detection of leaks and assessment of proper filtration. The test involves generating a cold Emery 3004 aerosol (Air Techniques International, Owings Mills, MD, USA), which is injected at the rear of each filter while the photometer performs point-by-point monitoring across the filter surface and its frame, ensuring no leaks are present. The scanning velocity does not exceed 15 cm/s, as recommended in Annex B.6 of ISO 14644-3. Any point where the photometer records a value equal to or greater than 0.01% is considered a leak. Detected leaks are sealed with silicone and re-checked with the photometer to verify the effectiveness of the seal.
Acceptance criteria specify that no leaks should be detected in the filter body, frame, or gasket, and any sealed leaks must not exceed 3% of the exposed surface or measure more than 3.8 cm on a side. This integrity verification is performed on all terminal filters in each work area, ensuring that the classified air system operates correctly and complies with the cleanliness standards required by ISO 14644. For the measurements in this study, each filter area was divided into 10 equal sections.
The evaluation of recovery times in critical areas is performed in accordance with ISO 14644-3 and aims to determine the efficiency of the ventilation system in reducing particle concentrations following a contaminant overload to approximately 100 times the target cleanliness limit. The procedure involves generating particles using a particle generator so that the area concentration exceeds normal levels, while simultaneously activating the ventilation system and recording particle counts minute by minute until the permissible system values are reached.
The recovery time is defined as the time required to reduce the initial particle concentration by a factor of 100, known as 100:1 recovery, calculated using the logarithmic particle decay rate. This test applies only to critical areas designated by the laboratory, and according to the acceptance criteria for the classified air system, the recovery time must not exceed 20 min.
For “At work” performance tests, the procedure is similar to that used for “At rest” non-viable particle counting, but it is conducted during normal operation with personnel present, allowing the system behavior to be evaluated under actual working conditions. The results are compared with the specifications of ISO 14644-1:2015 for each area, ensuring that particle concentrations of ≥0.5 μm and ≥1.0 μm remain within the limits defined for each space, such as changing rooms, handwashing areas, airlocks, production areas, and pass-throughs, thereby guaranteeing proper operation and consistent air quality at all times.
During the study period, the system operated regularly in 8-h shifts, 5 days per week, with a team of four personnel and routine use of materials, equipment, and tools for the production of non-sterile pharmaceutical dosage forms. This operation was continuously monitored through environmental control systems that recorded critical conditions in real time, enabling compliance with international standards. Annual validations verified the sustained performance of the system under normal operating conditions and ensured the traceability of results over time.
Viable particle monitoring in the ISO 8 cleanroom was conducted using the passive sedimentation method, placing sterile Petri dishes containing selective culture media at predetermined sampling points for continuous 4 h exposures. Tryptic Soy Agar (TSA) was used for aerobic mesophilic bacteria, Sabouraud Dextrose Agar for molds and yeasts, and Cetrimide Agar for the detection of Pseudomonas sp. This procedure was performed under operational conditions, capturing the influence of dynamic factors such as personnel movement, material transfer, and airflow variations. The methodology follows both GMP and the United States Pharmacopeia (USP-1116), titled “Microbiological Control and Monitoring of Aseptic Processing Environments,” which provides internationally recognized guidance on monitoring viable microorganisms in controlled pharmaceutical environments, specifying exposure times, sampling strategies, and acceptable microbial limits to ensure product quality and process integrity. By applying USP-1116 standards, the study ensures that the monitoring reflects actual microbiological risks in the cleanroom, verifying that the HVAC system, cleaning, and disinfection protocols effectively maintain ISO 8 classification. The long-term application of this method over the study period provides a representative and reproducible assessment of the environmental microbiological status, demonstrating the sustained robustness of the system and its ability to prevent microbial contamination during routine production activities.
3. Results and Discussion
The validation of the qualified air system was performed by an accredited external entity, in compliance with the technical guidelines required by the SIC. Specialized personnel, calibrated instruments, and measurement methods with certified traceability were employed. This approach ensured the objectivity of the results and allowed for the evaluation of critical variables associated with environmental performance in classified areas, including the air change rate per hour, non-viable particle counts in the 0.5 μm/m3 and 1–5 μm/m3 ranges, airflow directionality, differential pressures between areas, ULPA/HEPA filter integrity, and recovery times following operational interruptions. Four measurements of particle counts and differential pressure were conducted at each sampling point.
Table 2 presents the results of the validation of the classified air ventilation system for the year 2024. Values are expressed as mean ± standard deviation (n = 10). A dash (–) indicates that the measurement is not applicable in that area. Specifically, it shows the air supply flow rates, air change calculations, and particle concentrations in various critical areas of the laboratory. Monitoring of 5.0 μm particles was excluded from the third-party annual validation plan and replaced by particles ≥ 1.0 μm as the critical metric due to their higher statistical sensitivity for evaluating HEPA filter performance under actual operational load in an ISO 8 cleanroom. The pharmaceutical facility under study produces exclusively non-sterile compounded formulations, where contamination control is primarily focused on fine airborne particulates rather than macroparticles typically associated with sterile or biologically active processes. In this context, particles ≥ 0.5 μm and ≥1.0 μm provide a technically robust indicator of the ventilation system’s capacity to prevent dispersion of powdered active ingredients and maintain environmental cleanliness throughout production. Larger particles ≥ 5.0 μm, commonly linked to microbial vectors in sterile environments, were considered less relevant due to their lower sensitivity for detecting operational contamination in non-sterile processes. This particle size selection aligns with the facility’s risk-based objectives, ensuring that the monitoring program captures meaningful trends in system performance, identifies potential deviations promptly, and supports evidence-based maintenance and operational decision-making. By emphasizing fine particle monitoring, the approach provides a scientifically justified and operationally practical metric for sustaining ISO 8 compliance and minimizing cross-contamination risks in routine production. During the validation process, the areas indicated in
Figure 2 were evaluated, including the changing room, handwashing area, airlock, production area, and passthrough.
For each measurement point, four determinations were performed for both particle concentration and differential pressure. The results are presented as the mean linear deviation, which reflects the variability of the measurements relative to the average value. This approach allows linking system reliability to the reproducibility or repeatability of the process within a 95% confidence level, representing the interval in which results are expected to fall. It provides a probable operational range and ensures that the measured values consistently reflect the actual performance of the system.
The volumes of the areas range from 4.27 m3 in the airlock to 23.06 m3 in Production Area 1, while the measured air supply flow rates vary between 378.87 m3/h in the handwashing area and 885.77 m3/h in Production Area 1, reflecting the need for higher air renewal in larger spaces. It is noteworthy that air changes per hour are high in smaller areas, such as the changing room, handwashing area, and airlock, with values ranging from 75.17 to 113.21 ACH, well above the ISO 14644 requirement of more than 20 ACH. Production Area 1 maintains 38 ACH, which is sufficient to ensure clean air.
Regarding “At rest” particle concentrations, values for particles ≥ 0.5 μm range from 121,836 particles/m3 in the airlock to 211,923 particles/m3 in the handwashing area, while particles ≥ 1.0 μm range from 81,059 particles/m3 to 84,865 particles/m3. This shows that smaller areas with high air change rates exhibit lower concentrations, whereas intermediate spaces may present higher values due to airflow patterns or potential leaks. During normal operation (“At work”), all areas show a slight increase in particle concentration, as expected due to personnel activity. However, the airlock and Production Area 1 maintain relatively low levels (85,033 and 82,826 particles/m³ for ≥1.0 μm, respectively), indicating that the ventilation system and HEPA filters are functioning correctly. In contrast, the passthrough shows a decrease in particles ≥ 0.5 μm from 179,131 to 107,199 particles/m3 when moving from “At rest” to “At work”, possibly due to airflow adjustments or differences in sampling. Overall, all air change rates comfortably meet ISO 14644-1 requirements, and particle concentrations remain within the expected ranges for ISO Class 8 areas, demonstrating that the ventilation and filtration system ensures air integrity both “At rest” and during normal operation. The observed reduction in particle counts in the duct during the “At work” condition in 2024 can be attributed to extended system stabilization and purge time. The “At rest” measurements were conducted after the standard recovery period of 15 min, whereas the “At work” measurements followed a longer period of continuous HVAC operation, immediately after the completion of the “At rest” tests. Given that the system provides more than 20 ACH, this additional operating time enabled sustained air turnover, enhancing the removal efficiency of suspended particles within the duct volume prior to sampling. These results highlight the system’s capability to maintain ISO 8 cleanroom parameters under dynamic operational conditions, demonstrating robust filtration performance and effective environmental control during active production periods.
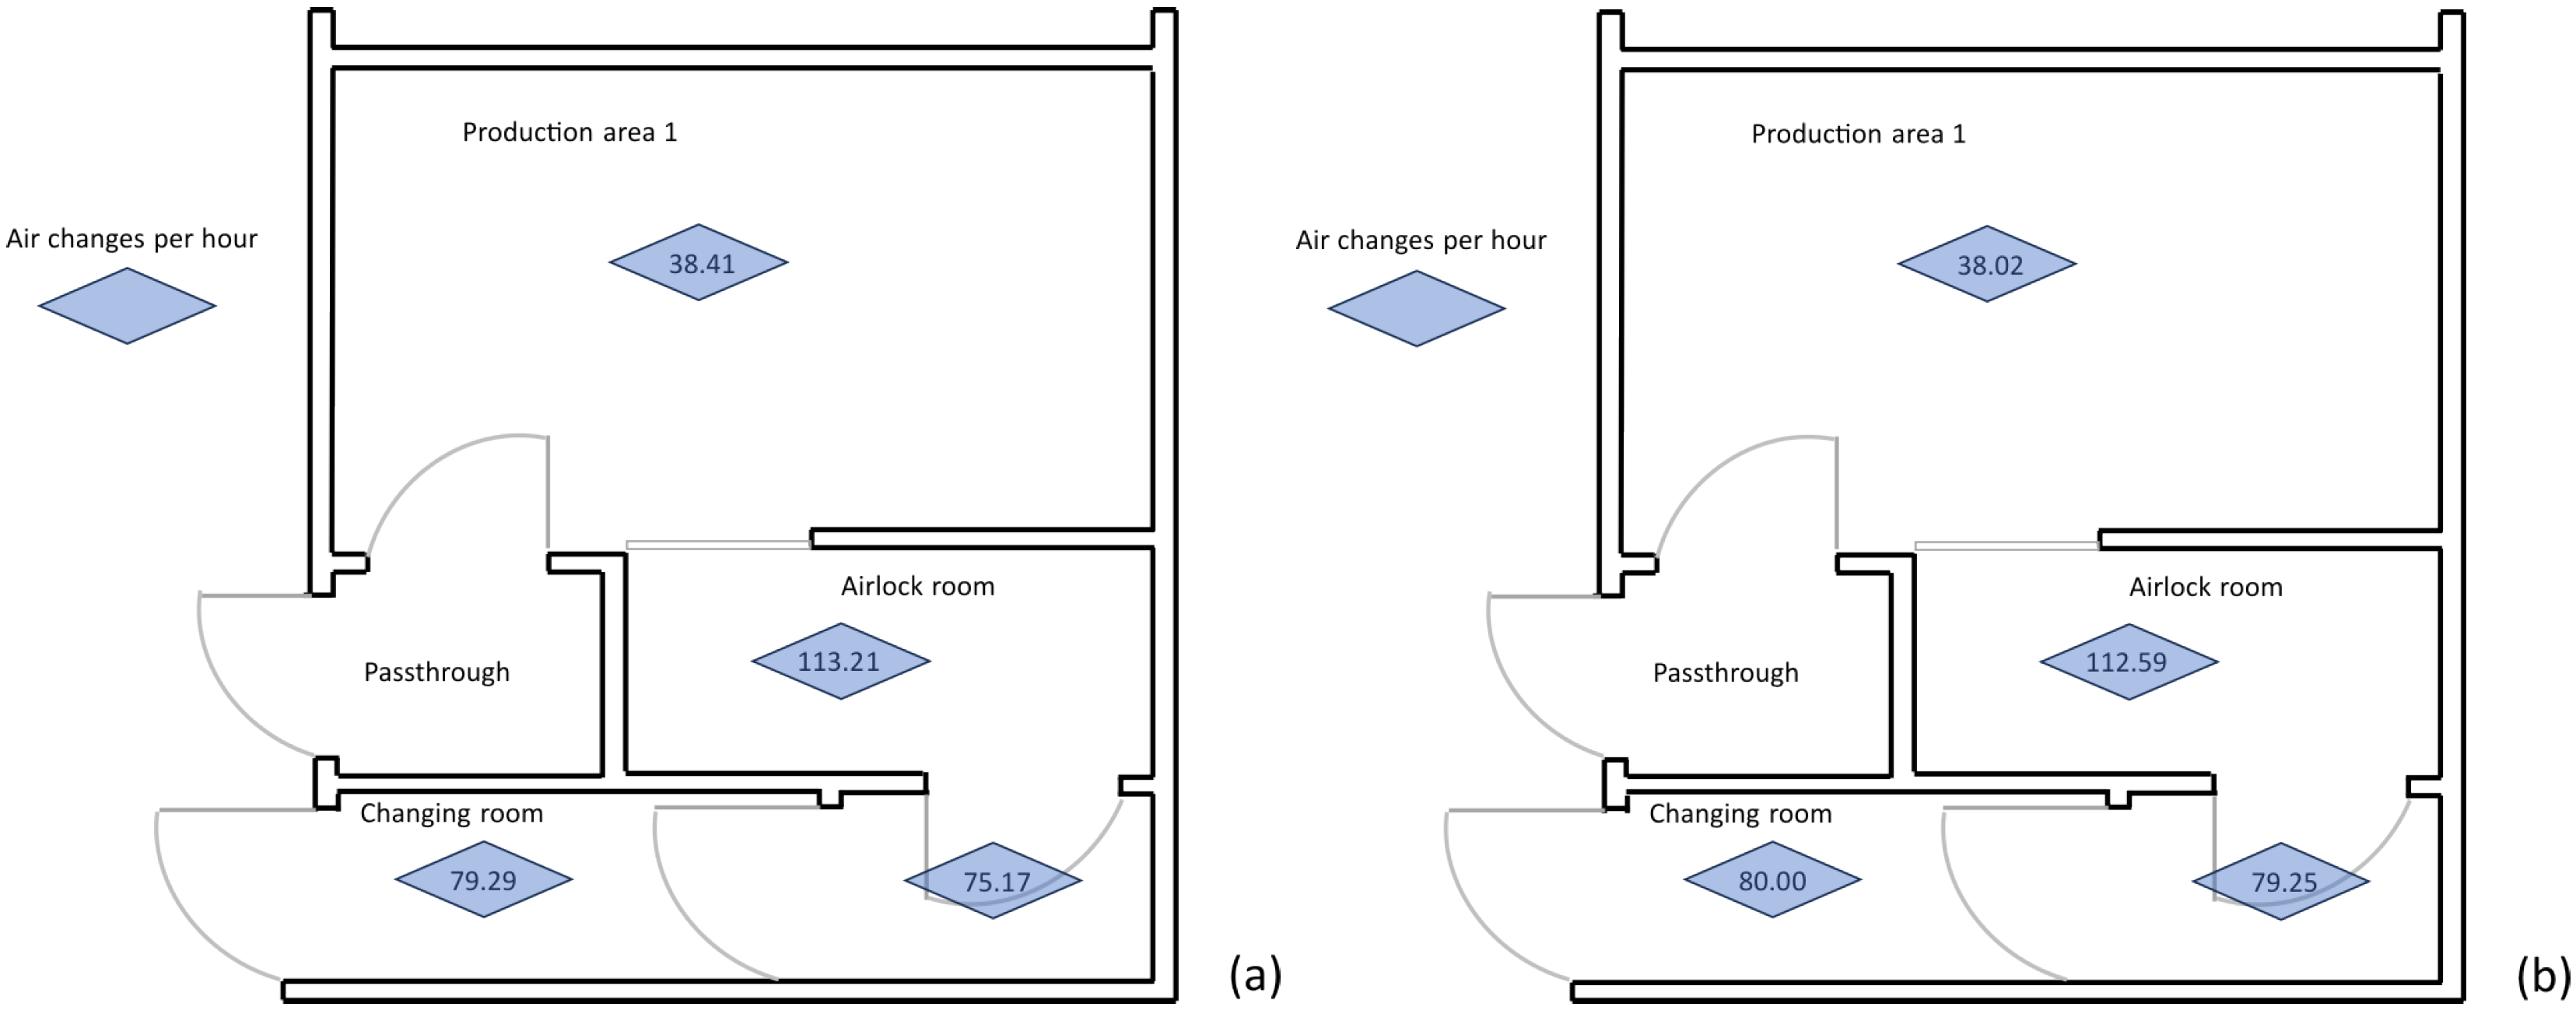
Figure 5a illustrates the air change rates (ACH) across the facility’s classified areas under “At rest” conditions, while
Figure 5b presents the corresponding values during “At Work” operation. The diagrams highlight the performance of the ventilation system in maintaining robust air renewal, with ACH values ranging from 38.41 to 113.21 “At rest” and demonstrating stable airflow under dynamic operating conditions. These high air change rates ensure rapid restoration of environmental cleanliness following potential contamination events, reflecting the system’s effectiveness in supporting ISO 8 requirements and mitigating particulate accumulation during routine production activities. In the “At rest” state, the recorded values were as follows: Production Area 1 with 38.41 ACH, airlock with 113.21 ACH, changing room with 79.29 ACH, and handwashing area with 75.17 ACH. Under “At work” conditions, very similar values were observed: Production Area 1 with 36.02 ACH, airlock with 112.59 ACH, changing room with 80.00 ACH, and handwashing area with 79.25 ACH. These results demonstrate that the ventilation and filtration system maintains stable performance across both conditions, with only minimal variation. Specifically, a slight decrease in air changes is observed in Production Area 1 when moving from “At rest” to “At work,” which is expected due to occupancy and activities that generate higher particle loads and alter airflow distribution. In contrast, the changing room and handwashing area show a slight increase under working conditions, suggesting an HVAC system adjustment to maintain the pressure gradient and protect the critical zone. The airlock remained practically stable in both states, ensuring containment and separation between areas.
The results obtained confirm that the facility complies with cleanroom design principles, where transition and support areas exhibit higher air change rates than the main production area, thereby ensuring proper environmental control both “At rest” and “At work”.
Table 3 presents the differential pressures between the evaluated locations under both “At rest” and “At work” conditions for 2024. The results indicate that the HVAC system maintains a robust and stable pressure cascade across all critical and support areas, with variations generally below 0.2 Pa. Critical areas such as the Isolation Room (21.8 ± 0.45 Pa) and the airlock–handwashing area (21.7 ± 0.5 Pa) exhibit differential pressures well above the typical ISO 8 design threshold of 15 Pa. These elevated pressures represent intentional operational safety margins designed to accommodate transient disturbances, filter loading, natural component aging, and dynamic airflow variations caused by personnel movement or material transfer.
The consistency of positive pressure gradients across intermediate zones, for example, between the Production Area and Passthrough (8.6 ± 0.1 Pa “At rest”; 8.7 ± 0.1 Pa “At work”) and between the Passthrough and Corridor (13.5 ± 1.0 Pa “At rest”; 13.5 ± 0.9 Pa “At work”), demonstrates effective implementation of a cascaded airflow strategy. Maintaining such pressure differentials is essential to prevent particle migration from less critical to more critical zones and to minimize the formation of recirculation zones or stagnant areas that could compromise cleanliness.
From an engineering perspective, the stability observed reflects the integration of several key design elements: high-efficiency HEPA/ULPA filtration to ensure near-total particle removal; unidirectional airflow in critical areas to maintain laminar flow patterns; and the strategic placement of supply and return vents informed by computational fluid dynamics (CFD) modeling. These features collectively reduce the risk of transient contamination events and support reproducible environmental conditions over extended operational periods.
Furthermore, the observed overpressures provide an additional buffer to maintain differential pressures above the minimum ISO 14644-3 requirements (10–12 Pa for ISO 8), even under dynamic conditions. This operational margin is particularly important in facilities with continuous production and regular personnel traffic, as it mitigates the impact of sudden pressure drops that could occur during door openings or material handling. The low variability between “At rest” and “At work” conditions highlights not only the responsiveness of the HVAC control system but also the effectiveness of validated standard operating procedures for personnel and material flow.
The results of the HEPA filter integrity test conducted in 2024 are presented in
Table 4, based on photometer measurements taken at ten points across the filter surface. The recorded values show minimum readings ranging from 0.0001% to 0.0007% and maximum readings between 0.0002% and 0.000%. All evaluated areas reported an obstruction percentage of 0.00%, indicating that no additional sealing was required. These results confirm the absence of leaks on both the filter surface and its housing, fully complying with the acceptance criteria established in ISO 14644-3, which sets a maximum allowable penetration of 0.01%. The uniformity of the readings across the inspected points further demonstrates the consistency of the seal and the effectiveness of the HEPA filter, ensuring that the air supplied to the classified area meets the required cleanliness standards. Therefore, the filter can be considered fully functional and reliable, providing adequate protection of critical areas against particles and contaminants.
The results obtained from the recovery time assessment indicate that, following an electrical power interruption or a contamination event, the ventilation system is capable of restoring the required operating conditions within a maximum of five minutes. All critical areas comply with the acceptance criterion established by the World Health Organization Technical Report Series No. 45, which specifies a recovery time of less than twenty minutes for a 100:1 recovery ratio. In particular, the production area reached the permissible particle concentrations for sizes equal to or greater than 0.5 μm and 1.0 μm within five minutes, demonstrating efficient and reliable system performance.
Table 5 presents the historical results of environmental microbiological monitoring in the ISO 8 cleanroom during the period 2014–2024. The table shows the average colony-forming units (CFU) for mesophilic bacteria, molds, yeasts, and the presence of Pseudomonas sp. The limits indicated correspond to USP-1116, a chapter of the United States Pharmacopeia that defines microbiological quality standards for controlled environments in pharmaceutical manufacturing. For ISO 8 (Grade D) cleanrooms under operational conditions, USP-1116 establishes maximum allowable counts of mesophilic bacteria (<100 CFU), total molds and yeasts (<50 CFU), and the absence of opportunistic pathogens such as
Pseudomonas sp. These standards provide a benchmark to evaluate the effectiveness of the HVAC system and cleaning protocols in maintaining microbiological control, ensuring both product safety and process compliance. The results in
Table 5 demonstrate that the monitored areas consistently met or exceeded these requirements, with mesophilic bacteria and fungi well below the USP limits and no detection of Pseudomonas sp. over the ten-year period. This indicates a sustained robustness of the HVAC system and cleaning/disinfection protocols in controlling microbiological contamination in the production environment.
The long-term stability of environmental microbiological control over the 2014–2024 period is supported by the passive sampling methodology employed. Sedimentation plates were exposed for four hours under dynamic operating conditions, providing a representative assessment of the microbial load actually affecting the workspace during production activities. The results show annual averages for mesophilic bacteria and molds/yeasts that are substantially below the USP-1116 limits (less than 5 CFU, compared to the maximum allowable 100 CFU for mesophiles and 50 CFU for fungi), and the complete absence of opportunistic pathogens such as Pseudomonas sp. on selective media. These findings confirm that the HVAC system functions as an effective barrier against microbiological contamination.
The biological resilience of the controlled environment is particularly notable, given that these low counts were maintained even during the extended 18.5-month interval between validations, caused by the COVID-19 pandemic. This demonstrates the robustness of the cleaning and disinfection protocols integrated within the company’s quality assurance system and validates the original cleanroom design. Overall, the data indicate that a combination of a well-engineered HVAC system, validated operational protocols, and systematic environmental monitoring can reliably sustain microbiological control in non-sterile pharmaceutical manufacturing environments over extended periods.
The validation process of the pharmaceutical company’s air handling system has been carried out continuously since the system was installed, ensuring that all critical areas maintain the required cleanliness and pressure conditions in accordance with the applicable ISO standards.
Table 6 presents a consolidated summary of the results corresponding to the production area over the period from 2014 to 2024. This long-term record allows for the evaluation of the system’s performance trends and consistency over time, as well as the reliability and reproducibility of the environmental conditions within this critical area. The consolidated results presented in
Table 5 indicate that the qualified air system complies with the requirements established for ISO 8 (Class 100,000) environments. An adequate number of air changes per hour was observed in the critical rooms, consistently remaining above the minimum threshold of 20 air changes required by ISO 14644-1 and GMP design guidelines. The non-viable particle counts remained within the acceptable limits, even under dynamic conditions, demonstrating the high efficiency of the filtration system and the effective environmental control maintained throughout the operation.
The observed fluctuations in HVAC performance metrics over the 2014–2024 period are not indicative of random instability but are attributable to discrete operational and maintenance events affecting system dynamics. Critical contributors include the natural aging and preventive replacement of HEPA filters in 2019, the enclosure of the Air Handling Unit (AHU) to optimize airflow efficiency and reduce leakage, delays in scheduled preventive maintenance during the COVID-19 pandemic that extended the interval between annual validations to 18.5 months, and a significant surge in production throughput in 2021. These factors provide a technical rationale for temporary variations in particle counts and air change rates despite the system maintaining structural and functional integrity.
Time-series analysis reveals that the spike in particles ≥ 1.0 μm in 2020 (210,680 particles/m
3) occurred during the delayed validation period caused by pandemic-related operational constraints. Operating the cleanroom for an extended period without preventive interventions led to higher levels of suspended particulates, while the integrity of the HEPA filters remained intact. This pattern illustrates how dynamic loads and personnel activity influence particle dispersion, in agreement with recent studies showing that transient emissions and human-induced variability are major contributors to fluctuations in cleanroom particulate levels [
20,
23].
Variations in air change rates (n) between 2017 (20.50 ACH) and 2021 (58.69 ACH) reflect both engineering interventions and process demands. The 2019 filter replacement and air handling unit enclosure enhanced system tightness and airflow delivery efficiency, while the extraordinary production load in 2021 required increased air exchange to sustain ISO 8 compliance. These findings corroborate systematic analyses of cleanroom ventilation, which emphasize that HVAC systems must accommodate operational peaks and human activity while maintaining contaminant control and pressure cascades [
24]. The results demonstrate the system’s adaptive capacity, confirming its resilience to operational stressors, robustness of pressure cascades, and effectiveness in maintaining controlled environmental conditions critical for product quality. Continuous monitoring combined with preventive maintenance and process-aware operational strategies is essential for sustaining long-term cleanroom performance in dynamic pharmaceutical manufacturing environments.
Additionally,
Table 6 presents satisfactory results from the HEPA filter integrity tests, with an efficiency exceeding 99.99% and no leaks detected. Positive pressure gradients between classified areas were verified, which supports the containment of contaminants and the maintenance of unidirectional airflow. Directionality tests, supplemented by smoke tests, demonstrated consistent airflow from clean areas to lower-classified zones. As for the environmental recovery times also documented in
Table 6, these were short and stable, indicating a rapid reestablishment of critical conditions after personnel entry or door openings. This recovery capability confirms the robustness of the system’s design in the face of operational variations commonly encountered in pharmaceutical manufacturing environments.
From a technical standpoint, the methodologies applied confirmed the robustness of the HVAC system in relation to regulatory criteria. Air exchange rates were determined based on velocity and airflow measurements at supply diffusers, demonstrating that classified areas maintain values above the minimum required for ISO 8 cleanrooms, which is more than 20 ACH. The non-viable particle count was performed in accordance with ISO 14644-1, using appropriate sampling volumes and comparing results under “At rest” and in operation conditions, showing that concentrations consistently remained within regulatory limits. The HEPA filter integrity test, conducted using PAO aerosol and the photometric method, confirmed the absence of leaks exceeding a penetration level of 0.01%. Similarly, differential pressure measurements between areas verified proper airflow directionality, preventing cross-contamination. Recorded recovery times, up to 10 min, remained well below the 20 min acceptance limit set by the ISO standard. Finally, temperature and humidity measurements confirmed that environmental gradients remained stable, ensuring homogeneous critical operating conditions throughout the system.
The analysis of historical trends from 2014 to 2024 allowed the identification of relevant aspects of the system’s performance. With respect to air renewal, although all results remained within regulatory limits, interannual variations were observed, with minimum values close to the acceptance threshold between 20 and 23 ACH and others significantly higher, ranging from 45 to 58 ACH, indicating a degree of dispersion in system efficiency. For particles measuring at least 0.5 μm, a high interannual variability was evident, with values as low as one hundred twenty-six thousand and peaks of up to 1.8 million. All results complied with standards, yet the fluctuations suggest possible associations with operational or maintenance conditions. A similar pattern was observed in the count of particles measuring at least 1.0 μm, with stable results in most years below two hundred thousand, except for atypical peaks in 2020 exceeding two million, attributable to isolated events. In contrast, recovery times demonstrated a stable and consistently favorable behavior, with an average of 7.75 min and maximum values of 10 min, confirming the system’s ability to rapidly reestablish cleanroom conditions.
The results confirm that the HVAC system continues to meet regulatory standards, although natural variability is observed across the different years evaluated. This behavior does not compromise the qualified state; rather, it highlights the importance of maintaining a robust trend review program that allows fluctuations to be correlated with operational, occupancy, or maintenance factors, thereby strengthening preventive oversight and continuous improvement. The documented evidence, together with metrological traceability and the annual execution of performance tests, demonstrates that the system operates under control, in reproducible and safe conditions, ensuring the protection of the product, the process, and the personnel, and guaranteeing sustained compliance with national and international regulatory requirements.
The results support the sustained efficiency of the qualified air system throughout the study period. These findings are consistent with the scientific literature, where authors such as Dhandapani et al. 2024 emphasize the importance of periodic validation of HVAC systems as a key strategy for ensuring controlled environments and the quality of pharmaceutical products. The systematic documentation of these variables and their performance not only ensures compliance with regulatory requirements but also strengthens the organization’s quality management system [
33].
It is important to highlight that this study provides valuable evidence on the effectiveness and stability of a Class 100,000 ISO 8-qualified air system under real operational conditions over a ten-year period. The findings demonstrate that, despite inherent limitations in conventional validation methods, systematic longitudinal monitoring captures the effects of human variability, fluctuations in production load, and potential airflow dead zones on environmental quality. The data show that, through rigorous validation and maintenance procedures, the HVAC system consistently maintains critical parameters such as differential pressure, air changes per hour, non-viable particle counts, airflow directionality, HEPA filter integrity, and microbiological control, ensuring protection of the product, personnel, and environment. This approach enables a representative assessment of system performance and strengthens informed decision-making in environmental control and quality assurance. Collectively, the results provide a robust technical reference for engineers, pharmaceutical chemists, and quality assurance professionals, demonstrating that proper system design, installation, and operation, combined with structured monitoring protocols, ensure sustained performance and minimize the risk of cross-contamination in compliance with international standards.
3.1. Study Limitations
Although this study benefits from a comprehensive ten-year longitudinal dataset, several limitations should be acknowledged to properly contextualize the findings.
The results are derived exclusively from a single pharmaceutical facility. Consequently, the observed HVAC system performance, particle levels, and microbiological profiles are influenced by local environmental conditions, facility design, operational practices, and the organization’s internal cleaning, disinfection, and third-party validation protocols. These factors may not represent other facilities, particularly those with different architectural layouts, process flows, or regional climatic conditions. Therefore, caution is required when attempting to generalize these findings to other ISO 8 cleanrooms or pharmaceutical production environments.
The study is primarily descriptive and observational, based on routine monitoring and validation reports rather than controlled experimental interventions. While this approach enables identification of temporal trends and correlations, such as the impact of the COVID-19 pandemic on extended validation intervals or the effects of mechanical improvements implemented in 2019, it does not allow for rigorous statistical isolation of individual variables. As a result, causal relationships between operational, environmental, or human factors and the observed variability cannot be definitively established.
Despite these limitations, the study provides a detailed and practical reference on the sustained performance of a qualified HVAC system in an ISO 8 cleanroom. The dataset offers valuable insight into system reliability, particle control, and environmental monitoring over an extended operational period, although the conclusions should be interpreted as evidence from a single case study rather than universally generalizable results.
3.2. Recommendations
In the design phase of an air handling system for cleanrooms, it is essential to begin with the regulatory requirements established by ISO 14644 and good manufacturing practices (GMPs), ensuring that each area meets the appropriate cleanliness classification according to the process risk. The system must provide an adequate number of air changes per hour, utilize terminal filtration with high-efficiency HEPA filters, and maintain a positive pressure gradient between areas of different classifications to prevent the ingress of contaminants.
It is also critical to define unidirectional airflow patterns in critical zones and mixed airflow patterns in support areas to achieve uniform distribution and avoid stagnant zones. Temperature, humidity, and differential pressure must be precisely controlled and continuously monitored to maintain environmental stability and minimize particle and microbial generation.
Simultaneously, the facility design should incorporate smooth, non-porous, and easily cleanable materials, as well as personnel and material airlocks to reinforce containment. Accessibility for maintenance must be considered without compromising the integrity of the cleanroom. Redundancies should be included to ensure operational continuity, and the system should be designed to facilitate subsequent validation through installation, operational, and performance qualification.
The validation of the air handling system in cleanrooms must encompass a comprehensive verification process from installation through routine operation, ensuring that critical areas consistently maintain the environmental conditions required by international standards and GMP. In accordance with ISO 14644-3, it is essential to perform key tests such as particle counting in both “At rest” and “At work” states, HEPA filter integrity testing with a maximum allowable leakage of 0.01%, evaluation of differential pressures between critical areas, calculation of air change rates, and determination of recovery time following a particle overload.
Validation must also include continuous environmental monitoring of parameters such as particles, pressure, temperature, and humidity, accompanied by periodic requalification as specified in ISO 14644-2, to ensure sustained system compliance. Energy efficiency optimization in accordance with ISO 14644-16 should also be considered by evaluating air change rates and airflow patterns to reduce consumption without compromising environmental quality.
Furthermore, maximum occupancy limits should be validated for each area, recognizing that personnel are a significant source of particles, and the proper selection, installation, and operation of ventilation and filtration equipment must be ensured. This validation process should not be viewed in isolation but integrated into the quality management system, ensuring that each test is supported by standardized procedures, documented records, and traceability in line with risk management principles, internal audits, and management reviews.
In this way, air system validation not only ensures compliance with ISO standards but also serves as a strategic pillar of quality assurance, enhancing process reliability and safeguarding the safety of products manufactured under good manufacturing practice guidelines.




 ,
,