Optimal D-STATCOM Operation in Power Distribution Systems to Minimize Energy Losses and CO2 Emissions: A Master–Slave Methodology Based on Metaheuristic Techniques
Abstract
1. Introduction
1.1. Problem Description
1.2. State of the Art
1.3. Research Focus, Key Contributions, and Scope
1.4. Novelty and Main Contributions of This Research
- A mathematical model representing the operation of D-STATCOMs in PDSs to reduce power losses and CO2 emissions. This model considers the technical constraints inherent to the operation of such devices and the network.
- A test system that takes into account the operating constraints and power demand behavior of an actual distribution system located in the city of Talca (Chile).
- Three master–slave methodologies for the intelligent operation of D-STATCOMs in PDSs, which provide solutions to the proposed model while ensuring adherence to system constraints under a varying power demand scenario.
- The selection of the PGA as the most efficient methodology (in terms of solution quality, repeatability, and processing times) to address the problem of intelligent operation of D-STATCOMs in PDSs with the ultimate goal of reducing power losses and CO2 emissions. This methodology considers the technical constraints of the devices and the network, as well as variations in demand associated with the different seasons.
1.5. Document Structure
2. Mathematical Formulation
2.1. Objective Functions
2.2. Constraints
2.3. Relevance of Optimally Integrating and Operating D-STATCOMs
3. Proposed Methodology
3.1. Proposed Encoding
3.2. Master Stage
3.2.1. Monte Carlo Method
3.2.2. Population-Based Genetic Algorithm
- Population generation: This principle stems from the fact that, in nature, the probability of survival is greater within communities than in solitary individuals. Hence, the GA employs populations of individuals (generations) to converge.
- Selection: This principle originates from a natural law that limits reproduction to certain individuals in a population, allowing only the fittest members to have higher chances of having offspring. Under this principle, the algorithm ensures that subsequent generations will outperform their predecessors.
- Encoding: This principle is based on how the individual characteristics of each solution are encoded, which influences the algorithm’s efficiency and its search space. It also impacts the adaptation of individuals to the problem’s constraints.
- Crossover: This principle deals with how individuals from the initial generation are recombined to shape the genetic structure of the successor generation. It facilitates the mixing of specific traits from population members and is the basic mechanism of evolution.
- Mutation: This process reveals the random nature of generating individuals by modifying the characteristics already defined in their structures. It enables the exploration of solutions that might otherwise remain undiscovered.
3.2.3. Particle Swarm Optimization
3.3. Slave Stage
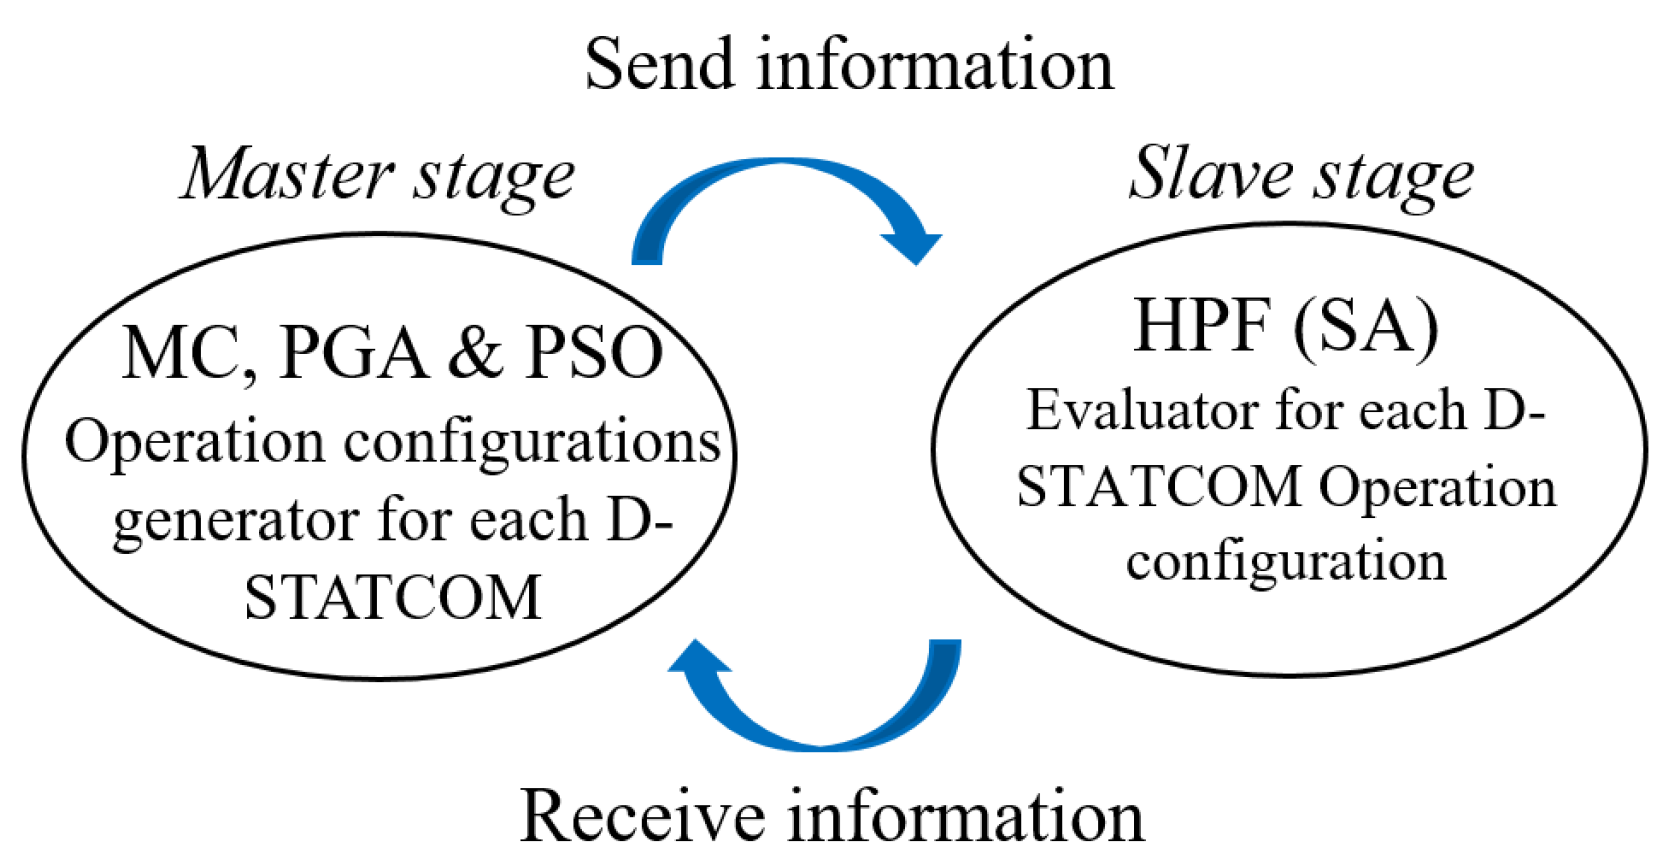
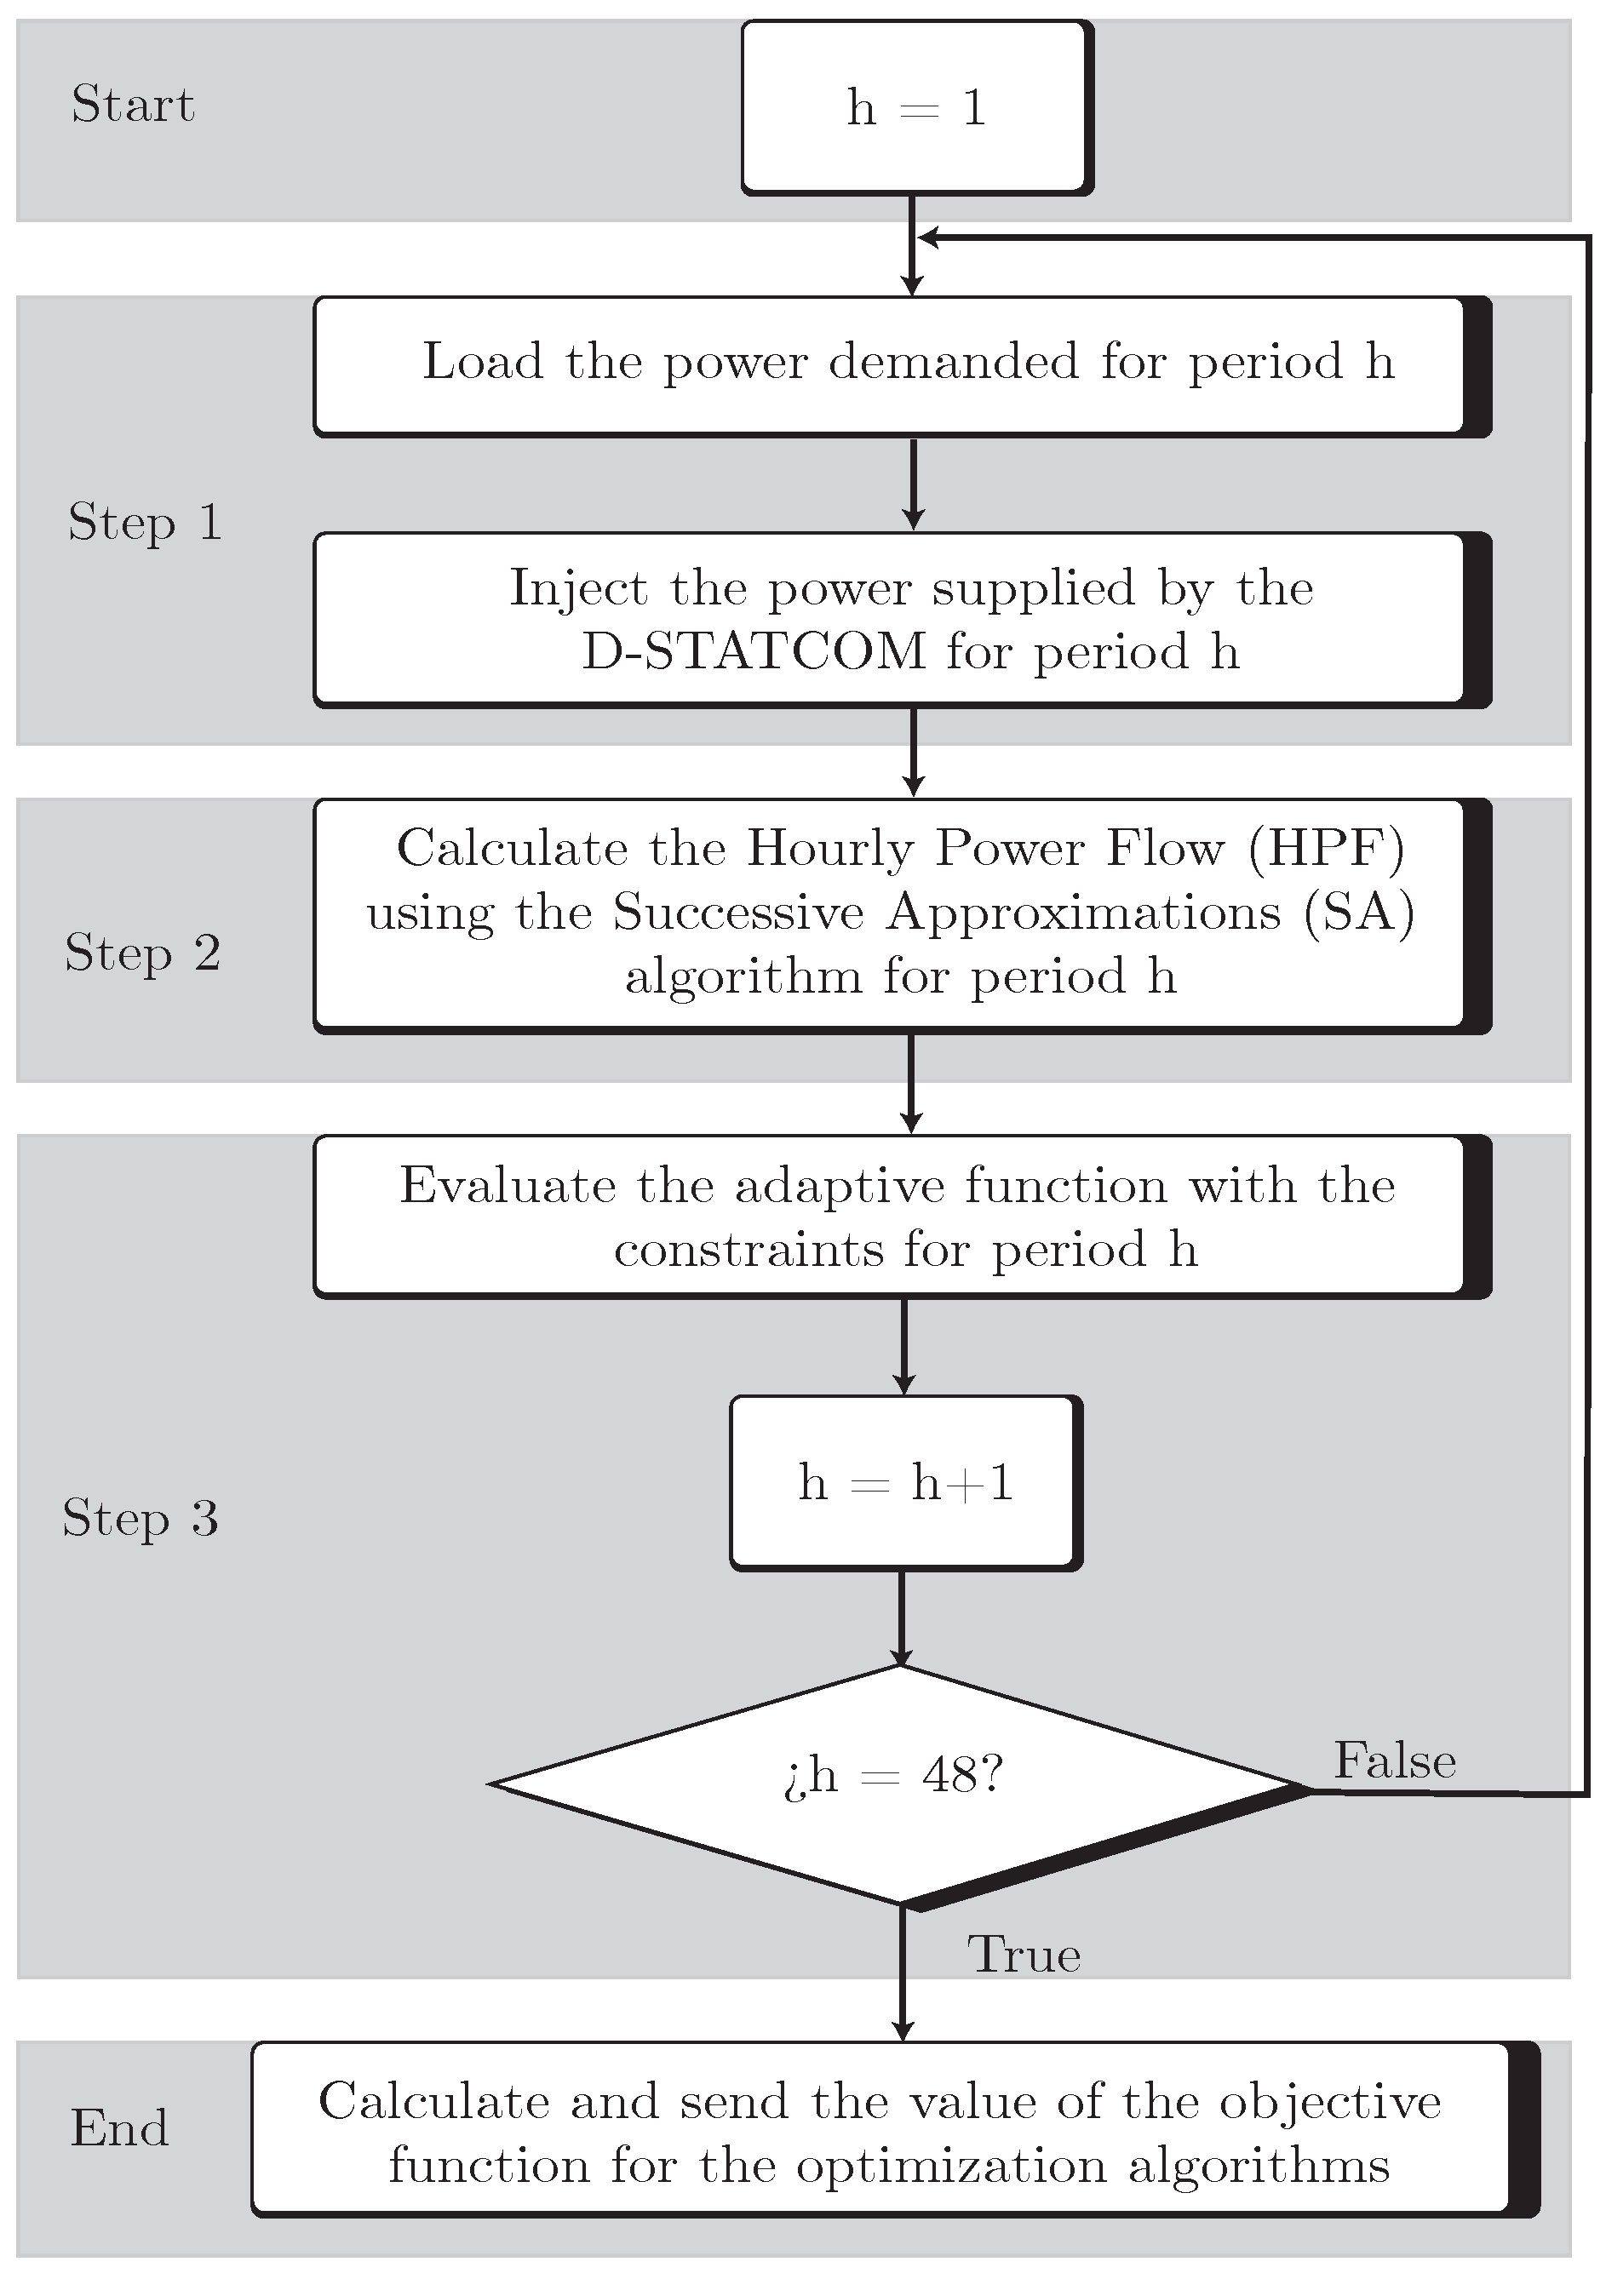
- Start: Each solution is evaluated for a day of operation, which comprises 48 time periods (h). These periods represent the energy demand data collected every half hour. Moreover, Steps 1 to 3 are repeated until the last period is evaluated.
- Step 1: The initial parameters of the network (e.g., demanded power, future locations of the D-STATCOMs, and current limits) are loaded without considering the presence of D-STATCOMs. Then, the reactive power operation configurations obtained from the algorithms’ solutions are implemented in the system, which seek to have an impact on it either by reducing energy losses or CO2 emissions.
- Step 2: The HPF is computed using the method of successive approximations—a numerical technique that involves finding the roots of an equation within a specified number of iterations [52]. This method calculates the voltage magnitudes in a network, which are later used to find the value of the objective functions and system’s constraints. The formulation employed for the method of successive approximations is as presented in Equations (11) and (12), following the formulation reported in [14].In these equations, is the generated power, and denotes the power demanded by the distribution system. Similarly, and represent the voltages at the generation and demand nodes, respectively. Furthermore, , , , and are the components of the nodal admittance matrix, with each component relating the admittance data associated with slack bus to slack bus, demand bus to slack bus, generation bus to demand bus, and demand bus to demand bus, respectively. Finally, since represents the variables of interest, the method of successive approximations iteratively solves Equation (13).
- Step 3: The fitness function of Equation (10) is evaluated, which comprises the value of the original objective function (minimization of energy losses or reduction in CO2 emissions) and the constraints added through penalties. In simpler terms, the aim is to develop an indicator that notifies the presence of infeasible solutions. This way, it is possible to identify solutions that appear to be of excellent quality in terms of reductions yet violate voltage and/or load constraints. The best-case scenario for the fitness function is when it equals the objective function (zero penalties).
- End: Once the value of the fitness function has been determined, it is passed to the slave stage to continue the process, and this is repeated for each solution.
4. Test Systems
4.1. Thirty-Three-Node Radial Test System
4.2. Sixty-Nine-Node Radial Test System
4.3. Test System Adapted to the Characteristics of a Feeder in the City of Talca in Chile
- To select a test scenario, the literature suggests considering any reported system as a candidate for testing, as these systems have been created to replicate the behavior of real PDSs [14]. However, programmers must use their judgment to select the most appropriate one. In this case, the chosen candidate should represent the worst-case scenario in terms of voltage and/or load violations.
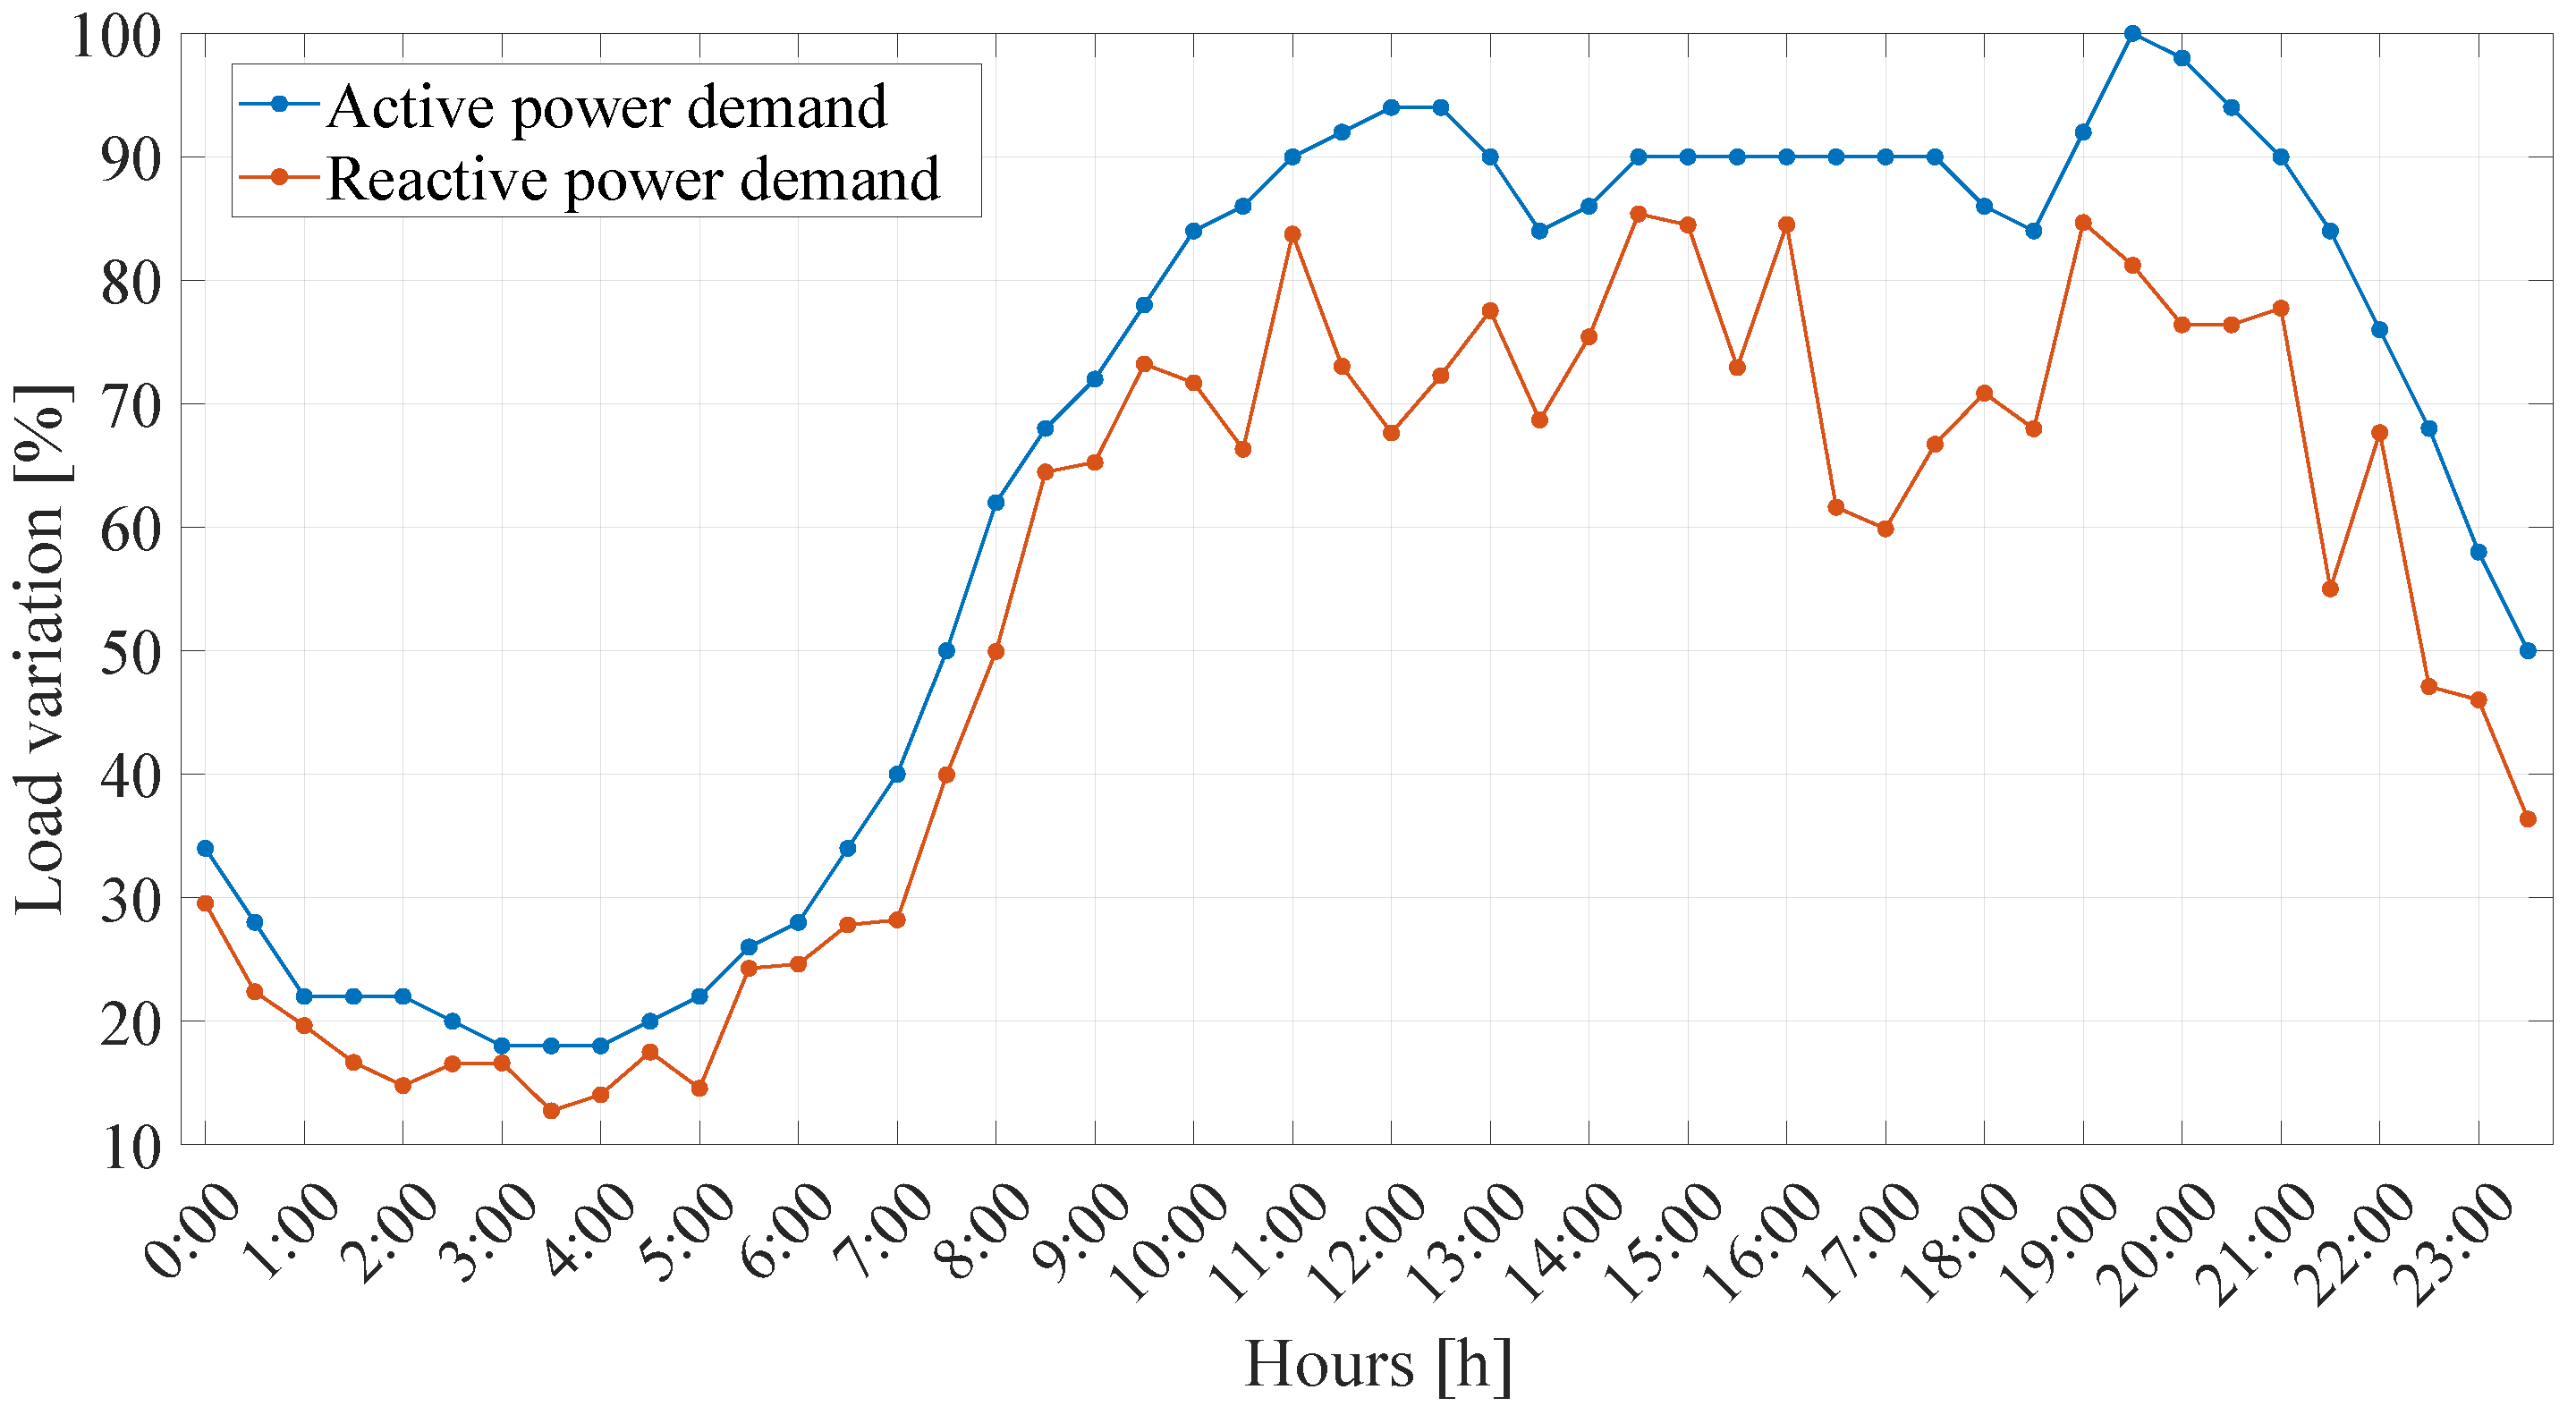
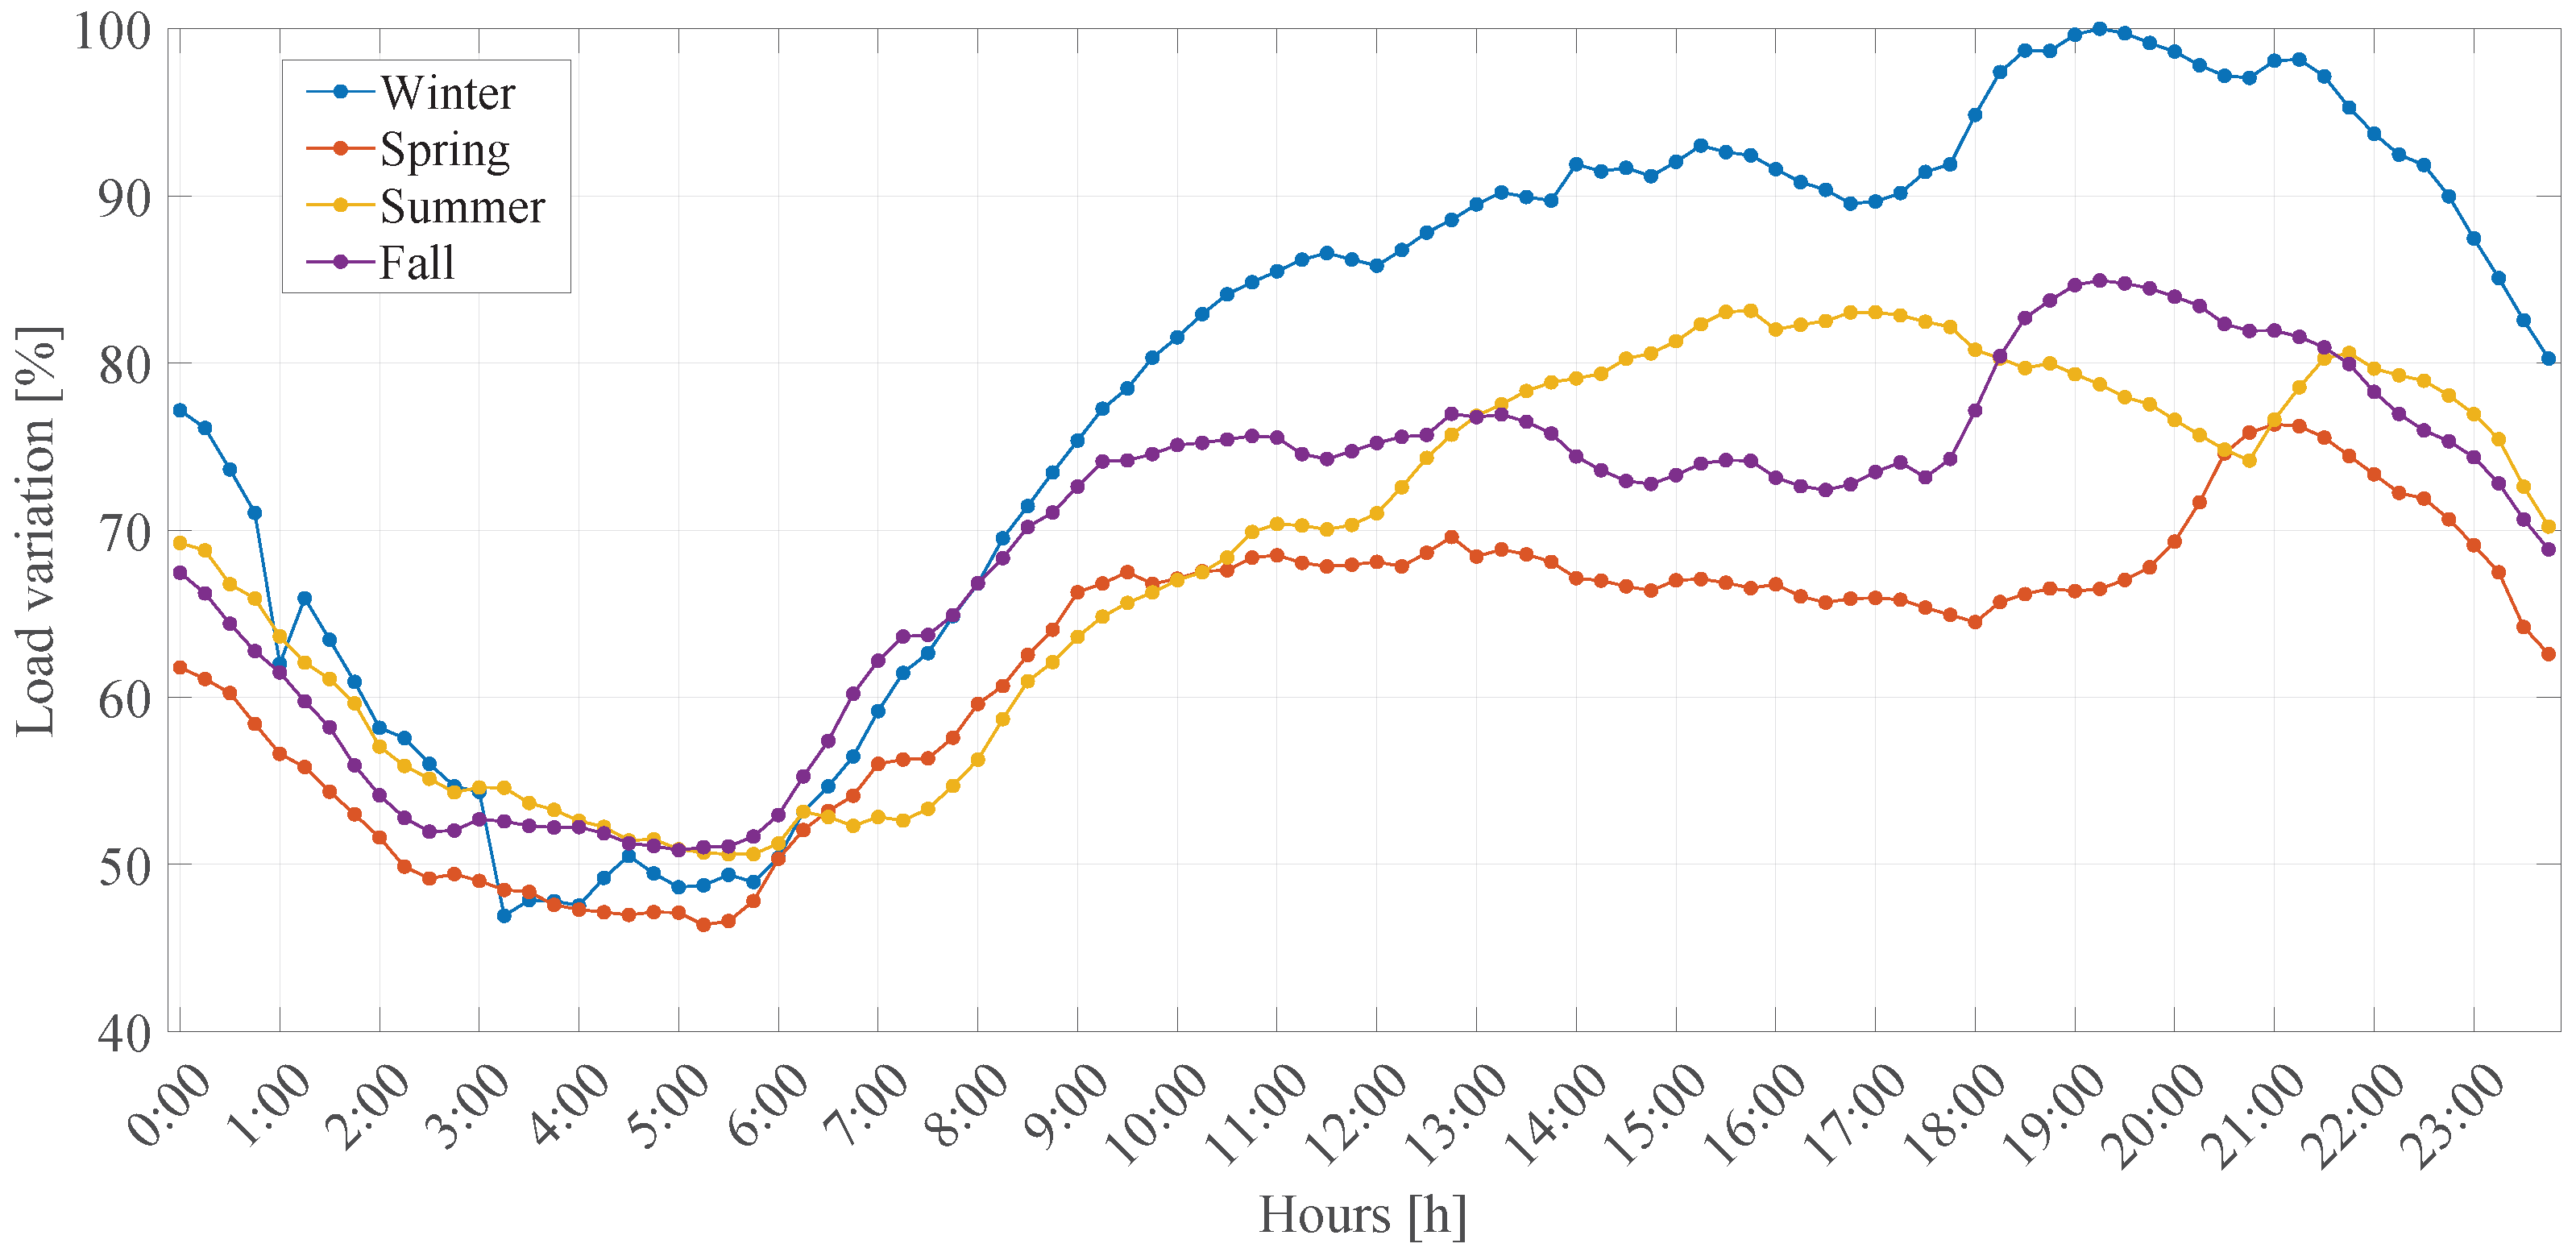
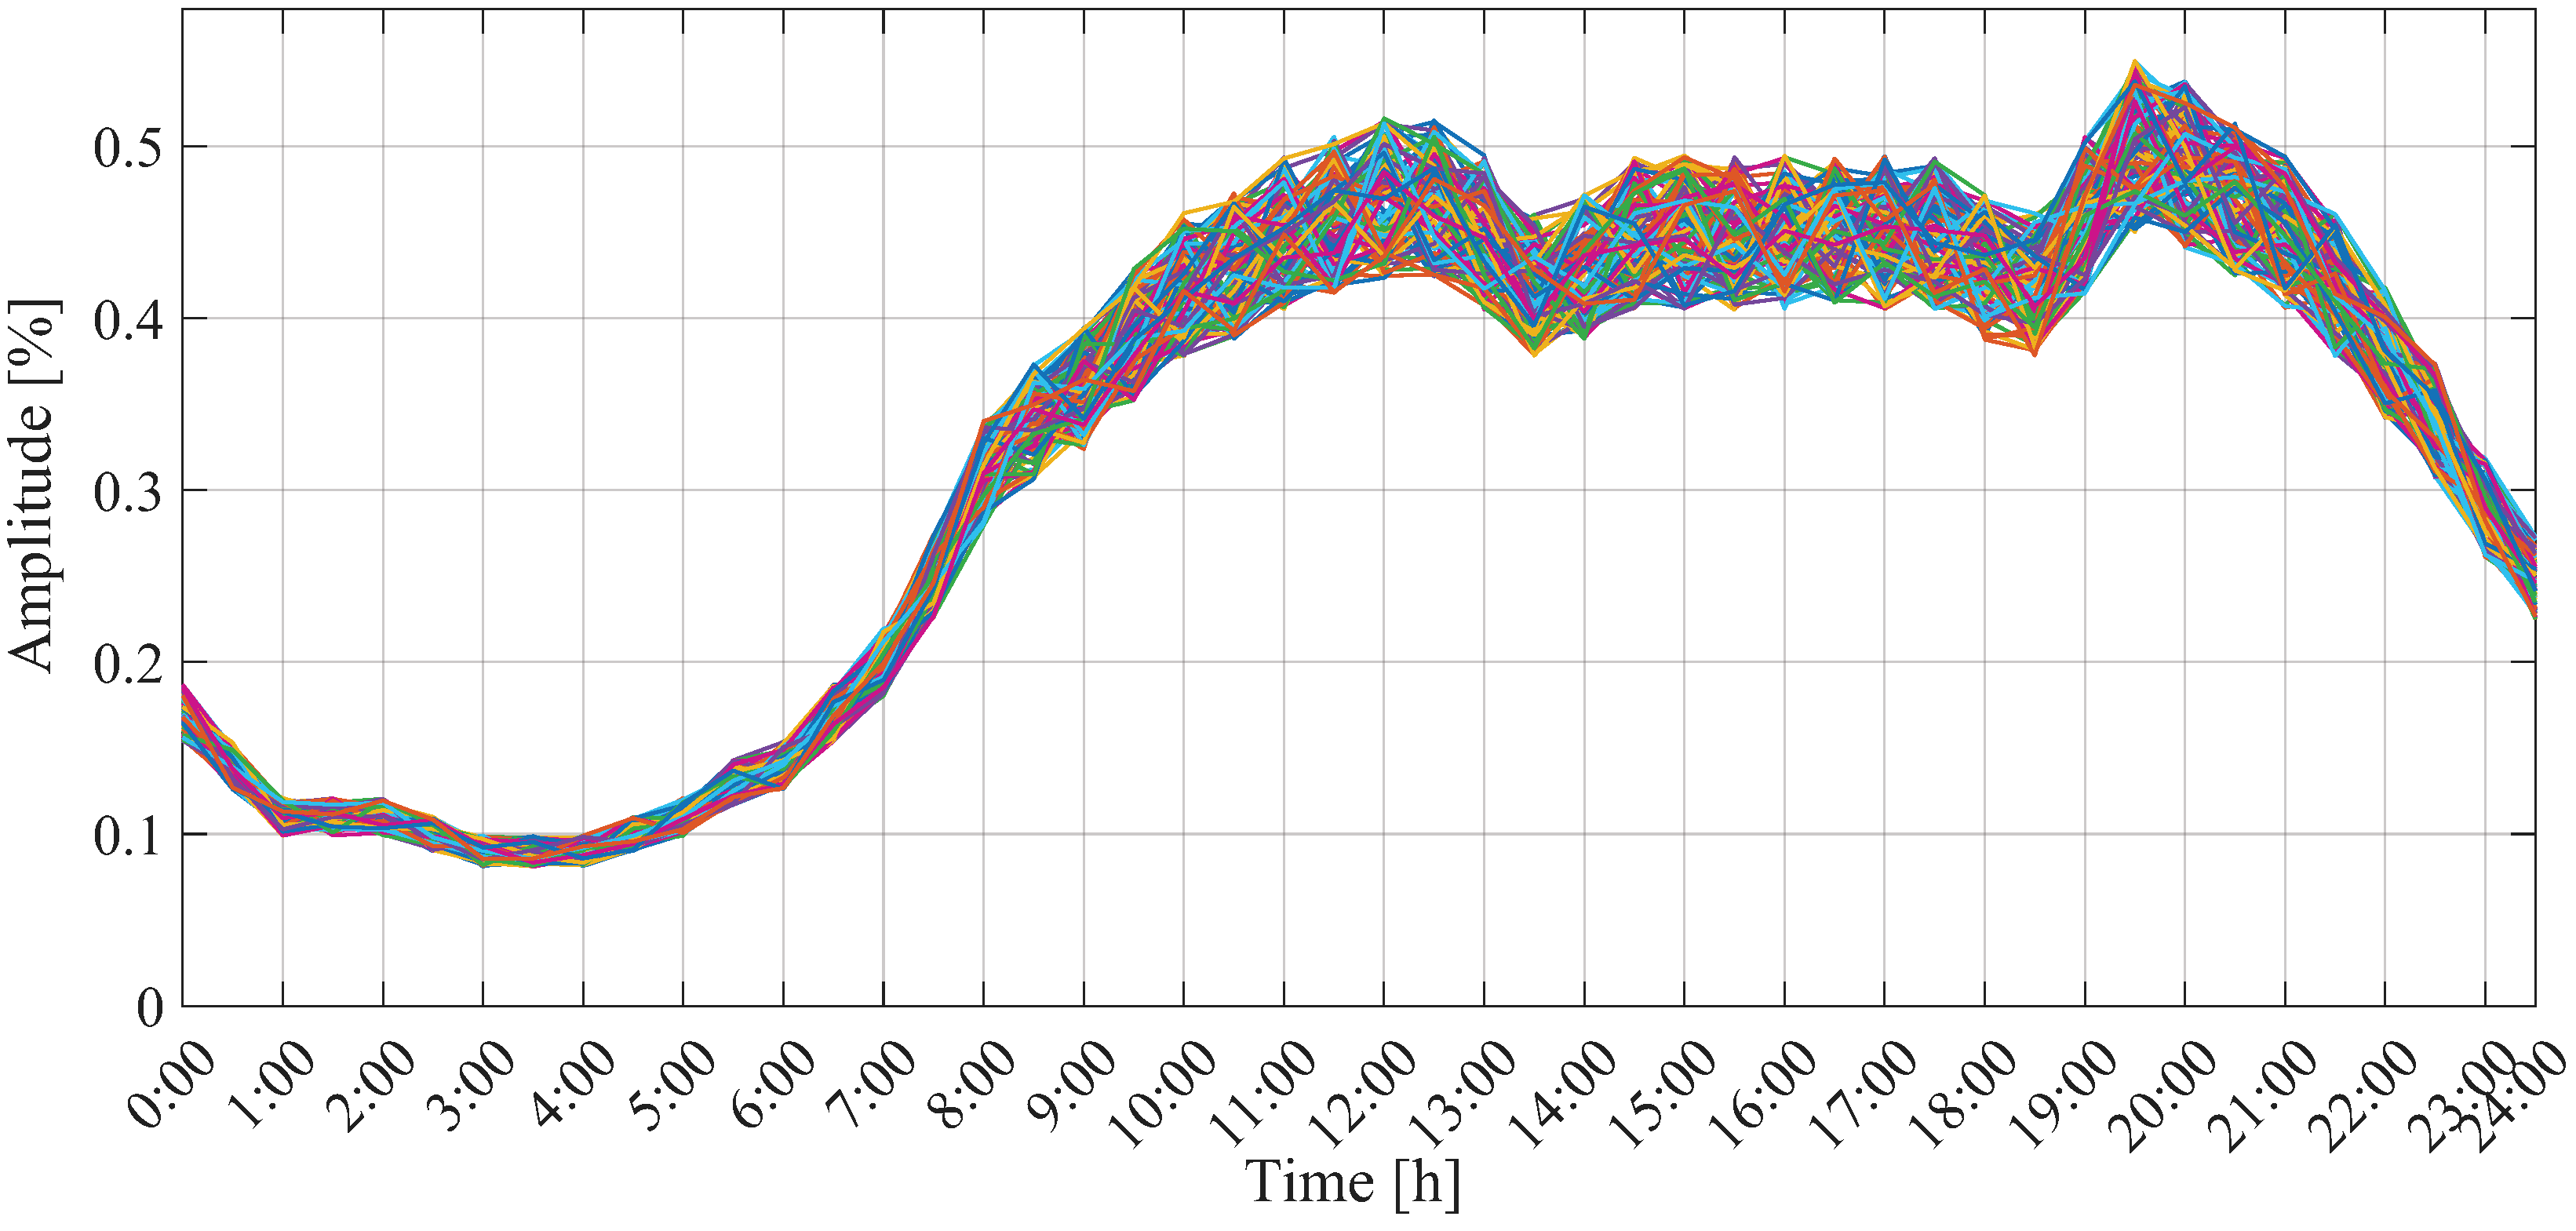
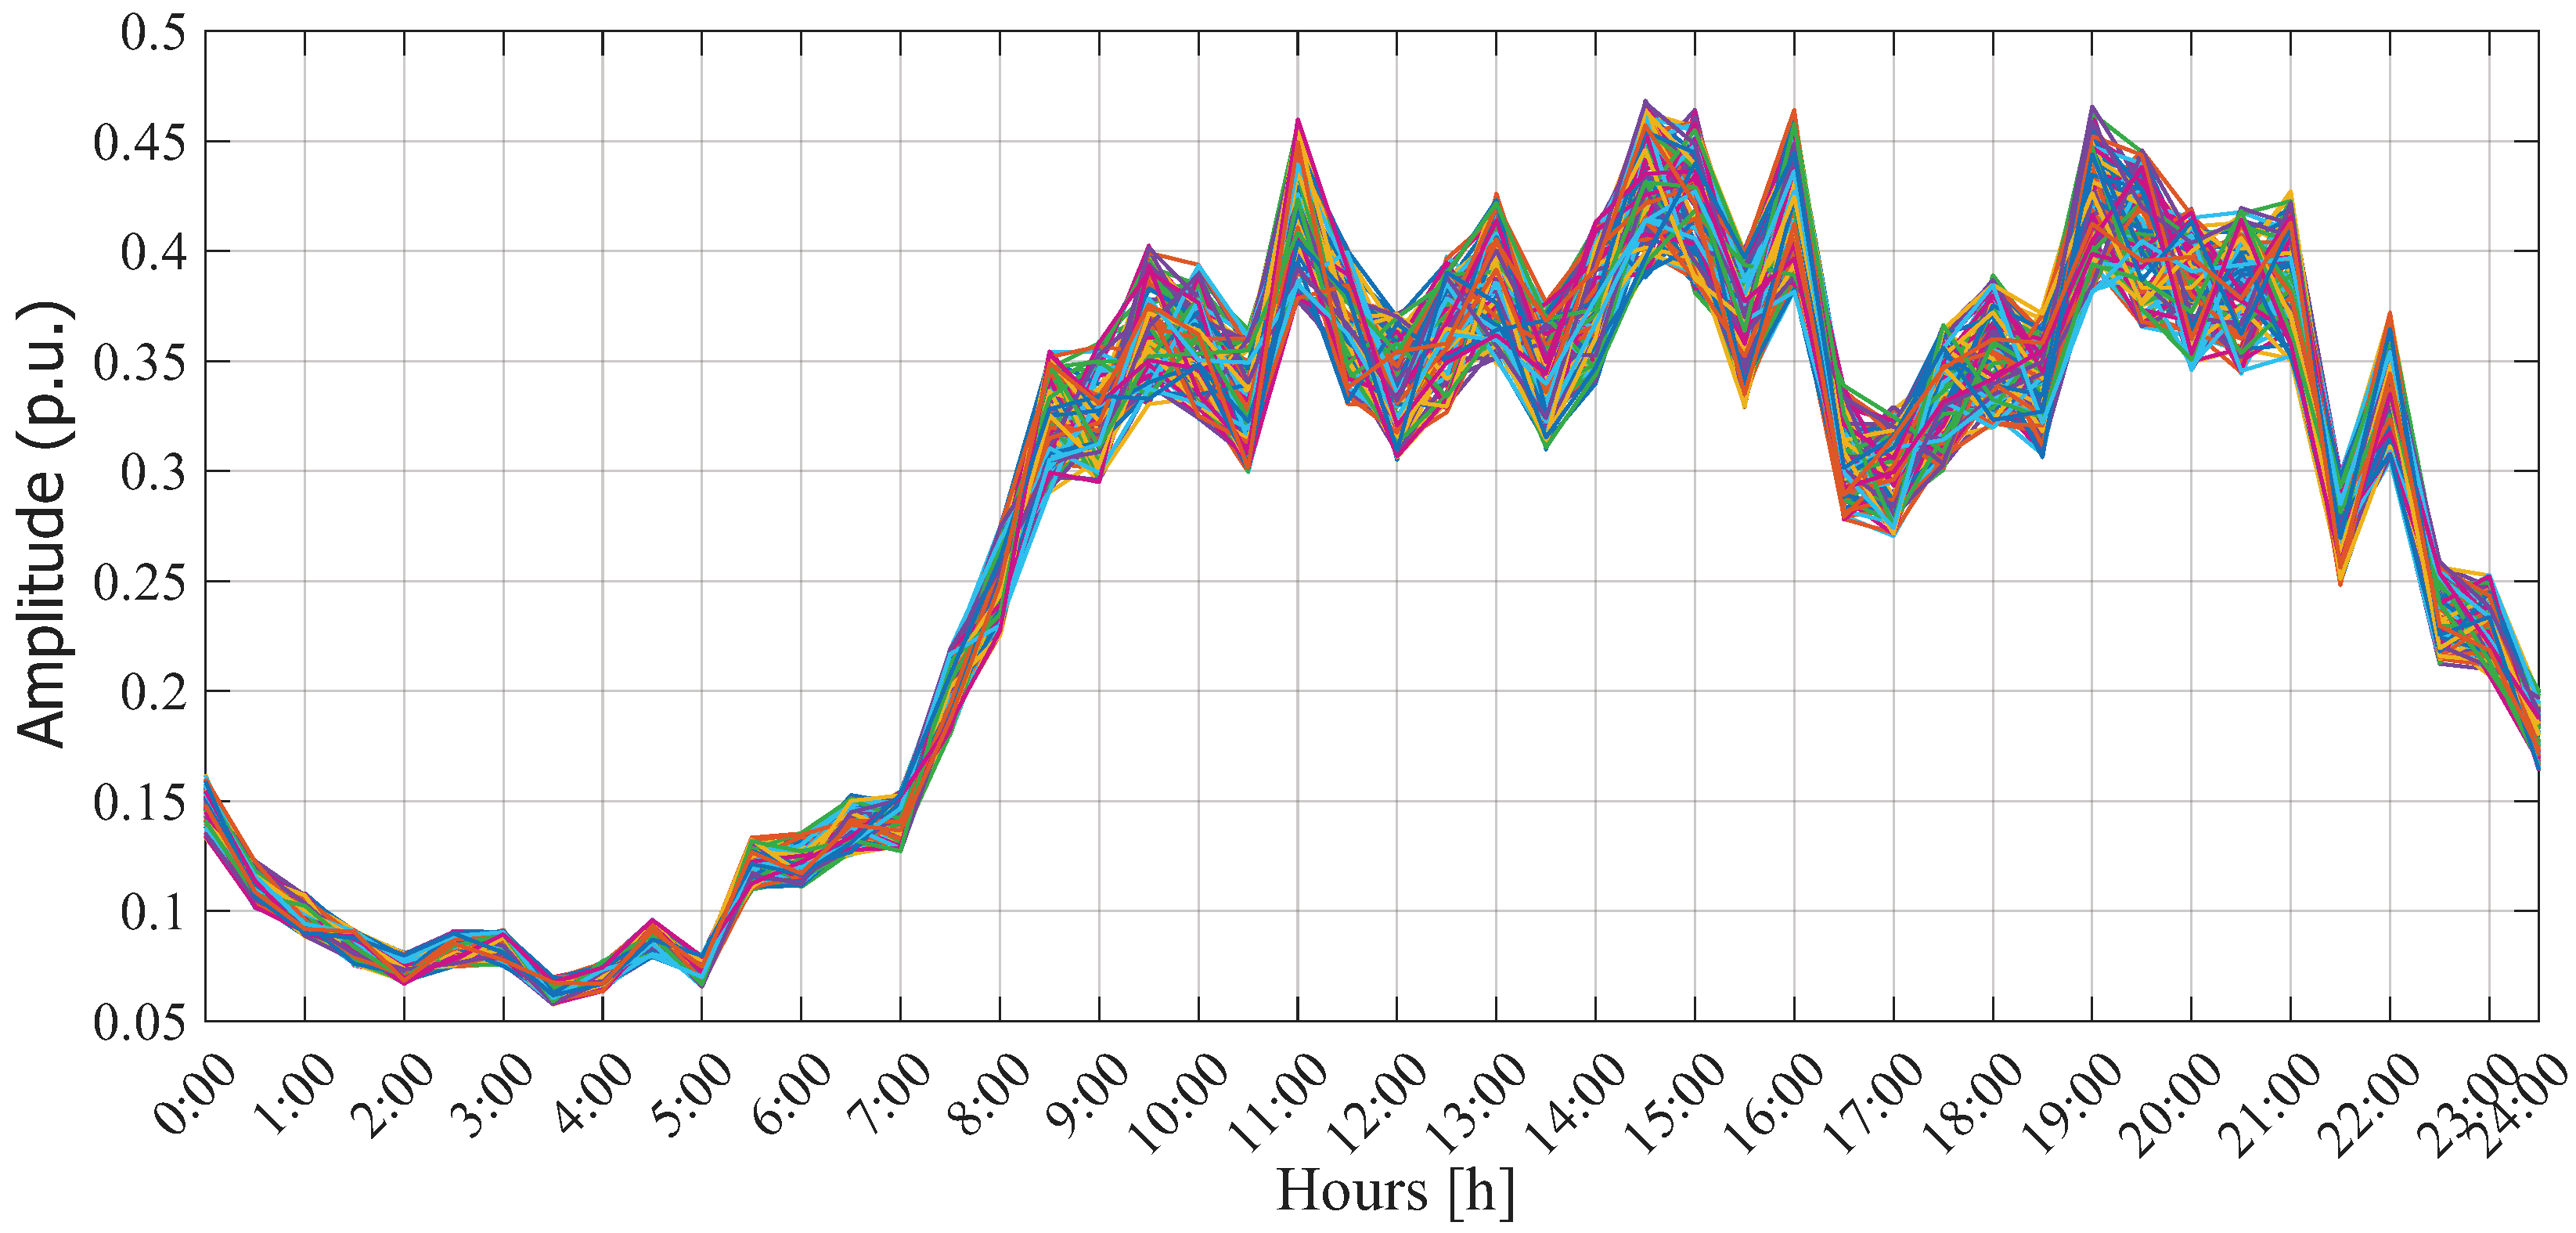
- According to Chilean regulations, the energy demand data of each feeder in Chile are available for access [53]. In this study, such data were used to replace the average demand curve of a Colombian PDS (see Figure 7). Although energy demand varies depending on the type of consumer (industrial, residential, or commercial), it is also influenced by the surrounding climatic conditions [54]. Hence, we here consider four different demand curves, one for each season (spring, summer, autumn, and winter).
- Since Talca’s feeder has four average demand curves, the current limit for each line must be recalculated by running an HPF that considers all four seasons. After this, we must select the highest currents throughout the year and follow the same procedure for conductor selection using RIC No. 4 [38].
- Another aspect worth mentioning regarding the demand curve is the time interval between measurements. In this adapted feeder, demand data are analyzed every 15 minutes, which modifies the encoding proposed in Section 3. In this case, a day of operation translates to 96 data points for each time period. Thus, the proposed encoding now includes a 1 × 288 vector, with each D-STATCOM injecting reactive power in a vector.
- The emission factor for conventional generators corresponds to that reported by the network operator in [55], i.e., 4.3278.
5. Simulation Results
5.1. Fine-Tuning
5.2. Results Obtained in the 33- and 69-Node Test Systems
5.2.1. Statistical Analysis
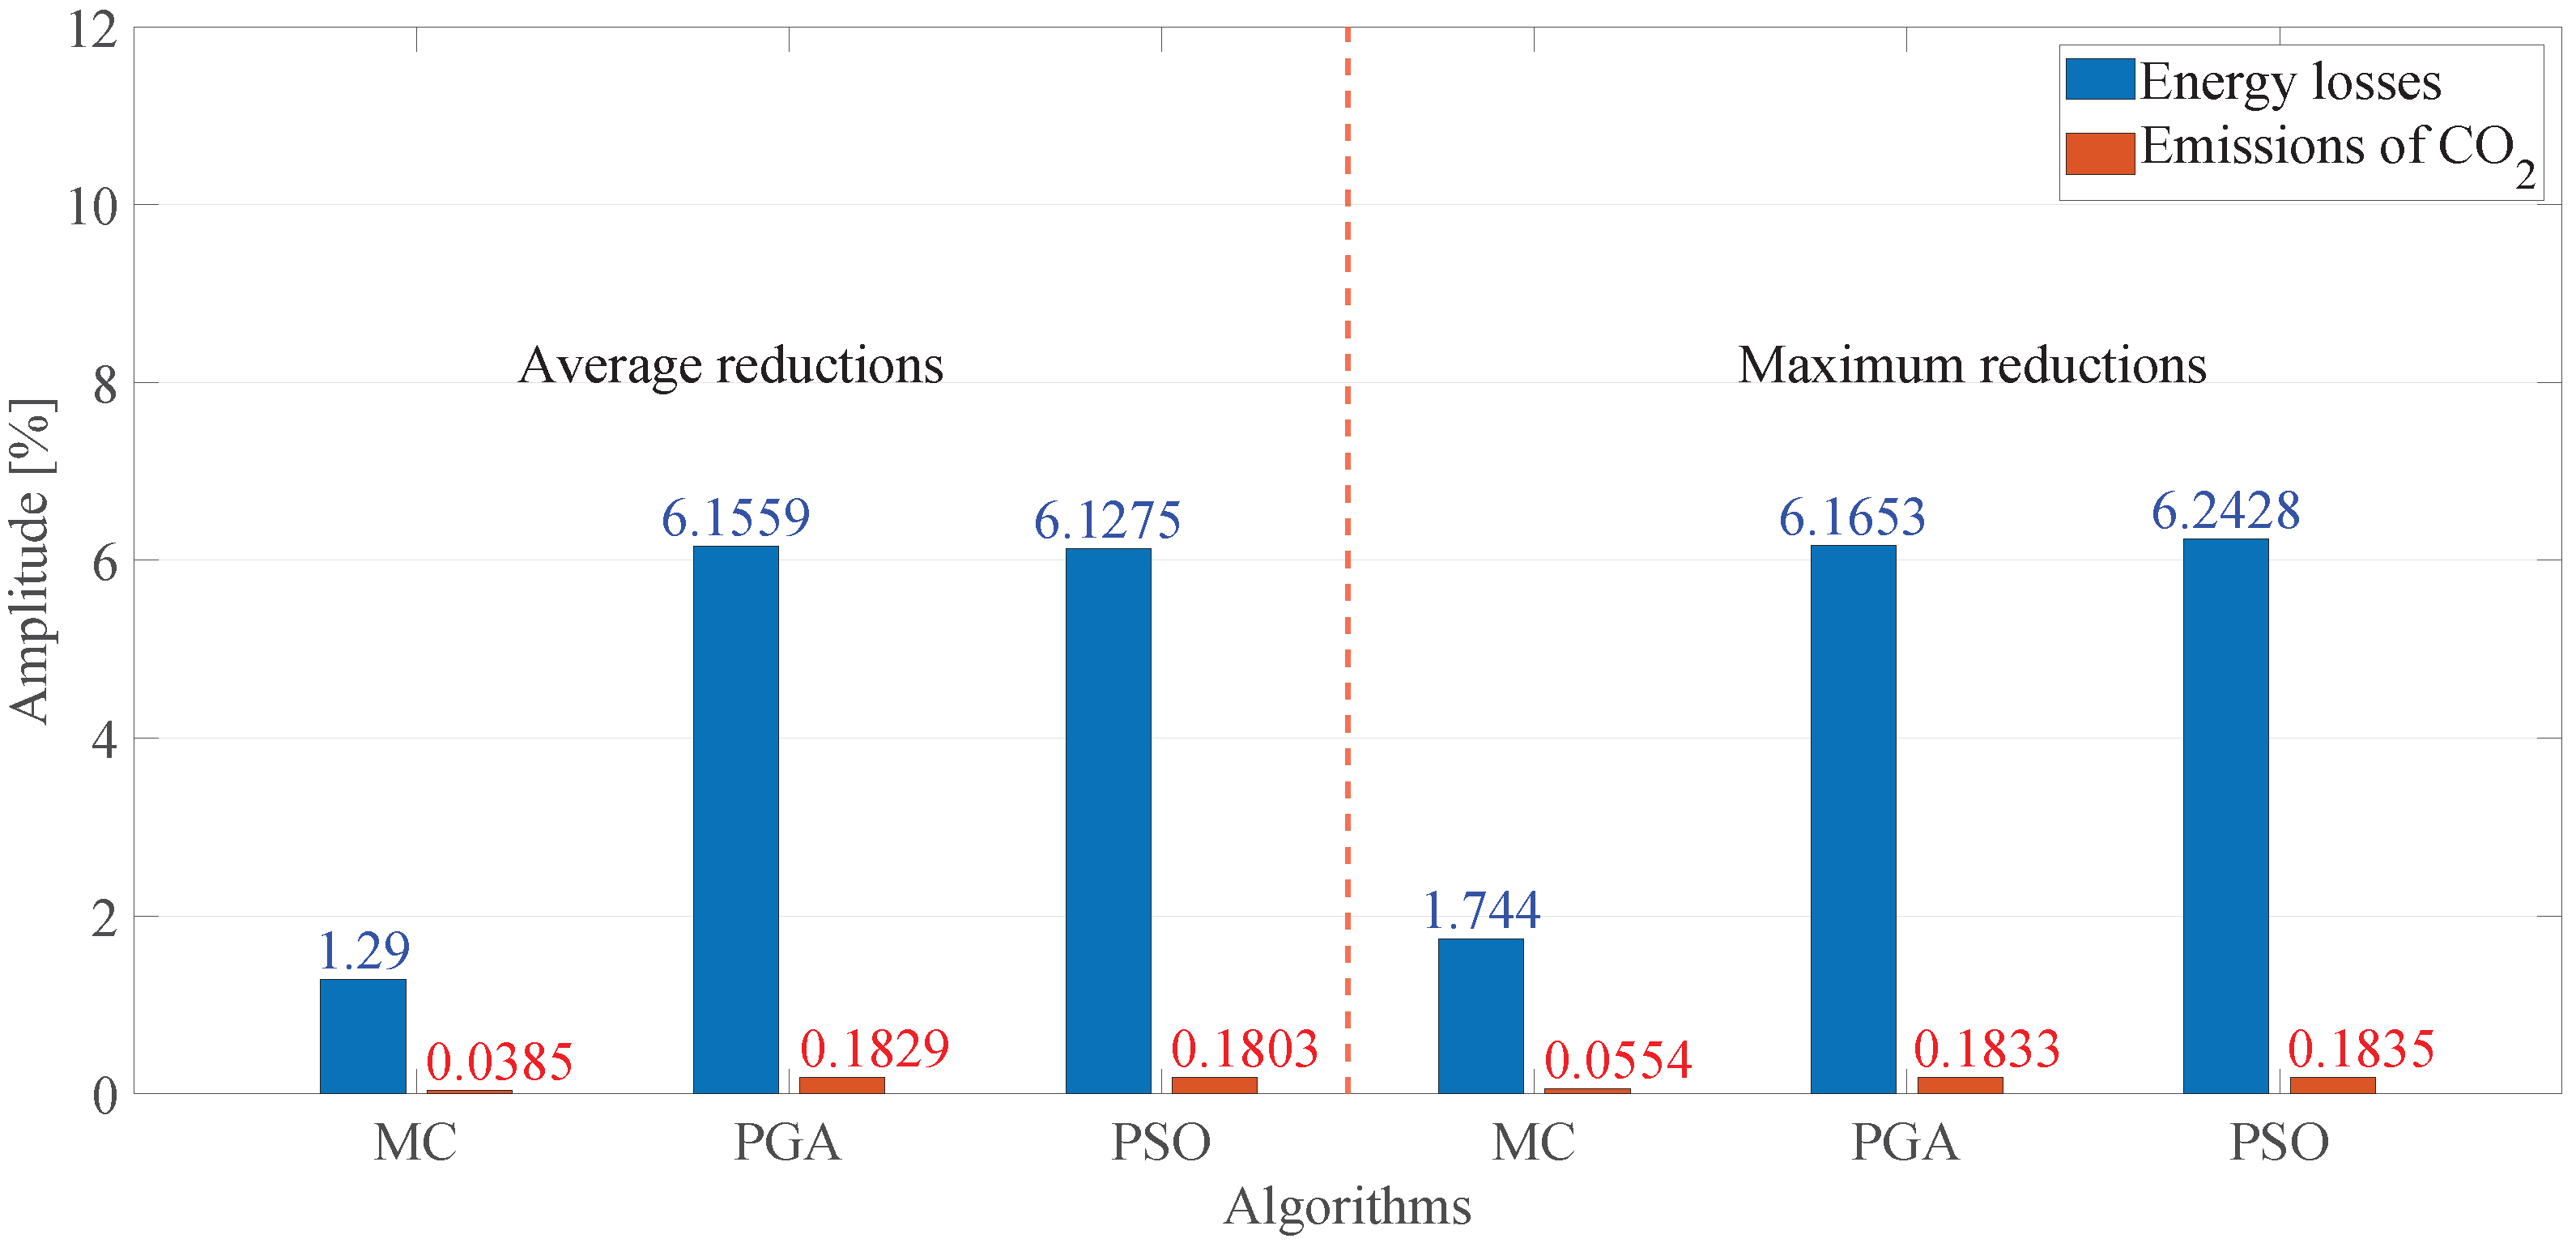
- When analyzing the performance of the algorithms after being executed 100 times, the PGA exhibited the best repeatability over time and obtained the lowest average reduction in both test systems and both objective functions. Regardless of processing time or the number of times the technique was run, it consistently outperformed the others. For the 33-node test system, it achieved an average reduction of 24.646% in energy losses and 0.9109% in CO2 emissions. In the case of the 69-node test system, it obtained an average reduction of 26.0823% in energy losses and 0.9784% in CO2 emissions.
- Regarding average standard deviation, the PGA was the best-performing technique, with an average value of 0.0026% in both test systems and both objective functions. Although it did not yield the best minimum solution in any case, it proved to be the most reliable strategy due to its minimum solution being very close to the average solution in all simulation scenarios, with an average accuracy of 0.0069% with respect to the best solution. This demonstrates the PGA’s superior performance in terms of repeatability, as its very small standard deviation ensures consistent results every time it is executed.
- Despite the PGA being the best technique in terms of solution quality, one of its major drawbacks was its average processing time. According to the results, it required an average processing time of 6438.5130 seconds in both test systems and for both objective functions. Importantly, since the problem under analysis involves dispatching power for an entire day, the PGA’s average processing time (1.78 h) is reasonable in the context of the 24-hour time horizon under analysis. This allows network operators to explore multiple scenarios in short processing times.
- The other methodologies also yielded positive results, occasionally outperforming the PGA. For instance, the PSO consistently provided the best solution in each study case. Notably, in the case of energy losses in the 69-node test system, it achieved reductions of 26.2104%. It also demonstrated a remarkable performance in terms of computational speed and the ability to find minimum solutions. It, however, showed a tendency to converge to local optima as the number of individuals and iterations increased, whereas the PGA maintained its effectiveness. The MC method, for its part, provided better solutions than those proposed in [14]—a study serving as a reference for this research. Still, due to its inherent stochastic nature, it did not consistently deliver high-quality solutions with repeatability over time. For the MC method, expanding the exploration space increases the likelihood of obtaining high-quality solutions but also extends processing times, as observed in the 69-node test system regarding reduction in CO2 emissions, where its average processing time exceeded three hours.
5.2.2. Graphical Analysis
- Thirty-Three-Node Test System
- Sixty-Nine-Node Test System
5.3. Uncertainty Analysis
5.4. Results Obtained in the Vaccaro Feeder
5.4.1. Statistical Analysis
5.4.2. Graphical Analysis
6. Results Analysis
6.1. Performance Evaluation in Test Scenarios
6.2. Comparison Between Optimization Techniques
6.3. Scalability and Processing Time
6.4. Adaptation to Real Operating Conditions
7. Conclusions
8. Future Works
Author Contributions
Funding
Institutional Review Board Statement
Informed Consent Statement
Data Availability Statement
Conflicts of Interest
Abbreviations
| Set of nodes in the power distribution system | |
| Set of time periods in the daily operation; 24 h intervals | |
| Indices for nodes in the network | |
| h | Index for time period |
| Nominal voltage base of the system [kV] | |
| Nominal apparent power base of the system [kVA] | |
| Time interval duration [h] | |
| CO2 emission factor of generator at node i | |
| Minimum allowable voltages at node i | |
| maximum allowable voltages at node i | |
| Maximum allowable current through line [A] | |
| Minimum reactive power limits of D-STATCOMs [kvar] | |
| Maximun reactive power limits of D-STATCOMs [kvar] | |
| Voltage magnitude at node i during time h [p.u.] | |
| Voltage angle at node i during time h [rad] | |
| Active power injected at node i in time h [kW] | |
| Active power demanded at node i in time h [kW] | |
| Reactive power injected at node i in time h [kvar] | |
| Reactive power demanded at node i in time h [kvar] | |
| Reactive power injected by the D-STATCOM at node i in time h [kvar] | |
| Current magnitude through line at time h [A] | |
| Magnitude of admittance between nodes i and j | |
| Phase angle of admittance between nodes i and j | |
| Total active power losses in the network [kWh] | |
| Total CO2 emissions [kgCO2] | |
| Objective function to minimize energy losses | |
| Objective function to minimize CO2 emissions |
Appendix A. Parameter Information of the 33- and 69-Bus Grids
| Line l | Node i | Node j | ] | ] | [kW] | [kvar] | [A] |
|---|---|---|---|---|---|---|---|
| 1 | 1 | 2 | 0.0922 | 0.0477 | 100 | 60 | 410 |
| 2 | 2 | 3 | 0.4930 | 0.2511 | 90 | 40 | 410 |
| 3 | 3 | 4 | 0.3660 | 0.1864 | 120 | 80 | 266 |
| 4 | 4 | 5 | 0.3811 | 0.1941 | 60 | 30 | 266 |
| 5 | 5 | 6 | 0.8190 | 0.7070 | 60 | 20 | 266 |
| 6 | 6 | 7 | 0.1872 | 0.6188 | 200 | 100 | 99 |
| 7 | 7 | 8 | 1.7114 | 1.2351 | 200 | 100 | 99 |
| 8 | 8 | 9 | 1.0300 | 0.7400 | 60 | 20 | 99 |
| 9 | 9 | 10 | 1.0400 | 0.7400 | 60 | 20 | 99 |
| 10 | 10 | 11 | 0.1966 | 0.0650 | 45 | 30 | 99 |
| 11 | 11 | 12 | 0.3744 | 0.1238 | 60 | 35 | 99 |
| 12 | 12 | 13 | 1.4680 | 1.1550 | 60 | 35 | 99 |
| 13 | 13 | 14 | 0.5416 | 0.7129 | 120 | 80 | 99 |
| 14 | 14 | 15 | 0.5910 | 0.5260 | 60 | 10 | 99 |
| 15 | 15 | 16 | 0.7463 | 0.5450 | 60 | 20 | 99 |
| 16 | 16 | 17 | 1.2890 | 1.7210 | 60 | 20 | 99 |
| 17 | 17 | 18 | 0.7320 | 0.5740 | 90 | 40 | 99 |
| 18 | 2 | 19 | 0.1640 | 0.1565 | 90 | 40 | 99 |
| 19 | 19 | 20 | 1.5042 | 1.3554 | 90 | 40 | 99 |
| 20 | 20 | 21 | 0.4095 | 0.4784 | 90 | 40 | 99 |
| 21 | 21 | 22 | 0.7089 | 0.9373 | 90 | 40 | 99 |
| 22 | 3 | 23 | 0.4512 | 0.3083 | 90 | 50 | 99 |
| 23 | 23 | 24 | 0.8980 | 0.7091 | 420 | 200 | 99 |
| 24 | 24 | 25 | 0.8960 | 0.7011 | 420 | 200 | 99 |
| 25 | 6 | 26 | 0.2030 | 0.1034 | 60 | 25 | 114 |
| 26 | 26 | 27 | 0.2842 | 0.1447 | 60 | 25 | 99 |
| 27 | 27 | 28 | 1.0590 | 0.9337 | 60 | 20 | 99 |
| 28 | 28 | 29 | 0.8042 | 0.7006 | 120 | 70 | 99 |
| 29 | 29 | 30 | 0.5075 | 0.2585 | 200 | 600 | 99 |
| 30 | 30 | 31 | 0.9744 | 0.9630 | 150 | 70 | 99 |
| 31 | 31 | 32 | 0.3105 | 0.3619 | 210 | 100 | 99 |
| 32 | 32 | 33 | 0.3410 | 0.5302 | 60 | 40 | 99 |
| Line l | Node i | Node j | ] | ] | [kW] | [kvar] | [A] |
|---|---|---|---|---|---|---|---|
| 1 | 1 | 2 | 0.00054 | 0.00126 | 0.00 | 0.00 | 410 |
| 2 | 2 | 3 | 0.00050 | 0.00120 | 0.00 | 0.00 | 410 |
| 3 | 3 | 4 | 0.00150 | 0.00360 | 0.00 | 0.00 | 410 |
| 4 | 4 | 5 | 0.02510 | 0.02940 | 0.00 | 0.00 | 266 |
| 5 | 5 | 6 | 0.36600 | 0.18640 | 2.60 | 2.20 | 266 |
| 6 | 6 | 7 | 0.38110 | 0.19410 | 40.40 | 30.00 | 266 |
| 7 | 7 | 8 | 0.09220 | 0.04700 | 75.00 | 54.00 | 266 |
| 8 | 8 | 9 | 0.04930 | 0.02510 | 30.00 | 22.00 | 266 |
| 9 | 9 | 10 | 0.81900 | 0.27070 | 28.00 | 19.00 | 99 |
| 10 | 10 | 11 | 0.18720 | 0.06190 | 145.00 | 104.00 | 99 |
| 11 | 11 | 12 | 0.71140 | 0.23510 | 145.00 | 104.00 | 99 |
| 12 | 12 | 13 | 1.03000 | 0.34000 | 8.00 | 5.00 | 99 |
| 13 | 13 | 14 | 1.04400 | 0.34500 | 8.00 | 5.00 | 99 |
| 14 | 14 | 15 | 1.05800 | 0.34960 | 0.00 | 0.00 | 99 |
| 15 | 15 | 16 | 0.19660 | 0.06500 | 45.00 | 30.00 | 99 |
| 16 | 16 | 17 | 0.37440 | 0.12380 | 60.00 | 35.00 | 99 |
| 17 | 17 | 18 | 0.00470 | 0.00160 | 60.00 | 35.00 | 99 |
| 18 | 18 | 19 | 0.32760 | 0.10830 | 0.00 | 0.00 | 99 |
| 19 | 19 | 20 | 0.21060 | 0.06900 | 1.00 | 0.60 | 99 |
| 20 | 20 | 21 | 0.34160 | 0.11290 | 114.00 | 81.00 | 99 |
| 21 | 21 | 22 | 0.01400 | 0.00460 | 5.00 | 3.50 | 99 |
| 22 | 22 | 23 | 0.15910 | 0.05260 | 0.00 | 0.00 | 99 |
| 23 | 23 | 24 | 0.34630 | 0.11450 | 28.00 | 20.00 | 99 |
| 24 | 24 | 25 | 0.74880 | 0.24750 | 0.00 | 0.00 | 99 |
| 25 | 25 | 26 | 0.30890 | 0.10210 | 14.00 | 10.00 | 99 |
| 26 | 26 | 27 | 0.17320 | 0.05720 | 14.00 | 10.00 | 99 |
| 27 | 3 | 28 | 0.00440 | 0.01080 | 26.00 | 18.60 | 99 |
| 28 | 28 | 29 | 0.06400 | 0.15650 | 26.00 | 18.60 | 99 |
| 29 | 29 | 30 | 0.39780 | 0.13150 | 0.00 | 0.00 | 99 |
| 30 | 30 | 31 | 0.07020 | 0.02320 | 0.00 | 0.00 | 99 |
| 31 | 31 | 32 | 0.35100 | 0.11600 | 0.00 | 0.00 | 99 |
| 32 | 32 | 33 | 0.83900 | 0.28160 | 10.00 | 10.00 | 99 |
| 33 | 33 | 34 | 1.70800 | 0.56460 | 14.00 | 14.00 | 99 |
| 34 | 34 | 35 | 1.47400 | 0.48730 | 4.00 | 4.00 | 99 |
| 35 | 3 | 36 | 0.00440 | 0.01080 | 26.00 | 18.55 | 99 |
| 36 | 36 | 37 | 0.06400 | 0.15650 | 26.00 | 18.55 | 99 |
| 37 | 37 | 38 | 0.10530 | 0.12300 | 0.00 | 0.00 | 99 |
| 38 | 38 | 39 | 0.03040 | 0.03550 | 24.00 | 17.00 | 99 |
| 39 | 39 | 40 | 0.00180 | 0.00210 | 24.00 | 17.00 | 99 |
| 40 | 40 | 41 | 0.72830 | 0.85090 | 102.00 | 1.00 | 99 |
| 41 | 41 | 42 | 0.31000 | 0.36230 | 0.00 | 0.00 | 99 |
| 42 | 42 | 43 | 0.04100 | 0.04780 | 6.00 | 4.30 | 99 |
| 43 | 43 | 44 | 0.00920 | 0.01160 | 0.00 | 0.00 | 99 |
| 44 | 44 | 45 | 0.10890 | 0.13730 | 39.22 | 26.30 | 99 |
| 45 | 45 | 46 | 0.00090 | 0.00120 | 39.22 | 26.30 | 99 |
| 46 | 4 | 47 | 0.00340 | 0.00840 | 0.00 | 0.00 | 99 |
| 47 | 47 | 48 | 0.08510 | 0.20830 | 79.00 | 56.40 | 99 |
| 48 | 48 | 49 | 0.28980 | 0.70910 | 384.70 | 274.50 | 99 |
| 49 | 49 | 50 | 0.08220 | 0.20110 | 384.70 | 274.50 | 99 |
| 50 | 8 | 51 | 0.09280 | 0.04730 | 40.50 | 28.30 | 99 |
| 51 | 51 | 52 | 0.33190 | 0.11400 | 3.60 | 2.70 | 99 |
| 52 | 9 | 53 | 0.17400 | 0.08860 | 4.35 | 3.50 | 195 |
| 53 | 53 | 54 | 0.20300 | 0.10340 | 26.40 | 19.00 | 195 |
| 54 | 54 | 55 | 0.28420 | 0.14470 | 24.00 | 17.20 | 195 |
| 55 | 55 | 56 | 0.28130 | 0.14330 | 0.00 | 0.00 | 195 |
| 56 | 56 | 57 | 1.59000 | 0.53370 | 0.00 | 0.00 | 195 |
| 57 | 57 | 58 | 0.78370 | 0.26300 | 0.00 | 0.00 | 195 |
| 58 | 58 | 59 | 0.30420 | 0.10060 | 100.00 | 72.00 | 195 |
| 59 | 59 | 60 | 0.38610 | 0.11720 | 0.00 | 0.00 | 195 |
| 60 | 60 | 61 | 0.50750 | 0.25850 | 1244.00 | 888.00 | 195 |
| 61 | 61 | 62 | 0.09740 | 0.04960 | 32.00 | 23.00 | 99 |
| 62 | 62 | 63 | 0.14500 | 0.07380 | 0.00 | 0.00 | 99 |
| 63 | 63 | 64 | 0.71050 | 0.36190 | 227.00 | 162.00 | 99 |
| 64 | 64 | 65 | 1.04100 | 0.53020 | 59.00 | 42.00 | 99 |
| 65 | 11 | 66 | 0.20120 | 0.06110 | 18.00 | 13.00 | 99 |
| 66 | 66 | 67 | 0.00470 | 0.00140 | 18.00 | 13.00 | 99 |
| 67 | 12 | 68 | 0.73940 | 0.24440 | 28.00 | 20.00 | 99 |
| 68 | 68 | 69 | 0.00470 | 0.00160 | 28.00 | 20.00 | 99 |
References
- Sallam, A.A.; Malik, O.P. Electric Distribution Systems; Power Systems; Wiley-IEEE Press: Hoboken, NJ, USA, 2018. [Google Scholar]
- Morón, J.A.Y. Sistemas Eléctricos de Distribución; Reverté: Barcelona, Spain, 2021. [Google Scholar]
- Montoya, O.D.; Molina-Cabrera, A.; Chamorro, H.R.; Alvarado-Barrios, L.; Rivas-Trujillo, E. A Hybrid approach based on SOCP and the discrete version of the SCA for optimal placement and sizing DGs in AC distribution networks. Electronics 2020, 10, 26. [Google Scholar] [CrossRef]
- Tolabi, H.B.; Ali, M.H.; Rizwan, M. Simultaneous reconfiguration, optimal placement of DSTATCOM, and photovoltaic array in a distribution system based on fuzzy-ACO approach. IEEE Trans. Sustain. Energy 2014, 6, 210–218. [Google Scholar] [CrossRef]
- Gil-González, W.; Montoya, O.D.; Rajagopalan, A.; Grisales-Noreña, L.F.; Hernández, J.C. Optimal selection and location of fixed-step capacitor banks in distribution networks using a discrete version of the vortex search algorithm. Energies 2020, 13, 4914. [Google Scholar] [CrossRef]
- Yu, Y.; Zhu, G.; Zhang, Q.; Behzadnia, M.; Yang, Z.; Liu, Y.; Xie, J. Multinonmetal-Doped V2O5 Nanocomposites for Lithium-Ion Battery Cathodes. ACS Appl. Energy Mater. 2024, 7, 11031–11037. [Google Scholar] [CrossRef]
- Soleimani, A.; Roghanian, P.; Heidari, M.; Heidari, M.; Pinnarelli, A.; Vizza, P.; Mahdavi, M.; Mousavi, S.F. Refining Hybrid Energy Systems: Elevating PV Sustainability, Cutting Emissions, and Maximizing Battery Cost Efficiency in Remote Areas. Energy Nexus 2025, 8, 100452. [Google Scholar] [CrossRef]
- Sultana, B.; Mustafa, M.; Sultana, U.; Bhatti, A.R. Review on reliability improvement and power loss reduction in distribution system via network reconfiguration. Renew. Sustain. Energy Rev. 2016, 66, 297–310. [Google Scholar] [CrossRef]
- Jordehi, A.R. Allocation of distributed generation units in electric power systems: A review. Renew. Sustain. Energy Rev. 2016, 56, 893–905. [Google Scholar] [CrossRef]
- Paredes Martínez, G.E. Metodologías de proyección de demanda y evaluación del impacto de vehículos eléctricos en redes de distribución. Appl. Sci. 2022, 12, 2341. [Google Scholar]
- Riquelme, P.J. Tecnologías para la Transmisión. In Estudio de Nuevas Tecnologías; Universidad de Chile: Santiago, Chile, 2012; p. 25. [Google Scholar]
- Barreto-Parra, G.F.; Cortés-Caicedo, B.; Montoya, O.D. Optimal Integration of D-STATCOMs in Radial and Meshed Distribution Networks Using a MATLAB-GAMS Interface. Algorithms 2023, 16, 138. [Google Scholar] [CrossRef]
- Nacional, C.E. Reportes Mensuales PMGD. 2023. Available online: https://www.coordinador.cl/desarrollo/documentos/gestion-de-proyectos/pequenos-medios-generacion-distribuida/reportes-mensuales-pmgd/ (accessed on 19 April 2023).
- Grisales-Noreña, L.F.; Montoya, O.D.; Hernández, J.C.; Ramos-Paja, C.A.; Perea-Moreno, A.J. A Discrete-Continuous PSO for the Optimal Integration of D-STATCOMs into Electrical Distribution Systems by Considering Annual Power Loss and Investment Costs. Mathematics 2022, 10, 2453. [Google Scholar] [CrossRef]
- Sirjani, R.; Jordehi, A.R. Optimal placement and sizing of distribution static compensator (D-STATCOM) in electric distribution networks: A review. Renew. Sustain. Energy Rev. 2017, 77, 688–694. [Google Scholar] [CrossRef]
- Beas Rabah, F.J. Evaluación de un compensador estático de reactivos en redes de distribución con centrales PMGD. Appl. Sci. 2014, 4, 112–125. [Google Scholar]
- Sayahi, K.; Bouallegue, B.; Bacha, F.; Barhoumi, E.M. Implementation of a D-STATCOM and Active Power Filter Control Strategy–Based on Virtual Flux Direct Power Control Technique for an Electrical Energy Quality Improvement. Int. J. Energy Res. 2025, 2025, 9910095. [Google Scholar] [CrossRef]
- Satyanrayana, M.; Veeramsetty, V.; Rajababu, D. Power Quality Issues Classification and Mitigation Techniques in Power System. In Advanced Computation Solutions for Energy Efficiency; Springer: Berlin, Germany, 2025; pp. 183–216. [Google Scholar]
- Banerji, A.; Biswas, S.K.; Singh, B. DSTATCOM control algorithms: A review. Int. J. Power Electron. Drive Syst. 2012, 2, 285. [Google Scholar] [CrossRef]
- Montoya, O.D.; Gil-González, W.; Hernández, J.C. Efficient Operative Cost Reduction in Distribution Grids Considering the Optimal Placement and Sizing of D-STATCOMs Using a Discrete-Continuous VSA. Appl. Sci. 2021, 11, 2175. [Google Scholar] [CrossRef]
- Salkuti, S.R. An efficient allocation of D-STATCOM and DG with network reconfiguration in distribution networks. Int. J. Adv. Technol. Eng. Explor. 2022, 9, 299. [Google Scholar]
- Cortés-Caicedo, B.; Molina-Martin, F.; Grisales-Noreña, L.F.; Montoya, O.D.; Hernández, J.C. Optimal design of PV Systems in electrical distribution networks by minimizing the annual equivalent operative costs through the discrete-continuous vortex search algorithm. Sensors 2022, 22, 851. [Google Scholar] [CrossRef]
- Montoya, O.D.; Grisales-Noreña, L.F.; Ramos-Paja, C.A. Optimal allocation and sizing of PV generation units in distribution networks via the generalized normal distribution optimization approach. Computers 2022, 11, 53. [Google Scholar] [CrossRef]
- Zare, P.; Davoudkhani, I.F.; Mohajery, R.; Zare, R.; Ghadimi, H.; Ebtehaj, M. Multi-Objective Coordinated Optimal Allocation of Distributed Generation and D-STATCOM in Electrical Distribution Networks Using Ebola Optimization Search Algorithm. In Proceedings of the 2023 8th International Conference on Technology and Energy Management (ICTEM), Babol, Iran, 8–9 February 2023; IEEE: Piscataway, NJ, USA, 2023; pp. 1–7. [Google Scholar]
- Eroğlu, F.; Kurtoğlu, M.; Eren, A.; Vural, A.M. Multi-objective control strategy for multilevel converter based battery D-STATCOM with power quality improvement. Appl. Energy 2023, 341, 121091. [Google Scholar] [CrossRef]
- Belhamidi, M.; Lakdja, F.; Guentri, H.; Boumediene, L.; Yahiaoui, M. Reactive Power Control of D-STATCOM in a Power Grid with Integration of the Wind Power. J. Electr. Eng. Technol. 2023, 18, 205–212. [Google Scholar] [CrossRef]
- Han, T.; Chen, Y.; Ma, J.; Zhao, Y.; Chi, Y.y. Surrogate modeling-based multi-objective dynamic VAR planning considering short-term voltage stability and transient stability. IEEE Trans. Power Syst. 2017, 33, 622–633. [Google Scholar] [CrossRef]
- Han, T.; Chen, Y.; Ma, J. Multi-objective robust dynamic VAR planning in power transmission girds for improving short-term voltage stability under uncertainties. IET Gener. Transm. Distrib. 2018, 12, 1929–1940. [Google Scholar] [CrossRef]
- Mousaei, A.; Gheisarnejad, M.; Khooban, M.H. Challenges and opportunities of FACTS devices interacting with electric vehicles in distribution networks: A technological review. J. Energy Storage 2023, 73, 108860. [Google Scholar] [CrossRef]
- Hashish, M.S.; Hasanien, H.M.; Ji, H.; Alkuhayli, A.; Alharbi, M.; Akmaral, T.; Turky, R.A.; Jurado, F.; Badr, A.O. Monte carlo simulation and a clustering technique for solving the probabilistic optimal power flow problem for hybrid renewable energy systems. Sustainability 2023, 15, 783. [Google Scholar] [CrossRef]
- Papazoglou, G.; Biskas, P. Review and Comparison of Genetic Algorithm and Particle Swarm Optimization in the Optimal Power Flow Problem. Energies 2023, 16, 1152. [Google Scholar] [CrossRef]
- Grisales-Noreña, L.F.; Gonzalez Montoya, D.; Ramos-Paja, C.A. Optimal sizing and location of distributed generators based on PBIL and PSO techniques. Energies 2018, 11, 1018. [Google Scholar] [CrossRef]
- Sadeghian, Z.; Akbari, E.; Nematzadeh, H.; Motameni, H. A review of feature selection methods based on meta-heuristic algorithms. J. Exp. Theor. Artif. Intell. 2025, 37, 1–51. [Google Scholar] [CrossRef]
- Saxena, N.K.; Kumar, A. Reactive power control in decentralized hybrid power system with STATCOM using GA, ANN and ANFIS methods. Int. J. Electr. Power Energy Syst. 2016, 83, 175–187. [Google Scholar] [CrossRef]
- Pérez-Ramírez, J.; Montoya-Acevedo, D.; Gil-González, W.; Montoya, O.D.; Restrepo, C. Shunt active power filter using model predictive control with stability guarantee. E-Prime Adv. Electr. Eng. Electron. Energy 2025, 12, 101029. [Google Scholar] [CrossRef]
- Gandhi, O.; Rodríguez-Gallegos, C.D.; Zhang, W.; Reindl, T.; Srinivasan, D. Levelised cost of PV integration for distribution networks. Renew. Sustain. Energy Rev. 2022, 169, 112922. [Google Scholar] [CrossRef]
- Grisales-Noreña, L.F.; Montoya, O.D.; Perea-Moreno, A.J. Optimal Integration of Battery Systems in Grid-Connected Networks for Reducing Energy Losses and CO2 Emissions. Mathematics 2023, 11, 1604. [Google Scholar] [CrossRef]
- de Electricidad y Combustibles SEC. Reglamento de Instalaciones de Consumo N°04—Conductores, Materiales y Sistemas de Canalización; SEC: Santiago, Chile, 2020. [Google Scholar]
- Montoya, O.D.; Molina-Cabrera, A.; Giral-Ramírez, D.A.; Rivas-Trujillo, E.; Alarcón-Villamil, J.A. Optimal integration of D-STATCOM in distribution grids for annual operating costs reduction via the discrete version sine-cosine algorithm. Results Eng. 2022, 16, 100768. [Google Scholar] [CrossRef]
- Gil-González, W. Optimal Placement and Sizing of D-STATCOMs in Electrical Distribution Networks Using a Stochastic Mixed-Integer Convex Model. Electronics 2023, 12, 1565. [Google Scholar] [CrossRef]
- Rao, V.S.; Rao, R.S. Optimal Placement of STATCOM using Two Stage Algorithm for Enhancing Power System Static Security. Energy Procedia 2017, 117, 575–582. [Google Scholar] [CrossRef]
- Rohouma, W.; Balog, R.S.; Peerzada, A.A.; Begovic, M.M. D-STATCOM for harmonic mitigation in low voltage distribution network with high penetration of nonlinear loads. Renew. Energy 2020, 145, 1449–1464. [Google Scholar] [CrossRef]
- Etanya, T.F.; Tsafack, P.; Ngwashi, D.K. Grid-connected distributed renewable energy generation systems: Power quality issues, and mitigation techniques—A review. Energy Rep. 2025, 13, 3181–3203. [Google Scholar] [CrossRef]
- Noreña, L.F.G.; Rivera, O.D.G.; Toro, J.A.O.; Paja, C.A.R.; Cabal, M.A.R. Metaheuristic optimization methods for optimal power flow analysis in DC distribution networks. Trans. Energy Syst. Eng. Appl. 2020, 1, 13–31. [Google Scholar] [CrossRef]
- Eremia, M.; Liu, C.C.; Edris, A.A. Advanced Solutions in Power Systems: HVDC, FACTS, and Artificial Intelligence; John Wiley & Sons: Hoboken, NJ, USA, 2016. [Google Scholar]
- Rani, K.R.; Rani, P.S.; Chaitanya, N.; Janamala, V. Improved Bald Eagle Search for Optimal Allocation of D-STATCOM in Modern Electrical Distribution Networks with Emerging Loads. Int. J. Intell. Eng. Syst. 2022, 15. [Google Scholar]
- Illana, J.I. Métodos Monte Carlo; Departamento de Física Teórica y del Cosmos, Universidad de Granada: Granada, Spain, 2013. [Google Scholar]
- Castiblanco-Pérez, C.M.; Toro-Rodríguez, D.E.; Montoya, O.D.; Giral-Ramírez, D.A. Optimal Placement and sizing of D-STATCOM in radial and meshed distribution networks using a discrete-continuous version of the genetic algorithm. Electronics 2021, 10, 1452. [Google Scholar] [CrossRef]
- Grisales-Noreña, L.; Montoya, O.D.; Gil-Gonzalez, W. Integration of energy storage systems in AC distribution networks: Optimal location, selecting, and operation approach based on genetic algorithms. J. Energy Storage 2019, 25, 100891. [Google Scholar] [CrossRef]
- Eberhart, R.; Kennedy, J. Particle swarm optimization. In Proceedings of the IEEE International Conference on Neural Networks, Citeseer, Perth, WA, Australia, 27 November–1 December 1995; Volume 4, pp. 1942–1948. [Google Scholar]
- Clerc, M.; Kennedy, J. The particle swarm-explosion, stability, and convergence in a multidimensional complex space. IEEE Trans. Evol. Comput. 2002, 6, 58–73. [Google Scholar] [CrossRef]
- Grisales-Noreña, L.F.; Morales-Duran, J.C.; Velez-Garcia, S.; Montoya, O.D.; Gil-González, W. Power flow methods used in AC distribution networks: An analysis of convergence and processing times in radial and meshed grid configurations. Results Eng. 2023, 17, 100915. [Google Scholar] [CrossRef]
- Información de Electricidad y Combustible SEC. Plataforma de Información Pública. 2023. Available online: https://www.sec.cl/gda/pip/ (accessed on 30 April 2023).
- Dictuc; Vinken. Diseño para el perfeccionamiento del mercado eléctrico nacional en la transición hacia esquemas de ofertas incorporando señales de flexibilidad y nuevos agentes participantes. Inf. Final. Com. Nac. Energía. 2021. Available online: https://www.cne.cl/wp-content/uploads/2022/07/Dictuc-Vinken-Diseno-para-el-perfeccionamiento-del-mercado-electrico-nacional.pdf (accessed on 4 August 2023).
- Compañía General de Electricidad (CGE). Informe de Responsabilidad Corporativa; Compañía General de Electricidad (CGE): Santiago, Chile, 2019; Available online: https://www.cge.cl/wp-content/uploads/2020/11/CGE_REPORTE_2019_4baja.pdf (accessed on 4 August 2023).








| Parameter | Value | Unit |
|---|---|---|
| 0.1643 | ||
| 24 | h | |
| (33 or 69) | Dimensionless | |
| (0–500) | kvar | |
| ±8 | % | |
| 12.66 | kV | |
| 1000 | kVA | |
| 0.5 | h |
| [ h] | P [p.u.] | Q [p.u.] | [ h] | P [p.u.] | Q [p.u.] | [ h] | P [p.u.] | Q [p.u.] |
|---|---|---|---|---|---|---|---|---|
| 1 | 0.1700 | 0.1477 | 17 | 0.3100 | 0.2497 | 33 | 0.4500 | 0.4226 |
| 2 | 0.1400 | 0.1119 | 18 | 0.3400 | 0.3224 | 34 | 0.4500 | 0.3081 |
| 3 | 0.1100 | 0.0982 | 19 | 0.3600 | 0.3263 | 35 | 0.4500 | 0.2994 |
| 4 | 0.1100 | 0.0833 | 20 | 0.3900 | 0.3661 | 36 | 0.4500 | 0.3336 |
| 5 | 0.1100 | 0.0739 | 21 | 0.4200 | 0.3585 | 37 | 0.4300 | 0.3543 |
| 6 | 0.1000 | 0.0827 | 22 | 0.4300 | 0.3316 | 38 | 0.4200 | 0.3399 |
| 7 | 0.0900 | 0.0831 | 23 | 0.4500 | 0.4187 | 39 | 0.4600 | 0.4234 |
| 8 | 0.0900 | 0.0637 | 24 | 0.4600 | 0.3652 | 40 | 0.5000 | 0.4061 |
| 9 | 0.0900 | 0.0702 | 25 | 0.4700 | 0.3382 | 41 | 0.4900 | 0.3820 |
| 10 | 0.1000 | 0.0875 | 26 | 0.4700 | 0.3614 | 42 | 0.4700 | 0.3820 |
| 11 | 0.1100 | 0.0728 | 27 | 0.4500 | 0.3877 | 43 | 0.4500 | 0.3887 |
| 12 | 0.1300 | 0.1214 | 28 | 0.4200 | 0.3434 | 44 | 0.4200 | 0.2751 |
| 13 | 0.1400 | 0.1231 | 29 | 0.4300 | 0.3771 | 45 | 0.3800 | 0.3383 |
| 14 | 0.1700 | 0.1390 | 30 | 0.4500 | 0.4269 | 46 | 0.3400 | 0.2355 |
| 15 | 0.2000 | 0.1410 | 31 | 0.4500 | 0.4224 | 47 | 0.2900 | 0.2301 |
| 16 | 0.2500 | 0.1998 | 32 | 0.4500 | 0.3647 | 48 | 0.2500 | 0.1818 |
| Line | [A] | Line | [A] |
|---|---|---|---|
| 1 | 410 | 17 | 99 |
| 2 | 307 | 18 | 99 |
| 3 | 266 | 19 | 99 |
| 4 | 195 | 20 | 99 |
| 5 | 195 | 21 | 99 |
| 6 | 195 | 22 | 99 |
| 7 | 99 | 23 | 99 |
| 8 | 99 | 24 | 99 |
| 9 | 99 | 25 | 114 |
| 10 | 99 | 26 | 99 |
| 11 | 99 | 27 | 99 |
| 12 | 99 | 28 | 99 |
| 13 | 99 | 29 | 99 |
| 14 | 99 | 30 | 99 |
| 15 | 99 | 31 | 99 |
| 16 | 99 | 32 | 99 |
| Test Systems | 33-Node Test System | 69-Node Test System | ||||
|---|---|---|---|---|---|---|
| Techniques | Parameters | Range | ||||
| MC method | Number of individuals | [50–2000] | 500 | 500 | 500 | 1000 |
| Number of iterations | [100–2000] | 1000 | 1000 | 1000 | 1000 | |
| PGA | Number of individuals | [50–300] | 300 | 300 | 300 | 300 |
| Number of iterations | [300–6000] | 6000 | 2500 | 2500 | 2500 | |
| Number of mutations | [5–20] | 5 | 5 | 5 | 5 | |
| PSO | Number of individuals | [50–2000] | 2000 | 2000 | 2000 | 500 |
| Number of iterations | [200–1500] | 500 | 500 | 500 | 200 | |
| Maximum inertia | [0.2–1] | 0.8 | 0.5 | 0.8 | 0.8 | |
| Minimum inertia | [0–0.6] | 0.6 | 0.2 | 0.6 | 0.6 | |
| Cognitive factor | [0.5–2] | 2 | 0.5 | 2 | 2 | |
| Social factor | [0–2] | 1 | 2 | 1 | 1 | |
| Velocity vector limit | [0.05–0.5] | 0.05 | 0.05 | 0.05 | 0.05 | |
| Test Systems | 33-Node Test System | 69-Node Test System | |||
|---|---|---|---|---|---|
| FOn | FO1 [kWh] | FO2 [TonCO2] | FO1 [kWh] | FO2 [TonCO2] | |
| Base case | 4444.3038 | 19.7346 | 4719.2523 | 20.6785 | |
| Solution reported in the literature [14] | 3568.6463 | 19.5907 | 3729.9182 | 20.5159 | |
| Average reduction | |||||
| Method | MC method | 3522.6095 | 19.5831 | 3700.8778 | 20.5103 |
| PGA | 3348.9625 | 19.5548 | 3488.3604 | 20.4762 | |
| PSO | 3349.9758 | 19.5553 | 3488.5301 | 20.4771 | |
| Maximum reduction | |||||
| Method | MC method | 3506.41 | 19.5798 | 3680.827 | 20.5069 |
| PGA | 3348.6279 | 19.5548 | 3487.7505 | 20.4761 | |
| PSO | 3345.8634 | 19.5547 | 3482.3152 | 20.4757 | |
| Average standard deviation [%] | |||||
| Method | MC method | 0.1735 | 0.0054 | 0.2297 | 0.0054 |
| PGA | 0.0035 | 0.0001 | 0.0068 | 0.0001 | |
| PSO | 0.0792 | 0.0015 | 0.1018 | 0.0039 | |
| Average processing time [s] | |||||
| Method | MC method | 1929.2804 | 1867.3774 | 4893.1803 | 11,204.963 |
| PGA | 6356.2218 | 3523.6951 | 7632.2218 | 8241.9134 | |
| PSO | 3945.1104 | 3400.9324 | 8242.0869 | 990.3428 | |
| Accuracy [%] | |||||
| Method | MC method | 0.4598 | 0.0168 | 0.5417 | 0.0166 |
| PGA | 0.0099 | 0.0003 | 0.0174 | 0.0003 | |
| PSO | 0.1227 | 0.0031 | 0.1781 | 0.0071 | |
| Test Systems | 33-Node Test System | 69-Node Test System | |||
|---|---|---|---|---|---|
| Average reduction [%] | |||||
| Method | MC method | 4.9294 | 0.1444 | 5.7423 | 0.1661 |
| PSO | 0.0302 | 0.0026 | 0.0048 | 0.0044 | |
| Maximum reduction [%] | |||||
| Method | MC method | 4.4998 | 0.128 | 5.2454 | 0.1498 |
| PSO | −1.0826 | −1.0001 | −1.156 | −1.0023 | |
| System | Objective Function | Avg. Reduction | Relative Reduction [%] | STD (Absolute) | STD [%] |
|---|---|---|---|---|---|
| 33-node | Power losses [kWh] | 3349.7227 | 24.9246 | 63.8036 | 1.9047 |
| CO2 emissions [ton] | 19.5162 | 0.9279 | 0.1550 | 0.7940 | |
| 69-node | Power losses [kWh] | 3488.5267 | 26.3816 | 67.9297 | 1.9472 |
| CO2 emissions [ton] | 20.6414 | 0.9956 | 0.1624 | 0.7869 |
| [MWh] | [TonCO2] | |
|---|---|---|
| Winter | ||
| Without D-STATCOMs | 9.4738 | 12.5332 |
| With D-STATCOMs | 8.3872 | 12.4862 |
| Processing time [s] | 13,919.2009 | 5818.3968 |
| Spring | ||
| Without D-STATCOMs | 6.7983 | 9.9561 |
| With D-STATCOMs | 5.169 | 9.8857 |
| Processing time [s] | 9287.817 | 4012.5191 |
| Summer | ||
| Without D-STATCOM | 9.7885 | 11.0652 |
| With D-STATCOMs | 6.5103 | 10.9235 |
| Processing time [s] | 10,090.7899 | 3847.156 |
| Autumn | ||
| Without D-STATCOM | 8.3045 | 11.095 |
| With D-STATCOM | 6.4402 | 11.0144 |
| Processing time [s] | 12,255.1628 | 4952.9754 |
Disclaimer/Publisher’s Note: The statements, opinions and data contained in all publications are solely those of the individual author(s) and contributor(s) and not of MDPI and/or the editor(s). MDPI and/or the editor(s) disclaim responsibility for any injury to people or property resulting from any ideas, methods, instructions or products referred to in the content. |
© 2025 by the authors. Licensee MDPI, Basel, Switzerland. This article is an open access article distributed under the terms and conditions of the Creative Commons Attribution (CC BY) license (https://creativecommons.org/licenses/by/4.0/).
Share and Cite
Bolaños, R.I.; Torres-Mancilla, C.E.; Grisales-Noreña, L.F.; Montoya, O.D.; Hernández, J.C. Optimal D-STATCOM Operation in Power Distribution Systems to Minimize Energy Losses and CO2 Emissions: A Master–Slave Methodology Based on Metaheuristic Techniques. Sci 2025, 7, 98. https://doi.org/10.3390/sci7030098
Bolaños RI, Torres-Mancilla CE, Grisales-Noreña LF, Montoya OD, Hernández JC. Optimal D-STATCOM Operation in Power Distribution Systems to Minimize Energy Losses and CO2 Emissions: A Master–Slave Methodology Based on Metaheuristic Techniques. Sci. 2025; 7(3):98. https://doi.org/10.3390/sci7030098
Chicago/Turabian StyleBolaños, Rubén Iván, Cristopher Enrique Torres-Mancilla, Luis Fernando Grisales-Noreña, Oscar Danilo Montoya, and Jesús C. Hernández. 2025. "Optimal D-STATCOM Operation in Power Distribution Systems to Minimize Energy Losses and CO2 Emissions: A Master–Slave Methodology Based on Metaheuristic Techniques" Sci 7, no. 3: 98. https://doi.org/10.3390/sci7030098
APA StyleBolaños, R. I., Torres-Mancilla, C. E., Grisales-Noreña, L. F., Montoya, O. D., & Hernández, J. C. (2025). Optimal D-STATCOM Operation in Power Distribution Systems to Minimize Energy Losses and CO2 Emissions: A Master–Slave Methodology Based on Metaheuristic Techniques. Sci, 7(3), 98. https://doi.org/10.3390/sci7030098


