Article

Stimulus Optimization for Softness Perception on a Friction-Variable Tactile Texture Display

Department of Computer Science, Tokyo Metropolitan University, Tokyo 191-0065, Japan
*
Author to whom correspondence should be addressed.
These authors contributed equally to this work.
Submission received: 4 May 2025 / Revised: 31 May 2025 / Accepted: 25 June 2025 / Published: 2 July 2025

Abstract

Surface texture displays are touch panels that provide tactile feedback. Presenting softness sensations on such rigid surfaces remains a challenge, and effective methods are not yet established. This study explores how low-frequency frictional modulation during finger sliding can evoke the perception of softness. We examined multimodal optimization—whether the optimal tactile parameters vary depending on the type of visually presented fabric. Videos of draping cloth were shown beneath the panel, while spatial wavelength of frictional modulation and finger sliding speed were optimized using response surface methodology. The optimal spatial wavelength did not significantly differ across fabric types: towel (16.8 mm), cotton (16.5 mm), leather (17.1 mm), and suede (15.4 mm), with an overall range of 15–18 mm. In contrast, the optimal sliding speed significantly varied by fabric: towel (144 mm/s), cotton (118 mm/s), leather (167 mm/s), and suede (96 mm/s). These results suggest that frictional variation with a fixed spatial wavelength may serve as a general strategy for presenting softness. The findings contribute to advancing tactile rendering techniques for hard touch surfaces.

1. Introduction

Touch panels are the most common human–computer interface, enabling users to interact with digital content by touching displayed images. In the field of haptics, technologies have been developed to provide tactile feedback when users touch these panels [1]. These technologies, known as surface tactile displays, aim to simulate textures [2,3,4,5] and the tactile sensations of mechanical interfaces such as switches and dials [6,7,8] and are even applied to emotional communication [9,10].
Most surface tactile displays use either vibrational or friction-modulation stimuli to provide tactile sensations. Vibrational stimuli are typically generated by rapidly oscillating the panel using actuators such as voice coil motors or piezoelectric elements [3,11,12]. Friction-modulation stimuli either increase friction via electrostatic adhesion [2,13,14,15,16,17] or decrease it using ultrasonic waves [4,6,17,18]. The interaction between vibration and frictional cues has also been explored [5,11,19,20].
Although flexible touch panels have been actively studied [21,22], rigid, flat panels combined with LCDs remain the most commercially widespread. With respect to texture presentation, various techniques have been proposed for simulating textures characterized by surface roughness and friction distributions [2,4,5,23,24]. However, presenting the sensation of softness on a hard surface remains a challenging problem. One approach is to visually deform virtual objects to induce the illusion of elasticity [25,26,27,28], but methods that induce softness perception through tactile stimulation remain underdeveloped.
A promising approach involves low-frequency mechanical vibrations or frictional modulation [29,30,31,32,33,34]. For example, Konyo et al. [29] reported that vibrotactile stimuli at around 5 Hz can induce a fabric-like softness sensation. They hypothesized that low-frequency vibrations effectively stimulate slowly adapting type I (SAI) units responsible for pressure sensation [35,36,37]. This finding aligns with results from studies using electrical stimulation [38]. Frictional modulation, defined as temporal changes in lateral force during finger sliding, has also been shown to induce softness perception, particularly in the 10–20 Hz range [30]. This phenomenon has been observed even on resin surfaces with shallow undulations [39,40].
Despite the above-cited reports, the neural basis by which low-frequency stimulation to the fingertip evokes the sensation of softness remains unclear. Previous studies [29,38] have consistently noted that low-frequency stimulation induces a sense of pressure on the fingertip. At low frequencies, SAI units are known to respond more readily than other mechanoreceptor types, exhibiting lower activation thresholds to mechanical stimuli [41,42]. There is a prevailing hypothesis that judgments of softness through tactile perception are based on the relationship between contact force and contact area at the finger–object interface [43,44,45,46]. SAI units are thought to play a dominant role in detecting skin deformation patterns within the contact area [47,48] and likely contribute to the perception of contact area.
Taken together, these findings suggest a plausible interpretation: low-frequency frictional modulation applied to the fingertip may modulate the sense of finger pad deformation—including the perception of contact pressure and contact area—thereby evoking sensations of softness.
The objective of this study is to optimize the tactile presentation of softness using low-frequency frictional modulation delivered through a surface tactile display. In our previous work [30], this optimization was explored under conditions excluding visual input, where participants evaluated the softness of the touch panel itself. However, in practical applications, tactile feedback is provided while interacting with visual images of soft objects. Therefore, the optimization of tactile stimuli should be investigated under conditions in which tactile and visual cues coexist. A key question is whether the optimal tactile stimulus depends on the type of object presented visually.
Previous studies have demonstrated that, for both real materials [39,40] and tactile displays [30,34], periodic modulation of the surface’s spatial gradient or low-frequency frictional variation during finger sliding plays a critical role in evoking the perception of softness. Under cross-modal conditions where fabric drape is visually presented, it is plausible that the optimal spatial period of tactile stimulation aligns with the visual properties of the drape. Since drape is a key visual cue for inferring fabric softness [49,50], matching the tactile stimulus with the visual drape dimensions may enhance the perceived softness through multisensory coherence.
Additionally, human exploratory behavior is known to be unconsciously modulated by the visual appearance and inferred properties of the target material [51,52,53]. For instance, when a surface appears hard, individuals are more likely to engage in sliding movements to extract texture information [51]. Therefore, it is also possible that the type of fabric visually presented influences the finger sliding speed, which in turn affects the perceived softness.
To address these questions, the present study aims to identify the optimal low-frequency frictional stimuli for evoking softness while displaying videos of four different fabrics beneath a touch panel. The optimization targets two parameters: the spatial period of the frictional modulation and the sliding speed of the user’s finger on the touch panel. The findings are expected to broaden the range of tactile sensations that surface tactile displays can effectively convey.

2. Methods

2.1. Apparatus: Tactile Texture Display

Figure 1 illustrates the working principle of electrostatic surface texture displays. The core component of the system is a conductive panel, typically composed of glass coated with indium tin oxide as the conductive layer. The surface of the panel is covered with a thin insulating film, preventing direct contact between the human finger and the conductive layer.
A voltage is applied to the conductive layer, generating an electric field between the finger and the conductive surface. Due to Coulomb forces between the charges in the skin and those in the conductive layer, the epidermis is attracted toward the panel [54,55,56]. As a result, adhesive friction between the finger and the panel increases. When the charge is released, this additional adhesive friction is reduced. Using this principle, electrostatic haptic displays can create a virtual friction distribution on the panel surface. Importantly, this tactile stimulation differs from electrical stimulation caused by current flow; instead, it is perceived as a mechanical stimulus.
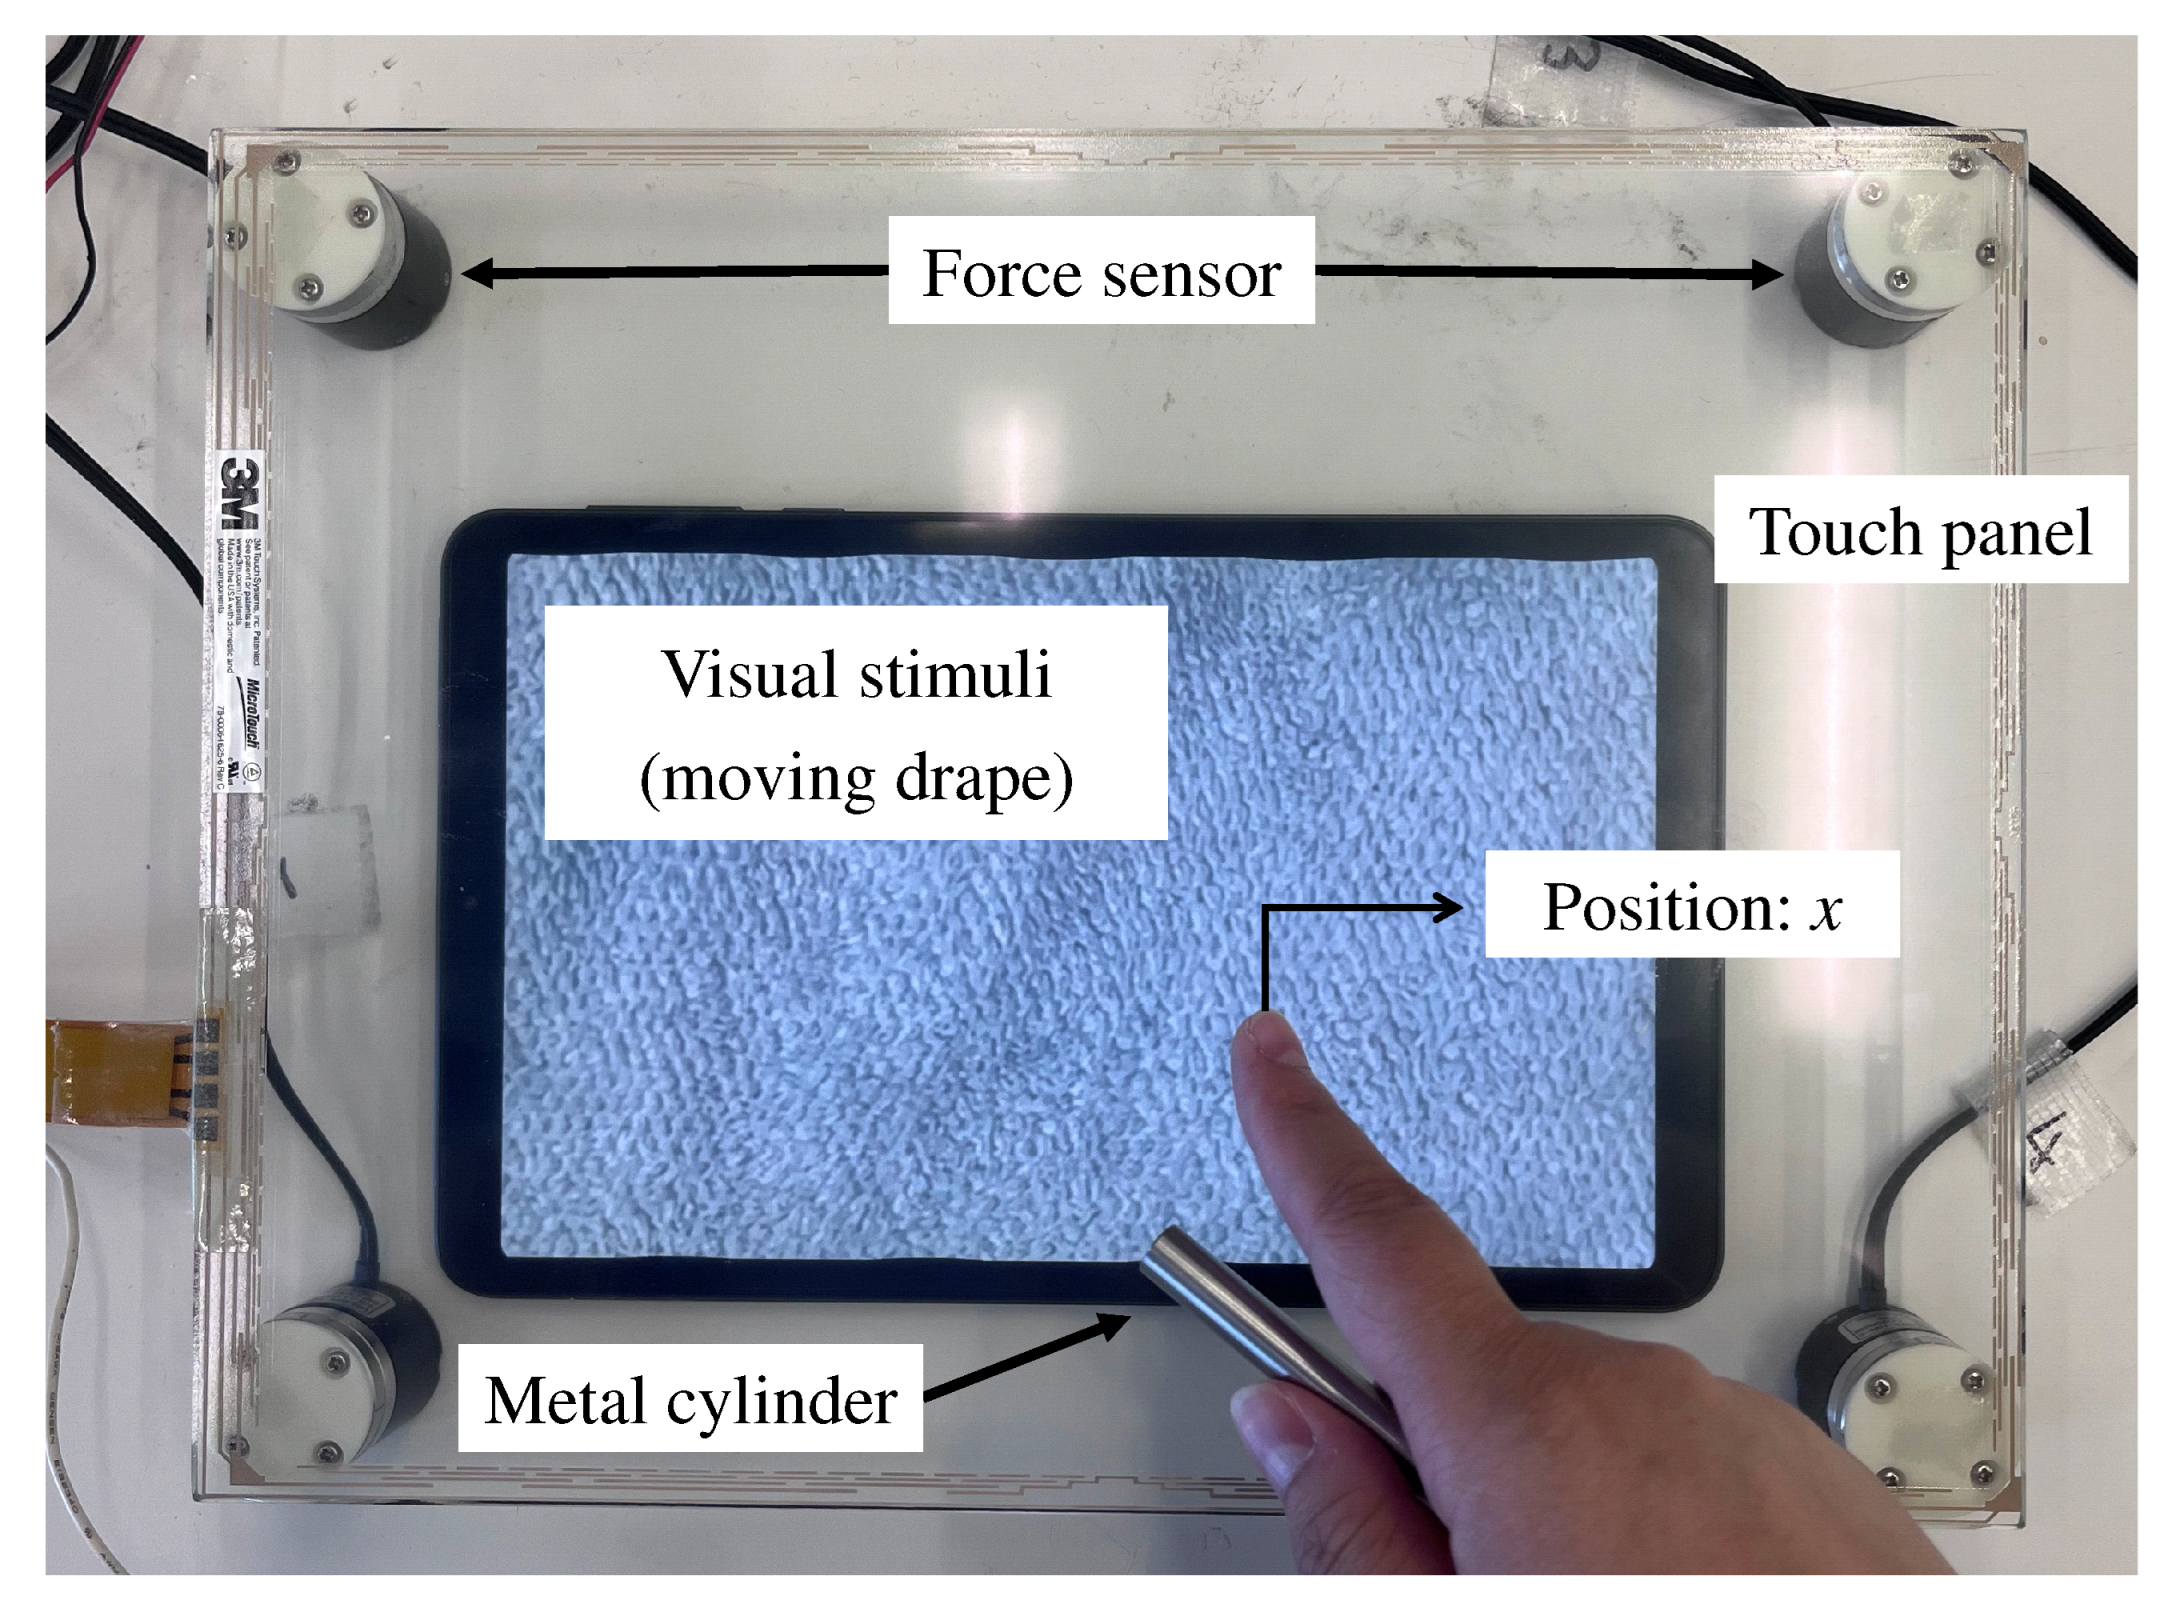
In this study, we used an electrostatic friction-based tactile display, as shown in Figure 2 [57]. The main components included a capacitive touch panel (SCT3260, 3M Touch Systems, Inc., Methuen, MA, USA) and four force sensors (USLG25, Tec Gihan Co., Ltd., Uji, Japan). The center of force was taken as the finger position on the touch panel. Participants held a grounded metal cylinder in their hand, which functioned as the ground electrode and enabled effective frictional stimulation.
The voltage signal applied to the touch panel was amplitude-modulated at 2 kHz and amplified using a dedicated amplifier (PD-206-150B, Piezo Driver, NF Corporation, Yokohama, Japan). The generation of the voltage signal was controlled based on the finger position input from force sensors using a data acquisition board (PEX-61216, Interface Corporation, Hiroshima, Japan) at a sampling rate of 2 kHz.

2.2. Tactile Stimuli

The low-frequency friction stimuli used as tactile cues were determined by the finger position on the display x ( t ) , the wavelength λ , and a gain parameter a, as defined by the following equation:
V ( t ) = a sin 2 π x ( t ) 2 λ .
This voltage was applied in a sinusoidal pattern based on the finger’s position in the x-direction (horizontal direction in Figure 2), resulting in a spatial distribution of friction perceived on the panel surface. The spatial extent of this distribution was determined by the wavelength λ , which, as described in Section 2.4, was one of the parameters optimized in the experiment.
Since the electrostatic force is proportional to the square of the applied voltage [14,15,55], the denominator in Equation (1) includes a factor of 2 to yield the desired spatial wavelength of the force resistance. Consequently, the spatial pattern of the electrostatic force F e is given by the following:
F e V 2 ( t ) = a 2 2 1 cos 2 π x ( t ) λ .
Because the strength of the resulting frictional stimulation can vary across participants—depending on individual finger conditions such as moisture content—the gain a was calibrated individually for each participant prior to the experiment, as described in Section 2.6. The maximum amplitude of the amplified voltage output was 36 V (72 Vpp).

2.3. Visual Stimuli

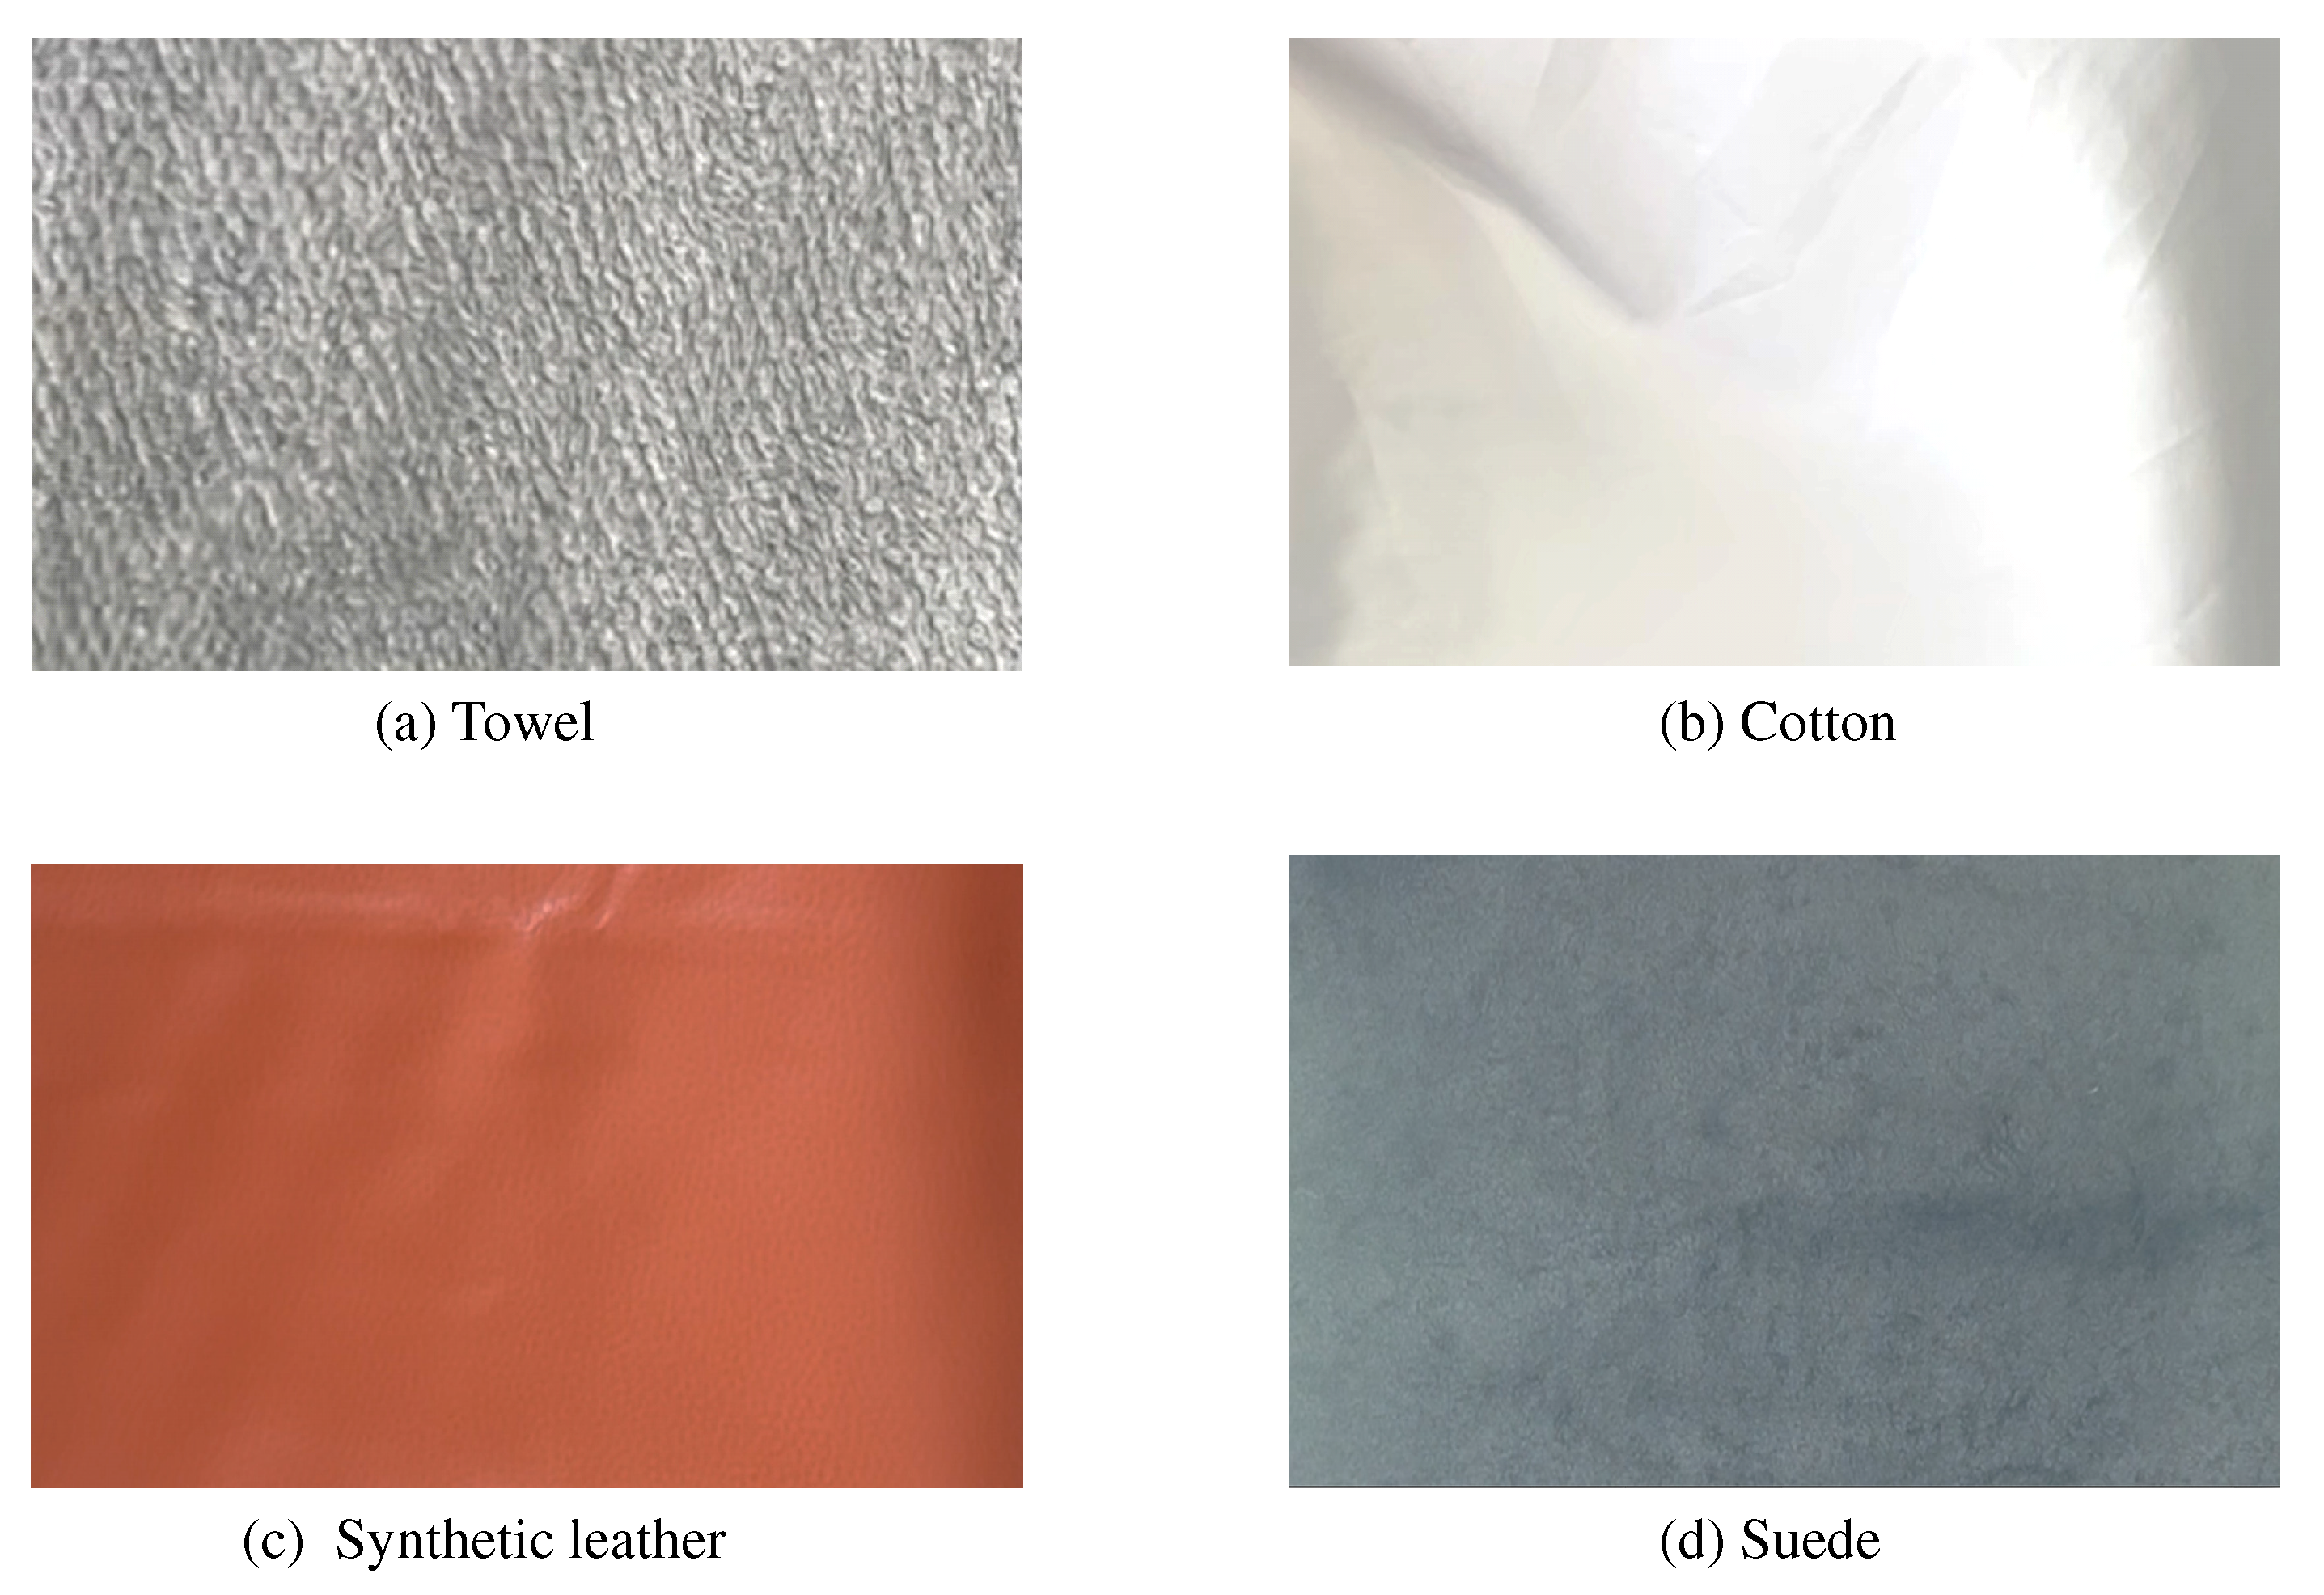
Because the touch panel was made of transparent glass, participants were able to view fabric videos displayed on a tablet (Headwolf FPad 3, Shenzhen Daohui Industrial Co., Ltd., Shenzhen, China; 1920 × 1200 pixels, 8.4 inches) placed beneath the panel. As visual stimuli, videos of four different fabric textures were used. As shown in Figure 3, these included towel, cotton, artificial leather, and suede. These fabrics are commonly encountered in daily life and differ substantially in tactile properties, allowing participants to form distinct haptic impressions based on the visual input. Hence, the use of fabrics with varied characteristics enabled a discussion on the generalizability of the findings.
As shown in Figure 4, the fabrics were presented as videos in which drapes moved smoothly from left to right. Videos were used instead of still images, as they are expected to evoke more vivid impressions of material properties [58,59]. The drape effect was produced by placing a cylindrical rod beneath each fabric and recording its horizontal movement at a constant speed of 0.10 m/s. The apparent widths (and unloaded thicknesses) of the drapes were as follows: 1.9 cm (4 mm) for towel, 1.6 cm (0.07 mm) for cotton, 2.6 cm (0.6 mm) for synthetic leather, and 1.5 cm (0.1 mm) for suede. The playback speed of the videos was varied to control the apparent speed of the drape motion. As described later, participants were instructed to slide their fingers in synchrony with the moving drape, allowing them to control the rubbing speed and experience a sensation similar to interacting with actual fabric.

2.4. Combination of Tactile and Visual Stimuli

As described in Section 1, the objective of this study is to maximize the perceived softness of cloth by manipulating the wavelength of the tactile stimulus ( λ ) and the finger sliding speed (v). To this end, we employed response surface methodology [60,61,62], a technique commonly used in quality engineering to efficiently identify optimal conditions while reducing the number of experimental trials (i.e., experimental cost). This method is particularly well-suited for optimization studies involving human participants, as it helps reduce the physical and cognitive burden on participants.
A widely used experimental design within response surface methodology is the central composite design [63,64], which allows for the effective approximation of a second-order response surface—perceived softness, in this case—while keeping the number of trials relatively low. In this design, the first step is to determine the center and range of the parameter space of interest. In this study, the parameters are λ and v, and thus the design space is defined in the λ v plane.
Next, a circle is inscribed within the exploration range, and eight points are evenly distributed along its circumference. These eight points, together with the center point, constitute the set of stimulus conditions to be tested.
The stimulus center was set at ( λ , v ) = ( 15 mm , 150 mm / s ) , with λ ranging from 5 mm to 25 mm and v ranging from 50 mm/s to 250 mm/s. These parameter ranges were determined with reference to a previous study [30], which was the first to explore the optimization of softness presentation. A preliminary study involving the authors and their colleagues confirmed that the optimal values were likely to fall within these ranges. As a result, the stimulus set included the following nine conditions, as shown in Figure 5: ( λ , v ) = ( 5 , 150 ) , ( 7.9 , 220 ) , ( 7.9 , 79 ) , ( 15 , 50 ) , ( 15 , 150 ) , ( 15 , 250 ) , ( 22.1 , 79 ) , ( 22.1 , 220 ) , and ( 25 , 150 ) .

2.5. Participants

A total of 15 university students (4 females, 11 males; aged 22–25) participated in Experiment 1. All participants were naive to the purpose of the experiment.
As described in Section 2.7, in Experiment 1, the optimal value is determined by using the response surface method of the subjective softness scores. We set the target 95% confidence interval width for the rating score to 1.0, corresponding to the resolution of the 10-point scale (0–9), and determined the required sample size accordingly.
Based on a previous study [30], which employed a similar experimental procedure, the standard deviation of softness scores was σ = 1.8 . The number of participants n required to achieve a confidence interval E of ± 1.0 for the sample mean was calculated using the following formula:
n = z · σ E 2 = 1.96 · 1.8 1.0 2 12.45 ,
indicating that a minimum of 13 participants would be required. Accordingly, 15 participants were recruited.
The required sample sizes for Experiments 2 and 3 were determined based on power analyses tailored to the respective statistical tests used in each experiment.
Eleven individuals (5 females, 6 males; aged 22–25) participated in Experiment 2. Ten of them had also taken part in Experiment 1. As described in Section 2.7, subjective responses were compared across five velocity levels of the moving drapes using repeated-measures analysis of variance (ANOVA). The required sample size was determined using G*Power (version 3.1.9.7) [65], assuming a potential effect size of f = 0.40 , a significance level of α = 0.05 , and a statistical power of 1 β = 0.8 . Under these parameters, the minimum required number of participants was determined to be 10.
Another group of 15 individuals (4 females, 11 males; aged 22–25) participated in Experiment 3. Nine among them also participated in Experiments 1 and 2. As described in Section 2.7, subjective softness values were compared between different stimulus conditions in Experiment 3. The sample size was determined, assuming an effect size of 0.8 (Cohen’s d), a significance level of α = 0.05 , and a power of 1 β = 0.8 for a two-tailed paired t-test. Under these conditions, a minimum of 15 participants was required.
In all experiments, informed consent was obtained from all participants prior to their participation.

2.6. Procedures

2.6.1. Experiment 1

Before the experiment, the voltage intensity used in the electrostatic friction display was individually adjusted for each participant. In the adjustment process, the initial voltage amplitude was set to a = 0.80 V (12.0 V after amplification) and was gradually increased in increments of 0.2 V until the participant was able to distinguish between haptic stimuli with wavelengths of λ = 5.0 mm and 2.5 mm. The voltage level at which the participant correctly identified the stimulus with the larger wavelength five consecutive times was used in the subsequent main experiment.
Additionally, if a participant was unable to complete this task even at the predefined maximum voltage ( a = 2.4 V, 36.0 V after amplification), they were scheduled to be screened out. As a result, all 15 participants in the main experiment successfully answered all five trials correctly.
In the main experiment, participants evaluated a total of 36 stimuli combining four different cloth images and nine parameter conditions. These stimuli were presented in random order during one session, with four sessions conducted in total. Notably, the condition with the median parameter values ( λ , v ) = ( 15 mm , 150 mm / s ) was examined twice in each session. In each trial, participants traced the display with their index finger for 20 s, following the movement speed of the fabric drape shown on the tablet. After each stimulus presentation, participants rated how soft they perceived the fabric shown on the screen on a 10-point scale from 0 to 9, where 0 meant “extremely hard” and 9 meant “extremely soft.”

2.6.2. Experiment 2

Experiment 2 investigated whether the apparent speed at which the drapes moved affected the impression of softness of the fabric, using only the visual stimuli used in Experiment 1. Participants viewed only the video displayed on a tablet device. The purpose of this experiment was to determine whether the response of the participants in Experiment 1 was influenced by the speed of video.
If the visual speed did not affect the softness responses, it could be assumed that the results of Experiment 1 were primarily determined by the wavelength of the tactile stimulus and the finger’s exploratory speed at which it was touched.
The speeds of the videos used were the same as in Experiment 1, with five levels: 50 mm/s, 79.8 mm/s, 150 mm/s, 220 mm/s, and 250 mm/s.
Each participant viewed a randomly presented video of each fabric for 20 s and rated the perceived softness on a 10-point scale, as in Experiment 1. Each session comprised 20 trials (5 speed levels × 4 fabric types), and a total of four sessions were conducted. The presentation order of the fabric types was counterbalanced across participants.

2.6.3. Experiment 3

This experiment was conducted as a follow-up to Experiment 1, with the aim of confirming whether the optimal condition could achieve performance equivalent to or better than the reference, that is, the central condition in the original stimulus set. Three friction stimulus conditions were compared: (1) the optimal parameter condition, (2) a reference condition using parameters located at the center of the stimulus range from Experiment 1, and (3) a no-electrostatic-stimulus condition.
For each cloth type, the three stimulus conditions were presented in random order. In each trial, participants were instructed to slide their fingers along the surface in sync with the moving drape displayed on the tablet, as in Experiment 1. Each task lasted 20 s. Following the task, participants rated the perceived softness of the displayed fabric image on a 10-point scale ranging from 0 to 9, consistent with the procedure in Experiment 1.
Each stimulus condition was presented once per cloth in a single session. Four sessions were conducted, resulting in a total of 48 trials (4 cloth types × 3 stimulus conditions × 4 repetitions).

2.7. Data Analysis

2.7.1. Experiment 1

To investigate optimal wavelength ( λ ) and finger sliding speed (v) for different cloth types, we applied response surface methodology. As shown in Figure 6, the response surface model approximated the relationship between λ , v, and perceived softness ratings. A second-order polynomial surface was constructed to estimate the parameter values that maximize perceived softness. The surface was fitted using the least squares method (fitlm function, MATLAB 2024a, MathWorks, Inc., Natick, MA, USA) based on the mean softness scores for each parameter combination. This optimization process was performed separately for each participant and cloth type.
Optimal values were calculated from each of the 60 response surfaces (15 participants × 4 cloth types). For subsequent analyses, only those that satisfied all of the following criteria were included:
  • The optimal value suggested by the response surface fell within the parameter search range (finger speed: 50–250 mm, surface wavelength: 5–25 mm).
  • The coefficient of determination for the response surface fitting was at least 0.49: R 2 0.49 . This value is the square of 0.7, which is the lower boundary of the range of strong correlation coefficient [66].
As a result, 44 optimal values were retained for analysis. In most of the excluded cases, the R 2 value did not meet the criterion.
Subsequently, we compared the optimal parameters for all pairwise combinations of the four cloth types using multivariate analysis of variance (MANOVA) (manova function, MATLAB 2024a, MathWorks, Inc., Natick, MA, USA). The dependent variables were wavelength ( λ ) and finger speed (v), and the independent variable was cloth type. The resulting p-values were adjusted using Bonferroni’s method with a correction factor of six (4 C 2 ).

2.7.2. Experiment 2

A repeated measures ANOVA was performed to analyze the effect of drape speed on the softness rating of the videos (ranova function, MATLAB 2024a, MathWorks, Inc., Natick, MA, USA). This analysis was performed for each fabric.

2.7.3. Experiment 3

Our primary interest was whether the optimal parameter condition would perform at least as well as the reference condition and significantly outperform the no-electrostatic-stimulus condition. Accordingly, for each fabric type, we compared subjective softness ratings between the optimal condition and the other two conditions using two-tailed paired t-tests, with a Bonferroni correction factor of 2 applied to account for multiple comparisons.

3. Results

3.1. Experiment 1

Figure 7 shows the means and standard errors of the optimal parameters across participants for each fabric type. The mean wavelengths ( λ ) and finger speeds (v) ranged approximately from 15 to 18 mm and from 90 to 170 mm/s, respectively.
The detailed values of λ and v for each fabric are as follows: towel, ( λ , v ) = ( 16.8 ± 1.3 mm , 143.8 ± 9.2 mm / s ) ; cotton, ( λ , v ) = ( 16.5 ± 1.4 mm , 118.1 ± 10.7 mm / s ) ; synthetic leather, ( λ , v ) = ( 17.1 ± 1.6 mm , 166.9 ± 14.6 mm / s ) ; and suede, ( λ , v ) = ( 15.4 ± 1.8 mm , 95.8 ± 7.6 mm / s ) .
Table 1 presents the results of the MANOVA comparing pairs of the four material types. Significant differences in the optimal parameters were observed between towel and suede ( p = 1.5 × 10 2 ) and between synthetic leather and suede ( p = 2.1 × 10 3 ).
The correlation coefficient between λ and v was as low as 0.13, indicating that the effects of these two variables on the softness scores can be separately discussed. Hence, as post-hoc tests, we conducted a one-way analysis of variance (ANOVA) to examine whether there were significant differences among fabric types in terms of optimal wavelength and optimal speed.
The results indicated that there was no significant difference in optimal wavelength among fabric types ( F ( 3 , 40 ) = 0.22 , p = 0.88 ).
In contrast, a significant difference in optimal speed was observed among fabric types ( F ( 3 , 40 ) = 7.99 , p = 3.0 × 10 4 ). Pairwise comparisons using Bonferroni correction with a factor of 6 revealed that the optimal speed for synthetic leather was significantly higher than that for suede ( F ( 1 , 20 ) = 21.5 , p = 1.6 × 10 4 , adjusted p = 9.6 × 10 4 ) and cotton ( F ( 1 , 21 ) = 9.8 , p = 5.1 × 10 3 , adjusted p = 3.0 × 10 2 ). Similarly, the optimal speed for towel tended to be higher than that for suede ( F ( 1 , 19 ) = 10.2 , p = 4.8 × 10 3 , adjusted p = 2.9 × 10 2 ).

3.2. Experiment 2

When only the visual stimuli—videos of cloths with moving drapes—were presented, the mean softness scores and standard errors were as follows: towel, 5.37 ± 0.50 ; leather, 3.77 ± 0.48 ; cotton, 5.10 ± 0.62 ; and suede, 5.49 ± 0.55 .
For all fabric types, no significant differences in subjective softness were observed across the speed levels: towel, F ( 4 , 50 ) = 0.63 , p = 0.63 ; leather, F ( 4 , 50 ) = 0.86 , p = 0.49 ; cotton, F ( 4 , 50 ) = 0.93 , p = 0.45 ; and suede, F ( 4 , 50 ) = 1.06 , p = 0.38 . The apparent speed of the drape did not influence the perceived softness of the cloth images.

3.3. Experiment 3

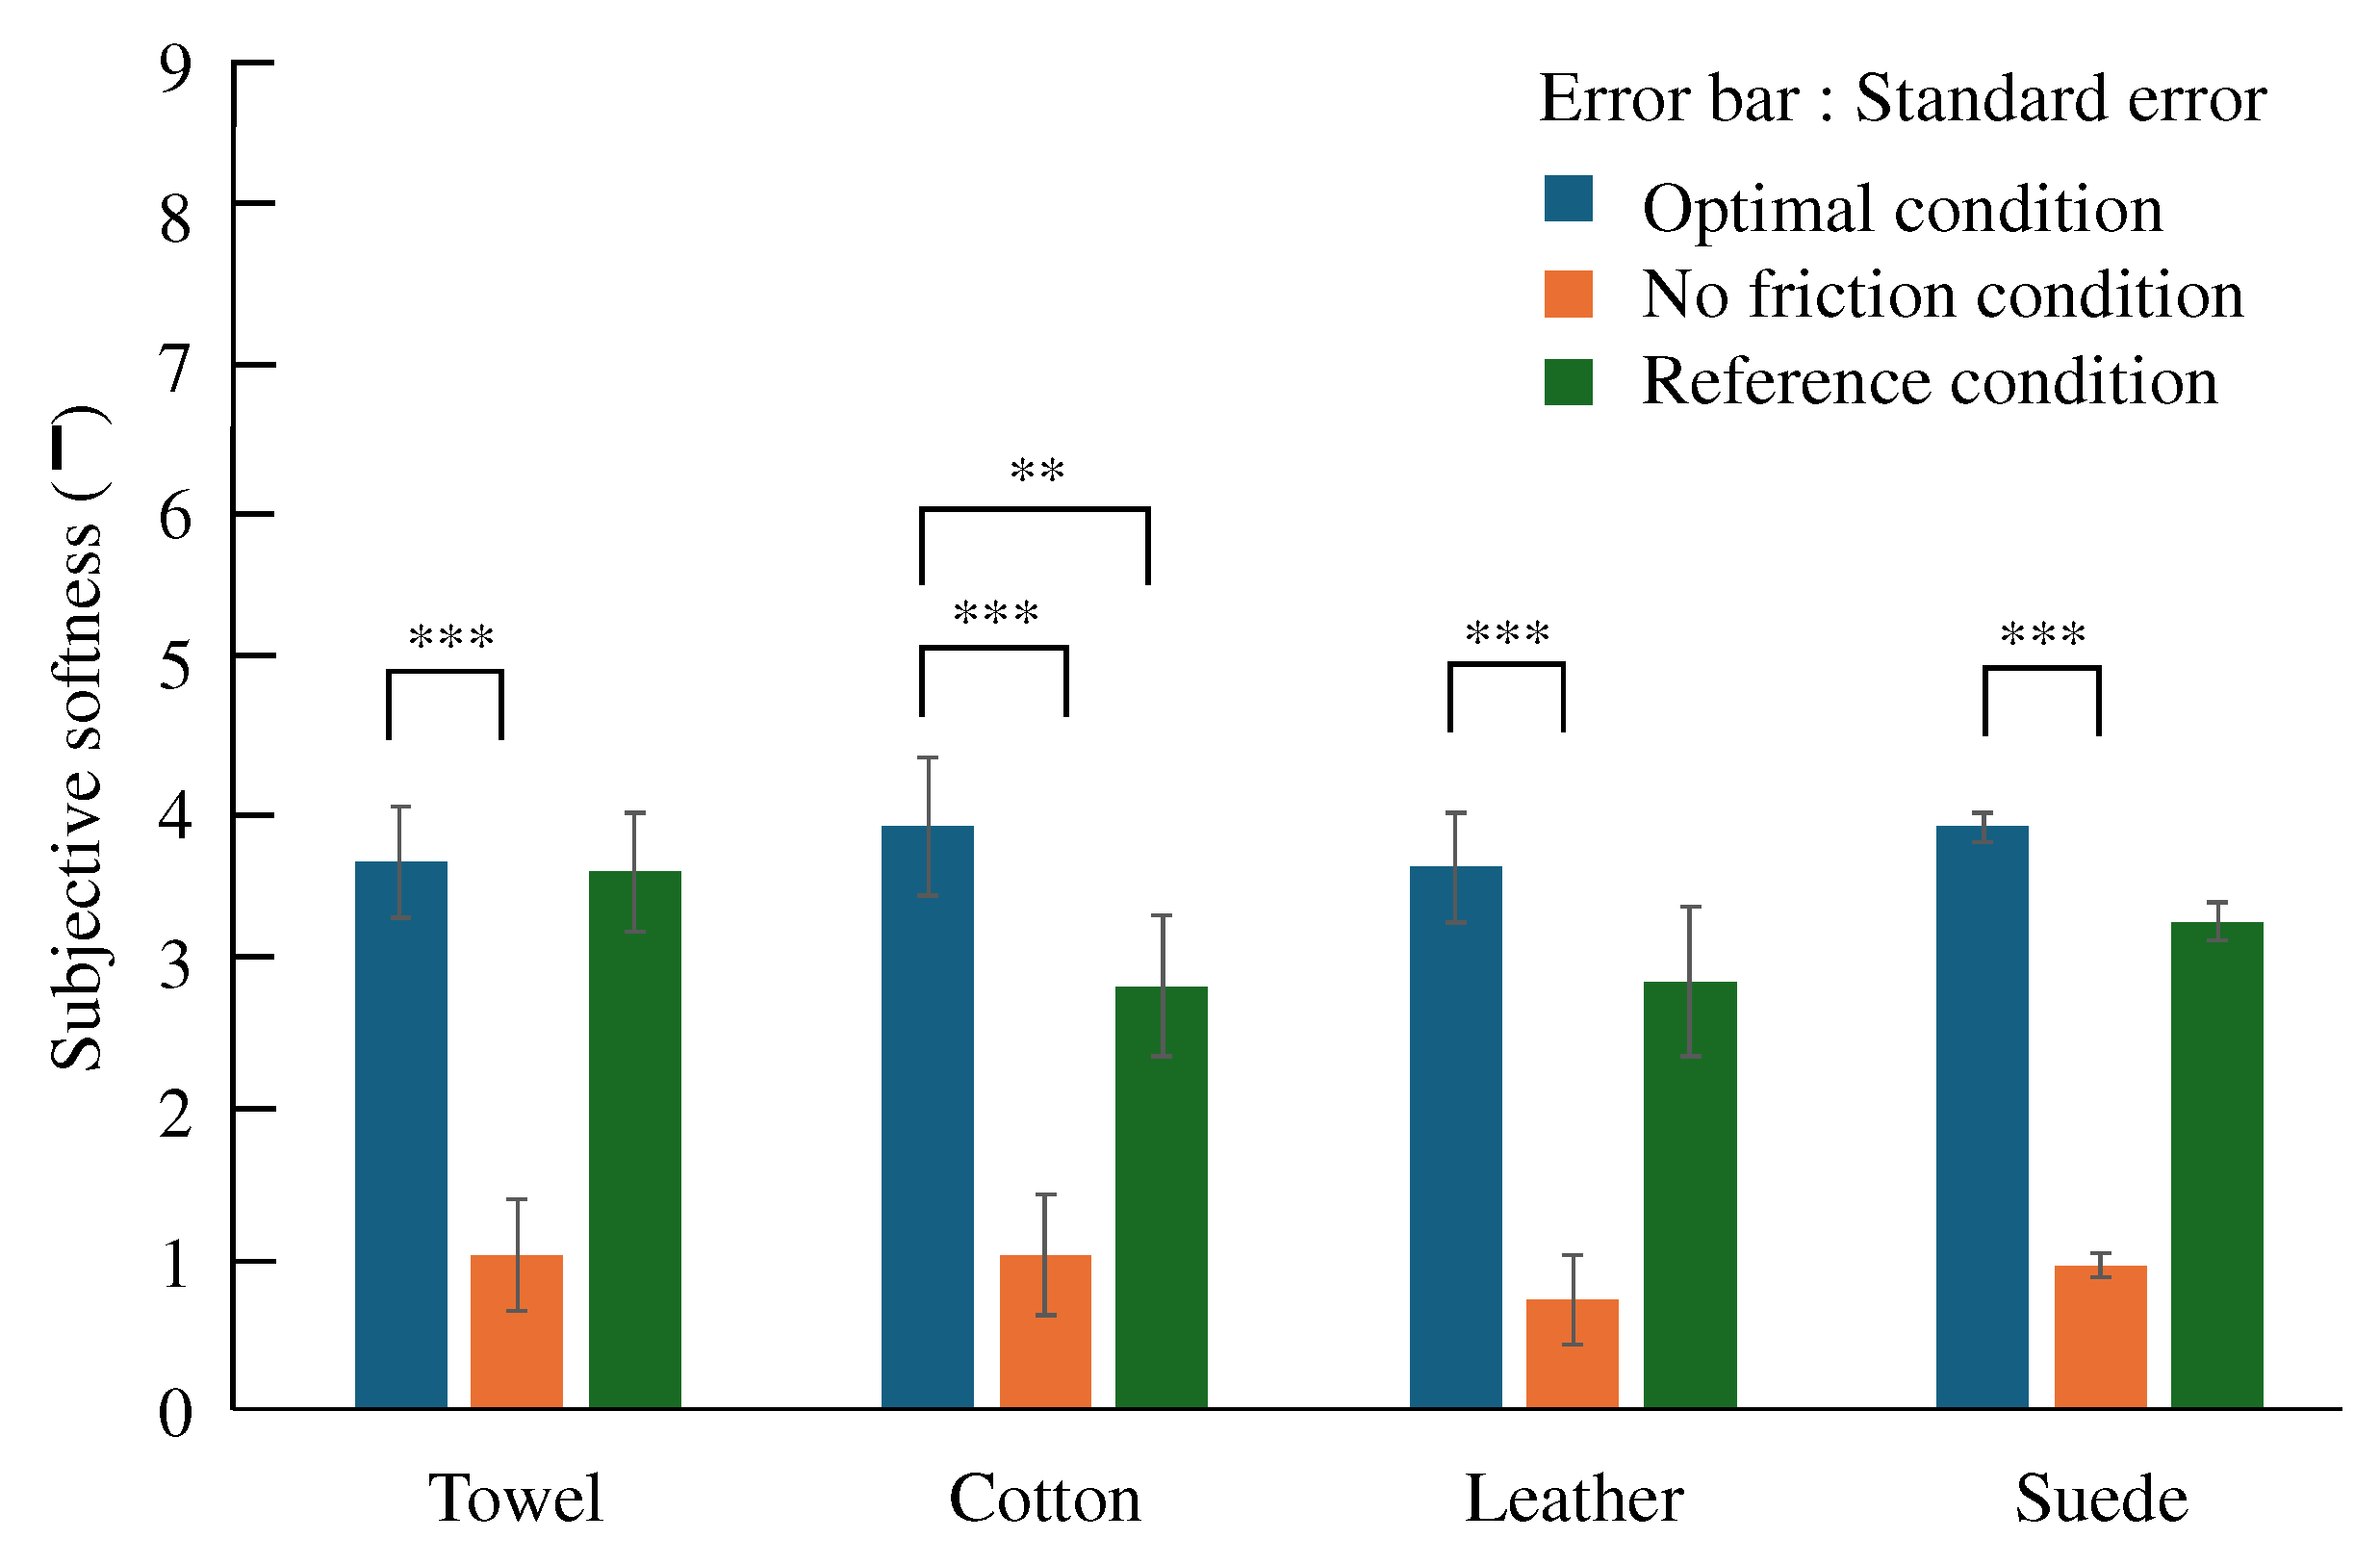
Figure 8 shows the mean and standard error of reported softness values for each cloth and stimulus condition.
Table 2 shows the results of the t-tests. A statistically significant difference was found for all fabrics when comparing the optimal parameter condition with the no-electrostatic-stimulus condition. In contrast, a statistically significant difference was observed only for cotton when comparing the optimal parameter condition with the reference condition. These results suggest that the optimal friction stimuli identified by the response surface methodology do not necessarily outperform the reference condition determined in advance by a small group of experienced participants. However, the optimal parameter condition evoked a stronger perception of softness compared to the no-electrostatic-stimulus condition.

4. Discussion

This study aimed to optimize the perception of softness induced by low-frequency frictional vibration stimuli, as reported in previous studies [30,31]. The parameters manipulated for optimization were the spatial frequency of the friction stimulus and the finger sliding speed across the display.
One major difference between the present study and prior work was the simultaneous presentation of frictional and visual stimuli. The visual stimuli consisted of videos of four types of fabrics with moving drapes. As shown in Experiment 1 and the subsequent analyses, the optimal wavelength was approximately 15–17 mm and did not depend on the fabric type. In contrast, the optimal sliding speed varied with the fabric type, ranging from approximately 90 to 170 mm/s. This velocity range falls within the range of natural finger exploration speeds [67].
The results of Experiment 2 indicated that the visual cues—speed of the moving drapes, or the playback speed of the videos—had no significant effect on softness judgments. Therefore, the differences in optimal sliding speeds observed in Experiment 1 are likely attributable primarily to haptic cues rather than visual motion.
In Experiment 3, the optimized tactile stimuli resulted in higher softness scores compared to the no-tactile-stimulus condition. A significant difference compared to the center condition of the parameter range was observed for only one of the four fabric types. This does not necessarily indicate a failure of the optimization; rather, it may reflect that the center of the parameter search space was already close to the optimal condition. In this study, the parameter search range was centered around expected optimal values determined through preliminary experiments.
The reason why the fabric type presented as a visual stimulus influenced the optimal sliding speed remains unclear. One plausible explanation is that the perceived bending stiffness or softness inferred from the visual information played a role. Among the four fabric types, as exhibited by the widths of drapes, the bending stiffness of artificial leather was relatively high. Fabric bending stiffness could be inferred to some extent from still or moving drape images [49,50,68,69].
Additionally, in Experiment 2, the average softness scores for each fabric were 3.8 for leather, 5.4 for towel, 5.1 for cotton, and 5.5 for suede, indicating that leather was perceived as harder than the other fabrics. That is, for fabrics perceived as stiff, the optimal sliding speeds tended to be relatively higher, while for less stiff fabrics, the optimal speeds tended to be lower. This observation is partly consistent with previous findings on exploratory hand movements [51], where individuals were more likely to perform sliding or rubbing motions on materials that appeared hard, while pressing movements—often accompanied by slower sliding velocities—were more frequently observed for materials that appeared soft. Thus, the optimal sliding speeds identified in the present study may reflect the natural exploratory movements people adopt based on the visual appearance of the material. Whether this relationship between optimal sliding speed and fabric characteristics (thickness and softness) is generalizable remains an open question for future research.
The optimal wavelength of 15–17 mm identified in this study differed slightly from the value of 10.6 mm reported in a previous study without visual stimuli [30]. The two studies differ primarily in the context in which participants made their judgments: in the present study, participants evaluated the softness of visually presented fabrics, whereas in the previous study, they evaluated the softness of the touch panel itself. This contextual difference could have contributed to the discrepancy in optimal wavelength, although the exact reason remains unclear. Rational explanations for this discrepancy are needed to generalize the findings.
Nevertheless, when considering the values reported in previous studies [30,31,33,34] alongside those obtained in the present study, an effective spatial wavelength for evoking softness likely falls within the range of 10 to 20 mm. Moreover, our results suggest that this optimal wavelength is largely independent of the finger sliding speed. This finding provides a practical advantage, as it implies that softness can be effectively evoked using a simplified approach based on low-frequency frictional variation. In real-world applications, users typically employ arbitrary finger speeds, making it impractical to constrain the effective speed range. In contrast, it is feasible to implement a fixed spatial wavelength of 10–20 mm to reliably induce the perception of softness.
An intriguing question is whether the spatial wavelength λ or the temporal frequency f = v / λ (resulting from finger movement) is more critical for softness presentation. Kim et al. [30] suggested that the optimal spatial wavelength and sliding speed corresponded to a temporal frequency of approximately 18.5 Hz. In contrast, the optimal values obtained in Experiment 1 of the present study yielded temporal frequencies ranging from 6.2 to 9.8 Hz (towel: 8.6 Hz, cotton: 7.2 Hz, leather: 9.8 Hz, suede: 6.2 Hz). The approximately threefold difference between these temporal frequencies suggests that it is unreasonable to conclude that a particular temporal frequency is universally effective.
The findings of the present study raise the possibility that spatial wavelength may play a more influential role than temporal frequency in the perception of softness. For example, conditions such as ( λ , v ) = ( 7.9 mm , 79 mm / s ) and ( 22.1 mm , 220 mm / s ) , which produce similar temporal frequencies ( f 10 Hz), did not result in comparable softness sensations. While this observation suggests a potential dominance of spatial cues, the current study was not designed to directly test the relative contributions of spatial wavelength and temporal frequency. Clarifying this relationship will require future experiments explicitly aimed at examining these factors.
This study has several limitations and suggests multiple aspects for future research.
First, only sinusoidal frictional stimuli were tested. While the sine wave is a reasonable initial choice due to its simplicity and smoothness, it may not be the most effective waveform. Optimizing the waveform or functional form of the stimulus could be meaningful, though doing so would substantially increase the number of parameters and, consequently, the experimental cost. Nevertheless, comparing the sine wave with alternative waveforms—such as triangular or bell-shaped profiles—would be a valuable next step.
Additionally, it would be practically relevant to compare the effectiveness of vibrotactile versus frictional stimuli in presenting softness sensations. Understanding which modality is more suitable could inform real-world applications.
This study focused on cloth as the visual stimulus, with a view toward commercial applications such as e-commerce experiences via touch panels. Future research should broaden the range of materials, including those relevant to human skin contact, and particularly those expected to be encountered in practical use cases. For example, the perception of softness from furry fabrics qualitatively differs from that of deformable cloth [52,70], suggesting that the optimal spatial wavelength may also differ accordingly.
Most participants in this study were Asian university students. As the concept of softness may depend on cultural or linguistic background [71], results could vary with different populations. Cross-cultural studies are needed to assess the generalizability of the findings.
Furthermore, some datasets did not fit well to the second-order surface assumed in response surface methodology, with R 2 values below 0.49. In such cases, more complex surface functions may be necessary, and the current use of a central composite design may need to be revisited and adapted.
The tactile display system and the video playback of the moving drapes were not synchronized. Therefore, we could not objectively verify how accurately participants matched their finger movements to the drape motion. Although the experimenter visually monitored whether participants followed the instructions to slide their fingers in synchrony with the moving images, this assessment was not based on quantitative measurement and may introduce variability in the results.
Given these limitations, the generalizability of the current findings should be interpreted with caution.
Finally, although the present study did not aim to elucidate why low-frequency frictional variation evokes softness perception, this question is closely related to the optimization of tactile stimuli and represents an important aspect to be addressed in future research.
One potential application of the techniques discussed in this study is their implementation in flexible visual displays with touch-detection capabilities [21,22]. In such a case, the inherent flexibility of the visual display would be perceptible to the user. If electrostatic friction modulation is also implemented, it could superimpose tactile softness sensations onto the physically flexible display, thereby enhancing the perception of softness in visually presented fabric products. This multimodal effect may enable more effective communication of material qualities through the display. However, a significant challenge arises: in flexible touch panels, the contact area between the finger and the panel surface may not remain stable, which could hinder the effectiveness of electrostatic friction stimuli. To our knowledge, there are no prior reports of electrostatic friction stimuli being successfully implemented on flexible surfaces, and this remains a key technical hurdle for future exploration.
Another promising application of the present method lies in its potential integration with visually induced haptic illusions [25,26,27]. For instance, the technique proposed in [25], which dynamically depicts the indentation of an elastic object during surface sliding, may synergize more effectively with friction modulation than other approaches that focus on object deformation via pinching [26]. In our study, participants viewed fabric images featuring a moving drape, which served as visual cues for softness perception. As discussed earlier, such dynamic imagery can play a critical role in cross-modal softness judgments. Therefore, the low-frequency tactile stimulation explored in this work is likely compatible with visual softness cues. A potential future direction involves combining friction modulation with visually simulated rubbing of soft materials [25], which may further enhance the perceived softness through multisensory integration. We plan to investigate the effectiveness of this multimodal approach in future studies.

5. Conclusions

This study optimized the presentation of softness using low-frequency frictional modulation on a surface tactile display. By combining electrostatic tactile stimuli with videos of moving fabric drapes, we investigated whether optimal tactile parameters vary with the type of visual material.
The optimal spatial wavelength was consistently 15–18 mm across all fabrics, while the optimal sliding speed varied by material, ranging from 90 to 170 mm/s. These results suggest that while speed may need adjustment depending on the visual context, a fixed spatial wavelength in the fixed range is generally effective. A follow-up experiment showed that optimized tactile stimuli improved softness ratings compared to no-stimulus conditions, though the effect of optimization was significant for only one fabric.
These findings support the use of frictional modulation for evoking softness and provide design insights for enhancing realism in surface tactile displays.

Author Contributions

Conceptualization, A.C. and S.O.; methodology, A.C. and S.O.; software, A.C.; validation, A.C., S.O., and A.K.; formal analysis, A.C. and S.O.; investigation, A.C. and S.O.; resources, A.C.; data curation, A.C.; writing—original draft preparation, A.C. and S.O.; writing—review and editing, A.C., S.O., and A.K.; visualization, A.C.; supervision, S.O.; project administration, S.O.; funding acquisition, S.O. All authors have read and agreed to the published version of the manuscript.

Funding

This research was funded by MEXT Kakenhi (23H04360 and 24K03019).

Institutional Review Board Statement

This study was conducted in accordance with the Declaration of Helsinki and approved by the Institutional Review Board, Hino Campus, Tokyo Metropolitan University (R6-009, date of approval: 25 March 2025).

Informed Consent Statement

Written informed consent was obtained from all participants involved in the study.

Data Availability Statement

Raw data are available upon request.

Conflicts of Interest

The authors declare no conflicts of interest.

References

  1. Basdogan, C.; Giraud, F.; Levesque, V.; Choi, S. A review of surface haptics: Enabling tactile effects on touch surfaces. IEEE Trans. Haptics 2020, 13, 450–470. [Google Scholar] [CrossRef]
  2. Otake, K.; Okamoto, S.; Akiyama, Y.; Yamada, Y. Tactile texture rendering for electrostatic friction displays: Incorporation of low-frequency friction model and high-frequency textural model. IEEE Trans. Haptics 2022, 15, 68–73. [Google Scholar] [CrossRef]
  3. Wiertlewski, M.; Lozada, J.; Hayward, V. The Spatial Spectrum of Tangential Skin Displacementcan Encode Tactual Texture. IEEE Trans. Robot. 2011, 27, 461–472. [Google Scholar] [CrossRef]
  4. Winfield, L.; Glassmire, J.; Colgate, J.E.; Peshkin, M. T-PaD: Tactile pattern display through variable friction reduction. In Proceedings of the Second Joint EuroHaptics Conference and Symposium on Haptic Interfaces for Virtual Environment and Teleoperator Systems, Tsukuba, Japan, 22–24 March 2007; pp. 421–426. [Google Scholar]
  5. Liu, G.; Zhang, C.; Sun, X. Tri-modal tactile display and its application into tactile perception of visualized surfaces. IEEE Trans. Haptics 2020, 13, 733–744. [Google Scholar] [CrossRef]
  6. Lévesque, V.; Oram, L.; MacLean, K.; Cockburn, A.; Marchuk, N.D.; Johnson, D.; Colgate, J.E.; Peshkin, M.A. Enhancing physicality in touch interaction with programmable friction. In Proceedings of the ACM SIGCHI Conference on Human Factors in Computing Systems, Vancouver, BC, Canada, 7–12 May 2011; pp. 2481–2490. [Google Scholar]
  7. Breitschaft, S.J.; Pastukhov, A.; Carbon, C.C. Where’s my button? Evaluating the user experience of surface haptics in featureless automotive user interfaces. IEEE Trans. Haptics 2022, 15, 292–303. [Google Scholar] [CrossRef]
  8. Park, G.; Choi, S.; Hwang, K.; Kim, S.; Sa, J.; Joung, M. Tactile effect design and evaluation for virtual buttons on a mobile device touchscreen. In Proceedings of the 13th International Conference on Human Computer Interaction with Mobile Devices and Services, Stockholm, Sweden, 30 August–2 September 2011; ACM: New York, NY, USA, 2011. MobileHCI’11. pp. 11–20. [Google Scholar] [CrossRef]
  9. Macdonald, S.; Freeman, E.; Pollick, F.; Brewster, S. Prototyping and evaluation of emotionally resonant vibrotactile comfort objects as a calming social anxiety intervention. ACM Trans. Comput.-Hum. Interact. 2024, 31, 1–48. [Google Scholar] [CrossRef]
  10. Blanc, C.; Buisson, J.C.; Kruck, J.; Kostrubiec, V. Haptic coordination: Squeezing a vibrating stress ball decreases anxiety and arousal. Hum. Mov. Sci. 2024, 96, 103220. [Google Scholar] [CrossRef]
  11. Ryu, S.; Pyo, D.; Lim, S.C.; Kwon, D.S. Mechanical Vibration Influences the Perception of Electrovibration. Sci. Rep. 2018, 8, 4555. [Google Scholar] [CrossRef]
  12. Hassen, R.; Gülecyüz, B.; Steinbach, E. PVC-SLP: Perceptual vibrotactile-signal compression based-on sparse linear prediction. IEEE Trans. Multimed. 2021, 23, 4455–4468. [Google Scholar] [CrossRef]
  13. Mullenbach, J.; Peshkin, M.; Colgate, J.E. eShiver: Lateral Force Feedback on Fingertips through Oscillatory Motion of an Electroadhesive Surface. IEEE Trans. Haptics 2017, 10, 358–370. [Google Scholar] [CrossRef]
  14. Vezzoli, E.; Amberg, M.; Giraud, F.; Lemaire-Semail, B. Electrovibration modeling analysis. In Haptics: Neuroscience, Devices, Modeling, and Applications; Springer: Berlin/Heidelberg, Germany, 2014; pp. 369–376. [Google Scholar] [CrossRef]
  15. Nakamura, T.; Yamamoto, A. A multi-user surface visuo-haptic display using electrostatic friction modulation and capacitive-type position sensing. IEEE Trans. Haptics 2016, 9, 311–322. [Google Scholar] [CrossRef]
  16. Bau, O.; Poupyrev, I.; Israr, A.; Harrison, C. TeslaTouch: Electrovibration for touch surfaces. In Proceedings of the Annual ACM Symposium on User Interface Software and Technology, New York, NY, USA, 3–6 October 2010; pp. 283–292. [Google Scholar]
  17. Smith, T.A.; Gorlewicz, J.L. HUE: A hybrid ultrasonic and electrostatic variable friction touchscreen. In Proceedings of the IEEE World Haptics Conference, Munich, Germany, 6–9 June 2017; pp. 635–640. [Google Scholar] [CrossRef]
  18. Wiertlewski, M.; Fenton Friesen, R.; Colgate, J.E. Partial squeeze film levitation modulates fingertip friction. Proc. Natl. Acad. Sci. USA 2016, 113, 9210–9215. [Google Scholar] [CrossRef]
  19. Ito, K.; Okamoto, S.; Yamada, Y.; Kajimoto, H. Tactile texture display with vibrotactile and electrostatic friction stimuli mixed at appropriate ratio presents better roughness textures. ACM Trans. Appl. Percept. 2019, 16, 20. [Google Scholar] [CrossRef]
  20. Bernard, C.; Ystad, S.; Monnoyer, J.; Wiertlewski, M. Detection of friction-modulated textures is limited by vibrotactile sensitivity. IEEE Trans. Haptics 2020, 13, 542–551. [Google Scholar] [CrossRef]
  21. Anwer, A.H.; Khan, N.; Ansari, M.Z.; Baek, S.S.; Yi, H.; Kim, S.; Noh, S.M.; Jeong, C. Recent advances in touch sensors for flexible wearable devices. Sensors 2022, 22, 4460. [Google Scholar] [CrossRef]
  22. Ouyang, C.; Liu, D.; He, K.; Kang, J. Recent advances in touch sensors for flexible displays. IEEE Open J. Nanotechnol. 2023, 4, 36–46. [Google Scholar] [CrossRef]
  23. Jiao, J.; Zhang, Y.; Wang, D.; Visell, Y.; Cao, D.; Guo, X.; Sun, X. Data-driven rendering of fabric textures on electrostatic tactile displays. In Proceedings of the IEEE Haptics Symposium, San Francisco, CA, USA, 25–28 March 2018; pp. 169–174. [Google Scholar]
  24. Jiao, J.; Wang, D.; Zhang, Y.; Cao, D.; Visell, Y.; Guo, X.; Sun, X. Detection and discrimination thresholds for haptic gratings on electrostatic tactile displays. IEEE Trans. Haptics 2019, 12, 34–42. [Google Scholar] [CrossRef]
  25. Li, M.; Sareh, S.; Xu, G.; Ridzuan, M.B.; Luo, S.; Xie, J.; Wurdemann, H.; Althoefer, K. Evaluation of pseudo-haptic interactions with soft objects in virtual environments. PLoS ONE 2016, 11, e0157681. [Google Scholar] [CrossRef]
  26. Yabe, S.I.; Kishino, H.; Kimura, T.; Nojima, T. Pseudo-haptic feedback on softness induced by squeezing action. In Proceedings of the IEEE World Haptics Conference, Munich, Germany, 6–9 June 2017; pp. 557–562. [Google Scholar] [CrossRef]
  27. Argelaguet, F.; Sato, T.; Duval, T.; Kitamura, Y.; Lécuyer, A. Collaborative pseudo-haptics: Two-user stiffness discrimination based on visual feedback. In Proceedings of the Haptics: Neuroscience, Devices, Modeling, and Applications, Versailles, France, 24–26 June 2014; Springer: Berlin/Heidelberg, Germany, 2014; pp. 49–54. [Google Scholar] [CrossRef]
  28. Ban, Y.; Narumi, T.; Tanikawa, T.; Hirose, M. Controlling perceived stiffness of pinched objects using visual feedback of hand deformation. In Proceedings of the IEEE Haptics Symposium (HAPTICS), Houston, TX, USA, 23–26 February 2014; pp. 557–562. [Google Scholar] [CrossRef]
  29. Konyo, M.; Yoshida, A.; Tadokoro, S.; Saiwaki, N. A tactile synthesis method using multiple frequency vibration for representing virtual touch. In Proceedings of the IEEE/RSJ International Conference on Intelligent Robots and Systems, Edmonton, AB, Canada, 2–6 August 2005; pp. 3965–3971. [Google Scholar]
  30. Kim, G.; Okamoto, S.; Maruyama, H. Response surface of softness perceived via frictional tactile stimuli on flat touch-display. In Proceedings of the International Symposium on Affective Science and Engineering, Nagoya, Japan, 24–27 October 2017; p. PM–1B–04. [Google Scholar] [CrossRef]
  31. Ito, K.; Okamoto, S.; Elfekey, H.; Kajimoto, H.; Yamada, Y. Feeling softness on a hard touch panel using an electrostatic tactile texture display. In Proceedings of the IEEE 6th Global Conference on Consumer Electronics, Nagoya, Japan, 24–27 October 2017; pp. 282–283. [Google Scholar] [CrossRef]
  32. Ikeda, A.; Suzuki, T.; Takamatsu, J.; Ogasawara, T. Producing method of softness sensation by device vibration. In Proceedings of the IEEE International Conference on Systems, Man, and Cybernetics, Manchester, UK, 13–16 October 2013; pp. 3384–3389. [Google Scholar]
  33. Kim, G.; Okamoto, S.; Akiyama, Y.; Yamada, Y. Softness Presentation via Friction Force Control on Electrostatic Tactile Panel Display. In Proceedings of the IEEE 2nd Global Conference on Life Sciences and Technologies, Kyoto, Japan, 10–12 March 2020; pp. 219–221. [Google Scholar] [CrossRef]
  34. Chihara, A.; Azechi, M.; Kurita, A.; Okamoto, S. Soft feel presentation on touch panels using low-frequency friction stimuli. In Proceedings of the IEEE 13th Global Conference on Consumer Electronics, Kitakyushu, Japan, 29 October–1 November 2024; pp. 738–740. [Google Scholar] [CrossRef]
  35. Ochoa, J.; Torebjörk, E. Sensations evoked by intraneural microstimulation of single mechanoreceptor units innervating the human hand. J. Physiol. 1983, 342, 633–654. [Google Scholar] [CrossRef]
  36. Vallbo, A.B.; Johansson, R.S. Properties of cutaneous mechanoreceptors in the human hand related to touch sensation. Hum. Neurobiol. 1984, 3, 3–14. [Google Scholar]
  37. Iggo, A. Sensory receptors in the skin of mammals and their sensory functions. Rev. Neurol. 1985, 141, 599–613. [Google Scholar] [CrossRef] [PubMed]
  38. Kajimoto, H.; Kawakami, N.; Maeda, T.; Tachi, S. Tactile feeling display using functional electrical stimulation. In Proceedings of the International Conference on Artificial Reality and Telexistence, Tokyo, Japan, 16–18 December 1999. [Google Scholar]
  39. Wang, H.; Sun, Q.; Okamoto, S. Surface shape alters perceived material softness. i-Perception 2024, 15, 20416695241245021. [Google Scholar] [CrossRef] [PubMed]
  40. Qingyu Sun, H.W.; Okamoto, S. Designing macroscopic surface features perceived as soft during finger sliding. IEEE Access 2025, 13, 92965–92973. [Google Scholar] [CrossRef]
  41. Freeman, A.W.; Johnson, K.O. A model accounting for effects of vibratory amplitude on responses of cutaneous mechanoreceptors in macaque monkey. J. Physiol. 1982, 323, 43–64. [Google Scholar] [CrossRef]
  42. Bolanowski, S.J.; Gescheider, G.A.; Verrillo, R.T.; Checkosky, C.M. Four channels mediate the mechanical aspects of touch. J. Acoust. Soc. Am. 1988, 84, 1680–1694. [Google Scholar] [CrossRef]
  43. Bicchi, A.; Schilingo, E.P.; De Rossi, D. Haptic discrimination of softness in teleoperation: The role of the contact area spread rate. IEEE Trans. Robot. Autom. 2000, 16, 496–504. [Google Scholar] [CrossRef]
  44. Scilingo, E.P.; Bianchi, M.; Grioli, G.; Bicchi, A. Rendering softness: Integration of kinesthetic and cutaneous information in a haptic device. IEEE Trans. Haptics 2010, 3, 109–118. [Google Scholar] [CrossRef]
  45. Inoue, K.; Okamoto, S.; Akiyama, Y.; Yamada, Y. Surfaces with finger-sized concave feel softer. IEEE Trans. Haptics 2022, 15, 32–38. [Google Scholar] [CrossRef]
  46. Mete, M.; Jeong, H.; Wang, W.D.; Paik, J. SORI: A softness-rendering interface to unravel the nature of softness perception. Proc. Natl. Acad. Sci. USA 2024, 121, e2314901121. [Google Scholar] [CrossRef]
  47. Johansson, R.S.; Vallbo, Å.B. Tactile sensory coding in the glabrous skin of the human hand. Trends Neurosci. 1983, 6, 27–32. [Google Scholar] [CrossRef]
  48. Blake, D.T.; Hsiao, S.S.; Johnson, K.O. Neural coding mechanisms in tactile pattern recognition: The relative contributions of slowly and rapidly adapting mechanoreceptors to perceived roughness. J. Neurosci. 1997, 17, 7480–7489. [Google Scholar] [CrossRef] [PubMed]
  49. Bouman, K.L.; Xiao, B.; Battaglia, P.; Freeman, W.T. Estimating the material properties of fabric from video. In Proceedings of the IEEE International Conference on Computer Vision, Sydney, NSW, Australia, 1–8 December 2013; pp. 1984–1991. [Google Scholar] [CrossRef]
  50. Jimba, N.; Ishikawa, T.; Yanagida, Y.; Mori, H.; Sasaki, K.; Ayama, M. Visual ratings of “softness/hardness” of rotating fabrics. Int. J. Cloth. Sci. Technol. 2019, 32, 48–62. [Google Scholar] [CrossRef]
  51. Nagano, H.; Okamoto, S.; Yamada, Y. Haptic invitation of textures: Perceptually prominent properties of materials determine human touch motions. IEEE Trans. Haptics 2014, 7, 345–355. [Google Scholar] [CrossRef] [PubMed]
  52. Cavdan, M.; Doerschner, K.; Drewing, K. Task and material properties interactively affect softness explorations along different dimensions. IEEE Trans. Haptics 2021, 14, 603–614. [Google Scholar] [CrossRef]
  53. Yokosaka, T.; Kuroki, S.; Watanabe, J.; Nishida, S. Linkage between free exploratory movements and subjective tactile ratings. IEEE Trans. Haptics 2017, 10, 217–225. [Google Scholar] [CrossRef] [PubMed]
  54. Mallinckrodt, E.; Hughes, A.L.; Sleator, J.W. Perception by the skin of electrically induced vibrations. Science 1953, 118, 277–278. [Google Scholar] [CrossRef]
  55. Strong, R.M.; Troxel, D.E. An electrotactile display. IEEE Trans. Man-Mach. Syst. 1970, 11, 72–79. [Google Scholar] [CrossRef]
  56. Persson, B.N.J. The dependency of adhesion and friction on electrostatic attraction. J. Chem. Phys. 2018, 148, 144701. [Google Scholar] [CrossRef]
  57. Azechi, M.; Okamoto, S. Combined virtual bumps and textures on electrostatic friction tactile displays. In Proceedings of the IEEE 11th Global Conference on Consumer Electronics, Osaka, Japan, 18–21 October 2022; pp. 315–317. [Google Scholar] [CrossRef]
  58. Fan, S.; Shen, Z.; Koenig, B.L.; Ng, T.T.; Kankanhalli, M.S. When and why static images are more effective than videos. IEEE Trans. Affect. Comput. 2020, 14, 308–320. [Google Scholar] [CrossRef]
  59. Kawabe, T.; Maruya, K.; Fleming, R.W.; Nishida, S. Seeing liquids from visual motion. Vis. Res. 2015, 109, 125–138. [Google Scholar] [CrossRef]
  60. Li, X.; Kurashiki, T.; Fukuda, M. Effects of design parameters on click characteristics of a round-type diaphragm for push momentary switch. J. Adv. Mech. Des. Syst. Manuf. 2013, 7, 268–281. [Google Scholar] [CrossRef]
  61. Yamada, S.; Okamoto, S.; Ogura, Y.; Kosuge, Y. Optimal design of a haptic popping toy using response surface. J. Adv. Mech. Des. Syst. Manuf. 2024, 18, JAMDSM0014. [Google Scholar] [CrossRef]
  62. Khuri, A.I.; Mukhopadhyay, S. Response surface methodology. Wiley Interdiscip. Rev. Comput. Stat. 2010, 2, 128–149. [Google Scholar] [CrossRef]
  63. Bhattacharya, S. Central Composite Design for response surface methodology and its application in pharmacy. In Response Surface Methodology in Engineering Science; Kayaroganam, P., Ed.; IntechOpen: Londen, UK, 2021. [Google Scholar] [CrossRef]
  64. Azari, A.; Mesdaghinia, A.; Ghanizadeh, G.; Masoumbeigi, H.; Pirsaheb, M.; Ghafari, H.R.; Khosravi, T.; Sharafi, K. Which is better for optimizing the biosorption process of lead—Central composite design or the Taguchi technique? Water Sci. Technol. 2016, 74, 1446–1456. [Google Scholar] [CrossRef]
  65. Faul, F.; Erdfelder, E.; Lang, A.G.; Buchner, A. G*Power 3: A flexible statistical power analysis program for the social, behavioral, and biomedical sciences. Behav. Res. Methods 2007, 39, 175–191. [Google Scholar] [CrossRef] [PubMed]
  66. Mukaka, M.M. Statistics corner: A guide to appropriate use of correlation coefficient in medical research. Malawi Med. J. 2012, 24, 69–71. [Google Scholar]
  67. Tanaka, Y.; Bergmann Tiest, W.M.; Kappers, A.M.L.; Sano, A. Contact force and scanning velocity during active roughness perception. PLoS ONE 2014, 9, e93363. [Google Scholar] [CrossRef]
  68. Bhat, K.S.; Twigg, C.D.; Hodgins, J.K.; Khosla, P.K.; Popović, Z.; Seitz, S.M. Estimating cloth simulation parameters from video. In Proceedings of the ACM SIGGRAPH/Eurographics Symposium on Computer Animation, San Diego, CA, USA, 26–27 July 2003; pp. 37–51. [Google Scholar]
  69. Jang, S.Y.; Ha, J. The influence of tactile information on the human evaluation of tactile properties. Fash. Text. 2021, 8, 39. [Google Scholar] [CrossRef]
  70. Hosoi, J.; Jin, D.; Ban, Y.; Warisawa, S. Voluminous fur stroking experience through interactive visuo-haptic model in virtual reality. IEEE Trans. Haptics 2025, 18, 232–243. [Google Scholar] [CrossRef]
  71. Arakawa, N.; Watanabe, T.; Fukushima, K.; Matsumoto, Y.; Nakatani, M. Talk to us about your skin: The relationship between spoken language and haptic exploratory procedures. Int. J. Cosmet. Sci. 2024, 46, 437–456. [Google Scholar] [CrossRef]
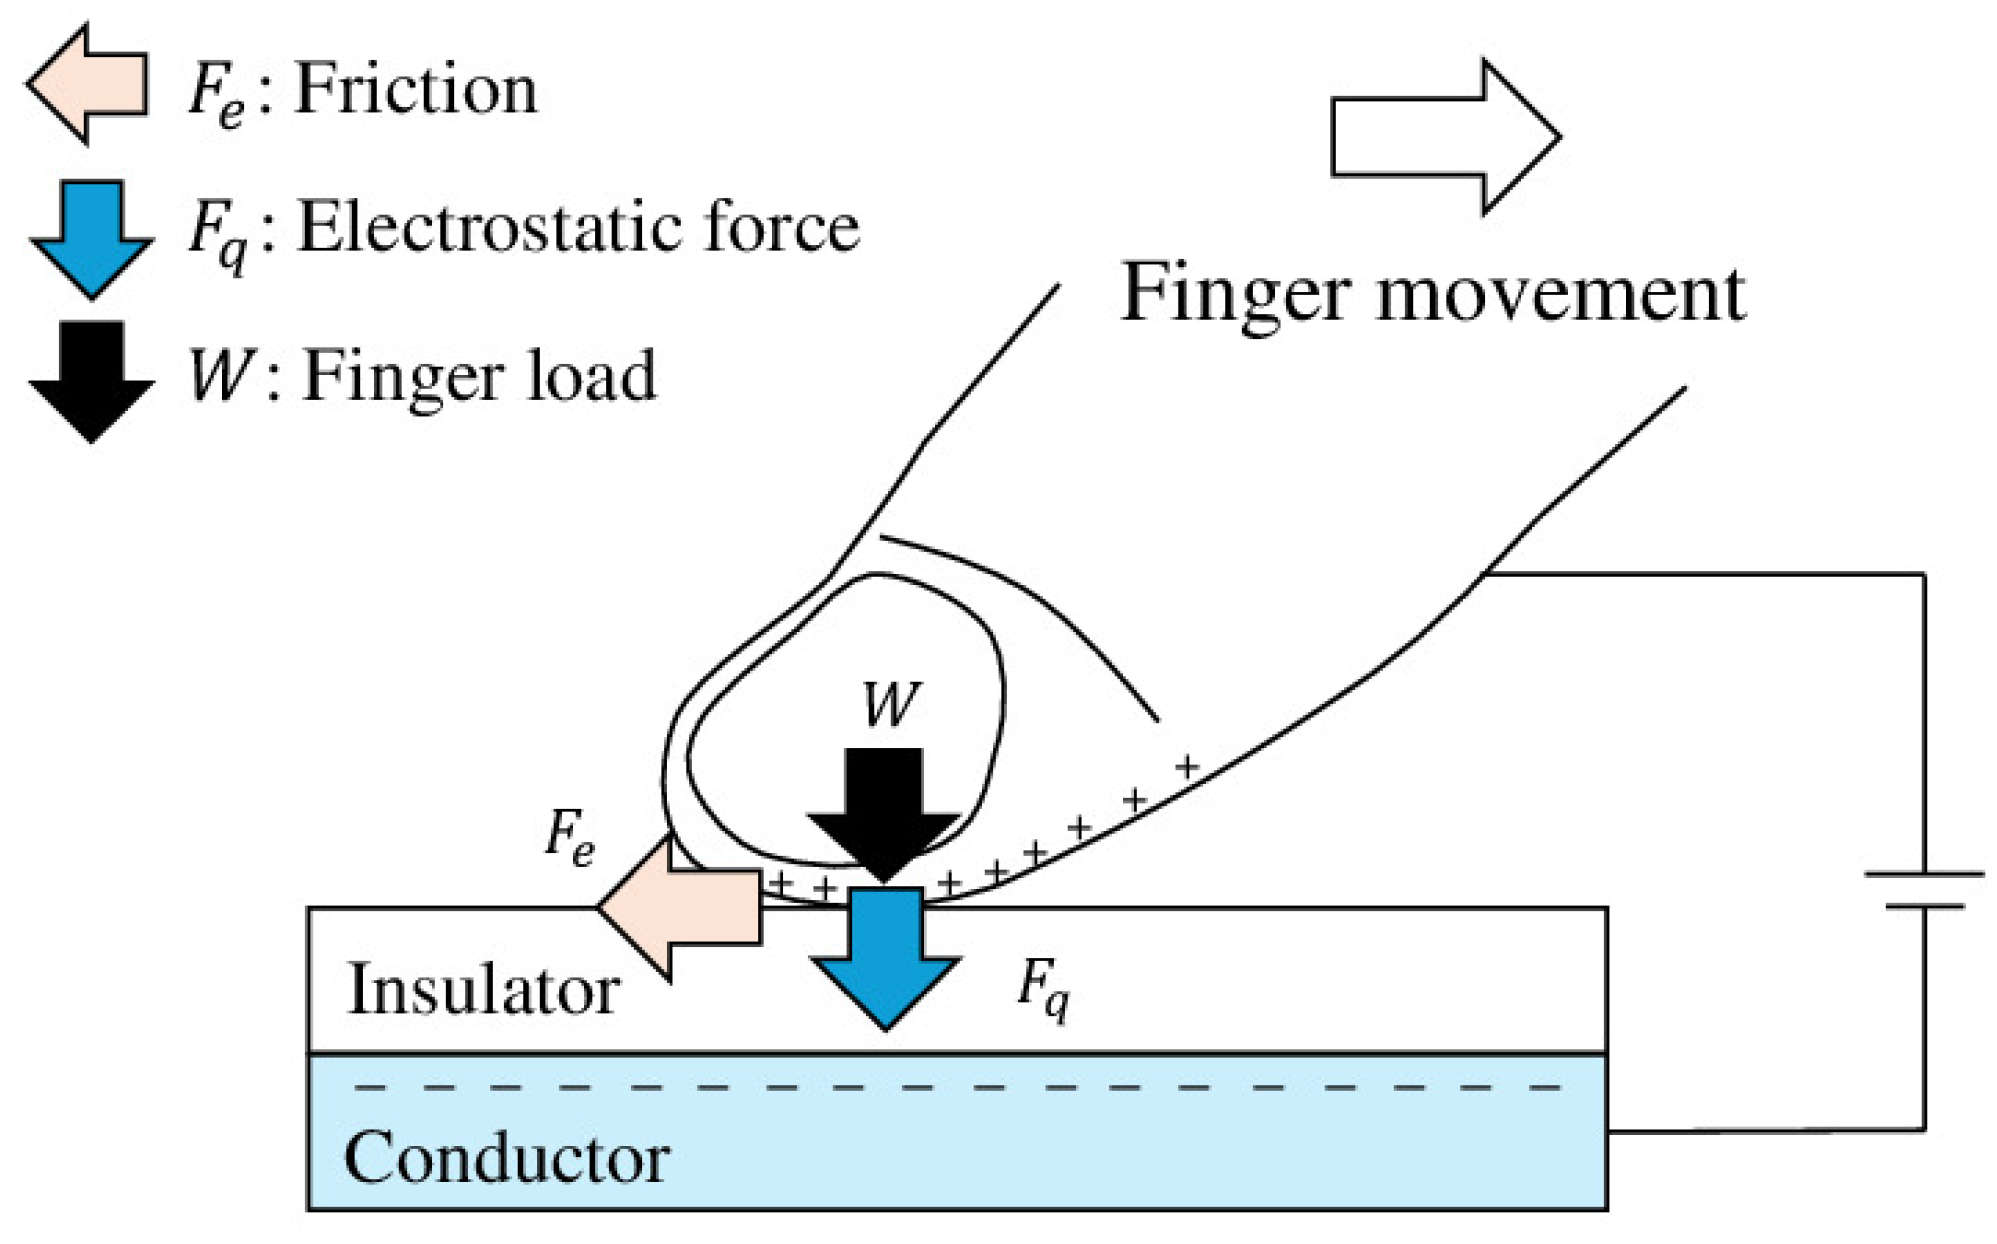
Figure 1. Principle of electrostatic texture display. The plus (+) and minus (−) symbols indicate positive and negative charges, respectively.
Sci 07 00096 g001
Figure 2. Tactile texture display using electrostatic friction stimuli.
Sci 07 00096 g002
Figure 3. Four types of cloth images used in experiments.
Sci 07 00096 g003
Figure 4. Visual stimulus depicting a single cloth drape moving from left to right. The drape constantly moved at different speed levels.
Sci 07 00096 g004
Figure 5. Parameter combinations used for generating tactile stimuli. Nine conditions were selected based on a central composite design.
Sci 07 00096 g005
Figure 6. Example of a response surface for suede. The coefficient of determination is R 2 = 0.84 . The red point indicates the estimated maximum score, while the gray circles represent the scores for the nine tested parameter combinations.
Sci 07 00096 g006
Figure 7. Optimal value of softness for each type of cloth. Mean and standard error among the participants.
Sci 07 00096 g007
Figure 8. Subjective softness reported in Experiment 2. ** and *** indicate significance levels of 0.01 and 0.001, respectively.
Sci 07 00096 g008
Table 1. Results of MANOVA on the optimal stimulus parameters: λ and v. Adjusted p-values are those corrected by Bonferroni method.
Comparison PairF-Valuep-ValueAdjusted p-ValueEffect Size ( η 2 )
Towelvs.Cotton1.60 2.3 × 10 1 1.000.14
Towelvs.Synthetic leather0.98 3.9 × 10 1 1.000.094
Towelvs.Suede8.28 2.5 × 10 3 1.5 × 10 2 0.47
Cottonvs.Synthetic leather3.90 4.0 × 10 2 2.4 × 10 1 0.34
Cottonvs.Suede1.79 1.9 × 10 1 1.000.17
Synthetic leathervs.Suede13.15 3.5 × 10 4 2.1 × 10 3 0.61
Table 2. Results of t-tests for inter-condition comparisons for each cloth type.
ClothComparison Pairt-Valuep-ValueAdjusted p-Value
TowelOptimal vs. Reference0.16 8.7 × 10 1 1.00
Optimal vs. No friction5.23 1.0 × 10 4 2.0 × 10 4
CottonOptimal vs. Reference3.30 5.3 × 10 3 1.0 × 10 2
Optimal vs. No friction6.55 1.3 × 10 5 2.6 × 10 5
LeatherOptimal vs. Reference2.37 3.2 × 10 2 6.5 × 10 2
Optimal vs. No friction7.72 2.0 × 10 6 4.0 × 10 6
SuedeOptimal vs. Reference1.82 8.9 × 10 2 1.7 × 10 1
Optimal vs. No friction7.46 3.0 × 10 6 6.0 × 10 6
Disclaimer/Publisher’s Note: The statements, opinions and data contained in all publications are solely those of the individual author(s) and contributor(s) and not of MDPI and/or the editor(s). MDPI and/or the editor(s) disclaim responsibility for any injury to people or property resulting from any ideas, methods, instructions or products referred to in the content.