Article

Numerical Study of Flow Characteristics on Landward Levee Slopes Under Overtopping at Different Froude Numbers

by
Chanjin Jeong
,
Dong-Hyun Kim
and
Seung-Oh Lee
*
Department of Civil & Environmental Engineering, Hongik University, Seoul 04066, Republic of Korea
*
Author to whom correspondence should be addressed.
Sci 2025, 7(3), 119; https://doi.org/10.3390/sci7030119
Submission received: 21 July 2025 / Revised: 19 August 2025 / Accepted: 27 August 2025 / Published: 1 September 2025
(This article belongs to the Section Environmental and Earth Science)

Abstract

Most levees are composed of earthen materials, making their structural stability vulnerable under flood conditions, especially in the case of overtopping. This study aims to analyze the relationship between the channel Froude number and the flow behavior on the landward slope of a levee during overtopping, enabling the prediction of landward slope velocity (LSV) in advance. Accurate estimation of flow velocity on the landward slope is crucial for predicting the occurrence and intensity of erosion during overtopping events, and it serves as a critical criterion for designing protective armoring and assessing levee structural stability. Numerical simulations were conducted under various Froude numbers in the channel to estimate the corresponding LSV. Key variables, including channel discharge, velocity, levee height, and overtopping flow depth, were used to establish quantitative correlations between channel flow characteristics and LSV. The proposed model effectively predicts the LSV for channel Froude numbers approximately between 0.05 and 0.60. The findings allow for a simplified estimation of LSV based on changes in Froude number and overtopping flow depth, providing valuable baseline data for planning levee reinforcement and maintenance strategies.

1. Introduction

In recent years, the frequency of localized torrential rainfall and extreme precipitation events has been increasing due to the impacts of climate change. Consequently, the probability of rising flood levels in rivers and the overtopping of levees is also increasing. River levees, which are predominantly constructed using earthen materials, are particularly vulnerable to structural instability when subjected to the hydraulic loads induced during flood events. Studies from flood-prone regions in Europe, North America, and Asia have consistently reported overtopping and erosion as the leading causes of levee failures, typically accounting for over 70–80% of total failure cases [1].
Overtopping occurs when the flood discharge exceeds the conveyance capacity of the river channel, or when debris or sediment reduces that capacity. Erosion, on the other hand, typically takes place in steep or highly curved river sections, where excessive flow velocities and tractive forces scour the levee slopes and/or toe regions [2]. Additionally, the investigation of 230 levee overtopping cases across the United States from 1948 to 2019 reported that approximately 65% of the incidents resulted in levee failure [3]. These results indicate a high likelihood of structural failure following overtopping. However, most studies have focused on channel flow or overall failure mechanisms, and quantitative analyses of flow characteristics on the landward slope of levees remain relatively limited. Since slope velocity can induce localized scour and structural damage on the surface of the landward slope of levees, understanding it is another key factor in ensuring levee stability.
To address these challenges, extensive research has been conducted to investigate levee overtopping mechanisms and develop mitigation strategies. Various reinforcement techniques, including riprap, geotextiles, concrete blocks, soil improvement, sheet piles, and geogrid systems, have been applied to enhance erosion resistance and stability. However, most studies have focused on experimental validations, with limited quantitative analyses of flow behavior during overtopping. While early studies relied primarily on hydraulic experiments, recent research has increasingly shifted toward numerical modeling capable of addressing complex conditions.
Wu [4] proposed a simplified physically based model to simulate earthen embankment breaching caused by overtopping and piping. Han and Choi [5] proposed an empirical formula for estimating segmental tractive forces based on slope gradients for levee slopes composed of cohesive soils and analyzed the allowable tractive force under varying revetment materials and vegetation densities using hydraulic model tests. Kim et al. [6] conducted a study comparing the scour resistance of native soil and soil-improvement materials to ensure the hydraulic stability of riverbanks and proposed optimal mixing ratios and material properties suitable for revetment reinforcement. Go et al. [7] validated the effectiveness of levee reinforcement methods through large-scale overtopping collapse experiments using full-scale levee models and quantitatively evaluated slope erosion rates using image-based analysis techniques. Lee et al. [8] analyzed the collapse delay effects of reinforcement layouts on slope through laboratory experiments aimed at preventing levee failure under extreme rainfall conditions. They found that the collapse time increased with the installation of reinforcements, with variations depending on the configuration of the reinforcements. Hughes and Nadal [9] experimentally analyzed flow characteristics on the crest and landward slope of levees under combined conditions of wave overtopping and storm surge and proposed empirical formulas for estimating overtopping discharge and channel velocity. Feliciano Cestero et al. [10] examined the influence of variations in particle size distribution and soil cohesion on levee failure behavior during overtopping through laboratory experiments. They quantitatively assessed the correlation between failure width, location, and geotechnical properties. Islam [11] conducted experimental studies on the effects of bed material composition and relative bed elevation on levee breach behavior, revealing that elevated bed levels significantly accelerate both horizontal and vertical failure processes of the levee.
Cho [12] performed probabilistic numerical simulations coupled with infiltration analysis to examine slope failure induced by rainfall infiltration, and proposed rainfall thresholds for failure prediction through Monte Carlo-based slope stability assessments. Kim et al. [13] carried out three-dimensional numerical analyses of infiltration and slope stability in levees, identifying vulnerable sections by comparing various cross-sectional profiles and analyzing discrepancies among different modeling approaches. Sharp and McAnally [14] employed numerical simulations to calculate flow velocity, water depth, and shear stress under overtopping conditions, and analyzed the distribution of shear stress in relation to changes in water level and surface roughness, thereby suggesting design thresholds applicable for levee protection. Hu et al. [15] proposed a new slope failure parameter that incorporates sediment transport and flow conditions to simulate overtopping-induced levee collapse. Xiao et al. [16] applied a numerical model to investigate wave overtopping of a levee during Hurricane Katrina. Li et al. [17] conducted a numerical study on combined wave overtopping and storm surge overflow for HPTRM-strengthened levees. Their approach, applied to a numerical model, demonstrated improved accuracy in predicting breach geometry and outflow discharge compared to previous models. Previous studies on levee overtopping have primarily focused on the mechanisms of levee failure, estimation of overtopping discharge, and analysis of scour initiation conditions. Although some research has qualitatively analyzed overtopping behavior using dimensionless parameters such as the Froude number, there has been limited effort to quantitatively predict the velocity distribution along the landward slope based on the relationship between upstream inflow discharge and the resulting flow regime. Table 1 provides a summary of previous studies on levee overtopping and reinforcement strategies.
Accordingly, this study aims to predict the landward slope flow velocity based on key hydraulic parameters, including Froude numbers, levee height, and overtopping flow depth, using numerical simulations. Through this approach, this study seeks to identify the correlation between channel flow conditions and landward slope flow behavior. Furthermore, by non-dimensionalizing the flow characteristics, this study derives generalized variables applicable to various levee scales and flood scenarios, which are expected to be widely applicable in levee design, planning for levee reinforcement, and levee maintenance.

2. Theoretical Background

2.1. Levee Failure Mechanism for Overtopping

Levee overtopping refers to the phenomenon in which the river water level exceeds the levee crest due to flooding or intense localized rainfall, causing water to flow over the top of the levee [18]. This is recognized as one of the primary causes of levee failure. When overtopping occurs, the overflow discharges across the landward slope of the levee at high velocities, generating substantial shear stress along the landward slope surface. This shear stress leads to erosion, which rapidly undermines the structural stability of the levee.
Failure due to overtopping typically occurs through a progressive failure mechanism involving multiple stages. Initially, the levee body becomes saturated due to prolonged rainfall or flood conditions, which reduces the soil’s shear strength and weakens the slope stability. As the water surface elevation surpasses the levee height, overtopping begins, and erosion is initiated at the toe of the landward slope by the overtopping flow. This initial erosion process has been experimentally verified through laboratory model tests, which demonstrated the onset of scour at the landward toe during the early stages of overtopping [19]. This scour progressively moves upslope, a process commonly referred to as headcut migration, eventually reaching the upper portion of the landward slope and the underside of the levee crest, culminating in complete structural failure of the levee.

2.2. Levee Overtopping

During overtopping events, the flow on the levee slope exhibits the characteristics of a shallow free-surface flow, whose behavior varies spatially depending on the levee geometry and hydraulic conditions. Typically, the overtopping flow accelerates as it passes over the levee crest and descends along the landward slope. In this process, the flow depth gradually decreases while the velocity increases, resulting in an accelerating flow regime. These flow characteristics significantly influence the shear stress acting on the slope surface, the depth of scour, and the evaluation of erosion resistance. As such, understanding and quantifying these characteristics is essential for assessing levee stability and developing effective protective measures. Although the actual flow varies spatially, a simplified analysis can be conducted by assuming uniform flow conditions over specific segments of the slope. Under such uniform flow assumptions, flow depth and velocity can be approximated using hydraulic equations. These approximations enable the estimation of average flow velocity and shear stress on the slope, which can serve as reference values for comparison with numerical model outputs. Figure 1 provides an overview of overtopping flow over a levee: (a) bird’s-eye view and (b) cross-section along A–A′.
When assuming uniform flow conditions, the velocity along the levee slope can be calculated using Manning’s equation, as expressed in Equation (1).
v = 1 n R 2 / 3 S 1 / 2
where v is the mean velocity (m/s), n is the Manning’s roughness coefficient, R is the hydraulic radius (m), and S is the slope gradient of the levee slope, which can be reasonably approximated as the energy slope ( S 0 S f ) under shallow, uniform flow conditions. In the case of levee slopes, the cross-sectional geometry is typically simple, and the flow over the slope generally occurs under shallow, free-surface conditions. Given that the flow width ( W f = 5   m ) is significantly greater than the flow depth (if h < 1 10 W f ,   h R ), the hydraulic radius ( R ) can be reasonably approximated by the flow depth (h). Here, h c h denotes the channel water depth, while h s represents the water depth measured along the landward slope of the levee. Under these assumptions, the flow is often analyzed on a unit-width basis, in which the total discharge (Q) is represented as the unit-width discharge ( q o v e r t o p p e d ). This simplification enables the theoretical estimation of flow velocity on the slope, which can be used to validate numerical simulation results and serves as a practical reference for designing slope reinforcements and establishing criteria for scour protection.

3. Numerical Model

3.1. Overview

In this study, FLOW-3D ver.2023R2, a three-dimensional computational fluid dynamics (CFD) software developed by Flow Science, Inc. in Los Alamos, New Mexico, USA, was employed. FLOW-3D is a general-purpose CFD tool that provides capabilities for simulating a wide range of fluid dynamics phenomena, including turbulence, shallow water flows, and solidification processes. A three-dimensional model was adopted to simulate the full flow evolution from channel inflow to overtopping, accounting for vertical flow variations and turbulent behavior along the levee slope. The FLOW-3D model solves the governing equations of fluid motion, specifically the continuity equation and the momentum equations, to simulate fluid flow. Based on these governing equations, FLOW-3D is capable of accurately reproducing complex hydraulic behaviors. In this study, the flow characteristics occurring along the levee slope under overtopping conditions were analyzed.
The governing equations in this model are the continuity equation and momentum equations, which are given by Equations (2)–(5) [20].

3.1.1. Continuity Equation

For incompressible flow, the governing continuity equation can be expressed as follows.
x u A x + y v A y + z w A z = R S O R ρ
where u , v , w represent the velocity components in the x , y , z directions, respectively, A x , A y , A z denote the area fractions for fluid flow, ρ is the density, and R S O R represents the mass source/sink term.

3.1.2. Momentum Equations

The momentum equations in the x, y, and z directions can be written as follows:
u t + 1 V f u A x u x + v A y u y + w A z u z = 1 ρ p x + F x R S O R ρ V f u
v t + 1 V f u A x v x + v A y v y + w A z v z = 1 ρ p y + F y R S O R ρ V f v
w t + 1 V f u A x w x + v A y w y + w A z w z = 1 ρ p z + F z R S O R ρ V f w
where A x , A y , A z represent the area fractions for fluid flow, V f is the volume fraction, ρ is the density, R S O R represents the mass source/sink term, and F x , F y , F z represent the total forces, including gravitational and inertial forces, in each respective direction.

3.1.3. Numerical Method for Free Surface Flow

The free surface flow was resolved using the Volume of Fluid (VOF) method embedded in the Finite Volume Method (FVM) framework of FLOW-3D [20]. The computational domain was discretized into fixed Eulerian grid cells, and the governing equations were solved using an explicit time-stepping scheme. The VOF technique tracks the free surface by computing the volume fraction of fluid in each grid cell, effectively capturing dynamic surface behaviors such as overtopping and wave propagation. FLOW-3D enhances this method by applying accurate boundary condition treatments and specialized numerical differencing schemes to minimize interface smearing. This enables reliable and detailed simulation of transient free surface flows encountered during levee overtopping events.

3.2. Model Configuration

3.2.1. Levee Geometry

To numerically analyze the flow characteristics on the levee slope during overtopping, an idealized straight channel with a symmetric levee cross-section was constructed. The levee geometry used in the numerical model is shown in Figure 2. The levee height and crest width were both set to 1.0 m, while the slope gradient was set to 1:3. This gradient is widely adopted in levee design and research, as it provides a reasonable balance between stability and hydraulic performance.
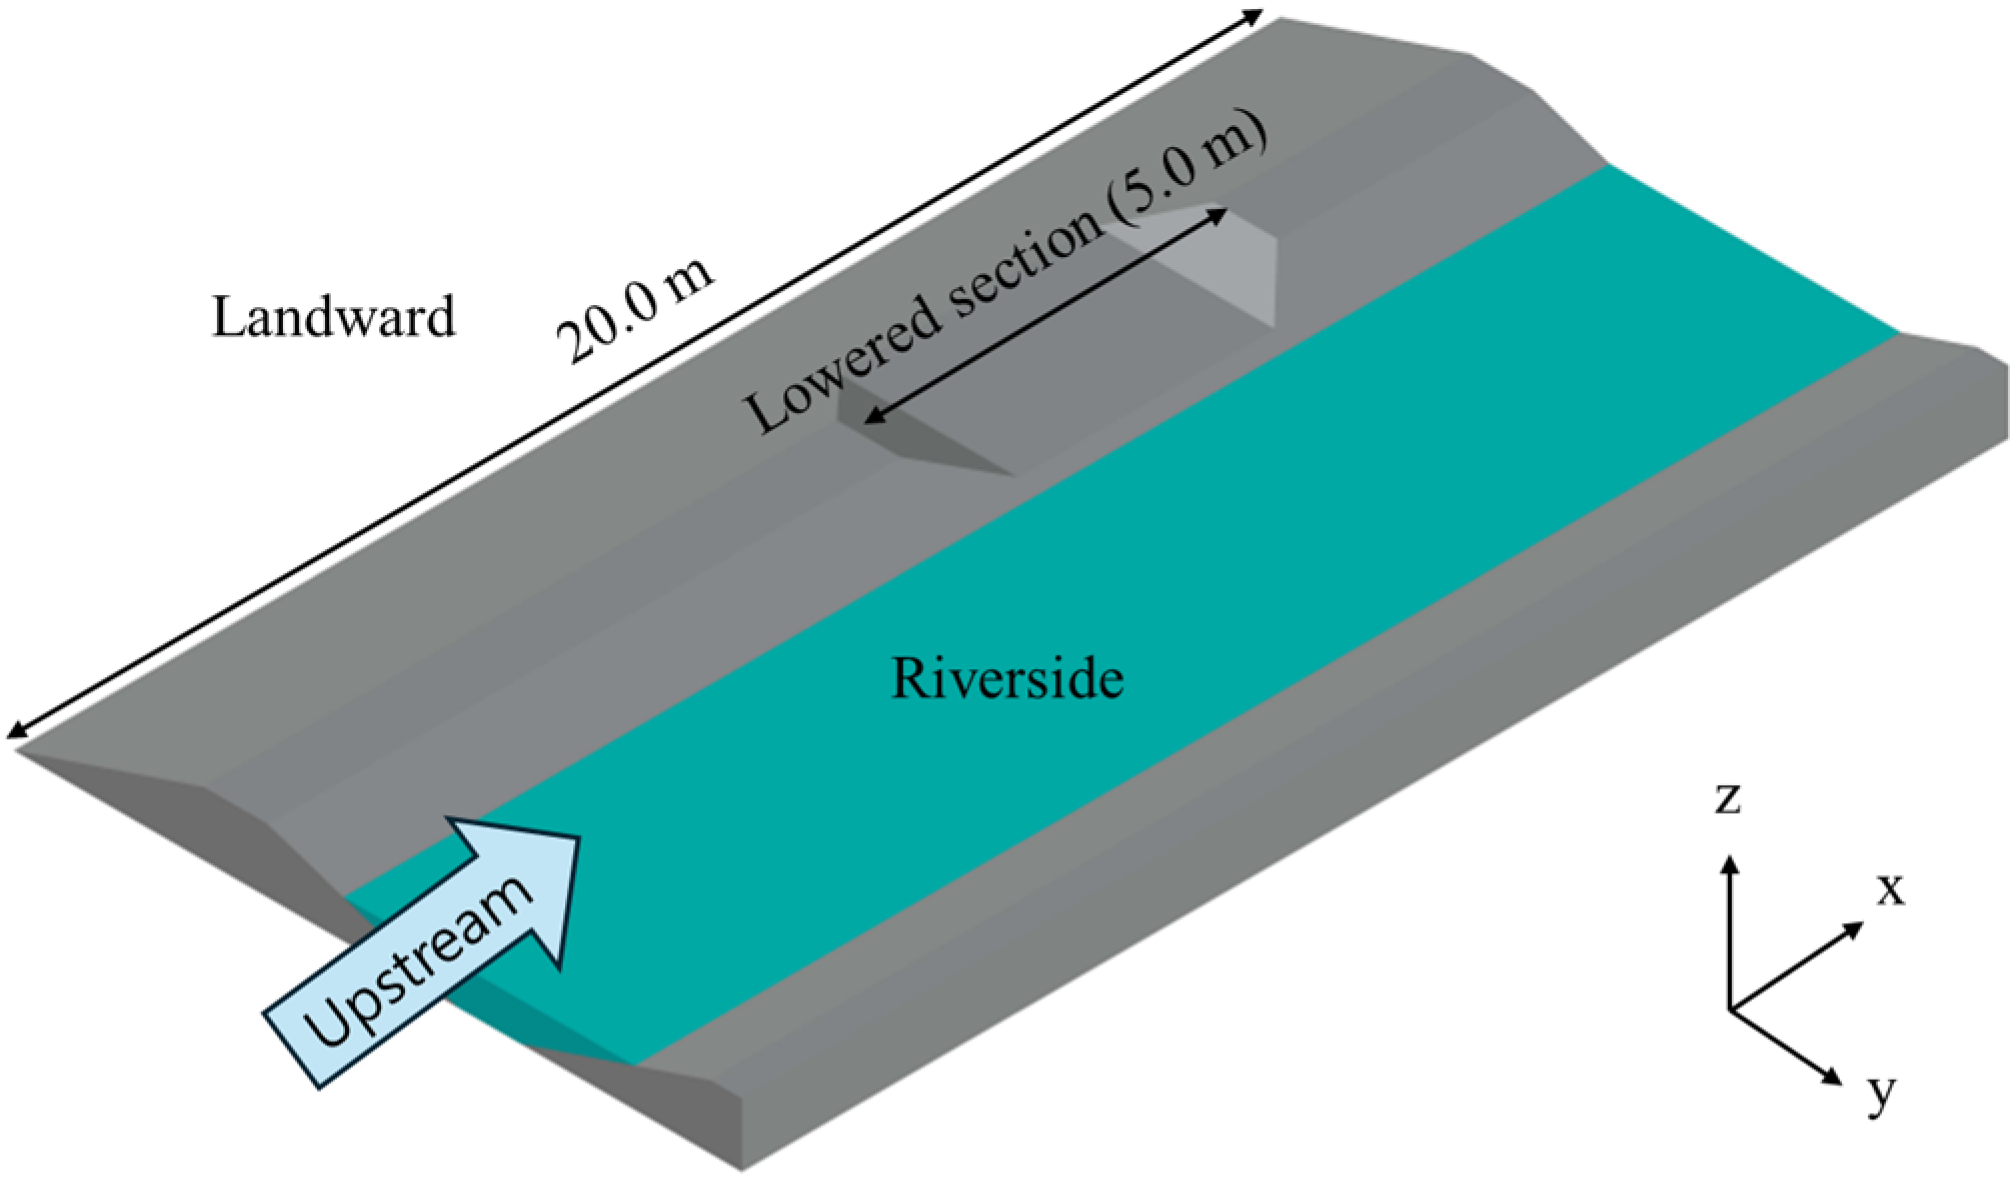
To replicate overtopping phenomena, a localized depression zone was introduced at the center of the channel, as illustrated in Figure 3. This segment was configured with a relatively lower crest elevation compared to the rest of the levee, thereby promoting overtopping as water levels rise. This configuration represents localized, low-elevation areas commonly found worldwide, often due to settlement or vehicular traffic. Following previous studies, a breach was intentionally introduced to examine the slope flow characteristics during overtopping-induced failure [21]. The purpose of this setup is to control the initial location of overtopping and to enhance the accuracy of flow velocity analysis along the slope. In addition, Manning’s roughness coefficient was set to 0.02, reflecting the relatively smooth and compacted surface condition typical of reinforced earthen levees. This value is supported by reference tables that report compacted earth or smooth vegetated surfaces with roughness coefficients in the range of 0.01–0.03 [22].

3.2.2. Grid Configuration

The FLOW-3D model used in this study employs a control volume-based numerical method and utilizes a Cartesian grid structure for flow analysis within the computational domain. In this modeling approach, the levee is defined as an obstacle, which represents an impermeable body that interacts with the fluid flow. The geometric resolution of the obstacle depends on the grid resolution, which directly affects the accuracy with which the levee’s shape is represented.
To accurately reproduce the shallow overland flow occurring along the levee slope, the computational grid was constructed using isotropic cells with a resolution of 0.04 m in both horizontal and vertical directions. The total computational domain was defined as 14.5 m in the x-direction, 20.0 m in the y-direction, and 1.0 m in the z-direction, resulting in a total of 4,428,600 grid cells. This high-resolution grid enabled the precise representation of the levee slope and crest geometry, resulting in improved accuracy in simulating the associated flow characteristics. A no-slip boundary condition was imposed along the wall and bottom surfaces, and the grid spacing was sufficiently refined to ensure that multiple cells were located within the viscous sublayer. Furthermore, Grid Convergence Index (GCI) verification was performed to confirm the adequacy of the grid resolution and the reliability of the simulation results.

3.2.3. Boundary Conditions

The boundary conditions applied in the three-dimensional numerical model are summarized in Table 2. A wall condition was assigned to the bottom of the domain (Z min) and the right bank boundary (Y max). The top boundary (Z max), which is in contact with the atmosphere, was set as a pressure boundary with no active flow, and the flow fraction was specified as zero. The upstream boundary at the levee inlet (X min) was defined with a volume flow rate condition. The downstream boundary (X max) and the landward outlet (Y min) were both specified as pressure (outflow) boundaries.

3.2.4. Turbulence Model

In FLOW-3D, turbulence models such as RNG (Renormalized Group Theory) and k ϵ ,   k ω models can be applied. Yakhot et al. [23] developed the RNG turbulence model to address the limitations of the k ϵ ,   k ω models. The RNG model incorporates statistically derived model constants, making it less sensitive to these constants and producing reliable results. Additionally, it is known to provide more accurate analysis for complex turbulent flow fields compared to traditional turbulence models. For this study, the RNG turbulence model was selected to more accurately analyze the complex turbulent flows associated with overtopping.

3.2.5. Case Setup

The primary objective of this study is to quantitatively evaluate the variation in flow velocity along the landward slope under conditions of levee overtopping. Since it is difficult to control the overtopping depth in the numerical model directly, overtopping was induced by adjusting the upstream inflow discharge.
As summarized in Table 3, the inflow discharge was systematically varied from 0.50 m3/s to 6.00 m3/s across 16 simulation cases, to reflect a wide range of flood scenarios. The corresponding Froude number in the channel ranged from 0.04 to 0.43, capturing realistic flow regimes that may occur during overtopping events. Meanwhile, the landward slope was fixed at 1:3 based on standard levee design criteria to maintain consistency in the geometric boundary condition. In Table 3, y0 denotes the water depth of the river. For each discharge condition, the resulting flow velocities along the landward slope were analyzed to assess the hydraulic response associated with varying overtopping depths. The simulation was performed under steady flow conditions with a total duration of 60 s. This period was sufficient to allow the flow to stabilize after overtopping began, and adaptive time stepping was applied to ensure numerical stability. In addition, the computed shear stress in the main channel ranged from 0.17 to 5.80 kg/m2 across the 16 cases, which provides a reference for comparing hydraulic loading between the channel and the landward slope.

3.3. Model Validation

3.3.1. Comparison with Theoretical Equation

To evaluate the reliability of the numerical model developed in this study, the simulated slope flow velocities were compared with theoretical predictions. The theoretical analysis was based on Equation (1), under the assumption that uniform flow is established along the landward slope. The comparison was conducted at the region near the toe of the landward slope, where the flow was observed to become fully developed and approach uniform conditions.
For Case 1, where the upstream inflow discharge was set to 0.50 m3/s, the slope velocities obtained from both the theoretical equation and the numerical model were compared, as shown in Table 4. The difference between the two results was approximately 1.60%, indicating a close agreement with the theoretical prediction. This result demonstrates that the numerical model accurately reproduces the flow characteristics on the landward slope during overtopping conditions. The mean velocity comparison was performed at the region near the toe of the landward slope, where the flow was sufficiently developed and approached a uniform flow condition, making it consistent with the assumptions of the theoretical formula.

3.3.2. Grid Independence Evaluation

In addition, a grid convergence analysis was performed to assess the numerical accuracy of the model using three different mesh resolutions. The GCI was computed following the standard procedure proposed by Roache [24], with a safety factor of 1.25 and assuming second-order convergence. The GCI for the finest mesh (0.04 m) was found to be 3.15%, indicating that the discretization error is sufficiently small and that the numerical results are mesh independent. The GCI was calculated using Equation (6) [24].
G C I f i n e = F s × ε 21 r 21 p 1 × 100
where ε 21 = 1 2 1 represents the approximate relative error, i represents the computed value of the target variable, r 21 represents the grid refinement ratio, F s represents the safety factor, and p represents the assumed order of convergence.
The detailed results of the mesh sensitivity test and the corresponding GCI value are summarized in Table 5, confirming that the selected mesh resolution ensures sufficient convergence and numerical reliability.

4. Results and Discussion

4.1. Levee Overtopping Flow

In this study, overtopping was intentionally induced at a designated settlement zone located at the center of the left-bank levee. This zone featured a locally reduced crest elevation to concentrate overtopping flow, representing a location that is particularly susceptible to early-stage overtopping during actual flood events. The flow acceleration near the levee crest was captured through three-dimensional simulation using FLOW-3D. Accordingly, overtopping depth and slope flow velocity were evaluated at this designated section for all simulation cases. To assess the hydraulic response of the landward slope under overtopping conditions, the landward slope velocity (LSV) is defined as the maximum velocity occurring near the toe of the landward slope. In addition, the overtopping depth and velocity values presented in this study were extracted as their respective maximum values. The overtopping depth was generally measured at the levee crest, while the velocity was measured near the toe of the slope, where the flow, after developing along the slope, reached its maximum speed.
As shown in Figure 4, overtopping depth was measured at the levee crest within the settlement zone. At the same time, the slope velocity was evaluated at a specified location on the landward slope surface.
Simulation results indicated that the maximum overtopping depth in the settlement area ranged from 0.107 m to 0.254 m, while the maximum slope velocity varied from 3.170 m/s to 3.586 m/s. In general, the critical velocity for initiating erosion on a levee slope depends on various factors, including the levee material, slope gradient, and surface conditions. According to previous studies [6], the critical velocity for unprotected earthen levees is approximately 1.3 m/s, while even with basic reinforcement methods such as vegetative mats, the threshold typically remains near 3.0 m/s.
Based on this, the maximum slope velocities derived from the simulations suggest a potential for erosion and slope failure if such flow conditions persist for a sufficient duration. Furthermore, as presented in Table 6, both overtopping depth and slope velocity showed an overall increasing trend with higher inflow discharge. Notably, at higher discharge levels, the overtopping flow exhibited a pronounced tendency to shift downstream in the channel, rather than flowing solely perpendicular to the levee crest. This indicates that the overtopping flow possesses a multidirectional nature, combining both transverse and longitudinal flow components. Analysis of the velocity distribution revealed that the maximum velocity primarily occurred near the toe of the slope. As the inflow discharge increased, flow velocities rose across the entire slope, with a noticeable bias in the flow direction, suggesting a non-uniform and concentrated hydraulic pattern under high-flow conditions. Supercritical flows were observed on the landward slope of the levee, indicating shallow, high-velocity conditions that can cause significant shear stress. Such hydraulic behavior increases the likelihood of erosion, particularly near the toe of the slope, and highlights the need for reinforced protective measures in that region.

4.2. Slope Velocity Variation

The velocity and overtopping depth results presented in the previous section were derived based on a specific levee geometry and inflow discharge configuration. As such, direct comparisons across different river or levee scales may be limited. To develop a more generalized understanding applicable under various conditions, this study employed a non-dimensional analysis to compare the flow characteristics between the main channel and the landward slope of the levee. The Froude number, a dimensionless quantity representing the ratio of inertial forces to gravitational forces in fluid dynamics, serves as a critical indicator for evaluating the dynamic behavior of flow, especially in distinguishing between subcritical and supercritical conditions. To characterize the hydraulic behavior of the river, the Froude number in the main channel was calculated using representative values of flow depth and velocity. Similarly, the Froude number along the landward slope was derived using the overtopping depth and slope velocity. These two Froude numbers are defined as shown in Equations (7) and (8).
F r C h = v c h g h c h
F r S = v s g h s
where F r C h is the Froude number in the channel, F r S is the Froude number on the landward slope, v C h is the mean velocity in the channel, v s is the mean velocity on the landward slope, h C h is the flow depth in the channel, h S is the flow depth on the landward slope, and g is the gravitational acceleration.
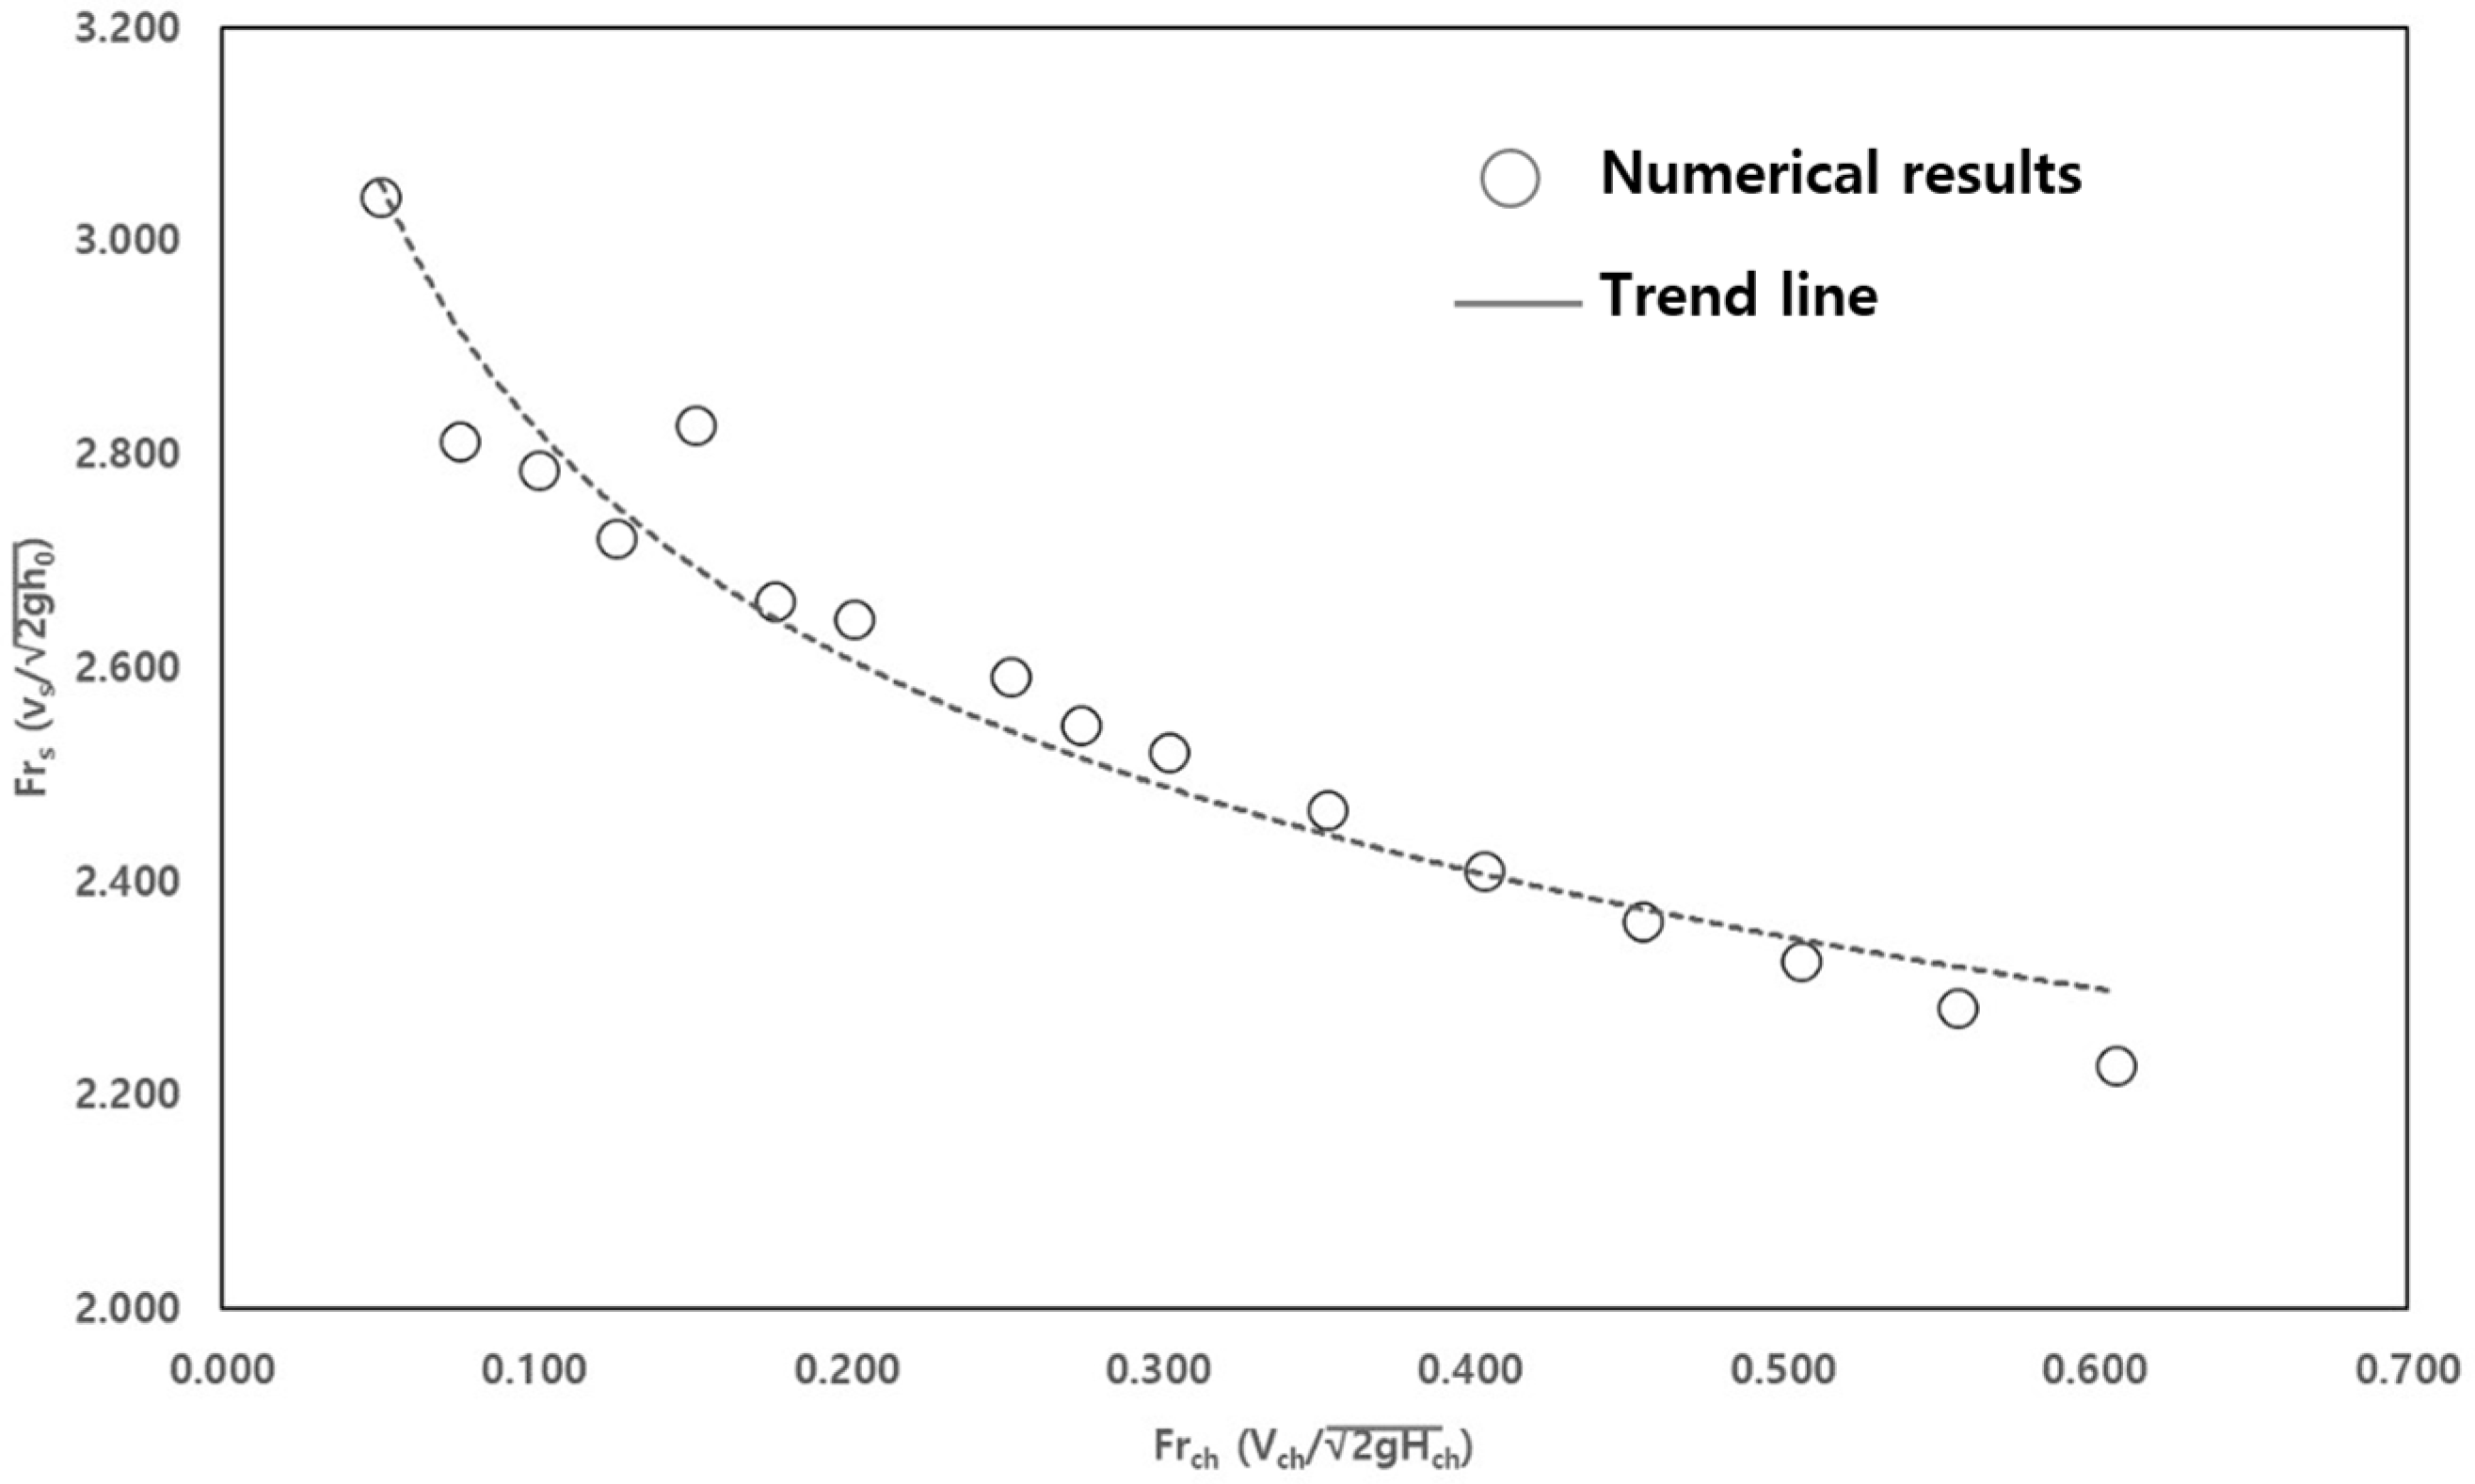
Analysis of the simulation results revealed that as the Froude number in the main channel increased, the Froude number on the landward slope exhibited a decreasing trend. This inverse relationship indicates that, for a given levee height, increases in overtopping depth result in a relatively moderate increase in slope velocity. In other words, the rate of increase in slope velocity diminishes with deeper overtopping flow. This trend provides a basis for developing a dimensionless relationship by which slope flow velocity can be estimated using overtopping depth alone. Such a formulation would allow for simplified prediction of slope flow behavior under various river conditions, without requiring detailed hydraulic modeling. The relationship between the two Froude numbers is illustrated in Figure 5, with a clear correlation between the Froude number in the main channel and the Froude number on the landward slope. Through regression analysis, an empirical relationship was derived, as expressed in Equation (9).
F r S = 2.168 × F r C h 0.115
This equation enables a dimensionless prediction of velocity on landward slopes of levee during overtopping by using the Froude number as a key indicator. With a coefficient of determination of approximately 0.94, the regression shows a strong correlation, validating its reliability across various flow rates. From an engineering application perspective, this relationship provides a practical tool for estimating LSV without requiring detailed geometric modeling. It facilitates rapid assessments in preliminary design stages, supports safety evaluations of existing levees, and helps determine the need for slope protection measures such as revetments or geotextile layers. Moreover, the use of non-dimensional parameters enhances scalability and transferability across different river sizes, allowing engineers to apply it in both small-scale channels and large river systems with confidence.

4.3. Shear Stress Response of the Landward Slope

The landward slope of levees is significantly exposed to shear stress during overtopping events, making it a primary location for structural damage and erosion. This section quantitatively evaluates the relative vulnerability of the slope by comparing the variation in shear stress concerning the Froude number between the main channel and the landward slope. As the Froude number increases, both velocity and shear stress also increase, leading to a higher risk of scour. Therefore, using the Froude number as a basis for estimating shear stress provides a practical and applicable approach in engineering practice.
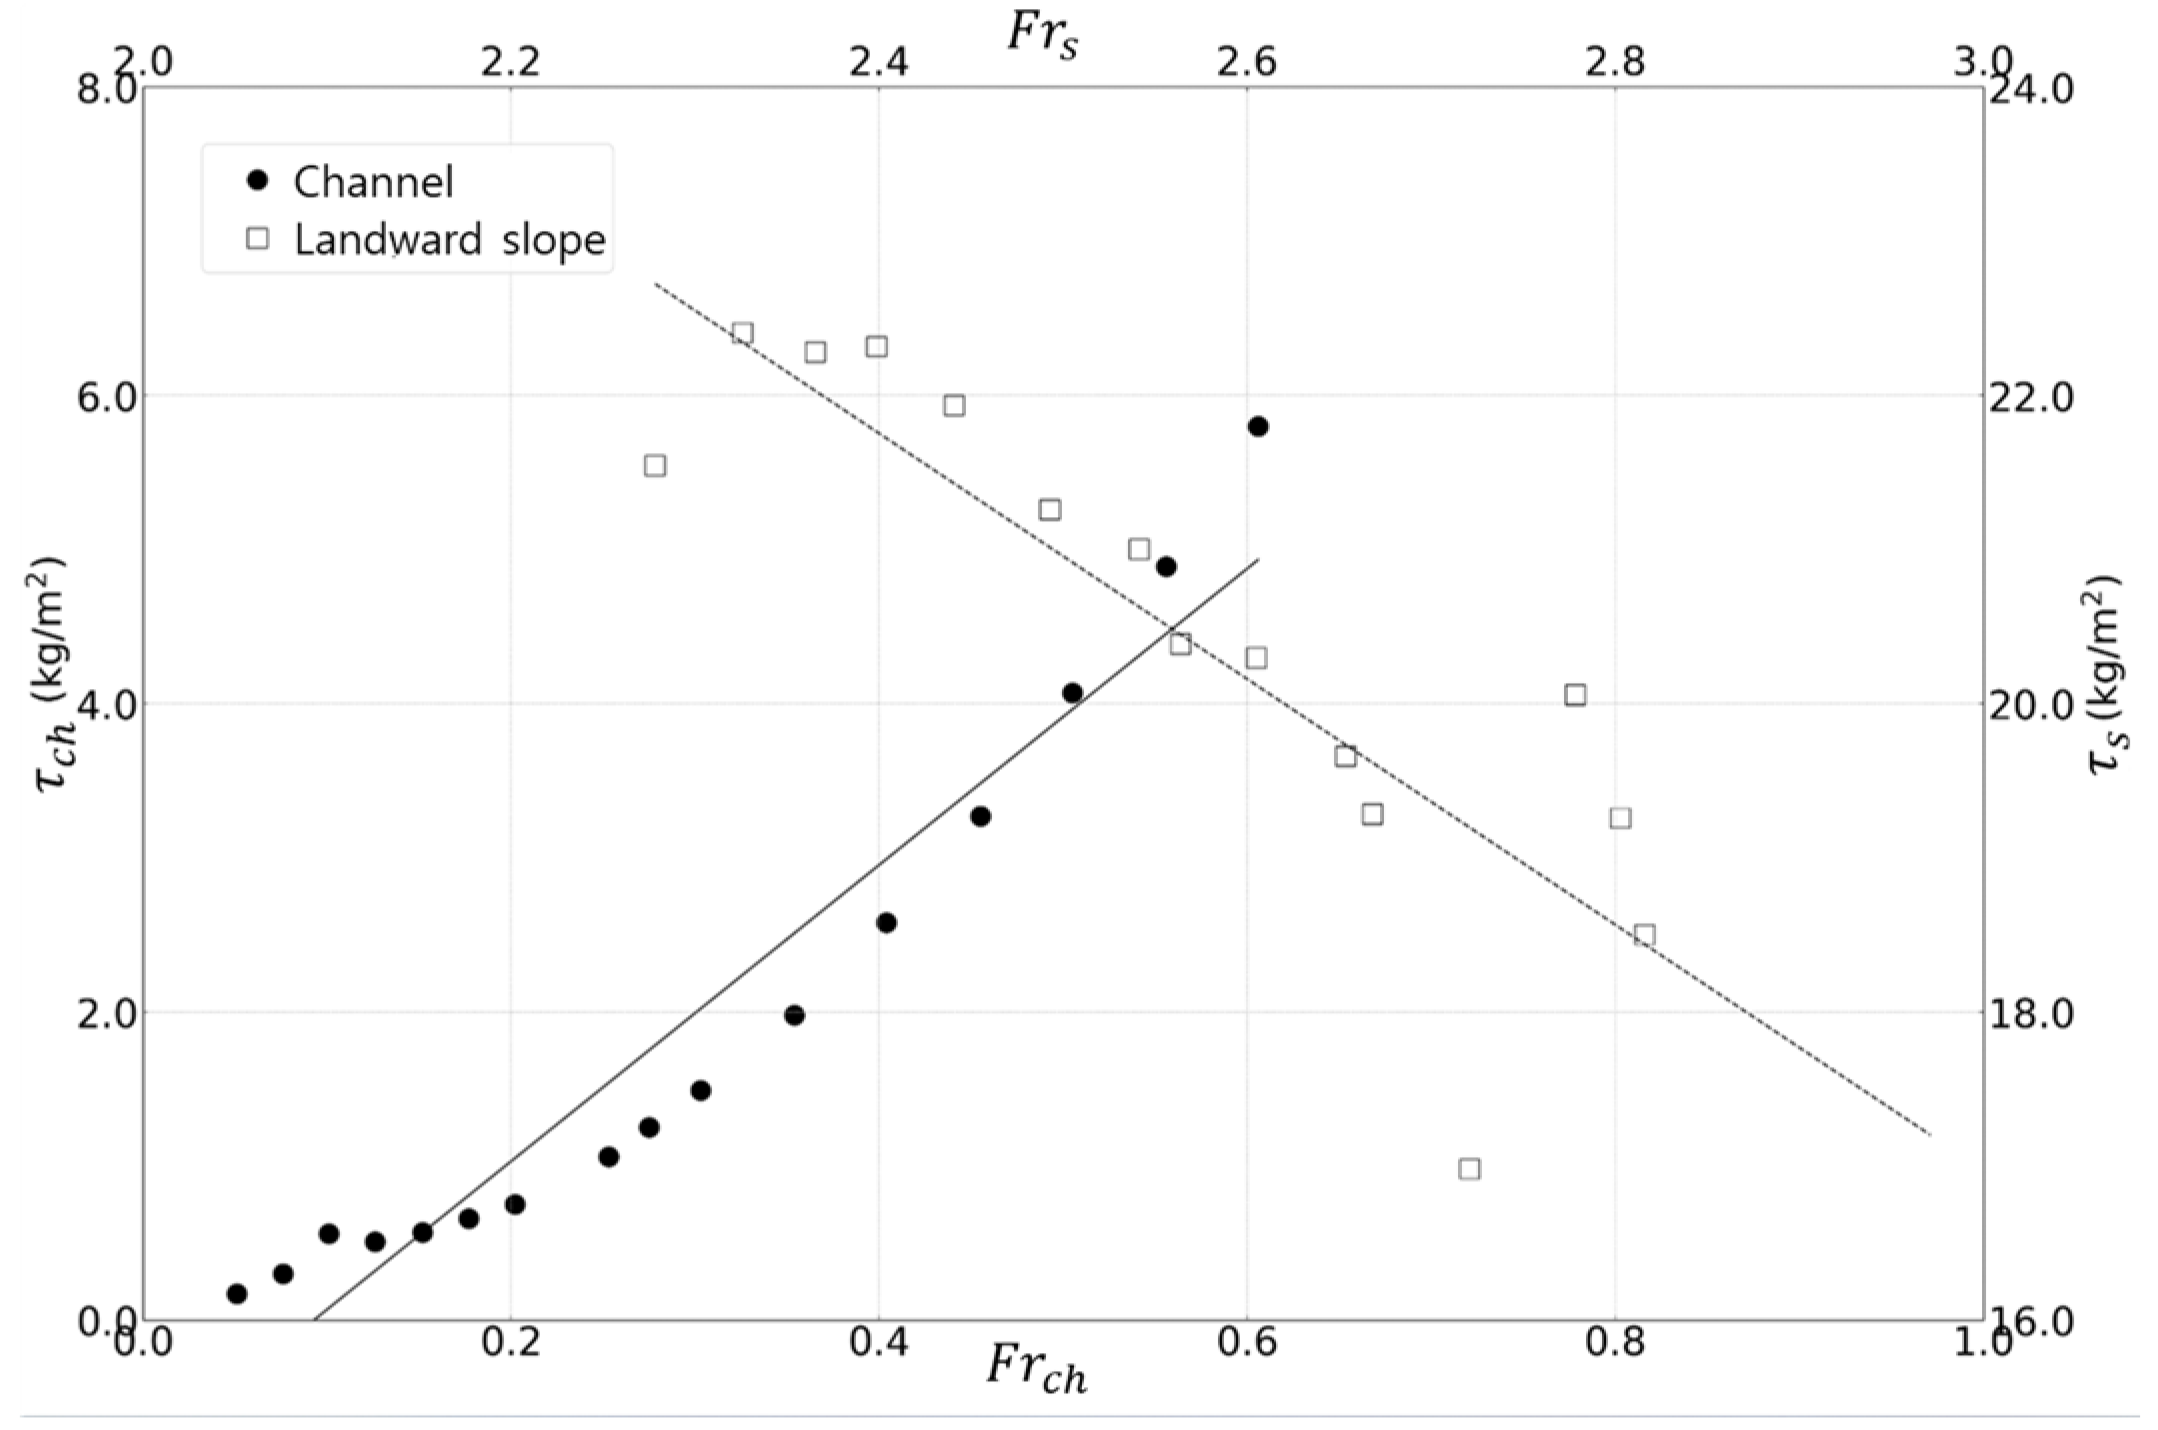
Shear stress data were collected in the main channel at the cross-section where overtopping begins, and on the landward slope at the toe region where the maximum velocity occurs. Each case was characterized by its corresponding Froude number—the Froude number in the main channel and that on the landward slope. The data were plotted as discrete points to analyze the response trend of shear stress with increasing Froude number. The Froude number in the main channel ranged from 0.05 to 0.60, while that on the landward slope ranged from 3.04 to 2.23. These values were used to compare the hydraulic responses of the two regions based on their relative magnitudes of shear stress. Minor deviations at very low/high Froude numbers arise from incomplete flow development, localized 3D effects near the slope toe, and increased sensitivity to relative roughness under shallow flows.
In the main channel, shear stress exhibited a gradual linear increase as the Froude number rose, indicating that the intensity of flow caused by increased discharge is directly reflected in the shear force. In contrast, the slope maintained consistently high levels of shear stress despite a relatively narrow range of decreasing Froude number, and the relationship also followed a linear trend. Notably, the magnitude of shear stress on the slope was approximately five to ten times higher than that in the main channel, confirming that the slope has significantly greater erosion potential.
Moreover, a comparison of the gradients of the trend lines reveals that the shear stress in the main channel is more sensitive to variations in the Froude number, whereas the slope tends to sustain high shear stress regardless of such changes. These findings indicate that the stability of the landward slope is more critically affected by shear loading than that of the main channel. Therefore, in designing slope protection works, it is essential to include structural reinforcements that consider the effects of overtopping conditions.
This analysis confirms that the comparison of shear stress with the Froude number provides an effective metric for evaluating potential damage on the landward slope during overtopping events. It also offers a practical basis for identifying erosion-prone areas and formulating appropriate mitigation strategies. It should be emphasized, however, that shear stress is generally proportional to the square of the depth-averaged velocity, and its magnitude is highly dependent on surface roughness conditions. Accordingly, the correlation presented in Figure 6 is valid only under the numerical conditions adopted in this study and should not be generalized to other hydraulic or roughness conditions without further validation.

5. Conclusions

This study aimed to quantitatively analyze the flow characteristics on the landward slope of a levee during overtopping and to propose a velocity prediction method applicable under various hydraulic conditions. To achieve this, a levee model including a localized settlement zone was constructed, and FLOW-3D was used to simulate changes in overtopping depth and slope velocity in response to varying inflow discharges.
The simulation results showed that landward slope velocities, which exceeded approximately 3 m/s, surpassed the erosion threshold for unreinforced earthen levees, indicating a potential risk of structural failure under prolonged overtopping conditions. As the inflow discharge increased, overtopping flow tended to shift toward the downstream direction of the river, and the maximum velocities were consistently concentrated near the toe of the slope.
To generalize the relationship between channel flow and slope velocity, a dimensionless analysis based on the Froude number was performed. A strong correlation was found between the Froude number in the main channel and that on the landward slope, and an empirical regression equation was derived. This correlation can serve as a practical tool for quantitatively estimating slope flow velocity under diverse river conditions.
In particular, the correlation proposed in this study enables straightforward estimation of slope flow velocity using only the design flood discharge, making it effective for the early identification of erosion-prone zones and the quantitative specification of reinforcement design conditions. This provides valuable guidance in the preliminary design phase for determining the extent of slope protection, selecting appropriate protective materials, and establishing durability requirements.
In many countries, flood protection infrastructure is designed based on return-period discharges, such as 50- or 100-year design floods. The dimensionless correlation equation proposed in this study allows for the straightforward estimation of slope flow velocities using such design discharges as input parameters. This approach can support more effective planning for flood control and levee reinforcement by enabling engineers to pre-estimate slope velocities corresponding to specific design events and to assess potential erosion risks in advance.
The comparative analysis of shear stress between the main channel and the landward slope revealed that the slope consistently experienced significantly higher shear forces under overtopping conditions. This indicates that the landward slope is more vulnerable to erosion, regardless of variations in the Froude number. Therefore, to enhance the overall stability of levee systems, reinforcement design for the landward slope should be prioritized. To this end, a practical evaluation framework that integrates Froude number-based velocity prediction with shear stress analysis is needed for application in engineering practice.
Future research should incorporate a broader range of flood conditions, levee geometries, material properties, and surface roughness scenarios. In addition, calibration and validation with both laboratory experiments and field data will be essential to further improve the practical applicability and reliability of the proposed correlation.

Author Contributions

C.J. and D.-H.K. performed the methodology, numerical analysis, and writing/editing of the paper. S.-O.L. contributed to funding, the aim of the paper, and research progress. All authors have read and agreed to the published version of the manuscript.

Funding

This work was supported by the Korea Environment Industry & Technology Institute (KEITI) through the Research and Development on the Technology for Securing the Water Resources Stability in Response to Future Change Program, funded by the Korea Ministry of Environment (MOE) (RS-2024-00332877).

Institutional Review Board Statement

Not applicable.

Informed Consent Statement

Not applicable.

Data Availability Statement

The original contributions presented in this study are included in the article. Further inquiries can be directed to the corresponding author(s).

Conflicts of Interest

The authors declare no conflicts of interest.

References

  1. Zhang, W.; Li, J.; Zhang, L.; Tai, P.; Chen, X. Quantifying risk contagion of fluvial flood disaster chain. Georisk Assess. Manag. Risk Eng. Syst. Geohazards 2025, 19, 82–96. [Google Scholar] [CrossRef]
  2. Ko, D.; Kang, J. Assessment of Levee Slope Reinforced with Bio-polymer by Image Analysis. Ecol. Resilient Infrastruct. 2019, 6, 258–266. [Google Scholar] [CrossRef]
  3. Flynn, S.; Vahedifard, F.; Schaaf, D. A dataset of levee overtopping incidents. In Proceedings of the Geo-Extreme 2021, Savanah, GA, USA, 7–10 November 2021; pp. 99–108. [Google Scholar]
  4. Wu, W. Simplified physically based model of earthen embankment breaching. J. Hydraul. Eng. 2013, 139, 837–851. [Google Scholar] [CrossRef]
  5. Han, M.-S.; Choi, G.-W. A Suggestion of Formulae to Calculate Sectional Tractive Force on the Slope of Cohesive River Bank and its Application. J. Korea Water Resour. Assoc. 2012, 45, 583–596. [Google Scholar] [CrossRef]
  6. Kim, Y.; Kim, J.-H.; Seo, S.-G.; Bhang, I.-H. Comparison of Critical Tractive Forces for Application of Soil Improvement Material to Bank Revetment Work. J. Korean Geotech. Soc. 2015, 31, 65–73. [Google Scholar] [CrossRef]
  7. Go, D.W.; Kang, J.G.; Kang, W.C. Performance evaluation of biopolymer-based levee reinforcement method using 3D point cloud modeling technique. J. Korea Water Resour. Assoc. 2021, 54, 181–190. [Google Scholar]
  8. Lee, J.M.; Choi, I.S.; Yeom, S.I.; Ahn, J.K. Arrangement method of reinforcement materials to delay levee breach by overtopping. J. Korea Acad.-Ind. Coop. Soc. 2024, 25, 425–430. [Google Scholar]
  9. Hughes, S.A.; Nadal, N.C. Laboratory study of combined wave overtopping and storm surge overflow of a levee. Coast. Eng. 2009, 56, 244–259. [Google Scholar] [CrossRef]
  10. Cestero, J.A.F.; Imran, J.; Chaudhry, M.H. Experimental investigation of the effects of soil properties on levee breach by overtopping. J. Hydraul. Eng. 2015, 141, 04014085. [Google Scholar] [CrossRef]
  11. Islam, M. Experimental investigation on failure behavior of levee based on its bed material and river bed height relative to floodplain level. J. Agric. Rural Dev. 2018, 10, 65–74. [Google Scholar]
  12. Cho, S.-E. Probabilistic Failure-time Analysis of Soil Slope under Rainfall Infiltration by Numerical Analysis. J. Korean Geotech. Soc. 2019, 35, 45–58. [Google Scholar] [CrossRef]
  13. Kim, T.-W.; Chae, Y.-M.; Lee, J.W.; Kim, J.-H. Analysis of vulnerable cross-sections by 3D modeling of the embankment. In Proceedings of the Korean Geosynthetics Society Conference, Seoul, Republic of Korea, 26–28 October 2021. [Google Scholar]
  14. Sharp, J.A.; McAnally, W.H. Numerical modeling of surge overtopping of a levee. Appl. Math. Model. 2012, 36, 1359–1370. [Google Scholar] [CrossRef]
  15. Hu, P.; Ji, A.; Li, W.; Cao, Z. Numerical modelling of levee breach with an improved slope-failure operator. J. Hydraul. Res. 2023, 61, 333–345. [Google Scholar] [CrossRef]
  16. Xiao, H.; Huang, W.; Tao, J. Numerical modeling of wave overtopping a levee during Hurricane Katrina. Comput. Fluids 2009, 38, 991–996. [Google Scholar] [CrossRef]
  17. Li, L.; Yuan, S.; Amini, F.; Tang, H. Numerical study of combined wave overtopping and storm surge overflow of HPTRM strengthened levee. Ocean Eng. 2015, 97, 1–11. [Google Scholar] [CrossRef]
  18. Azhar, M.; Vahedifard, F.; AghaKouchak, A. Regional Data-Driven Modeling of Levee Failure due to Overtopping. In Proceedings of the Geotechnical Frontiers, Louisville, KY, USA, 2–5 March 2025; pp. 308–317. [Google Scholar]
  19. Wei, H.; Yu, M.; Wang, D.; Li, Y. Overtopping breaching of river levees constructed with cohesive sediments. Nat. Hazards Earth Syst. Sci. 2016, 16, 1541–1551. [Google Scholar] [CrossRef]
  20. Flow Science Inc. Flow-3D User Manual; Flow Science Inc.: Santa Fe, NM, USA, 2023. [Google Scholar]
  21. Dou, S.T.; Wang, D.W.; Yu, M.H.; Liang, Y.J. Numerical modeling of the lateral widening of levee breach by overtopping in a flume with 180 bend. Nat. Hazards Earth Syst. Sci. 2014, 14, 11–20. [Google Scholar] [CrossRef]
  22. Environmental Protection Agency (EPA). Storm Water Management Model Reference Manual Volume I—Hydrology; National Risk Management Laboratory, Office of Research and Development: Cincinnati, OH, USA, 2016. [Google Scholar]
  23. Yakhot, V.; Orszag, S.A.; Thangam, S.; Gatski, T.B.; Speziale, C.G. Development of turbulence models for shear flows by a double expansion technique. Phys. Fluids A 1992, 4, 1510–1520. [Google Scholar] [CrossRef]
  24. Roache, P.J. Perspective: A Method for Uniform Reporting of Grid Refinement Studies. J. Fluids Eng. 1994, 116, 405–413. [Google Scholar] [CrossRef]
Figure 1. Overview of overtopping flow over a levee.
Sci 07 00119 g001
Figure 2. Cross-sectional geometry of the levee used in the numerical simulation.
Sci 07 00119 g002
Figure 3. Channel geometry, including the lowered levee section.
Sci 07 00119 g003
Figure 4. FLOW—3D modeling results for Case 8.
Sci 07 00119 g004
Figure 5. Dimensionless correlation between channel and slope Froude numbers.
Sci 07 00119 g005
Figure 6. Comparison of shear stress responses to Froude number in channel and slope conditions.
Sci 07 00119 g006
Table 1. Summary of levee failure studies.
MethodologyReferenceTarget ParameterApplications
Hydraulic
experiment
Wu [4]Failure shapeFailure prediction
Han and Choi [5]Shear stressRevetment evaluation
Kim et al. [6]Shear stressMaterial optimization
Go et al. [7]Erosion rateRevetment evaluation
Lee et al. [8]Failure timeRevetment evaluation
Hughes and Nadal [9]Velocity, dischargeEmpirical equations
Feliciano Cestero et al. [10]Failure LocationSoil properties
Islam [11]Failure progressionBed and material
Numerical
simulations
Cho [12]Slope stabilityRainfall threshold
Kim et al. [13]Slope stabilityVulnerability
Sharp and McAnally [14]Shear stress, velocityDesign thresholds
Hu et al. [15]Slope stabilityBreach prediction
Xiao et al. [16]Slope stabilityVulnerability
Li et al. [17]Overtopping dischargeEmpirical equations
Table 2. Boundary condition of the model.
LocationBoundary ConditionLocationBoundary Condition
X MinFlow rateX MaxOutflow
Y MinOutflowY MaxWall
Z MinWallZ MaxPressure (fraction = 0)
Table 3. Simulation cases ( y 0 = 0.9 m for all cases).
CaseInflow
Discharge (m3/s)
F r C h τ C h   (kg/m2)
10.500.040.17
20.750.050.30
31.000.070.56
41.250.090.51
51.500.110.57
61.750.130.66
72.000.140.75
82.500.181.06
92.720.191.25
103.000.211.49
113.500.251.98
124.000.292.58
134.500.323.27
145.000.364.07
155.500.394.89
166.000.435.80
Table 4. Comparison between theoretical and numerical slope velocities.
Inflow DischargeTheoretical VelocityNumerical VelocityRelative Error
0.50 m3/s3.12 m/s3.17 m/s1.60%
Table 5. Grid size and velocity results used for GCI computation.
ParameterFine (△x)Medium (1.5△x)Coarse (2.0△x) G C I f i n e
Landward slope velocity3.17 m/s3.27 m/s3.30 m/s3.15%
Table 6. Hydraulic parameters for each simulation case.
CaseInflow Velocity
(m/s)
Overtopping Depth
(m)
LSV
(m/s)
Slope
Froude Number
10.1500.1073.1702.150
20.2250.1393.2791.988
30.3000.1483.3591.969
40.3750.1563.3681.924
50.4500.1333.2231.999
60.5260.1553.2801.882
70.6010.1593.3051.871
80.7510.1723.3671.833
90.8170.1793.3781.800
100.9010.1893.4321.783
111.0510.2013.4641.744
121.2010.2163.5101.704
131.3510.2303.5481.670
141.5020.2403.5661.644
151.6520.2523.5861.613
161.8020.2543.5181.575
Disclaimer/Publisher’s Note: The statements, opinions and data contained in all publications are solely those of the individual author(s) and contributor(s) and not of MDPI and/or the editor(s). MDPI and/or the editor(s) disclaim responsibility for any injury to people or property resulting from any ideas, methods, instructions or products referred to in the content.