Classification of Ancient Roman Coins by Denomination Using Colour, a Forgotten Feature in Automatic Ancient Coin Analysis
Abstract
:1. Introduction
2. How to Represent Colour for Ancient Coin Analysis?
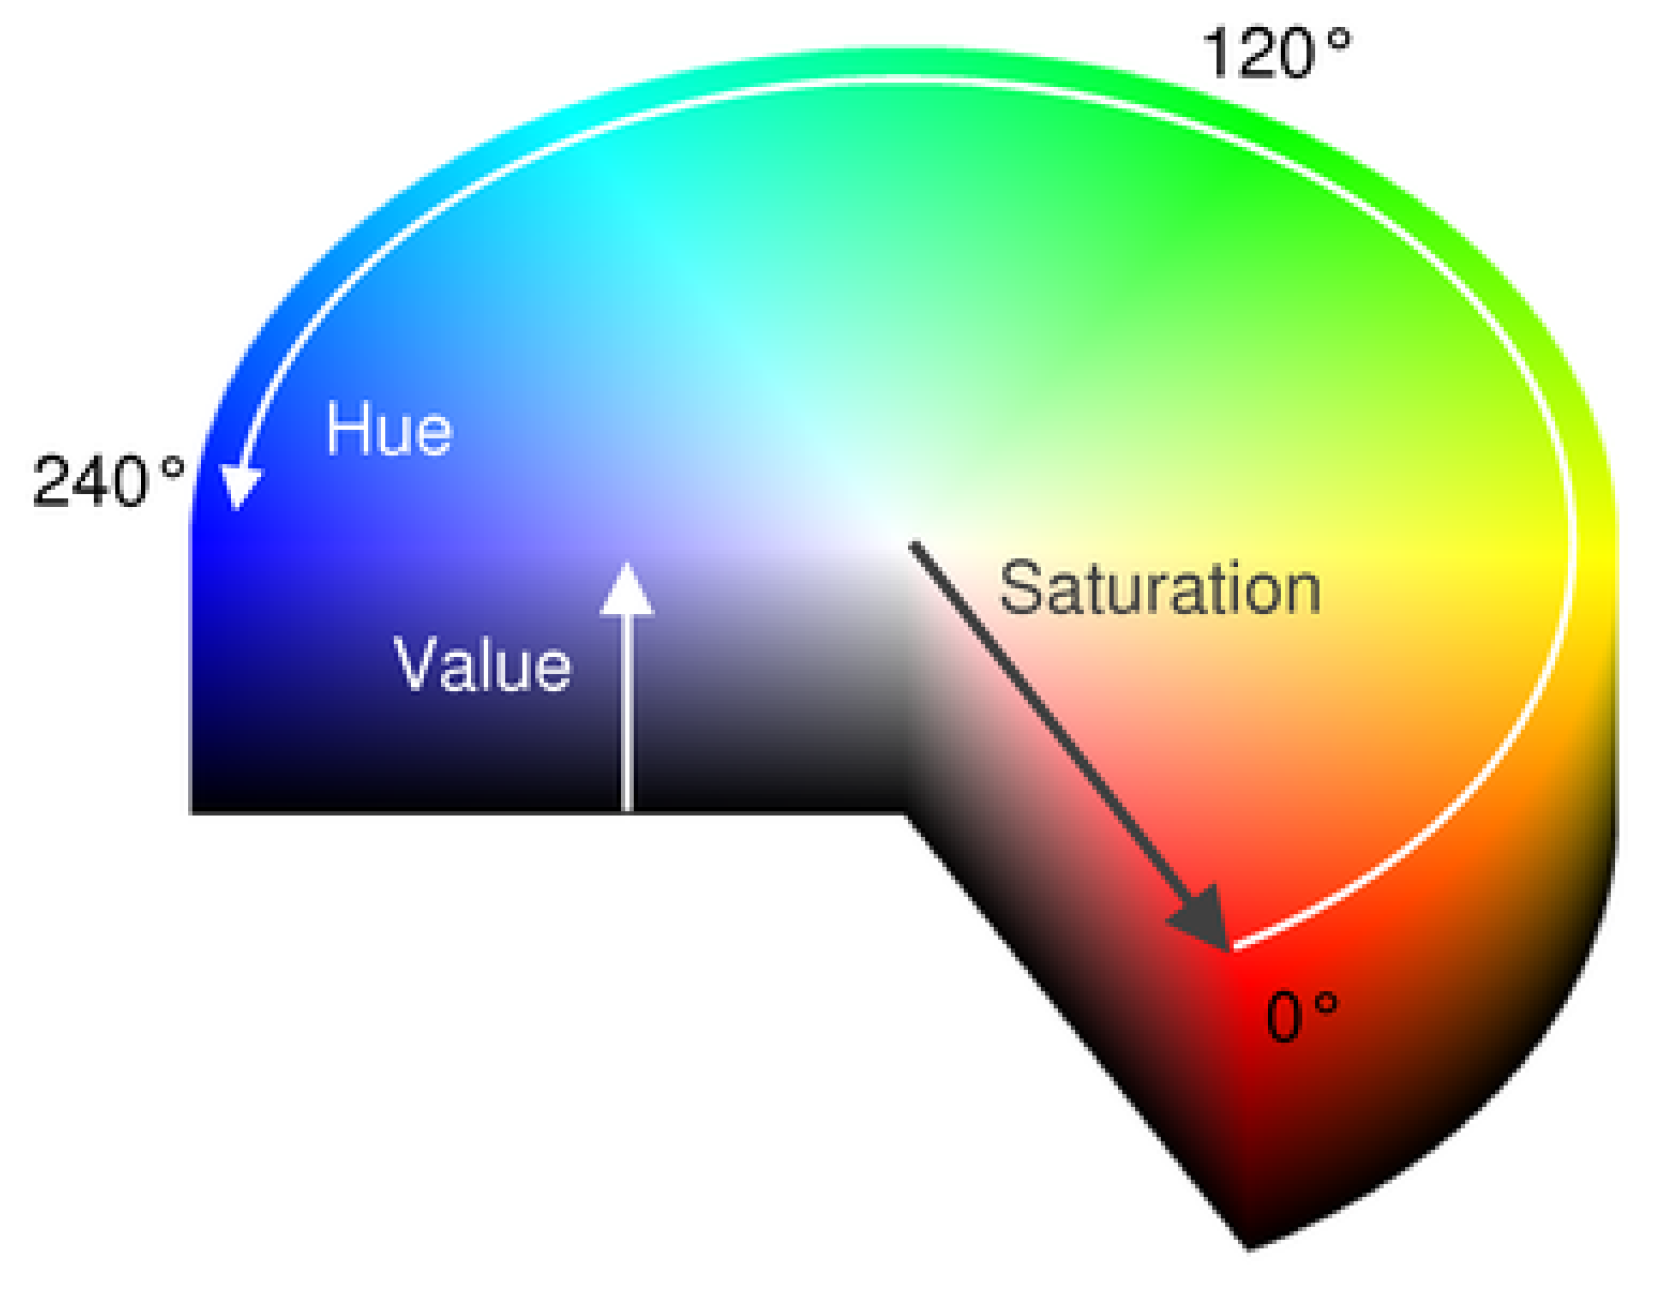
2.1. Representation 1: Histogram of Hue
2.2. Representation 2: Histogram of Colour Words
3. Empirical Evaluation
3.1. Data
3.2. Experimental Methodology and Details
3.3. Results
4. Summary and Future Work
Future Work
Author Contributions
Funding
Conflicts of Interest
References
- Zaharieva, M.; Kampel, M.; Zambanini, S. Image based recognition of ancient coins. In International Conference on Computer Analysis of Images and Patterns; Springer: Berlin, Germany, 2007; pp. 547–554. [Google Scholar]
- Kampel, M.; Zaharieva, M. Recognizing ancient coins based on local features. In International Symposium on Visual Computing; Springer: Berlin/Heidelberg, Germany, 2008; Volume 1, pp. 11–22. [Google Scholar]
- Anwar, H.; Zambanini, S.; Kampel, M. Coarse-grained ancient coin classification using image-based reverse side motif recognition. Mach. Vis. Appl. 2015, 26, 295–304. [Google Scholar] [CrossRef]
- Sutherland, C.H.V.; Carson, R.A.G. The Roman Imperial Coinage; Spink: London, UK, 1923; Volumes 1–10. [Google Scholar]
- Arandjelović, O.; Zachariou, M. Images of Roman imperial denarii: A curated data set for the evaluation of computer vision algorithms applied to ancient numismatics, and an overview of challenges in the field. Sci 2020, 2, 15. [Google Scholar]
- Arandjelović, O. Automatic attribution of ancient Roman imperial coins. In Proceedings of the IEEE Conference on Computer Vision and Pattern Recognition, San Francisco, CA, USA, 13–18 June 2010; pp. 1728–1734. [Google Scholar]
- Fare, C.; Arandjelović, O. Ancient Roman coin retrieval: A new dataset and a systematic examination of the effects of coin grade. In European Conference on Information Retrieval; Springer: Cham, Switzerland, 2017; pp. 410–423. [Google Scholar]
- Arandjelović, O. Reading ancient coins: Automatically identifying denarii using obverse legend seeded retrieval. In European Conference on Computer Vision; Springer: Berlin/Heidelberg, Germany, 2012; Volume 4, pp. 317–330. [Google Scholar]
- Arandjelović, O. Colour invariants under a non-linear photometric camera model and their application to face recognition from video. Pattern Recognit. 2012, 45, 2499–2509. [Google Scholar] [CrossRef]
- Hotta, K. Local co-occurrence features in subspace obtained by KPCA of local blob visual words for scene classification. Pattern Recognit. 2012, 45, 321–372. [Google Scholar] [CrossRef]
- Rieutort-Louis, W.; Arandjelović, O. Description transition tables for object retrieval using unconstrained cluttered video acquired using a consumer level handheld mobile device. In Proceedings of the IEEE International Joint Conference on Neural Networks, Vancouver, BC, Canada, 24–29 July 2016; pp. 3030–3037. [Google Scholar]
- Niemeyer, M.; Arandjelović, O. Automatic semantic labelling of images by their content using non-parametric Bayesian machine learning and image search using synthetically generated image collages. In Proceedings of the IEEE International Conference on Data Science and Advanced Analytics, Turin, Italy, 1–3 October 2018; pp. 160–168. [Google Scholar]
- Lazebnik, S.; Schmid, C.; Ponce, J. Beyond bags of features: Spatial pyramid matching for recognizing natural scene categories. In Proceedings of the IEEE Conference on Computer Vision and Pattern Recognition, New York, NY, USA, 17–22 June 2006. [Google Scholar]
- Arandjelović, O. Object matching using boundary descriptors. In Proceedings of the British Machine Vision Conference, Surrey, UK, 3–7 September 2012. [Google Scholar] [CrossRef] [Green Version]
- Shannon, C. A mathematical theory of communication. Bell Syst. Tech. J. 1948, 27, 379–423. [Google Scholar] [CrossRef] [Green Version]
- Conn, B.; Arandjelović, O. Towards computer vision based ancient coin recognition in the wild—Automatic reliable image preprocessing and normalization. In Proceedings of the IEEE International Joint Conference on Neural Networks, Anchorage, AK, USA, 14–19 May 2017; pp. 1457–1464. [Google Scholar]
- Breiman, L. Random forests. Mach. Learn. 2001, 45, 5–32. [Google Scholar] [CrossRef] [Green Version]
- Schlag, I.; Arandjelović, O. Ancient Roman coin recognition in the wild using deep learning based recognition of artistically depicted face profiles. In Proceedings of the IEEE International Conference on Computer Vision, Venice, Italy, 22–29 October 2017; pp. 2898–2906. [Google Scholar]
- Cooper, J.; Arandjelović, O. Visually understanding rather than merely matching ancient coin images. In Proceedings of the INNS Conference on Big Data and Deep Learning, Sestri Levante, Italy, 16–18 April 2019; pp. 330–340. [Google Scholar]
- Cooper, J.; Arandjelović, O. Learning to describe: A new approach to computer vision for ancient coin analysis. Sci 2020, 2, 8. [Google Scholar] [CrossRef] [Green Version]
- Aslan, S.; Vascon, S.; Pelillo, M. Two sides of the same coin: Improved ancient coin classification using Graph Transduction Games. Pattern Recognit. Lett. 2020, 131, 158–165. [Google Scholar] [CrossRef]
- Zachariou, M.; Dimitriou, N.; Arandjelović, O. Visual reconstruction of ancient coins using cycle-consistent generative adversarial networks. Sci 2020, 2, 13. [Google Scholar] [CrossRef] [Green Version]
- Poh, N.; Bengio, S. Database, protocols and tools for evaluating score-level fusion algorithms in biometric authentication. Pattern Recognit. 2006, 39, 223–233. [Google Scholar] [CrossRef]
- Arandjelović, O. Weighted linear fusion of multimodal data—A reasonable baseline? In Proceedings of the ACM Conference on Multimedia; ACM: New York, NY, USA, 2016; pp. 851–857. [Google Scholar]
- Vincent, P.; Bengio, Y. Manifold Parzen windows. In Advances in Neural Information Processing Systems; MIT Press: Cambridge, MA, USA, 2003; pp. 849–856. [Google Scholar]
| True/Predicted Class | As | Denarius | Dupondius | Sestertius |
|---|---|---|---|---|
| As | 0.92 | 0.01 | 0.02 | 0.06 |
| Denarius | 0.00 | 0.91 | 0.04 | 0.05 |
| Dupondius | 0.03 | 0.05 | 0.59 | 0.33 |
| Sestertius | 0.05 | 0.11 | 0.29 | 0.55 |
| True/Predicted Class | As | Denarius | Dupondius | Sestertius |
|---|---|---|---|---|
| As | 0.89 | 0.04 | 0.02 | 0.05 |
| Denarius | 0.00 | 0.89 | 0.07 | 0.03 |
| Dupondius | 0.02 | 0.09 | 0.64 | 0.25 |
| Sestertius | 0.04 | 0.06 | 0.16 | 0.73 |
| True/Predicted Class | As | Denarius | Dupondius | Sestertius |
|---|---|---|---|---|
| As | 0.96 | 0.01 | 0.01 | 0.01 |
| Denarius | 0.00 | 0.96 | 0.02 | 0.02 |
| Dupondius | 0.01 | 0.02 | 0.81 | 0.15 |
| Sestertius | 0.02 | 0.00 | 0.14 | 0.84 |
© 2020 by the authors. Licensee MDPI, Basel, Switzerland. This article is an open access article distributed under the terms and conditions of the Creative Commons Attribution (CC BY) license (http://creativecommons.org/licenses/by/4.0/).
Share and Cite
Ma, Y.; Arandjelović, O. Classification of Ancient Roman Coins by Denomination Using Colour, a Forgotten Feature in Automatic Ancient Coin Analysis. Sci 2020, 2, 37. https://doi.org/10.3390/sci2020037
Ma Y, Arandjelović O. Classification of Ancient Roman Coins by Denomination Using Colour, a Forgotten Feature in Automatic Ancient Coin Analysis. Sci. 2020; 2(2):37. https://doi.org/10.3390/sci2020037
Chicago/Turabian StyleMa, Yuanyuan, and Ognjen Arandjelović. 2020. "Classification of Ancient Roman Coins by Denomination Using Colour, a Forgotten Feature in Automatic Ancient Coin Analysis" Sci 2, no. 2: 37. https://doi.org/10.3390/sci2020037
APA StyleMa, Y., & Arandjelović, O. (2020). Classification of Ancient Roman Coins by Denomination Using Colour, a Forgotten Feature in Automatic Ancient Coin Analysis. Sci, 2(2), 37. https://doi.org/10.3390/sci2020037


