Review

Japanese Sword Studies Using Neutron Bragg-Edge Transmission and Computed Tomography

1
Faculty of Engineering, Hokkaido University, Kita 13, Nishi 8, Kita-ku, Sapporo 060-8628, Japan
2
Japan Proton Accelerator Research Complex (J-PARC) Center, Japan Atomic Energy Agency, 2-4 Shirakata, Tokai-mura, Ibaraki 319-1195, Japan
3
Comprehensive Research Organization for Science and Society (CROSS), 162-1 Shirakata, Tokai-mura, Ibaraki 319-1106, Japan
4
Faculty of Engineering, Kyushu University, 744 Motooka, Nishi-ku, Fukuoka 819-0395, Japan
*
Author to whom correspondence should be addressed.
Quantum Beam Sci. 2025, 9(4), 33; https://doi.org/10.3390/qubs9040033
Submission received: 31 August 2025 / Revised: 16 November 2025 / Accepted: 19 November 2025 / Published: 24 November 2025
(This article belongs to the Special Issue Quantum Beam Science: Feature Papers 2025)

Abstract

Japanese swords have a history of more than one thousand years and are recognized as metallic art objects. The sword-making process is not clearly understood, especially for old swords made before about 1600 A.D. Knowledge of structural information such as crystallite sizes and anisotropy is important to understand the sword characteristics and the sword-making process. Bragg-edge transmission imaging is a useful noninvasive method that can extract this structural information continuously over a wide area of the sword. Neutron CT is powerful enough to detect quenched areas, voids, and precipitates. Using both methods, we measured more than 10 swords and obtained information on the two-dimensional crystallite size distribution, anisotropy parameter, lattice plane spacing, and quenched regions. Comparison of the results indicated the following features: the crystallite size distributions showed two patterns: an almost uniform distribution of small-sized crystallites, and mixed distributions of large- and small-sized crystallites. The patterns were observed in different eras and places. The preferred orientation showed different patterns, and strain areas due to quenching were observed in many swords. The quenched area showed a trend that the quenching was weaker for old swords than newer ones. CT images showed the boundaries of the quenched regions and a void in the layered structure for one sword, for which a layered structure was confirmed.

1. Introduction

Japanese swords have a curved shape, and they have been produced from the tenth century to modern ages. Japanese swords made before about 1600 A.D. are called ‘old swords’ (Koto in Japanese). In this period, Gokaden sword-smithing traditions of the five famed regions were born, namely, Yamato (present-day Nara prefecture), Yamashiro (Kyoto prefecture), Bizen/Bishu (Okayama prefecture), Soshu (Kanagawa prefecture), and Mino (Gifu prefecture). Each school had its own characteristics. However, after the Warring States period around the end of the Koto age, many swordsmiths moved to various places ruled by local lords, and the sword-making process would change, compared with the Koto age. The swords made from ca. 1600 A.D. to the latter half of the 18th century are called ‘new swords’ (Shinto). In this period, swords were more ornamental than practical. The swords made after the new sword age until 1876 A.D. are called new-new swords (Shin-shinto), with a trend of resemblance to Koto swords. After 1876 A.D., it was prohibited for a samurai to carry swords. The swords made after this year are called modern swords (Gendaito).
The beauty of the sword surface, e.g., tempering pattern (hamon), has been appreciated for a long time. Although knowledge of swords’ metallurgical characteristics would be helpful in the study of sword-making processes, they are not fully understood, especially for Koto. Investigations of metallurgical characteristics have been performed using invasive methods [1,2,3,4,5,6,7,8]. In these studies, the authors elucidated metallurgical information such as the structures of the swords and the distribution of ferrite, perlite, cementite, and martensite. The bending process of the sword during quenching was also clarified by computer simulation [9]. However, the metallurgical characteristics of each sword should be studied in a noninvasive way, to preserve the sword’s condition. Methods using X-rays and neutrons are suitable for noninvasive investigations [10]. Imaging is a useful method to see the inside of the swords, to observe the precipitates and structure. Neutron diffraction is useful since X-ray diffraction cannot provide crystallographic information about the internal parts of a sword since penetration power of X-rays is very weak compared with that of neutrons. Neutron diffraction studies have been performed for various swords [11,12,13,14,15,16], providing crystallographic information such as lattice parameter, phase fraction, stress, carbon content and so on. However, the data obtained were pointwise and not suitable to observe position-based variations. On the other hand, Bragg-edge transmission (BET) imaging can provide structural information relating to the crystal structure, phase, crystallite size, and lattice plane spacing and texture [17], over a wide area of about 10 cm × 10 cm, although the information is average over the neutron beam direction. Furthermore, we can identify a martensite area on the edge side of the sword from the Bragg-edge broadening analysis [18]. The texture is related to mechanical deformation and important to characterize materials. The neutron diffraction has advantages, and the measurement methods have been developed at various neutron facilities [19,20,21,22,23,24], which were used to analyze, to cite a case, for TRIP steel [25]. In BET, we do not obtain detailed information about the pole figures relating to the texture but obtain relevant information through the analysis of the transmission spectrum. We applied the BET method and CT to study Japanese swords and obtained information on the quenching area, lattice plane spacing d110, anisotropy, and crystallite size over a wide area of the sword. The results obtained over the wide area are useful to observe the change in characteristics, which then offers hints or evidence for the structure and the sword-making process. The results on the characteristics of each sword were reported separately [26,27,28,29,30,31,32,33]. About 10 Japanese swords have been studied, including a naginata. The swords were made in various eras and places. This number was not high enough to allow for a discussion of the general characteristics of Japanese swords. However, the results showed specific characteristics depending on the sword, and therefore, it is important to compare their characteristics and discuss sword features and structures thoroughly. Here, we compare the martensite/quenching areas, strains, anisotropy, and crystallite sizes, and discuss their characteristics relatively to detect similarities or differences in the swords depending on era and place. This will lead to a better understanding of the structure and sword-making process. Such studies will likely contribute to uncovering the development of Japanese sword-smithing techniques.

2. Japanese Swords

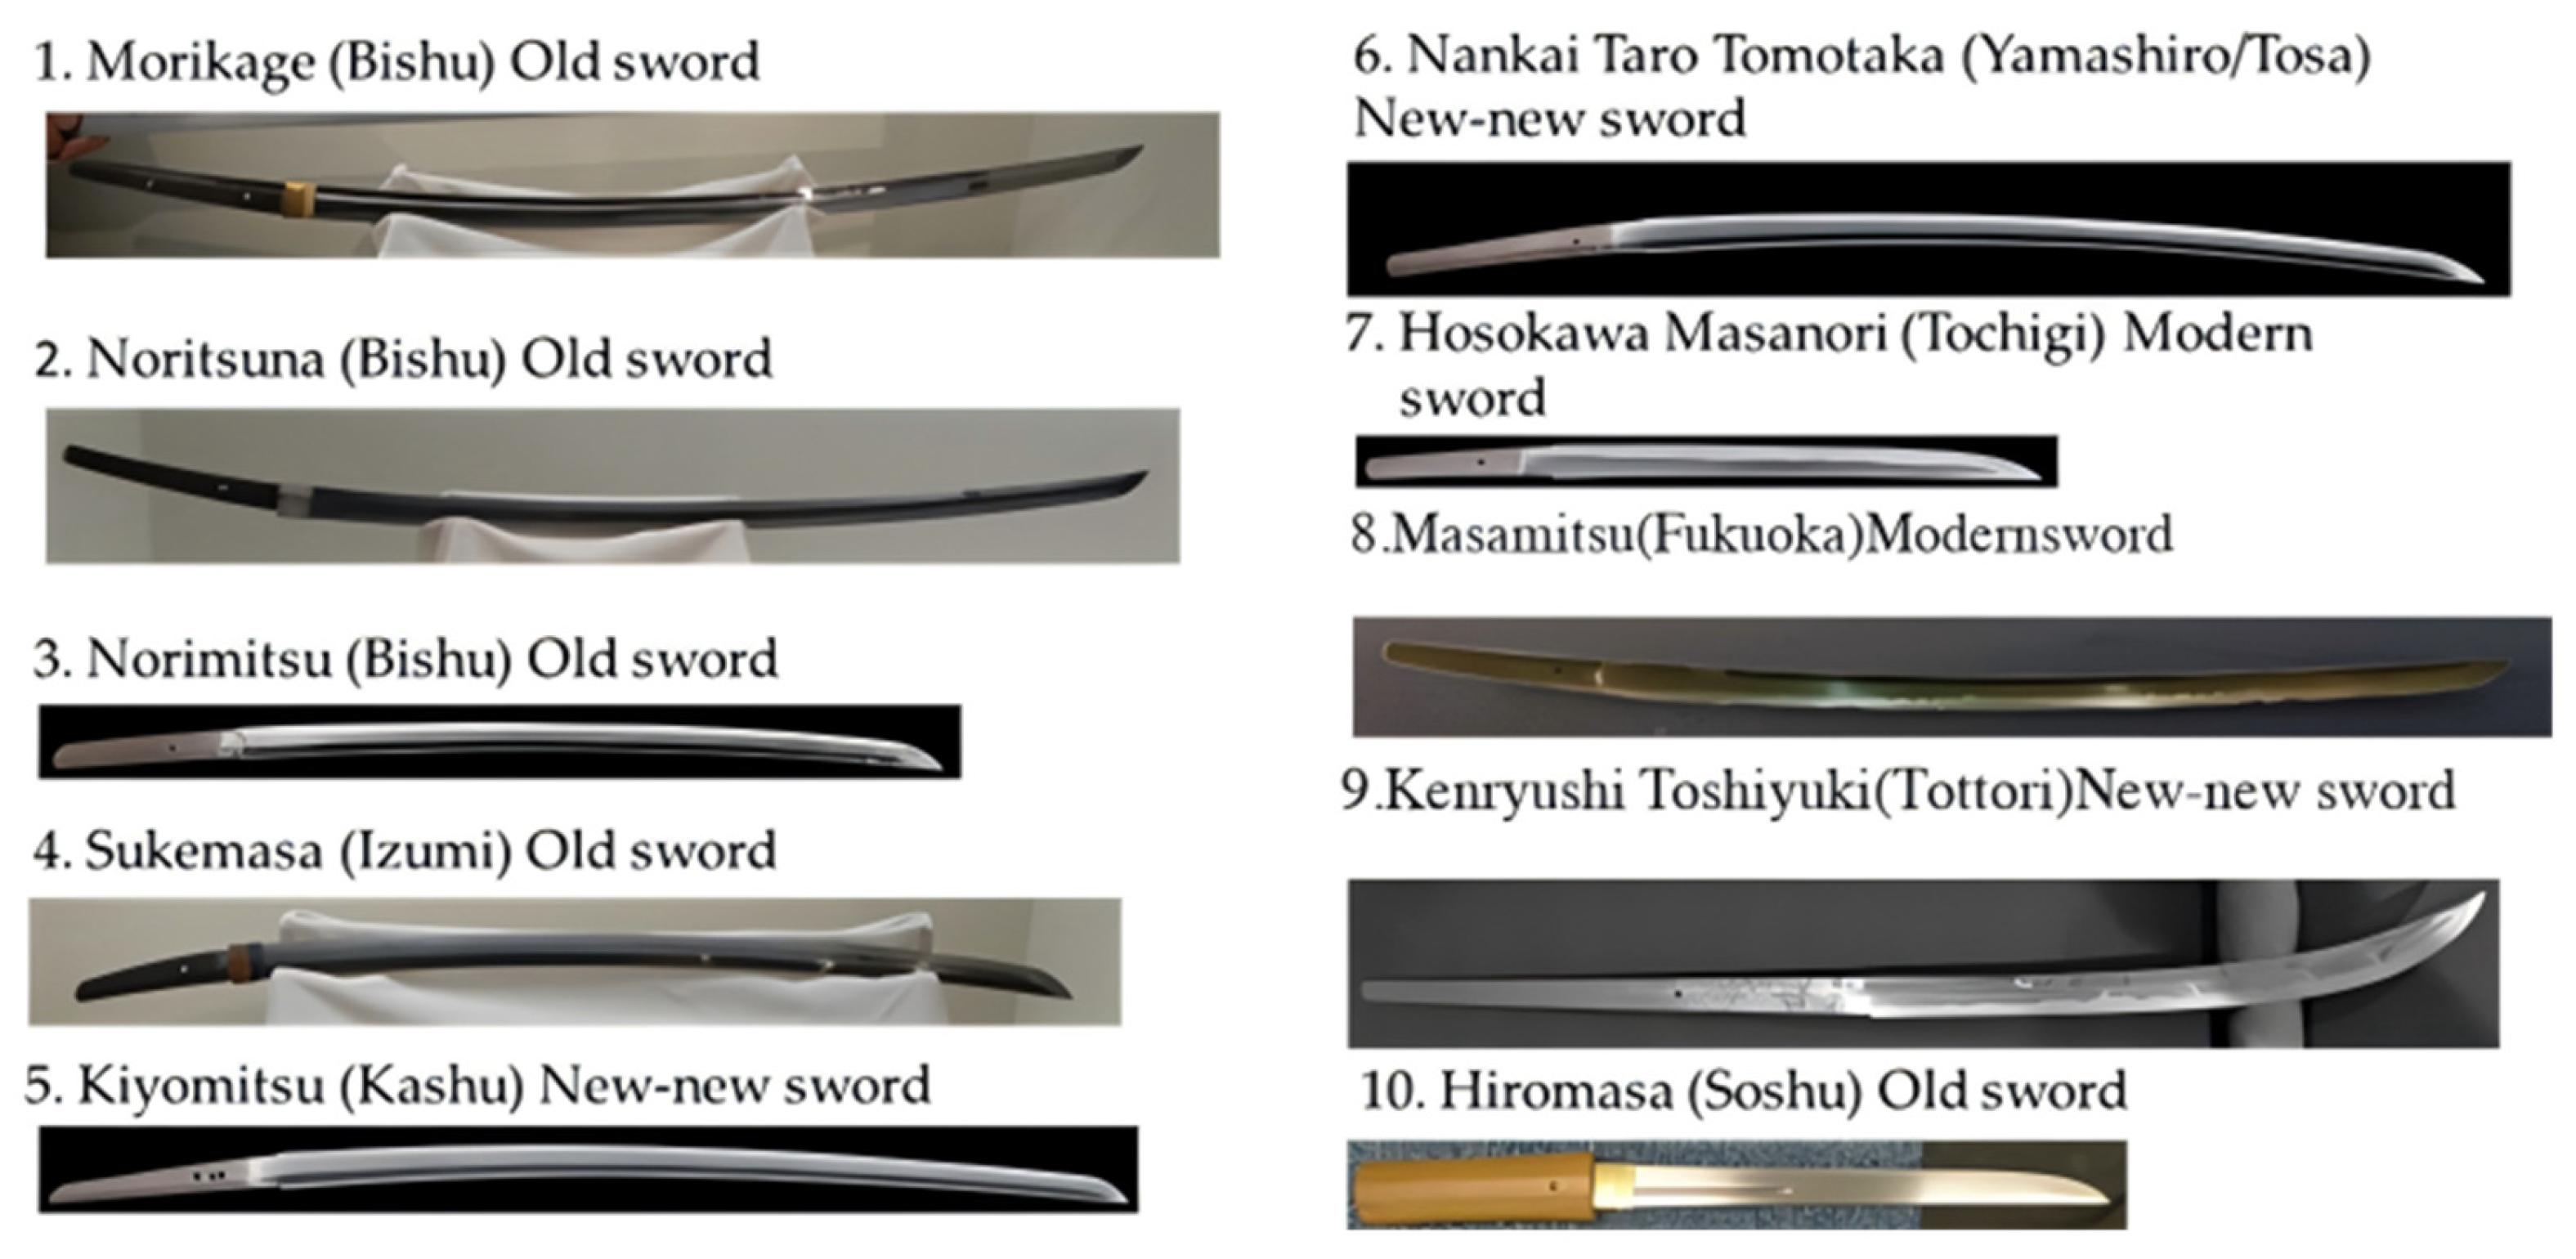
The ten Japanese swords discussed here are listed in Table 1. There are three long swords, three swords, two wakizashi, one naginata, and one short sword. They were made in the South and North Courts period (1336–1392); the Muromachi period (1336–1573), the first 56 years of which coincided with the South and North Courts period; the Edo period (1603–1868); the Meiji period (1868–1912); and the Showa period (1926–1989). The blade lengths are also presented in the table. Figure 1 shows places where the swords were made. Furthermore, places of the Gokaden are indicated in blue. In this paper, we do not discuss swords made in two of the Gokaden, Yamato and Mino. The swords discussed in this paper are from the Tochigi to Fukuoka prefectures. Figure 2 shows photos of the swords in the same order as Table 1. Please note that the sizes of the swords in the images are not representative. The first three were made in Bishu/Bizen in the period earlier than 15th century. The first two, Morikage [28,32] and Noritsuna [27,32], are long swords, with blade lengths of 80.3 cm and 75.0 cm, respectively. The last one, Norimitsu, is wakizashi, and the blade length is 45.4 cm [31]. Norimitsu is a saiha sword; i.e., it was refurbished later probably due to a fire. However, the steel structure in the sword would not have changed by applying saiha. Sukemasa was made in Izumi, which would be in the present-day Osaka prefecture, in the Muromachi period, and the blade length is 64.0 cm [26]. Kiyomitsu is a sword made in Kashu, Ishikawa prefecture, in the Edo period, with a blade length of 69.6 cm [30]. Nankai Taro Tomotaka (called Tomotaka hereafter) was made in 1836, and its blade length is 70.8 cm [30]. Nankai Taro Tomotaka was born in Tosa (Kochi prefecture) and moved to Yamashiro (Kyoto prefecture). Hosokawa Masanori (called Masanori) is a wakizashi made at the end of the Edo period towards the Meiji period, with a blade length of 31.3 cm [30]. This sword was made in the age of new-new swords. Masamitsu is a long sword made in 1969 with a blade length of 74.2 cm [29], and Kenryushi Toshiyuki (called Toshiyuki) is a naginata made in Tottori in the Edo period (1846) with a blade length of 39.1 cm [33]. Naginata is considered to be similar to the other swords and is thus featured in comparisons here. Hiromasa is a short sword made in Soshu (Kanagawa prefecture) in the Muromachi period with a blade length of 26.9 cm. This sword is included to show the characteristics of a short sword.

3. Experimental Methods

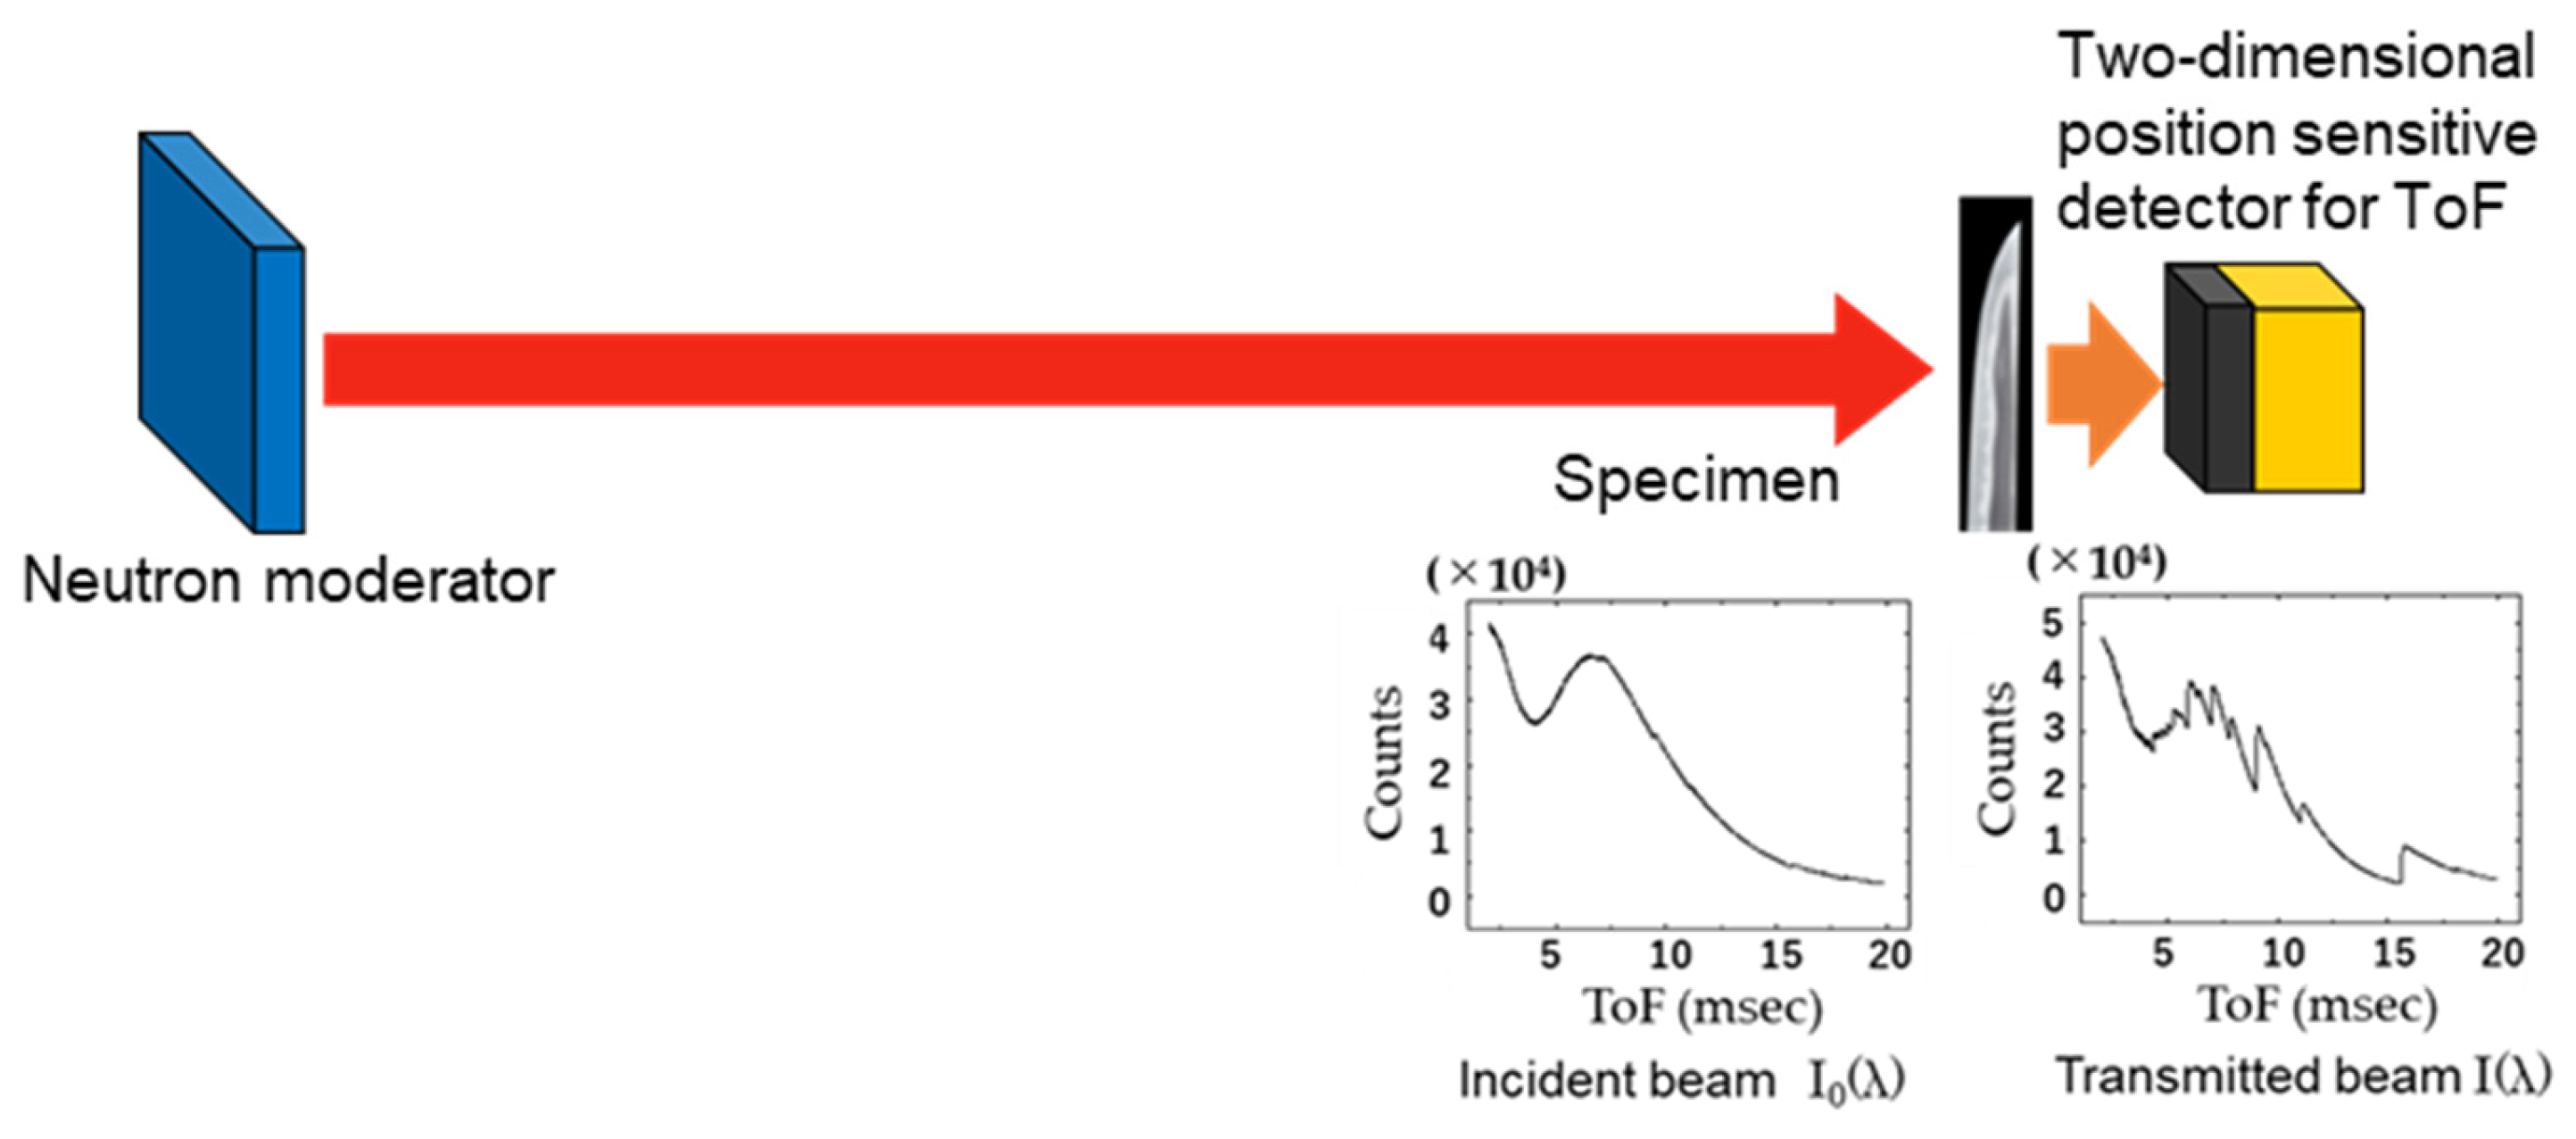
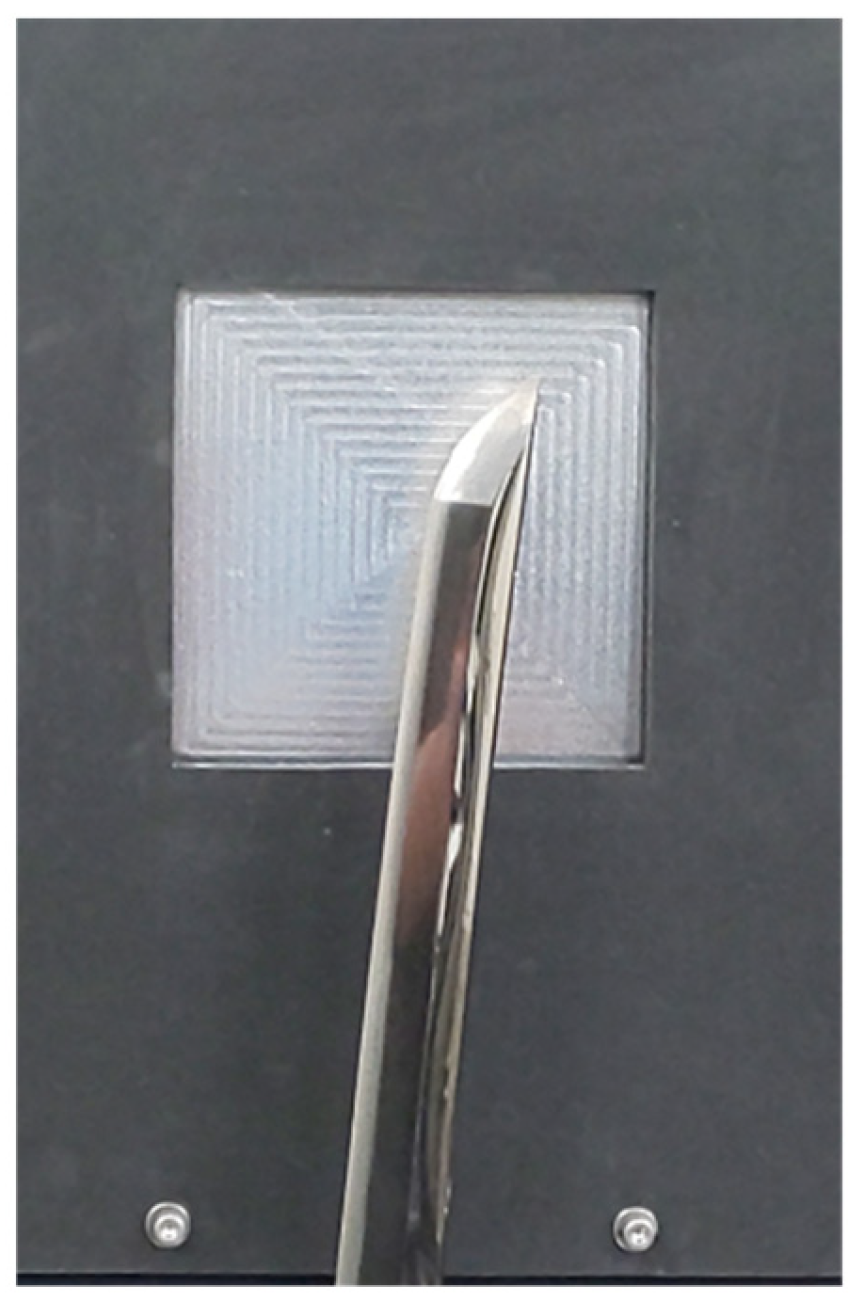
Here, we introduce experimental methods for better understanding, although this is a review article. The measurements on the swords were performed on RADEN at a beamline number 22 (BL22) in J-PARC/MLF (Material Life Science Experimental Facility) [34]. RADEN is a dedicated instrument for energy-resolved neutron imaging, but it can also be used for traditional imaging. A schematic view of the experimental layout is shown in Figure 3. Neutrons emitted from a neutron moderator are scattered and absorbed by a specimen, and transmitted neutrons are detected by a two-dimensional position-sensitive detector. The neutron energy (wavelength) is determined by a neutron’s time-of-flight traveling from the moderator to the detector (time-of-flight method: ToF). An incident neutron spectrum I0(λ) and a transmitted spectrum I(λ) are also shown. Wavelength resolution is about 0.2% at 0.2 nm at a position of 23 m from a moderator. A photo of a sword set in front of a neutron detector is shown in Figure 4. A boron-type neutron imaging detector was used for BET imaging. A CCD camera with 6LiF/ZnS was used for the neutron CT measurements. All CT datasets were reconstructed using the filtered back projection algorithm.
To analyze the Bragg-edge transmission spectrum, a RITS code was used [17]. Here, we describe in detail content of the code to explain the Bragg-edge transmission since the method is not very common. The neutron transmission Tr(λ) as a function of wavelength λ is represented by
T r λ = I ( λ ) / I 0 ( λ ) = exp σ tot λ ρ t .
Here, σtot(λ) is the neutron total cross-section, ρ is the number density of a specimen, and t is the thickness of the specimen. The Bragg-edge transmission spectrum reflects all scattering effects occurring in a specimen, which relate to the microscopic structural and dynamical information, and absorption of the specimen. An analytical expression of the effective total cross-section was formulated, which is applicable to a pulsed neutron source with the ToF method, in which the neutron energy is decided by the flight time of a neutron from a moderator to a detector. This expression includes the effects of the incident neutron pulse shape, variation in the crystal lattice plane spacing, crystal orientation distribution due to the texture, and extinction of diffracted neutrons inside one crystallite.
In the low-energy region, the total cross-section consists of elastic coherent scattering, elastic incoherent scattering, inelastic coherent scattering, inelastic incoherent scattering, and absorption as follows:
σ tot λ = σ coh ela λ + σ incoh ela λ + σ coh inela λ + σ incoh inela λ + σ abs λ .
The elastic coherent scattering cross-section relates to the Bragg edges and reflects the crystal structure. To describe an actual Bragg-edge transmission spectrum of a polycrystalline material, a modified expression of a Bragg-edge transmission cross-section was adopted. This was combined by the kinematical diffraction theory [35] with three new factors, Rhkl(λ, 2dhkl), Phkl(λ, 2dhkl), and Ehkl, 2dhkl, Fhkl), as follows:
σ coh ela ( λ ) = λ 2 2 V 0 h k l F h k l 2 d h k l R h k l ( λ , 2 d h k l ) P h k l ( λ , 2 d h k l ) E h k l ( λ , 2 d h k l , F h k l )
where V0 is the unit cell volume, dhkl is the crystal lattice plane spacing, and Fhkl is the crystal structure factor including the Debye-Waller factor.
The first factor Rhkl(λ, 2dhkl) is the edge profile function including the dhkl information. This function describes the edge broadening due to the neutron pulse shape, the strain, and the microstructure. The crystallographic anisotropy due to the preferred orientation in a polycrystalline material changes the whole shape of a Bragg-edge transmission spectrum. To evaluate the effect, the second factor Phkl(λ, 2dhkl) was formulated based on the modified March-Dollase pole-density profile function [36,37]. Furthermore, the primary extinction effect, the re-diffraction phenomenon inside one perfect crystal block (the mosaic block or the crystallite), increases the transmitted neutron intensity, i.e., decreases the Bragg-edge transmission cross-section that was considered in the third factor Ehkl, 2dhkl, Fhkl) based on Sabine’s primary extinction function for powder diffractometry [38,39].
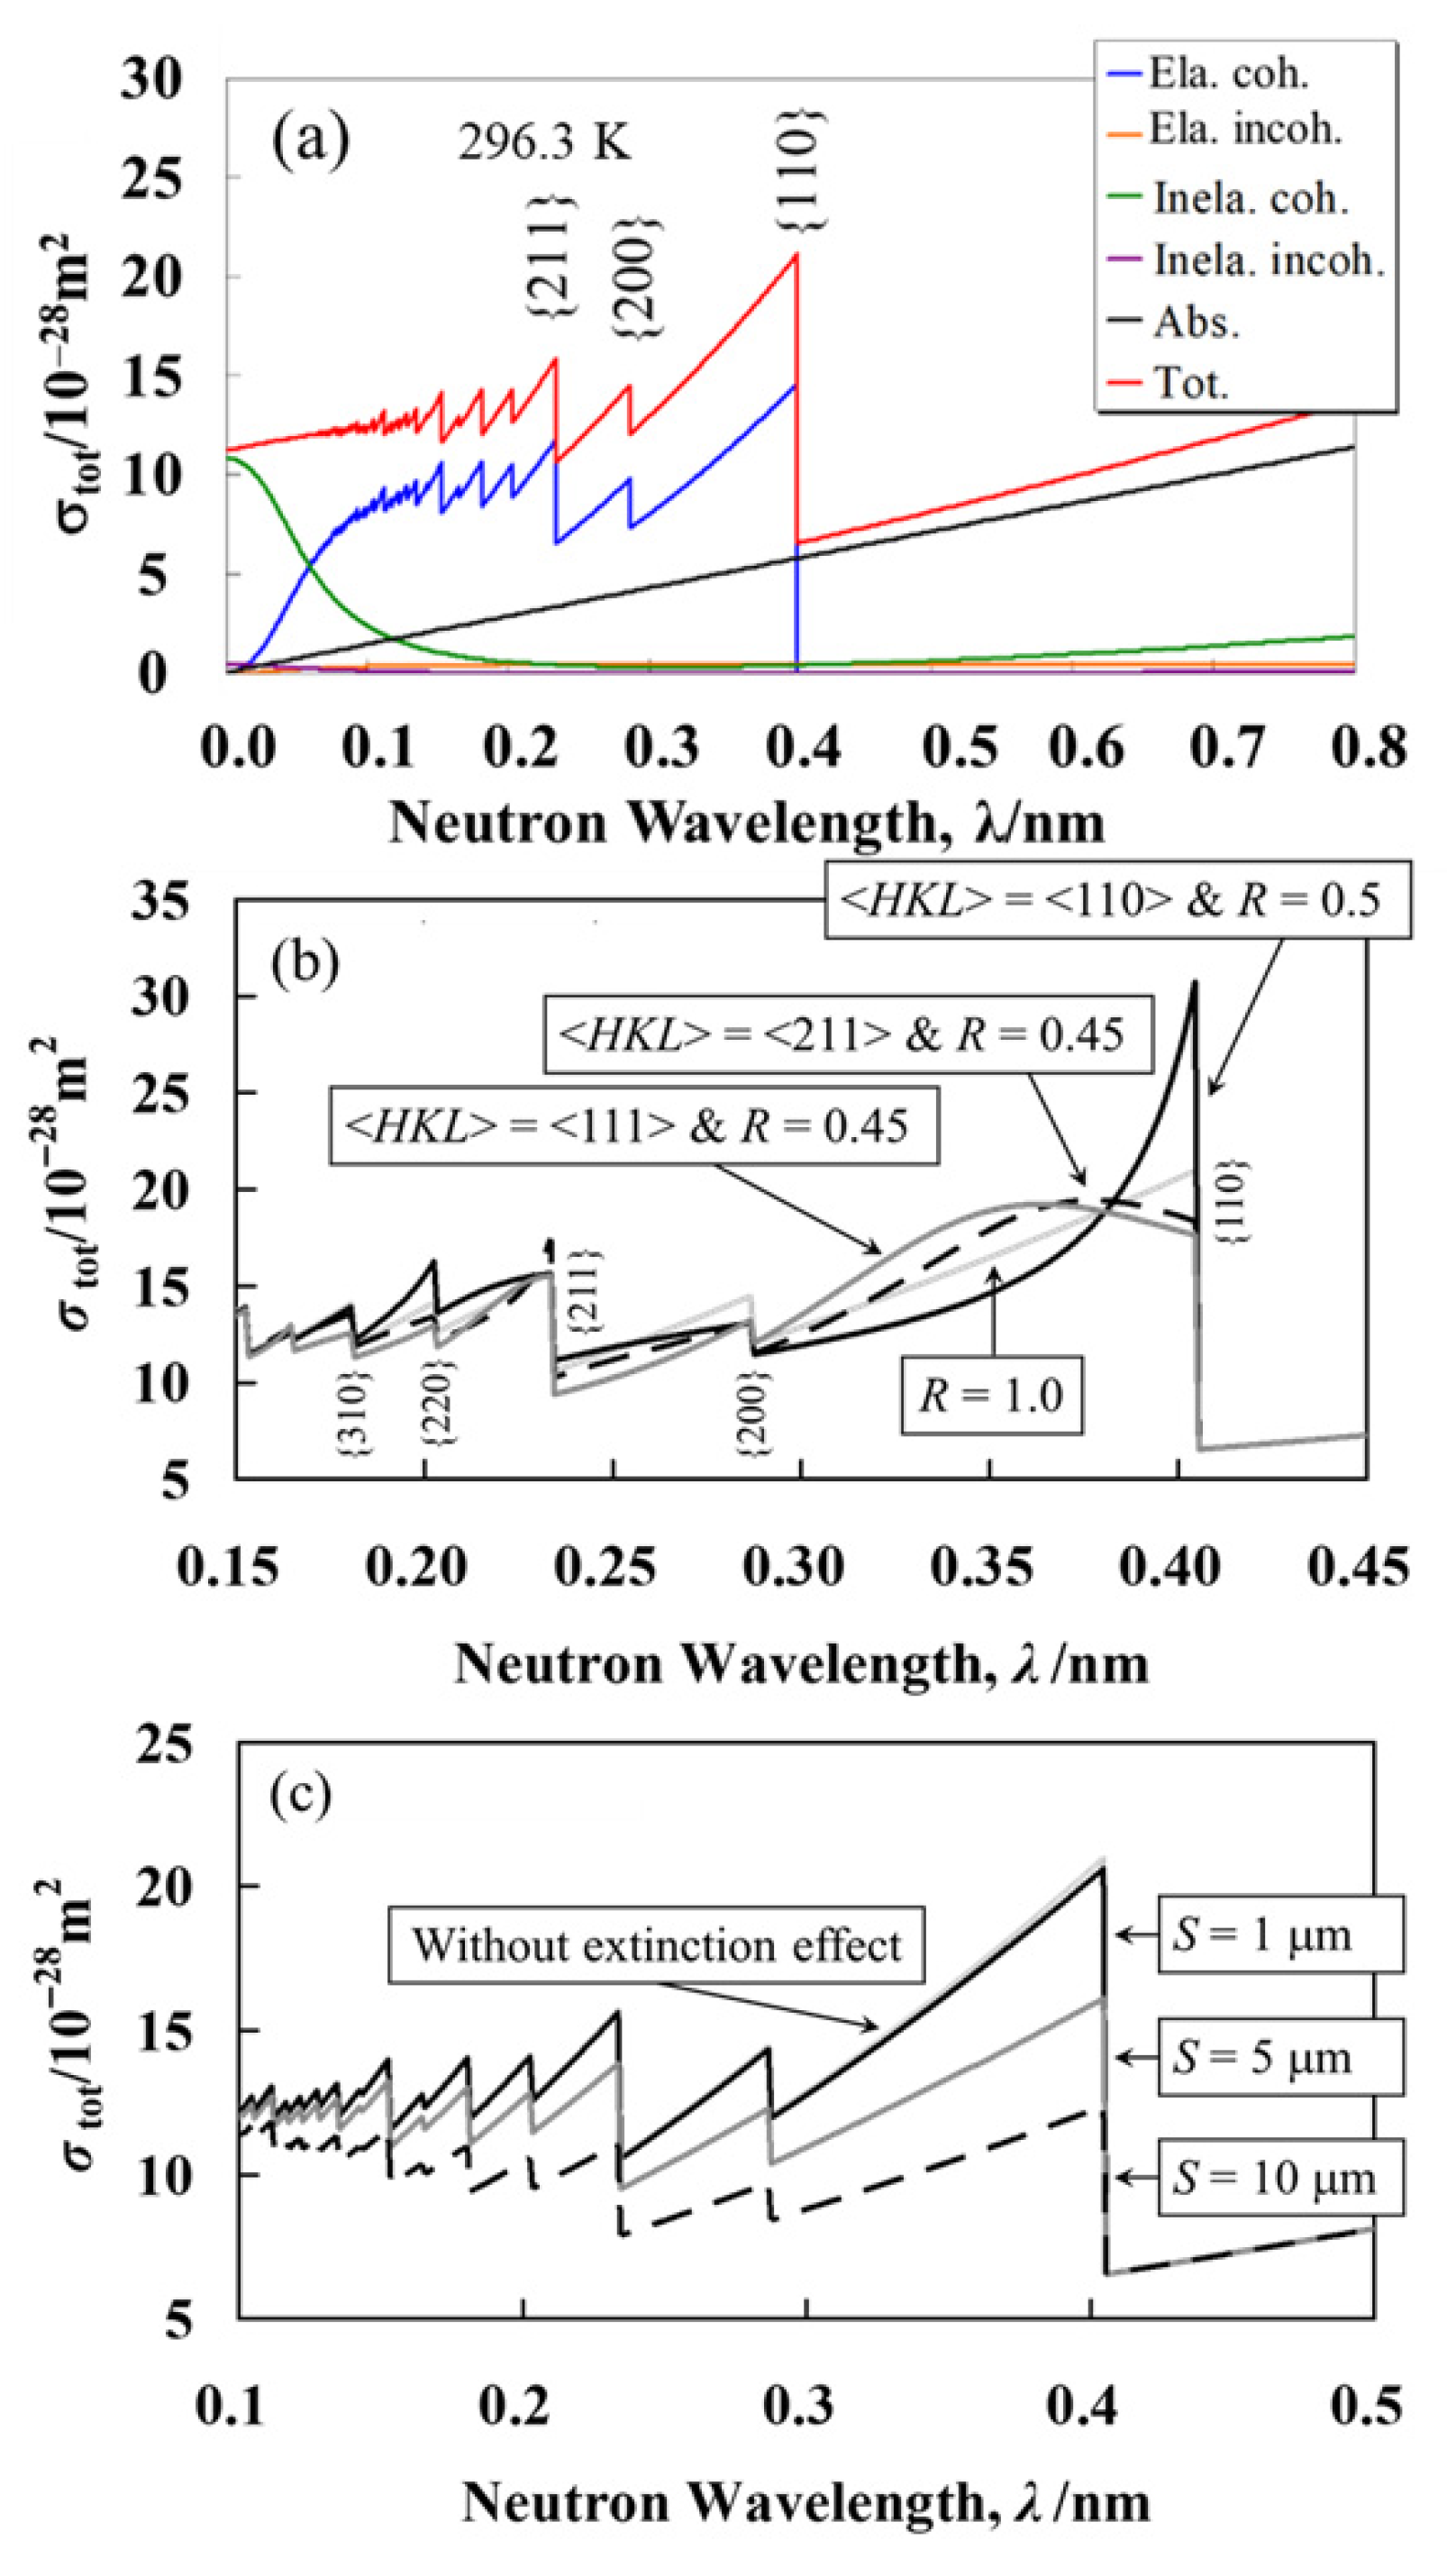
Figure 5a shows a total neutron cross-section of α-iron indicating each component written in Equation (2), without accounting for small angle scattering and the effects considered in the effective total cross-section. Figure 5b shows the whole-shape change of the effective total cross-section depending on the preferred orientation axis <HKL> and the crystallographic anisotropy parameter R of the March-Dollase model. Figure 5c shows the whole change in the effective total cross-section of α-iron, depending on the crystallite size S of Sabine’s powder extinction model [38]. The scattering components other than the elastic coherent scattering and the absorption were calculated using the traditional total cross-section theory [40]. In Figure 5a, the elastic coherent scattering due to diffraction appears below the wavelength of the Bragg cut-off, λ = 2d110, and decreases in the short-wavelength region. There are many edges corresponding to the Bragg edges of λ = 2dhkl. The coherent inelastic cross-section increases rapidly below around 0.2 nm, and the cross-section is very small above this wavelength. The inelastic and elastic incoherent cross-sections are very small over all the regions. The absorption cross-section is proportional to the wavelength and dominant above the Bragg cut-off wavelength. Figure 5b shows simulation examples of the total cross-section of α-iron depending on various values of <HKL> and R. If there is no anisotropy (random orientation distribution), R is unity. When the texture increases, R moves away from 1. R = 0 or ∞ indicates a single crystal specimen. In this simulation, the extinction function Ehkl, 2dhkl, Fhkl) was equal to unity, meaning no effect of crystallite size. The whole shape of the Bragg-edge transmission cross-section, especially around the {110} Bragg edge corresponding to the maximum d-spacing, is drastically changed by the anisotropy of the crystal orientation distribution. Figure 5c shows simulation examples of the total cross-section depending on various values of S. In this simulation, the preferred orientation distribution function Phkl(λ, 2dhkl) was unity, meaning no effect of anisotropy. The Bragg-edge transmission cross-section is drastically reduced by increasing the crystallite size up to 10 µm by the extinction of diffracted neutrons inside the crystallite.
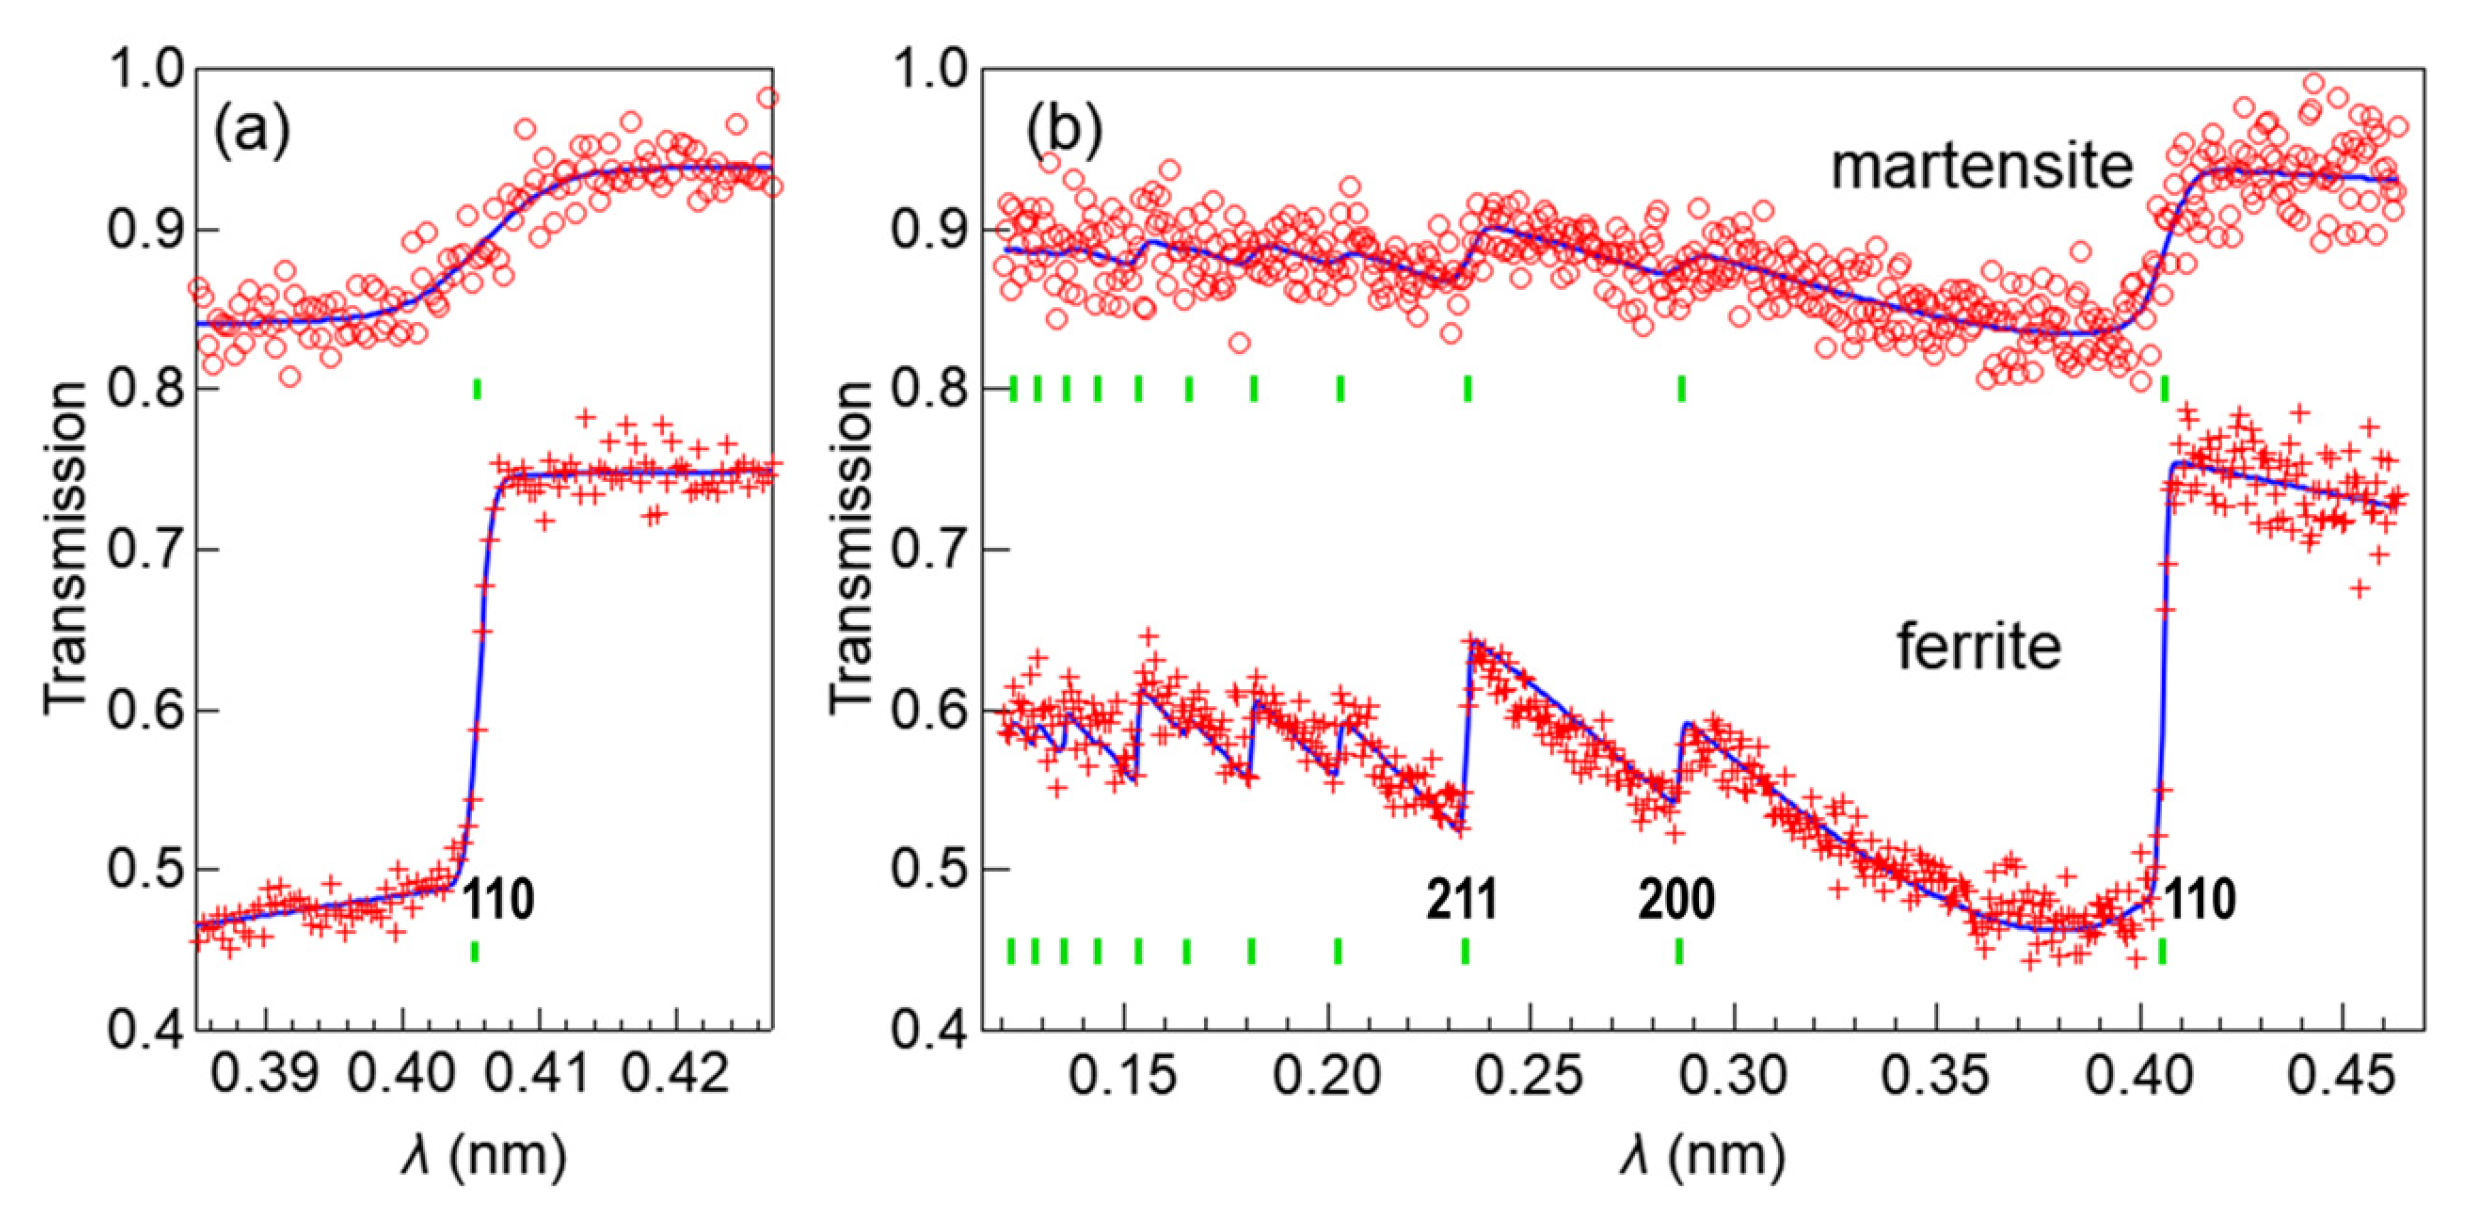
Figure 6 shows examples of transmission data obtained for Norimitsu [31]. Figure 6a presents the wavelength-dependent transmission spectra around {110} and (b) over a wide wavelength range. d110 is obtained by analyzing the spectrum shown in (a), and this requires higher wavelength resolution than (b). Therefore, the time bin is narrower in (a) than (b), and the data are different. The crystal structure and phase information are obtained from the edge positions. In a martensite transformation, the body-centered-cubic structure of α-Fe changes to a body-centered-tetragonal structure with c/a > 1. The edge slope of {110} in the martensite becomes gentle or broad [18], as clearly recognized when comparing the upper figure (martensite) with the lower figure (ferrite) in Figure 6a. We obtain the width of the edge broadening, W110, by analyzing the single-edge structure around {110}, and then we can identify the area of the martensite, i.e., the quenched area in the sword. The crystallite size S and the anisotropy parameter R are obtained by analyzing the overall structures of the transmissions shown in Figure 6b. In the figures, fitting results of the RITS simulations are also indicated. Here, the data were analyzed from 0.12 nm to 0.46 nm for wide-wavelength analysis. The pixel size of the detector was 0.4 mm, but 1.2 mm area data were used for the analysis to obtain good statistics. In all analyses and discussions in this paper, the crystal structure of steel (ferrite/martensite phase) is assumed to be a single-phase body-centered-cubic (BCC) structure. The analysis does not include cementite in pearlite and retained austenite because their contribution to the BET spectra is negligible.

4. Comparison of Neutron Imaging Results

Here, we present the mapping results of edge broadening W110 of the {110} lattice plane spacing d110, anisotropy parameter R, and crystallite size S, and the CT images [26,27,28,29,30,31,32,33]. Many of the neutron measurements were performed in three parts of the swords: tip area, center area of the longitudinal direction, and end area of the blade (area from tang to blade). The width of each figure corresponds to about 10 cm. The short sword, Hiromasa, was measured in three parts, covering the entire area of the sword. Then, the mapping result of each part was connected to cover a whole sword.

4.1. Edge Broadening W110 (Quenching Region)

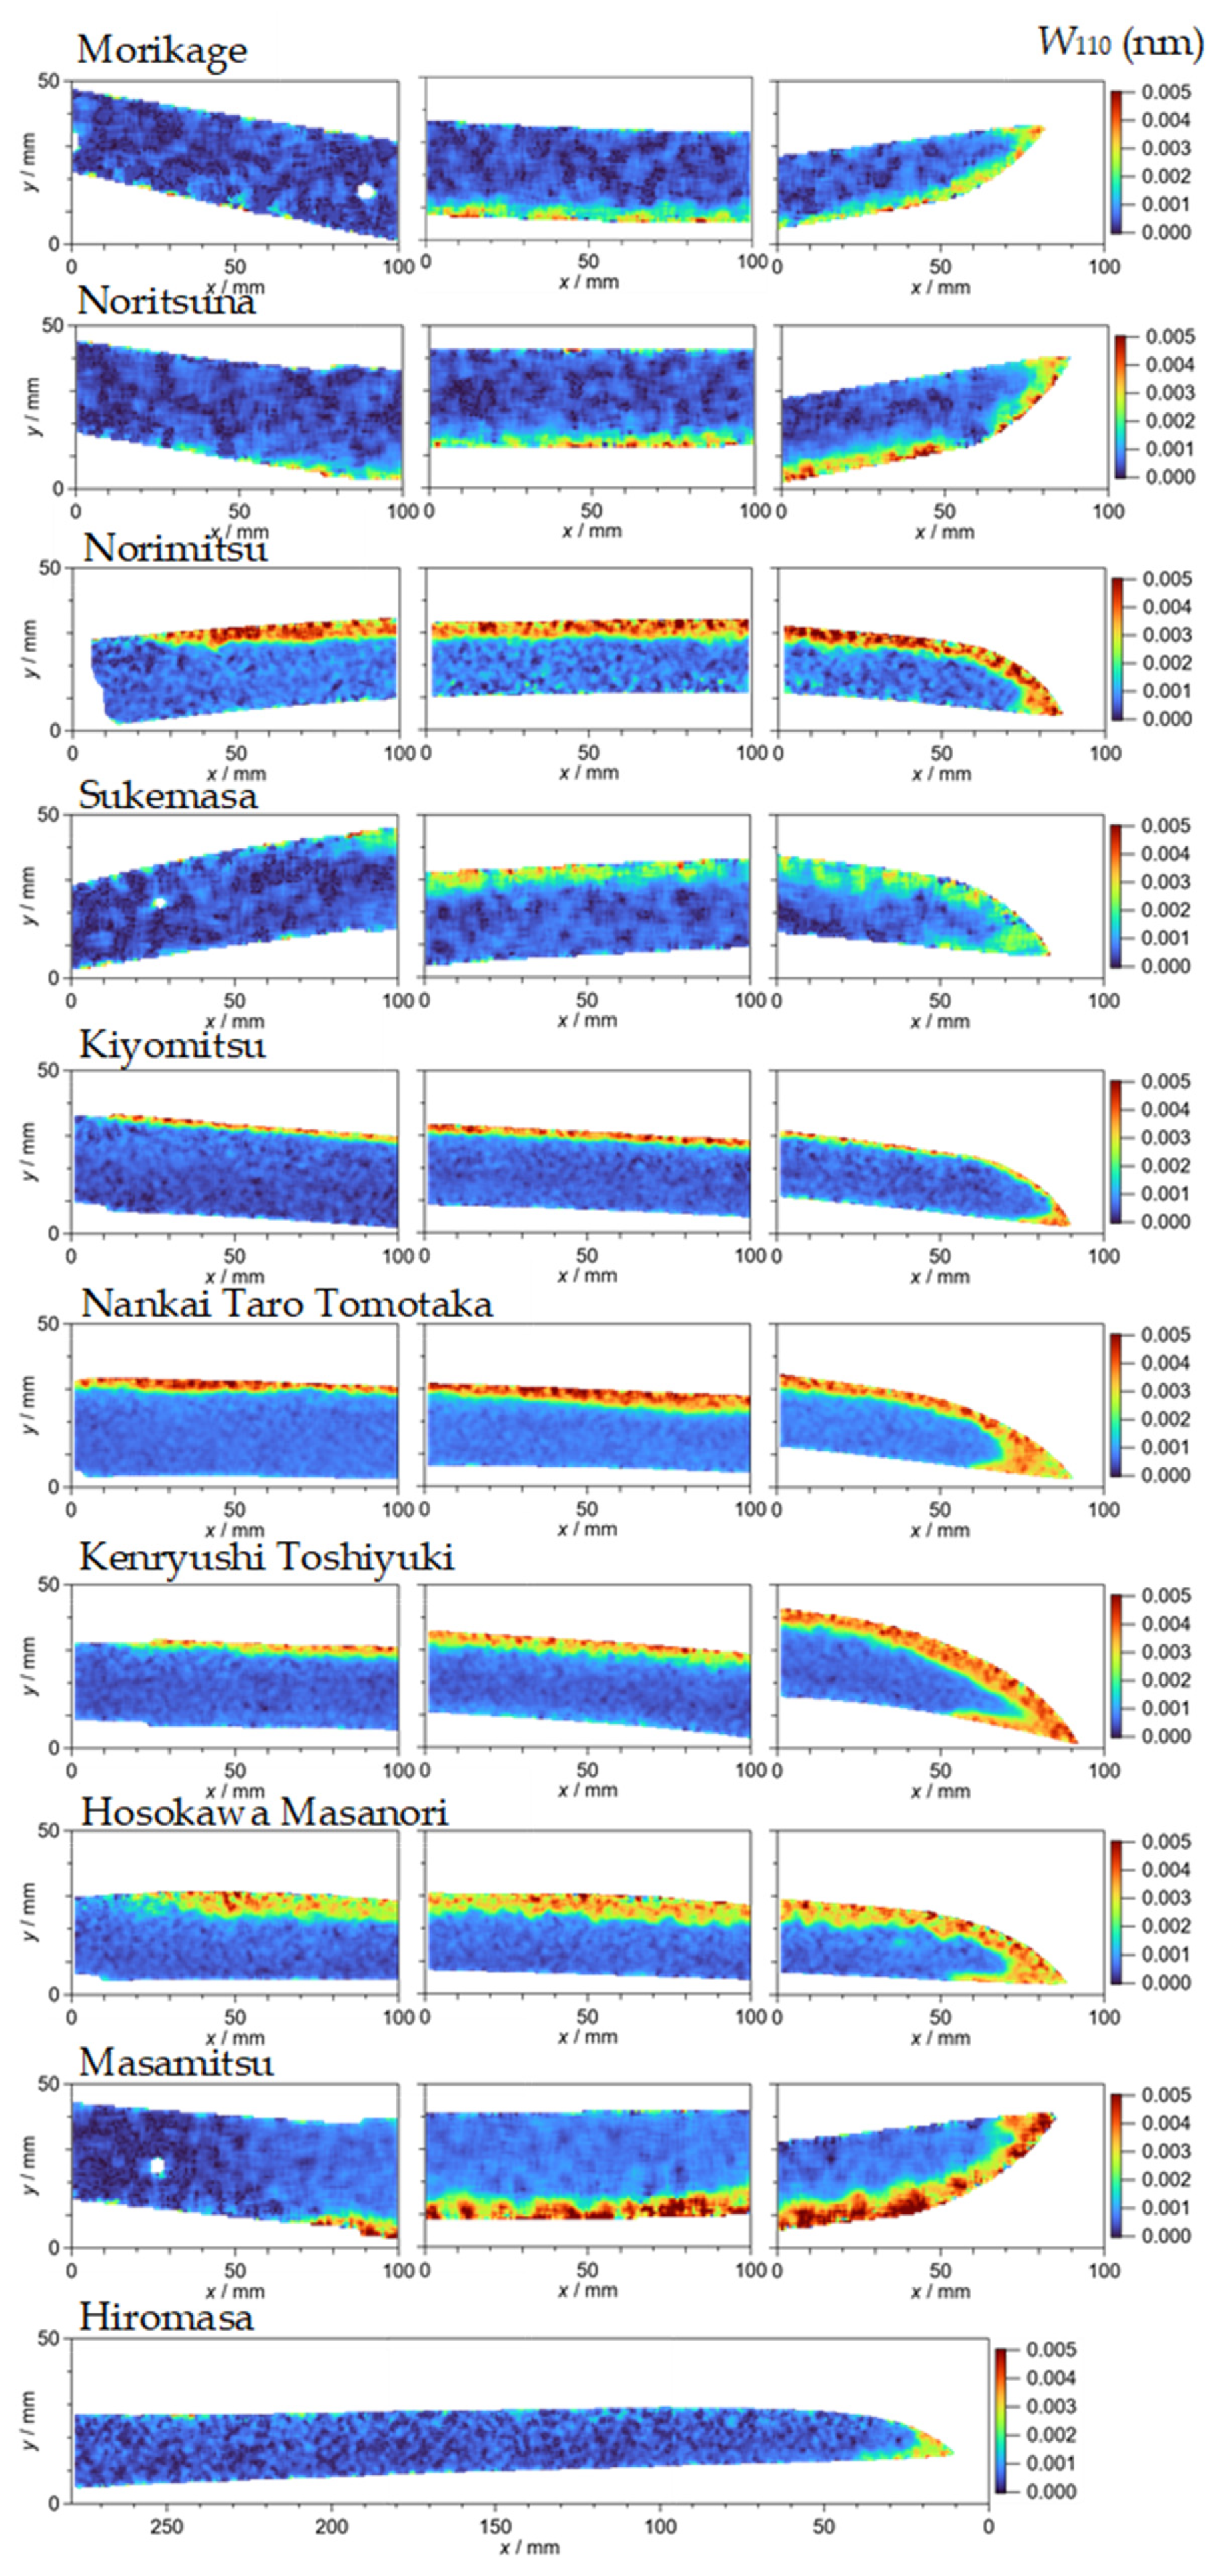
Figure 7 shows the widths of the edge broadening at the {110} edge, W110 in nm, to indicate martensite or quenched areas. The color bar range is from 0.0 to 0.005 nm. W110 values of three old swords, Morikage, Norimitsu, and Sukemasa, were not as high as that of Norimitsu, since the latter has wide red areas but the other three swords have green areas wider than Norimitsu. Norimitsu is a saiha sword and would have been quenched again in later years. The quenching areas of Tomotaka, Toshiyuki, Masanori, and Masamitsu appear clearly compared with these old swords. The quenching area of Kiyomitsu is narrow but can be clearly observed. This reflects the narrow straight hamon. These results suggest that the quenching of the old swords was weaker than that of the later swords. However, Hiromasa has a quenched area only around the tip but not at the edge side. This may be due to the edge being polished over time.

4.2. Lattice Plane Spacing d110

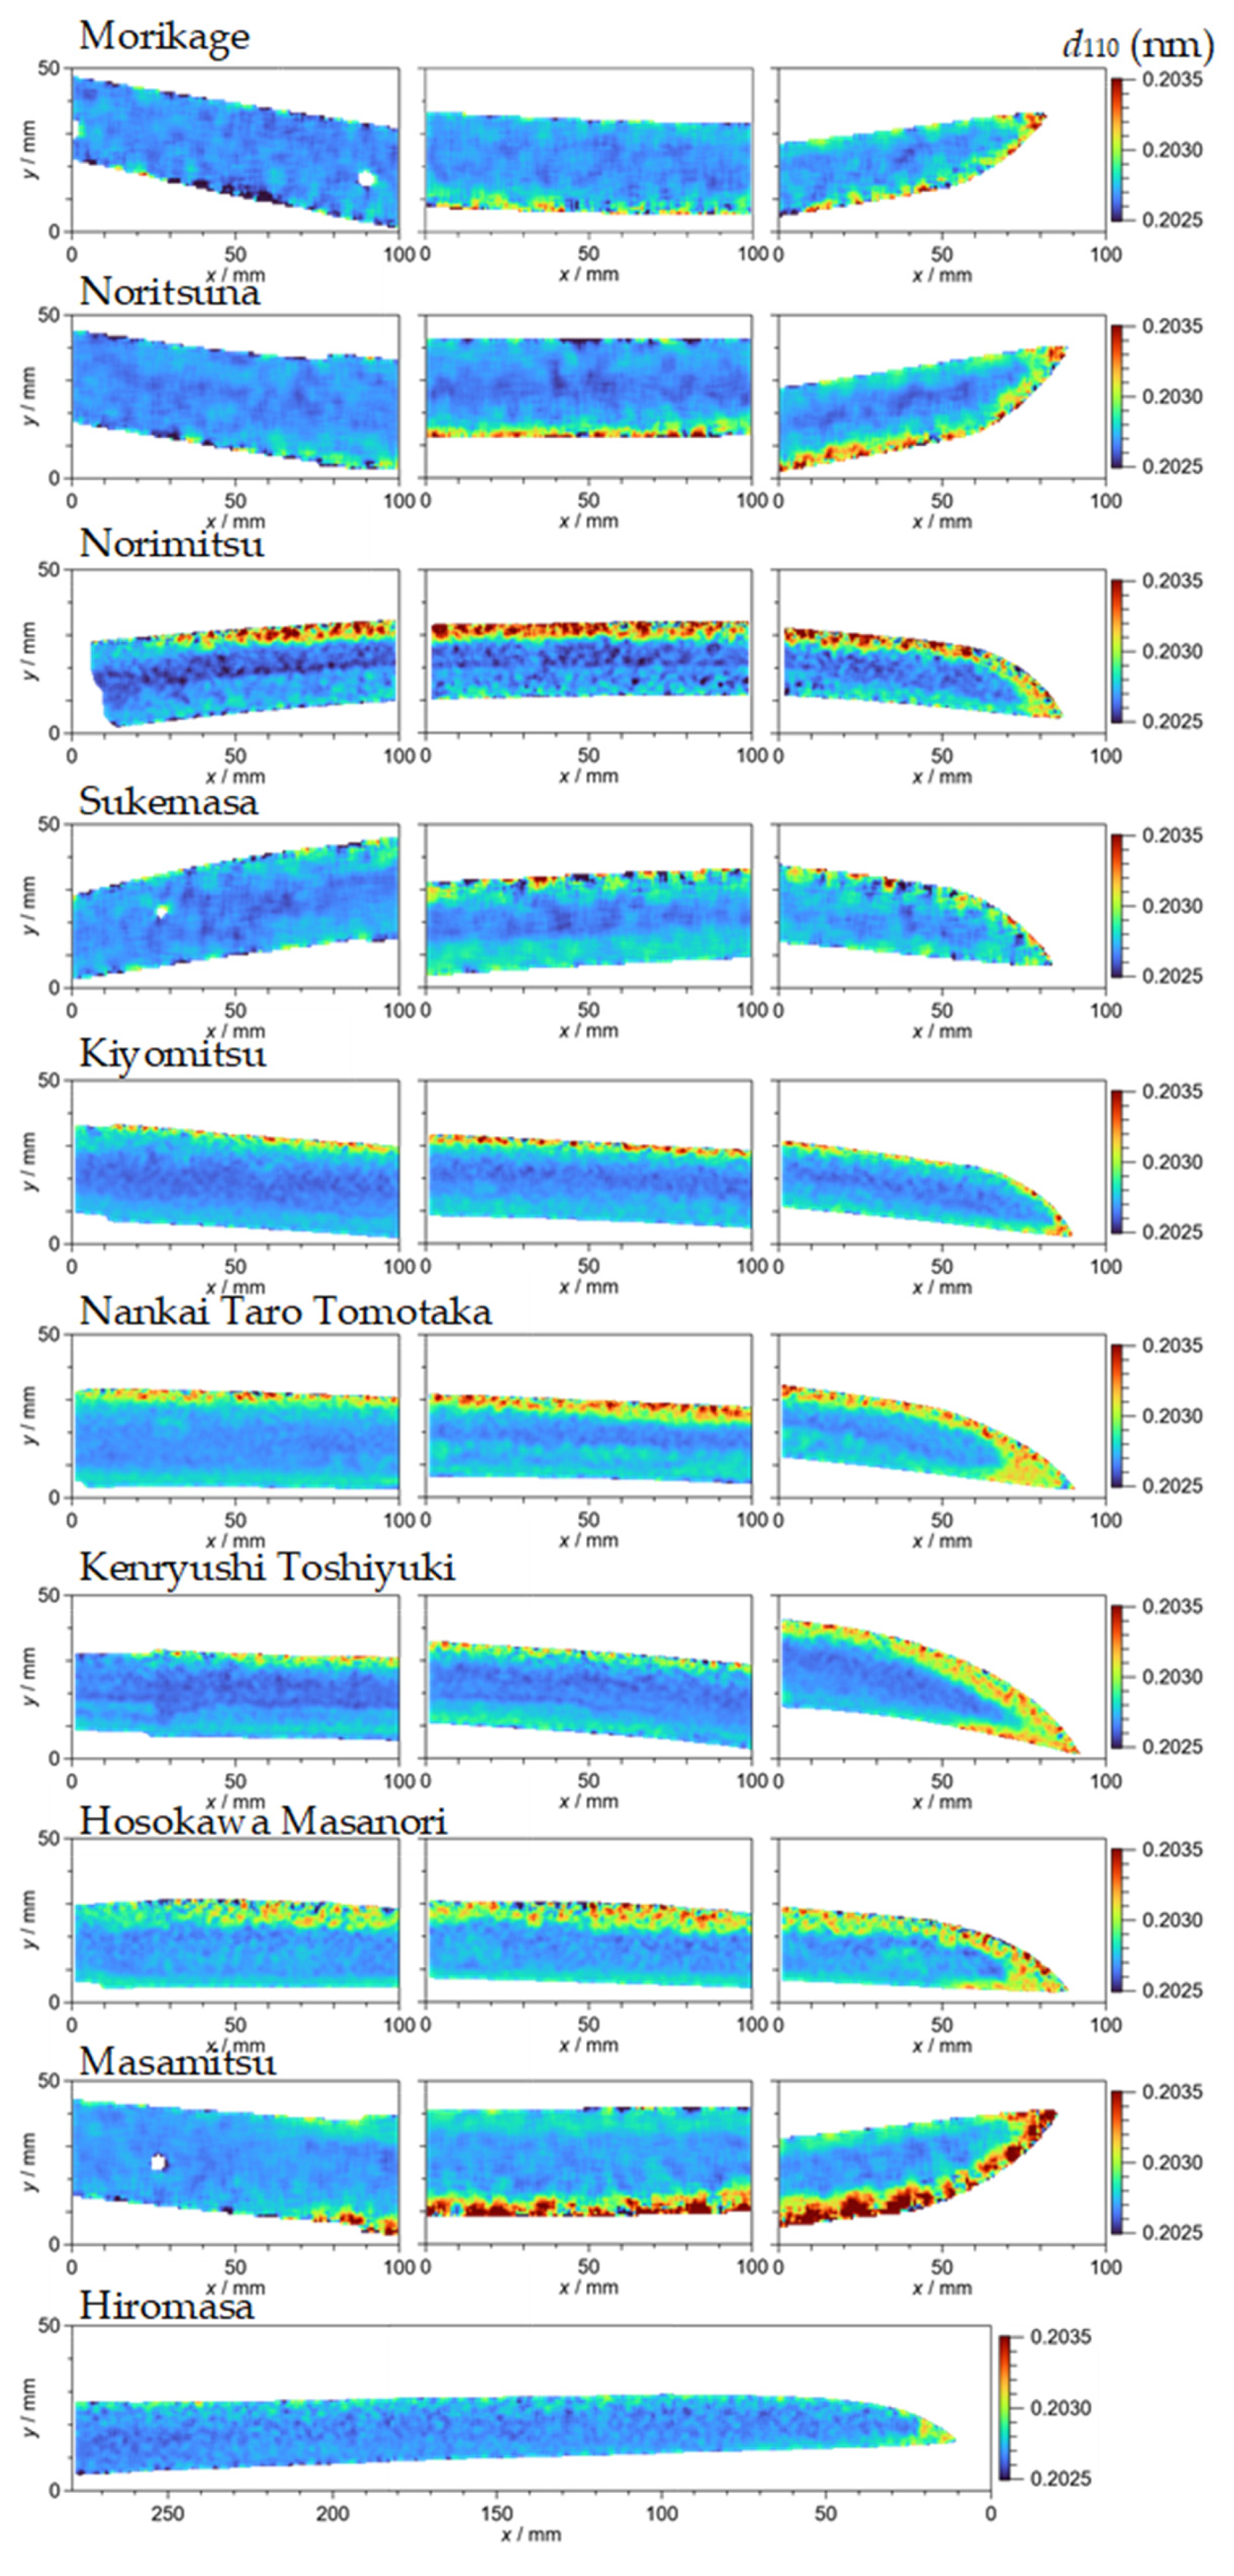
Figure 8 shows the mapping of the lattice plane spacing d110. The color bar range is from 0.2025 to 0.2035 nm. Largest lattice plane spacings are observed at the edge sides for all swords other than Hiromasa, and this is due to martensite. At the back side, areas of larger lattice plane spacing were sometimes observed, and this is considered to be due to bending of the swords by quenching. The values and areas of the larger lattice plane spacing are different from each other, and this suggests different sword-making processes among the swords. However, there is no such area for the short sword, Hiromasa, because there was almost no bending.

4.3. Degree of Anisotropy (Texture)

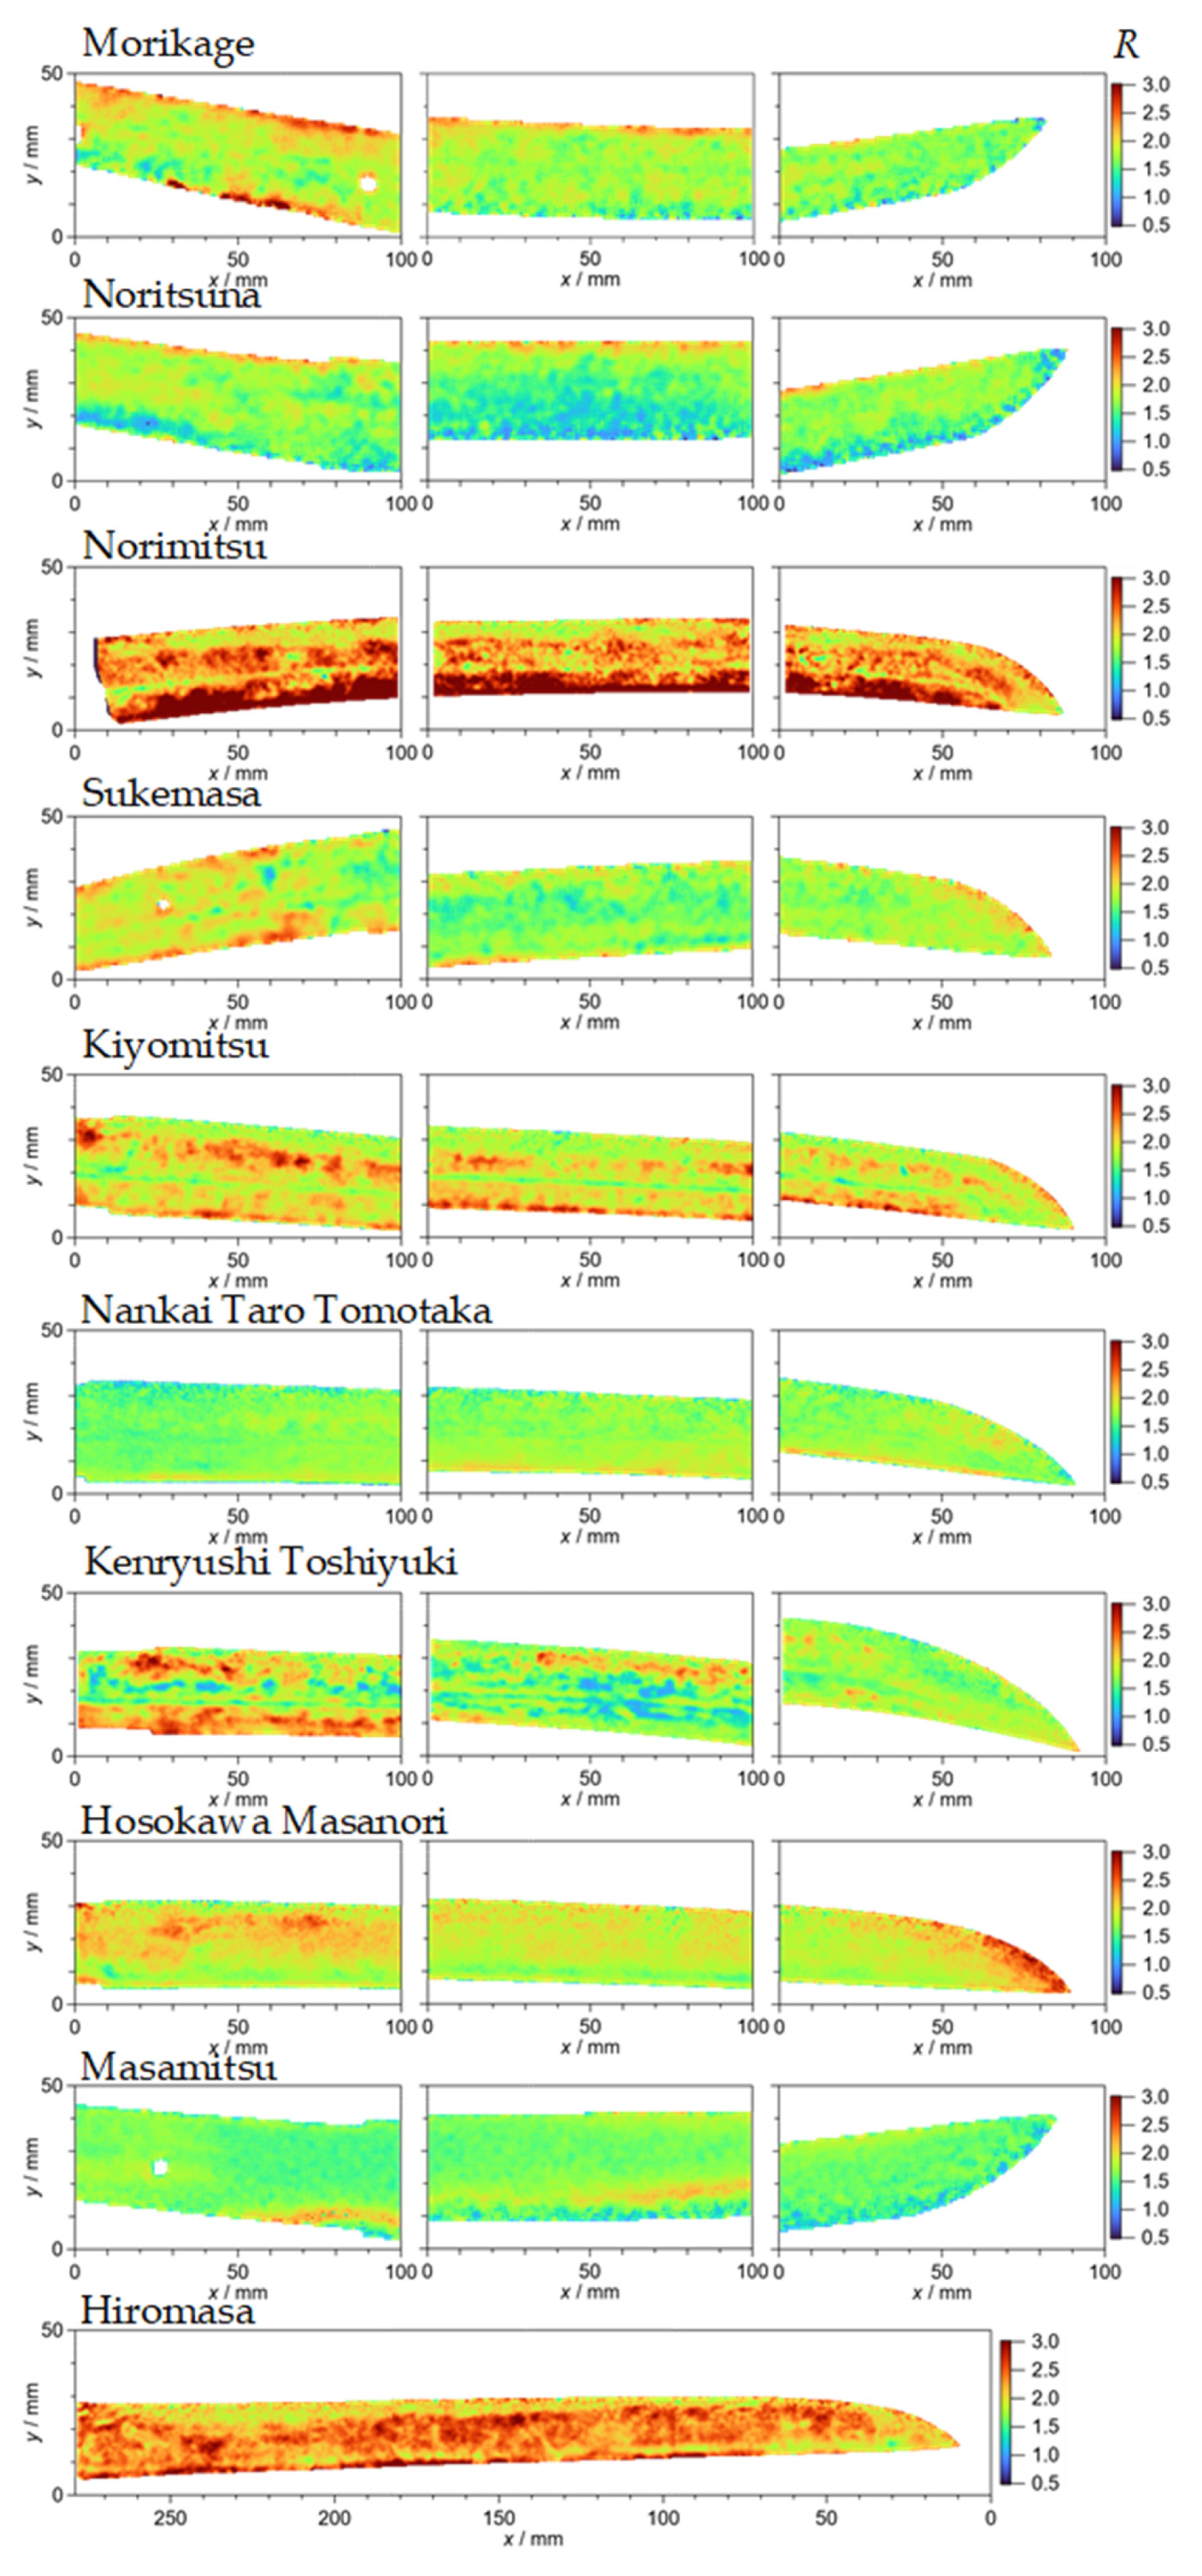
Figure 9 shows the mapping of anisotropy parameter R. The color bar range is from 0.5 to 3.0. It is considered that the texture or anisotropy will be affected by forging from one direction as with a rolling press in steel production. However, the causes of the texture resulting from the sword-making process are not clearly understood. The R distributions do not seem to have a general trend; even in Bizen swords, there are differences. Morikage has a slightly stronger anisotropy over the whole sword, and a similar distribution was observed for Masanori and Hiromasa. Norimitsu shows a similar distribution but is much stronger at the back side and slightly weaker toward the edge side. Noritsuna has a rather strong anisotropic area at the back side and almost isotropic areas from around the shinogi to the edge in the middle area and at the edge sides in the nakago and the tip areas. The shinogi is the thickest place around the center in the height direction, and nakago is the area where the sword handle is set. This tendency is similar to Tomotaka while being less anisotropic. Sukemasa shows isotropic features around the center in the height direction, and the texture becomes stronger in the nakago and tip areas. Kiyomitsu shows two areas of strong texture in the upper and lower the shinogi. Two similar strong areas were observed in the left figure of Toshiyuki but the trend is different in other parts. Masamitsu has a slightly strong anisotropic area continuing from the edge side of the nakago to the center part. This feature is uniquely observed only in this sword, and it may be due to strong forging around this area. As mentioned before, the distributions of the parameter R do not show systematic changes depending on the eras and places. Although the characteristics of each sword was recognized, further studies are needed to clarify the reasons for such anisotropy.

4.4. Crystallite Size

Figure 10 shows the mapping of the crystallite size S in µm. The color bar range is from 0 to 5 µm. It is known that the carbon content affects the crystallite size. The grain size increases from the edge to the back for Kobuse (in Japanese) structure [41]. In this sword, a soft steel with low carbon content (core steel) is covered with a hard steel with high carbon content (surface steel), except on the back surface of the sword. A similar trend was observed in the study on a piece of an old sword [5], in which the grain size was 10–15 µm at the edge side and become larger toward the backside. The grain size is larger than the crystallite size since the crystallite size reflects the size of the perfect crystal in a grain through the first order extinction. The crystallite size as obtained by BET exhibits a similar trend in the size change to the grain size [17]. The first three are Bizen/Bishu swords and the crystallite size of these swords have a similar trend, where the size is large in the back areas and smaller at the edge sides. However, Kiyomitsu shows a more complicated distribution, in which areas with large crystallite size appear around the center in the height direction in the middle figure, and a wider area of the larger crystallite size appears in the left figure. Toshiyuki has a more random distribution of the crystallite size. However, uniform distributions of a smaller crystallite size appear in Sukemasa, Tomotaka, and Masamitu. The distribution of Hiromasa shows some larger crystallite size areas at the back side and smaller areas at the edge side, which is similar to the Bizen swords while the larger-size area is small.
The uniform distributions of small-size crystallites are due to the higher carbon content in the steel, suggesting a monolayer structure in the swords. The distributions of Kiyomitsu and Toshiyuki are complicated, indicating possibly complicated structures.

4.5. CT Images

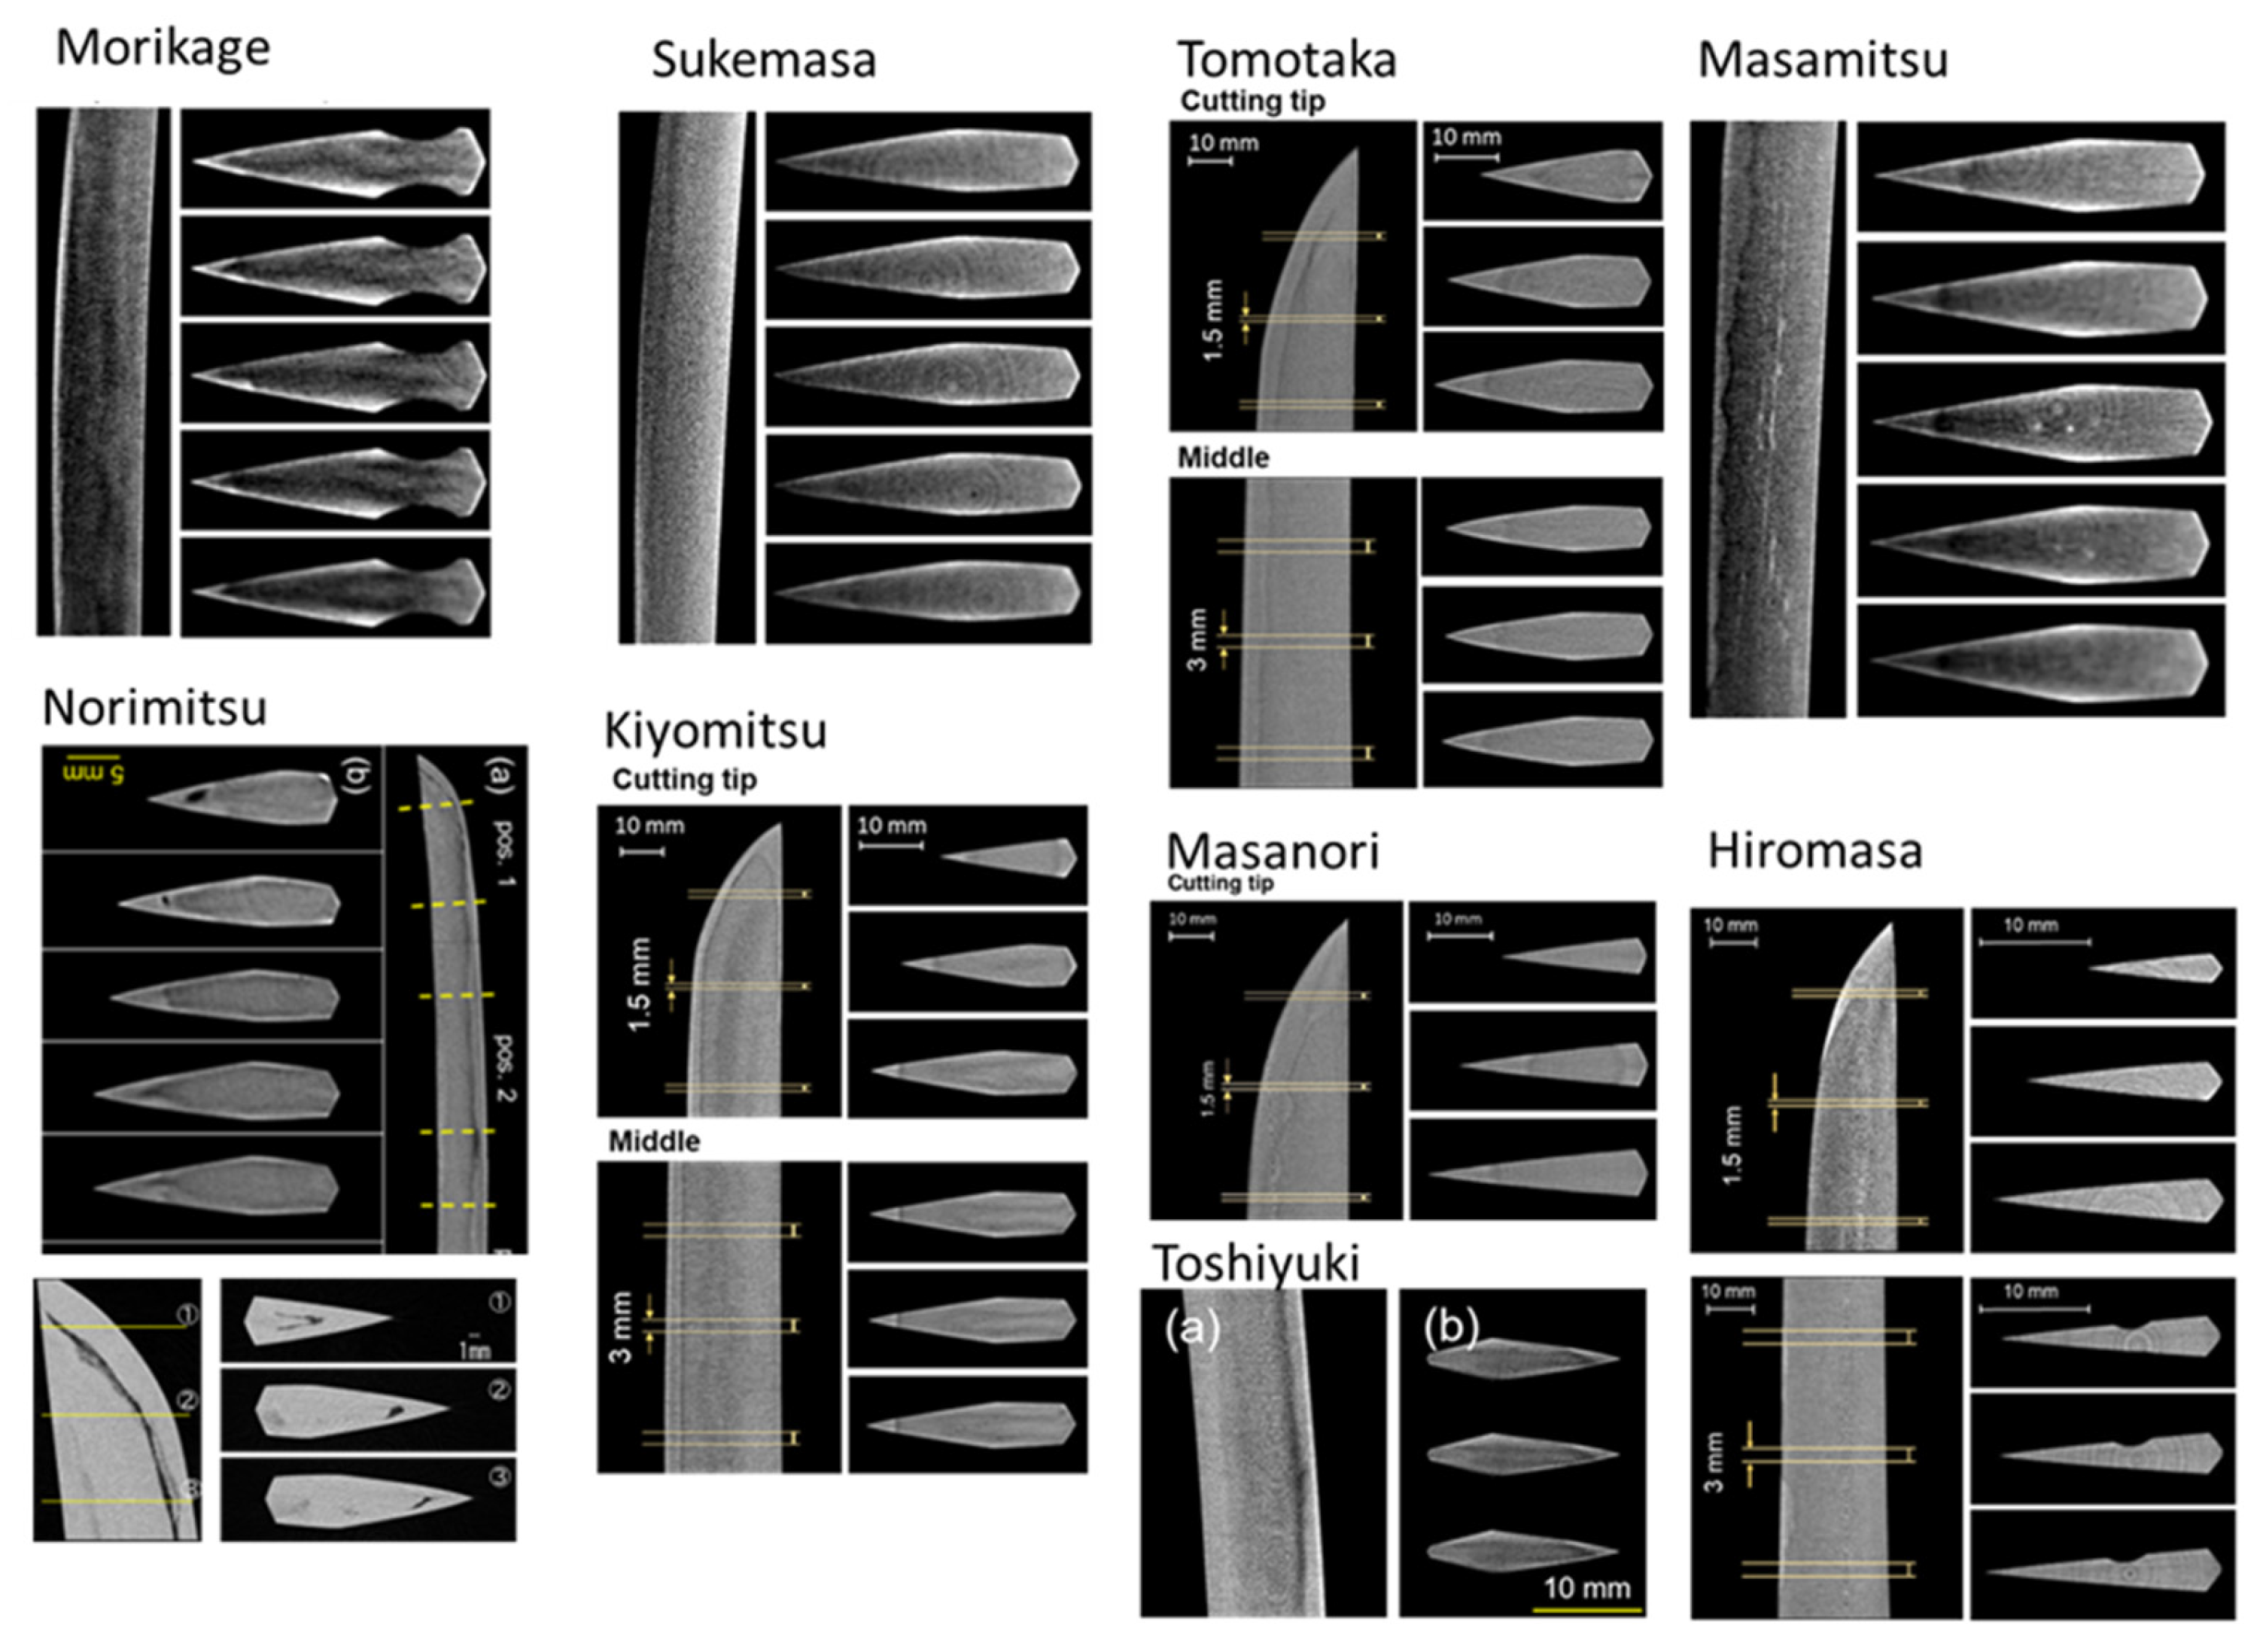
Figure 11 shows CT images of swords other than Noritsuna [28,30,31,33]. White areas occasionally appeared at the corners and surfaces due to beam-hardening and partial volume effects, which are common in CT imaging of metallic materials. Sword images, except for those of Hiromasa, also show black lines near the edges in the longitudinal direction, which indicate quenching area boundaries. For Hiromasa, a line showing the boundary was observed around the tip, and this is consistent with the result of the edge width distribution, where a quenching area was only observed around the tip. In cross-sectional images, quenching boundaries were observed as curved black lines, since there was a temperature gradient along the thickness direction during quenching. However, straight lines were observed for Kiyomitsu, since it has a narrow straight quenching area and a narrow hamon. The images for Kiyomitsu and Toshiyuki show a complicated contrast change. Their crystallite size distributions were also complicated. Images of Sukemasa, Tomotaka, and Masamitsu show smooth contrast, suggesting a monolayer structure. Masanori exhibits a rather smooth contrast change, but a boundary line near the back appears in the center figure of the cross-sections due to quenching from the edge side to the back. In Masamitsu, there are white lines in the longitudinal image and white spots in the cross-section images, which may be due to neutron absorption, but this is not certain. It is indicated that swords with a monolayer structure were present in different places and in the eras of the old swords and the new-new swords. Therefore, this type of sword-making process was probably widely used.
A lower figure of Norimitsu showing a tip area clearly indicates black areas in the upper left figure. We confirmed these are voids, and there are narrow black lines towards the shinogi from the void area, which will indicate boundaries between the core steel and the surface steel, which would be produced during a forge-welding of a surface steel and a core steel. The cross-sectional images suggest that the height of the surface steel was low, probably below the shinogi. Cross-sectional images far from the tip shown in the upper figure show no such voids. Therefore, this forge weld failure happened only at the tip area.
Based on the results, the carbon contents at surface positions of Norimitsu were measured in order to confirm the layered structure [32]. For this measurement, negative muon lifetime analysis was used [42], which enables us to measure the carbon content at an end position of a muon range, namely, as a function of depth along the muon beam. In this method, negative muons are irradiated to the sword and the muons form muonic atoms. The muon lifetime depends on materials. For example, the lifetimes are 205.4 ns for iron and 2022.6 ns for carbon. Therefore, we can distinguish these two decay curves and the intensity of each decay is obtained by fitting. From these intensities, we can deduce the carbon content. Muon range in a material is uniquely determined by muon momentum, and the carbon content at the end point of the range is obtained. We measured the carbon contents at a depth of 0.75 mm from the surface, and the positions were near the hamon, and around shinogi, and shinogiji (between shinogi and back) around the center of the longitudinal direction. The carbon contents were 0.41, 0.19, and 0.18 mass %. The latter two carbon contents correspond to that of the core steel, indicating that the core steel came to the surface. The carbon content around the hamon corresponds to the surface steel. Based on the results of CT, the crystallite size distribution, and the carbon contents, it is concluded that Norimitsu has a layered structure with core and surface steel. However, this layered structure is different from Kobuse, since the surface steel is low and thin and the core steel appears above the shinogi, which is a structure called Okihagane in Japanese. The same structure will be applicable to Morikage and Noritsuna, but not to all the Bizen swords. The results suggest that their crystallite sizes are controlled, mainly relating to the carbon content of the steel.

5. Summary

BET and CT neutron imaging methods were used to study the structural characteristics of Japanese swords. The combined use of BET and CT proved to be useful, clarifying that the crystallite size corresponds to the carbon content and the distributions are categorized into patterns. It is suggested that crystallite size is useful to understand sword structure and the sword-making process. The trend in anisotropy in each sword was different, and this may be due to different swordsmith’s forging process, and therefore, further investigation is required to elucidate the reasons behind them. Quenching areas were clearly observed, and it was found that quenching of the old swords was not as strong as that of later swords. Contrast variations in CT images were significant for swords with nonuniform crystallite sizes, but further studies are needed to understand the reason for this while the characteristics will relate the carbon content.
In this paper, we have summarized and compared the results obtained so far. Although the sword number was not so many, we were able to find specific characteristics existing among the swords. To gain more general knowledge on the characteristics of Japanese swords and study historical development of the sword-smithing technique, further research is desired for swords produced in various places and eras.

Author Contributions

Y.K., K.O., and Y.M. conceived the study. K.O., Y.M., J.D.P., K.W., H.S., and Y.K. conducted the neutron imaging experiments and discussed the experimental results. Y.K., K.O., and Y.M. wrote the manuscript, and all authors discussed the compared results of and commented on the manuscript. All authors have read and agreed to the published version of the manuscript.

Funding

This research received no external funding.

Data Availability Statement

The data will be available on request by the corresponding authors of the papers referred to in this paper.

Acknowledgments

Although this paper merely referenced the results described in the original papers, the authors would like to express their sincere gratitude to Katsuya Hirota at KEK for supply of Norimitsu and the late Masakazu Ito, the former curator of Wakou Museum in Yasuki City in Japan, for the supply of Morikage, Noritsuna, Sukemasa, and Masamitsu, as well as NITROPLUS Co., Ltd. for providing other Japanese swords. The neutron experiments at the MLF J-PARC were conducted under Proposal Nos. 2017A0099, 2021B0248, 2020I0022, 2020B0330, and 2022A0154 and 2023B0239.

Conflicts of Interest

The authors declare no conflicts of interest.

References

  1. Tawara, K. Nihontoh no Kagakuteki Kenkyu (Scientific Research of Japanese Swords); Hitachi Hyoronsha: Tokyo, Japan, 1953; pp. 6–77. (In Japanese) [Google Scholar]
  2. Tanimura, H. Development of the Japanese Sword. JOM 1980, 32, 63–73. Available online: https://link.springer.com/article/10.1007/BF03354549 (accessed on 18 November 2025). [CrossRef]
  3. Notis, M.R. The history of the metallographic study of the Japanese sword. Mater. Char. 2000, 45, 253–258. [Google Scholar] [CrossRef]
  4. Inoue, T. Tatara and the Japanese sword: The science and technology. Acta Mech. 2010, 214, 17–30. [Google Scholar] [CrossRef]
  5. Yaso, M.; Takaiwa, T.; Minagi, Y.; Kubota, K.; Morito, S.; Ohba, T.; Das, A.K. Study of Microstructures on Cross Section of JAPANESE SWORD. ESOMAT 2009, 2009, 07018. [Google Scholar] [CrossRef]
  6. Das, A.K.; Ohba, T.; Morito, S.; Yaso, M. Evidence of lath martensite in high-C Japanese sword produced from tamahagane steel by tatara process. Mater. Sci. Forum. 2010, 654–656, 138–141. [Google Scholar] [CrossRef]
  7. Matsumoto, C.; Das, A.K.; Ohba, T.; Morito, S.; Hayashi, T.; Takami, G. Characteristics of Japanese sword produced from tatara steel. J. Alloys Compd. 2013, 577S, S673–S677. [Google Scholar] [CrossRef]
  8. Pham, A.H.; Ohba, T.; Morito, S.; Hayashi, T. Automatic reconstruction approach to characterization of prior-austenite microstructure in various Japanese swords. Mater. Trans. 2015, 56, 1639–1647. [Google Scholar] [CrossRef]
  9. Inoue, T. The Japanese Sword: The material, manufacturing and computer simulation of quenching process. Mater. Sci. Res. Int. 1997, 3, 193–203. [Google Scholar] [CrossRef]
  10. Deschler-Erb, E.; Lehmann, E.H.; Pernet, L.; Vontobel, P.; Hartmann, S. The complementary use of neurons and X-rays for the non-destructive investigation of archaeological objects from Swiss collections. Archaeometry 2004, 46, 647–661. [Google Scholar] [CrossRef]
  11. Grazzi, F.; Civita, F.; Williams, A.; Scherillo, A.; Barzagli, E.; Bartoli, L.; Edge, D.; Zoppi, M. Ancient and historic steel in Japan, India and Europe, a non-invasive comparative study using thermal neutron diffraction. Anal. Bioanal. Chem. 2011, 400, 1493–1500. [Google Scholar] [CrossRef]
  12. Grazzi, F.; Bartoli, L.; Civita, F.; Franci, R.; Paradowska, A.; Scherillo, A.; Zoppi, M. From Koto age to modern times: Quantitative characterization of Japanese swords with Time of Flight Neutron Diffraction. J. Anal. At. Spectrom. 2011, 26, 1030–1039. [Google Scholar] [CrossRef]
  13. Barzagli, E.; Grazzi, F.; Scherillo, A.; Civita, F.; Zoppi, M. Determination of the metallurgical properties of six ferrous Japanese arrow tips through time-of-flight neutron diffraction. Acta Crystallogr. A 2011, 67, C525–C526. [Google Scholar] [CrossRef]
  14. Salvemini, F.; Luzin, V.; Grazzi, F.; Gatenby, S.; Kim, M.J. Structural characterization of ancient Japanese swords from MAAS using neutron strain scanning measurements. Mater. Res. Proc. 2017, 2, 443–448. [Google Scholar] [CrossRef]
  15. Salvemini, F.; Luzin, V.; Avdeev, M.; Tremsin, A.; Sokolova, A.; Gregg, A.; Wensrich, C.M.; Gatenby, S.; Kim, M.J.; Grazzi, F. Samurai’s swords, a non-invasive investigation by neutron techniques. Materials Science Forum. 2020, 983, 15–23. [Google Scholar] [CrossRef]
  16. Harjo, S.; Kawasaki, T.; Grazzi, F.; Shinohara, T.; Tanaka, M. Neutron diffraction study on full-shape Japanese sword. Materialia 2019, 7, 100377. [Google Scholar] [CrossRef]
  17. Sato, H.; Kamiyama, T.; Kiyanagi, Y. A Rietveld-type analysis code for pulsed neutron Bragg-edge transmission imaging and quantitative evaluation of texture and microstructure of a welded α-iron plate. Mater. Trans. 2011, 52, 1294–1302. [Google Scholar] [CrossRef]
  18. Sato, H.; Sato, T.; Shiota, Y.; Kamiyama, T.; Tremsin, A.S.; Ohnuma, M.; Kiyanagi, Y. Relation between Vickers hardness and Bragg-edge broadening in quenched steel rods observed by pulsed neutron transmission imaging. Mater. Trans. 2015, 56, 1147–1152. [Google Scholar] [CrossRef]
  19. Bunge, H.J. Advantages of neutron diffraction in texture analysis. Textures Micro Struct. 1989, 10, 265–307. [Google Scholar] [CrossRef]
  20. Brokmeier, H.G.; Gan, W.M.; Randau, C.; Völler, M.; Rebelo-Kornmeier, J.; Hofmann, M. Texture analysis at neutron diffractometer STRESS-SPEC. Nucl. Instrum. Methods Phys. Res. A 2011, 642, 87–92. [Google Scholar] [CrossRef]
  21. Matthies, S.; Pehl, J.; Wenk, H.-R.; Lutterotti, L.; Vogel, S.C. Quantitative texture analysis with the HIPPO neutron TOF diffractometer. J. Appl. Cryst. 2005, 38, 462–475. [Google Scholar] [CrossRef]
  22. Kockelmann, W.; Chapon, L.C.; Radaelli, P.G. Neutron texture analysis on GEM at ISIS. Phys. B 2006, 385–386, 639–643. [Google Scholar] [CrossRef]
  23. Xu, P.G.; Harjo, S.; Ojima, M.; Suzuki, H.; Ito, T.; Gong, W.; Vogel, S.C.; Inoue, J.; Tomota, Y.; Aizawa, K.; et al. High stereographic resolution texture and residual stress evaluation using time-of-flight neutron diffraction. J. Appl. Crystallogr. 2018, 51, 746–760. [Google Scholar] [CrossRef] [PubMed]
  24. Xu, P.G.; Liss, K.D. Multiple wavelengths texture measurement using angle dispersive neutron diffraction at WOMBAT. Quantum Beam Sci. 2021, 5, 11. [Google Scholar] [CrossRef]
  25. Xu, P.G.; Tomota, Y.; Arakaki, Y.; Harjo, S.; Sueyoshi, S. Evaluation of austenite volume fraction in TRIP steel sheets using neutron diffraction. Mater. Charact. 2017, 127, 104–110. [Google Scholar] [CrossRef]
  26. Oikawa, K.; Kiyanagi, Y.; Sato, H.K.; Ohmae, K.; Pham, A.H.; Watanabe, K.; Matsumoto, Y.; Shinohara, T.; Kai, T.; Harjo, S.; et al. Pulsed neutron imaging based crystallographic structure study of a Japanese sword made by Sukemasa in the Muromachi period. Mater. Res. Proc. 2020, 15, 207–213. [Google Scholar] [CrossRef]
  27. Sato, H.; Kiyanagi, Y.; Oikawa, K.; Ohmae, K.; Pham, A.H.; Watanabe, K.; Matsumoto, Y.; Shinohara, T.; Kai, T.; Harjo, S.; et al. Crystallographic microstructure study of a Japanese sword made by Noritsuna in the Muromachi period by pulsed neutron Bragg-edge transmission imaging. Mater. Res. Proc. 2020, 15, 214–220. [Google Scholar] [CrossRef]
  28. Matsumoto, Y.; Watanabe, K.; Ohmae, K.; Uritani, A.; Kiyanagi, Y.; Sato, H.; Ohnuma, M.; Pham, A.H.; Morito, S.; Ohba, T.; et al. Comparative study of ancient and modern Japanese swords using neutron tomography. Mater. Res. Proc. 2020, 15, 221–226. [Google Scholar] [CrossRef]
  29. Ohmae, K.; Kiyanagi, Y.; Sato, H.; Oikawa, K.; Pham, A.H.; Watanabe, K.; Matsumoto, Y.; Shinohara, T.; Kai, T.; Harjo, S.; et al. Crystallographic structure study of a Japanese sword Masamitsu made in the 1969 using pulsed neutron imaging. Mater. Res. Proc. 2020, 15, 227–232. [Google Scholar] [CrossRef]
  30. Matsumoto, Y.; Oikawa, K.; Watanabe, K.; Sato, H.; Parker, J.D.; Shinohara, T.; Kiyanagi, Y. Nondestructive analysis of internal crystallographic structures of Japanese swords using neutron imaging. J. Archaeol. Sci. Rep. 2024, 58, 104729. [Google Scholar] [CrossRef]
  31. Oikawa, K.; Matsumoto, Y.; Watanabe, K.; Sato, H.; Parker, J.D.; Shinohara, T.; Kiyanagi, Y. Energy-resolved neutron imaging study of a Japanese sword signed by Bishu Osafune Norimitsu. Sci. Rep. 2024, 14, 27990. [Google Scholar] [CrossRef]
  32. Kiyanagi, Y.; Oikawa, K.; Ninomiya, K.; Watanabe, K.; Pham, A.H.; Tampo, M.; Kubo, K.M.; Sato, H.; Matsumoto, Y.; Shinohara, T.; et al. Metallurgical study of Japanese swords made in Bizen in the Muromachi period by using pulsed neutron imaging and muon lifetime measurements. JPS Conf. Proc. 2025. accepted. [Google Scholar]
  33. Oikawa, K.; Matsumoto, Y.; Sato, H.; Watanabe, K.; Parker, J.D.; Sshinohara, T.; Kiyanagi, Y. Pulsed-Neutron imaging study of a naginata from the Edo period and spears from the Muromachi period. JPS Conf. Proc. 2025. accepted. [Google Scholar]
  34. Shinohara, T.; Kai, T.; Oikawa, K.; Nakatani, T.; Segawa, M.; Hiroi, K.; Su, Y.; Ooi, M.; Harada, M.; Iikura, H.; et al. The energy-resolved neutron imaging system. RADEN. Rev. Sci. Instrum. 2020, 91, 043302. [Google Scholar] [CrossRef] [PubMed]
  35. Fermi, E.; Sturm, W.J.; Sachs, R.G. The Transmission of Slow Neutrons through Microcrystalline Materials. Phys. Rev. 1947, 71, 589–594. [Google Scholar] [CrossRef]
  36. Dollase, W.A. Correction of intensities for preferred orientation in powder diffractometry: Application of the March model. J. Appl. Cryst. 1986, 19, 267–272. [Google Scholar] [CrossRef]
  37. Larson, A.C.; Von Dreele, R.B. General Structure Analysis System (GSAS); Los Alamos National Laboratory Report LAUR 86-748; Los Alamos National Laboratory: Los Alamos, NM, USA, 2004.
  38. Sabine, T.M. A reconciliation of extinction theories. Acta Crystallogr. Sec. A 1988, 44, 368–373. [Google Scholar] [CrossRef]
  39. Sabine, T.M.; Von Dreele, R.B.; Jørgensen, J.-E. Extinction in time-of-flight neutron powder diffractometry. Acta Cryst. 1988, A44, 374–379. [Google Scholar] [CrossRef]
  40. Kropff, F.; Granada, J.R. CRIPO: A Fast Computer Code for the Evaluation of σT in Polycrystalline Materials; Unpublished Report CAB-1977; Institute Balseiro: Bariloche, Argentina, 1977. [Google Scholar]
  41. Kitada, M. Microstructure of Japanese Swords in the Muromachi Period, Uchida Rokakuho, Japan; Uchida Rokakuho: Tokyo, Japan, 2008; Chapter 3-1; pp. 13–17. (In Japanese) [Google Scholar]
  42. Ninomiya, K.; Kubo, M.K.; Inagaki, M.; Yoshida, G.; Chiu, I.; Kudo, T.; Asari, S.; Sentoku, S.; Takeshita, S.; Shimomura, K.; et al. Development of a non-destructive depth-selective quantification method for sub-percent carbon contents in steel using negative muon lifetime analysis. Sci. Rep. 2024, 14, 1797. [Google Scholar] [CrossRef]
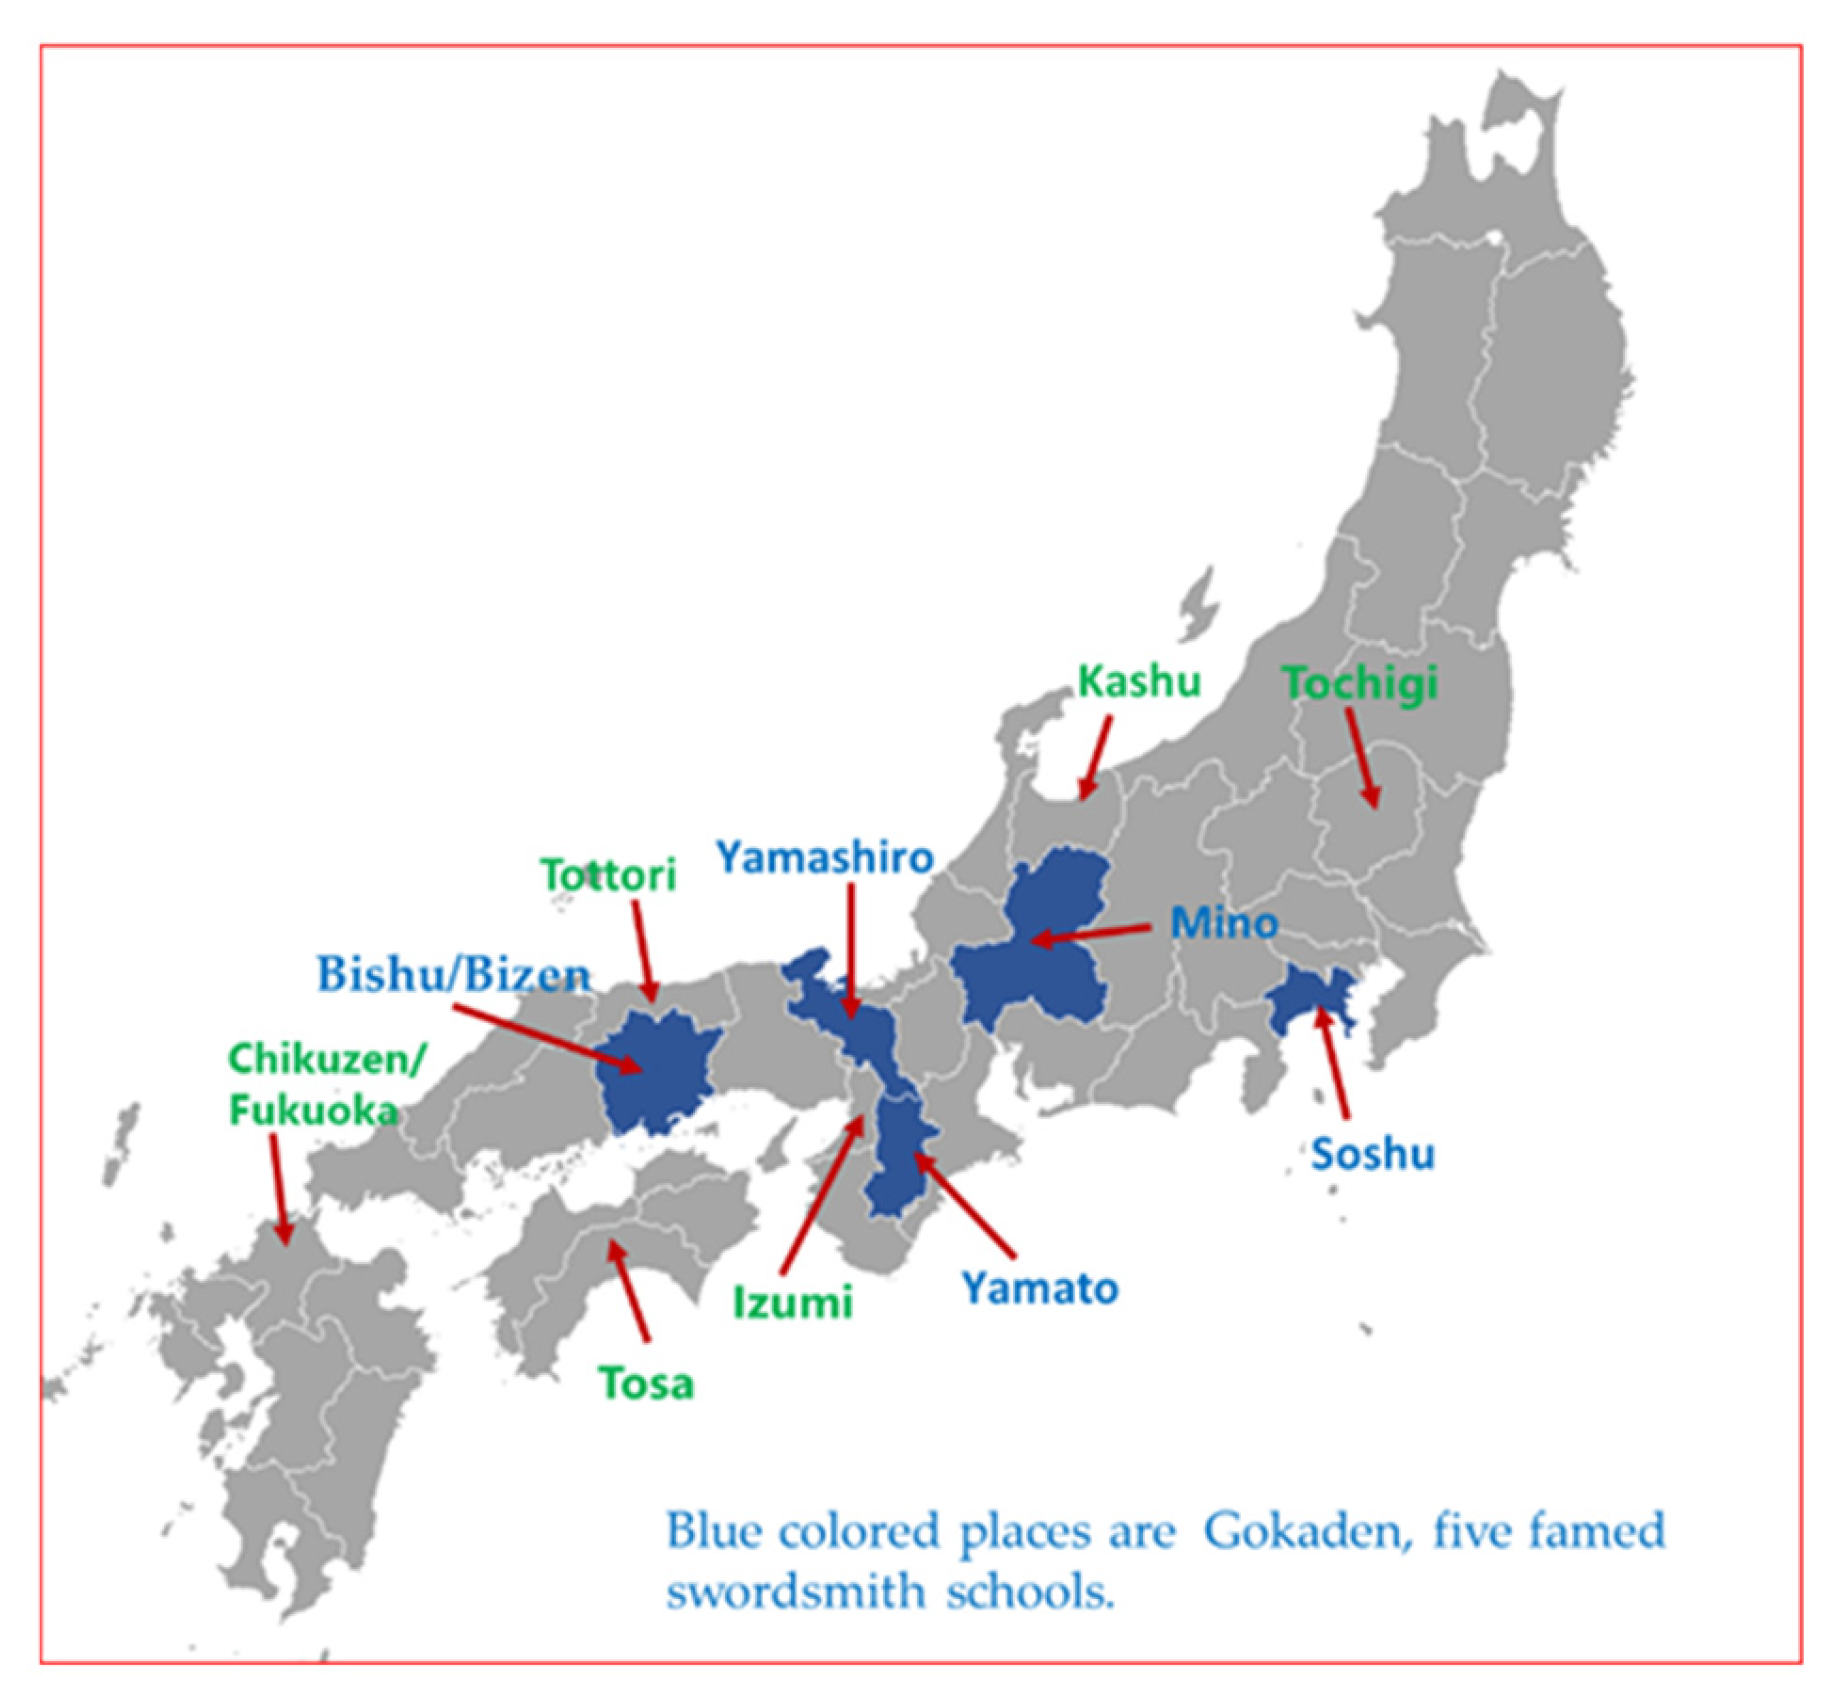
Figure 1. Locations of Gokaden and of the production of the swords discussed here.
Qubs 09 00033 g001
Figure 2. Photos of the swords discussed in this paper. Names of swordsmiths, production places, and sword category are written. The phot of Sukemasa was taken from [26], Morikage [28], Masamitsu [29], Kiyomitsu, Nankai Taro Tomotaka and Hosokawa Masanori [30], Norimitsu [31], Noritsuna [32] and Kenryushi Toshiyuki [33].
Qubs 09 00033 g002
Figure 3. Schematic view of the experimental setup. ToF spectra of an incident beam I0(λ) and a transmitted beam I(λ) are indicated.
Qubs 09 00033 g003
Figure 4. A Japanese sword set in front of a BET detector.
Qubs 09 00033 g004
Figure 5. Total neutron cross-section indicating each component (a), change in the entire effective total cross-sections due to anisotropy parameter R and preferred orientation axis <HKL> (b), and crystallite size S (c). Figure (b,c) were taken from Ref. [17].
Qubs 09 00033 g005
Figure 6. Bragg-edge transmission spectra. Red circles/plus markers indicate the observed values, the blue line represents the calculated values, and the short green vertical lines indicate the positions of 2dhkl. (a) Bragg edges around {110}, and (b) transmission spectra over a wide-wavelength region [31].
Qubs 09 00033 g006
Figure 7. Mapping of the edge widths W110 (nm) corresponding to quenching area [26,27,29,30,31,32,33].
Qubs 09 00033 g007
Figure 8. Mapping of the lattice plane spacing d110 (nm) [26,27,29,30,31,32,33].
Qubs 09 00033 g008
Figure 9. Mapping of the degree of the preferred orientation R [26,27,29,30,31,32,33].
Qubs 09 00033 g009
Figure 10. Mapping of the crystallite size S in nm [26,27,29,30,31,32,33].
Qubs 09 00033 g010
Figure 11. CT images of the swords. In each figure, the left-hand figure is along the longitudinal direction and the right-hand figure is a cross-sectional image, except for the upper figure for Norimitsu. The CT images of Morikaga, Sukemasa and Masamitsu were taken from [28], Kiyomitsu, Tomotaka and Masanori from [30], Norimitsu from [31] and Toshiyuki from [33].
Qubs 09 00033 g011
Table 1. List of Japanese swords.
No.SwordsmithProduction AgeType Production Area
(Present-Day Prefecture)
Blade Length (cm)
1MorikageSouth and North Courts period (1356–1361)Long sword (Old sword)Bishu (Okayama)80.3
2NoritsunaMuromachi period (1405)Long sword (Old sword)Bishu (Okayama)75.0
3NorimitsuMuromachi period
(~15th century)
Wakizashi (Old sword)Bishu (Okayama)45.4
4SukemasaLatter period of MuromachiSword (Old sword)Izumi (Osaka)64.0
5KiyomitsuEdo periodSword (New-new sword)Kashu (Ishikawa)69.6
6Nankai Taro TomotakaEdo period (1836)Sword (New-new sword)Tosa (Kochi)/
Yamashiro(Kyoto)
70.8
7Hosokawa MasanoriEdo to Meiji periodWakizashi (New-new sword)(Tochigi)31.3
8MasamitsuShowa period (1969)Long sword (Modern sword)(Fukuoka)74.2
9Kenryushi ToshiyukiEdo period (1846)Naginata (New-new sword)Tottori (Tottori)39.1
10HiromasaBeginning of Muromachi periodShort sword (Old sword)Soshu (Kanagawa)26.9
Disclaimer/Publisher’s Note: The statements, opinions and data contained in all publications are solely those of the individual author(s) and contributor(s) and not of MDPI and/or the editor(s). MDPI and/or the editor(s) disclaim responsibility for any injury to people or property resulting from any ideas, methods, instructions or products referred to in the content.