Article

Methodological Approach to the Characterization of Single-Photon Sources Using a Hanbury Brown–Twiss Interferometer in a Laser-Excited Fluorescence Microscope

by
Sergey Mikushev
and
Aleksei Kalinichev
*
Research Park, St. Petersburg State University, 198504 St. Petersburg, Russia
*
Author to whom correspondence should be addressed.
Quantum Beam Sci. 2025, 9(4), 30; https://doi.org/10.3390/qubs9040030
Submission received: 24 June 2025 / Revised: 15 September 2025 / Accepted: 28 September 2025 / Published: 13 October 2025
(This article belongs to the Section Spectroscopy Technique)

Abstract

The development of quantum-enhanced technologies requires single-photon sources, as well as methods for their characterization and verification. Here, we describe a methodology for measuring the correlation function of a single-photon source using an experimental setup that comprises a laser-excited fluorescence microscope equipped with a Hanbury Brown–Twiss intensity interferometer as one of the detection systems. Measurements of the response function of the device and the reference samples are performed. The second-order autocorrelation function of the exciton state of GaAs quantum dots in AlGaAs nanowires is obtained and reveals a single-photon emission.

1. Introduction

Luminescence in semiconductors is a fundamental optical phenomenon that occurs due to the recombination of excited charge carriers and provides critical insight into the electronic structure, defect states, and carrier dynamics of these materials [1,2,3]. Steady-state luminescence spectroscopy, which measures the intensity of emitted light under continuous excitation, is widely used to determine bandgaps, impurity levels, and exciton effects in semiconductors [4,5]. By analyzing the spectral distribution and intensity of an emission, one can determine the radiative recombination pathways and assess the quality of the material. Therefore, steady-state luminescence is an important tool for optoelectronic applications such as light-emitting diodes (LEDs) [6], solar cells [7], and laser diodes [8].
While steady-state luminescence provides valuable information on the equilibrium properties of semiconductors, time-resolved luminescence spectroscopy enables dynamic insight into carrier recombination processes by measuring the emission decay on time scales ranging from picoseconds to milliseconds [9,10]. This method is excellent for investigating the mechanisms of non-radiative recombination, carrier trapping, and energy transfer, which are crucial for optimizing the performance of semiconductor devices [11].
The combination of steady-state and time-resolved luminescence methods has become indispensable in fundamental research and semiconductor technologies. These methods are widely used for the development of new materials, including low-dimensional systems such as quantum wells and dots (QWs and QDs) [12,13], nanowires (NWs) [14], and nanodiamonds with nitrogen-vacancy centers [15]. Such systems can serve as efficient sources of single photons [16,17], which play a crucial role in quantum-enhanced technologies [18,19,20] and enable secure communications, ultra-precise sensing, and advanced computing. In quantum cryptography, these objects are needed for quantum key distribution, which guarantees unconditional security through the non-cloning theorem and quantum entanglement [21].
In addition to traditional luminescence studies, measurements and manipulations with single photons require advanced correlation methods such as two-time field-intensity correlation. This allows for a deeper understanding of the statistical properties and fluctuations of the emitted light [22]. These methods reveal hidden dynamics, including blinking behavior in quantum dots [23] or spectral diffusion [24] in single emitters, which are not accessible using standard time-averaged measurements. By analyzing second-order coherence and temporal correlations, one can distinguish between classical and quantum light sources, study photon bunching/antibunching effects, and explore the underlying mechanisms of light–matter interactions in semiconductors [25,26].
Correlation functions can be conveniently measured using interferometric methods [27]. One method involves measuring the temporal correlations in a light field, based on the investigations of interference patterns between the original radiation and its delayed analog [27]. An effective experimental implementation of this method is the Michelson interferometer, where the precise control over the relative path length between the two arms of the interferometer enables systematic variation in the time delay. The attenuation of the interferogram envelope with large differences in path length allows one to obtain the coherence time of the emitted photons and, as a consequence, an accurate quantitative assessment of the dephasing mechanisms.
Another approach is based on correlation measurements of optical intensity. For this purpose, the Hanbury Brown and Twiss (HBT) method is used [28]. In this case, the signal arises from the intensity fluctuations and does not depend on the interference or phase relationships in the fields. Historically, second-order correlations of strong light beams were obtained from the correlation of the time-dependent outputs of a photodetector, I ( t ) , in the form
g 2 τ I t I t + τ I t 2   .  
Using the photon counting method, the intensity is proportional to the number of photons, n t . Hence, Equation (1) can be rewritten as
g 2 τ = n t n t + τ n t 2 .  
The value of g 2 0 is particularly important, as it can be used to classify the coherent or quantum emission. For fully coherent light, one has g 2 0 = 1, whereas g 2 0 > 1 for a bunched light and g 2 0 < 1 for an anti-bunched light.
In this paper, a self-made experimental setup based on the HBT interferometer is methodically considered. The basic operating principle of the setup is as follows. The radiation from the object under study is divided into two detectors to count photons. Then, the delay time of the photon detection in one of the detectors is collected and analyzed relative to the previous detection in the other detector. Using these data, a histogram of the time distribution of successive detection events is constructed. The histogram yields the second-order correlation function, g 2 τ . It is worth noting that this method measures the conditional probability of the successive photon emissions, which makes it robust regarding experimental imperfections. Unlike interferometric approaches that are sensitive to optical mismatches or mechanical instabilities, photon correlation measurements are not affected by such technical constraints. The method’s robustness extends to systems with non-ideal atom-like behavior, where significant contributions from pure dephasing and non-radiative decay processes may be present [29]. Despite this advantage, the use of the method requires some experimental care and fine-tuning of optical measurements.
Here, we consistently describe the experimental setup for measuring the photon correlations, the technical means and devices used, and the detailed measurement methodology. The setup is based on a laser-excited fluorescence microscope, in which an HBT interferometer acts as one of the detection systems. The main emphasis of this paper is on the original setup design, allowing for qualitative cross-correlation measurements. Single-photon sources based on GaAs quantum dots in AlGaAs nanowires were selected as a model [30]. The value of the second-order correlation function, g 2 0 , was demonstrated, corresponding to the “true” single-photon sources. Quantum dots in different material systems are widely used as a platform for quantum optical devices [30,31,32]. However, the possibilities of photon correlation techniques are not limited to single-photon measurements and can reveal much more information about the internal dynamics of multi-exciton recombination [33]. Modern methods and equipment used in the setup allow one to investigate a wide range of spectral and kinetic properties of luminescence and the correlation characteristics of different light emitters, as well as to study their behavior under different temperatures and excitation powers.

2. Materials and Methods

2.1. General Description

The functional scheme of the setup is shown in Figure 1. The optical path of the excitation is shown by the green dotted line. The laser beam passes through a telescope, which enables the beam divergence to be varied in order to adjust the laser focusing point relative to the object position in the microscope. The subsequent automated attenuator enables measurements of the useful signal dependencies on the power density applied to the sample. Depending on the task, various devices can be used to input the exciting laser into the microscope, such as long-wave interference filters (Longpass Edge Filter), in the case of the Stokes luminescence shift, or short-wave filters (Shortpass Edge Filter), in the case of the anti-Stokes shift. The interference filters direct most of the exciting radiation onto the sample and, at the same time, effectively separate the useful signal during detection. When this is not required, for example, when measuring the instrumental response, beam splitters of various ratios can be used instead.
The microscope is assembled on a Mitutoyo micro-objective with Köhler illumination. The illumination input and image output to the camera (yellow dotted lines in Figure 1) are performed using retractable beam splitters PBS1 and PBS2, which enable precise sample positioning. These beam splitters can be removed during registration in order to maximize the signal. The field of view of the objective is 100 μm, while the excitation beam is focused into a spot with a diameter of ~1.5 μm (solid state laser, 532 nm). The sample is placed in a Montana Instruments closed-loop helium cryostat that maintains a sample temperature in a range of 3.5 K to 350 K, and it is equipped with optical windows for the input/output of radiation. During optical measurements, the sample remains motionless. The scanning of the sample is performed by moving the micro-objective and a system of mirrors installed outside the cryo-station.
A useful signal (red dotted line in Figure 1) is collected in the same micro-objective through which the excitation occurs. The flipping mirror, FM, directs the entire signal either into the spectrometer M150 (Solar Laser Systems, Minsk, Belarus) or into the HBT interferometer. This scheme helps to significantly speed up the registration of the emission spectra and to carry out a preliminary assessment of the signal before much longer measurements of the correlation functions. In the HBT interferometer, the radiation from the sample is divided by a beam splitter cube (BS) in a ratio of 50/50 and enters the two identical Lomo MDR41 monochromators. After that, the radiation is fed via an optical fiber into the Scontel single-photon detection system. To obtain the temporal and correlation characteristics of the samples, the time-correlated single-photon counting (TCSPC) method is used [34]. Electrical response processing is performed using a TimeTagger Ultra (Swabian Instruments, Stuttgart, Germany) streaming time-to-digital converter. The setup allows for fully automated photoluminescence experiments and detailed object mapping, as well as single-photon counting, lifetime measurements, and auto- and cross-correlations. The setup provides stability for 5 days without the need for any adjustment, even for very long measurements.

2.2. Microscope

2.2.1. Microscope Illumination

Microscope illumination is performed using the method of Köhler [35]. The method allows for uniform illumination of the object across the entire field of view, even when using sources with non-uniform luminous bodies of complex shapes. In this case, we use a KL 1500 LCD (Schott, Wolverhampton, UK) cold light source with adjustable illumination intensity and an output in the form of a multi-fiber bundle. Let us briefly consider the illumination method of Köhler [35]. According to Abbe’s theory, the resolution and similarity between a non-self-illuminating object and an image are affected not only by the lens but also by the lighting system. The method introduced by Köhler allows one to obtain uniform illumination over the field of view and simultaneously achieve an increase in resolution by using a special condenser. Illumination in reflected light, according to Köhler, is also called the bright field method in reflected light, and the device itself is called an opaque illuminator.
The Köhler illumination is performed as follows. Collector L6 projects an image of the fiber optic bundle into the plane of the ID1 iris aperture diaphragm, which is imaged by lens L8 in the plane of the exit pupil of the micro-objective. Lens L7 projects the collector frame into the plane of the ID2 iris field diaphragm. Lens L8 and the micro-objective project an image of field diaphragm ID2 into the plane of the sample, using an inclined semitransparent plate that directs part of the light beam from the source into the objective to illuminate the surface of the object. The light reflected from the surface of the object enters the micro-objective. Eyepiece L5, in turn, forms an enlarged image of the sample in the camera matrix. Thus, the illumination of the specimen is performed from above through the objective, which simultaneously plays the role of both an objective and a condenser.

2.2.2. Microscope Objective

In our experimental setup, we use a Mitutoyo infrared objective with a 50-x magnification, a numerical aperture of NA 0.42, and a working distance of 15 mm. This objective is selected taking into account the assembly of the whole setup on a Montana Instruments cryostat, which has no option for a built-in microscope. Therefore, the microscope is assembled outside of the cryostat. This feature necessitates the use of objectives with a large working distance. Additionally, we use a relatively low numerical aperture due to the presence of an additional 2 mm glass window between the object and the objective, which leads to a significant decrease in the signal intensity [36].

2.2.3. Microscope Camera

The sample image obtained with the microscope is captured by a DCC3260C CMOS camera (Thorlabs, Newton, NJ, USA) with a 1936 × 1216-pixel resolution. Light from the micro-objective is directed to the camera through an automated moving beam splitter plate. The plate is mounted on the same translator as the illumination beam splitter plate. This allows one to compensate for the beam shift relative to the optical axis of the microscope.

2.2.4. Microscope Translator

This setup does not have a microscope stage in the usual sense. The sample remains in a stationary position, and its scanning is carried out by moving the microscope itself. The same beam path is ensured by installing mirrors on the movable translators along each of the axes. MTS25-Z8 (Thorlabs, Newton, NJ, USA) motorized translators enable movement along the specified axes with a minimum step of 0.05 µm and a bidirectional repeatability of 1.6 µm. This is sufficient for precise positioning on a sample of about 1 µm in size, as well as for precise mapping in the transverse coordinates.

2.3. Excitation

2.3.1. Light Source

Luminescence excitation is performed using the laser light sources. Continuous wave (CW) diode-pumped solid state lasers (DPSSLs) ATC-53-500 (ATC-SD, Saint Petersburg, Russia) with a wavelength of 532 nm are used to collect emission spectra and to obtain the second-order correlation function. The excitation source for time-correlated photon counting is a picosecond laser, PicoQuant LDH-IB-450-B (PicoQuant, Berlin, Germany), with a radiation wavelength of 450 nm. The characteristic pulse time of this laser is less than 70 ps (FWHM), and the maximum repetition frequency is 80 MHz.
It should be noted that our experimental setup has the ability to excite luminescence with a wide range of laser sources, including picosecond lasers of the PicoQuant LDH series, as well as a femtosecond laser complex (Mira Optima 900D (Coherent, Saxonburg, PA, USA)). This enables the tunability of the excitation in the entire optical and near-IR range, with different pumping modes.

2.3.2. Beam Input

The laser radiation is introduced through a telescope with a variable focal length to compensate for divergence and adjust the laser focus with the sample plane under the microscope. The excitation power is tuned using an attenuator assembled from two Glan–Taylor prisms and a λ/2 plate inserted between them. The first Glan prism serves to improve the polarization extinction ratio. The second prism acts as an analyzer. The λ/2 plate is installed in a PRM1Z8 (Thorlabs, Newton, NJ, USA) automated rotating translator. The repeatable incremental motion of this translator is 0.03 degrees, which allows for the precise and highly repeatable adjustment of the excitation power.

2.4. Registration System

2.4.1. Detectors

Single optical photons are detected using the ECOPRS-CCR-SW/TW-85 system (SCONTEL, Moscow, Russia). The system is based on a closed-loop cryostat (OPRS-CCR) and is designed to detect photons using superconducting single-photon detectors (SSPDs) combined with a single-mode optical fiber. By using the SSPD photoresponse mechanism, it is possible to achieve high quantum efficiency and time resolution. The detector used has 8 channels, pairwise optimized for four wavelength ranges. The quantum efficiency is about 85% at wavelengths 780 nm, 930 nm, 1200 nm, and 1550 nm and 50% over the entire working range. The time resolution is 50 ps, with a dead time of 10 ns at a wavelength of 780 nm and 15 ns at 1550 nm.
The emission spectra are recorded using a high-speed spectroscopic CCD camera ANDOR DV420-BV (Andor Technology, Belfast, Northern Ireland) with a matrix size of 1024 × 255 pixels and a pixel size of 26 × 26 µm.

2.4.2. Monochromators

In order to measure the luminescence spectra, a spectrometer based on a Solar Laser Systems M150 monochromator and an ANDOR DV420-BV CCD camera is constructed. The M150 monochromator is assembled using an optimized Czerny–Turner scheme and is equipped with three diffraction gratings of 300 gr/mm, 600 gr/mm, and 1200 gr/mm (the inverse linear dispersions are 20, 9.4, and 4.9 nm/mm, respectively). High luminosity (aperture ratio 1:3.6) allows for the acquisition of emission spectra at low pump power and low quantum yield of the samples. The photon correlation measurements in the HBT scheme, as well as the correlated photon counting time, are performed using monochromators MDR-41 (LOMO, Saint Petersburg, Russia). These monochromators, equipped with 1500 gr/mm gratings, have a reciprocal linear dispersion of 2 nm/mm and a relative aperture of 1:6. Low astigmatism allows one to obtain a point image at the monochromator output, which is critical for further input of radiation into the single-mode optical fiber of the detection system.

2.4.3. Time-to-Digital Converter

The implementation of the TCSPC method is carried out using a TimeTagger Ultra (Swabian Instruments, Stuttgart, Germany) streaming time-to-digital converter. This time converter has a time jitter of 8 ps (FWHM) and a dead time of 2.1 ns. In conjunction with picosecond lasers, this enables accurate measurements of short lifetimes, along with correlation measurements.

3. Results

Here, we describe a detailed procedure for measuring the instrument response function (IRF) of the experimental setup, demonstrate the fluorescence kinetics of the reference samples, and discuss a methodology for studying the correlation of photons emitted by an optically pumped radiation source.

3.1. Instrument Response Function

Before conducting studies of new samples, it is crucial to ensure the correctness of the methods and equipment used for measurements. Verification of the setup can be carried out by several methods, such as measuring the signal from the excitation pulse or the known reference samples (e.g., organic dyes fluorescein, rhodamine, erythrosine B [37,38,39], and others).
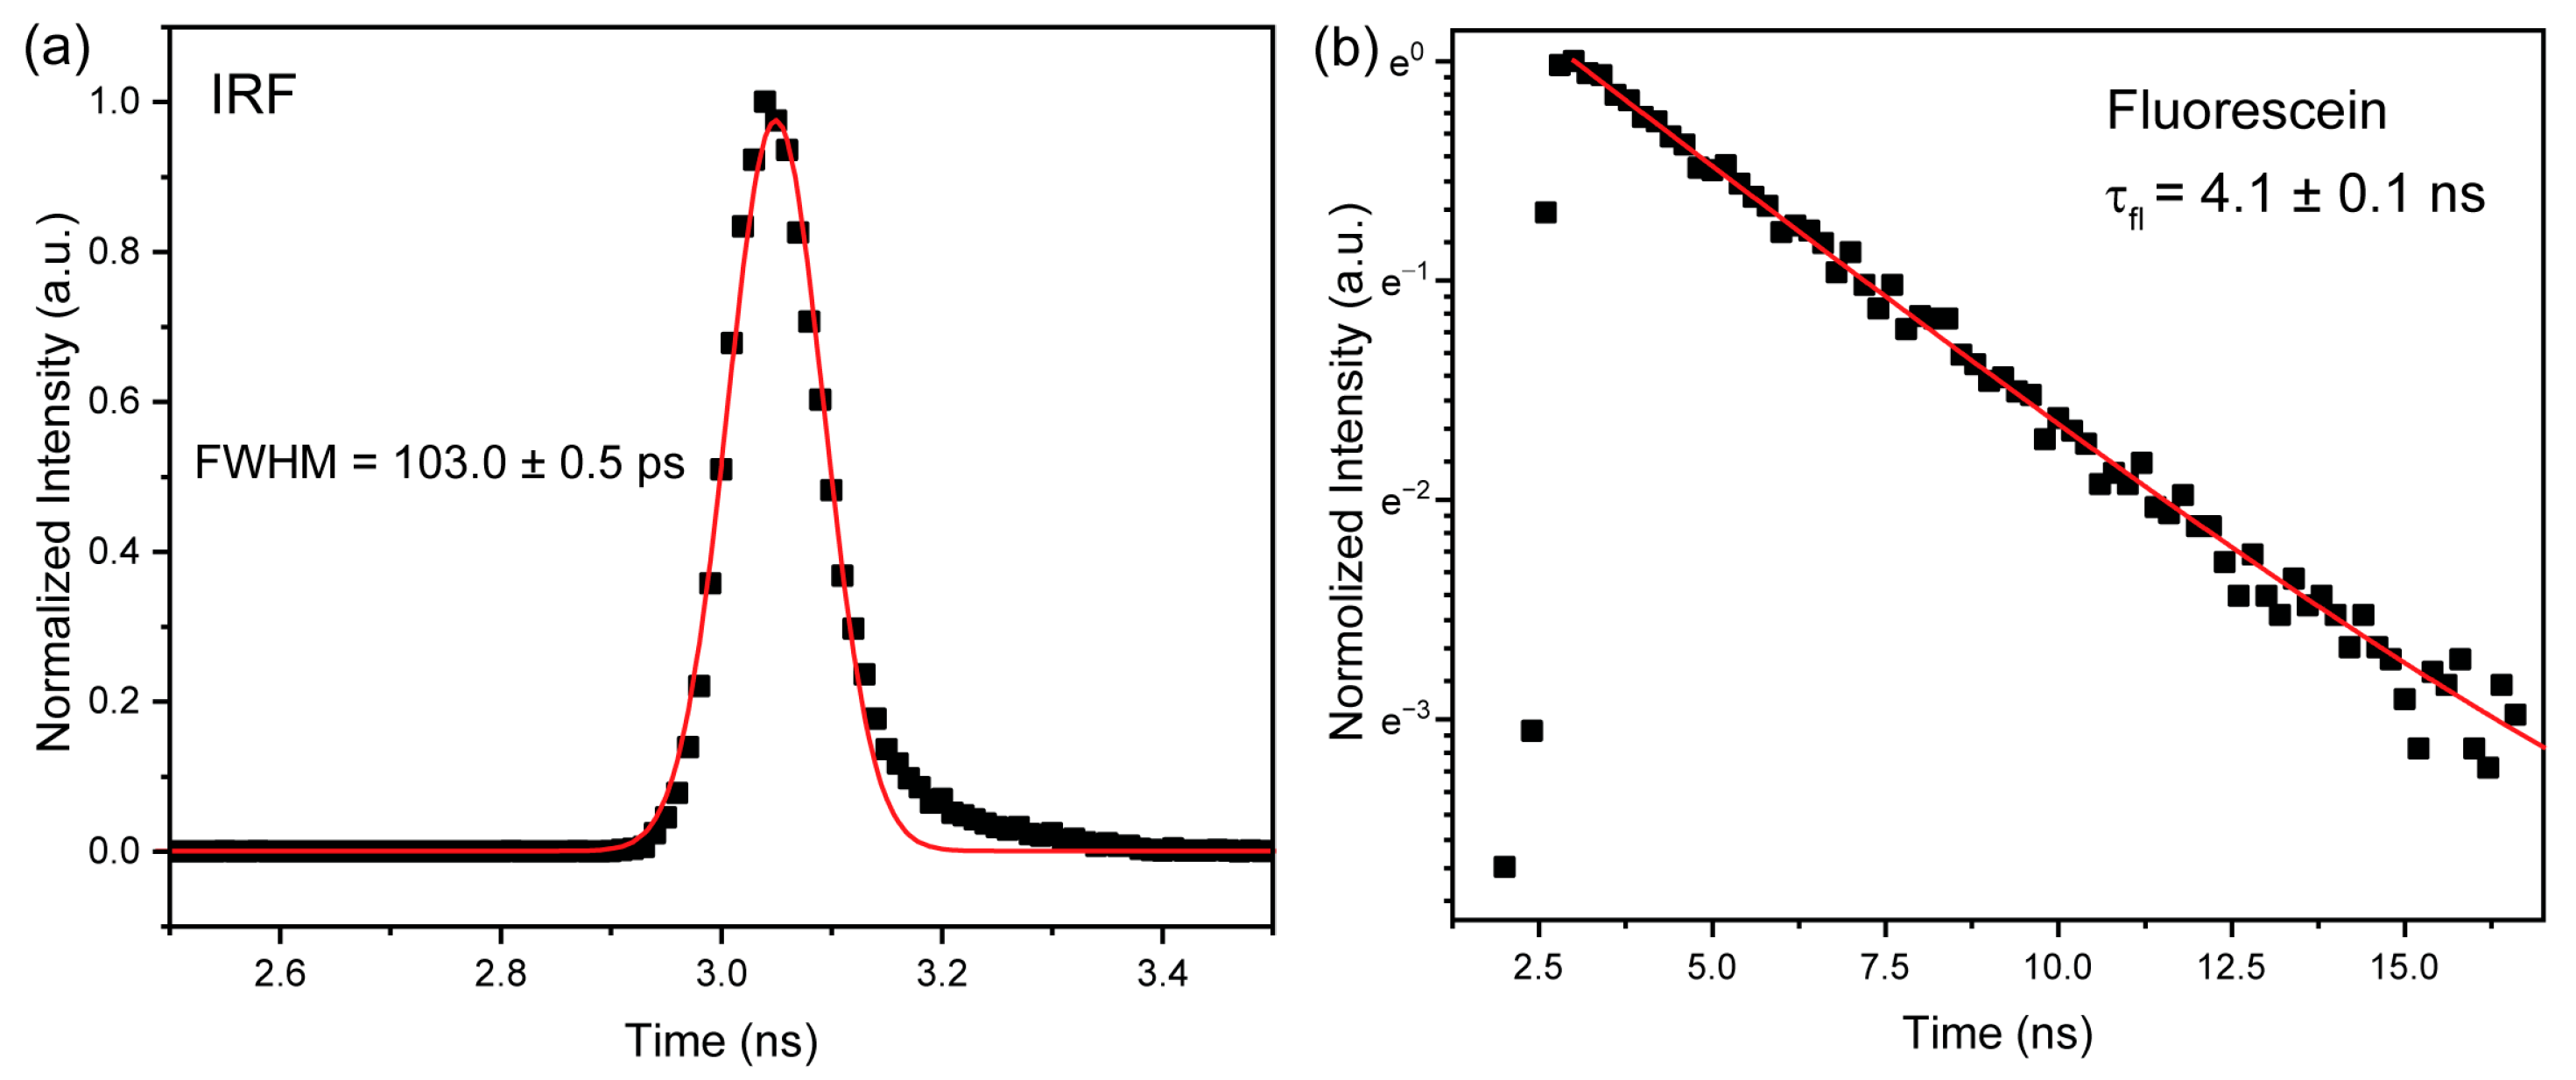
In order to measure the IRF, the excitation laser radiation should be directed to the detecting system. In this case, the LEF (Figure 1) in the optical system should be replaced with a beam splitter. Additionally, a highly reflective object, such as a mirror or polished silicon, should be placed instead of the sample. The detection system is configured in such a way that detection occurs at the laser wavelength. A synchronized pulse from the laser control unit is fed to the start channel of the time-to-digital converter using the TCSPC method, and a signal pulse from the detector is fed to the stop channel. The instrument response function (IRF) measured in this way is approximated by a Gaussian function. For the typical results shown in Figure 2a, the half-width at half-maximum (FWHM) is found to be 103 ps. The temporal width of the IRF is usually determined by the total contributions of the excitation laser pulse width, the detector response width, and the electronics. The IRF half-width calculated using the device parameters provided by the manufacturer is 90 ps, which is in fairly good agreement with the experimentally measured value.
The organic dye fluorescein was dissolved in water at pH = 11 and a concentration of 10−4 M to demonstrate the measurement of the reference lifetime. The experimental setup is configured in such a way that the exciting laser radiation is completely cut off by the LEF filter, and the luminescence signal is directed to the detecting system. Fluorescein has fairly wide spectral bands of emission and excitation, with the maxima at 520 nm and 490 nm, respectively. Thus, to collect the luminescence decay curve, a laser with a wavelength of 450 nm and an LEF of 500 nm is selected. The lifetime is collected at a wavelength of 520 nm. The electronics for the TCSPC method are configured similarly to IRF measurements. The lifetime of organic dyes is highly dependent on the environment, concentration, and solvent [40,41], which should be taken into account when conducting measurements. The resulting luminescence decay curve is shown in Figure 2b. The decay lifetime is found to be 4.1 ns, which correlates well with the literature data [38].

3.2. Autocorrelation Measurements

In this section, we demonstrate a detailed procedure for autocorrelation measurements using the example of exciton states of GaAs quantum dots in AlGaAs nanowires. These hybrid nanostructures were grown by molecular beam epitaxy on Si(111) substrate using the Au-catalyzed vapor–liquid–solid method [42]. Prior to measurement, the sample is placed on a holder inside the cuvette compartment of the Montana Instruments cryo-station and held with low-temperature grease. After that, the sample is cooled to a temperature of 6 K, which is necessary because exciton states occur only at low temperatures, and the emission intensity increases at lower temperatures. Due to the location of the objective and translators outside the sample chamber and the submicron size of the investigated structures, it is necessary to ensure a stable ambient temperature for a long time. Otherwise, a temperature change would lead to the “drift” of the objects from the focal point.
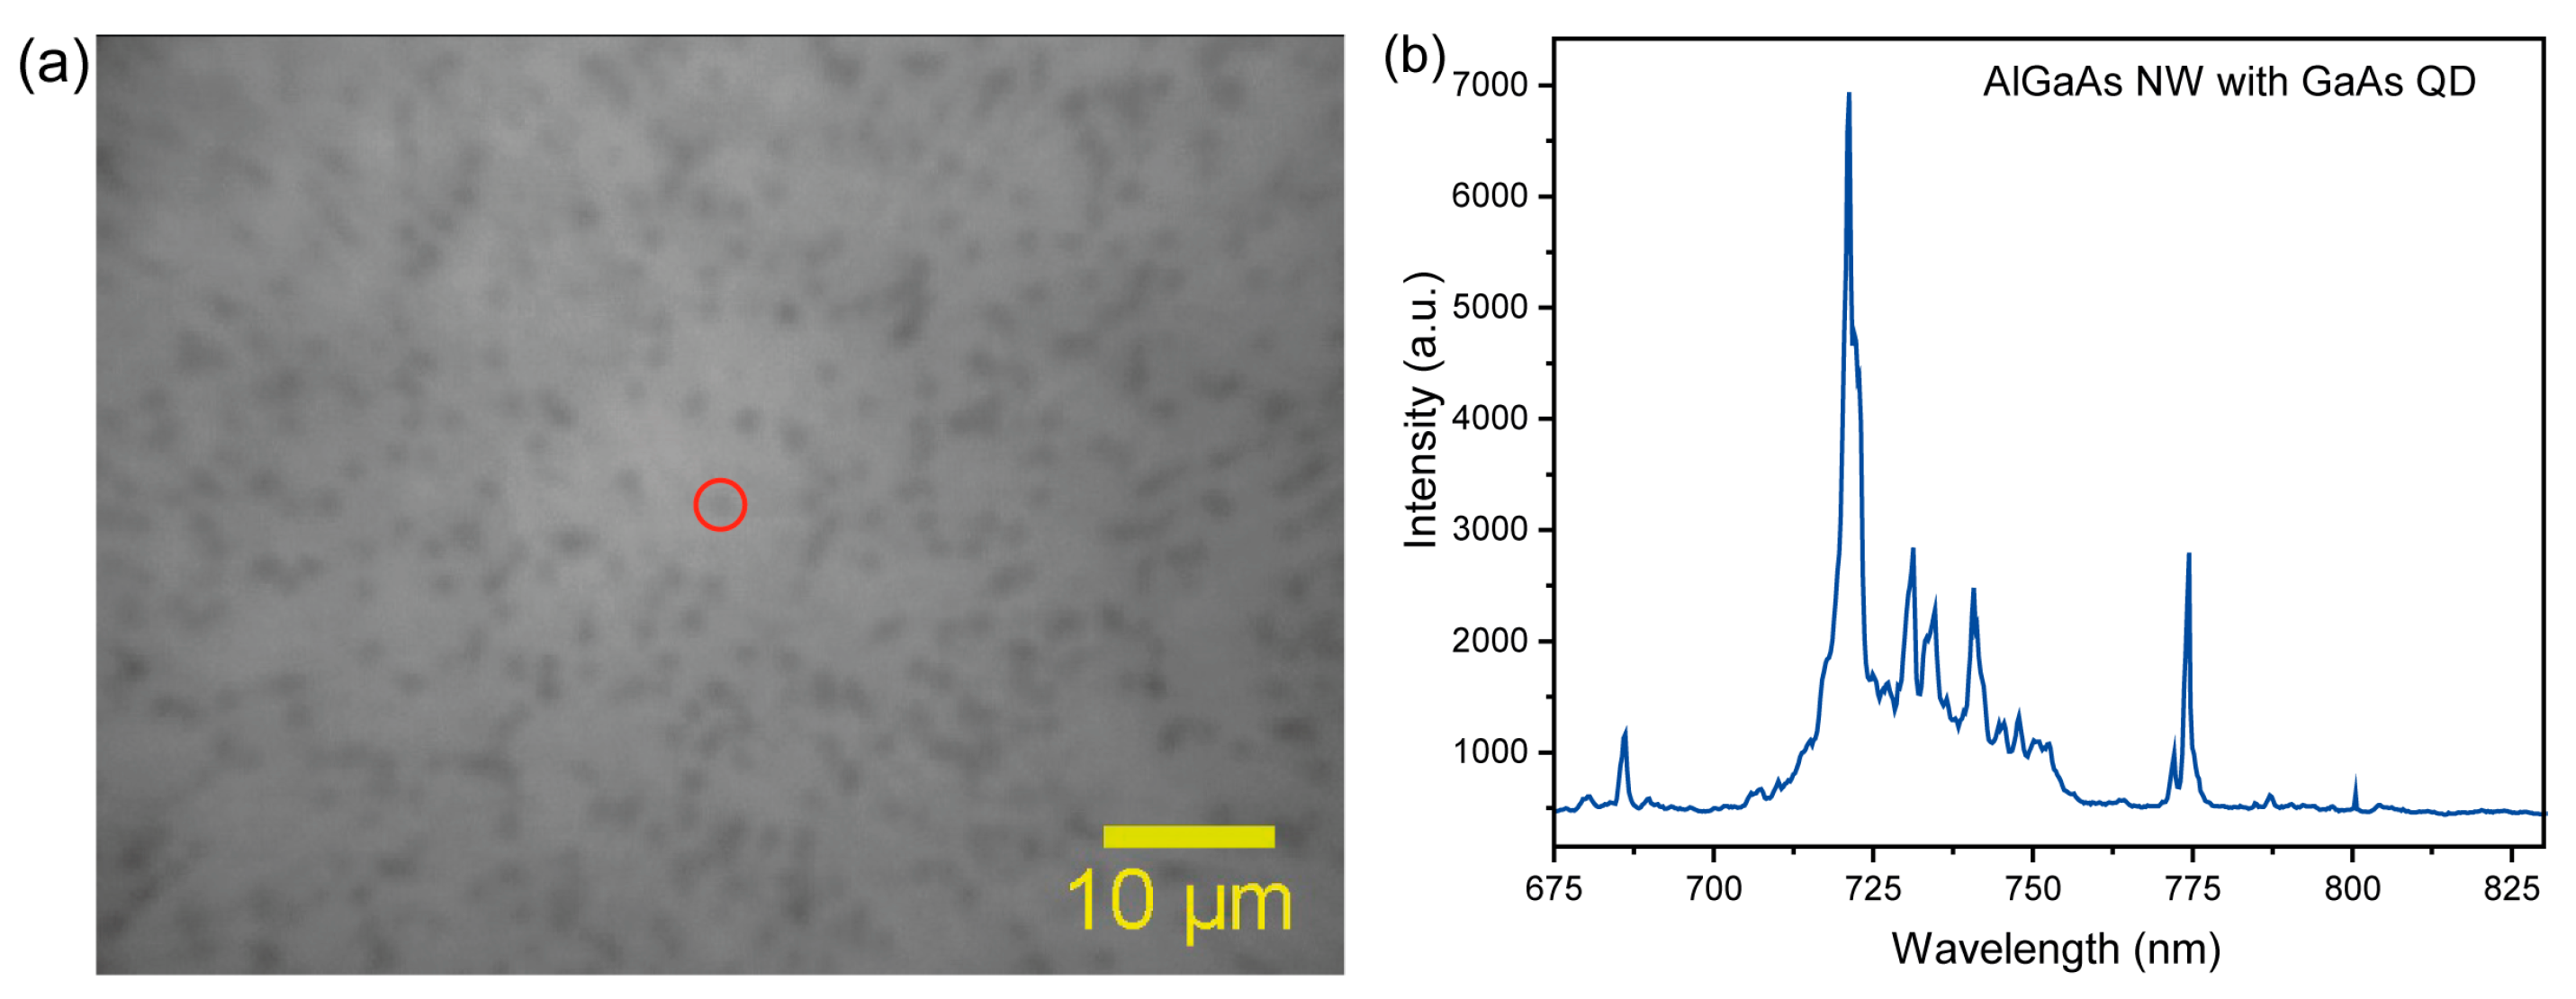
The study of the samples starts with a visual search for individual nanowires since the dense arrangement can lead to re-emission, energy exchange, and the presence of more than one emitter in focus at the same time. An example of the selected area is shown in Figure 3a. A quick check of the nanowires is performed using the steady-state emission spectrum obtained in an M150 spectrometer. The luminescence is excited using a 532 nm laser. The excitation power for the given measurements is 1 μW under the objective. The selected samples show the broad emission peaks from the AlGaAs shell, with the maxima at 720 and 740 nm, as well as narrow spectral lines from the GaAs quantum dots (Figure 3b). This approach allows us to cut off the defective structures and to select NW with the most intensive radiation. The next important step is the selection of the excitation power using an automated attenuator. One should avoid too-high powers that lead to heating of the sample, broadening of the spectral lines, and anti-bunching. At the same time, the signal intensity should be sufficient to register the correlation function.
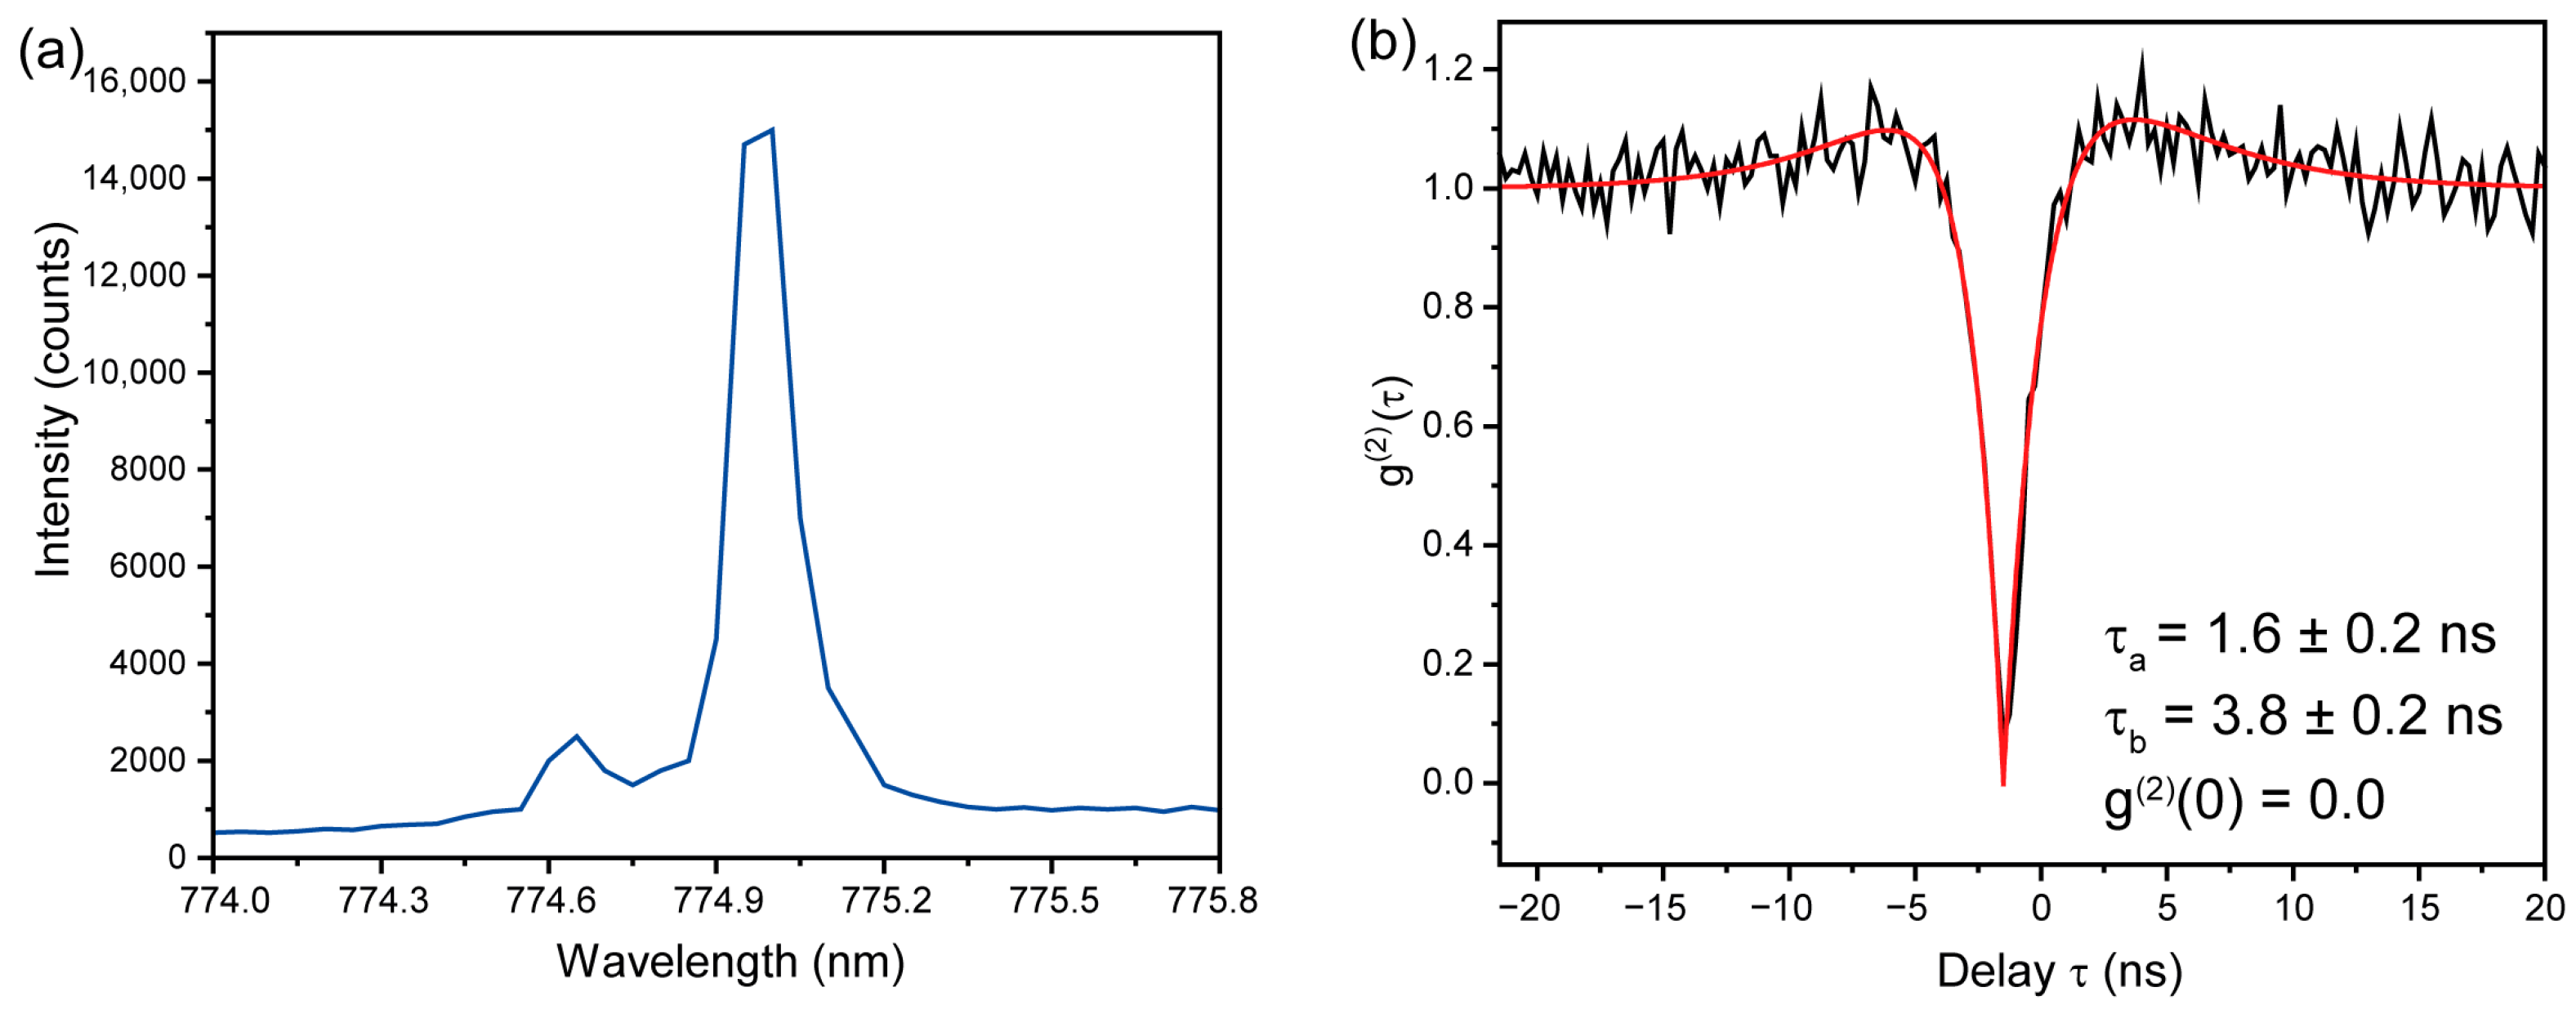
The next step of the study is the precise measurement of the selected spectral line from the selected quantum dot using monochromators in the HBT interferometer. In this case, the spectrum is obtained point-by-point using the single-photon detectors directly. In the presented example, a line with a wavelength of 775 nm was selected (Figure 4a), whose half-width turned out to be narrower than or equal to the maximum resolution of the monochromator used (0.1 nm). After selecting the wavelengths in both monochromators of the HBT interferometer, one can start measuring correlations. For the measurements of the autocorrelation function from the exciton states of the GaAs quantum dots, the two wavelengths are equal. It should be noted that this setup also allows for cross-correlation measurements.
The autocorrelation function is measured under constant pumping. The measuring equipment is configured in such a way that a signal from one monochromator is fed to the start channel by the TCSPC method, and a signal from the other monochromator is fed to the stop channel. Then, a bidirectional histogram of the photon distribution is constructed by registering the times of the two signals relative to each other (Figure 4b). The duration of the measurement depends on the photon count rate, which in this case is about 9000 counts/s per channel. The total accumulation time is 28,800 s, and the time bin is 250 ps. The analysis of the obtained data is carried out using the known formula for the autocorrelation function [43]:
g 2 τ = 1 + a 2 b e τ τ 0 τ b 1 + b e τ τ 0 τ a .
Here, a is the background illumination; b is the bunching coefficient; τ is the zero-time shift; and τ a and τ b are the effective lifetimes of the antibunching and bunching effects, respectively. The measured data correspond to the convolution of the g 2 τ function with the IRF of the setup, which in this case equals 103 ps. The value of g 2 0 obtained from Equation (3) is 0.01, with τ a = 1.6 ns and τ b = 3.8 ns. Thus, it can be concluded that the radiation source is in the illuminated region and that this nanowire with an embedded quantum dot is the source of single photons. The presence of a component associated with bunching can be explained by slight laser heating. The difference between the g 2 0 value and the data obtained in [42] is explained by the low background illumination, as well as the dark count of the detectors used. Our results reproduce the work of [42], which demonstrated, for the first time, GaAs QDs in AlGaAs NWs.
Figure 5 shows the photoluminescence decay curve originating from a single nanowire quantum dot excited by 50 ps pulses at 740 nm and a very low average excitation power. The decay is well fitted by the single exponential, with a lifetime of 1.24 ns. This lifetime is comparable to the one measured for GaAs/AlGaAs nanowires in [44] and agrees well with the intrinsic radiative exciton recombination [45].

4. Conclusions

In summary, we have presented a detailed description of an experimental setup for measuring the steady-state and kinetic luminescence properties of solid-state samples at temperatures varying from 3.5K to 350K, as well as measuring photon correlations. The process of verifying lifetime measurements using a reference sample has been described in detail. The IRF measurement of the setup has been carried out and resulted in a ~100 ps scale. The technique for measuring the second-order autocorrelation function has successfully been demonstrated using GaAs quantum dots in AlGaAs nanowires as an example. The possibility of characterizing a single-photon source and measuring the lifetimes of intrinsic radiative exciton recombinations has also been shown. This setup and technique should be useful for optical studies of quantum light sources based on different types of nanostructures in a wide range of material systems.

Author Contributions

Conceptualization, S.M.; methodology, S.M.; software, A.K.; validation, S.M.; formal analysis, S.M.; investigation, A.K.; resources, S.M.; data curation, S.M.; writing—original draft preparation, S.M.; writing—review and editing, S.M.; visualization, S.M.; supervision, S.M.; project administration, S.M. All authors have read and agreed to the published version of the manuscript.

Funding

The authors acknowledge the Center for Optical and Laser Materials Research (Project N 125021902439-8) of the Research Park of Saint Petersburg State University, Russian Federation.

Data Availability Statement

The data obtained and used in this study can be provided by the corresponding author upon request.

Acknowledgments

The authors are deeply grateful to R. Reznik for the fruitful discussion.

Conflicts of Interest

The authors declare no conflicts of interest.

References

  1. Bassett, L.C.; Alkauskas, A.; Exarhos, A.L.; Fu, K.-M.C. Quantum Defects by Design. Nanophotonics 2019, 8, 1867–1888. [Google Scholar] [CrossRef]
  2. Pelant, I.; Valenta, J. Luminescence Spectroscopy of Semiconductors; Oxford University Press: Oxford, UK, 2012; ISBN 0199588333. [Google Scholar]
  3. Peter, Y.U.; Cardona, M. Fundamentals of Semiconductors: Physics and Materials Properties; Springer Science & Business Media: Berlin/Heidelberg, Germany, 2010; ISBN 3642007104. [Google Scholar]
  4. Koch, S.W.; Kira, M.; Khitrova, G.; Gibbs, H.M. Semiconductor Excitons in New Light. Nat. Mater. 2006, 5, 523–531. [Google Scholar] [CrossRef] [PubMed]
  5. Scholes, G.D.; Rumbles, G. Excitons in Nanoscale Systems. Nat. Mater. 2006, 5, 683–696. [Google Scholar] [CrossRef]
  6. Yam, F.K.; Hassan, Z. Innovative Advances in LED Technology. Microelectron. J. 2005, 36, 129–137. [Google Scholar] [CrossRef]
  7. Avrutin, V.; Izyumskaya, N.; Morkoç, H. Semiconductor Solar Cells: Recent Progress in Terrestrial Applications. Superlattices Microstruct. 2011, 49, 337–364. [Google Scholar] [CrossRef]
  8. Baranov, A.; Tournié, E. Semiconductor Lasers: Fundamentals and Applications; Woodhead Publishing: Cambridge, UK, 2013. [Google Scholar]
  9. Wheeler, D.A.; Zhang, J.Z. Exciton Dynamics in Semiconductor Nanocrystals. Adv. Mater. 2013, 25, 2878–2896. [Google Scholar] [CrossRef]
  10. Kambhampati, P. Unraveling the Structure and Dynamics of Excitons in Semiconductor Quantum Dots. Acc. Chem. Res. 2011, 44, 1–13. [Google Scholar] [CrossRef]
  11. Sze, S.M. Semiconductor Devices: Physics and Technology; John Wiley & Sons: Hoboken, NJ, USA, 2008; ISBN 812651681X. [Google Scholar]
  12. Nozik, A.J. Spectroscopy and Hot Electron Relaxation Dynamics in Semiconductor Quantum Wells and Quantum Dots. Annu. Rev. Phys. Chem. 2001, 52, 193–231. [Google Scholar] [CrossRef]
  13. Bimberg, D.; Pohl, U.W. Quantum Dots: Promises and Accomplishments. Mater. Today 2011, 14, 388–397. [Google Scholar] [CrossRef]
  14. Quan, L.N.; Kang, J.; Ning, C.-Z.; Yang, P. Nanowires for Photonics. Chem. Rev. 2019, 119, 9153–9169. [Google Scholar] [CrossRef]
  15. Radtke, M.; Bernardi, E.; Slablab, A.; Nelz, R.; Neu, E. Nanoscale Sensing Based on Nitrogen Vacancy Centers in Single Crystal Diamond and Nanodiamonds: Achievements and Challenges. Nano Futur. 2019, 3, 042004. [Google Scholar] [CrossRef]
  16. Shields, A.J. Semiconductor Quantum Light Sources. Nat. Photonics 2007, 1, 215–223. [Google Scholar] [CrossRef]
  17. Senellart, P.; Solomon, G.; White, A. High-Performance Semiconductor Quantum-Dot Single-Photon Sources. Nat. Nanotechnol. 2017, 12, 1026–1039. [Google Scholar] [CrossRef] [PubMed]
  18. Heindel, T.; Kim, J.-H.; Gregersen, N.; Rastelli, A.; Reitzenstein, S. Quantum Dots for Photonic Quantum Information Technology. Adv. Opt. Photonics 2023, 15, 613–738. [Google Scholar] [CrossRef]
  19. Arakawa, Y.; Holmes, M.J. Progress in Quantum-Dot Single Photon Sources for Quantum Information Technologies: A Broad Spectrum Overview. Appl. Phys. Rev. 2020, 7, 021309. [Google Scholar] [CrossRef]
  20. Elshaari, A.W.; Pernice, W.; Srinivasan, K.; Benson, O.; Zwiller, V. Hybrid Integrated Quantum Photonic Circuits. Nat. Photonics 2020, 14, 285–298. [Google Scholar] [CrossRef]
  21. Subramani, S.; Svn, S.K. Review of Security Methods Based on Classical Cryptography and Quantum Cryptography. Cybern. Syst. 2025, 56, 302–320. [Google Scholar] [CrossRef]
  22. Vamivakas, A.N.; Atatüre, M. Photons and (Artificial) Atoms: An Overview of Optical Spectroscopy Techniques on Quantum Dots. Contemp. Phys. 2010, 51, 17–36. [Google Scholar] [CrossRef]
  23. Efros, A.L.; Nesbitt, D.J. Origin and Control of Blinking in Quantum Dots. Nat. Nanotechnol. 2016, 11, 661–671. [Google Scholar] [CrossRef]
  24. Sallen, G.; Tribu, A.; Aichele, T.; André, R.; Besombes, L.; Bougerol, C.; Richard, M.; Tatarenko, S.; Kheng, K.; Poizat, J.-P. Subnanosecond Spectral Diffusion Measurement Using Photon Correlation. Nat. Photonics 2010, 4, 696–699. [Google Scholar] [CrossRef]
  25. Messin, G.; Hermier, J.-P.; Giacobino, E.; Desbiolles, P.; Dahan, M. Bunching and Antibunching in the Fluorescence of Semiconductor Nanocrystals. Opt. Lett. 2001, 26, 1891–1893. [Google Scholar] [CrossRef] [PubMed]
  26. Eremchev, I.Y.; Tarasevich, A.O.; Kniazeva, M.A.; Li, J.; Naumov, A.V.; Scheblykin, I.G. Detection of Single Charge Trapping Defects in Semiconductor Particles by Evaluating Photon Antibunching in Delayed Photoluminescence. Nano Lett. 2023, 23, 2087–2093. [Google Scholar] [CrossRef] [PubMed]
  27. Zwiller, V.; Aichele, T.; Benson, O. Single-Photon Fourier Spectroscopy of Excitons and Biexcitons in Single Quantum Dots. Phys. Rev. B 2004, 69, 165307. [Google Scholar] [CrossRef]
  28. Brown, R.H.; Twiss, R.Q. Correlation between Photons in Two Coherent Beams of Light. Nature 1956, 177, 27–29. [Google Scholar] [CrossRef]
  29. Loudon, R. The Quantum Theory of Light; OUP Oxford: Oxford, UK, 2000; ISBN 0191589780. [Google Scholar]
  30. Bhattacharya, P.; Ghosh, S.; Stiff-Roberts, A.D. Quantum Dot Opto-Electronic Devices. Annu. Rev. Mater. Res. 2004, 34, 1–40. [Google Scholar] [CrossRef]
  31. García de Arquer, F.P.; Talapin, D.V.; Klimov, V.I.; Arakawa, Y.; Bayer, M.; Sargent, E.H. Semiconductor Quantum Dots: Technological Progress and Future Challenges. Science 2021, 373, eaaz8541. [Google Scholar] [CrossRef]
  32. Yu, Y.; Liu, S.; Lee, C.-M.; Michler, P.; Reitzenstein, S.; Srinivasan, K.; Waks, E.; Liu, J. Telecom-Band Quantum Dot Technologies for Long-Distance Quantum Networks. Nat. Nanotechnol. 2023, 18, 1389–1400. [Google Scholar]
  33. Kiraz, A.; Fälth, S.; Becher, C.; Gayral, B.; Schoenfeld, W.V.; Petroff, P.M.; Zhang, L.; Hu, E.; Imamoğlu, A. Photon Correlation Spectroscopy of a Single Quantum Dot. Phys. Rev. B 2002, 65, 161303. [Google Scholar] [CrossRef]
  34. Becker, W. The Bh TCSPC Handbook; Becker & Hickl: Berlin, Germany, 2019; Available online: http://www.becker-hickl.de (accessed on 20 August 2019).
  35. Amelinckx, S.; Van Dyck, D.; van Landuyt, J.; Van Tendeloo, G. Handbook of Microscopy: Applications in Materials Science, Solid-State Physics and Chemistry. Prakt. Met. 1997, 34, 11. [Google Scholar]
  36. Bass, M.; Van Stryland, E.W.; Williams, D.R.; Wolfe, W.L. Handbook of Optics; McGraw-Hill: New York, NY, USA, 1995; Volume 2. [Google Scholar]
  37. Seybold, P.G.; Gouterman, M.; Callis, J. Calorimetric, Photometric and Lifetime Determinations of Fluorescence Yields of Fluorescein Dyes. Photochem. Photobiol. 1969, 9, 229–242. [Google Scholar] [CrossRef]
  38. Zhang, X.-F.; Zhang, J.; Liu, L. Fluorescence Properties of Twenty Fluorescein Derivatives: Lifetime, Quantum Yield, Absorption and Emission Spectra. J. Fluoresc. 2014, 24, 819–826. [Google Scholar] [CrossRef] [PubMed]
  39. Minami, T.; Kawahigashi, M.; Sakai, Y.; Shimamoto, K.; Hirayama, S. Fluorescence Lifetime Measurements under a Microscope by the Time-Correlated Single-Photon Counting Technique. J. Lumin. 1986, 35, 247–253. [Google Scholar] [CrossRef]
  40. Martin, M.M.; Lindqvist, L. The PH Dependence of Fluorescein Fluorescence. J. Lumin. 1975, 10, 381–390. [Google Scholar]
  41. Klonis, N.; Sawyer, W.H. Spectral Properties of the Prototropic Forms of Fluorescein in Aqueous Solution. J. Fluoresc. 1996, 6, 147–157. [Google Scholar] [CrossRef] [PubMed]
  42. Leandro, L.; Gunnarsson, C.P.; Reznik, R.; Jöns, K.D.; Shtrom, I.; Khrebtov, A.; Kasama, T.; Zwiller, V.; Cirlin, G.; Akopian, N. Nanowire Quantum Dots Tuned to Atomic Resonances. Nano Lett. 2018, 18, 7217–7221. [Google Scholar] [CrossRef]
  43. Brouri, R.; Beveratos, A.; Poizat, J.-P.; Grangier, P. Photon Antibunching in the Fluorescence of Individual Color Centers in Diamond. Opt. Lett. 2000, 25, 1294–1296. [Google Scholar] [CrossRef]
  44. Perera, S.; Fickenscher, M.A.; Jackson, H.E.; Smith, L.M.; Yarrison-Rice, J.M.; Joyce, H.J.; Gao, Q.; Tan, H.H.; Jagadish, C.; Zhang, X. Nearly Intrinsic Exciton Lifetimes in Single Twin-Free GaAs∕AlGaAs Core-Shell Nanowire Heterostructures. Appl. Phys. Lett. 2008, 93, 053110. [Google Scholar]
  45. Wolford, D.J.; Gilliland, G.D.; Kuech, T.F.; Smith, L.M.; Martinsen, J.; Bradley, J.A.; Tsang, C.F.; Venkatasubramanian, R.; Ghandi, S.K.; Hjalmarson, H.P. Intrinsic Recombination and Interface Characterization in “Surface-free” GaAs Structures. J. Vac. Sci. Technol. B Microelectron. Nanom. Struct. Process. Meas. Phenom. 1991, 9, 2369–2376. [Google Scholar] [CrossRef]
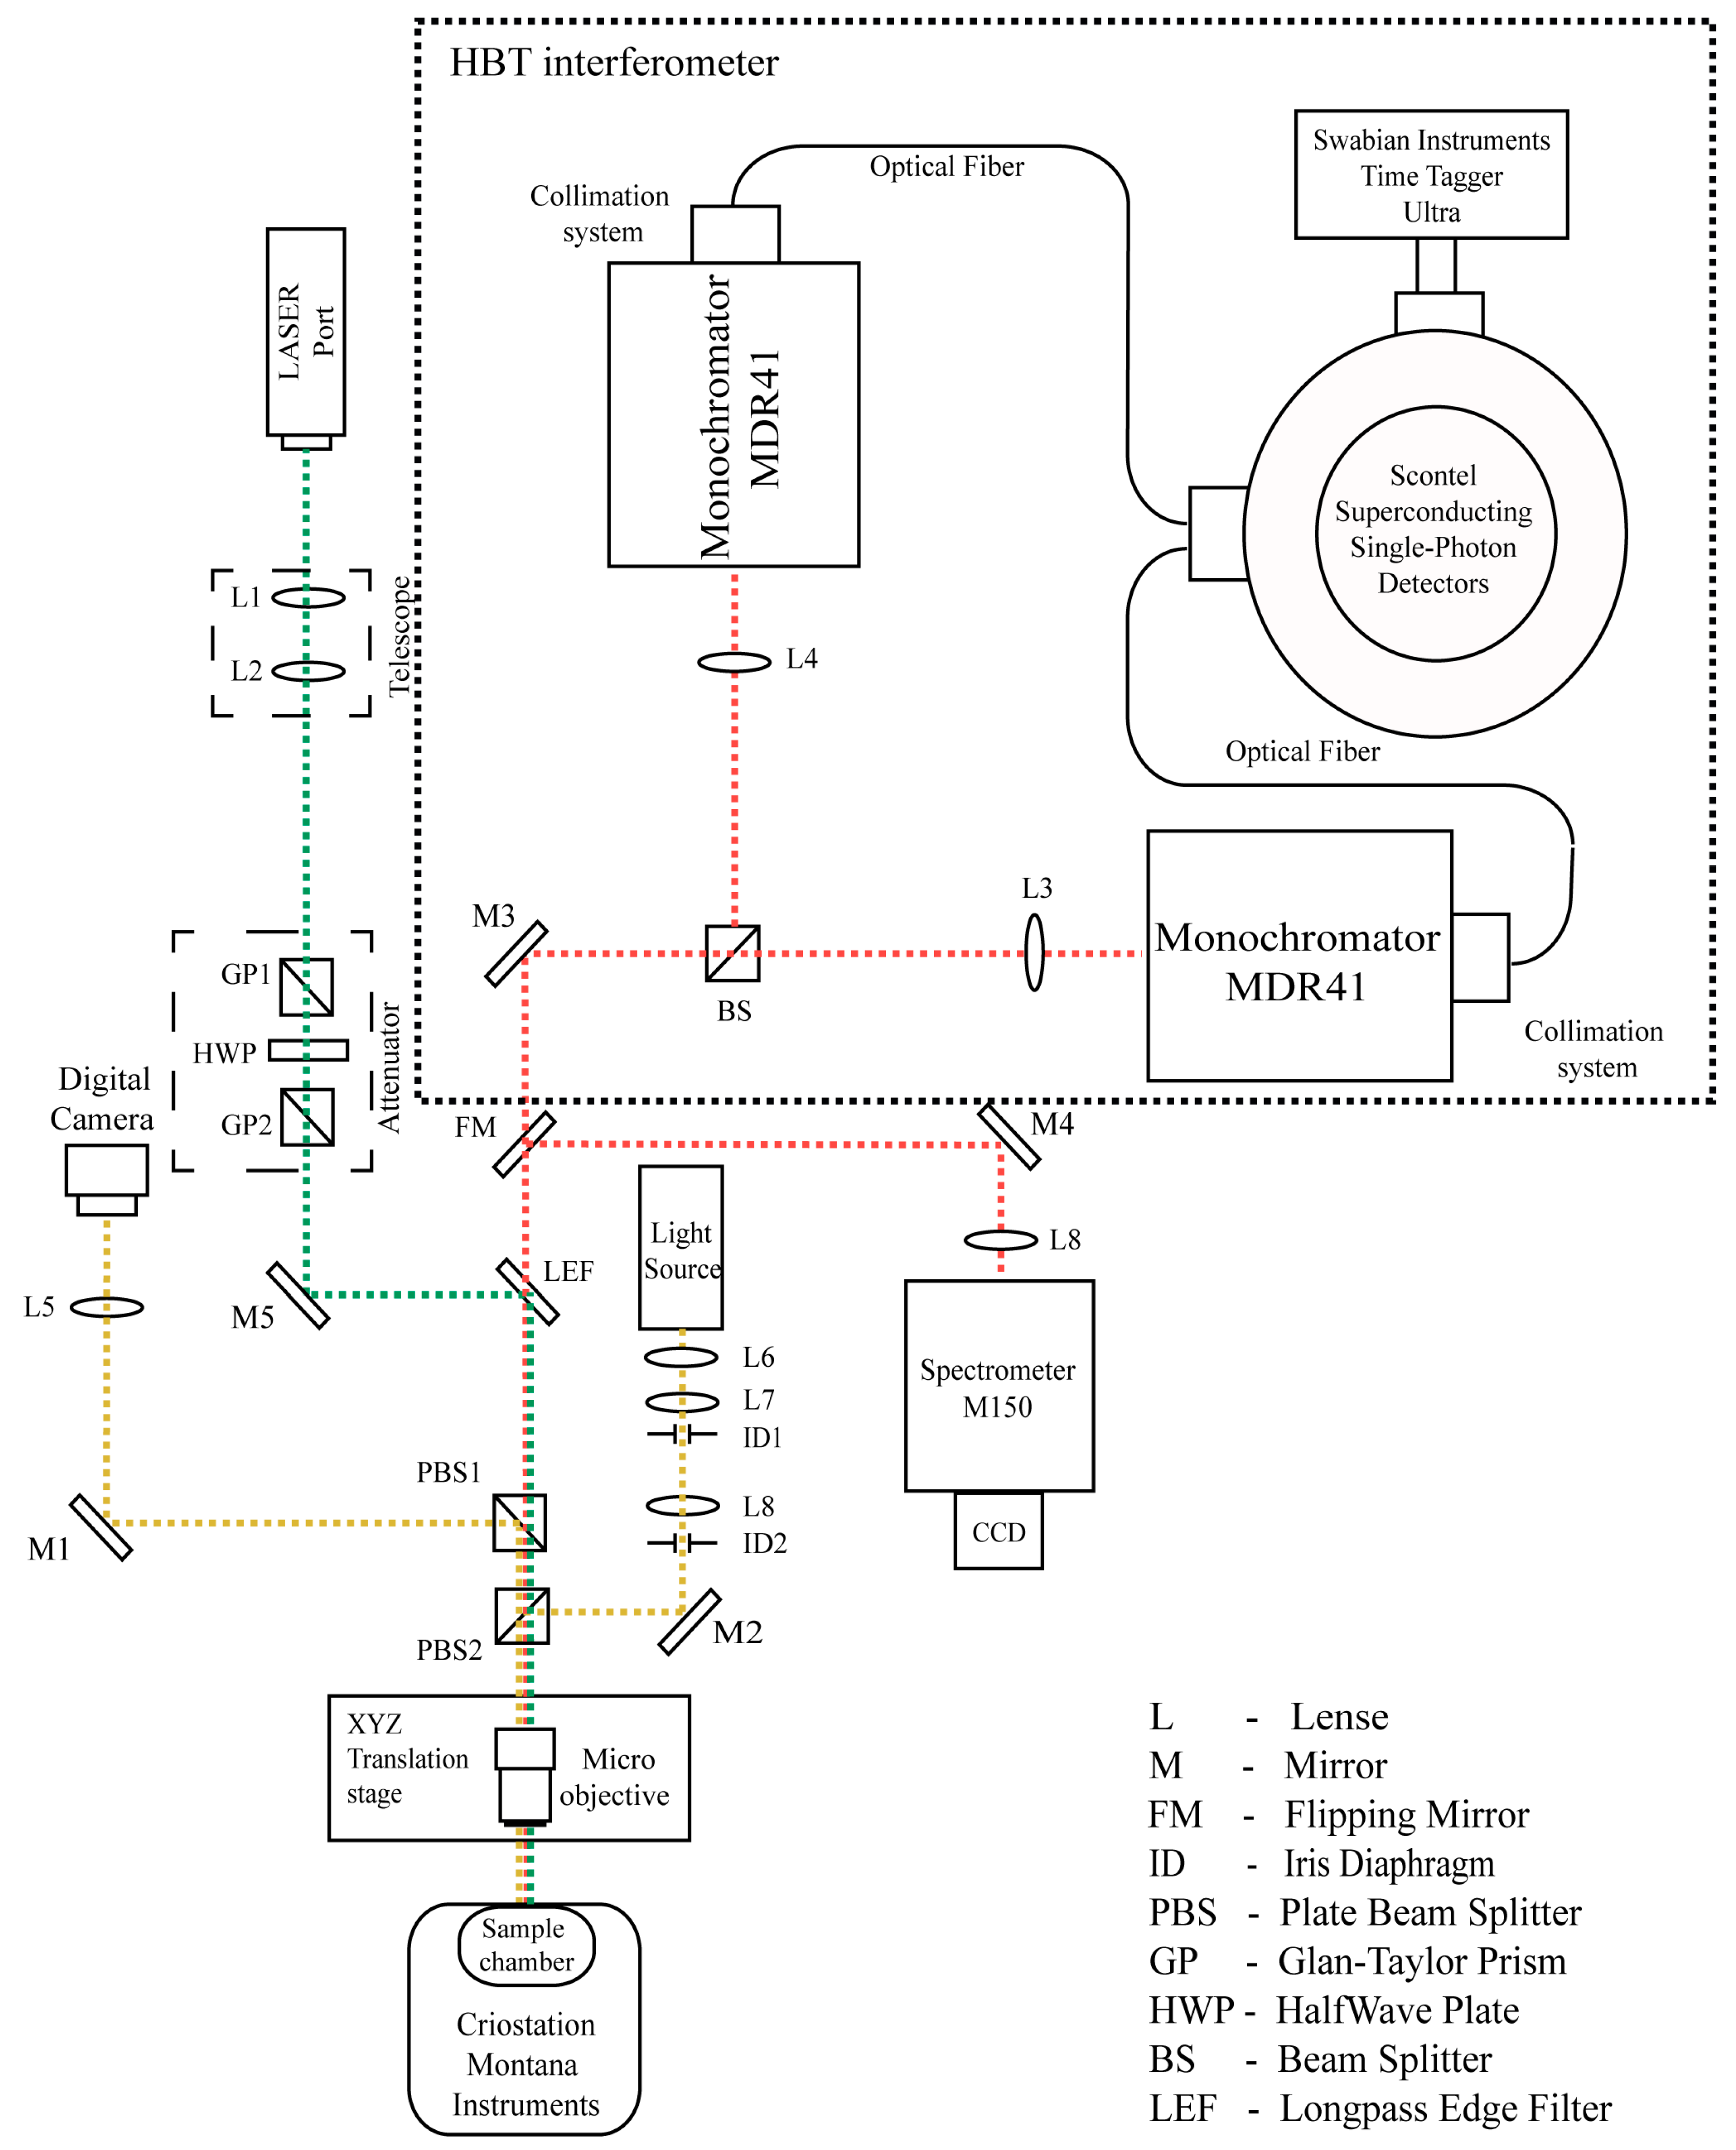
Figure 1. Functional scheme of the experimental setup. The setup is based on a laser-excited fluorescence microscope, in which an HBT interferometer acts as one of the detection systems. The optical path of the excitation, useful signal, and illumination is shown by the green, red, and yellow dotted lines, respectively.
Qubs 09 00030 g001
Figure 2. Temporal measurements corresponding to (a) IRF of the experimental setup and (b) luminescence decay curve of fluorescein in water at pH = 11 and a concentration of 10−4 M. Black dots refer to experimental data; red curves refer to approximation by a Gaussian function (a) and by exponential decay (b).
Qubs 09 00030 g002
Figure 3. (a) Microscopic image of AlGaAs nanowires with GaAs quantum dots placed under Mitutoyo ×50 micro-objective, NA 0.42; the selected nanowire is marked with a red circle. (b) Emission spectrum from the selected nanowire obtained using an M150 spectrometer, an excitation wavelength of 532 nm, and a power under the objective of 1 μW.
Qubs 09 00030 g003
Figure 4. (a) Detailed emission spectrum corresponding to the exciton luminescence of a GaAs quantum dot. (b) Autocorrelation function at a wavelength of 775 nm, count rate of 9000 counts/s per channel, total accumulation time of 28,800 s, and time bin of 250 ps.
Qubs 09 00030 g004
Figure 5. Temporal decay of 740 nm photoluminescence from a single GaAs/AlGaAs nanowire quantum dot photoexcited by 50-picosecond pulses at 450 nm. Black dots refer to experimental data; red curves refer to the approximation of exponential decay.
Qubs 09 00030 g005
Disclaimer/Publisher’s Note: The statements, opinions and data contained in all publications are solely those of the individual author(s) and contributor(s) and not of MDPI and/or the editor(s). MDPI and/or the editor(s) disclaim responsibility for any injury to people or property resulting from any ideas, methods, instructions or products referred to in the content.