
Assessing Heterogeneity Among Cyclists Towards Importance of Bicycle Infrastructural Elements in Urban Areas


Abstract
1. Introduction
2. Literature Review
3. Materials and Methods
3.1. Non-Parametric Tests
3.2. TOPSIS Method
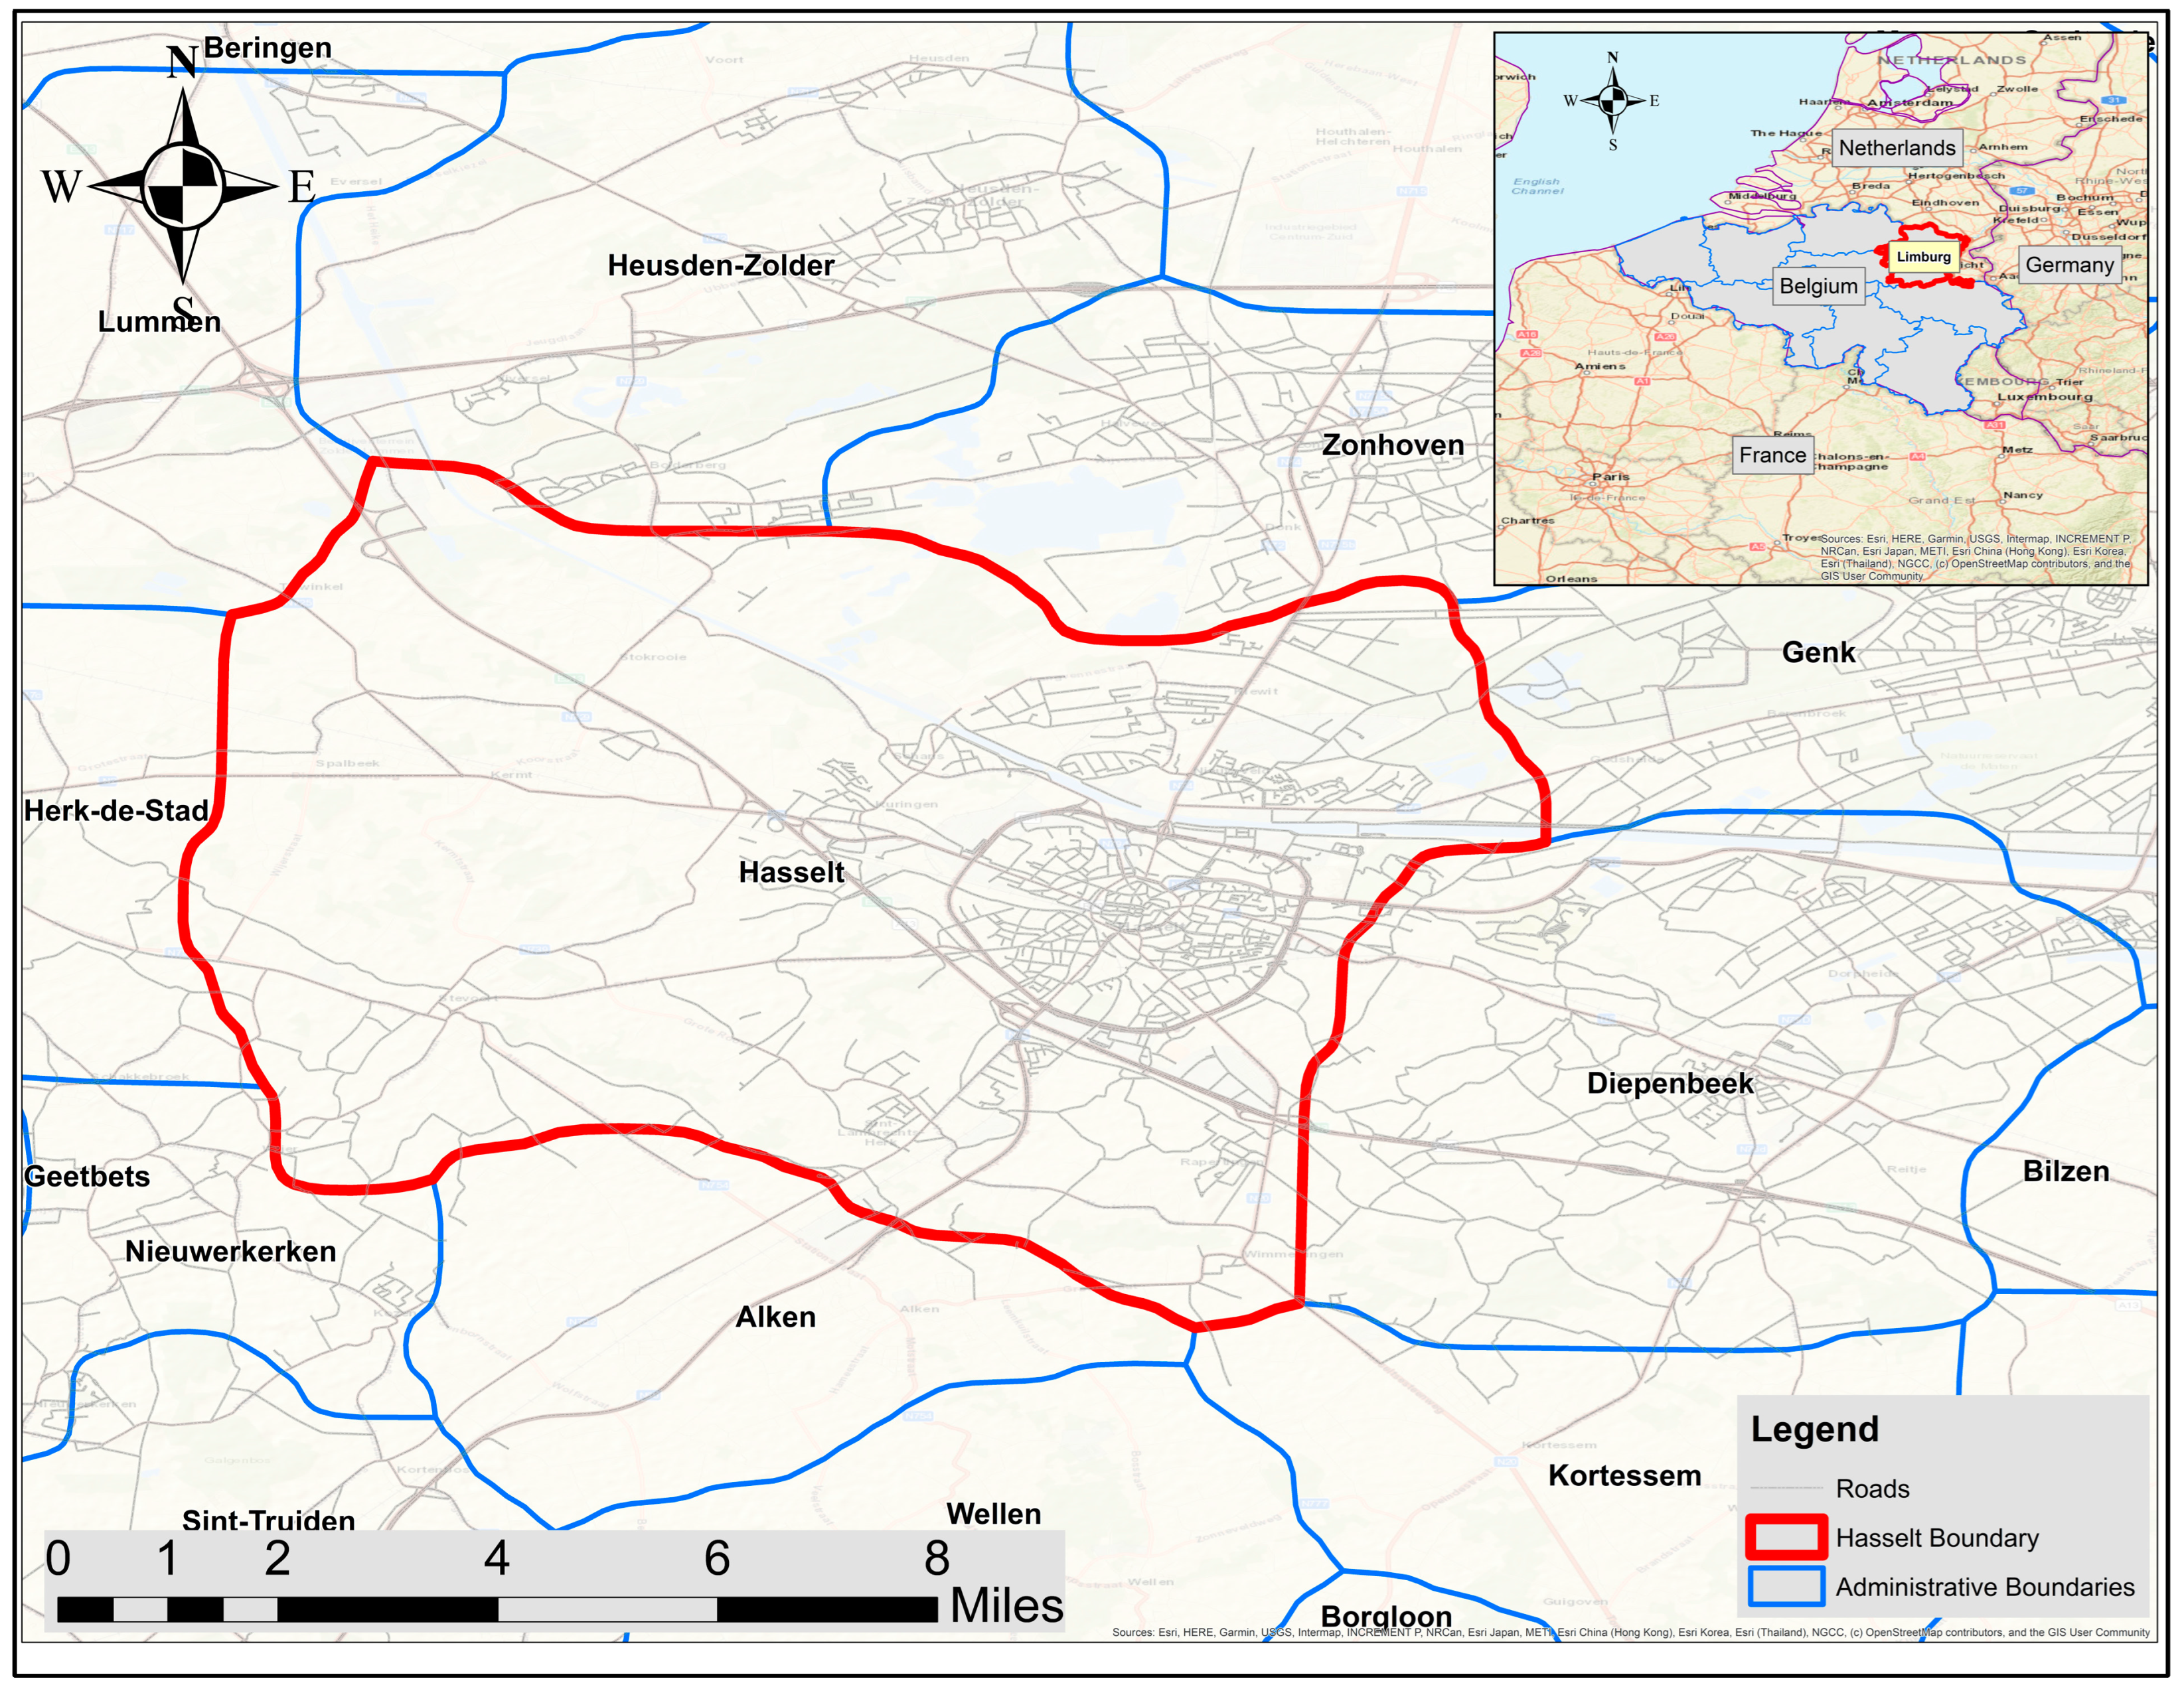
3.3. Study Area
3.4. Selection of Bicycle Infrastructure Variables
3.5. Questionnaire
3.6. Sample Size
3.7. Data Collection
3.8. Reliability Assessment of the Questionnaire Results
4. Results
4.1. Sociodemographic Characteristic
4.2. Cycling Characteristics
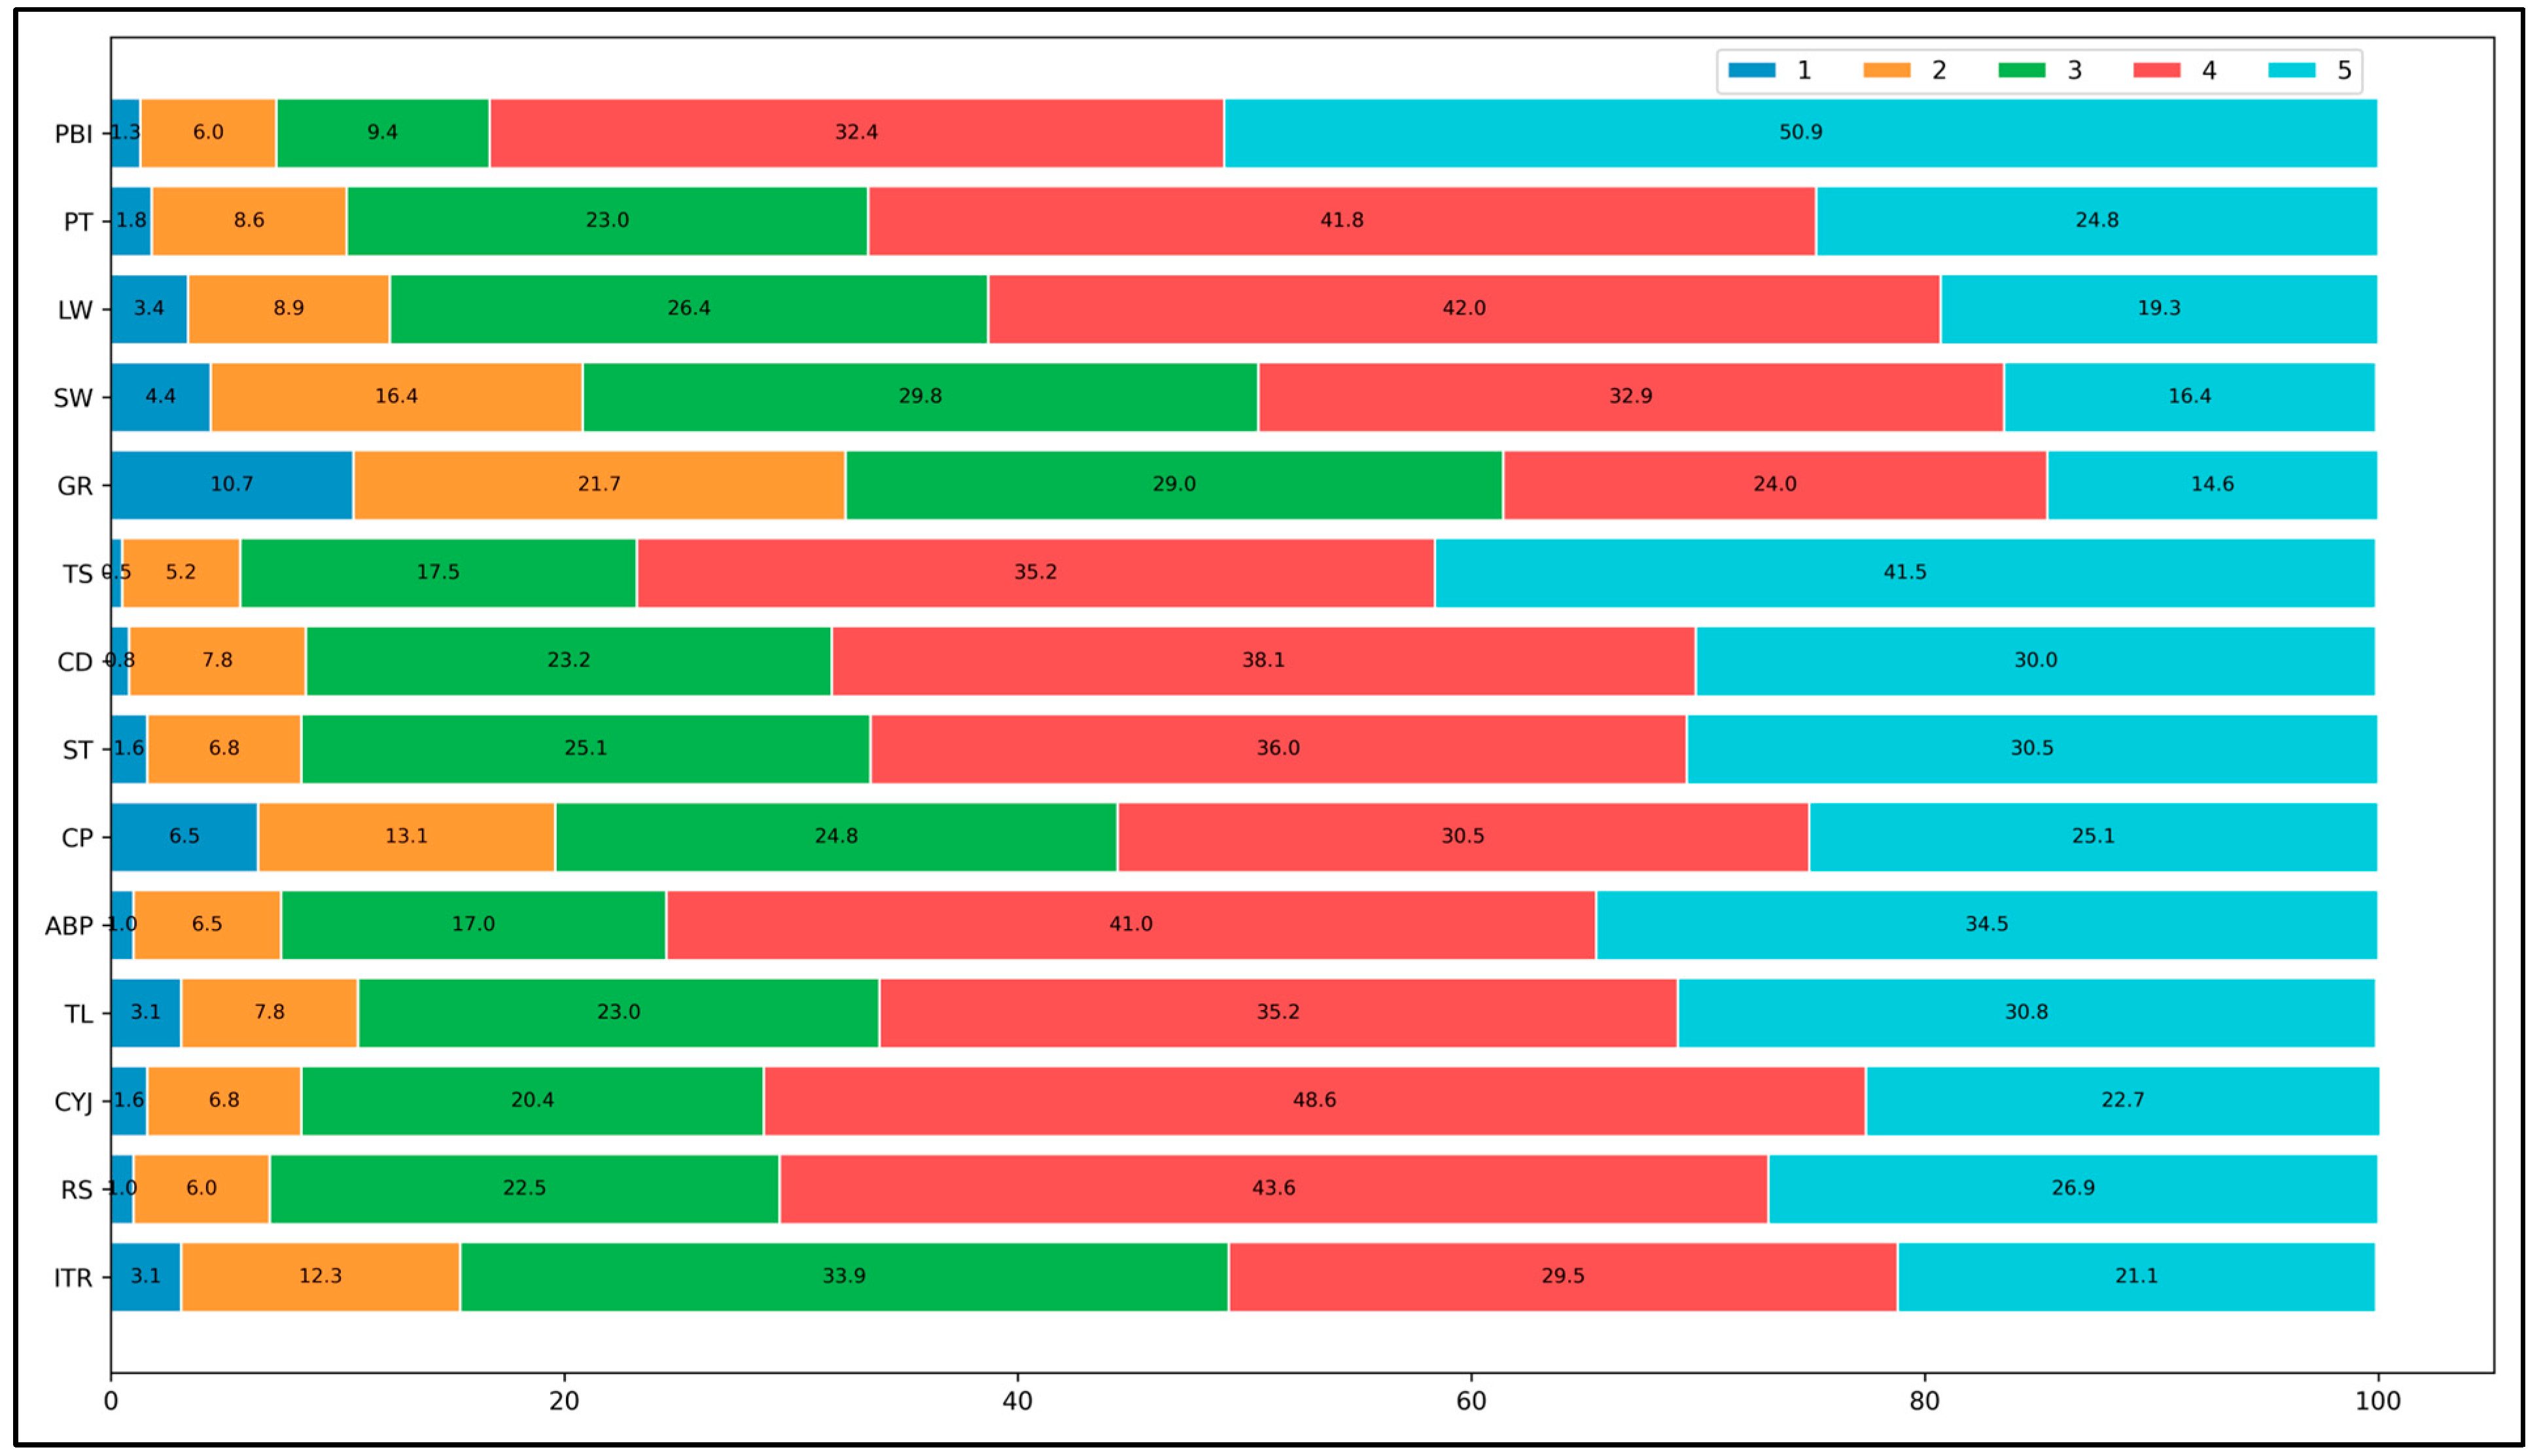
4.3. Bicycle Infrastructure Indicators Importance
4.4. TOPSIS Analysis
4.5. Heterogeneity in the Perceived Importance of Bicycle Infrastructure Indicators
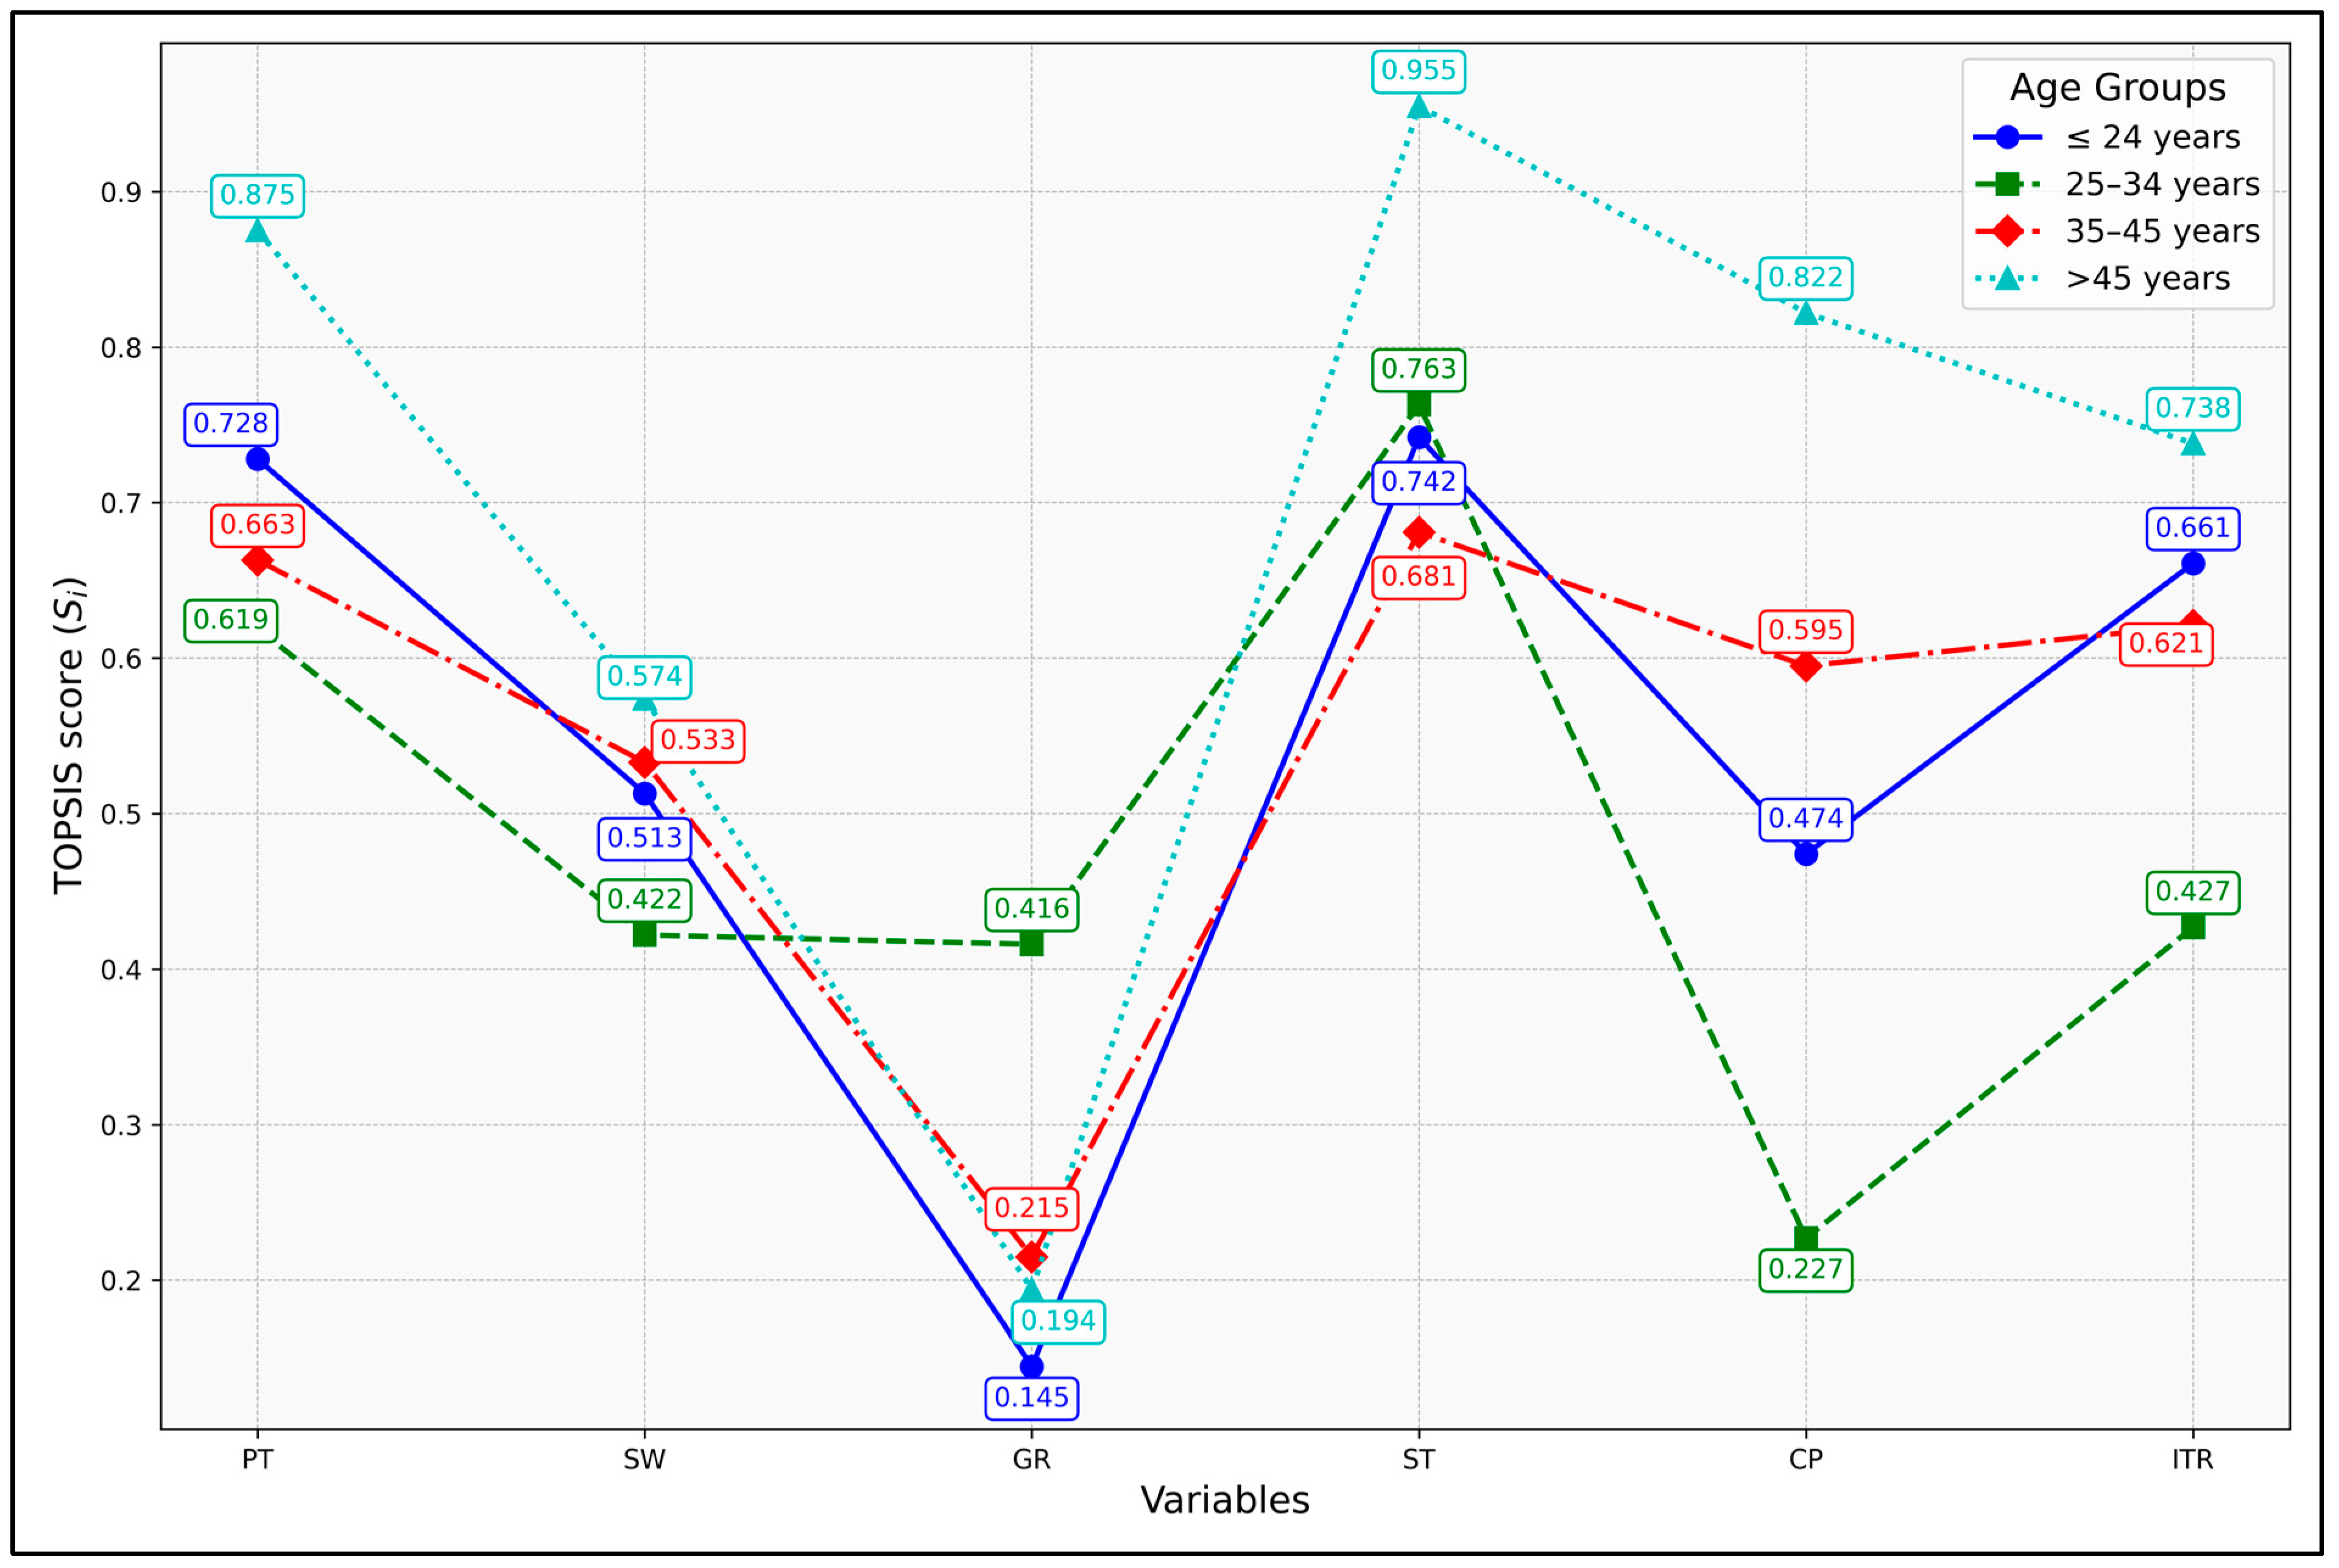
4.5.1. Effect of Age Group
4.5.2. Effect of Daily Bicycle Use
4.5.3. Effect of Cycling Experience (Years)
4.5.4. Effect of Weekly Bicycle Use
4.5.5. Effect of Bicycle Trip Purpose
5. Discussion
6. Conclusions
Author Contributions
Funding
Data Availability Statement
Acknowledgments
Conflicts of Interest
References
- Monga, M.; Sadhukhan, S. Quantifying Perceived Social Benefit of Bicycle-Friendly Infrastructure in Indian Cities: Patna as a Case Study. J. Cycl. Micromobility Res. 2023, 1, 100003. [Google Scholar] [CrossRef]
- Woodcock, J.; Banister, D.; Edwards, P.; Prentice, A.M.; Roberts, I. Energy and Transport. Lancet 2007, 370, 1078–1088. [Google Scholar] [CrossRef]
- Ahmed, T.; Pirdavani, A.; Janssens, D.; Wets, G. Utilizing Intelligent Portable Bicycle Lights to Assess Urban Bicycle Infrastructure Surfaces. Sustainability 2023, 15, 4495. [Google Scholar] [CrossRef]
- Acerra, E.M.; Shoman, M.; Imine, H.; Brasile, C.; Lantieri, C.; Vignali, V. The Visual Behaviour of the Cyclist: Comparison between Simulated and Real Scenarios. Infrastructures 2023, 8, 92. [Google Scholar] [CrossRef]
- Maizlish, N.; Woodcock, J.; Co, S.; Ostro, B.; Fanai, A.; Fairley, D. Health Cobenefits and Transportation-Related Reductions in Greenhouse Gas Emissions in the San Francisco Bay Area. Am. J. Public Health 2013, 103, 703–709. [Google Scholar] [CrossRef]
- Ahmed, T.; Moeinaddini, M.; Almoshaogeh, M.; Jamal, A.; Nawaz, I.; Alharbi, F. A New Pedestrian Crossing Level of Service (Pclos) Method for Promoting Safe Pedestrian Crossing in Urban Areas. Int. J. Environ. Res. Public Health 2021, 18, 8813. [Google Scholar] [CrossRef]
- Sobhani, A.; Aliabadi, H.A.; Farooq, B. Metropolis-Hasting Based Expanded Path Size Logit Model for Cyclists’ Route Choice Using GPS Data. Int. J. Transp. Sci. Technol. 2019, 8, 161–175. [Google Scholar] [CrossRef]
- Delhoum, Y.; Belaroussi, R.; Dupin, F.; Zargayouna, M. Analysis of MATSim Modeling of Road Infrastructure in Cyclists’ Choices in the Case of a Hilly Relief. Infrastructures 2022, 7, 108. [Google Scholar] [CrossRef]
- Karolemeas, C.; Vassi, A.; Tsigdinos, S.; Bakogiannis, D.E. Measure the Ability of Cities to Be Biked via Weighted Parameters, Using GIS Tools. the Case Study of Zografou in Greece. Transp. Res. Procedia 2022, 62, 59–66. [Google Scholar] [CrossRef]
- Cantisani, G.; Durastanti, C.; Moretti, L. Cyclists at Roundabouts: Risk Analysis and Rational Criteria for Choosing Safer Layouts. Infrastructures 2021, 6, 34. [Google Scholar] [CrossRef]
- Muhs, C.D.; Clifton, K.J. Do Characteristics of Walkable Environments Support Bicycling? Toward a Definition of Bicycle-Supported Development. J. Transp. Land Use 2016, 9, 147–188. [Google Scholar] [CrossRef]
- Cafiso, S.; Pappalardo, G.; Stamatiadis, N. Observed Risk and User Perception of Road Infrastructure Safety Assessment for Cycling Mobility. Infrastructures 2021, 6, 154. [Google Scholar] [CrossRef]
- Kellstedt, D.K.; Spengler, J.O.; Maddock, J.E. Comparing Perceived and Objective Measures of Bikeability on a University Campus: A Case Study. SAGE Open 2021, 11, 21582440211018685. [Google Scholar] [CrossRef]
- Asadi-Shekari, Z.; Moeinaddini, M.; Zaly Shah, M. Non-Motorised Level of Service: Addressing Challenges in Pedestrian and Bicycle Level of Service. Transp. Rev. 2013, 33, 166–194. [Google Scholar] [CrossRef]
- van Lierop, D.; Soemers, J.; Hoeke, L.; Liu, G.; Chen, Z.; Ettema, D.; Kruijf, J. Wayfinding for Cycle Highways: Assessing e-Bike Users’ Experiences with Wayfinding along a Cycle Highway in the Netherlands. J. Transp. Geogr. 2020, 88, 102827. [Google Scholar] [CrossRef]
- Wijaya, N.D.P.; Zubizaretta, Z.D.; Kurniasari, M.W.; Pangamiani, K. Evaluation of the Provision Of Specific Bicycle Lanes in the Malang City. J. Innov. Civ. Eng. (JICE) 2023, 4, 76–85. [Google Scholar] [CrossRef]
- Parks, J.; Tanaka, A.; Ryus, P.; Monsere, C.M.; Mcneil, N.; Goodno, M. Assessment of Three Alternative Bicycle Infrastructure Quality-of-Service Metrics. Transp. Res. Rec. 2013, 2387, 56–65. [Google Scholar] [CrossRef]
- McNeil, N.; Monsere, C.M.; Dill, J. Influence of Bike Lane Buffer Types on Perceived Comfort and Safety of Bicyclists and Potential Bicyclists. Transp. Res. Rec. 2015, 2520, 132–142. [Google Scholar] [CrossRef]
- Nuñez, J.Y.M.; Bisconsini, D.R.; Rodrigues da Silva, A.N. Combining Environmental Quality Assessment of Bicycle Infrastructures with Vertical Acceleration Measurements. Transp. Res. Part A Policy Pract. 2020, 137, 447–458. [Google Scholar] [CrossRef]
- Tainio, M.; de Nazelle, A.J.; Götschi, T.; Kahlmeier, S.; Rojas-Rueda, D.; Nieuwenhuijsen, M.J.; de Sá, T.H.; Kelly, P.; Woodcock, J. Can Air Pollution Negate the Health Benefits of Cycling and Walking? Prev. Med. 2016, 87, 233–236. [Google Scholar] [CrossRef]
- Hull, A.; Holleran, C.O. Bicycle Infrastructure : Can Good Design Encourage Cycling ? Urban Plan Transp. Res. 2014, 2, 369–406. [Google Scholar] [CrossRef]
- Winters, M.; Zanotto, M.; Butler, G. The Canadian Bikeway Comfort and Safety (Can-Bics) Classification System: A Common Naming Convention for Cycling Infrastructure. Health Promot. Chronic Dis. Prev. Can. 2020, 40, 288–293. [Google Scholar] [CrossRef] [PubMed]
- Pucher, J.; Dill, J.; Handy, S. Infrastructure, Programs, and Policies to Increase Bicycling: An International Review. Prev. Med. 2010, 50, S106–S125. [Google Scholar] [CrossRef] [PubMed]
- Kirner Providelo, J.; da Penha Sanches, S. Roadway and Traffic Characteristics for Bicycling. Transportation 2011, 38, 765–777. [Google Scholar] [CrossRef]
- La Paix, L.; Cherchi, E.; Geurs, K. Role of Perception of Bicycle Infrastructure on the Choice of the Bicycle as a Train Feeder Mode. Int. J. Sustain. Transp. 2021, 15, 486–499. [Google Scholar] [CrossRef]
- Pucher, J.; Buehler, R. Making Cycling Irresistible: Lessons from the Netherlands, Denmark and Germany. Transp. Rev. 2008, 28, 495–528. [Google Scholar] [CrossRef]
- Fernández-Heredia, Á.; Monzón, A.; Jara-Díaz, S. Understanding Cyclists’ Perceptions, Keys for a Successful Bicycle Promotion. Transp. Res. Part A Policy Pract. 2014, 63, 1–11. [Google Scholar] [CrossRef]
- Akar, G.; Clifton, K.J. Influence of Individual Perceptions and Bicycle Infrastructure on Decision to Bike. Transp. Res. Rec. 2009, 2140, 165–172. [Google Scholar] [CrossRef]
- Asadi-shekari, Z.; Moeinaddini, M.; Zaly, M. Pedestrian Safety Index for Evaluating Street Facilities in Urban Areas. Saf. Sci. 2015, 74, 1–14. [Google Scholar] [CrossRef]
- Pucher, J. Cycling Safety on Bikeways vs. Roads. Transp. Q. 2001, 55, 9–11. [Google Scholar]
- Adinarayana, B.; Kasinayana, B. Bicycle Safety Index for Bicycle Level of Service on Urban Streets with Extreme Mixed Weather Conditions. Innov. Infrastruct. Solut. 2022, 7, 248. [Google Scholar] [CrossRef]
- Caviedes, A.; Figliozzi, M. Modeling the Impact of Traffic Conditions and Bicycle Facilities on Cyclists’ on-Road Stress Levels. Transp. Res. Part F Traffic Psychol. Behav. 2018, 58, 488–499. [Google Scholar] [CrossRef]
- Scarano, A.; Rella Riccardi, M.; Mauriello, F.; D’Agostino, C.; Pasquino, N.; Montella, A. Injury Severity Prediction of Cyclist Crashes Using Random Forests and Random Parameters Logit Models. Accid. Anal. Prev. 2023, 192, 107275. [Google Scholar] [CrossRef]
- DiGioia, J.; Watkins, K.E.; Xu, Y.; Rodgers, M.; Guensler, R. Safety Impacts of Bicycle Infrastructure: A Critical Review. J. Saf. Res. 2017, 61, 105–119. [Google Scholar] [CrossRef]
- Cobb, D.P.; Jashami, H.; Hurwitz, D.S. Bicyclists’ Behavioral and Physiological Responses to Varying Roadway Conditions and Bicycle Infrastructure. Transp. Res. Part F Traffic Psychol. Behav. 2021, 80, 172–188. [Google Scholar] [CrossRef]
- Lizana, M.; Tudela, A.; Tapia, A. Analysing the Influence of Attitude and Habit on Bicycle Commuting. Transp. Res. Part F Traffic Psychol. Behav. 2021, 82, 70–83. [Google Scholar] [CrossRef]
- Reynolds, C.C.; Harris, M.A.; Teschke, K.; Cripton, P.A.; Winters, M. The Impact of Transportation Infrastructure on Bicycling Injuries and Crashes: A Review of the Literature. Environ. Health 2009, 8, 47. [Google Scholar] [CrossRef] [PubMed]
- de Geus, B.; De Bourdeaudhuij, I.; Jannes, C.; Meeusen, R. Psychosocial and Environmental Factors Associated with Cycling for Transport among a Working Population. Health Educ. Res. 2008, 23, 697–708. [Google Scholar] [CrossRef]
- Handy, S.L.; Xing, Y. Factors Correlated with Bicycle Commuting: A Study in Six Small US Cities. Int. J. Sustain. Transp. 2011, 5, 91–110. [Google Scholar] [CrossRef]
- Milakis, D. Will Greeks Cycle? Exploring Intention and Attitudes in the Case of the New Bicycle Network of Patras. Int. J. Sustain. Transp. 2015, 9, 321–334. [Google Scholar] [CrossRef]
- Dill, J.; Mohr, C.; Ma, L. How Can Psychological Theory Help Cities Increase Walking and Bicycling? J. Am. Plan. Assoc. 2014, 80, 36–51. [Google Scholar] [CrossRef]
- Xing, Y.; Volker, J.; Handy, S. Why Do People like Bicycling? Modeling Affect toward Bicycling. Transp. Res. Part F Traffic Psychol. Behav. 2018, 56, 22–32. [Google Scholar] [CrossRef]
- Carr, T.; Dill, J. Bicycle Commuting and Facilities in Major U.S. Cities: If You Build Them, Commuters Will Use Them. Transp. Res. Rec. 2003, 1828, 116–123. [Google Scholar]
- Monsere, C.; Dill, J.; McNeil, N.; Clifton, K.; Foster, N.; Goddard, T.; Berkow, M.; Gilpin, J.; Voros, K.; van Hengel, D.; et al. Lessons from the Green Lanes: Evaluating Protected Bike Lanes in the U.S. NITC-RR-583; Transportation Research and Education Center (TREC): Portland, OR, USA, 2014. [Google Scholar] [CrossRef]
- Monsere, C.M.; McNeil, N.W.; Sanders, R.L. User-Rated Comfort and Preference of Separated Bike Lane Intersection Designs. Transp. Res. Rec. 2020, 2674, 216–229. [Google Scholar] [CrossRef]
- Foster, N.; Monsere, C.M.; Dill, J.; Clifton, K. Level-of-Service Model for Protected Bike Lanes. Transp. Res. Rec. 2015, 2520, 90–99. [Google Scholar] [CrossRef]
- Heinen, E.; Maat, K.; Van Wee, B. The Role of Attitudes toward Characteristics of Bicycle Commuting on the Choice to Cycle to Work over Various Distances. Transp. Res. Part D Transp. Environ. 2011, 16, 102–109. [Google Scholar] [CrossRef]
- Fuller, D.; Gauvin, L.; Kestens, Y.; Daniel, M.; Fournier, M.; Morency, P.; Drouin, L. Use of a New Public Bicycle Share Program in Montreal, Canada. Am. J. Prev. Med. 2011, 41, 80–83. [Google Scholar] [CrossRef]
- Puello, L.L.P.; Geurs, K. Modelling Observed and Unobserved Factors in Cycling to Railway Stations: Application to Transit-Oriented-Developments in the Netherlands. Eur. J. Transp. Infrastruct. Res. 2015, 15, 27–50. [Google Scholar]
- Reibstein, D.J.; Lovelock, C.H.; Dobson, R. de P. The Direction of Causality between Perceptions, Affect, and Behavior: An Application to Travel Behavior. J. Consum. Res. 1980, 6, 370–376. [Google Scholar] [CrossRef]
- Di Salvo, R.; Galletta, A.; Belcore, O.M.; Villari, M. Modeling Users’ Performance: Predictive Analytics in an IoT Cloud Monitoring System. In Proceedings of the Advances Service-Oriented and Cloud Computing: In Proceedings of the Service-Oriented and Cloud Computing: 8th IFIP WG 2.14 European Conference, ESOCC 2020, Heraklion, Greece, 28–30 September 2020; pp. 149–158. [Google Scholar]
- Comi, A.; Polimeni, A. Assessing Potential Sustainability Benefits of Micromobility: A New Data Driven Approach. Eur. Transp. Res. Rev. 2024, 16, 19. [Google Scholar] [CrossRef]
- Kothari, C.R. Research Methodology: Methods and Techniques; New Age International: New Delhi, India, 2004; ISBN 81-224-1522-9. [Google Scholar]
- Gibbons, J.D.; Chakraborti, S. Nonparametric Statistical Inference: Revised and Expanded; CRC Press: Boca Raton, FL, USA, 2014; ISBN 0-203-91156-3. [Google Scholar]
- Sheskin, D.J. Handbook of Parametric and Nonparametric Statistical Procedures; Chapman and Hall/CRC: Boca Raton, FL, USA, 2003; ISBN 0-429-18616-9. [Google Scholar]
- Kant, R.; Sadhukhan, S.; Anbanandam, R. Measuring Heterogeneity in Pedestrians’ Perceived Importance towards Crossing Facilities: An Experience in Roorkee. Transp. Res. Part F Traffic Psychol. Behav. 2024, 106, 257–275. [Google Scholar] [CrossRef]
- Sadhukhan, S.; Banerjee, U.K.; Maitra, B. Preference Heterogeneity towards the Importance of Transfer Facility Attributes at Metro Stations in Kolkata. Travel Behav. Soc. 2018, 12, 72–83. [Google Scholar] [CrossRef]
- Rosner, B.; Glynn, R.J. Power and Sample Size Estimation for the Wilcoxon Rank Sum Test with Application to Comparisons of C Statistics from Alternative Prediction Models. Biometrics 2009, 65, 188–197. [Google Scholar] [CrossRef]
- Awasthi, A.; Chauhan, S.S.; Omrani, H. Application of Fuzzy TOPSIS in Evaluating Sustainable Transportation Systems. Expert. Syst. Appl. 2011, 38, 12270–12280. [Google Scholar] [CrossRef]
- Pitale, A.M.; Parida, M.; Sadhukhan, S. Location Evaluation of Existing Park-and-Ride Facilities Along a Transit Corridor: A Case of Delhi MRTS. Transp. Dev. Econ. 2022, 8, 29. [Google Scholar] [CrossRef]
- Feng, C.-M.; Wang, R.-T. Performance Evaluation for Airlines Including the Consideration of Financial Ratios. J. Air Transp. Manag. 2000, 6, 133–142. [Google Scholar] [CrossRef]
- Sadhukhan, S.; Banerjee, U.K.; Maitra, B. Commuters’ Perception towards Transfer Facility Attributes in and around Metro Stations: Experience in Kolkata. J. Urban Plan. Dev. 2015, 141, 04014038. [Google Scholar] [CrossRef]
- Codina, O.; Maciejewska, M.; Nadal, J.; Marquet, O. Built Environment Bikeability as a Predictor of Cycling Frequency: Lessons from Barcelona. Transp. Res. Interdiscip. Perspect. 2022, 16, 100725. [Google Scholar] [CrossRef]
- Hardinghaus, M.; Nieland, S.; Lehne, M.; Weschke, J. More than Bike Lanes—A Multifactorial Index of Urban Bikeability. Sustainability 2021, 13, 11584. [Google Scholar] [CrossRef]
- Ito, K.; Biljecki, F. Assessing Bikeability with Street View Imagery and Computer Vision. Transp. Res. Part C Emerg. Technol. 2021, 132, 103371. [Google Scholar] [CrossRef]
- Schmid-Querg, J.; Keler, A.; Grigoropoulos, G. The Munich Bikeability Index: A Practical Approach for Measuring Urban Bikeability. Sustainability 2021, 13, 428. [Google Scholar] [CrossRef]
- Porter, A.K.; Kohl, H.W.; Pérez, A.; Reininger, B.; Pettee Gabriel, K.; Salvo, D. Bikeability: Assessing the Objectively Measured Environment in Relation to Recreation and Transportation Bicycling. Environ. Behav. 2020, 52, 861–894. [Google Scholar] [CrossRef]
- Arellana, J.; Saltarín, M.; Larrañaga, A.M.; González, V.I.; Henao, C.A. Developing an Urban Bikeability Index for Different Types of Cyclists as a Tool to Prioritise Bicycle Infrastructure Investments. Transp. Res. Part A Policy Pract. 2020, 139, 310–334. [Google Scholar] [CrossRef]
- Lowry, M.; Callister, D.; Gresham, M.; Moore, B. Assessment of Communitywide Bikeability with Bicycle Level of Service. Transp. Res. Rec. 2012, 2314, 41–48. [Google Scholar] [CrossRef]
- Bíl, M.; Andrášik, R.; Kubeček, J. How Comfortable Are Your Cycling Tracks? A New Method for Objective Bicycle Vibration Measurement. Transp. Res. Part C Emerg. Technol. 2015, 56, 415–425. [Google Scholar] [CrossRef]
- Lin, J.J.; Wei, Y.H. Assessing Area-Wide Bikeability: A Grey Analytic Network Process. Transp. Res. Part A Policy Pract. 2018, 113, 381–396. [Google Scholar] [CrossRef]
- Hoedl, S.; Titze, S.; Oja, P. The Bikeability and Walkability Evaluation Table: Reliability and Application. Am. J. Prev. Med. 2010, 39, 457–459. [Google Scholar] [CrossRef]
- Gu, P.; Han, Z.; Cao, Z.; Chen, Y.; Jiang, Y. Using Open Source Data to Measure Street Walkability and Bikeability in China: A Case of Four Cities. Transp. Res. Rec. 2018, 2672, 63–75. [Google Scholar] [CrossRef]
- Tran, P.T.M.; Zhao, M.; Yamamoto, K.; Minet, L.; Nguyen, T.; Balasubramanian, R. Cyclists’ Personal Exposure to Traffic-Related Air Pollution and Its Influence on Bikeability. Transp. Res. Part D Transp. Environ. 2020, 88, 102563. [Google Scholar] [CrossRef]
- Ahmed, T.; Pirdavani, A.; Wets, G.; Janssens, D. Bicycle Infrastructure Design Principles in Urban Bikeability Indices: A Systematic Review. Sustainability 2024, 16, 2545. [Google Scholar] [CrossRef]
- Beura, S.K.; Bhuyan, P.K. Development of a Bicycle Level of Service Model for Urban Street Segments in Mid-Sized Cities Carrying Heterogeneous Traffic: A Functional Networks Approach. J. Traffic Transp. Eng. 2017, 4, 503–521. [Google Scholar] [CrossRef]
- Beura, S.K.; Chellapilla, H.; Bhuyan, P.K. Urban Road Segment Level of Service Based on Bicycle Users’ Perception under Mixed Traffic Conditions. J. Mod. Transp. 2017, 25, 90–105. [Google Scholar] [CrossRef]
- Dai, B.; Dadashova, B. Review of Contextual Elements Affecting Bicyclist Safety. J. Transp. Health 2021, 20, 101013. [Google Scholar] [CrossRef]
- Arellana, J.; Saltarín, M.; Larrañaga, A.M.; Alvarez, V.; Henao, C.A. Urban Walkability Considering Pedestrians’ Perceptions of the Built Environment: A 10-Year Review and a Case Study in a Medium-Sized City in Latin America. Transp. Rev. 2020, 40, 183–203. [Google Scholar] [CrossRef]
- Ros-McDonnell, L.; de-la-Fuente-Aragon, M.V.; Ros-McDonnell, D.; Carboneras, M.C. Development of a Biking Index for Measuring Mediterranean Cities Mobility. Int. J. Prod. Manag. Eng. 2020, 8, 21–29. [Google Scholar] [CrossRef]
- Krenn, P.J.; Oja, P.; Titze, S. Development of a Bikeability Index to Assess the Bicycle-Friendliness of Urban Environments. Open J. Civ. Eng. 2015, 05, 451–459. [Google Scholar] [CrossRef]
- Castañon, U.N.; Ribeiro, P.J.G. Bikeability and Emerging Phenomena in Cycling: Exploratory Analysis and Review. Sustainability 2021, 13, 2394. [Google Scholar] [CrossRef]
- Likert, R. A Technique for the Measurement of Attitudes. Arch. Psychol. 1932, 22, 55. [Google Scholar]
- Qualtrics, Provo, UT 2005. Available online: https://www.qualtrics.com/blog/citing-qualtrics/ (accessed on 25 July 2024).
- de Vet, H.C.W.; Mokkink, L.B.; Mosmuller, D.G.; Terwee, C.B. Spearman–Brown Prophecy Formula and Cronbach’s Alpha: Different Faces of Reliability and Opportunities for New Applications. J. Clin. Epidemiol. 2017, 85, 45–49. [Google Scholar] [CrossRef]
- Le, H.T.K.; Buehler, R.; Hankey, S. Have Walking and Bicycling Increased in the US? A 13-Year Longitudinal Analysis of Traffic Counts from 13 Metropolitan Areas. Transp. Res. Part D Transp. Environ. 2019, 69, 329–345. [Google Scholar] [CrossRef]
- Jacobsen, P.L.; Racioppi, F.; Rutter, H. Who Owns the Roads? How Motorised Traffic Discourages Walking and Bicycling. Inj. Prev. 2009, 15, 369–373. [Google Scholar] [CrossRef] [PubMed]
- Liu, J.; Khattak, A.J.; Li, X.; Nie, Q.; Ling, Z. Bicyclist Injury Severity in Traffic Crashes: A Spatial Approach for Geo-Referenced Crash Data to Uncover Non-Stationary Correlates. J. Saf. Res. 2020, 73, 25–35. [Google Scholar] [CrossRef]
- Ito, Y.; Morgan, M.; Lovelace, R. Where to Invest in Cycle Parking: A Portfolio Management Approach to Spatial Transport Planning. Environ. Plan. B Urban Anal. City Sci. 2023, 50, 1438–1454. [Google Scholar] [CrossRef]
- Hood, J.; Sall, E.; Charlton, B. A GPS-Based Bicycle Route Choice Model for San Francisco, California. Transp. Lett. 2011, 3, 63–75. [Google Scholar] [CrossRef]
- Cervero, R.; Duncan, M. Walking, Bicycling, and Urban Landscapes: Evidence From the San Francisco Bay Area. Am. J. Public Health 2003, 93, 1478–1483. [Google Scholar] [CrossRef] [PubMed]
- Winters, M.; Davidson, G.; Kao, D.; Teschke, K. Motivators and Deterrents of Bicycling: Comparing Influences on Decisions to Ride. Transportation 2011, 38, 153–168. [Google Scholar] [CrossRef]
- Broach, J.; Dill, J.; Gliebe, J. Where Do Cyclists Ride? A Route Choice Model Developed with Revealed Preference GPS Data. Transp. Res. Part A Policy Pract. 2012, 46, 1730–1740. [Google Scholar] [CrossRef]
- Tyndall, J. Cycling Mode Choice amongst US Commuters: The Role of Climate and Topography. Urban Stud. 2020, 59, 97–119. [Google Scholar] [CrossRef]
- Yang, Y.; Wu, X.; Zhou, P.; Gou, Z.; Lu, Y. Towards a Cycling-Friendly City: An Updated Review of the Associations between Built Environment and Cycling Behaviors (2007–2017). J. Transp. Health 2019, 14, 100613. [Google Scholar] [CrossRef]
- The Brussels Times. Belgium, the Homeland of e-Bike? Motorised Bicycle Sales Soar. Available online: https://www.brusselstimes.com/1001418/belgium-the-homeland-of-e-bike-motorised-bicycle-sales-soar (accessed on 27 August 2024).
- Aldred, R.; Elliott, B.; Woodcock, J.; Goodman, A. Cycling Provision Separated from Motor Traffic: A Systematic Review Exploring Whether Stated Preferences Vary by Gender and Age. Transp. Rev. 2017, 37, 29–55. [Google Scholar] [CrossRef]
- Garrard, J.; Rose, G.; Lo, S.K. Promoting Transportation Cycling for Women: The Role of Bicycle Infrastructure. Prev. Med. 2008, 46, 55–59. [Google Scholar] [CrossRef] [PubMed]
- Nuñez, J.Y.M.; Teixeira, I.P.; da Silva, A.N.R.; Zeile, P.; Dekoninck, L.; Botteldooren, D. The Influence of Noise, Vibration, Cycle Paths, and Period of Day on Stress Experienced by Cyclists. Sustainability 2018, 10, 2379. [Google Scholar] [CrossRef]


| Indicators | Notation | References |
|---|---|---|
| Presence of bicycle lanes, paths | PBI | [9,63,64,65,66,67] |
| Pavement type | PT | [65,68,69,70] |
| Bicycle lane width | LW | [65,68,69,71] |
| Sidewalks width | SW | [65,72,73] |
| Grade | GR | [9,65,68,74] |
| Motorized traffic speed | TS | [68,75] |
| Traffic control devices | CD | [68,69,76,77,78] |
| Street lighting | ST | [65,66,79] |
| Car parking along the cycle path | CP | [64,65,80] |
| Availability of bicycle parking | ABP | [63,80] |
| Trees/green area and landscaping | TRL | [64,71,74,78,79,81] |
| Bicycle facilities at traffic signals | CYJ | [66,75,80,82] |
| Road signage | RS | [64] |
| Interruptions | ITR | [65,67,80] |
| Variable | Male | Female | Prefer Not to Disclose | Total |
|---|---|---|---|---|
| Gender | 193 (50.4%) | 185 (48.3%) | 5 (1.3%) | 383 |
| Age | ||||
| Younger than 18 years | 5 (2.6%) | 5 (2.7%) | 1 (20%) | 11 (2.9%) |
| 18–24 years | 67 (34.7%) | 69 (37.3%) | 1 (20%) | 137 (35.8%) |
| 25–34 years | 73 (37.8%) | 49 (26.5%) | 1 (20%) | 123 (32.1%) |
| 35–44 years | 24 (12.4%) | 37 (20%) | 1 (20%) | 62 (16.2%) |
| 45–54 years | 17 (8.8%) | 19 (10.3%) | 1 (20%) | 37 (9.7%) |
| 55–64 years | 5 (2.6%) | 6 (3.2%) | 0 (0%) | 11 (2.9) |
| Older than 65 years | 2 (1%) | 0 (0%) | 0 (0%) | 2 (0.5%) |
| Educational background | ||||
| Less than a high school diploma | 2 (1%) | 3 (1.6%) | 0 (0%) | 5 (1.3%) |
| High school diploma | 44 (22.8%) | 45 (34.5%) | 1 (20%) | 90 (23.5%) |
| Bachelor’s degree | 55 (28.5%) | 55 (29.7%) | 2 (40%) | 112 (29.2%) |
| Master’s degree | 70 (36.3%) | 68 (36.8%) | 2 (40%) | 140 (36.6%) |
| Doctorate | 22 (11.4%) | 14 (7.6%) | 0 (0%) | 36 (9.4%) |
| Job | ||||
| Student | 122 (63.2%) | 96 (51.9%) | 2 (40%) | 220 (57.4%) |
| Employed | 55 (28.5%) | 79 (42.7%) | 2 (40%) | 136 (35.5%) |
| Entrepreneur | 8 (4.1%) | 3 (1.6%) | 0 (0%) | 11 (2.9%) |
| Retired | 5 (2.6%) | 3 (1.6%) | 0 (0%) | 8 (2.1%) |
| Disabled | 0 (0%) | 0 (0%) | 1 (20%) | 1 (0.3%) |
| Unemployed | 3 (1.6%) | 4 (2.2%) | 0 (0%) | 7 (1.8%) |
| Variable | Male | Female | I Prefer Not to Disclose | Total (%) |
|---|---|---|---|---|
| Frequent mode of transport | ||||
| Car | 20 (10.4%) | 21 (11.4%) | 0 (0.0%) | 41 (10.7%) |
| Scooter | 0 (0.0%) | 1 (0.5%) | 1 (20.0%) | 2 (0.5%) |
| Public transport | 18 (9.3%) | 25 (13.5%) | 0 (0.0%) | 43 (11.2%) |
| Bicycle | 119 (61.7%) | 95 (51.4%) | 3 (60.0%) | 217 (56.7%) |
| Foot | 36 (18.7%) | 43 (23.2%) | 1 (20.0%) | 80 (20.9%) |
| Biking experience | ||||
| Less than one year | 15 (7.8%) | 20 (10.8%) | 0 (0.0%) | 35 (9.1%) |
| 1–2 years | 19 (9.8%) | 11 (5.9%) | 0 (0.0%) | 30 (7.8%) |
| 2–5 years | 23 (11.9% | 12 (6.5%) | 0 (0.0%) | 35 (9.1%) |
| 5–10 years | 18 (9.3%) | 24 (13.0%) | 0 (0.0%) | 42 (11.0%) |
| More than ten years | 118 (61.1%) | 118 (63.8%) | 5 (100.0%) | 241 (62.9%) |
| Daily average cycling distance (km) | ||||
| Less than 1 km | 18 (9.3%) | 26 (14.1%) | 1 (20.0%) | 45 (11.7%) |
| 1–2 km | 32 (16.6%) | 35 (18.9%) | 0 (0.0%) | 67 (17.5%) |
| 2–5 km | 69 (35.8%) | 51 (27.6%) | 1 (20.0%) | 121 (31.6%) |
| 5–10 km | 38 (19.7%) | 52 (28.1%) | 1 (20.0%) | 91 (23.8%) |
| More than 10 km | 36 (18.7%) | 21 (11.4%) | 2 (40.0%) | 59 (15.4%) |
| Weekly cycling frequency (average number of days in a week) | ||||
| 1-day | 15 (7.8%) | 20 (10.8%) | 1 (20.0%) | 36 (9.4%) |
| 2-days | 20 (10.4%) | 20 (10.8%) | 0 (0.0%) | 40 (10.4%) |
| 3-days | 24 (12.4%) | 25 (13.5%) | 2 (40.0%) | 51 (13.3%) |
| 4-days | 35 (18.1%) | 25 (13.5%) | 0 (0.0%) | 60 (15.7%) |
| 5-days | 54 (28.0%) | 63 (34.1%) | 1 (20.0%) | 118 (30.8%) |
| 6-days | 22 (11.4%) | 19 (10.3%) | 0 (0.0%) | 41 (10.7%) |
| 7-days | 23 (11.9%) | 13 (7.0%) | 1 (20.0%) | 37 (9.7%) |
| Variables | Si | Ranks | ||
|---|---|---|---|---|
| PBI | 0.011 | 0.164 | 0.935 | 1 |
| PT | 0.053 | 0.143 | 0.728 | 8 |
| LW | 0.072 | 0.127 | 0.638 | 10 |
| SW | 0.100 | 0.100 | 0.502 | 12 |
| GR | 0.173 | 0.044 | 0.202 | 14 |
| TS | 0.017 | 0.169 | 0.908 | 2 |
| CD | 0.040 | 0.158 | 0.796 | 4 |
| ST | 0.040 | 0.152 | 0.790 | 5 |
| CP | 0.101 | 0.082 | 0.446 | 13 |
| ABP | 0.031 | 0.158 | 0.834 | 3 |
| TRL | 0.052 | 0.132 | 0.715 | 9 |
| CYJ | 0.054 | 0.151 | 0.737 | 7 |
| RS | 0.044 | 0.159 | 0.781 | 6 |
| ITR | 0.074 | 0.126 | 0.631 | 11 |
| Variable | Gender | Age | Cycling Distance (km) | Cycling Experience (years) | Weekly Bicycle Use | Trip Nature |
|---|---|---|---|---|---|---|
| PBI | 0.782 | 0.089 | 0.029 | 0.012 | 0.037 | <0.001 |
| PT | 0.563 | 0.036 | 0.022 | 0.708 | 0.408 | 0.513 |
| LW | 0.983 | 0.063 | 0.209 | 0.597 | 0.033 | 0.020 |
| SW | 0.744 | 0.008 | 0.851 | 0.073 | 0.016 | 0.121 |
| GR | 0.87 | <0.001 | 0.034 | <0.001 | 0.916 | 0.750 |
| TS | 0.302 | 0.472 | 0.894 | 0.714 | 0.570 | 0.009 |
| CD | 0.708 | 0.070 | 0.446 | 0.123 | 0.544 | 0.021 |
| ST | 0.929 | <0.001 | 0.533 | 0.211 | 0.757 | 0.443 |
| CP | 0.734 | <0.001 | 0.623 | 0.463 | 0.008 | 0.917 |
| ABP | 0.751 | 0.588 | 0.047 | 0.878 | 0.173 | 0.039 |
| TRL | 0.847 | 0.389 | 0.116 | 0.526 | 0.138 | 0.012 |
| CYJ | 0.593 | 0.102 | 0.383 | 0.520 | 0.661 | 0.011 |
| RS | 0.901 | 0.447 | 0.581 | 0.203 | 0.768 | 0.137 |
| ITR | 0.139 | 0.032 | 0.120 | 0.061 | 0.101 | 0.186 |
Disclaimer/Publisher’s Note: The statements, opinions and data contained in all publications are solely those of the individual author(s) and contributor(s) and not of MDPI and/or the editor(s). MDPI and/or the editor(s) disclaim responsibility for any injury to people or property resulting from any ideas, methods, instructions or products referred to in the content. |
© 2024 by the authors. Licensee MDPI, Basel, Switzerland. This article is an open access article distributed under the terms and conditions of the Creative Commons Attribution (CC BY) license (https://creativecommons.org/licenses/by/4.0/).
Share and Cite
Ahmed, T.; Pirdavani, A.; Wets, G.; Janssens, D. Assessing Heterogeneity Among Cyclists Towards Importance of Bicycle Infrastructural Elements in Urban Areas. Infrastructures 2024, 9, 153. https://doi.org/10.3390/infrastructures9090153
Ahmed T, Pirdavani A, Wets G, Janssens D. Assessing Heterogeneity Among Cyclists Towards Importance of Bicycle Infrastructural Elements in Urban Areas. Infrastructures. 2024; 9(9):153. https://doi.org/10.3390/infrastructures9090153
Chicago/Turabian StyleAhmed, Tufail, Ali Pirdavani, Geert Wets, and Davy Janssens. 2024. "Assessing Heterogeneity Among Cyclists Towards Importance of Bicycle Infrastructural Elements in Urban Areas" Infrastructures 9, no. 9: 153. https://doi.org/10.3390/infrastructures9090153
APA StyleAhmed, T., Pirdavani, A., Wets, G., & Janssens, D. (2024). Assessing Heterogeneity Among Cyclists Towards Importance of Bicycle Infrastructural Elements in Urban Areas. Infrastructures, 9(9), 153. https://doi.org/10.3390/infrastructures9090153