Article

Public Involvement in Transportation Decision Making: A Comparison between Baghdad and Tehran

by
Rusul Darraji
,
Reza Golshan Khavas
* and
Ali Tavakoli Kashani
School of Civil Engineering, Iran University of Science and Technology, Tehran 16846-13114, Iran
*
Author to whom correspondence should be addressed.
Infrastructures 2024, 9(9), 151; https://doi.org/10.3390/infrastructures9090151
Submission received: 10 July 2024 / Revised: 2 August 2024 / Accepted: 30 August 2024 / Published: 4 September 2024
(This article belongs to the Section Sustainable Infrastructures)

Abstract

This study develops an integrated methodology to incorporate public perspectives into the establishment and development of public transportation infrastructure systems. The approach involves surveying citizens to collect data, performing demographic analyses to identify differences between cities, and applying Multi-Criteria Decision-Making (MCDM) techniques to weight, scale, and integrate evaluation criteria in order to determine the optimal transportation option. The primary aim of this research is to incorporate public perspectives into transportation planning in developing countries and to promote stakeholder engagement for transportation initiatives in cities such as Baghdad, Iraq, and Tehran, Iran. First, an initial survey was conducted to identify the top three preferred criteria among 200 participants from both cities. The survey results revealed that the three most important criteria were safety, travel time, and reliability. Subsequently, a larger survey utilizing the Saaty scale was administered to capture citizens’ preferences, with a total sample size of 550 from Baghdad and 345 from Tehran. The weights of the criteria were then calculated using the Group Analytical Hierarchy Process (GAHP). Three transportation alternatives—monorail, Light Rapid Transit (LRT), and metrobus—were suggested by transportation experts to be evaluated and ranked using the Technique for Order Preference by Similarity to Ideal Solution (TOPSIS) based on the weighted citizen preferences. The results indicate that for Baghdad residents, transportation safety is the most important priority, followed by reliability and travel time. However, LRT is rated as the most optimal transportation solution (0.721), followed by monorail (0.596) and metrobus (0.078). In Tehran, travel time represents the most preferred transportation attribute, followed by reliability and safety. The residents of Tehran are shown to prefer LRT (0.843), followed by monorail (0.370) and metrobus (0.143). Despite the similar ranking of transportation alternatives in the two cities, the performance scores differ between them, highlighting the importance of tailoring transportation planning to the unique preferences and needs of local communities. The validation of the results was conducted through sensitivity analysis to determine how variations in the criteria weights and input parameters affected the final rankings. Additionally, a stated preference survey was employed as a practical method to evaluate the robustness of the final ranking of the alternatives.

1. Introduction

Transportation systems constitute a fundamental public infrastructure investment that is essential for a country’s economic productivity and competitiveness on the global stage. Robust transportation infrastructure supports the mobility and accessibility of people, goods, and services—elements that are absolutely vital for enhancing a country’s economic growth and sustaining its standing in the international marketplace [1].
Over the past two decades, developing countries have experienced significant population growth. This is particularly evident in the capital cities, such as Tehran and Baghdad, which have populations of 8.5 and 7 million, respectively. These large and growing urban centers are struggling with severe traffic congestion issues [2,3,4,5]. Providing an adequate public transportation infrastructure is crucial to meet the needs and preferences of people [3,6]. This can be achieved by incorporating public opinions and understanding their requirements when establishing a new transportation project or improving an existing public transportation system. One way to perform this is by gathering people’s preferences regarding switching to public transportation.
One of the most popular algorithms in transportation planning is Multi-Criteria Decision Making (MCDM). This subfield of operations research provides a powerful transportation planning tool, as it can not only indicate the economic impact of a planned transportation project but also incorporate ecological, spatial, and social considerations. The integration of these aspects with stakeholder perspectives in a single algorithm can lead to optimum decisions rather than multiple problem solutions. In fact, this algorithm enables gaining public trust regarding transportation projects [7,8,9,10]. Several studies have applied MCDM techniques to evaluate and improve public transportation systems. Krmac [11] developed an MCDM tool that integrated the Analytical Hierarchy Process (AHP) and Technique for Order Preference by Similarity to Ideal Solution (TOPSIS) to evaluate railway restructuring options through the lens of sustainability. The results showed that the TOPSIS method supported by AHP was able to robustly rank the various alternatives. Hamurcu [12] applied an integrated Analytical Network Process (ANP)-TOPSIS approach to select the optimal monorail route in Ankara, Turkey. The ANP identified the interdependent criteria, and TOPSIS was then used to rank the alternatives. The results demonstrated that this combined method was effective in evaluating the involved diverse factors. Nosala [13] applied MCDA in Cracow, Poland to evaluate and rank Integrated System of Urban Public Transport (ISUPT) alternatives for travel demand management. The alternatives were simulated and rated using AHP across various factors. Lambas [14] integrated AHP with Geographic Information System (GIS) to assess the transportation, economic, social, and environmental impacts associated with two transportation systems: the Light Rail Transit (LRT) system in Santa Cruz de Tenerife, Spain, and the Bus Rapid Transit (BRT) system in Prato, Italy. Jain [15] applied a survey-based analysis using AHP in Delhi, India, and concluded that public transportation safety was ranked the highest, followed by reliability, cost, and comfort. Moslem [16] used Fuzzy AHP (FAHP) and Interval AHP (IAHP) methods to develop a decision support procedure for public transport improvement in Mersin, Turkey. Stakeholder preferences were elicited via a survey and incorporated using the two techniques, which enabled accounting for uncertainty and reaching more consensual outcomes. Similar outcomes regarding IAHP were presented by Ghorbanzadeh [17]. Duleba [18] addresses improving city public bus quality of rising costs and differing views from passengers, managers, and government officials. The supply quality of the system was assessed using AHP through questionnaires. The findings provided a priority ranking of supply quality elements, aiding policymakers in enhancing public transportation. Ignaccoloa [19] presented a method using AHP and role-playing to involve university students as stakeholders in evaluating transit options for a new metro station in Catania, Italy. This method compared aggregated priorities and consensus voting, demonstrating the effectiveness of the AHP approach in transport decision making. Lee [20] analyzed the efficiency of transfer stations in Seoul’s public transportation network using smart card data and Data Envelopment Analysis. It was found that the average efficiency score for the major stations was relatively modest, with transfer efficiency linked to factors like the number of transfer trips and socioeconomic conditions. Lee [21] evaluated the equity of vertical transport in Seoul’s subway stations for mobility-disabled users and an equity score was estimated using the DEA model. The study finding was that while some stations were fully equitable, a significant number required substantial facility improvements to achieve the same level of equity. Lee [22] evaluated the nightlife attractiveness of Seoul for Millennials and Generation Z (Gen MZ) using DEA and smart card data. The results provided insights into the current and potential future nightlife hotspots in the city.
The existing literature clearly demonstrates that MCDM is a powerful tool for evaluating and improving public transportation systems. The integration of MCDM with techniques like GAHP and TOPSIS can significantly enhance the decision-making process. GAHP provides a structured framework for complex decisions by considering multiple decision makers’ perspectives, while TOPSIS ranks alternatives based on proximity to positive ideal and negative ideal solutions. Combining GAHP and TOPSIS leverages the strengths of both methods, resulting in a flexible approach applicable to various decision-making problems, including transportation mode evaluation. However, a research gap has been identified regarding the lack of public involvement in this process, particularly in developing countries, where public involvement has been perceived as time-consuming, resource-intensive, and costly. To address this gap, this study, for the first time, establishes an online survey based on Saaty’s scale in Tehran and Baghdad to gain people’s perspectives on improving the existing public transportation systems. The data were collected and analyzed using a hybrid approach that involved the Group Analytical Hierarchy Process (GAHP) for weighting the criteria and TOPSIS for obtaining the final ranking of the three proposed transportation alternatives: LRT, monorail, and metrobus. LRT is an electric rail-based transit system that operates on dedicated rights-of-way, providing higher capacity and faster service compared to other urban rail transit systems. LRT is suitable for urban and suburban routes with moderate to high passenger volumes [1]. Monorail is an urban transportation system that operates on a single elevated track using special vehicles designed to supply high-capacity and efficient service. Monorail is preferred for certain urban routes, tourist attractions, and areas where elevated tracks are beneficial [23]. Metrobus is a high-capacity, high-frequency bus services system operated by metropolitan transit agencies; metrobus systems often have dedicated stations and lanes, but may not have all the infrastructure and operational enhancements of a regular BRT system. Metrobus is best suited for providing flexible transit options in urban and suburban areas not served by rail infrastructure [24]. This study provides guidance for decision makers and planners to integrate public preferences into the decision-making process regarding public transportation infrastructure. Figure 1 shows examples of LRT, monorail, and metrobus systems in different cities around the world.

2. Methodology

In this study, a novel hybrid algorithm is employed to integrate public perspectives into transportation planning. This algorithm uniquely combines the GAHP and TOPSIS methods, marking its first application in this context. The approach consists of three stages, as illustrated in Figure 2.
The first stage involves identifying criteria based on previous research, expert opinions, and a preliminary questionnaire survey conducted in Baghdad and Tehran, where citizens highlighted the most important transportation attributes for their commuting experience. Alternatives are then identified based on prior research and expert insights. The second stage focuses on constructing a hierarchy diagram to organize the decision-making framework, followed by conducting a survey in Baghdad and Tehran. The survey included questions regarding the socioeconomic characteristics of the respondents, utilized Saaty’s 9-point scale, and incorporated inquiries related to stated preferences. The participants utilized a 9-point Saaty scale for evaluating the relative importance of criteria through pairwise comparisons. Then, the GAHP method is applied to calculate weights based on the public’s preference using the geometric mean. Scaling was conducted by experts who evaluated the alternatives using a 5-point Likert scale to estimate their relative importance regarding each criterion, creating the decision matrix. In the third stage, the TOPSIS method is utilized to rank the transportation alternatives. A comparative study evaluates how variations in public preferences for the same performance criteria impact the rankings in the two cities.
The results undergo validation through a sensitivity analysis to assess how changes in criteria weights and input parameters affect final rankings. The sensitivity analysis was performed using the weights derived from the GAHP method, equal weighting method, and the entropy method. A detailed description of the GAHP, TOPSIS, and the entropy methods used in this work is shown below.

2.1. Group Analytic Hierarchy Process (GAHP)

The GAHP algorithm enables a group of decision makers to be involved in the decision-making process rather than considering one decision maker’s opinion as it is applied using AHP [26]. GAHP organizes complex problems into a hierarchical framework that includes the goal, criteria, sub-criteria, and alternatives [11]. This makes it well-suited for transportation decision making, as it is flexible, user-friendly, accommodates various viewpoints, evaluates consistency, incorporates expert opinions, and integrates with other MCDM methods [9,27]. The key steps of the proposed method are outlined below [1]:
1.
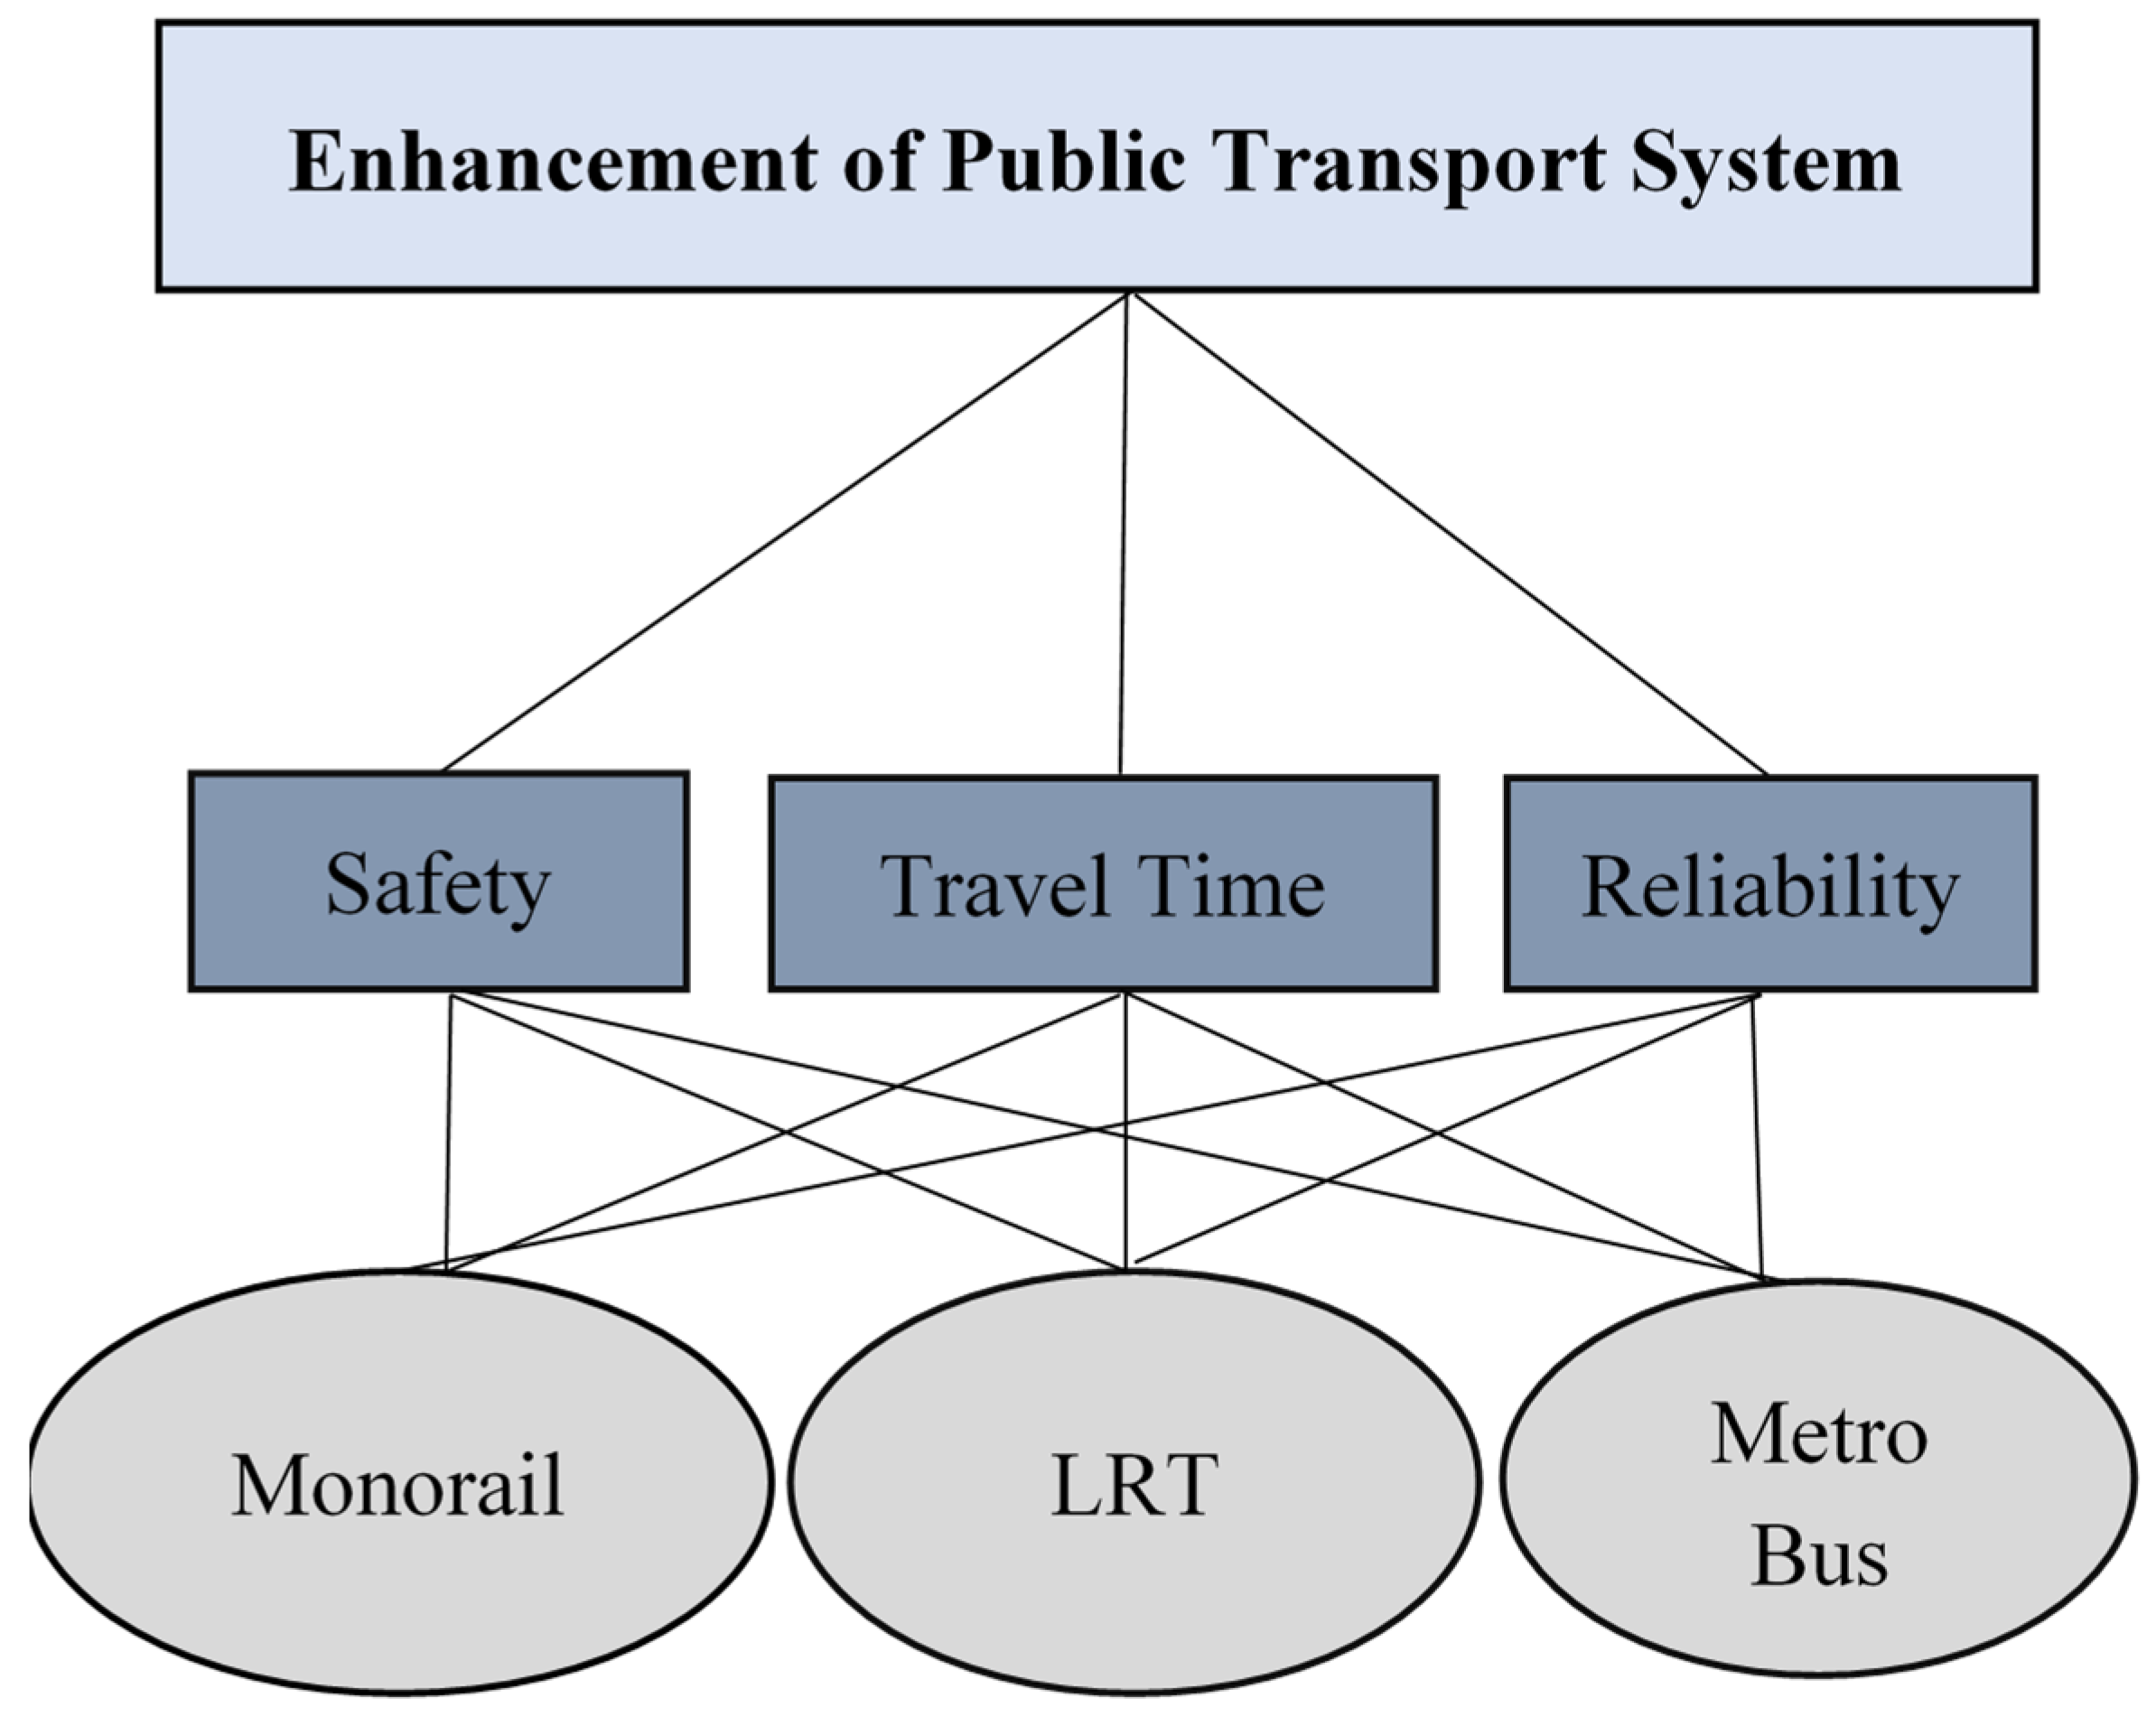
Decompose the decision problem and formulate a hierarchical model considering at least three levels: objectives, criteria, and alternatives.
2.
Calculate the local weights considering comparisons between the factors on one level and specific factors in the immediate upper level using Saaty’s scale. In AHP, multiple pairwise comparisons are based on a regular comparison scale of 9 levels as shown in Table 1. Let C = 1 ,   2 ,   ,   n be the set of criteria. The pairwise comparisons of the n criteria may be represented in an ( n × n ) matrix A = a i j , where each considered element a i j   i ,   j = 1 ,   2 ,   3 ,   ,   n is the ratio of the weights of the corresponding criteria, as illustrated below:
A = a 11 a 12 a 1 n a 21 a 22 a 2 n a n 1 a n 2 a m n = 1 w 1 / w 2 w 1 / w n w 2 / w 1 1 w 2 / w n w n / w 1 w n / w 2 1
where a i j = w i / w j   , ( w i   and   w j are the relative importance of criteria i and j , respectively) and = 1 / a i j .
3.
Calculate the Eigenvalues and Eigenvectors after the pairwise matrices have been completed. This is accomplished by multiplying matrix A by the weight vector W , which allows for the determination of the relative importance weights. The summation of these weights in each pairwise comparison matrix should equal 1. Assuming that the vector of weights is known, this multiplication results in A W = n W , which represents a system of homogeneous linear equations. Here, W is referred to as the principal right Eigenvector of A , and n is the corresponding Eigenvalue of A :
A n I W = 0
or
A W = 1 w 1 / w 2 w 1 / w n w 2 / w 1 1 w 2 / w n w n / w 1 w n / w 2 1 w 1 w 2 w n = n × w 1 w 2 w n = n W
According to Saaty’s principle, if the judgments of decision makers are perfectly consistent, meaning that all the pairwise comparisons satisfy the condition a i k = a i j ×   a j i (for i ,   j , and k = 1 ,   2 ,   3 ,   ,   n ), then the principal right Eigenvector of A is equal to n . However, as stated in Equation (3), perfectly consistent judgments rarely occur in reality. Thus, the Eigenvalue of A also rarely equals n . Therefore, the largest Eigenvalue ( λ m a x ) will always be greater than or equal to n , and Equation (3) can be transformed as follows:
A W = λ max W
where W represents the Eigenvector associated with λ m a x . Furthermore, to calculate λ m a x , the Normalization of the Geometric Mean (NGM) method can be employed to estimate the principal right Eigenvector ( w i ), with Equation (6) representing its largest Eigenvalue λ m a x
w i = j = 1 n a i j 1 n k n j = 1 n a k j 1 n
λ m a x = i = 1 n j = 1 n a i j × w i  
4.
Check the consistency of the pairwise comparisons, which is defined by the relationship between the values of the evaluation matrix A . The closeness between λ m a x and n can be used to measure the degree of inconsistency of the matrix A . The value of the consistency index ( C I ) is calculated as follows:
C I = λ m a x n / n 1
5.
Finally, the consistency ratio ( C R ) is derived via the following equation:
C R = C I / R I
where R I is the Random Index, which represents the average C I for randomly generated reciprocal matrices with a sample size of 500 and a dimension of n . The values of R I can be obtained from Table 2. The matrix is accepted and considered consistent if the C R value is less than or equal to 0.1 . However, if C R > 0.1 , the matrix is deemed unacceptable, indicating that the inconsistency is too large; therefore, the decision makers should revise their judgments.
6.
Based on GAHP, to incorporate the decision makers’ views into the main matrix, the formula for the geometric mean is calculated as follows:
y i j = l = 1 k x i j l 1 k   i , j = 1 , 2 , 3 n ,   i j   ,   l = 1 , 2 ,   3 k
where l is the number of decision makers, k is the total number of decision makers, and ( i ,   j ) are the criteria under comparison.

2.2. TOPSIS Method

TOPSIS, developed by Hwang and Yoon in 1981, has become a widely used MCDM technique [28]. It facilitates the selection of an alternative that is closest to the positive ideal solution and farthest from the most negative ideal solution by ranking alternatives. Therefore, it has been extensively used in transportation projects due to its sufficient comprehensibility for decision makers [27,29,30]. To apply this method, the following steps should be taken [30]:
  • The normalized decision matrix ( N ) should be constructed as follows:
    N i j = X i j j = 1 n X i j 2 ,                 i = 1 , 2 , , m ,             j = 1 , 2 , , n .
  • Then, the weighted normalized decision matrix ( V ) is calculated as follows:
    V i j = W i N i j ,         i = 1 , 2 , , m ,     j = 1 , 2 , , n .
    where W i is the weight of the i t h attribute or criterion ( i = 1 m W i = 1 ) .
  • The positive ideal solution A + and negative ideal solutions A are calculated as follows:
    A + = V 1 + , , V n + ,                       w h e r e     V j + = M a x i V i j                 j K M i n i ( V i j   )               j = K ´
    A = V 1 , , V n ,                 w h e r e     V j = M a x i V i j                   j K M i n i ( V i j   )                 j = K ´
    where i 1 , 2 , , n ,   j 1 , 2 , , n , K is related to the positive criteria, and K ´ is related to the negative criteria.
  • The separation measures can be calculated for each positive and negative ideal solution using the n-dimensional Euclidean distance as follows:
    d j + = i = 1 m ( V i j V i + ) 2 1 / 2 ,   j = 1 , , n .
    d j = i = 1 m ( V i j V i ) 2 1 / 2 ,   j = 1 , , n .
    where d j + ≥ 0 and d j ≥ 0.
  • The relative closeness to the ideal solution, A j with respect to A + is defined as follows:
    R j = d j d j + + d j ,         j = 1 , 2 , , n , R j 0 , 1
    Finally, the rank of the preference order of alternatives according to their relative closeness values ( R j ) is obtained for every alternative; the alternative that has a greater R j is better than the other alternatives.

2.3. The Entropy Method

The entropy method is particularly useful when there is a lack of clear information on the relative importance of the evaluation criteria. This approach analyzes the decision matrix of the alternative options to derive the appropriate weighting scheme.
The entropy method involves specifying the criteria, C = C 1 ,   C 2 , , C n , and then proposing all of the alternatives for the specific transportation problem, A = A 1 ,   A 2 , , A m . After that, it requires obtaining the original decision matrix D [31] as follows:
D = x 11 x 12 x 1 n x 21 x 22 x 2 n x n 1 x n 2 x m n
where x i j is the rating of the alternative ( A i with respect to the criterion C j ). The decision matrix is then normalized using the column vector normalization approach. The normalized decision matrix R = r i j   can be calculated as follows:
              r i j = x i j i = 1 m x i j ,   i = 1 , 2 , m ,       j = 1 , 2 , n
where m and n are the corresponding number of criteria and alternatives. Following this, forming the weighted column is performed W = w 1 ,   w 2 , , w n   , and the core concept of entropy in informatics is used to determine the weight of the criteria as follows:
        E i = 1 ln m i = 1 m r i j ln r i j   ,     j = 1 , 2 , , n
However, if r i j = 0 , then ln r i j = 0 . Also, H j = 1 E j , where H j represents the importance of the j t h criterion. For example, if r 1 j = r 2 j = … = r m j = 1 / m , then E j = 1 , and H j = 0. Then, the weight of the j t h criterion can be defined as follows:
w j = H j j = 1 n H j ,   j = 1 , 2 , , n
If the values for the j t h criterion are identical across all of the m alternatives, then that criterion is considered to be the least important, and its corresponding weight will be zero. As illustrated in Table 1 and Table 2, the results for the first and second scenarios were the same, but differed from the third scenario results. Overall, this sensitivity analysis demonstrates how the multi-criteria models’ outputs are varied based on the weighting approach considering multiple scenarios.
Additionally, a stated preference survey was incorporated into the questionnaire and served as a practical method for evaluating the robustness of the final rankings of the alternatives. The stated preference survey facilitates respondents in comparing different levels of criteria of various modes to complete the commute trips described earlier. The alternatives that are shown to the respondents include the modes that were suggested by the experts. The respondents have to choose one of the alternatives. The process of choosing amongst the alternatives involved four scenarios (each scenario involves varying the levels of criteria associated with the different alternatives).

3. Results and Discussion

3.1. The Survey

A questionnaire survey consisting of 15 questions was conducted in both Baghdad and Tehran. The survey captured the socioeconomic characteristics of the participants such as gender, age, educational attainment, monthly family income, and car ownership, as illustrated in Table 3. It also utilized Saaty’s scale, allowing the respondents to assign levels of importance to various criteria. Additionally, a stated preference survey was incorporated in the survey as a practical approach to validate the performance of the proposed model. Despite the challenges, a total of 550 responses from Baghdad and 345 responses from Tehran were collected, providing sufficient insights for this research.
The demographic characteristics of the participants in both cities adequately represent the populations of Baghdad [32] and Tehran [33]. In Baghdad, the results of a frequency analysis revealed that (45.2%) of the respondents were male, and (54.3%) were female, indicating a nearly even distribution. However, over half of the respondents (63%) were aged between 30 and 45 years. Additionally, nearly half of them held a master’s degree (43.8%), and the dominant level of income among the participants was medium (68.5%), with (32.4%) of the sample not owning a car.
In Tehran, the frequency analysis of the socioeconomic characteristics showed (67%) of the participants were male and (33%) were female. Also, over half of the participants (58.5%) were aged between 14 and 29 years. Furthermore, nearly half held a master’s degree (50.1%). The majority of the respondents reported high income levels (59.4%), with only (4.6%) of them not owning a car.
The sample of the questions included in the questionnaire survey is presented in Appendix A. The responses were collected over nearly four months using a random sampling technique through an online survey to reach as many participants as possible.

3.2. GAHP-TOPSIS Calculations

To identify the performance criteria and alternative transportation solutions, the following steps were undertaken: For identifying the performance criteria, prior research, as shown in Table 4, informed the process, along with experts’ inputs from two transportation professors—one from Tehran and the other from Baghdad—who contributed their expertise in identifying the most appropriate criteria. Additionally, a preliminary questionnaire survey was carried out in Baghdad and Tehran to inquire about the key attributes that individuals prioritize during their daily commutes. The primary survey received responses from (200) participants, and the percentage distribution of the results revealed that safety, travel time, and reliability were identified as the most crucial criteria by the participants during their travels. Thus, three key criteria were established to evaluate public transportation alternatives in this case study: safety, travel time, and reliability. These attributes significantly influence commuter behavior and satisfaction, as they directly impact personal safety, time management, and the predictability of transportation services. Correspondingly, three alternative transportation solutions—monorail, LRT, and metrobus—were identified based on prior research and were proposed by the two transportation professors as hypothetical case studies for the cities of Baghdad and Tehran. These modes were selected for evaluation as they were not currently implemented in the target cities. The aim was to investigate the impact of incorporating public preferences, as measured by the weights assigned to various transportation performance criteria, on the selection of the optimal alternative transportation solution to address the prevailing issues of severe traffic congestion and air pollution in these urban areas. This approach allowed for the assessment of transportation alternatives from the public’s perspective, which is crucial for informing the decision-making process and improving the alignment between transportation infrastructure investments and the needs and preferences of local communities.
The proposed holistic methodology was employed following the definition of the hierarchy model. First, the weights of the criteria were determined. A unique form of a questionnaire survey based on pairwise comparisons was designed and then incorporated into the GAHP decision tree as shown in Figure 3.
In this study, the GAHP method was employed to assign weights to the evaluation criteria for the public transportation system. The participants from Baghdad (550 total) and Tehran (345 total) were asked to provide pairwise comparisons of the criteria using Saaty’s 9-point scale to indicate their relative importance. Only the responses with a consistency ratio of less than 0.1 were considered for further analysis, resulting in 276 usable responses from Baghdad and 174 usable responses from Tehran after the filtration process.
The pairwise comparison matrices of the evaluation criteria were then established using the geometric means of these consistent participant responses from both cities. For Baghdad and Tehran, the pairwise comparison matrix is shown in Table 5.
The resulting weights of the criteria, as well as CI and CR, are presented in Table 6 for Baghdad and Tehran. These values were derived using the comparison matrices in Table 5.
The findings from the context of Baghdad indicate that the criteria assigned the highest weight by the participants were safety, followed by reliability, and travel time. This can be attributed to the high reliance on personal vehicles in the city, with increased car ownership due to the improved economic situation in recent years [4]. However, the transportation infrastructure in Baghdad is inadequate and unable to accommodate the growing number of vehicles [3]. This heavy dependence on personal vehicles has led to high rates of accidents, with road accidents in Iraq ranking as the seventh leading cause of death in 2019 [42,43]. This can be attributed to various factors, including insufficient transportation infrastructure, the lack of traffic law enforcement, inadequate signage and traffic furniture, the security situation, and poor driver performance [4,42].
The participants in Baghdad placed reliability as the second most important criterion, likely due to the severe traffic congestion in the city. This congestion has led to increased delays and unpredictable departure and arrival times for public transportation users. As a result, the reliability of the transportation system emerged as a key concern for the participants, underscoring the need to address the challenges posed by the worsening traffic situation in Baghdad. By establishing a safe and reliable transportation system in Baghdad, travel time can be effectively managed and reduced [44]. This would address the concerns expressed by the participants and contribute to the development of a more sustainable and efficient public transportation system in the city.
In contrast, the more-developed public transportation system in Tehran has already addressed the issues of safety and reliability [2], leading the people in this city to assign a higher weight to travel time as the primary concern during their travel.
The evaluation of the alternative transportation solutions was carried out with the involvement of a panel of expert assessors. In this phase of the study, 10 transportation experts were tasked with evaluating the three proposed alternatives (LRT, monorail, and metrobus) according to the established performance criteria. The expert panel consisted of two engineers from the municipality of Baghdad, each with more than 10 years of relevant experience, five university professors specializing in transportation and urban planning, and three transportation PhD candidates. The experts were instructed to use a 5-point Likert scale to assess the performance of each alternative against the defined criteria. The scale ranged from 1, indicating “very bad” performance, to 5, representing “very good” performance. The experts’ detailed evaluations were then compiled to construct the comparison matrix for the project options. Table 7 presents the consolidated results of the expert assessments for both the Baghdad and Tehran contexts, which formed the basis for the decision matrix representing the performance of the alternatives on each criterion in the two cities.
To rank the alternative solutions for both Baghdad and Tehran, the TOPSIS methodology was utilized. The results of the analysis are presented in Table 8 and Table 9, which show the weighted normalized decision matrix and the corresponding performance scores for each city, respectively. Table 8 illustrates the performance scores for Baghdad. The highest score was obtained by the LRT solution with a score of (0.721) followed by the monorail solution which achieved a score of (0.596). The metrobus solution had the lowest score of (0.078). Similarly, Table 9 shows the results for Tehran. The LRT alternative solution achieved (0.843), while the monorail and metrobus solutions obtained scores of (0.370) and (0.143), respectively.
Despite the varying importance assigned to each criterion between Baghdad and Tehran, the final ranking of the alternative transportation solutions proved to be the same for both cities. Specifically, LRT was ranked first, followed by monorail and then metrobus. However, the quantitative performance scores on the ranked alternatives differed between Baghdad and Tehran, even though the ranking order remained consistent. This difference can be attributed to the experts’ judgments used to construct the evaluation decision matrix.
A stated preference survey was incorporated into the questionnaire survey to validate the performance of the proposed model. The ranking of the alternative transportation solutions, determined using TOPSIS, was specifically corroborated by the results obtained from this stated preference survey component. The participants were asked to compare and choose between the three suggested alternatives (monorail, LRT, and metrobus) across four different scenarios, and each scenario involved varying levels of safety, travel time, and reliability criteria associated with the different alternatives as shown in Appendix A. The percentage distribution of the collected survey data showed that in Baghdad, 54.4% of the participants preferred the LRT option, followed by monorail at 27.5% and metrobus at 18.1%. In Tehran, the preference was even more pronounced, with 75.2% of the participants selecting the LRT alternative, 20.4% choosing the monorail, and only 4.4% preferring the metrobus. The close alignment between the results from the GAHP-TOPSIS technique and the stated preference survey lends strong credibility to the overall MCDM methodology employed in this study. This suggests that the weights derived using the 9-point Saaty scale in the GAHP method, as well as the ranking of alternatives using the TOPSIS technique, effectively and efficiently captured the preferences of the surveyed population.

3.3. Scenario Analysis

To assess the robustness of the findings, a comprehensive sensitivity analysis was conducted as part of the decision-making process. This analysis examined the impact of varying the relative weighting assigned to the evaluation criteria on the ranking of the alternative transportation solutions. Three distinct weighting scenarios were considered in the sensitivity analysis. The first scenario utilized the criteria weights derived from the original questionnaire survey, which were obtained using the GAHP method. In the second scenario, an equal weighting approach was adopted, where all the criteria were assigned the same level of importance. This allowed for the examination of how the ranking of alternatives would change under a more neutral set of criteria weights. Finally, the third scenario employed the entropy method to determine the criteria weights.
Table 10 presents the results of the sensitivity analysis. The rank reversal observed between the GAHP/equal weighting methods and the entropy method can be attributed to the entropy method’s sensitivity to the distribution and variability of performance scores. Specifically, the entropy method assigns greater weight to criteria with higher variability, which favored the monorail in this instance. Additionally, in this case, rank reversal occurs when transportation decisions rely solely on expert judgments, overlooking public preferences. This underscores the necessity of incorporating public perspectives into the transportation decision-making process.

4. Conclusions

This study effectively integrates public opinion into transportation planning in Baghdad and Tehran, representing a novel contribution to the field by emphasizing the inclusion of public perspectives in transportation decision making, particularly within the context of developing countries’ infrastructure. Through the use of a comprehensive questionnaire survey, statistical analysis, and MCDM methods, the proposed methodology leverages the strengths of GAHP and TOPSIS to offer valuable guidance for future transportation investments.
The insights gained from this study provide decision makers with a framework to account for public preferences in their planning processes, enhancing the relevance and effectiveness of transportation solutions. By identifying the most favored mode of public transport based on public opinions, this work paves the way for improvements in customer satisfaction and encourages policymakers to actively consider community input in shaping the future of transportation infrastructure. The following points are considered as the main study findings:
(1)
The usage of the GAHP-TOPSIS approach to rank alternatives based on public preferences ensured the evaluations and ranking, and reflected the viewpoints of transportation system users.
(2)
The results showed that criteria weights and alternative ranking differ between cities regarding weights and performance scores.
(3)
In Baghdad, safety was most important, and the top-ranked alternative was LRT, followed by monorail, and lastly metrobus.
(4)
In Tehran, travel time was most important, and the top-ranked alternatives were LRT, followed by monorail, and lastly metrobus.
The primary limitation of this study was the restricted number of evaluation criteria assessed. This limitation was intentionally implemented to enhance comprehension for first-time public participants. Additionally, the three suggested transportation modes were the only options not currently implemented in either Baghdad or Tehran. Future research could examine additional performance criteria to provide a more comprehensive evaluation. Considering more than three alternative transportation solutions may provide additional options for comparison. Future research could also explore the application of the Extended AROMAN method to compare the rankings of the alternatives obtained from the TOPSIS and AROMAN techniques. Additionally, future research could utilize Geographic Information System (GIS) to determine the optimal routes for implementing the proposed transportation alternatives. Finally, expanding the study to include more cities would enhance the generalizability of the conclusions.

Author Contributions

Conceptualization, R.D.; software, R.D.; validation, R.G.K.; formal analysis, R.D.; investigation, R.D.; resources, A.T.K.; data curation, R.D.; writing—original draft, R.D.; writing—review and editing, R.G.K. and A.T.K.; supervision, R.G.K. and A.T.K. All authors have read and agreed to the published version of the manuscript.

Funding

The authors received no financial support for the research, authorship, and/or publication of this article.

Data Availability Statement

The authors stated no potential conflicts of interest with respect to the research, authorship, and/or publication of this article.

Conflicts of Interest

The authors declare no conflict of interest.

Appendix A. The Questionnaire Survey

We appreciate your participation in this survey. This survey aims to understand your preferences regarding public transportation. Your responses will assist guide future transportation planning and decision-making.
In this survey, we have identified three key criteria that impact your daily commute including safety, travel time, and reliability. We aim to identify your preferences on the relative importance of these criteria. Your input will provide valuable insights to help transportation decision-makers in identifying the most preferred transportation solution that best meet the needs of commuters like yourself.
The responses will be kept anonymous, and The information you will provide cannot be linked to a certain person as we are not gathering any personal identifiable information.
  • Q1/what is your gender?
    Male
    Female
  • Q2/what is your age?
    14–29
    30–45
    >45
  • Q3/what is your educational attainment?
    Elementary school diploma
    Secondary school diploma
    High school diploma
    Bachelor
    Master’s
    PhD
  • Q4/How much is your monthly family income?
    -
    For citizens in Baghdad
    <229$
    229$–485$
    >485$
    -
    For citizens in Tehran
    <120$
    120–360$
    >360$
  • Q5/Do you own a private vehicle?
    Yes
    No
  • Q6/which of the following transportation attributes do you consider to be the most important during your daily commute?
    Safety during travel
    Travel time (In-vehicle travel time)
  • Q7/Based on your previous answer, how important do you consider the transportation attribute you chose in comparison to the others?
    Equal importance
    Slightly more important
    Moderately more important
    Strongly more important
    Extremely more important
  • Q8/which of the following transportation attributes do you consider to be the most important during your daily commute?
    Safety during travel
    Reliability (The punctuality of arrival and departure times, as well as the consistent frequency of service provided).
  • Q9/Based on your previous answer, how important do you consider the transportation attribute you chose in comparison to the others?
    Equal importance
    Slightly more important
    Moderately more important
    Strongly more important
    Extremely more important
  • Q10/which of the following transportation attributes do you consider to be the most important during your daily commute?
    Travel time (In-vehicle travel time)
    Reliability (The punctuality of arrival and departure times, as well as the consistent frequency of service provided).
  • Q11/Based on your previous answer, how important do you consider the transportation attribute you chose in comparison to the others?
    Equal importance
    Slightly more important
    Moderately more important
    Strongly more important
    Extremely more important
  • Q12/If you are on your way to (school, university, work), which of the following modes of transportation do you prefer to use?
    Metrobus, which take around 58 min to reach your destination. These buses provide a moderate level of safety and average punctuality in terms of arrival and departure times.
    LRT, it takes approximately 55 min to reach your destination. The LRT system offers a high level of safety and excellent punctuality in terms of arrival and departure times.
    The suspended train (monorail), it takes approximately 60 min to reach your destination. The monorail system offers a high level of safety and excellent punctuality in terms of arrival and departure times.
  • Q13/If you are on your way to (school, university, work), which of the following modes of transportation do you prefer to use?
    Metrobus, they take approximately 58 min to reach your destination. These buses provide a low level of safety and have low punctuality in terms of their schedules.
    LRT, it takes approximately 55 min to reach your destination. The LRT system offers a medium level of safety and excellent punctuality in terms of arrival and departure times.
    The suspended train (monorail), it takes approximately 60 min to reach your destination. The monorail system offers a high level of safety and average punctuality in terms of arrival and departure times.
  • Q14/If you are on your way to (school, university, work), which of the following modes of transportation do you prefer to use?
    Metrobus, they take approximately 38 min to reach your destination. These buses provide a medium level of safety and have average punctuality in terms of their schedules.
    LRT, it takes approximately 32 min to reach your destination. The LRT system offers a high level of safety and excellent punctuality in terms of arrival and departure times.
    The suspended train (monorail), it takes approximately 46 min to reach your destination. The monorail system offers a high level of safety and excellent punctuality in terms of arrival and departure times.
  • Q15/If you are on your way to (school, university, work), which of the following modes of transportation do you prefer to use?
    Metrobus, they take approximately 38 min to reach your destination. These buses provide a low level of safety and have low punctuality in terms of their schedules.
    LRT, it takes approximately 32 min to reach your destination. The LRT system offers a medium level of safety and excellent punctuality in terms of arrival and departure times.
    The suspended train (monorail), it takes approximately 46 min to reach your destination. The monorail system offers a high level of safety and average punctuality in terms of arrival and departure times.

References

  1. Sinha, K.C.; Labi, S. Transportation Decision Making Principles of Project Evaluation and Programming; John Wiley & Sons, Inc.: Hoboken, NJ, USA, 2007. [Google Scholar]
  2. Alizadeh, H.; Sharifi, A. Analyzing Urban Travel Behavior Components in Tehran Iran. Future Transp. 2023, 3, 236–253. [Google Scholar] [CrossRef]
  3. Alrawi, F. The importance of intelligent transport systems in the preservation of invironment. Transp. Res. Procedia 2017, 24, 197–203. [Google Scholar] [CrossRef]
  4. Feghoul, M.D.E. Joint Iraq Needs Assessment Working Paper—Transport and Telecommunications. 2003. Available online: https://documents1.worldbank.org/curated/en/145971468253197373/pdf/315470IQ0TRANSPORT010TELECOM01public1.pdf (accessed on 1 August 2024).
  5. EASO. EASO Country of Origin Information Report—IRAQ: Internal Mobility; European Asylum Support Office (EASO): Valletta, Malta, 2019. [Google Scholar]
  6. Nassereddinea, M.; Eskandarib, H. An integrated MCDM approach to evaluate public transportation systems in Tehran. Transp. Res. Part A 2017, 106, 427–439. [Google Scholar] [CrossRef]
  7. Deluka-Tibljaš, A.; Karleuša, B.; Dragičević, N. Review of Multicriteria analysis methods. GRAĐEVINAR 2017, 65, 619–631. [Google Scholar]
  8. Macharis, C.; Bernardini, A. Reviewing the use of Multi Criteria Decision Analysis for the evaluation of transport projects Time for a multi actor approach. Transp. Policy 2015, 37, 177–186. [Google Scholar] [CrossRef]
  9. Yannis, G.; Kopsacheili, A.; Dragomanovits, A. State of the art review on multi criteria decision making in the transport sector. J. Traffic Transp. Eng. 2020, 7, 413–431. [Google Scholar] [CrossRef]
  10. Bilotto, C.M.; Allen, S.; Biggs, D.; Moore, W.J. Public Engagement in Transportation Decision Making. Transportation Research Board: Washington, DC, USA, 2019. [Google Scholar]
  11. Krmac, E.; Djordjević, B. A multi criteria assessment tool for the evaluation of sustainable railway restructuring models. In The Analytic Hierarchy Process: Advances in Research and Applications; Daniel, R., Ed.; Nova Science Publishers, Inc.: Hauppauge, NY, USA, 2018. [Google Scholar]
  12. Hamurcu, M.; Eren, T. An Application of Multicriteria Decision-making for the Evaluation of Alternative Monorail Routes. Mathematics 2019, 7, 16. [Google Scholar] [CrossRef]
  13. Katarzyna Nosala, K.S. Application of AHP method for multi criteria evaluation of variants of the integration of urban public transport. Transp. Res. Procedia 2014, 3, 269–278. [Google Scholar] [CrossRef]
  14. Lambas, M.E.L.; Giuffrida, N.; Ignaccolo, M.; Inturri, G. Comparison Between Bus Rapid Transit and Light-Rail Transit Systems: A Multi-Criteria Decision Analysis Approach. WIT Trans. Built Environ. 2017, 176, 143. [Google Scholar] [CrossRef]
  15. Jain, S.; Aggarwal, P.; Prashant Kumar, S.S.; Sharma, P. Identifying public preferences using multi criteria decision making for assessing the shift of urban commuters from private to public transport a case study of Delhi. Transp. Res. Part F 2014, 2014, 60–70. [Google Scholar] [CrossRef]
  16. Moslem, S.; Ghorbanzadeh, O.; Blaschke, T.; Duleba, S. Analysing Stakeholder Consensus for a Sustainable Transport Development Decision by the Fuzzy AHP and Interval AHP. Sustainability 2019, 11, 3271. [Google Scholar] [CrossRef]
  17. Ghorbanzadeh, O.; Moslem, S.; Blaschke, T.; Duleba, S. Sustainable Urban Transport Planning Considering Different Stakeholder Groups by an Interval-AHP Decision Support Model. Sustainability 2019, 11, 9. [Google Scholar] [CrossRef]
  18. Duleba, S.; Mishina, T.; Shimazaki, Y. A Dynamic Analysis on Public Bus Transports Supply Quality by Using AHP. Transport 2012, 27, 268–275. [Google Scholar] [CrossRef]
  19. Ignaccoloa, M.; Inturria, G.; García-Melónb, M.; Nadia Giuffridaa, M.L.P.; Torrisia, V. Combining Analytic Hierarchy Process AHP with role playing games for stakeholder engagement in complex transport decisions. Transp. Res. Procedia 2017, 27, 500–507. [Google Scholar] [CrossRef]
  20. Lee, E.H.; Lee, H.; Kho, S.-Y.; Kim, D.-K. Evaluation of Transfer Efficiency between Bus and Subway based on Data Envelopment Analysis using Smart Card Data. KSCE J. Civ. Eng. 2018, 23, 788–799. [Google Scholar] [CrossRef]
  21. Lee, E.H.; Jeong, J. Assessing equity of vertical transport system installation in subway stations for mobility handicapped using data envelopment analysis. J. Public Transp. 2023, 25, 100074. [Google Scholar] [CrossRef]
  22. Lee, C.; Lee, E.H. Evaluation of urban nightlife attractiveness for Millennials and Generation, Z. Cities 2024, 149, 104934. [Google Scholar] [CrossRef]
  23. Fatih Yildlzhan, M.K. Monorail system feasibility study for.developing countries: The case study of.Eskişehir-Turkey. Politek. Dergisi. J. Polytech. 2022, 25, 775–783. [Google Scholar] [CrossRef]
  24. Ayaz, R.; Nakir, İ.; Durusu, A.; Akca, H.; Tanrioven, M. Tanrioven. A Comparison of Metrobus System and Trolleybus System Considering Energy Costs and CO2 Emission: A Case Study for Istanbul. In Proceedings of the SET2011, 10th International Conference on Sustainable Energy Technologies, Istanbul, Turkey, 4–7 September 2011. [Google Scholar]
  25. Abdel-Basset, M.; Manogaran, G.; Gamal, A.; Smarandache, F. A Group Decision Making Framework Based on Neutrosophic TOPSIS Approach for Smart Medical Device Selection. J. Med. Syst. 2019, 43, 38. [Google Scholar] [CrossRef]
  26. Haghighat, F. Application of a multicriteria approach to road safety evaluation in the Bushehr province Iran. Promet Traffic Transp. 2011, 23, 341–352. [Google Scholar]
  27. Broniewicz, E.; Ogrodnik, K. A Comparative Evaluation of Multi-Criteria Analysis Methods for Sustainable Transport. Energies 2021, 14, 5100. [Google Scholar] [CrossRef]
  28. Hao, N.; Feng, Y.; Zhang, K.; Tian, G.; Zhang, L.; Jia, H. Evaluation of traffic congestion degree: An integrated approach. Int. J. Distrib. Sens. Netw. 2017, 13, 1550147717723163. [Google Scholar] [CrossRef]
  29. Behzadian, M.; Otaghsara, S.K.; Yazdani, M.; Ignatius, J. A state-of the-art survey of TOPSIS applications. Expert Syst. Appl. 2012, 39, 13051–13069. [Google Scholar] [CrossRef]
  30. Marchetti, D.; Wanke, P. Efficiency of the rail sections in Brazilian railway system, using TOPSIS and a genetic algorithm to analyse optimized scenarios. Transp. Res. Part E Logist. Transp. Rev. 2020, 135, 101858. [Google Scholar] [CrossRef]
  31. Wu, X.; Zhang, C.; Yang, L. Evaluation and selection of transportation service provider by TOPSIS method with entropy weight. Therm. Sci. 2021, 25, 1483–1488. [Google Scholar] [CrossRef]
  32. EASO. Iraq Key Socio-Economic Indicators; European Asylum Support Office (EASO): Valletta, Malta, 2020. [Google Scholar]
  33. Aboutorabi Kashani, M.; Abbasi, M.; Mamdoohi, A.R.; Sierpiński, G. The Role of Attitude, Travel-Related, and Socioeconomic Characteristics in Modal Shift to Shared Autonomous Vehicles with Ride Sharing. World Electr. Veh. J. 2023, 14, 23. [Google Scholar] [CrossRef]
  34. Duleba, S.; Blahota, I. Determining optimal group weights for consensus creation in AHP for three conflicting stakeholder groups by vector distance minimization. J. Oper. Res. Soc. 2021, 2021, 1633–1648. [Google Scholar] [CrossRef]
  35. Salavati, A.; E Nunes Da Silva, F.J.S.; Haghshenas, H. Comparing Public Transport Alternatives using AHP and TOPSIS in asfahan. Int. J. Transp. Eng. 2019, 8, 85–105. [Google Scholar]
  36. Koohathongsumrit, N.; Meethom, W. Route selection in multimodal transportation networks:a hybrid multiple criteria decision making approach. J. Ind. Prod. Eng. 2021, 38, 171–185. [Google Scholar] [CrossRef]
  37. Gompf, K.; Traverso, M.; Hetterich, J. Using Analytical Hierarchy Process (AHP) to Introduce Weights to Social Life Cycle Assessment of Mobility Services. Sustainability 2021, 13, 1258. [Google Scholar] [CrossRef]
  38. Alkharabsheh, A.; Moslem, S.; Oubahman, L.; Duleba, S. An Integrated Approach of Multi-Criteria Decision-Making and Grey Theory for Evaluating Urban Public Transportation Systems. Sustainability 2021, 13, 2740. [Google Scholar] [CrossRef]
  39. Ramani, T.L.; Quadrifoglio, L.; Zietsman, J. Accounting for Nonlinearity in the MCDM Approach for a Transportation Planning Application. IEEE Trans. Eng. Manag. 2010, 57, 702–711. [Google Scholar] [CrossRef]
  40. Cadena, P.C.B.; Magro, J.M.V. Setting the Weights of Sustainability Criteria for the Appraisal of Transport Projects. Transport 2015, 30, 298–306. [Google Scholar] [CrossRef]
  41. Sirikijpanichkul, A.; Winyoopadit, S.; Jenpanitsub, A. A multi actor multi criteria transit system selection model a case study of Bangkok feeder system. Transp. Res. Procedia 2017, 25C, 3740–3759. [Google Scholar] [CrossRef]
  42. Aldhalemi, A.; Abidi, F. Evaluation of the Iraqi Road Safety System in Light of Crash Severity Indicators. In Proceedings of the 2nd International Multi-Disciplinary Conference Theme: Integrated Sciences and Technologies, IMDC-IST 2021, Sakarya, Turkey, 7–9 September 2021. [Google Scholar]
  43. Albayati, A.H.; Lateef, I.M. Characteristics of Traffic Accidents in Baghdad. Civ. Eng. J. 2019, 5, 940–949. [Google Scholar] [CrossRef]
  44. Mahawi, H.A.; Abduljabbar, A.S. Reliability of travel time for Abi Talep urban arterial street in Baghdad city-Iraq. In Proceedings of the 3rd International Conference on Smart Cities and Sustainable Planning, Baghdad, Iraq, 26–27 April 2022. [Google Scholar]
Figure 2. The proposed methodology (created by authors employing [25]).
Infrastructures 09 00151 g002
Figure 3. Hierarchy structure of the proposed decision model.
Infrastructures 09 00151 g003
Table 1. Ratios for pairwise comparison matrix.
ComparisonsX/Y Ratio
Criterion X is extremely more important than criterion Y9
Criterion X is strongly more important than criterion Y7
Criterion X is moderately more important than criterion Y5
Criterion X is slightly more important than criterion Y3
Criterion X is equally important to criterion Y1
Criterion X is slightly less important than criterion Y1/3
Criterion X is moderately less important than criterion Y1/5
Criterion X is strongly less important than criterion Y1/7
Criterion X is extremely less important than criterion Y1/9
Table 2. Relationship between Matrix Order and Average Random Index [1].
Matrix Size (n) 1 2 3 4 5 67 8 9 10
RI 0   0 0.85   0.9 1.12 1.24 1.32   1.41   1.45 1.49
Table 3. Characteristics of participants in Baghdad and Tehran.
QuestionOptionsBaghdadTehran
ObservedFrequency (%)ObservedFrequency (%)
GenderMale25145.223167
Female30454.811433
Age (years)14–2913624.520258.5
30–453506312135.1
+456912.4226.4
DegreePrimary183.2308.6
Bachelor22440.417350.1
Master’s24343.812135.1
PhD7012.6216.1
Income (USD)Low11620.9226.4
Medium38068.511834.1
High5910.620559.4
Car OwnershipYes37567.632995.4
No18032.4164.6
Table 4. Detailed description of the selected performance criteria.
DimensionCriteriaDefinitionIndicatorReferences
SocialSafetySafety refers to protection from unintentional harm or accidents
  • Lesser accident
  • Personal safety
Nosal [13], Lambas [14], Jain [15], Moslem [16], Duleba [34], Salavati [35], Koohathongsumrit [36], Gompf [37], Alkharabsheh [38]
EconomicTravel TimeExpected travel time to reach the destination (measured
in Minutes)
  • Less travel time
Ramani [39], Nosal [13], Jain [15], Moslem [16], Duleba [34], Ignaccolo [19], Cadena [40], Alkharabsheh [38]
ServiceReliabilityThe reliability of a transport system refers to the consistency and dependability of the transportation services and infrastructure in consistently meeting user expectations and needs
  • Good frequency
  • On-time arrivals
  • Adherence to schedule
Sirikijpanichkula [41], Jain [15], Moslem [16], Duleba [34], Salavati [35], Alkharabsheh [38]
Table 5. Pairwise comparison matrix for criteria derived from GAHP for Baghdad and Tehran.
CityCriteriaSafetyTravel TimeReliability
BaghdadSafety11.2711.050
Travel Time0.78710.751
Reliability0.9521.3321
TehranSafety10.4270.450
Travel Time2.34211.25
Reliability2.2220.81
Table 6. Results derived from GAHP for Baghdad and Tehran.
CityCriterionWeightIndexes
BaghdadSafety0.364 λ m a x = 3.000
CI = 0.000
For n = 3, RI = 0.58
CR = 0.000
Travel time0.278
Reliability0.358
TehranSafety0.180 λ m a x = 3.004
CI = 0.002
For n = 3, RI = 0.58
CR = 0.003
Travel time0.444
Reliability0.375
Table 7. Evaluation matrix.
CriteriaSafetyTravel TimeReliability
Max/MinMaxMaxMax
Weight (Baghdad)0.3640.2780.358
Weight (Tehran)0.1800.4440.375
Monorail3.8672.4333.022
LRT3.4552.8933.546
Metrobus2.8212.5462.862
Table 8. TOPSIS for Baghdad.
CriteriaSafetyTravel TimeReliability d j + d j R j Ranking of Alternatives
Monorail0.2380.1480.1980.0440.0650.5962
LRT0.2130.1760.2320.0250.0660.7211
Metrobus0.1740.1550.1870.0810.0070.0783
V j + 0.2380.1760.232
V j 0.1740.1480.187
Table 9. TOPSIS for Tehran.
CriteriaSafetyTravel TimeReliability d j + d j R j Ranking of Alternatives
Monorail0.1180.2370.2070.0570.0340.3702
LRT0.1050.2820.2430.0130.0680.8431
Metrobus0.0860.2480.1960.0660.0110.1433
V j + 0.11790.2820.243
V j 0.0860.2370.196
Table 10. Scenario analysis.
CitiesBaghdadTehranBaghdad and TehranBaghdad and Tehran
AlternativePerformance Score
(GAHP)
Performance Score
(GAHP)
Rank
for Both Cities
Performance Score
(Equal Weighting)
Rank
for Both Cities
Performance Score (Entropy Method)Rank
for Both Cities
Monorail0.5960.37020.56320.7851
LRT0.7210.84310.73510.6182
Metrobus0.0780.14330.10130.0443
Disclaimer/Publisher’s Note: The statements, opinions and data contained in all publications are solely those of the individual author(s) and contributor(s) and not of MDPI and/or the editor(s). MDPI and/or the editor(s) disclaim responsibility for any injury to people or property resulting from any ideas, methods, instructions or products referred to in the content.

