Article

Effect of the Particle Size Distribution of the Ballast on the Lateral Resistance of Continuously Welded Rail Tracks

by
Jafar Chalabii
1,2,
Morteza Esmaeili
3,
Dániel Gosztola
1,2,
Szabolcs Fischer
1,2,* and
Majid Movahedi Rad
1,2,*
1
Central Campus Győr, Széchenyi István University, 9026 Győr, Hungary
2
Vehicle Industry Research Center, Széchenyi István University, 9026 Győr, Hungary
3
School of Railway Engineering, Iran University of Science and Technology, Tehran 16846, Iran
*
Authors to whom correspondence should be addressed.
Infrastructures 2024, 9(8), 129; https://doi.org/10.3390/infrastructures9080129
Submission received: 14 June 2024 / Revised: 27 July 2024 / Accepted: 30 July 2024 / Published: 6 August 2024

Abstract

:
While the effect of ballast degradation on lateral resistance is noteworthy, limited research has delved into the specific aspect of ballast breakage in this context. This study is dedicated to assessing the influence of breakage on sleeper lateral resistance. For simplicity, it is assumed that ballast breakage has already occurred. Accordingly, nine granularity variations finer than No. 24 were chosen for simulation, with No. 24 as the assumed initial particle size distribution. Initially, a DEM model was validated for this purpose using experimental outcomes. Subsequently, employing this model, the lateral resistance of different particle size distributions was examined for a 3.5 mm displacement. The track was replaced by a reinforced concrete sleeper in the models, and no rails or rail fasteners were considered. The sleeper had a simplified model with clumps, the type of which was the so-called B70 and was applied in Western Europe. The sleeper was taken into consideration as a rigid body. The crushed stone ballast was considered as spherical grains with the addition that they were divided into fractions (sieves) in weight proportions (based on the particle distribution curve) and randomly generated in the 3D model. The complete 3D model was a 4.84 × 0.6 × 0.57 m trapezoidal prism with the sleeper at the longitudinal axis centered and at the top of the model. Compaction was performed with gravity and slope walls, with the latter being deleted before running the simulation. During the simulation, the sleeper was moved horizontally parallel to its longitudinal axis and laterally up to 3.5 mm in static load in the compacted ballast. The study successfully established a relationship between lateral resistance and ballast breakage. The current study’s findings indicate that lateral resistance decreases as ballast breakage increases. Moreover, it was observed that the rate of lateral resistance decrease becomes zero when the ballast breakage index reaches 0.6.

1. Introduction

Rail transport [1,2,3,4] is one of the most important modes of land transport [5,6]—with ups and downs since the mid-1800s. During this period, industrial revolutions, economic crises and booms, together with earnings and energy prices, have had a major impact on the priority given to rail transport. Currently, it can be competitive for transport distances of around 500–1000 km.
The two main superstructure types for railway tracks are the traditional crushed stone ballasted solution [7,8] and the more modern and more expensive ballastless solution [9]. The life cycle costs are significantly lower for the ballastless superstructure; this is reflected in both the geometric and structural deterioration rates of the track [9]. The rate of degradation and the resulting collateral effects [which are often interdependent, interacting back and forth—such as vibrations, noise effects (squeaking, impact noises, etc.), impact–impulse-like forces and stresses, etc.]—can in many cases be reduced by special vibration damping elastomers or other structural layers or elements [10,11]. Of course, the circular behavior of the deterioration law (which is dematerialized in reality through the vehicle–superstructure–substructure–subsoil–substructure—superstructure–vehicle elements) can be influenced by other effects and structural characteristics, e.g., the quality and goodness of rail welds [12,13] or fishplated rail joints [14] (hardness–wear characteristics–rail-end deflection–rail-end plastic deformation, etc.). At the moment, it seems too far away, but hopefully in the future, civil engineers will be able to track and possibly predict track degradation, even with digital twins [15] or DIC technique [16], which could be useful in the field of transport planning and management.
In the current article, from the two types of railway track systems (with conventional fishplated rail joints track and CWR), the CWR tracks are discussed and analyzed. For this type, track buckling is the critical structural stability loss mode (but of course this can also be of interest for long-rail tracks with fishplated rail joints above the closure rail temperature). To compensate for the buckling, adequate and enough lateral ballast resistance, track frame stiffness in the horizontal plane, etc. are required. In this article, the topic of the phenomenon of horizontal track buckling is analyzed in detail considering different ballast gradations.
Railway track buckling, a menacing threat to the railway system, is akin to a silent predator lurking within the network [17,18,19]. Triggered by temperature fluctuations, it disrupts the smooth flow of travel, risking safety and punctuality. To counter this menace, a comprehensive approach involving vigilance, innovative engineering, and technological advancements is imperative to safeguard the integrity of the railway system. The elevated summer temperatures worldwide and the growing threat of track buckling globally have raised significant concerns regarding railway track stability [18]. The escalation of global temperatures can lead to elevated rail temperatures and the accumulation of compressive forces within the continuous welded rail (CWR) infrastructure. While continuous welded rail (CWR) offers a smooth ride and entails lower maintenance costs, it has drawbacks. Specifically, the track is prone to buckling when the rail temperature surpasses a certain threshold. Numerous research studies have consistently identified track buckling as a significant contributing factor to train derailments, resulting in substantial human and material losses [20,21]. Research findings indicate that the components of the track system demonstrating resistance to rail buckling include the sleeper and the supporting ballast. Lateral ballast resistance serves the dual purpose of mitigating track buckling and preserving the lateral alignment of the track, thereby contributing to the generation of lateral forces within the rails. The paramount role in counteracting buckling forces during rail expansion is attributed to ballast offering lateral resistance. As previously mentioned, the distribution of lateral resistance is characterized by a proportion of 65% for ballast, 25% for rails, and 10% for fasteners in the overall composition [22].
Fang et al. [23] review the importance of wheel–rail contact in rail transportation, highlighting its role in supporting, traction, braking, and steering of vehicles. They discuss advancements in contact mechanics and tribology, including normal and tangential contact modeling, and the impact of environmental factors like water and sand. They also review empirical adhesion models, such as WILAC- and EHL-based models (Greenwood–Tripp and Greenwood–Williamson). The study emphasizes the need for advanced models and identifies challenges and research areas to enhance railway safety and performance. As demonstrated both in the United Kingdom and on a global scale, instances of railway track buckling persist even when the tracks receive comprehensive support, and visual inspections suggest that the ballast layer is in satisfactory condition. Indeed, the deterioration of ballast particles and the accretion of ballast degradation or external contaminants, such as subgrade intrusion or coal dust, are frequently imperceptible through visual inspection [24,25]. Currently, there are no quantifiable data regarding the impact of degraded ballast on the lateral stiffness of ballasted tracks and the percentage by which fine particles generated in fouled ballast would diminish lateral support through direct contact with the sleeper. Consequently, there is an imperative need to conduct a comprehensive study to quantify the influence of progressive ballast degradation on lateral resistance. This study should systematically account for the contributions of various frictional components within a ballasted track.
Based on prior research on track buckling simulations utilizing the Finite Element Method (FEM) [26,27,28], railway tracks have commonly been represented through a framework involving interconnected beams and springs to emulate the various track components. Nonlinear tensionless springs within the ballast have been employed at the extremities of sleepers to simulate the behavior exhibited by the ballast material accurately. Incorporating the elastoplastic curve for lateral resistance has been implemented within the model framework for track buckling simulations. The characteristics of the lateral springs within the ballast linked to sleepers are determined based on the contact force between the sleeper and the ballast, as well as the displacement of the sleeper under lateral loading conditions obtained from Single Sleeper (Tie) Push Tests (STPTs) [29,30]. The technique has demonstrated itself as the most appropriate approach endorsed by AREMA (American Railway Engineering and Maintenance-of-Way Association) for assessing track lateral resistance [31]. Considerable investigation has been carried out on the Single Sleeper (Tie) Push Tests (STPTs) on sleepers to derive the displacement curve indicative of lateral resistance for ballasted tracks.
This approach facilitates the assessment of the lateral resistance occurring within the interaction of sleepers and ballast. In the process of modeling the Single Sleeper (Tie) Push Tests (STPTs), scholars regarded the ballast layer as a continuum model, depicted as a uniform material composed of interconnected minute elements [32]. Three-dimensional Finite Element Method (FEM) models were created to represent sleepers embedded within a uniform ballast medium [32,33]. Subsequently, the friction coefficient between the sleeper and ballast was altered to investigate the lateral resistance exhibited within the ballasted track. The findings exhibited consistent and plausible patterns. Nonetheless, certain modeling elements, including assumptions regarding friction and boundary conditions, in prior studies were frequently based on specific presumptions, thereby casting doubt on the reliability of the results. Primarily, considering the particulate nature of a ballast layer assembly comprising aggregate particles, each typically measuring approximately 40–75 mm [34] in size, it is crucial to acknowledge that treating railway ballast as a continuum is not realistic. A more realistic numerical simulation approach that has gained widespread adoption for simulating the load-deformation behavior of ballast layer granular materials is the Discrete Element Method (DEM). The initial application of DEM for granular material was primarily focused on rock and soil particles [35]. This method involves a numerical approach aimed at computing the deformations of individual particles within a granular assembly while considering their interactions. By employing DEM, it becomes possible to gain a deeper understanding of the micro-mechanical behavior exhibited by railway ballast. Recent research endeavors have proposed various DEM approaches to examine the lateral resistance of ballasted tracks. These studies have involved simulations resembling STPTs and have explored diverse types of discrete ballast particles [36,37,38,39,40].
Passionately, the resilience of ballasted tracks, adorned with the rhythmic pulse of trains, ebbs away over time, succumbing to the relentless embrace of degradation, relentless maintenance, and the unruly upheaval of ballast. However, amidst this dance of weariness, hope gleams on the horizon through various methods that could breathe life back into its lateral strength. Among these, the mere alteration of sleeper shapes [37,41] or the adhesive embrace of ballast [42] present themselves as potential saviors. Even the reinforcement of ballast [43] and the devoted care in track maintenance or renewal promise to resurrect their lateral resistance. Pioneering studies have delved into the impact of ballast particle shapes and the tender caress of tamping activities [44] on the stability of these tracks. It has been revealed that tamping activities wield a considerable influence, loosening the once-compacted ballast layers and influencing their lateral fortitude. An undeniable truth emerges from these studies—the angular defiance of ballast particles surpasses the resilience of their rounded counterparts. The very essence of ballast degradation is intimately linked to the origin of crushed stone aggregates and their elemental morphologies [45]. Over time, the shapes of deteriorated ballast particles shift, adopting a more rounded guise devoid of their former sharpness. Such transformations bear dire consequences, as round gravel ballast imposes a hefty toll, diminishing the lateral resistance by 30–35% [46]. Each rounded particle whispers of the track’s fading strength, urging for a revival of their angular might.
Also, in 2022, Chalabii et al. [47] investigated the impact of sleeper shape on the lateral resistance of ballasted tracks using discrete element modeling (DEM). The study validated the model with experimental data and analyzed the sensitivity on different sleeper contact areas. The research resulted in a precise regression equation linking various sleeper contact areas to maximum lateral resistance, highlighting the sleeper’s head area’s significant influence on lateral resistance compared to other areas.
The usage-induced degradation of railway tracks necessitates continuous improvements in ballasted track infrastructure. The absence of adequate ballast support poses a significant risk to the overall capacity of railway tracks [48,49]. For instance, visible voids and gaps often occur between sleepers and the ballast in poorly maintained tracks, primarily attributed to saturated track beds (highly moist ground) resulting from natural water sources or inadequate drainage systems. Ballasted tracks’ strength and drainage capabilities become compromised due to increased ballast fouling. Consequently, this leads to more significant particle displacement, exacerbating the loss of support conditions. A previous study demonstrated that fouled ballast could diminish the lateral resistance of tracks by integrating fouled particles into voids [50]. The degree of fouling was assessed by measuring the ratio between the volume of fouled ballast and the volume of voids, wherein fouled particles were randomly deposited. However, this study focused solely on the lateral resistance of ballasted tracks at specific instances of fouling and time. Given the uncertainties regarding the extent to which progressive ballast degradation and fouling diminish lateral resistance in ballasted tracks, the research described in this paper aims to quantitatively evaluate the primary contributions of the frictional components of a sleeper concerning track lateral resistance. This will be accomplished through a realistic DEM modeling approach, specifically targeting ballast behavior.
After conducting a comprehensive review of technical literature, it became evident that despite the importance of ballast breakage’s effect on the sleeper lateral resistance, limited studies have been conducted so far. Therefore, the primary objective of the current research is to adequately address the question of the relationship between ballast breakage and the lateral resistance of the standard concrete sleeper, B70 type. Therefore, as the first step, a DEM model was validated in the PFC3D [51] environment, utilizing previously conducted experimental data from STPTs [23]. Notably, the DEM method was chosen for simulation in this study primarily because it allows for considering granular material behavior. This preference is made despite the limitations of other methods, such as simulation in Abaqus, which cannot assess granular behavior. In the investigation of ballast breakage, the assumption was made that breakage had occurred beforehand, and the study focused on examining ballast particles post-breakage. Consequently, a sensitivity analysis was carried out on 10 variations of particle size distribution (PSD), each finer than the No. 24. Ultimately, the effect of ballast breakage on sleeper lateral resistance was investigated, and a correlation between the two was proposed.

2. Specifications of Material and DEM Simulations

The discrete element method (DEM) functions as a computational solution to elucidate the mechanical behavior of discontinuous structures. According to Peter Cundall [52], the Discrete Element Method (DEM) originated to analyze rock mechanics, employing deformable polygonal-shaped components. Subsequently, it found application in soil mechanics, broadening its scope and impact within the field. The development of Itasca’s UDEC (Universal Distinct Element Code) and 3DEC (Three-Dimensional Distinct Element Code) stemmed from the evolution and application of the Discrete Element Method (DEM) within rock and soil mechanics. PFC (Particle Flow Code) stands as an advanced iteration derived from the Discrete Element Method (DEM), markedly enhancing contact recognition among elements. This enhancement accelerates model solutions by employing rigid disks (PFC2D) or spherical particles (PFC3D) [53], heralding a leap forward in computational efficiency within this domain.
In this section, the processes of modeling will be explained. Given FEM’s historical precedence in STPT numerical modeling, there is a crucial need to scrutinize STPT responses within a discrete setting capable of simulating individual particles and elucidating inter-particle connections. Drawing from findings by Khatibi et al., specific components of the contact model have been selected for incorporation in this investigation [49]. The subsequent sections will discuss the model’s geometry and boundary conditions. Detailed explanations of the sleeper and ballast components, including their pertinent characteristics, will ensue. Furthermore, a thorough discussion of the contact model for 11 kinds of PSD will be presented. Lastly, a systematic progression of developing a model for incremental lateral loading will be delineated step by step.

2.1. Geometry of the Model

Figure 1 illustrates the schematic of the model, which takes the form of a trapezoidal prism. The base length measures 4.84 m, the upper length is 1.95 m, the height is 1 m, and the model’s width is 0.6 m. The model’s length of 4.84 m is enough to create a track model with a ballast shoulder that is 40 cm wide. In order to generate the necessary quantity of non-overlapping ballast particles, the domain height needs to be adequate.
After settling the ballast particles, due to their own weight and the sleeper’s settling, the excess ballast particles were removed to create a layer with a height of 570 mm, as shown in Figure 1a. Two walls aligned with the lateral force direction were removed after shaping the ballast embankment, as depicted in Figure 1b, to resemble the actual scenario closely. Furthermore, the model’s width was chosen to be 60 cm, as depicted in Figure 1c, to accommodate the spacing of sleepers. The model incorporates rigid wall components delineating the model’s lateral sides and base boundaries. However, these wall elements lack accuracy in representing the interactions between the ballast and the subgrade. To address this limitation, an appropriate friction angle has been allocated to govern the interaction between the ballast particles themselves and between the ballast and the subgrade. As outlined in Figure 1, the track configuration is defined by the model’s dimensions and measurements.

2.2. Sleeper’s Simulation

The choice of simulating the B70-type sleeper was based on the findings of Khatibi et al. [39], where the lateral resistance of this particular sleeper was evaluated in experimental testing. The common B70 concrete sleeper type is visually represented in Figure 2.
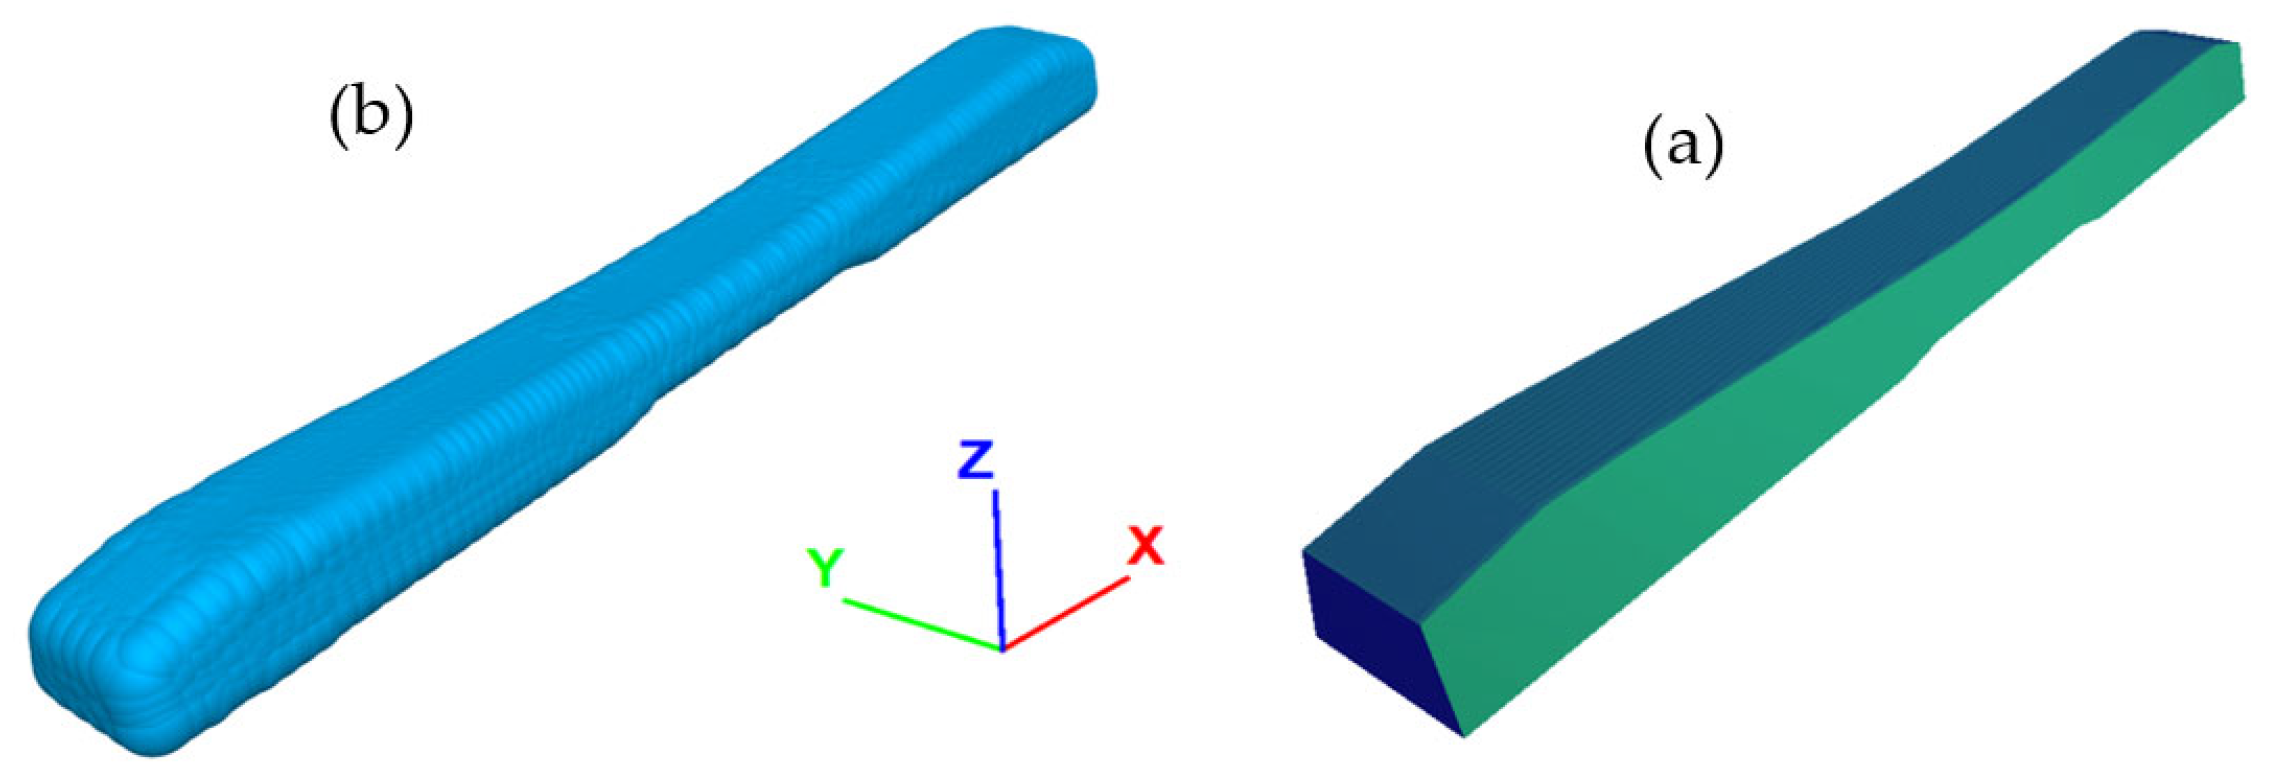
Within the PFC3D framework, the representative volume of the sleeper, depicted in Figure 3a, is denoted as the STL (Standard Triangle Language) file. Notably, this representation is founded on the clump logic of spherical particles, resulting in the formation of the sleeper as a cohesive clump element. The visual depiction of the clump sleeper element, comprised of 2892 pebbles, is presented in Figure 3b.
Opting to create the sleeper as a clump element offers the distinct advantage of facilitating force assignment. This stands in contrast to wall limits, where a cumbersome process of pushing the wall elements towards the ballast surface becomes necessary to achieve the equivalent stress of the sleeper’s self-weight. The endeavor to determine the optimal stress level and ensure a uniform stress distribution beneath the sleeper’s face through this method involves a challenging trial-and-error process, underscoring its inherent complexity.
It is crucial to highlight that the STPT procedure necessitates imparting horizontal velocity to the sleeper walls while systematically recording the ensuing wall response forces as the sleeper undergoes gradual movement. In contrast, with a clump element, the application of sleeper weight is simplified by merely assigning density. In simulating the STPT, lateral force application becomes straightforward. To enhance the surface characteristics of the sleeper clump, the approach of employing maximum inter-pebble angular smoothness was employed, effectively minimizing surface roughness.
The concept of this parameter was introduced by Taghavi [54]. As illustrated in Figure 4, the angle defines the roughness at the interface of two disks or spheres. A rough surface is generated when pebbles of a clump particle are stacked at an angle ( φ ) of less than 180 ° , enhancing the inter-particle shear strength. However, when φ equals 180 ° , the pebble arrangement results in a flat surface, and the inter-particle interaction becomes dependent on the particle shape and contact model parameters. For creating the sleeper clump in this study, a value of φ = 180 degrees, indicating an absolutely smooth contact, was chosen.

2.3. Simulation of Ballast Particles

A DEM modeling technique for ballast particulates involves the creation of spheres, as discussed in studies [41,55]. Utilizing spheres reduces processing time and simplifies computations. However, it is worth noting that particles tend to deform more than actual ballast granules due to the low rolling resistance of spheres and exhibit lower shear strength. To address this, the RR-linear (rolling resistance linear) contact model, as employed by Chen et al. [56], can be applied to bridge this gap.
The primary size distribution in the study, validated through laboratory results, is identified as No. 24. It is assumed that breakage has occurred within this ballast, resulting in the formation of 10 new granular configurations, as illustrated in Figure 5. These new distributions will be investigated in the study. Table 1 provides the exact percentage of each distribution.

2.4. Contact Model

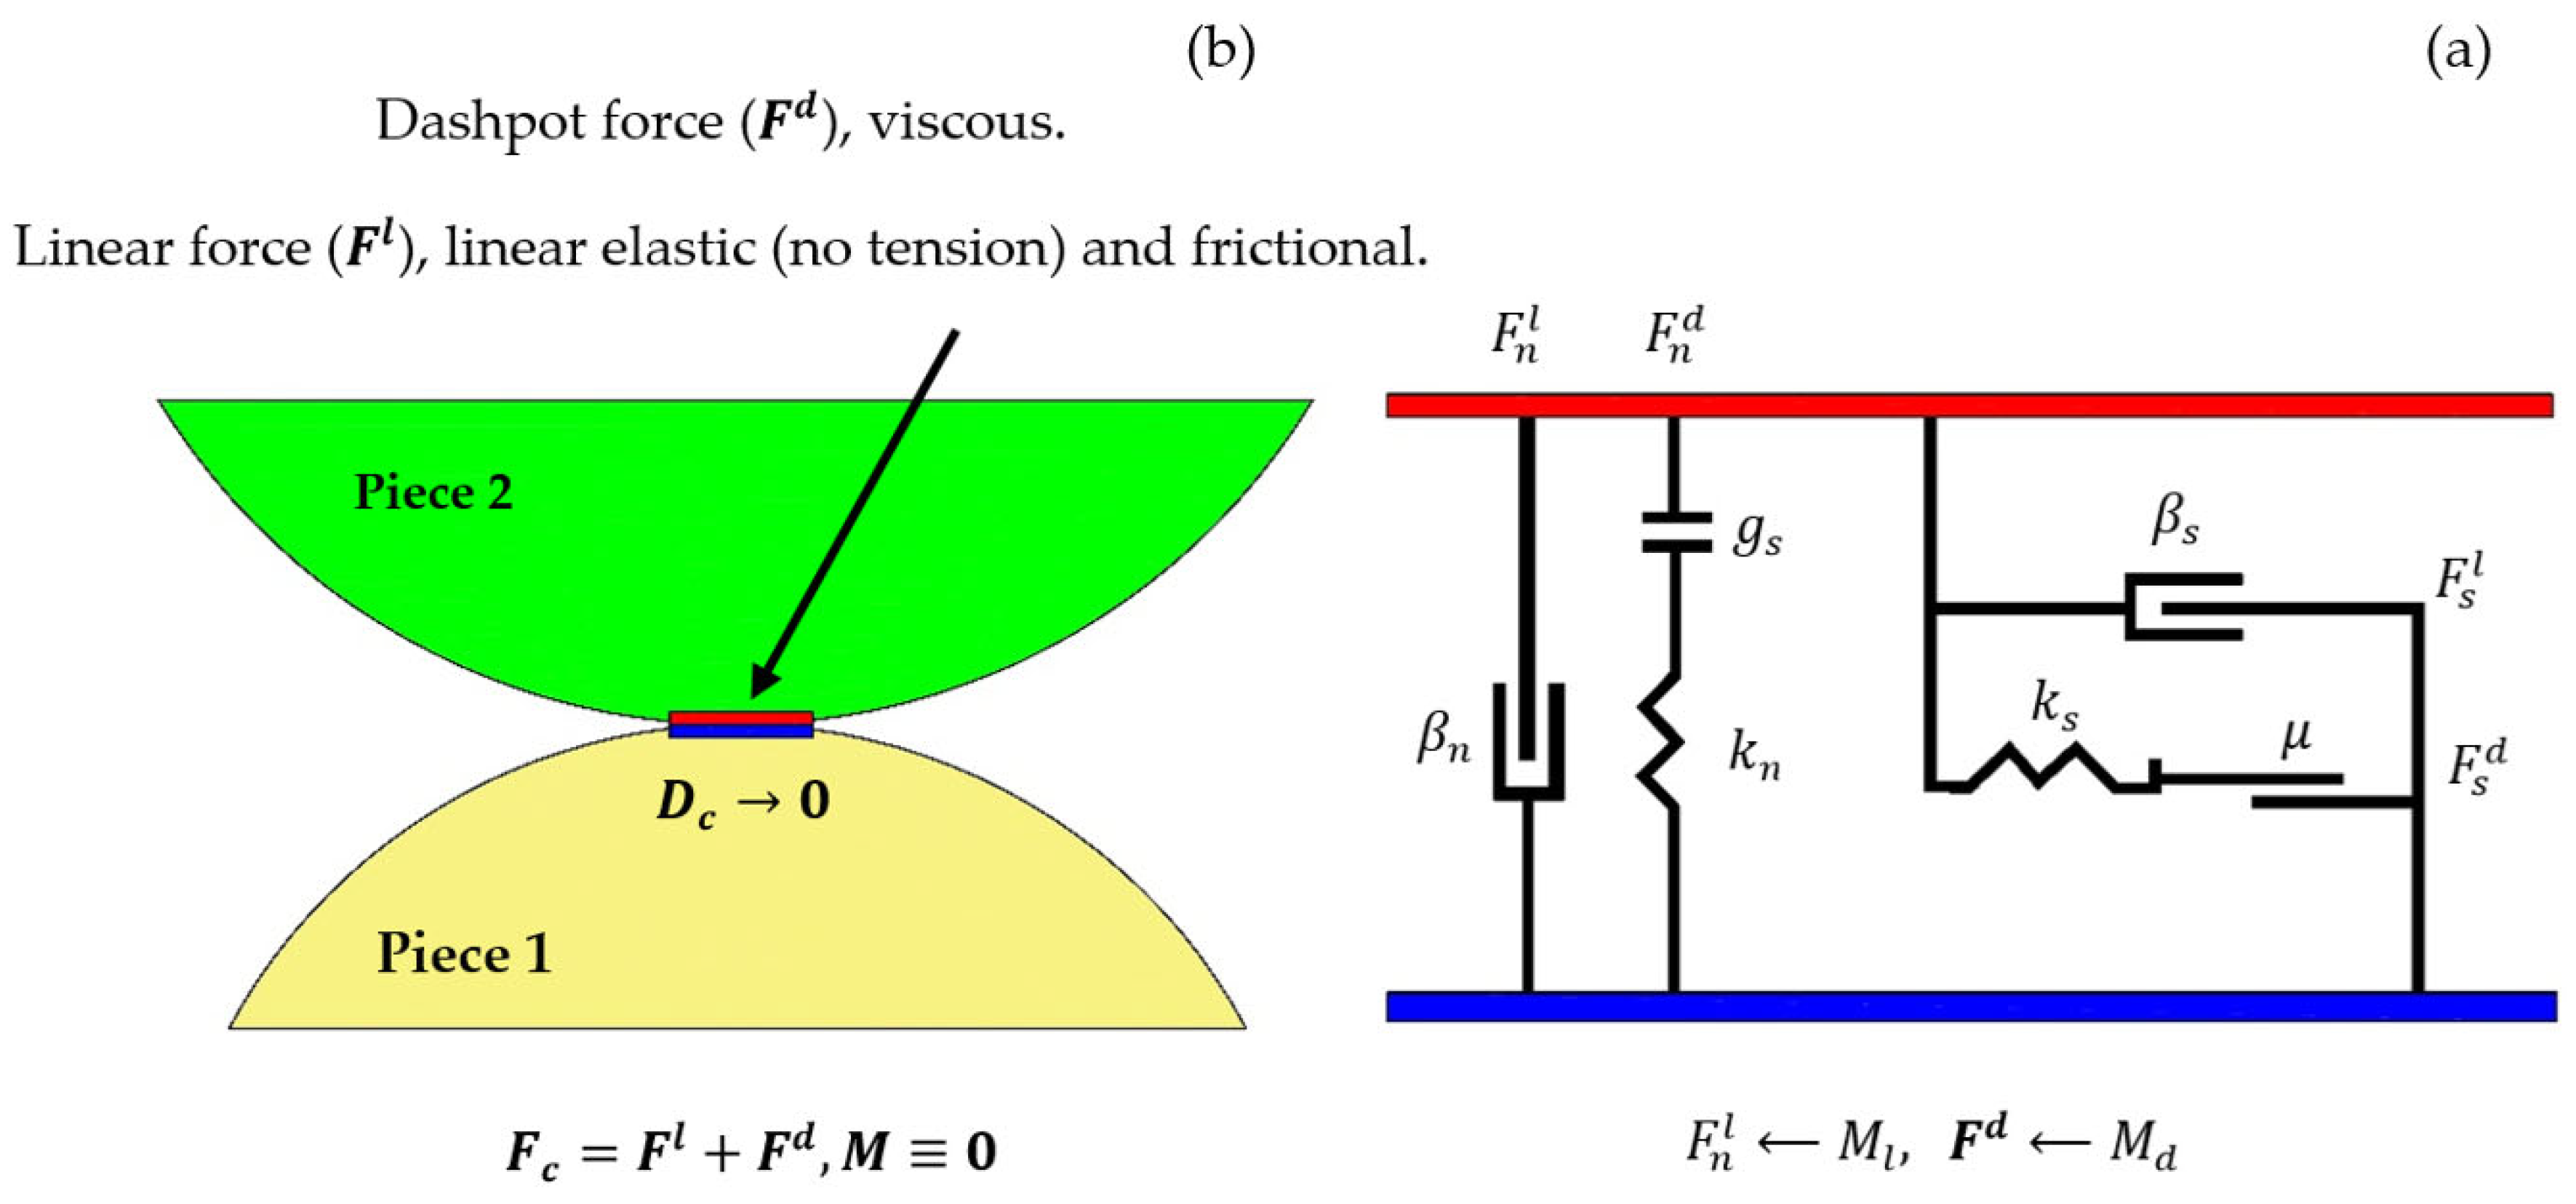
The computation of contact forces at both inter-particle and wall–particle interactions employs a linear elastic contact model. In terms of both accuracy and computation time, this contact model proves sufficient for analyses involving significant deformations and monotonic loadings [53]. The schematic shape of the linear model is shown in Figure 6.
Referring to Figure 6a, the symbols F n l and F s l denote the normal and shear components of the linear force, respectively. Furthermore, F n d , and F s d represent the normal and shear components of the dashpot force, respectively. Additionally, the symbols β n , β s , g s , and μ correspond to the normal critical damping ratio, shear critical damping ratio, and friction coefficient, respectively. It should be noted that M l , M d , F c , and M represent the normal-force update mode, dashpot mode, contact force, and contact moment, respectively [57].
Various formulas can represent the linear elastic contact model, and in this instance, Mindlin and Deresiewicz’s version [34] has been employed, a choice observed in numerous DEM models [58,59,60,61]. When formulating an elastic linear contact model, it is crucial to consider important factors such as normal and shear contact stiffness, along with the friction rate [59].
K n = G s 8 R e δ n 3 ( 1 ν )
K s = 2 2 ν 3 G s 2 F n R e ( 1 ν ) 3
The symbols K n and K s represent the normal and shear stiffnesses, respectively, while G s stands for the shear modulus, and ν denotes Poisson’s ratio. The particle radius, denoted as R e , is defined as follows in the context of two contacting particles, A and B , with radii R A and R B :
R e = 2 R B R A R B + R A
The normal contact force, Fn, is determined by the following equation:
F n = δ n K n
The parameter δ n represents particle overlaps, and it can reasonably be assumed that these overlaps are less than 5% of the average radius of the overlapping particles [26]. In accordance with Equations (1) and (2), the values of K n   and K s   are derived from the mechanical properties of the ballast primary rock material, G s and ν . The results of uniaxial compression tests conducted by Khatibi et al. (2017) following ISRM (1979)-EUR4 standards utilized core cylindrical samples with a diameter of 54 mm and a height-to-diameter ratio of 2.5. The Poisson’s ratio was determined to be 0.2, and the shear elastic modulus was established as G = 8.9   G P a [39].
The study leveraged the results of direct shear tests conducted by Fathali et al. (2016) following ASTM D3080 standards, utilizing a shear box with dimensions of 300 × 300 × 200 mm, to determine the coefficient of friction f . The calculated friction angle φ was found to be 43.6°, approximately corresponding to an interparticle friction coefficient F I of 0.9 [39].
To represent a rigid scenario, it is assumed that the wall–particle interaction’s normal and shear contact stiffness is approximately double that of the ballast stiffness. The friction coefficient for the base wall boundary f w b was set to 0.57 based on Khatibi et al.’s (2017) assumption that the friction angle equaled 30° [39]. For simulating the extension of the ballast layer across the track length, the friction coefficient for the side wall borders   f w s was considered to be the same as the inter-particle ballast friction, specifically 0.9.
Table 2 summarizes the mechanical specifications and particle sizes utilized in the numerical model, along with the corresponding details from the experimental test [39] against which the simulated model was compared.
The value of R e for granularity No. 24 is determined following the calculations conducted by Chalabii et al. [62]. In the ballast layer, three distinct particle sizes were identified based on the size distribution curve of No. 24. Consequently, three unique pairs of interacting particles are likely to exist, leading to multiple values of R e . The size distribution curve revealed particle sizes with radii of 31.7 mm, 19.05 mm, and 9.5 mm in the ballast layer. Consequently, R e is not a singular value, and there are three distinct values for all potential twin contacts. Equation (3) was applied to compute the values of R e , resulting in 23.8 mm, 14.6 mm, and 12.7 mm, respectively. The average value, R ~ e = 17 mm, was determined and utilized for the simulation.
It should be mentioned that according to Equations (1), (2), and (4), the amounts of K n and K s were determined based on the amounts of R ~ e ,   δ n , ν , and G s . The corresponding values of R ~ e , K n , K s , and δ n for various other size distributions are presented in Table 3.

2.5. The STPT Process’s Simulation

This section delineates the systematic process for simulating the STPT within the PFC3D environment. Initially, the definition of the problem domain and establishment of wall boundaries were undertaken, accompanied by the specification of wall contact properties. Subsequently, in the second phase, the generation of ballast materials was executed based on the size distribution curve depicted in Figure 5, employing the clump distribution keyword within PFC. The implementation of the inter-particle contact model was initiated, and gravity was activated to induce the settling of particles under their individual weights. In the primary phase, as illustrated in Figure 7c, an additional number of ballasts was generated. Surplus clumps were removed to establish a 350 mm layer, as depicted in Figure 7d. The third stage involved the creation of concrete sleepers. In this step, sleeper density was assigned, and the equilibrium analysis continued until the vertical settling of the sleeper approached zero. Moving to the fourth step, the formation of the shoulder and the area around the sleeper was undertaken. Following the self-weight-induced settling of the ballast, surplus material was removed to achieve a 570 mm layer. Subsequently, two walls oriented towards the direction of lateral resistance were eliminated to simulate the real-world scenario, as observed in Figure 7g. Notably, before the creation of the 350 mm and 570 mm layers through material removal, a weight analysis of the ballast layer was conducted until the repetition count yielded negligible changes in the layer height. The sequential model creation process is visually represented in Figure 7. Additionally, Figure 7f illustrates the sleeper embedded in the ballast layer, poised for lateral loading in the subsequent STPT modeling. The STPT simulation procedure was initiated with a uniform load of 100 N per iteration applied to the sleeper.

3. Results

Initially, it was essential to validate the lateral resistance of the sleeper for PSD No. 24, utilizing experimental results [39]. Subsequently, the lateral resistance of other PSDs was simulated using this validated model. Figure 8 compares simulated and experimental results for PSD No. 24. As depicted in Figure 8, the simulated and experimental results exhibit close agreement.
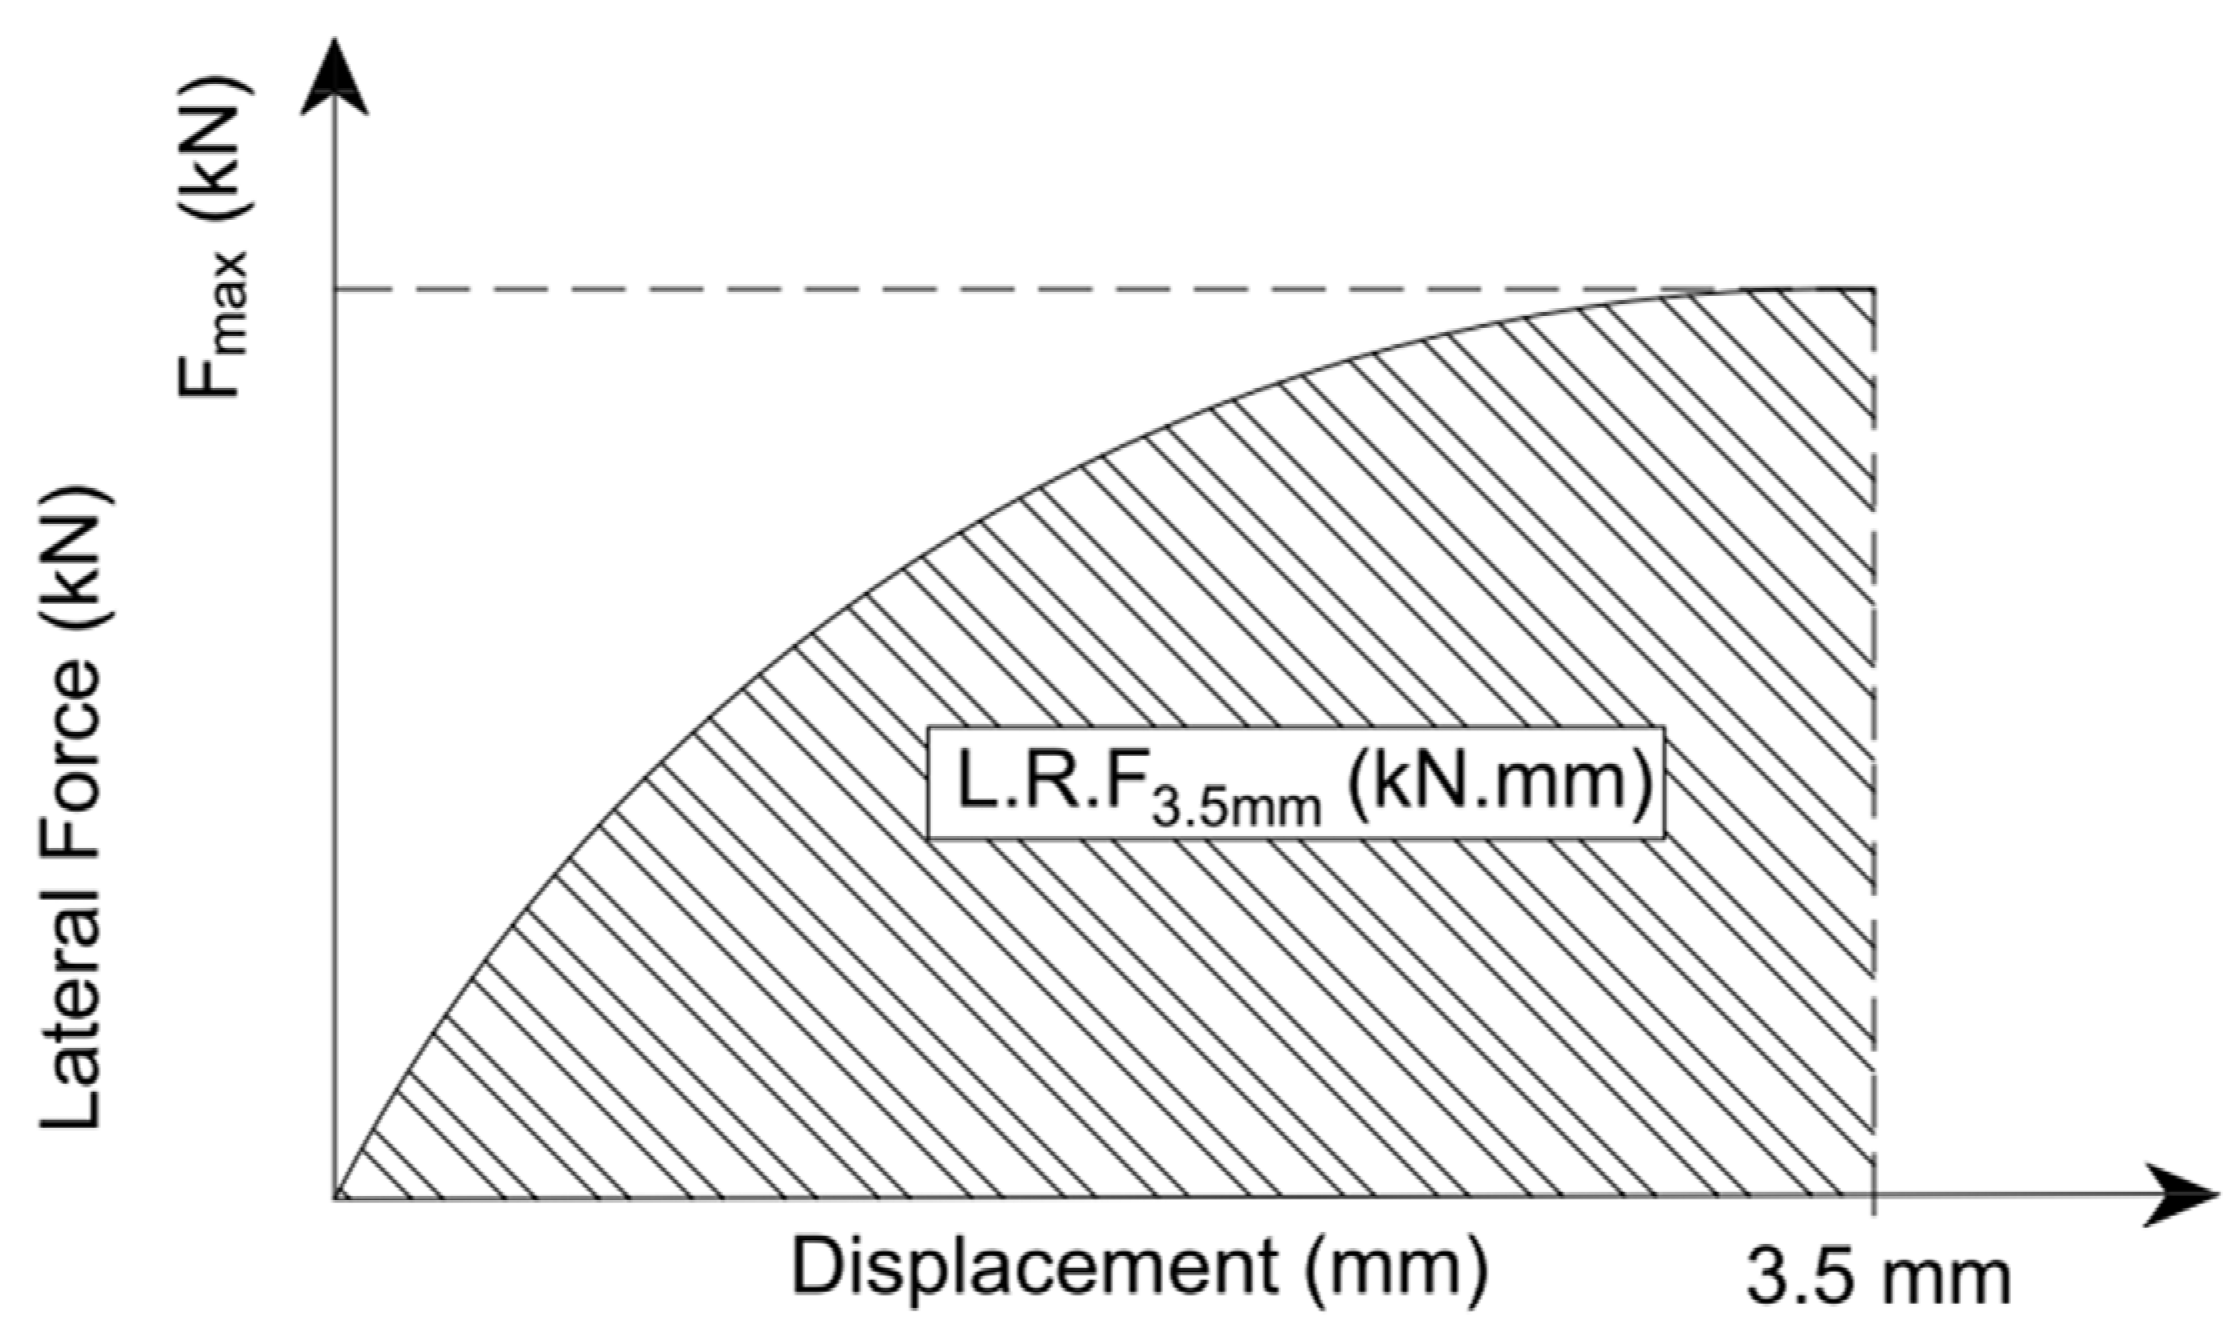
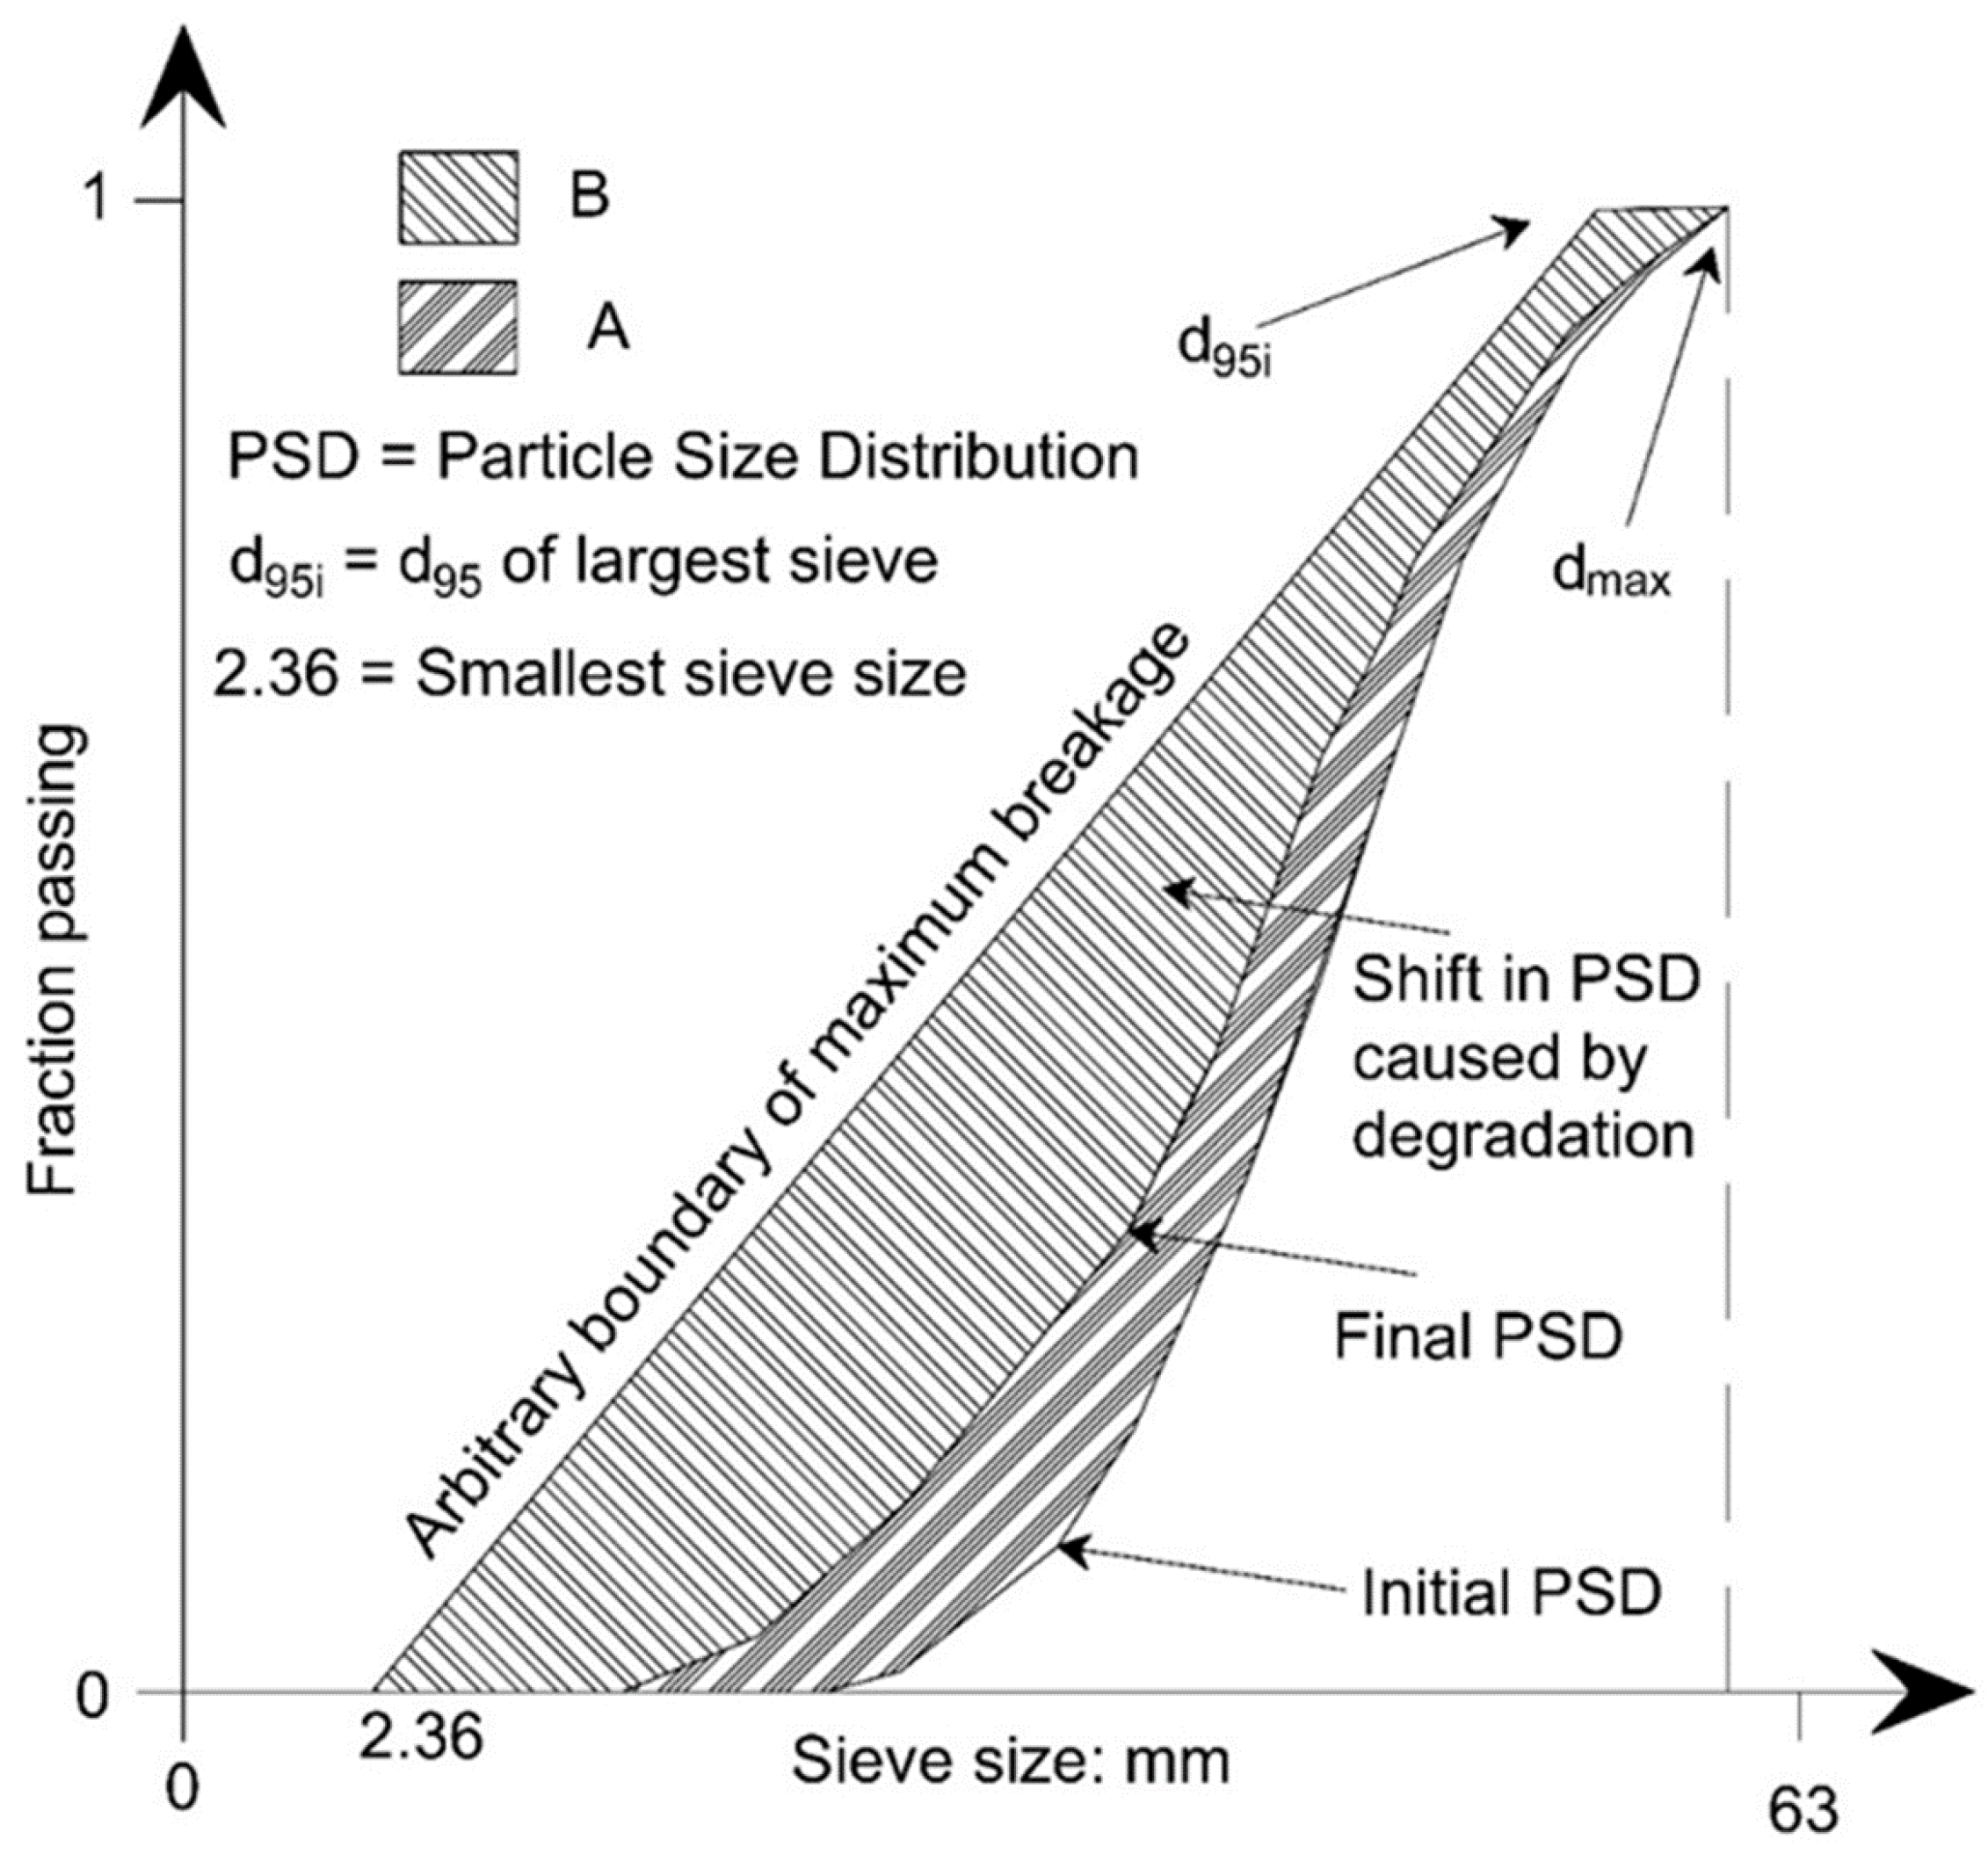
To quantify the lateral resistance of the sleeper, Chalabii et al. [62] introduced L . R . F 3.5 , representing the area under the lateral force–displacement curve for a 3.5 mm displacement, as depicted in Figure 9. Additionally, the calculation of ballast breakage utilizes B B I (Ballast Breakage Index), which has been adapted based on the modifications proposed by Indraratna et al. [63]. B B I can be calculated using Equation (5).
B B I = A A + B
where A and B represent the area between the initial and final PSD and the area between the final PSD and an arbitrary point, as illustrated in Figure 10, respectively.
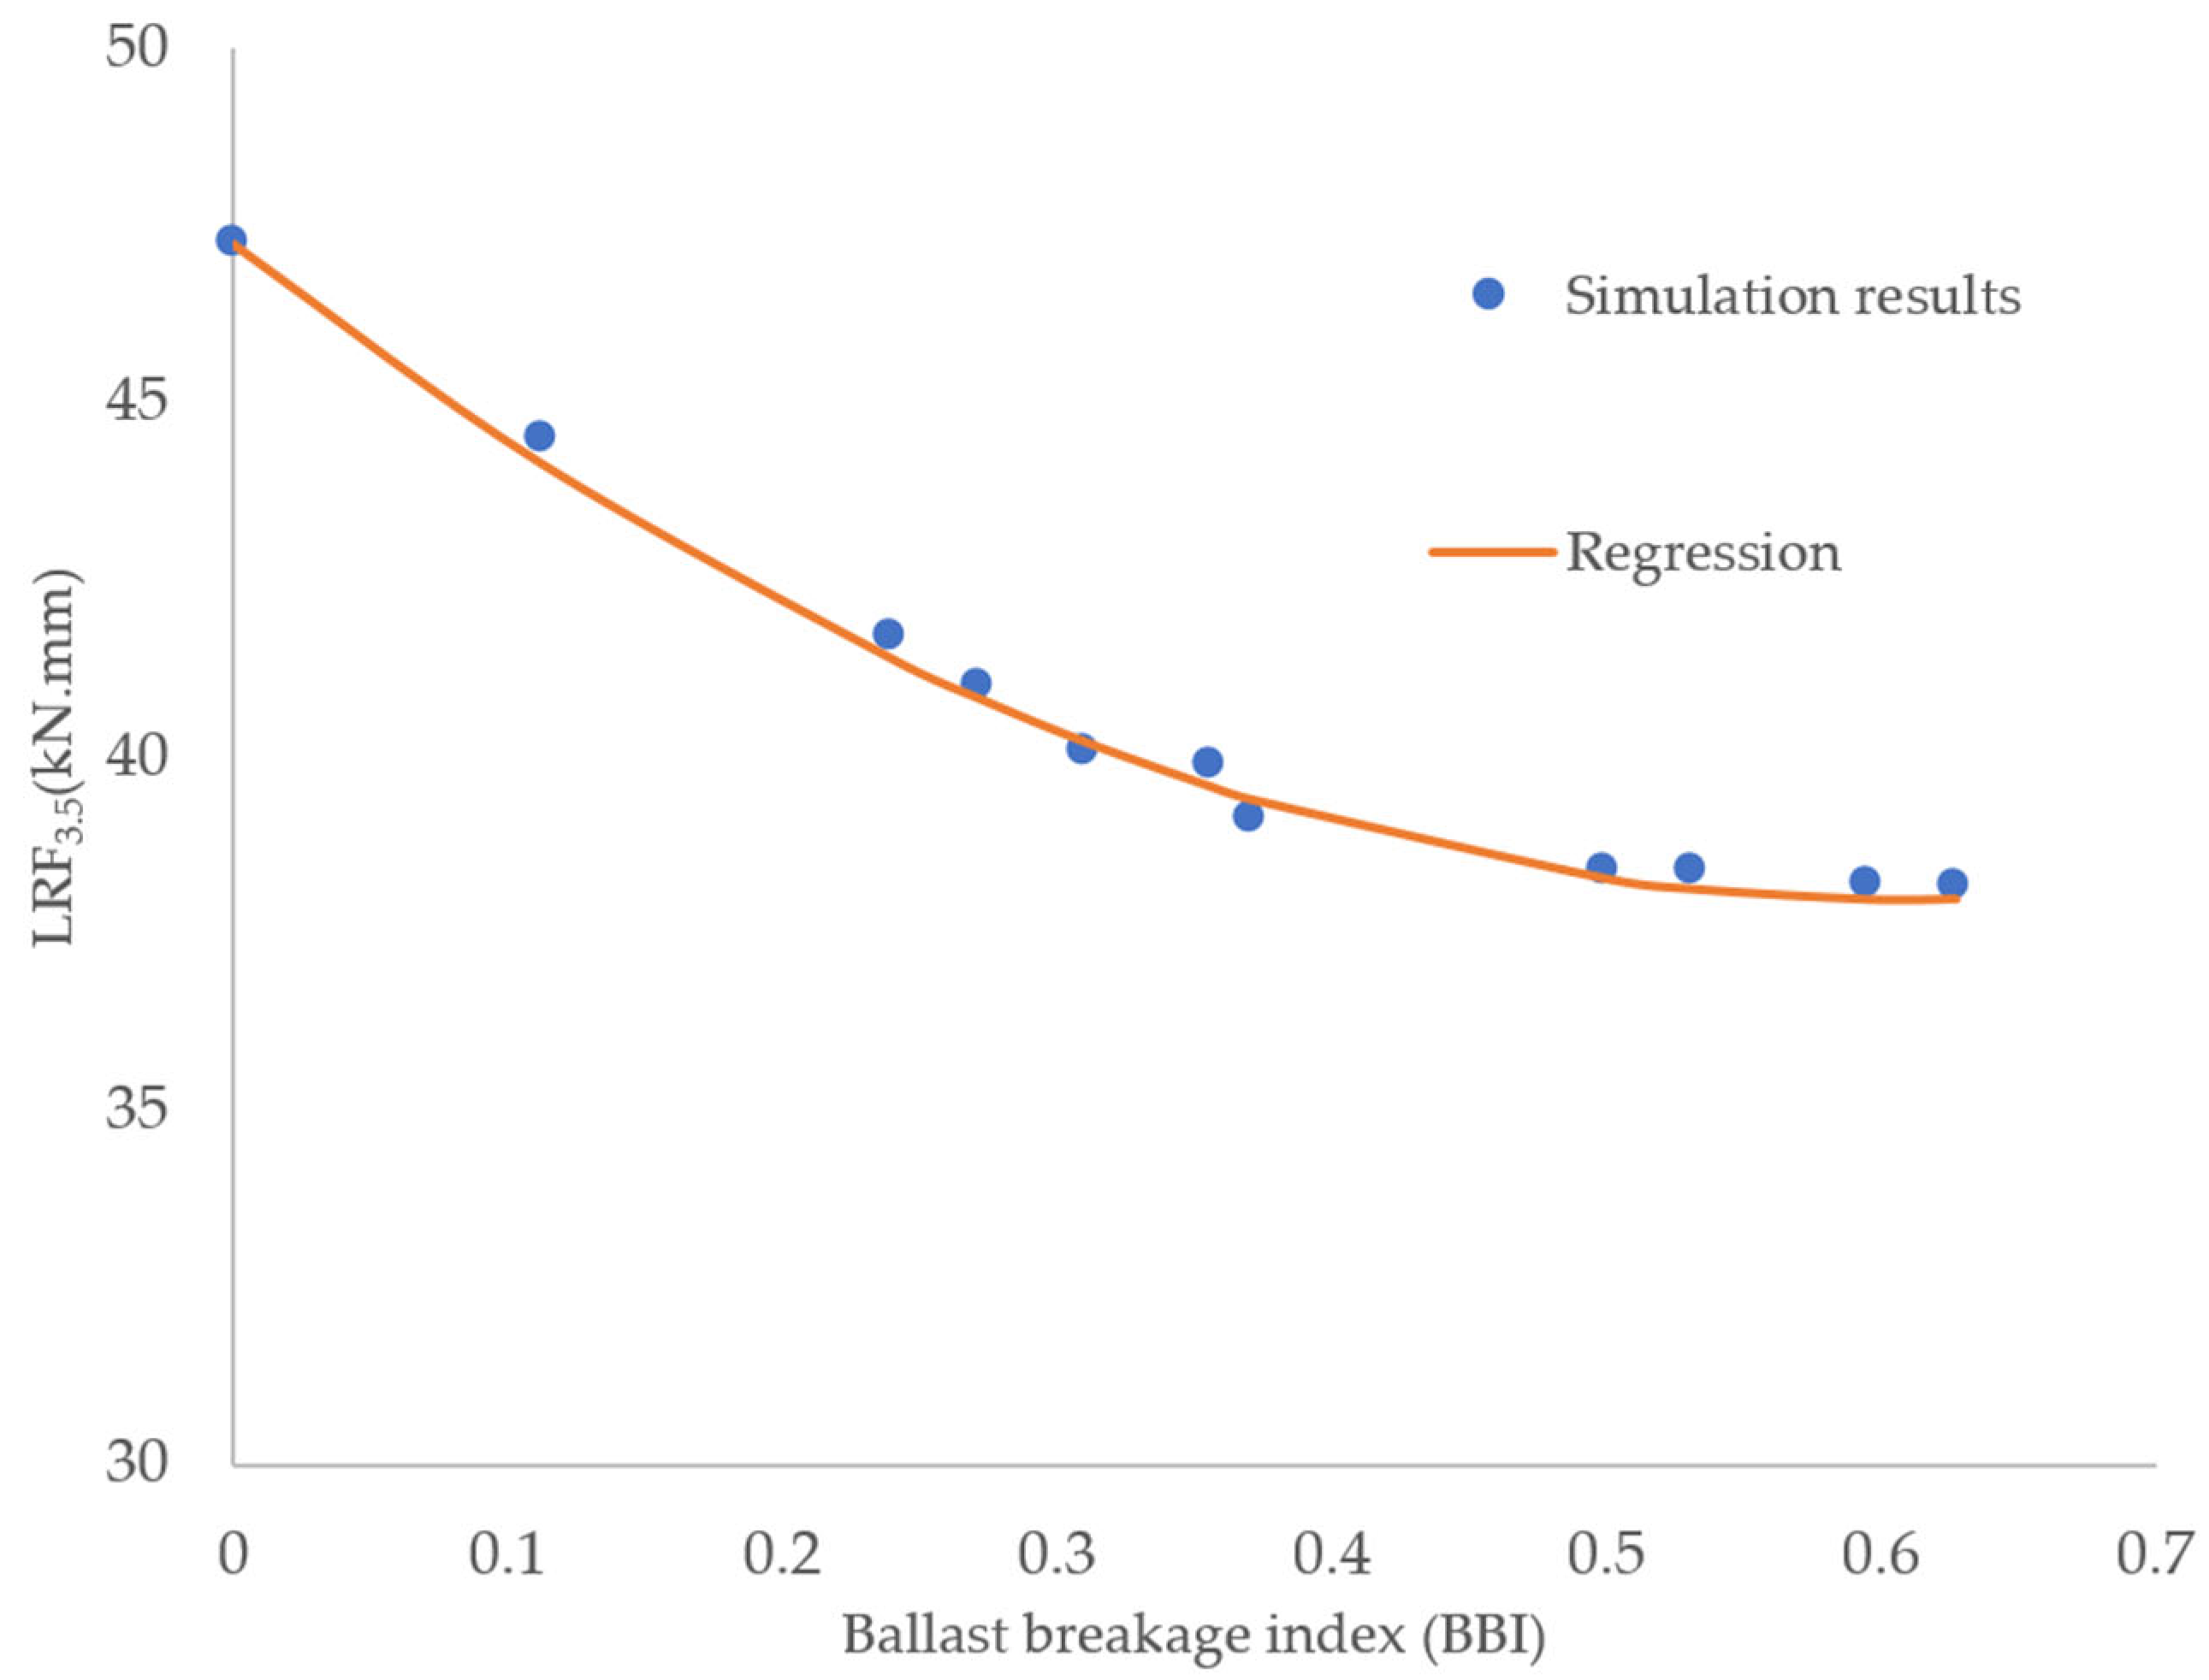
Establishing a correlation between degradation in ballasted railway tracks and the lateral resistance of the sleeper has consistently posed a challenge for railway and geotechnical engineers and researchers. To address this challenge, several studies have been dedicated to this topic [57,64,65]. Despite numerous attempts to address this matter, there has been a notable absence of studies specifically dedicated to establishing a direct relationship between the lateral resistance of concrete sleepers and ballast breakage. In this study, an endeavor was made to identify a suitable correlation between the sleeper’s lateral resistances and ballast breakage. The comparison of L R F 3.5 results with B B I is illustrated in Figure 11. Therefore, multiple regression equations were formulated to express lateral resistance as a function of B B I . The results depicted in Figure 11 pertain to a lateral displacement of 3.5 mm. Two key factors were considered to determine the optimal prediction equation, minimizing disagreement between the equation and DEM data and achieving an R 2 value close to 1.0. To elaborate, Figure 12 provides a visual representation where proximity to the 45-degree line signifies greater accuracy in the predicted equation. As shown in Figure 12, considering a standard error of ±5° (dash lines), all data points fall within this range, indicating strong alignment between the derived equation and the data collected from DEM analyses. Ultimately, Equation (5) was suggested as the most fitting model.
L R F 3.5 = 47.26 30.43 · B B I + 25 · B B I 2             R 2 = 0.98

4. Conclusions

The present study explored the effect of ballast breakage on the lateral resistance of the B70-type sleeper in ballasted railway tracks. To achieve this, the initial step involved the three-dimensional DEM modeling of an experimental STPT using PFC3D software, version 7. Then, the response of lateral displacement to lateral resistance in the DEM model was validated by comparing it with the experimental data provided by Khatibi et al. [39]. Subsequently, under the assumption that breakage occurs in the ballast grains and leveraging the validated model, an examination of the lateral resistance of the sleeper was conducted for ten particle size distributions finer than No. 24. The summary of the achieved results is as follows:
  • The DEM results demonstrate satisfactory agreement with experimental data regarding lateral resistance displacement for a 3.5 mm displacement. However, a gap was observed in the graph, attributed to inherent differences in ballast and sleeper shapes, as well as variations in the loading process and conditions;
  • The results were presented based on the BBI and LRF3.5 parameters provided by [39,62], respectively. From the results of LRF3.5 based on BBI, a regression is presented to find the relationship between these parameters.
  • According to Equation (5), the LRF3.5 value decreases with an increase in BBI, but the rate of decrease continues until it reaches zero at BBI = 0.6. This implies that lateral resistance decreases up to a specific value of ballast breakage, and after that point, it remains constant.
However, it is essential to acknowledge certain limitations in this research. For instance, the assumption of a spherical shape for ballast particles was made. While this limitation was compensated to an acceptable extent by incorporating sliding resistance into the results, considering the actual shape of particles would likely have yielded more precise outcomes. Furthermore, the fouling of ballast after degradation was overlooked for simplification purposes. In future studies, it would be beneficial to investigate the combined effects of both ballast breakage and fouling within the same model.

Author Contributions

Conceptualization, J.C., M.E., D.G., S.F. and M.M.R.; methodology, J.C., M.E., D.G., S.F. and M.M.R.; software, J.C., M.E., D.G., S.F. and M.M.R.; validation, J.C., M.E., D.G., S.F. and M.M.R.; formal analysis, J.C., M.E., D.G., S.F. and M.M.R.; investigation, J.C., M.E., D.G., S.F. and M.M.R.; resources, J.C., M.E., D.G., S.F. and M.M.R.; data curation, J.C., M.E., D.G., S.F. and M.M.R.; writing—original draft preparation, J.C., M.E., D.G., S.F. and M.M.R.; writing—review and editing, J.C., M.E., D.G., S.F. and M.M.R.; visualization, J.C., M.E., D.G., S.F. and M.M.R.; supervision, J.C., M.E., D.G., S.F. and M.M.R.; project administration, J.C., M.E., D.G., S.F. and M.M.R.; funding acquisition, J.C., M.E., D.G., S.F. and M.M.R. All authors have read and agreed to the published version of the manuscript.

Funding

This paper was prepared by the research team “SZE-RAIL”. This research was supported by SIU Foundation’s project ‘Sustainable railways—Investigation of the energy efficiency of electric rail vehicles and their infrastructure’. The publishing of the paper did not receive financial support or financing of the article process charge.

Data Availability Statement

Data are contained within the article.

Conflicts of Interest

The authors declare no conflicts of interest.

List of Abbreviations

AbbreviationDefinition
CWRContinuous Welded Rail
3DECThree-Dimensional Distinct Element Code
AREMAAmerican Railway Engineering and Maintenance-of-Way Association
ASTMAmerican Society for Testing Materials
DEMDiscrete Element Modeling
EHLElastohydrodynamically lubricated
FEMFinite Element Method
ISRMInternational Society for Rock Mechanics
PFCParticle Flow Code
PSDParticle Size Distribution
STLStandard Triangle Language
STPTsSingle Sleeper (Tie) Push Tests
UDECUniversal Distinct Element Code
WILACWater-Induced Low-Adhesion Creep force model

List of Symbols

Symbols and IndexesUnits in SI SystemDefinition
F c NContact force
F n d NThe normal components of the dashpot force
F n l NThe normal components of the linear force
F s d NThe shear components of the dashpot force
F s l NThe shear components of the linear force
G s PaShear modulus
K n N/mNormal stiffnesses
K s N/mShear stiffnesses
L R F 3.5 NmLateral resistance factor
M d [−]Dashpot mode
M l [−]Normal-force update mode
R e mParticle radius
f w b [−]The friction coefficient for the base wall boundary
f w s [−]Side wall friction coefficient
g s mA surface gap
β n [−]The normal critical damping ratio
β s [−]The shear critical damping ratio
γ b kg/m3Ballast particle density
γ s kg/m3Sleeper clump density
δ n mParticle overlaps
B B I [−]Ballast Breakage Index
F I [−]The interparticle friction coefficient
M [−]Contact moment
f [−]Coefficient of friction
μ [−]Friction coefficient
ν [−]Poisson’s ratio
φ degreesThe angle of pebbles of a clump particle

References

  1. Vitković, N.; Marinković, D.; Stan, S.-D.; Simonović, M.; Miltenović, A.; Tomić, M.; Barać, M. Decision Support System for Managing Marshalling Yard Deviations. Acta Polytech. Hung. 2024, 21, 121–134. [Google Scholar] [CrossRef]
  2. Song, Y.; Liu, Z.; Gao, S. Current Collection Quality of High-speed Rail Pantograph-catenary Considering Geometry Deviation at 400 km/h and above. In IEEE Transactions on Vehicular Technology; IEEE: Piscataway, NJ, USA, 2024. [Google Scholar] [CrossRef]
  3. Jovanović, V.; Janošević, D.; Marinković, D.; Petrović, N.; Pavlović, J. Railway Load Analysis During the Operation of an Excavator Resting on the Railway Track. Acta Polytech. Hung. 2023, 20, 79–93. [Google Scholar] [CrossRef]
  4. Jovanović, V.; Marinković, D.; Janošević, D.; Petrović, N. Influential Factors in the Loading of the Axial Bearing of the Slewing Platform Drive in Hydraulic Excavators. Teh. Vjesn. 2023, 30, 158–168. [Google Scholar] [CrossRef]
  5. Volkov, V.; Taran, I.; Volkova, T.; Pavlenko, O.; Berezhnaja, N. Determining the Efficient Management System for a Specialized Transport Enterprise. Nauk. Visnyk Natsionalnoho Hirnychoho Univ. 2020, 2020, 185–191. [Google Scholar] [CrossRef]
  6. Saukenova, I.; Oliskevych, M.; Taran, I.; Toktamyssova, A.; Aliakbarkyzy, D.; Pelo, R. Optimization of Schedules for Early Garbage Collection and Disposal in the Megapolis. East.-Eur. J. Enterp. Technol. 2022, 1, 13–23. [Google Scholar] [CrossRef]
  7. Ézsiás, L.; Tompa, R.; Fischer, S. Investigation of the Possible Correlations Between Specific Characteristics of Crushed Stone Aggregates. Spectr. Mech. Eng. Oper. Res. 2024, 1, 10–26. [Google Scholar] [CrossRef]
  8. Fischer, S. Evaluation of inner shear resistance of layers from mineral granular materials. Facta Univ. Ser. Mech. Eng. 2023, 12155. [Google Scholar] [CrossRef]
  9. Nagy, R.; Horvát, F.; Fischer, S. Innovative Approaches in Railway Management: Leveraging Big Data and Artificial Intelligence for Predictive Maintenance of Track Geometry. Teh. Vjesn. 2024, 31, 1245–1259. [Google Scholar] [CrossRef]
  10. Kuchak, A.T.J.; Marinkovic, D.; Zehn, M. Finite Element Model Updating—Case Study of a Rail Damper. Struct. Eng. Mech. 2020, 73, 27–35. [Google Scholar] [CrossRef]
  11. Kuchak, A.T.J.; Marinkovic, D.; Zehn, M. Parametric Investigation of a Rail Damper Design Based on a Lab-Scaled Model. J. Vib. Eng. Technol. 2021, 9, 51–60. [Google Scholar] [CrossRef]
  12. Brautigam, A.; Szalai, S.; Fischer, S. Investigation of the application of austenitic filler metals in paved tracks for the repair of the running surface defects of rails considering field tests. Facta Univ. Ser. Mech. Eng. 2023, 12081. [Google Scholar] [CrossRef]
  13. Fischer, S.; Harangozó, D.; Németh, D.; Kocsis, B.; Sysyn, M.; Kurhan, D.; Brautigam, A. Investigation of Heat-Affected Zones of Thermite Rail Weldings. Facta Univ. Ser. Mech. Eng. 2023, 11420. [Google Scholar] [CrossRef]
  14. Németh, A.; Fischer, S. Investigation of glued insulated rail joints applied to CWR tracks. Facta Univ. Ser. Mech. Eng. 2021, 19, 681–704. [Google Scholar] [CrossRef]
  15. Monek, G.D.; Fischer, S. Expert Twin: A Digital Twin with an Integrated Fuzzy-Based Decision-Making Module. Decis. Mak. Appl. Manag. Eng. 2024, 8, 1–21. [Google Scholar] [CrossRef]
  16. Szalai, S.; Szívós, B.; Kocsis, D.; Sysyn, M.; Liu, J.; Fischer, S. The Application of DIC in Criminology Analysis Procedures to Measure Skin Deformation. J. Appl. Comput. Mech. 2024. [Google Scholar] [CrossRef]
  17. Oslakovic, I.S.; ter Maat, H.; Hartmann, A.; Dewulf, G. Risk Assessment of Climate Change Impacts on Railway Infrastructure. In Proceedings of the Engineering Project Organization Conference, Tabernash, CO, USA, 9–11 July 2013. [Google Scholar]
  18. Quinn, A.; Unión Internacional de Ferrocarriles. RAIL Adapt: Adapting the Railway for the Future. In Proceedings of the 7th Transport Research Arena TRA 2018, Vienna, Austria, 16–19 April 2018; A Report for the International Union of Railways (UIC); Railway Technical Publications (ETF): Paris, France, 2017; ISBN 9782746126800. [Google Scholar]
  19. Ngamkhanong, C.; Kaewunruen, S.; Afonso Costa, B.J. State-of-the-Art Review of Railway Track Resilience Monitoring. Infrastructures 2018, 3, 3. [Google Scholar] [CrossRef]
  20. Dindar, S.; Kaewunruen, S.; An, M.; Osman, M.H. Natural Hazard Risks on Railway Turnout Systems. Procedia Eng. 2016, 161, 1254–1259. [Google Scholar] [CrossRef]
  21. Kaewunruen, S.; Wang, Y.; Ngamkhanong, C. Derailment-Resistant Performance of Modular Composite Rail Track Slabs. Eng. Struct. 2018, 160, 1–11. [Google Scholar] [CrossRef]
  22. Zakeri, J.A.; Mirfattahi, B.; Fakhari, M. Lateral Resistance of Railway Track with Frictional Sleepers. Proc. Inst. Civ. Eng. Transp. 2012, 165, 151–155. [Google Scholar] [CrossRef]
  23. Fang, C.; Jaafar, S.A.; Zhou, W.; Yan, H.; Chen, J.; Meng, X. Wheel-Rail Contact and Friction Models: A Review of Recent Advances. Proc. Inst. Mech. Eng. Part F J. Rail Rapid Transit 2023, 237, 1245–1259. [Google Scholar] [CrossRef]
  24. Anbazhagan, P.; Bharatha, T.P.; Amarajeevi, G. Study of Ballast Fouling in Railway Track Formations. Indian Geotech. J. 2012, 42, 87–99. [Google Scholar] [CrossRef]
  25. Sussmann, T.R.; Ruel, M.; Chrismer, S.M. Source of Ballast Fouling and Influence Considerations for Condition Assessment Criteria. Transp. Res. Rec. 2012, 2289, 87–94. [Google Scholar] [CrossRef]
  26. Lei, X.; Feng, Q. Analysis of Stability of Continuously Welded Rail Track with Finite Elements. Proc. Inst. Mech. Eng. Part F J. Rail Rapid Transit 2004, 218, 225–233. [Google Scholar] [CrossRef]
  27. Carvalho, J.; Delgado, J.; Calçada, R.; Delgado, R. A New Methodology for Evaluating the Safe Temperature in Continuous Welded Rail Tracks. Int. J. Struct. Stab. Dyn. 2013, 13, 1350016. [Google Scholar] [CrossRef]
  28. Ngamkhanong, C.; Wey, C.M.; Kaewunruen, S. Buckling Analysis of Interspersed Railway Tracks. Appl. Sci. 2020, 10, 3091. [Google Scholar] [CrossRef]
  29. Esveld, C. Improved Knowledge of CWR Track. In Interactive Conference on Cost Effectiveness and Safety Aspects of Railway Track; UIC/ERRI: Paris, France, 1998; pp. 8–9. [Google Scholar]
  30. Kish, A. On the fundamentals of track lateral resistance. In Proceedings of the AREMA 2011 Annual Conference, Minneapolis, MN, USA, 18–21 September 2011. [Google Scholar]
  31. AREMA. Manual for Railway Engineering. Man. Railw. Eng. 2010, 1. [Google Scholar]
  32. Kabo, E. A Numerical Study of the Lateral Ballast Resistance in Railway Tracks. Proc. Inst. Mech. Eng. Part F J. Rail Rapid Transit 2006, 220, 425–433. [Google Scholar] [CrossRef]
  33. Ali Zakeri, J.; Esmaeili, M.; Kasraei, A.; Bakhtiary, A. A Numerical Investigation on the Lateral Resistance of Frictional Sleepers in Ballasted Railway Tracks. Proc. Inst. Mech. Eng. Part F J. Rail Rapid Transit 2016, 230, 440–449. [Google Scholar] [CrossRef]
  34. Ngamkhanong, C.; Kaewunruen, S.; Baniotopoulos, C. A Review on Modelling and Monitoring of Railway Ballast. Struct. Monit. Maint. 2017, 4, 195–220. [Google Scholar] [CrossRef]
  35. Cundall, P.A. A Computer Model for Simulating Progressive Large-Scale Movements in Blocky Rock Systems. In Proceedings of the Symposium of the International Society of Rock Mechanics, Nancy, France, 4–6 October 1971; Volume 8, pp. 129–136. [Google Scholar]
  36. Irazábal González Supervisor, J. Numerical Analysis of Railway Ballast Behaviour Using the Discrete Element Method. Ph.D. Thesis, Departament d’Enginyeria Civil i Ambiental, Universitat Politècnica de Catalunya, Barcelona, Spain, 2017. [Google Scholar] [CrossRef]
  37. Jing, G.Q.; Aela, P.; Fu, H.; Yin, H. Numerical and Experimental Analysis of Single Tie Push Tests on Different Shapes of Concrete Sleepers in Ballasted Tracks. Proc. Inst. Mech. Eng. Part F J. Rail Rapid Transit 2019, 233, 666–677. [Google Scholar] [CrossRef]
  38. Guo, Y.; Fu, H.; Qian, Y.; Markine, V.; Jing, G. Effect of Sleeper Bottom Texture on Lateral Resistance with Discrete Element Modelling. Constr. Build. Mater. 2020, 250, 118770. [Google Scholar] [CrossRef]
  39. Khatibi, F.; Esmaeili, M.; Mohammadzadeh, S. DEM Analysis of Railway Track Lateral Resistance. Soils Found. 2017, 57, 587–602. [Google Scholar] [CrossRef]
  40. Irazábal González, J.; Salazar González, F. Numerical Modelling of Railway Ballast Using the Discrete Element Method. Master’s Thesis, Universitat Politècnica de Catalunya, Barcelona, Spain, 2015. [Google Scholar] [CrossRef]
  41. Jing, G.; Aela, P.; Fu, H. The Contribution of Ballast Layer Components to the Lateral Resistance of Ladder Sleeper Track. Constr. Build. Mater. 2019, 202, 796–805. [Google Scholar] [CrossRef]
  42. Xiao, H.; Ling, X. Experiment and DEM Analysis of Lateral Resistance of Glued Ballast. Xinan Jiaotong Daxue Xuebao/J. Southwest Jiaotong Univ. 2017, 52, 1046–1054. [Google Scholar] [CrossRef]
  43. Jing, G.; Zhang, X.; Jia, W. Lateral Resistance of Polyurethane-Reinforced Ballast with the Application of New Bonding Schemes: Laboratory Tests and Discrete Element Simulations. Constr. Build. Mater. 2019, 221, 627–636. [Google Scholar] [CrossRef]
  44. Tutumluer, E.; Huang, H.; Hashash, Y.; Ghaboussi, J. Aggregate Shape Effects on Ballast Tamping and Railroad Track Lateral Stability. In Proceedings of the AREMA Annual Conference, Louisville, KY, USA, 17–20 September 2006; pp. 17–20. [Google Scholar]
  45. Guo, Y.; Markine, V.; Song, J.; Jing, G. Ballast Degradation: Effect of Particle Size and Shape Using Los Angeles Abrasion Test and Image Analysis. Constr. Build. Mater. 2018, 169, 414–424. [Google Scholar] [CrossRef]
  46. Lichtberger, B. Track Compendium, 1st ed.; Eurailpress: Hamburg, Germany, 2005. [Google Scholar]
  47. Chalabii, J.; Movahedi Rad, M.; Hadizadeh Raisi, E.; Esfandiari Mehni, R. Effect of Sleeper-Ballast Particle Contact on Lateral Resistance of Concrete Sleepers in Ballasted Railway Tracks. Materials 2022, 15, 7508. [Google Scholar] [CrossRef]
  48. Feng, B.; Hou, W.; Tutumluer, E. Implications of Field Loading Patterns on Different Tie Support Conditions Using Discrete Element Modeling: Dynamic Responses. Transp. Res. Rec. 2019, 2673, 509–520. [Google Scholar] [CrossRef]
  49. Ngamkhanong, C.; Feng, B.; Tutumluer, E.; Hashash, Y.M.A.; Kaewunruen, S. Evaluation of Lateral Stability of Railway Tracks Due to Ballast Degradation. Constr. Build. Mater. 2021, 278, 122342. [Google Scholar] [CrossRef]
  50. Xu, Y.; Gao, L.; Zhang, Y.R.; Yin, H.; Cai, X.P. Discrete Element Method Analysis of Lateral Resistance of Fouled Ballast Bed. J. Cent. South Univ. 2016, 23, 2373–2381. [Google Scholar] [CrossRef]
  51. Lim, N.H.; Kim, K.J.; Bae, H.U.; Kim, S. DEM Analysis of Track Ballast for Track Ballast-Wheel Interaction Simulation. Appl. Sci. 2020, 10, 2717. [Google Scholar] [CrossRef]
  52. Cundall, P.A.; Strack, O.D.L. A Discrete Numerical Model for Granular Assemblies. Géotechnique 1979, 29, 47–65. [Google Scholar] [CrossRef]
  53. CGI Itasca. PFC3D (Particle Flow Code in Three Dimensions); CGI Itasca: Grand Rapids, MN, USA, 2021. [Google Scholar]
  54. Taghavi, R. Automatic Clump Generation Based on Mid-Surface. In Proceedings of the 2nd international FLAC/DEM Symposium, Melbourne, Australia, 14–16 February 2011; pp. 791–797. [Google Scholar]
  55. Irazábal, J.; Salazar, F.; Oñate, E. Numerical Modelling of Granular Materials with Spherical Discrete Particles and the Bounded Rolling Friction Model. Application to Railway Ballast. Comput. Geotech. 2017, 85, 220–229. [Google Scholar] [CrossRef]
  56. Chen, C.; McDowell, G.R.; Thom, N.H. Discrete Element Modelling of Cyclic Loads of Geogrid-Reinforced Ballast under Confined and Unconfined Conditions. Geotext. Geomembr. 2012, 35, 76–86. [Google Scholar] [CrossRef]
  57. Laryea, S.; Safari Baghsorkhi, M.; Ferellec, J.F.; McDowell, G.R.; Chen, C. Comparison of Performance of Concrete and Steel Sleepers Using Experimental and Discrete Element Methods. Transp. Geotech. 2014, 1, 225–240. [Google Scholar] [CrossRef]
  58. Yimsiri, S.; Soga, K. DEM Analysis of Soil Fabric Effects on Behaviour of Sand. Geotechnique 2010, 60, 483–495. [Google Scholar] [CrossRef]
  59. Lin, X.; Ng, T.T. A Three-Dimensional Discrete Element Model Using Arrays of Ellipsoids. Geotechnique 1997, 47, 319–329. [Google Scholar] [CrossRef]
  60. Chen, Y.C.; Hung, H.Y. Evolution of Shear Modulus and Fabric during Shear Deformation. Soils Found. 1991, 31, 148–160. [Google Scholar] [CrossRef]
  61. Sitharam, T.G.; Vinod, J.S.; Ravishankar, B.V. Evaluation of Undrained Response from Drained Triaxial Shear Tests: DEM Simulations and Experiments. Geotechnique 2008, 58, 605–608. [Google Scholar] [CrossRef]
  62. Chalabii, J.; Movahedi Rad, M.; Hosseini, S. Optimal Shape Design of Concrete Sleepers under Lateral Loading Using DEM. Buildings 2023, 13, 1574. [Google Scholar] [CrossRef]
  63. Indraratna, B.; Lackenby, J.; Christie, D. Effect of Confining Pressure on the Degradation of Ballast under Cyclic Loading. Geotechnique 2005, 55, 325–328. [Google Scholar] [CrossRef]
  64. Koyama, E.; Ito, K.; Hayano, K.; Momoya, Y. A New Approach for Evaluating Lateral Resistance of Railway Ballast Associated with Extended Sleeper Spacing. Soils Found. 2021, 61, 1565–1580. [Google Scholar] [CrossRef]
  65. Esmaeili, M.; Khodaverdian, A.; Neyestanaki, H.K.; Nazari, S. Investigating the Effect of Nailed Sleepers on Increasing the Lateral Resistance of Ballasted Track. Comput. Geotech. 2016, 71, 1–11. [Google Scholar] [CrossRef]
Figure 1. The model’s schematic: (a) the longitudinal section model before the removal of walls in the direction of lateral force, (b) the longitudinal section model subsequent to the deletion of walls in the direction of lateral force, and (c) the cross-section model.
Infrastructures 09 00129 g001
Figure 2. The dimensions of concrete sleeper type B70 are provided in millimeters.
Infrastructures 09 00129 g002
Figure 3. The concrete sleeper is depicted as follows: (a) a 3D sketch of sleeper type B70 in the form of an STL (Standard Triangle Language) file, and (b) a clump particle generated in PFC (Particle Flow Code) to represent the sleeper element.
Infrastructures 09 00129 g003
Figure 4. The concept of an angular measure of smoothness was introduced by Taghavi [54].
Infrastructures 09 00129 g004
Figure 5. The ballast size distribution initially follows the No. 24 specification. After ballast breakage occurs, a set of newly assumed distributions is investigated.
Infrastructures 09 00129 g005
Figure 6. The behavioral and rheological aspects of the linear model. (a) A schematic representation illustrating the vertical and horizontal forces of the linear model. (b) A schematic representation illustrating the linear contact between two particles, adapted from reference [40].
Infrastructures 09 00129 g006
Figure 7. The process of STPT Modelling in DEM.
Infrastructures 09 00129 g007
Figure 8. Evaluation of the lateral force–displacement curve by comparing simulated and experimental data [39].
Infrastructures 09 00129 g008
Figure 9. The factor of lateral resistance for 3.5 mm displacement [62].
Infrastructures 09 00129 g009
Figure 10. Evaluation of the ballast breakage index (BBI), modified in accordance with [63].
Infrastructures 09 00129 g010
Figure 11. DEM results of L R F 3.5 and regression of lateral resistance factor–ballast breakage index curve.
Infrastructures 09 00129 g011
Figure 12. L R F 3.5 simulated compared to L R F 3.5 predicted by the Equation (5).
Infrastructures 09 00129 g012
Table 1. Used particle size distributions.
Kind of PSDPercentage of Passing (%)
Sieve Size (mm) No. 24No. 25No. 57No. 5No. 4ANo. 4No. 3#5#4#3#2#1
75100100------------------------------
639080------100---100100------------
50---60------90509590100100100---
38.1---------------------35909090100
37.52550100100609035---------------
25---159590102015520707090
19.050------75---15---05305070
12.5---56035---55---0202540
9.5---0---153---0------01020
4.75------10000------------00
2.36------5---------------------------
Table 2. Mechanical requirements and particle sizes used in DEM simulation in comparison with experimental [24] parameters.
Parameters of ContactSymbolUnitsValue in SimulationExperimental Value [39]
Shear elastic modulus G P a -- 8.9 × 10 9
Poisson’s ratio of ballast ν ---- 0.2
Ballast particle density γ b k g / m 3 2600 2600
Sleeper clump density γ s k g / m 3 2500 2500
Interparticle friction coefficient F I -- 0.9 0.9
Side wall friction coefficient f w s -- 1 × 1 0 8 --
Base wall friction coefficient (subgrade) f w b -- 057 --
Wall’s normal and shear stiffness K s w ,   K n w P a 10 8 --
Table 3. Summary of linear contact model’s parameters for different PSD.
PSDDiameter of Particles (mm) R A (mm) R B (mm) R e (mm) R ~ e (mm) δ n (mm) K n (Pa) K s (Pa)
No. 2463.4, 38.1, 1931.719.0523.817
9.519.0512.70.85 0.4 × 1 0 8 0.53 × 1 0 8
31.79.514.6
38.1, 25.4, 19.0519.0512.715.2412.13
#419.059.5212.70.6 0.28 × 1 0 8 0.37 × 1 0 8
12.76.358.5
No. 338.1, 25.4, 19.05, 12.719.0512.715.2410.74
19.059.5212.7
19.056.359.52
12.79.5210.880.54 0.25 × 1 0 8 0.33 × 1 0 8
12.76.358.5
9.526.357.62
#350, 37.5, 25, 12.52518.7521.4313.47
2512.516.7
256.25100.67 0.31 × 1 0 8 0.42 × 1 0 8
18.7512.515
18.756.259.37
12.56.258.3
No. 4A50, 37.5, 25, 9.52518.7521.412.59
2512.516.7
254.7580.63 0.29 × 1 0 8 0.39 × 1 0 8
18.7512.515
18.7512.57.6
18.756.256.9
#238.1, 25.4, 19.05, 12.719.0512.715.210.74
19.059.52512.7
19.056.359.520.54 0.25 × 1 0 8 0.33 × 1 0 8
12.79.52510.88
12.76.358.47
9.5256.357.62
No. 437.5, 25, 1918.7512.51511.98
18.759.512.60.6 0.28 × 1 0 8 0.37 × 1 0 8
12.56.258.3
No. 525, 19, 12.5, 9.512.59.510.797.54
12.56.258.3
12.54.756.90.38 0.18 × 1 0 8 0.23 × 1 0 8
9.56.257.5
9.54.756.3
6.254.755.4
No. 5725, 12.5, 4.7512.56.258.35.25
12.52.37540.26 0.12 × 1 0 8 0.16 × 1 0 8
6.252.3753.4
#125.4, 19.05, 12.7, 9.2512.79.52510.97.01
12.76.358.47
12.74.6256.780.35 0.16 × 1 0 8 0.22 × 1 0 8
9.5256.357.62
9.5254.6256.23
6.354.6255.35
Disclaimer/Publisher’s Note: The statements, opinions and data contained in all publications are solely those of the individual author(s) and contributor(s) and not of MDPI and/or the editor(s). MDPI and/or the editor(s) disclaim responsibility for any injury to people or property resulting from any ideas, methods, instructions or products referred to in the content.