Article

The Effect of Access to Waterbodies and Parks on Walking and Cycling in Urban Areas

1
GRETTIA, Components and Systems Department (COSYS), Gustave Eiffel University, 77454 Marne-la-Vallée, France
2
Perceptions, Interactions, Behaviors & Simulations of Road and Street Users (PICS-L), Components and Systems Department (COSYS), Gustave Eiffel University, 77454 Marne-la-Vallée, France
*
Author to whom correspondence should be addressed.
Infrastructures 2024, 9(12), 235; https://doi.org/10.3390/infrastructures9120235
Submission received: 24 October 2024 / Revised: 5 December 2024 / Accepted: 9 December 2024 / Published: 17 December 2024
(This article belongs to the Special Issue Sustainable Infrastructures for Urban Mobility)

Abstract

:
This pilot study investigated whether good and bad access to waterbodies and parks have different impacts on walking and cycling in neighborhoods in urban areas. Focusing on Paris, France, the neighborhoods were classified based on their access to the two natural environments through GIS analysis. Active mobility, past behavior, trip purpose, and subjective evaluation were collected through an online survey. The subjective evaluation included infrastructure satisfaction and the perception of transport mode choice, urban area aesthetic level, safety, health, and preference for active mobility over car use. Descriptive analyses, Mann–Whitney tests, and Fisher’s exact tests were conducted to compare between two access groups and between cycling and walking. Active mobility was mainly performed for utilitarian purposes. Weekly cycling frequency was found to be lower than walking. Access to natural environments mainly impacts walking. Contrary to general belief, cycling frequency is higher in neighborhoods with bad access to waterbodies than in ones with good access. Contrary to expectations, this study found little significant effect on active mobility in the accessibility to both natural environments. This study also highlights the influence of dominant active mobility purposes in urban areas with respect to access to natural environments, and provides a subjective evaluation for active mobility.

1. Introduction

Active mobility trips, such as walking and cycling, are increasing in urban areas due to health, social, economic, and environmental benefits [1,2]. To continue this trend, it is important to assess the trip quality, address the barriers, and discover the facilitators that can encourage more frequent walking and cycling. Subjective evaluation has been extensively applied when assessing the satisfaction and perception of active mobility [3]. It allows us to understand how aspects related to walking and cycling are perceived, specifically the attitude and behavior of road users, the interaction between road users on the road, and the mobility elements in urban areas, such as the infrastructure, visual appearance of the streetscape, and natural environment.
The natural environment is an integral part of urban areas, particularly where active mobility trips are conducted. Two types of natural environments can be defined, i.e., blue and green environments. The blue environment includes natural and artificial waterbodies, such as rivers, canals, lakes, and fountains, while the green environment is related to vegetation. Both blue and green environments are essential in addressing the ongoing climate issue by creating cooling effects in the built environment [4,5]. Walking and cycling in pleasant weather conditions and places with natural shade from trees are more favorable [6]. The increase in active mobility trips significantly reduces CO2 emissions [7]. Therefore, it is evident that the natural environment and active mobility are related from the perspective of climate-related topics.
Furthermore, the natural environment is seen as a leisure destination and a place to conduct social activity [8]. It increases the aesthetic levels in urban spaces, contributing to the decision to visit these places [9]. Trees provide a natural enclosure for road users, which positively affects perceived safety [10]. In addition, natural environments have also been linked to psychological benefits. Vegetation and waterbodies are associated with creating pleasant and deactivating emotions, which is related to serene, relaxed, or calm situations [6,8,11].
Active mobility trips to natural environments increase when there is an improvement in the access to this destination, i.e., by providing walking or cycling infrastructure [12]. The benefit of the infrastructure improvement is not only limited to trips in the natural environment, but also contributes to active mobility in general in urban areas by increasing the infrastructure satisfaction [13]. Furthermore, aesthetic urban areas and the presence of infrastructure for active mobility positively affect road users’ attitudes, which can increase active mobility trips [14,15]. Focusing on the subjective evaluation, this pilot study aims to investigate the effect of access to waterbodies and parks in the neighborhood on walking and cycling. In detail, this study focuses on the indirect contributions that can be observed in terms of general walking and cycling activity in urban areas due to the presence of blue and green environments. We highlight the comparisons between neighborhoods with good and bad access to waterbodies and parks on past behavior, subjective perception, and infrastructure satisfaction. Considering the positive effect of the natural environment on active mobility, it was hypothesized that people who live in neighborhoods with good access to waterbodies and parks have more active mobility trips in the previous week, have higher satisfaction with active mobility infrastructure, and have a more positive subjective perception of active mobility compared to the people who live in neighborhoods with bad access to waterbodies and parks.
In the literature, various methods leverage big data to characterize how friendly environments encourage walking and cycling [16]. Geospatial analysis uses GIS data to calculate walkability and cyclability indexes [17], incorporating factors like land-use mix, intersection density, population density [18], bike lane density, road safety [19], slope [20], and connectivity. Mobile applications used to record physical activity such as Strava can also be analyzed [16]. Furthermore, sentiment analysis is a recent field of automated investigation. For instance, Chen [21] proposed a text-mining approach of qualitative narratives to assess cyclists’ satisfaction on a dataset comprising online reviews. These big data methods are interesting in defining an objective measurement of the suitability of the infrastructure for active travel. However, they do not consider any association with the natural environment.
Since the study focuses on understanding the subjective evaluation, including attitude, on active mobility in relation to access to the natural environment, an online survey was chosen to collect the data. Surveys have been widely used in studies with a focus on understanding active mobility from the users’ perspective [1,3,22,23]. Other methods, such as big data, which is widely used in active mobility studies, cannot use surveys or other subjective measurements to collect data. However, this study requires the identification of the general neighborhood of the respondents; thus, we are able to employ surveys to collect the necessary information while protecting respondents’ privacy. This is in contrast to the use of GPS recordings, where the exact locations of the activity mobility users are recorded.
By including the subjective evaluation and active mobility behavior of the actual residents of the study area, this study observed the role of active mobility in daily activities and to what extent natural environments influence the residents’ active mobility trips. By considering different types of active mobility purposes, i.e., utilitarian, recreational, and physical activity purposes, this study makes a significant contribution to the research focusing on active mobility in relation to the natural environment, especially related to waterbodies. Particularly, there is little research focusing on waterbodies in cities far from the coastline [24].
This paper is divided into seven sections. Section 2 provides an overview of the association between the natural environment and active mobility, as well as the subjective evaluation of walking and cycling. Section 3 describes the methodology used for this study. In Section 4, the results are presented, and the findings from the statistical analysis are reported. Section 5 discusses the results, while Section 6 addresses the study’s limitations and suggests directions for future research. Finally the conclusions are presented in Section 7.

2. Literature Review

2.1. The Association Between Active Mobility and Natural Environment

A number of studies found a positive association between active mobility and the natural environment, particularly due to improvements in the aesthetic quality of urban areas [25,26]. As transport modes, walking and cycling are preferred modes of transport for accessing the natural environment as these activities are often considered as a part of the experience [27]. Introducing an artificial waterbody in a built environment can attract more active mobility trips [12,28]. Similar effects have been observed with parks, particularly in promoting recreational walking [22].
Specifying the purpose of engaging in active mobility is also relevant in studies related to the natural environment. In general, three main purposes for active mobility are identified: utilitarian, recreational, and physical activity purposes. Utilitarian trips are undertaken to fulfill practical needs, such as traveling to workplaces or schools, visiting health facilities, or purchasing food at markets [29]. In contrast, recreational trips are made for personal enjoyment or pleasure, such as visiting parks for picnics or traveling to cultural sites. Meanwhile, walking and cycling for physical activity purposes are carried out for health-related reasons without a specific destination.
The growing importance and interest in adopting more sustainable transport modes for daily trips motivates people to use nonmotorized transport modes for utilitarian trips [23]. A positive relationship has been observed between living in a residential area near the workplace, surrounded by vital amenities, and accessible by public transport, and the likelihood of making trips on foot or by cycling [30,31]. Specifically, utilitarian trips prioritize efficiency and speed [32]. Environmental aesthetic attributes and leisure destinations, such as parks, are not significantly associated with utilitarian walking and cycling [3]. Therefore, when active mobility is discussed in relation to the natural environment, it is primarily in the context of recreational trips and physical activity [27,28,33].
Compared to utilitarian walking, trips for recreational and physical activity purposes are strongly associated with the visual appreciation of both built and natural environments by active mobility users, as well as the overall trip experience to reach a destination [32]. In addition, the natural environment contributes to an increase in trip frequency. People living near a waterbody are more likely to report engaging in recreational walking and cycling trips [33,34]. This positive relationship was also found regarding the accessibility to green space and recreational walking and cycling trips [35]. Engaging in physical activity in a natural environment is perceived as more enjoyable and less tiring compared to performing the same activity in an urban environment [36].
The natural environment has been included in previous research as a factor that can influence active mobility behavior. What remains unclear is the impact on active mobility of the presence and absence of the natural environment in urban areas, and further research is needed to compare the two conditions. Additionally, existing studies have primarily focused on a single active mobility purpose, largely recreational trips and physical activity. Further research is needed to consider and compare multiple active mobility purposes, particularly utilitarian trips.

2.2. Subjective Evaluation in Active Mobility

Subjective evaluation in active mobility encompass various aspects related to this activity, such as infrastructure satisfaction, perceptions of transport mode choice, perceptions of safety, perceptions of health, and perceptions of aesthetic quality [37,38,39,40,41,42]. Calvey et al. [37] identified five factors that are considered when evaluating active mobility infrastructure satisfaction: maintenance, environment, network, design, and personal satisfaction. Among these factors, well-maintained infrastructure, free from defects, is important for achieving positive satisfaction. In addition, the presence of high-quality and well-connected infrastructure can increase active mobility [43].
In addition to infrastructure quality, another widely addressed topic is the trade-off between traveling by nonmotorized transport and motorized transport, particularly by car. Several advantages associated with traveling by car need to be sacrificed when choosing active mobility as a transport mode. The preference for traveling by car is influenced by its ability to accomodate long-distance trips with less time and physical effort [44]. Traveling by car is also positively associated with greater comfort and prestige [45]. However, car use in many cities is becoming increasingly restricted or even impossible, leading to a decline in car preference in urban areas [38]. As a result, De Vos et al. [38] observed a higher preference for walking and cycling in this type of area compared to car use.
While ensuring safety is crucial for active mobility users due to their vulnerability, i.e., lack of protection against serious injuries or death upon traffic crash [46], greater attention should be paid to their safety when traveling near waterbodies and parks. Waterbodies and parks are often places for social activities across all age groups, particularly for young and elderly individuals. Regardless of visitors’ age, neighborhoods with these destinations can experience a surge in pedestrian activity, which places traffic safety of active mobility users at risk [47]. Nevertheless, the rise in active mobility trips can act as the catalyst of road infrastructure improvements, such as traffic speed reductions, which benefit vulnerable road users [48]. When objectively measured, these safety improvements have a positive association with active mobility, but limited evidence exists regarding their impact on perceived safety [3]. Addressing safety perceptions in active mobility is essential, as negative perceptions outweigh positive ones. Campos Ferreira et al. [39] summarized that negative perception of safety arise from the interaction between road users, e.g., the behavior of other road users and general road safety culture, traffic and infrastructure conditions, and other external factors such as weather.
Both active mobility and natural environment are positively associated with health. Walking and cycling trips to natural environments lead to an increase in the frequency of physical activity [12], and such destinations positively affect perceived physical and mental health [40]. Engaging in physical activity in green spaces improves mood and self-esteem, with an even greater effect observed when a waterbody is present [49]. However, the objective positive effects of waterbodies on health, such as reducing body mass index and the risk of cardiovascular disease, are limited [24].
Finally, the aesthetic quality of the environment during walking and cycling should be considered in subjective evaluations. Attractive building facades are positively associated with perceptions of walking and cycling [41]. A positive active mobility experience is more likely when the urban space features complex designs or has a distinct character, such as the presence of graffiti [50]. Regarding the natural environment, vegetation has been found to enhance the aesthetic quality of roads [42], encouraging social activity on the street and influencing the decision to opt for longer routes for visual appeal [51]. Both vegetation and waterbody exposure are positively associated with satisfaction with physical activity [52].
The natural environment has been recognized as a factor contributing to perceptions of health and aesthetic quality. Therefore, there is a need to explore how other subjective evaluation aspects relate to the natural environment, and to investigate whether these perceptions vary when people walk or cycle in neighborhoods with different levels of access to natural environments.

3. Materials and Methods

3.1. Study Location and QGIS Analysis

The study focused on the city of Paris, France, which is home to an estimated 2.1 million residents, as of 2024 [53], and is one of the most visited cities in the world. To accommodate people’s movements within the city and in its suburbs, Paris is accessible by private and public transport, including both motorized and nonmotorized vehicles. A 2022 report on trips in Paris [54] revealed that more than half of trips within the city were made on foot, with an increasing trend annually. Cycling also showed significant growth, with a 19% rise in the use of bicycle infrastructure in 2022 compared to 2021. The number of trips using Vélib’, the public bicycle sharing system in Paris, increased by 13% during the same period. For comparison, the volume of motorized traffic within the city in 2022 decreased by almost 51% compared to 2021. These observations, combined with improvements in active mobility infrastructure, show the growing importance of walking and cycling in Paris.
Paris has a total area of 105.4 km2, which is divided into 20 administrative divisions (boroughs, or arrondissements in French). Each administrative division is further divided into four neighborhoods, giving a total of 80 neighborhoods. Using QGIS, a GIS analysis was performed to classify each neighborhood based on its accessibility to waterbodies and parks. The data on neighborhood boundaries were provided by the French National Institute of Statistics and Economic Studies (INSEE) from the Aggregated Units for Statistical Information (IRIS) from the update in January 2024. Within IRIS, the French territories are divided into grids, with each grid consisting of 2000 inhabitants. In the case of Paris, one neighborhood can be divided into several grids. For this study, those grids were dissolved into one neighborhood boundary.

3.1.1. Neighborhoods Classification—Access to Waterbodies

The data on waterbodies were provided by the French National Institute of Geographic and Forestry Information (IGN) from the BD TOPO database (updated in June 2024). Due to the size of waterbodies, they may be located in multiple neighborhoods. By intersecting waterbodies with the geographic boundary of the neighborhoods, the presence of waterbodies within each neighborhood could be identified. Overall, natural and artificial waterbodies cover almost 3% of the area of Paris. The presence of three types of waterbody, i.e., the Seine River, the Canal Saint-Martin, and two big lakes in the Bois de Vincennes in the eastern part of Paris (Lac Daumesnil and Lac des Minimes) was considered as the indicator of good access to waterbodies in this study. An exception was made for a part of the Canal Saint-Martin, because it is not visible to the public in three neighborhoods. Therefore, these three neighborhoods were considered to have poor access to waterbodies. All other neighborhoods were considered to have bad access to waterbodies, including neighborhoods that have only small-sized waterbodies, e.g., fountains and ponds. Figure 1 (left) shows the neighborhoods which had good or bad access to the three waterbodies. There were more neighborhoods with bad access to waterbodies (52 neighborhoods) compared to the ones with good access (28 neighborhoods).

3.1.2. Neighborhoods Classification—Access to Parks

The data on parks were obtained from the OpenStreetMap. Figure 1 (right) shows that most Parisian neighborhoods are well served with parks of various sizes, which cover around 25% of the total area of Paris. Therefore, the classification for good access to parks was limited to the presence of large-sized parks in the neighborhoods. Similar to the GIS analysis for the waterbodies, the data for parks were intersected with the geographic boundary of the neighborhoods to identify the presence of large-sized parks in each neighborhood. Due to this technique, two big parks, i.e., Bois de Boulogne in the western Paris and Bois de Vincennes in the eastern Paris, were divided into several parts according to the number of neighborhoods where these parks are located. Figure 1 (right) shows the neighborhoods that had good or bad access to large-sized parks, where there were more neighborhoods with bad access to parks (66 neighborhoods) than with good access (14 neighborhoods).

3.2. Survey

3.2.1. Survey Design

An online survey was distributed to collect data about the subjective perception, infrastructure satisfaction, frequency, and purpose of walking and cycling in Paris. The survey was distributed to the Gustave Eiffel University mailing list and social media from July until mid-September 2024. This period was chosen considering the weather that encourages trips on foot and by bicycle. Only respondents who were above 18 years old and lived in Paris for at least one year were recruited. The restriction for the duration of living was applied to ensure respondents’ familiarity with their neighborhoods.
The respondents indicated the duration of living in their place of residence in Paris and their age. Since the survey was targeted for Parisians, respondents identified the district and neighborhood where their place of residence was located by choosing from the available options in the survey. This method was sufficient for conducting data analysis without asking the respondents to indicate their addresses. By using this information, it was possible to identify whether they lived in a neighborhood with good or bad access to waterbodies and parks.
A question was asked to let respondents choose the date they were born, i.e., if they were born between the 1st and the 15th day of the month or between the 16th and the 31st day of the month. Each option guided respondents to complete the survey focusing only on walking or cycling. The number of days of walking (of more than 10 min) or cycling in the past week was asked. Respondents who indicated walking or cycling activity for at least one day in the past week were also asked to indicate their main walking or cycling purpose. Three options were available, i.e., walking or cycling for utilitarian, recreational, and physical activity purposes. Utilitarian trips were specified in the survey as walking or cycling to the workplace, to an educational institution, to make food purchases, to have administrative or medical appointments, and to accompany dependents. Physical activity could be chosen when walking or cycling was conducted with no specific destination. The availability of cars in the household was asked for both groups. Respondents who completed the survey for cycling activity also indicated the availability of bicycles in the household.
For both activities, similar items were asked concerning the subjective perception and infrastructure satisfaction. Five statements were considered for subjective perception, i.e., the influence of the neighborhood on daily commute mode choice, walking or cycling since interesting things can be discovered, the feeling of safety and being protected, the preference of walking or cycling rather than using a car, and walking or cycling because it is healthier. Each statement was rated on a 5-point Likert scale, with 1 indicating a strong disagreement and 5 indicating a strong agreement. Then, four aspects were considered for infrastructure satisfaction, i.e., the sidewalk or cycle path width, building facade attractiveness, the separation from motorized vehicles, and the presence of defects on the sidewalk or cycle path. Each item was rated on a 5-point Likert scale, with 1 indicating a strong dissatisfaction and 5 indicating a strong satisfaction.

3.2.2. Sample

A total of 109 valid data were included in the analysis, with 58 data focused on walking and 51 data focused on cycling. All respondents lived in Paris for at least one year and were at least 18 years old. By using the neighborhood classifications on the access to waterbodies and parks, these data were classified separately. Table 1 and Table 2 show the characteristics of each group in relation to the access to waterbodies and parks, respectively. For walking, there were more respondents living in neighborhoods with bad access to waterbodies (62%) and parks (88%) than in neighborhoods with good access to waterbodies (38%) and parks (12%). This could also be observed for cycling, where there were more respondents living in neighborhoods with bad access to waterbodies (73%) and parks (80%) than in neighborhoods with good access to waterbodies (27%) and parks (20%). The average duration of living for all groups was between 12 and 29 years, which suggests a good familiarity with the neighborhoods. The average age of all groups was between 35 and 45 years. For the cycling group, the car ownership was lower than the bicycle ownership. It should be noted that the bicycle ownership was not asked for respondents who completed the survey on walking, hence the unavailability of the data.

3.3. Statistical Analysis

The descriptive statistics summarized the average and distribution of the data. Considering the ordinal data and low sample size, nonparametric tests were conducted. To compare the effect of access to waterbodies and parks on walking and cycling, Mann–Whitney tests were performed for active mobility frequency, subjective perception statements, and infrastructure satisfaction items on a 95% confidence level. Mann–Whitney tests were also performed to compare data between walking and cycling when access to waterbodies and parks was not considered. Fisher’s exact tests were performed on a 95% confidence level to determine whether there was an association between walking and cycling purposes and access to waterbodies and parks. Fisher’s exact test can be applied instead of the chi-square test when the sample size of a category is small, i.e., fewer than five [55]. Considering the low sample sizes in some of the groups, Fisher’s exact test was chosen for this study. All statistical tests were performed using R with the ‘stats’ and ‘gmodels’ libraries. Using the ‘stats’ library, Fisher’s exact tests for this study were conducted by setting the hybrid and the Monte Carlo p-value simulation to true due to the use of 2 × 3 tables, i.e., two groups of access to waterbodies or parks and three categories of active mobility purposes.

4. Results

In this section, the results of the statistical analyses are described. Significant results are also highlighted. The complete results of Mann–Whitney tests related to active mobility frequency, infrastructure satisfaction, and subjective perception can be found in Appendices’ Table A1, Table A2 and Table A3.

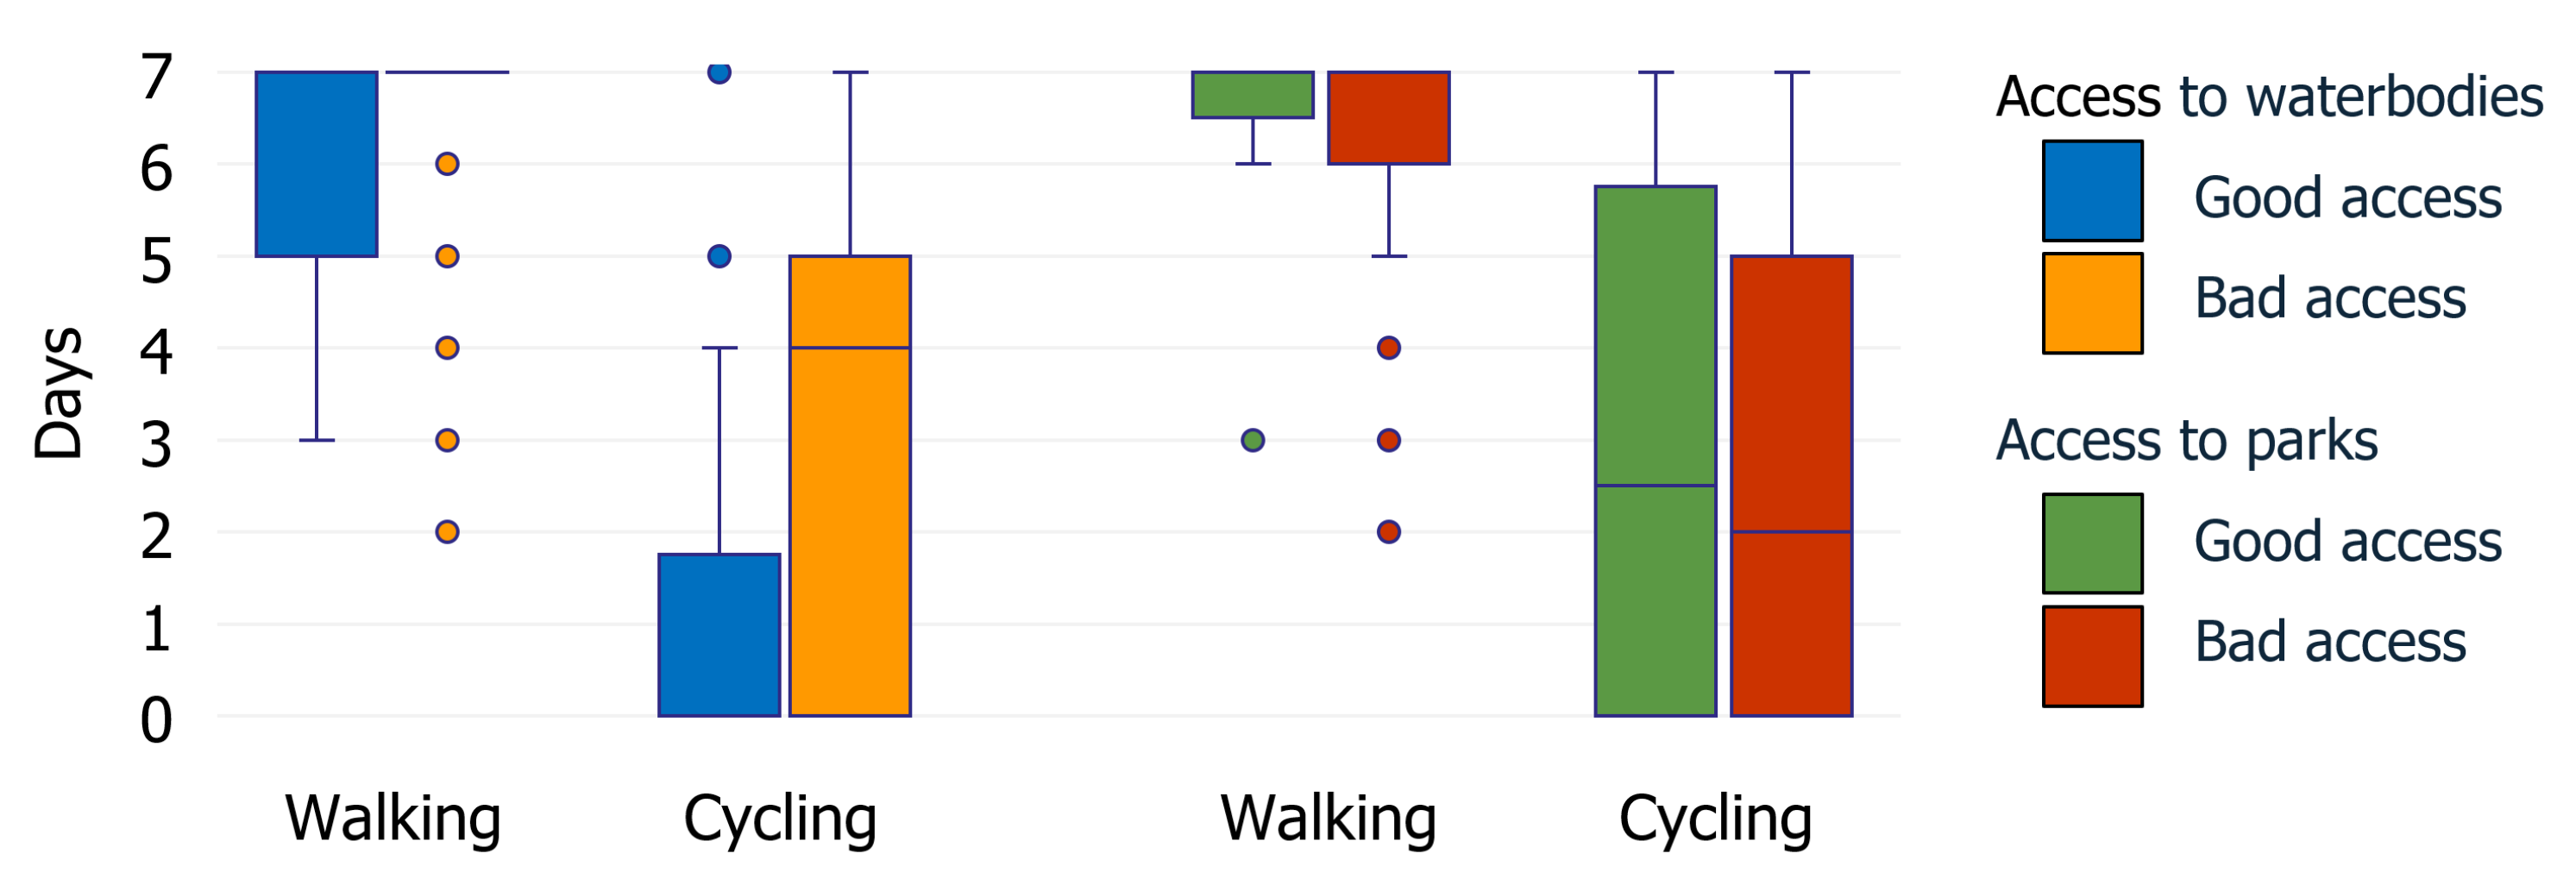
4.1. Active Mobility Frequency

Figure 2 shows the number of days of walking and cycling in the past week for the neighborhood groups. Regardless of these groups, the Mann–Whitney test showed that there was a significant difference between the walking and cycling frequencies (W = 404.5, p = 0.000). In general, walking was performed almost every day. There was a variation in cycling frequency in a week, but it was generally lower than the walking frequency.
From the Mann–Whitney tests, it was found that there was a significant difference in the cycling frequencies in relation to access to waterbodies (W = 161.5, p = 0.035). The results indicate that the cycling frequency is higher when people live in neighborhoods with bad access to waterbodies compared to the ones with good access (Table 1). There was no significant difference in walking frequencies due to the access to waterbodies, and walking and cycling frequencies due to the access to parks. As shown in Table 1, the walking frequencies for the two types of accessibility to waterbodies were similar. This finding can also be observed in relation to the accessibility to parks (Table 2).

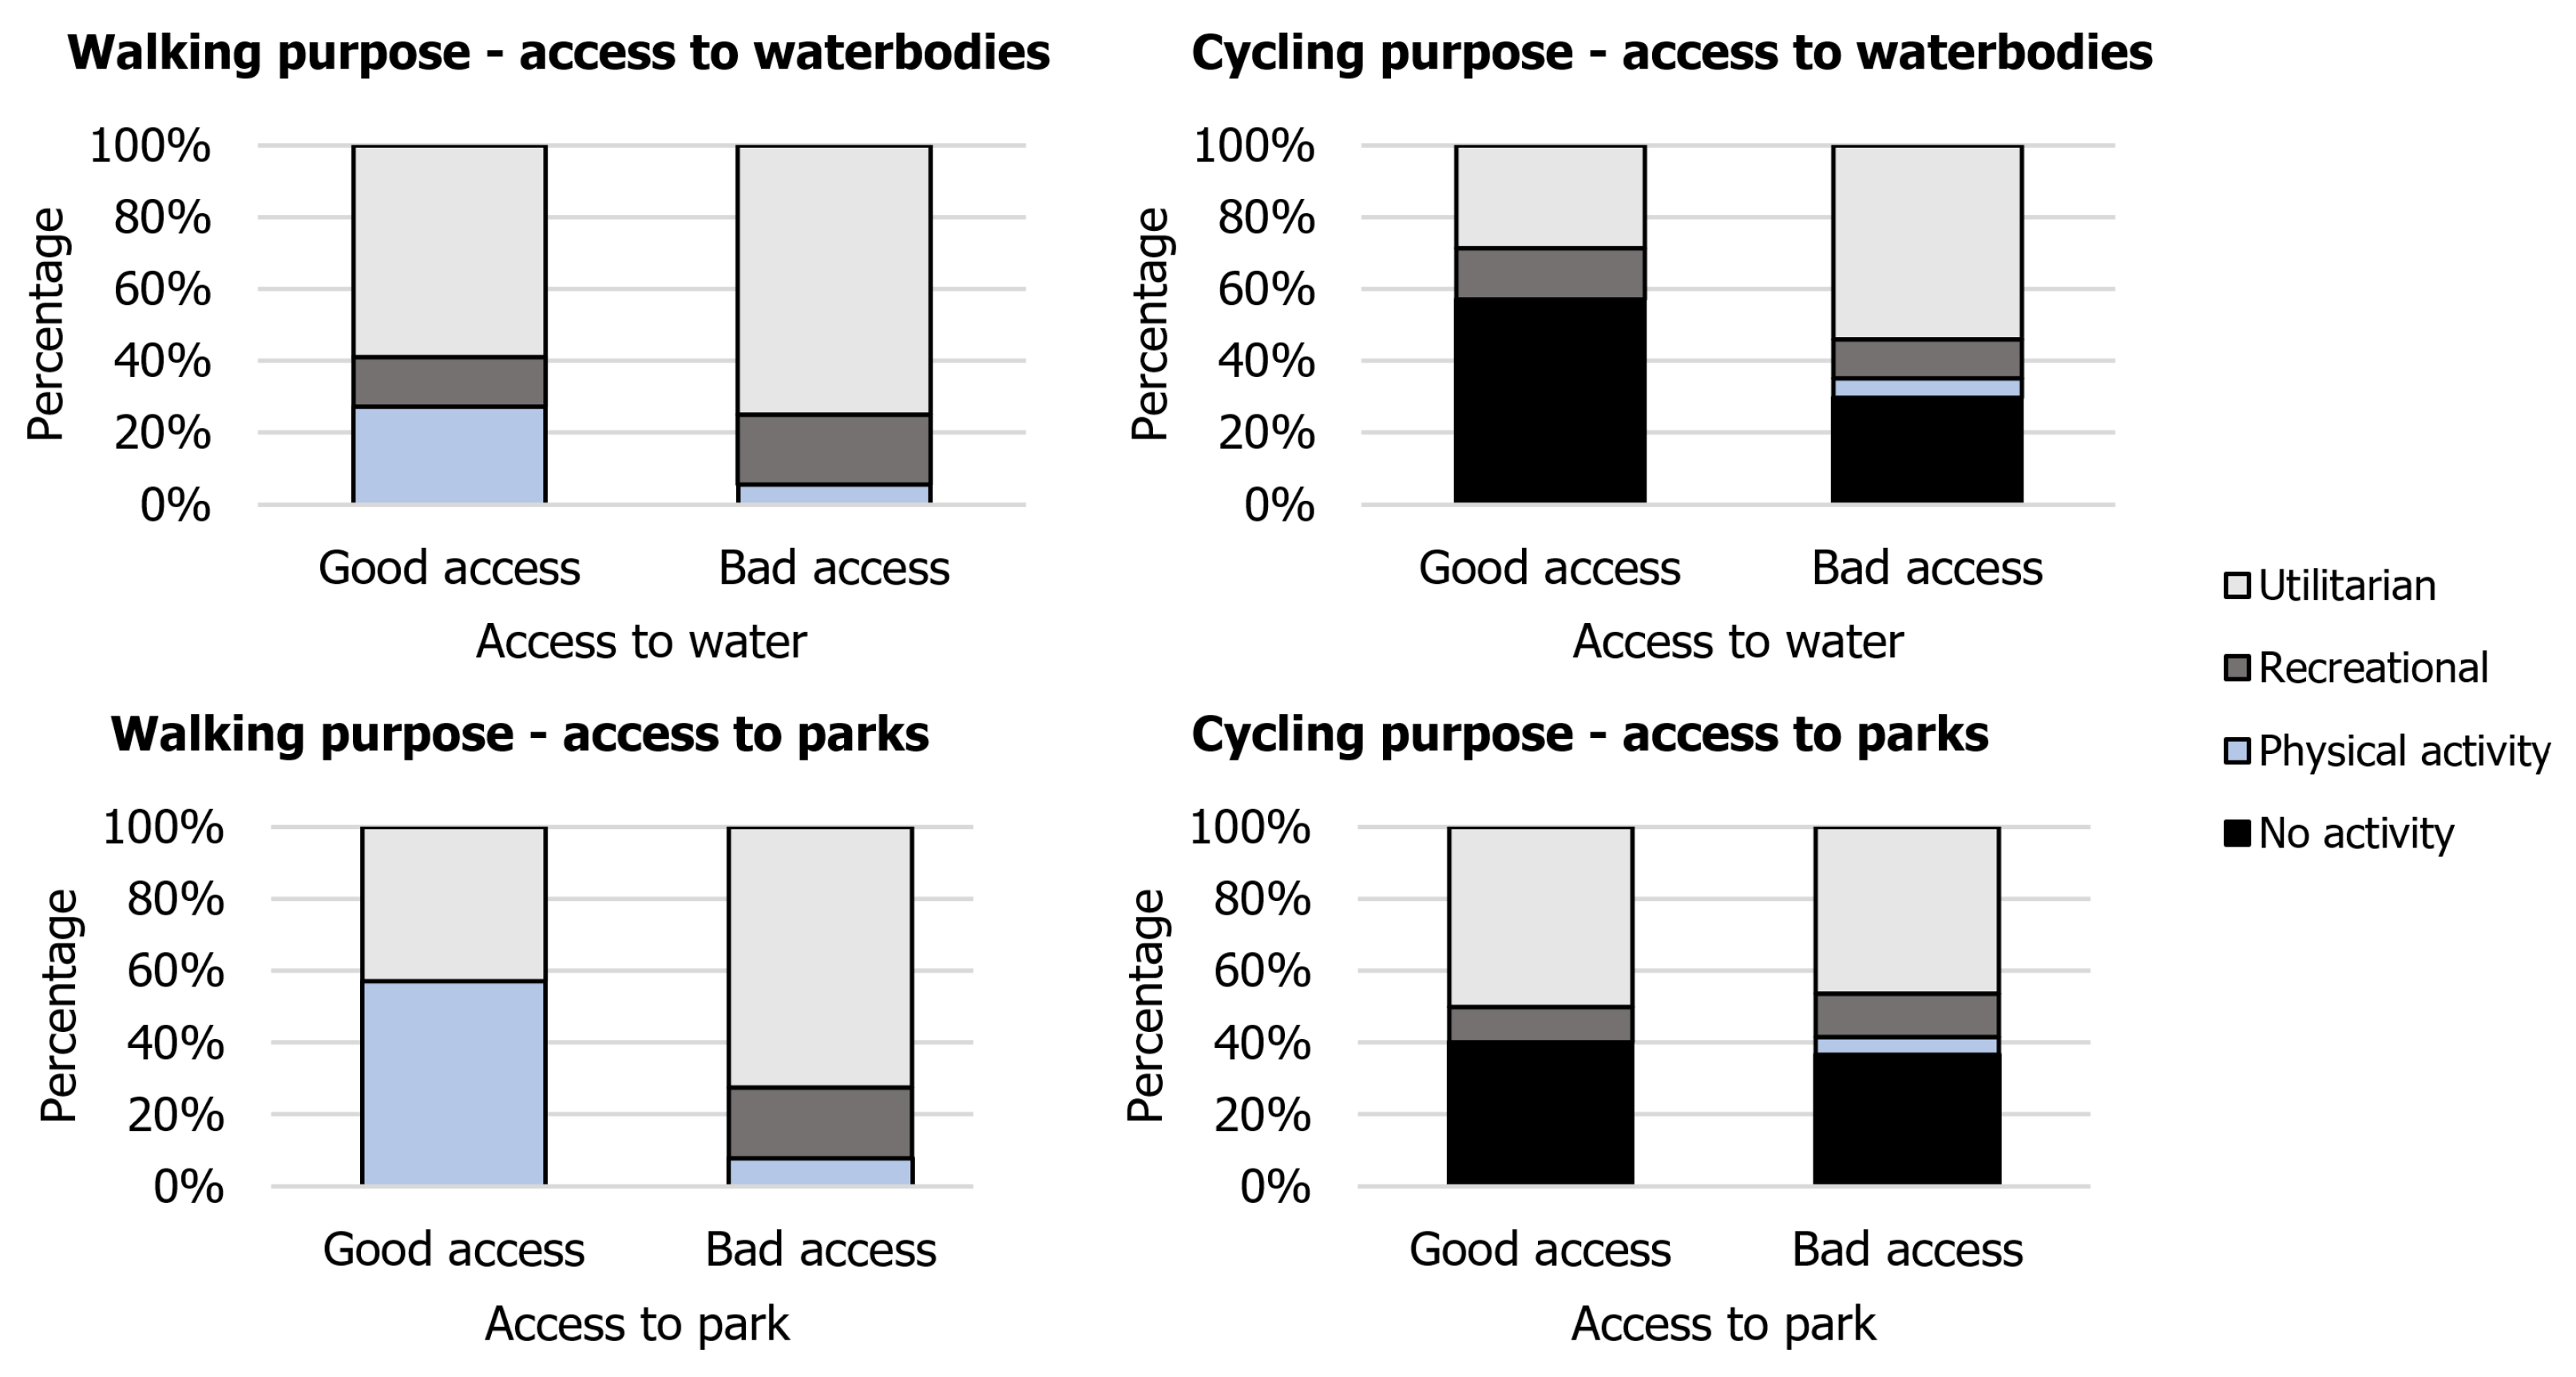
4.2. Active Mobility Purposes

One main walking or cycling purpose was chosen among three available options when these activities were performed in the past week, i.e., utilitarian, recreational, and physical activity purposes. Figure 3 shows the percentage of walking and cycling for different purposes considering the access to waterbodies and parks. As shown in Figure 2, no cycling activity was reported as well. Therefore, the percentages of no cycling activity were also included in the graphs. Among the three purposes, and regardless of access to waterbodies and parks, walking and cycling were primarily conducted for utilitarian purposes, i.e., 69% and 47%, respectively. The percentage of walking for recreational purposes was higher than for physical activity purposes, i.e., 17% and 14%, respectively. This observation was also valid for cycling, with 12% of cycling trips conducted for recreational purposes, while only 4% of cycling trips were conducted for physical activity purposes. A total of 37% of respondents reported no cycling activity in the past week.
Concerning access to waterbodies, it was found that utilitarian walking and cycling trips were conducted more frequently in neighborhoods with bad access to waterbodies. Similar observations were found for recreational walking and cycling trips for physical activity. Meanwhile, good access to waterbodies resulted in more walking for physical activity and recreational cycling, but also for no cycling activity. Despite the observable differences, Fisher’s exact tests showed no association between walking and cycling purposes and access to waterbodies (p = 0.097 and p = 0.246, respectively).
From Fisher’s exact test, an association was found between walking purposes and access to parks (p = 0.008). A majority of walking trips in neighborhoods with good access to parks were undertaken for physical activity purposes (57%) followed by utilitarian walking trips (43%), with no recreational walking reported. A majority of walking trips were conducted for utilitarian purposes in neighborhoods with bad access to parks (72%), followed by recreational trips (20%) and physical activity (8%). Utilitarian and recreational walking trips were undertaken more frequently in neighborhoods with bad access to parks. On the other hand, there was a huge contrast in walking trip frequencies for physical activity, where walking was conducted more frequently in neighborhoods with good access to parks. While Fisher’s exact test was not statistically significant (p = 1), good access to parks resulted in more utilitarian cycling trips, fewer recreational cycling trips, and fewer cycling trips for physical activity compared to the neighborhoods with bad access to the parks. However, it also meant more reports on no cycling activities in the neighborhoods with good access to parks.

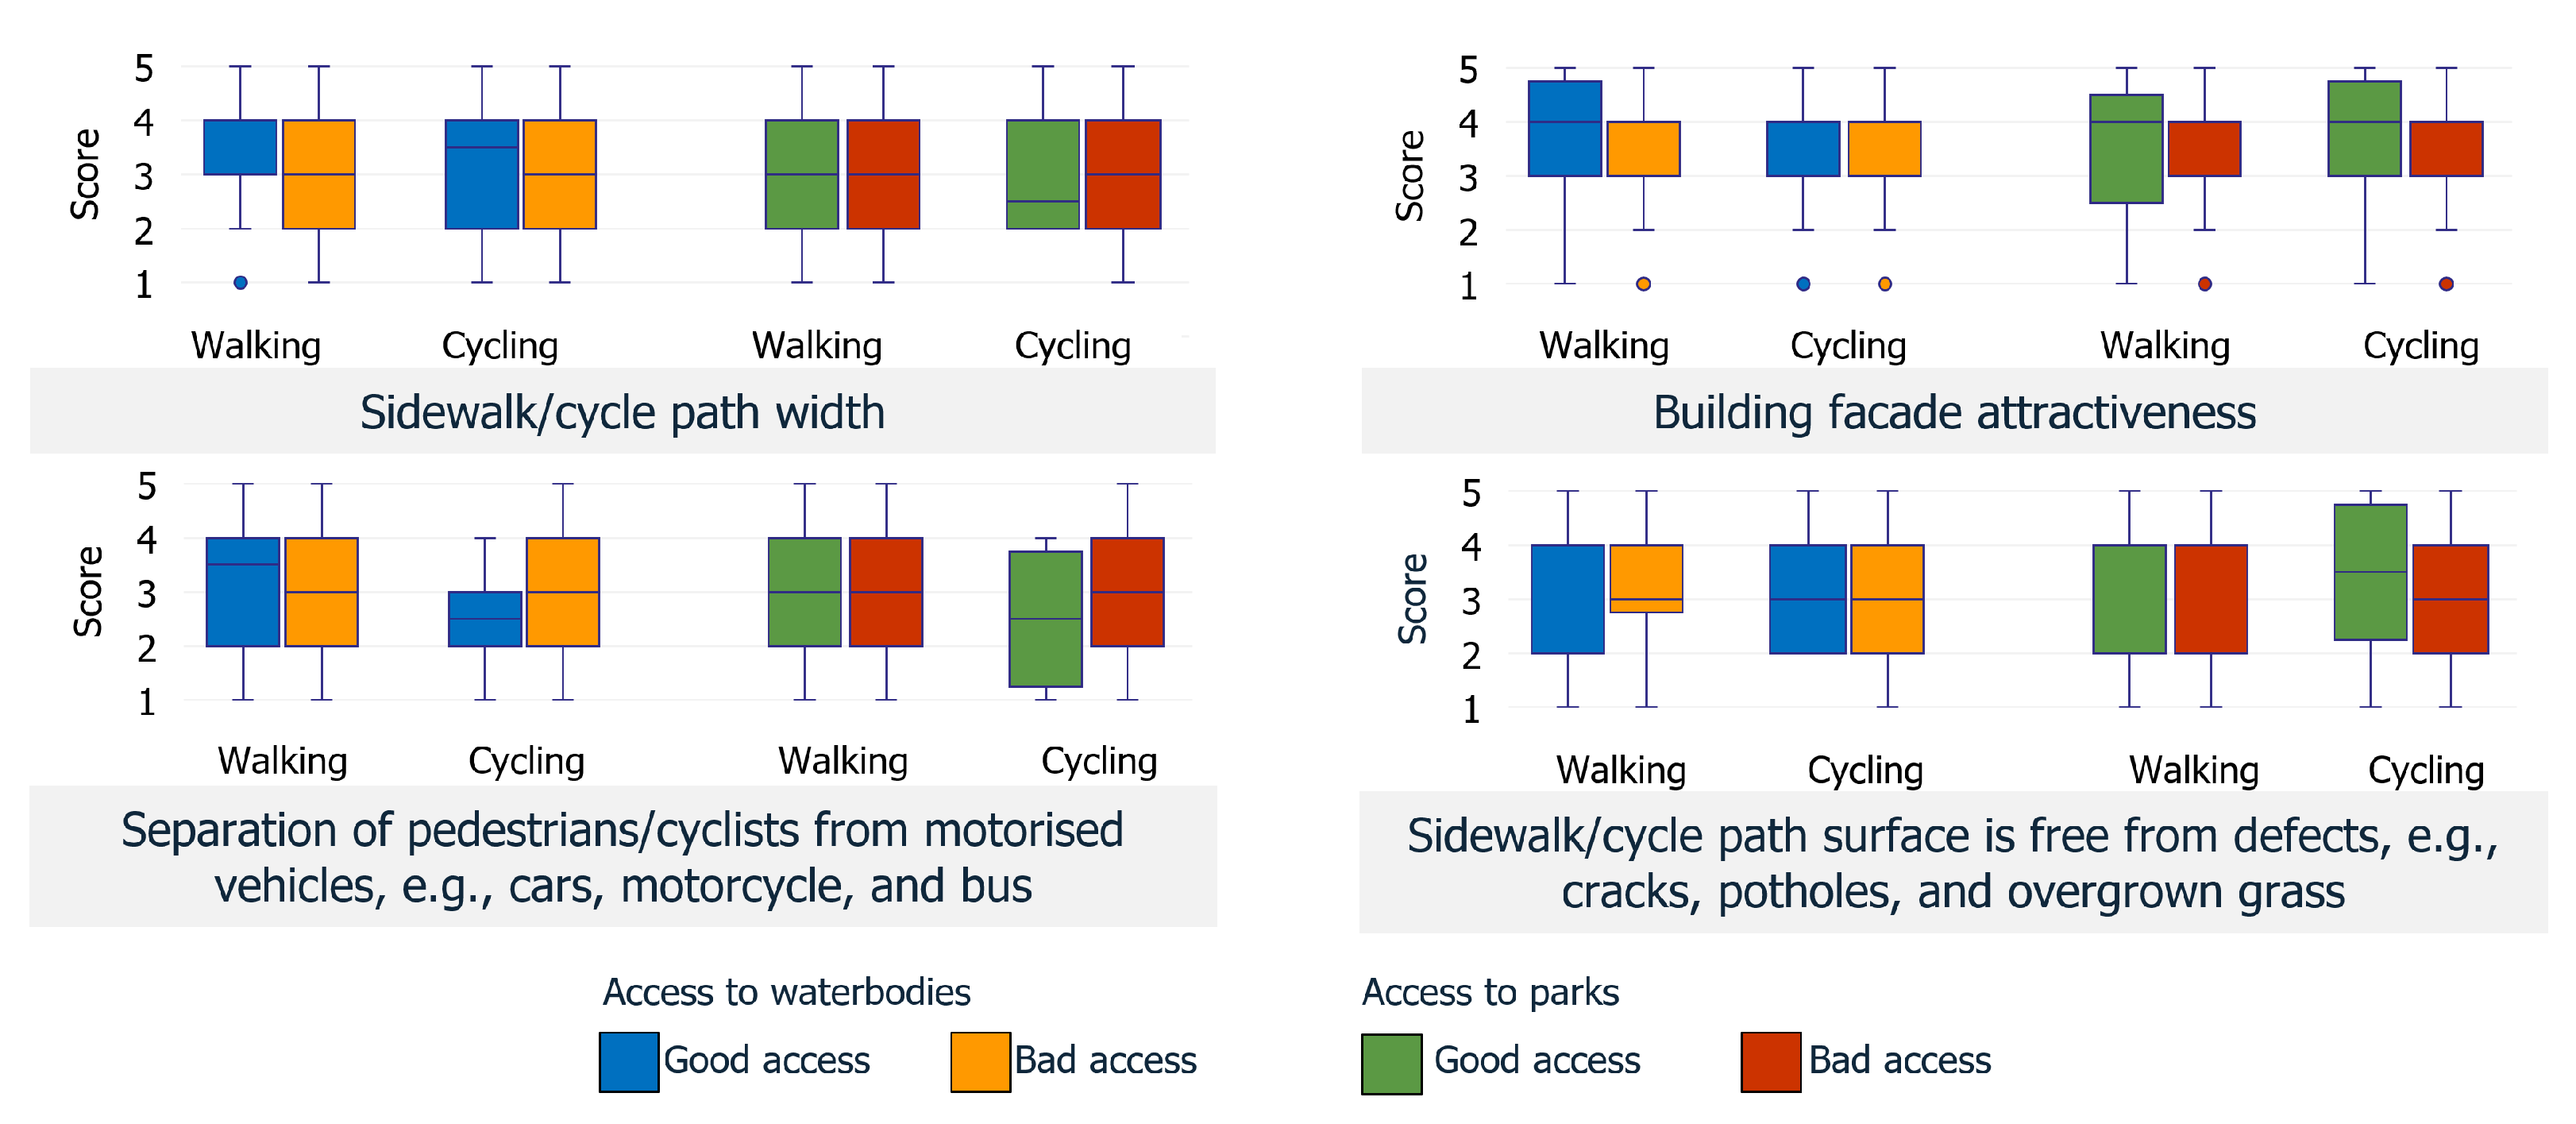
4.3. Infrastructure Satisfaction

Four aspects were considered to evaluate the satisfaction with the walking and cycling infrastructure. The score distribution is shown in Figure 4. Regardless of the accessibility to waterbodies and parks, there was no significant difference in walking and cycling infrastructure satisfaction. Pedestrians and cyclists felt neither positively nor negatively about the sidewalk or cycle path width, the separation from motorized vehicles, and the defects found on the path surface. On the other hand, they were satisfied with the building facade attractiveness.
A significant difference in the score distribution was found regarding the satisfaction with the sidewalk width due to access to waterbodies (W = 260.5, p = 0.024). There was a higher satisfaction with sidewalk width in neighborhoods with good access to waterbodies than in neighborhoods with bad access. No significant difference was found in other observations.

4.4. Subjective Perception

Five statements were asked to evaluate the subjective perception of walking and cycling in respondents’ neighborhood and in Paris. The score distribution of these statements is shown in Figure 5. In general, the responses related to walking had an agreement in all statements, indicating a positive perception of the neighborhoods of walking. Specifically, a strong agreement was found for the preference for walking to car use. Although it also applied to cycling, the agreement level was slightly lower. From the Mann–Whitney test, a significant difference in the score distribution was found regarding the preference for walking to car use due to the access to waterbodies (W = 290, p = 0.031). It means that people who live in neighborhoods with bad access to waterbodies have a higher preference for walking to car use compared to people who live in neighborhoods with good access to waterbodies. No significant difference was found for other observations.
When the access to both natural environments was not considered, a significant difference between walking and cycling trips was only found concerning the feeling of safety and being protected (W = 911, p = 0.000). Compared to pedestrians, cyclists felt less safe and less protected while cycling around the city.

5. Discussion

This pilot study compared Parisian neighborhoods based on their accessibility to waterbodies and parks, and the effect on Parisians’ walking and cycling frequencies in the past week, purposes, subjective perceptions, and infrastructure satisfaction. Surprisingly, the hypothesis that higher frequencies of active mobility, greater infrastructure satisfaction, and more positive perceptions would be found among residents of neighborhoods with good access to waterbodies and parks was not supported in general. The Mann–Whitney tests and Fisher’s exact tests showed few significant differences in relation to access to both natural environments and active mobility. Among the significant results, the initial hypothesis was supported regarding the satisfaction with sidewalk width and access to waterbodies. Furthermore, significant effects of access to waterbodies and parks in the neighborhoods were more frequently observed in walking-related aspects, such as the association between walking purposes and access to parks, sidewalk width satisfaction due to the access to waterbodies, and a preference for walking over car use due to the access to waterbodies. Meanwhile, the effects on cycling were limited to trip frequency associated with waterbody access and the feeling of safety when compared to walking, regardless of access to natural environments.
Walking is the most popular way to move around Paris, followed by using public transport, which also requires walking in some parts of one’s trip. The mode share for cycling is still small but it shows an improvement [54]. Although it is a pilot study and the sample size is small, the findings in this study were consistent with the 2022 report on trips in Paris [54], which found that there was a large contrast between trips on foot and by cycling.
Previous research has linked the natural environment with active mobility for recreational and physical activity purposes. Only one significant result was found for walking purposes due to the access to parks, which highlighted the association between access to parks and walking for physical activity purposes. Consistent with previous findings [56], this study found a higher walking frequency for physical activity purposes in neighborhoods with good access to parks compared to the ones with bad access. Parks provide space to conduct physical activity, and the vegetation also contributes to the improvement of mental health [57]. While Yang et al. [56] found a negative association between access to waterbodies and physical activity, the current study reported no association between the two aspects. The authors proposed the lack of waterbodies in the study area, i.e., Beijing, China, to explain the findings. Considering the presence of waterbodies and a high proportion of utilitarian walking and cycling in Paris, it can, thus, be suggested that the effect of waterbodies in urban areas may be weaker in explaining active mobility for different kinds of purposes.
High levels of utilitarian walking and cycling trips observed in the current study might explain the minimal significant effect of accessibility to both natural environments. This is consistent with Gao et al. [58], who reported that natural environments are not associated with active mobility trips for utilitarian purposes. Instead, Gao et al. found that factors enhancing trip efficiency, such as short distances to the nearest public transport stops, high road connectivity, and favorable weather conditions for cycling, are more relevant for utilitarian trips. The high numbers of utilitarian trips also suggest that for Parisians, walking and cycling are a part of their daily life and they are performed regardless of the influence from the built and natural environments.
The effect of high numbers of utilitarian cycling trips might also explain the significant difference in cycling frequencies due to the accessibility to waterbodies, i.e., higher numbers of cycling trips were found in neighborhoods with bad access to waterbodies than those with good access. This finding differs from those of Jansen et al. [28] and Chen et al. [34], where they found higher cycling levels in areas near waterbodies in the Netherlands (Rotterdam and Maastricht) and the USA (Seattle), respectively. A possible explanation for this might be because the Seine River, in particular, is located in the middle of Paris, which is also an area with high pedestrian volumes and tourist activities. Cyclists prefer to choose routes with less interaction with pedestrians for making utilitarian trips [59].
The significant results of the subjective evaluation for walking were related to the sidewalk width and the preference for walking over driving. Considering the efforts to improve pedestrian connectivity and restrict car use in the city [54], these significant results highlight the importance of efficient travel, which is closely associated with utilitarian trips. Similar findings were reported by Sugiyama et al. [60], where pedestrians undertaking utilitarian trips prioritized the functional aspects of the urban areas over other factors, such as safety, aesthetics, and traffic.

6. Limitations and Future Research

6.1. Limitations of the Work

Some limitations of this study were identified. As a pilot study with a small sample size, the results may have limited generalizability to the target population. The small sample size also resulted in disproportionate representation across accessibility groups, especially with respect to access to parks. To mitigate this disproportionality, accessibility classification was performed considering only two groups. Consequently, access to the two observed elements, waterbodies and parks, was oversimplified: it was based on a binary presence within neighborhoods. More complex analyses related to this research topic could be conducted with a larger sample size. Furthermore, increasing the sample size would lead to results that can be generalized to a broader context.
Nevertheless, significant results were obtained in this study, and some findings were consistent with the existing literature. Several previous pilot studies have also utilized small sample sizes with satisfactory outcomes. Boettge et al. [61] surveyed 89 cyclists to evaluate the stress levels of cycling routes in St. Louis, Missouri, USA. Smith et al. [62] conducted a pilot study with 58 participants who were asked to draw their usual walking routes to understand pedestrians’ mental mapping of their neighborhoods. Focusing on the reliability of assessment methods for further studies, Ashe et al. [63] and Fliess-Douer et al. [64] reported positive outcomes with a total of 20 and 47 analyzable data, respectively.
This pilot study focused on subjective perceptions while walking and cycling in one’s neighborhood. The active mobility frequency that was collected through the survey did not include information regarding origin and destination points. Additionally, this study focused more on past behavior rather than the intention or the decision to walk or cycle. Therefore, future research should explore the influence of the natural environment on the decision to engage in active mobility.
Further, comparisons were made between Parisian neighborhoods in the current study. Although classification was possible regarding access to the natural environment, all neighborhoods showed little variation in built environment characteristics, including the quality of active mobility infrastructure. A change in built environmental characteristics of one’s residential location might influence active mobility behavior and attitudes [65]. Future research should compare accessibility to waterbodies and parks between two urban areas with distinct characteristics, such as urban density, public transport availability, and active mobility infrastructure connectivity. Several studies already considered Paris and its suburbs [33,66], where contrasting results were obtained when the built environment characteristics were different. People living farther from the city center were also found to engage in less active mobility and were more likely to do so for recreational purposes rather than for utilitarian trips [67].
Further research should also consider comparing the effect of objective and perceived access to the natural environment in neighborhoods with similar characteristics. This is because the perception of distance to a destination and accessibility may vary among active mobility users, and a positive perception may compensate for less-favorable environmental characteristics [68]. Chan et al. suggested that the objective built environment characteristics, such as road connectivity and accessibility, have weaker effects compared to subjective or perceived connectivity and accessibility on active mobility perceptions and behavior. This suggests that a significant effect might be observed when comparing objective and perceived access to natural environments.

6.2. Perspective of the Work

Future works are planned as a continuation of this pilot study. First, the sample size will be increased, with 300 additional data being provided by the survey service Toluna (Harris Interactive). The purpose of the study is to investigate whether classification can be made for active mobility users based on their attitudes and whether differences exist across two levels of urban area characteristics at their place of residence. These two levels concern the macro level, e.g., population density and land-use mix, and the micro level, e.g., vegetation and slope. These data will be obtained through GIS analyses.
Another GIS-based study is planned using bicycle GPS recordings. As studies related to active mobility users with objective measurement are still limited, the planned study aims to provide new perspectives on the relationship between cycling trips and urban area characteristics. It will use the Almabike fleet of 600 bicycles equipped with GPS receivers to monitor their trajectories [69].
Finally, focusing on cyclists and the streetscape of the cycling environment, an ongoing experiment is being conducted using a bicycle simulator and eye-tracking glasses. The study aims to explore how cyclists behave while cycling and interacting with other road users, such as pedestrians and motorized vehicle users. It considers various infrastructure scenarios to investigate the difference and relationship between cyclists’ infrastructure preferences, emotion states, cycling speed, and eye movements.

7. Conclusions

The current study presented findings on how access to natural environments, specifically waterbodies and parks, affects walking and cycling in urban areas. Neighborhoods in Paris were classified based on whether they had good or poor access to these two types of natural environments. Perceptions and past active mobility behaviors of Paris residents were gathered through an online survey and compared. Considering that limited effects were observed regarding access to natural environments, this study provides insight that the mere presence of waterbodies and parks in a neighborhood may not be sufficient to influence active mobility perceptions and behaviors. Meanwhile, the significant results regarding subjective perceptions and infrastructure satisfaction suggest the importance of effective travel options for utilitarian trips. Nevertheless, high levels of active mobility in a city, combined with consistent improvements in infrastructure quality, contribute to more positive subjective evaluations.

Author Contributions

Conceptualization, I.S., R.B., S.A. and H.I.; methodology, I.S. and S.A.; validation, I.S., R.B., S.A. and H.I.; formal analysis, I.S.; investigation, I.S.; writing—original draft preparation, I.S. and R.B.; writing—review and editing, I.S., R.B., S.A. and H.I.; visualization, I.S.; supervision, R.B., S.A. and H.I.; project administration, R.B., S.A. and H.I.; funding acquisition, R.B., S.A. and H.I. All authors have read and agreed to the published version of the manuscript.

Funding

This project has received funding from the European Union’s Horizon 2020 research and innovation programme under the Marie Skłodowska-Curie COFUND grant agreement no. 101034248.Infrastructures 09 00235 i001

Data Availability Statement

Data are available within this article.

Conflicts of Interest

The authors declare no conflicts of interest. The funders had no role in the design of the study; in the collection, analyses, or interpretation of data; in the writing of the manuscript; or in the decision to publish the results.

Appendix A

Table A1. Mann–Whitney test results for comparing good and bad access to waterbodies and parks in relation to walking.
Dependent MeasureAccess to WaterbodyAccess to Park
W Value p Value W Value p Value
Frequency315.50.1031781
Subjective perception
   1. My neighborhood influences which transport mode I choose for daily commuting381.50.815176.50.97
   2. I often walk because there is always something interesting to be discovered3970.9931460.418
   3. I feel safe and protected while walking around the city3820.816167.50.787
   4. I prefer walking to car whenever possible2900.031 *156.50.513
   5. I walk because it is healthier245.50.775159.50.632
Infrastructure satisfaction
   1. Sidewalk width260.50.024 *157.50.609
   2. Building facade attractiveness393.50.973164.50.734
   3. Separation of pedestrians from motorized vehicles379.57891740.921
   4. Sidewalk surface is free from defects3710.682167.50.794
* p-value < 0.05.
Table A2. Mann–Whitney test results for comparing good and bad access to waterbodies and parks in relation to cycling.
Dependent MeasureAccess to WaterbodyAccess to Park
W Value p Value W Value p Value
Frequency161.50.035 *198.50.883
Subjective perception
   1. My neighborhood influences which transport mode I choose for daily commuting221.50.4191600.274
   2. I often cycle because there is always something interesting to be discovered172.50.056192.50.764
   3. I feel safe and protected while cycling around the city1750.068170.50.403
   4. I prefer cycling to car whenever possible193.50.106192.50.738
   5. I cycle because it is healthier245.50.7751390.105
Infrastructure satisfaction
   1. Cycle path width2400.6811980.871
   2. Building facade attractiveness2230.432164.50.32
   3. Separation of cyclists from motorized vehicles2090.2821710.413
   4. Cycle path surface is free from defects251.50.8781800.546
* p-value < 0.05.
Table A3. Mann–Whitney test results for comparing walking and cycling in relation to the frequency, subjective perception, and infrastructure satisfaction.
Dependent MeasureW Valuep Value
Frequency404.50.000 *
Subjective perception
   1. My neighborhood influences which transport mode I choose for daily commuting14020.629
   2. I often walk/cycle because there is always something interesting to be discovered12910.230
   3. I feel safe and protected while walking/cycling around the city9110.000 *
   4. I prefer walking/cycling to car whenever possible13230.249
   5. I walk/cycle because it is healthier13480.403
Infrastructure satisfaction
   1. Sidewalk/cycle path width13480.407
   2. Building facade attractiveness12640.172
   3. Separation of pedestrians/cyclists from motorized vehicles13090.286
   4. Sidewalk/cycle path surface is free from defects14050.642
* p-value < 0.05.

References

  1. Bornioli, A.; Parkhurst, G.; Morgan, P.L. Psychological Wellbeing Benefits of Simulated Exposure to Five Urban Settings: An Experimental Study From the Pedestrian’s Perspective. J. Transp. Health 2018, 9, 105–116. [Google Scholar] [CrossRef]
  2. Pisoni, E.; Christidis, P.; Cawood, E.N. Active mobility versus motorized transport? User choices and benefits for the society. Sci. Total Environ. 2022, 806, 150627. [Google Scholar] [CrossRef] [PubMed]
  3. Cerin, E.; Nathan, A.; van Cauwenberg, J.; Barnett, D.W.; Barnett, A. The neighbourhood physical environment and active travel in older adults: A systematic review and meta-analysis. Int. J. Behav. Nutr. Phys. Act. 2017, 14, 15. [Google Scholar] [CrossRef]
  4. Yang, F.; Yousefpour, R.; Zhang, Y.; Wang, H. The assessment of cooling capacity of blue-green spaces in rapidly developing cities: A case study of Tianjin’s central urban area. Sustain. Cities Soc. 2023, 99, 104918. [Google Scholar] [CrossRef]
  5. Ampatzidis, P.; Kershaw, T. A review of the impact of blue space on the urban microclimate. Sci. Total Environ. 2020, 730, 139068. [Google Scholar] [CrossRef] [PubMed]
  6. Sundling, C.; Jakobsson, M. How Do Urban Walking Environments Impact Pedestrians’ Experience and Psychological Health? A Systematic Review. Sustainability 2023, 15, 10817. [Google Scholar] [CrossRef]
  7. Brand, C.; Götschi, T.; Dons, E.; Gerike, R.; Anaya-Boig, E.; Avila-Palencia, I.; de Nazelle, A.; Gascon, M.; Gaupp-Berghausen, M.; Iacorossi, F.; et al. The climate change mitigation impacts of active travel: Evidence from a longitudinal panel study in seven European cities. Glob. Environ. Chang. 2021, 67, 102224. [Google Scholar] [CrossRef]
  8. Völker, S.; Kistemann, T. The impact of blue space on human health and well-being-Salutogenetic health effects of inland surface waters: A review. Int. J. Hyg. Environ. Health 2011, 214, 449–460. [Google Scholar] [CrossRef] [PubMed]
  9. Ferrer, S.; Ruiz, T.; Mars, L. A qualitative study on the role of the built environment for short walking trips. Transp. Res. Part F Traffic Psychol. Behav. 2015, 33, 141–160. [Google Scholar] [CrossRef]
  10. Harvey, C.; Aultman-Hall, L.; Hurley, S.E.; Troy, A. Effects of skeletal streetscape design on perceived safety. Landsc. Urban Plan. 2015, 142, 18–28. [Google Scholar] [CrossRef]
  11. Jin, Z.; Wang, J.; Liu, X. Attention and Emotion Recovery Effects of Urban Parks during COVID-19—Psychological Symptoms as Moderators. Forests 2022, 13, 2001. [Google Scholar] [CrossRef]
  12. Benton, J.S.; Cotterill, S.; Anderson, J.; Macintyre, V.G.; Gittins, M.; Dennis, M.; French, D.P. A natural experimental study of improvements along an urban canal: Impact on canal usage, physical activity and other wellbeing behaviours. Int. J. Behav. Nutr. Phys. Act. 2021, 18, 19. [Google Scholar] [CrossRef] [PubMed]
  13. Belaroussi, R.; Issa, E.; Cameli, L.; Lantieri, C.; Adelé, S. Exploring Virtual Environments to Assess the Quality of Public Spaces. Algorithms 2024, 17, 124. [Google Scholar] [CrossRef]
  14. Etminani-Ghasrodashti, R.; Paydar, M.; Ardeshiri, A. Recreational cycling in a coastal city: Investigating lifestyle, attitudes and built environment in cycling behavior. Sustain. Cities Soc. 2018, 39, 241–251. [Google Scholar] [CrossRef]
  15. Zhang, C.Q.; Zhang, R.; Gan, Y.; Li, D.; Rhodes, R.E. Predicting transport-related cycling in Chinese employees using an integration of perceived physical environment and social cognitive factors. Transp. Res. Part F Traffic Psychol. Behav. 2019, 64, 424–439. [Google Scholar] [CrossRef]
  16. Alattar, M.A.; Cottrill, C.; Beecroft, M. Sources and Applications of Emerging Active Travel Data: A Review of the Literature. Sustainability 2021, 13, 7006. [Google Scholar] [CrossRef]
  17. Wysling, L.; Purves, R.S. Where to improve cycling infrastructure? Assessing bicycle suitability and bikeability with open data in the city of Paris. Transp. Res. Interdiscip. Perspect. 2022, 15, 100648. [Google Scholar] [CrossRef]
  18. Karatas, P.; Tuydes-Yaman, H. Variability in sidewalk pedestrian level of service measures and rating. J. Urban Plan. Dev. 2018, 144, 04018042. [Google Scholar] [CrossRef]
  19. Ayad, L.; Imine, H.; Lantieri, C.; De Crescenzio, F. Pedal towards Safety: The Development and Evaluation of a Risk Index for Cyclists. Infrastructures 2024, 9, 14. [Google Scholar] [CrossRef]
  20. Delhoum, Y.; Belaroussi, R.; Dupin, F.; Zargayouna, M. Analysis of MATSim Modeling of Road Infrastructure in Cyclists’ Choices in the Case of a Hilly Relief. Infrastructures 2022, 7, 108. [Google Scholar] [CrossRef]
  21. Chen, L.H. Pedaling beyond ratings: A data-driven quest to Unravel the determinants of guided bicycle-tour satisfaction. Tour. Manag. 2024, 103, 104906. [Google Scholar] [CrossRef]
  22. Sugiyama, T.; Cerin, E.; Owen, N.; Oyeyemi, A.L.; Conway, T.L.; Dyck, D.V.; Schipperijn, J.; Macfarlane, D.J.; Salvo, D.; Reis, R.S.; et al. Perceived neighbourhood environmental attributes associated with adults’ recreational walking: IPEN Adult study in 12 countries. Health Place 2014, 28, 22–30. [Google Scholar] [CrossRef] [PubMed]
  23. Rejeb, R.; Bouscasse, H.; Chalabaev, A.; Mathy, S. What is the role of active mobility habits in the relationship between self-determination and modal shift intentions? A mediation analysis. Transp. Res. Part F Traffic Psychol. Behav. 2023, 99, 289–305. [Google Scholar] [CrossRef]
  24. Gascon, M.; Zijlema, W.; Vert, C.; White, M.P.; Nieuwenhuijsen, M.J. Outdoor blue spaces, human health and well-being: A systematic review of quantitative studies. Int. J. Hyg. Environ. Health 2017, 220, 1207–1221. [Google Scholar] [CrossRef] [PubMed]
  25. Huang, G.; Yu, Y.; Lyu, M.; Sun, D.; Zeng, Q.; Bart, D. Using google street view panoramas to investigate the influence of urban coastal street environment on visual walkability. Environ. Res. Commun. 2023, 5, 065017. [Google Scholar] [CrossRef]
  26. Ramirez Juarez, R.N.; Grigolon, A.B.; Madureira, A.M. Cyclists’ perception of streetscape and its influence on route choice: A pilot study with a mixed-methods approach. Transp. Res. Part F Traffic Psychol. Behav. 2023, 99, 374–388. [Google Scholar] [CrossRef]
  27. Laatikainen, T.E.; Piiroinen, R.; Lehtinen, E.; Kyttä, M. PPGIS approach for defining multimodal travel thresholds: Accessibility of popular recreation environments by the water. Appl. Geogr. 2017, 79, 93–102. [Google Scholar] [CrossRef]
  28. Jansen, F.; Ettema, D.; Kamphuis, C.; Pierik, F.; Dijst, M. How do type and size of natural environments relate to physical activity behavior? Health Place 2017, 46, 73–81. [Google Scholar] [CrossRef] [PubMed]
  29. Winters, M.; Brauer, M.; Setton, E.M.; Teschke, K. Built Environment Influences on Healthy Transportation Choices: Bicycling versus Driving. J. Urban Health 2010, 87, 969–993. [Google Scholar] [CrossRef]
  30. Stewart, O.T.; Moudon, A.V.; Saelens, B.E.; Lee, C.; Kang, B.; Doescher, M.P. Comparing Associations Between the Built Environment and Walking in Rural Small Towns and a Large Metropolitan Area. Environ. Behav. 2016, 48, 13–36. [Google Scholar] [CrossRef]
  31. Ek, K.; Wårell, L.; Andersson, L. Motives for walking and cycling when commuting—Differences in local contexts and attitudes. Eur. Transp. Res. Rev. 2021, 13, 46. [Google Scholar] [CrossRef] [PubMed]
  32. Beenackers, M.A.; Foster, S.; Kamphuis, C.B.; Titze, S.; Divitini, M.; Knuiman, M.; van Lenthe, F.J.; Giles-Corti, B. Taking Up Cycling After Residential Relocation. Am. J. Prev. Med. 2012, 42, 610–615. [Google Scholar] [CrossRef]
  33. Perchoux, C.; Kestens, Y.; Brondeel, R.; Chaix, B. Accounting for the daily locations visited in the study of the built environment correlates of recreational walking (the RECORD Cohort Study). Prev. Med. 2015, 81, 142–149. [Google Scholar] [CrossRef] [PubMed]
  34. Chen, P.; Zhou, J.; Sun, F. Built environment determinants of bicycle volume: A longitudinal analysis. J. Transp. Land Use 2017, 10, 655–674. [Google Scholar] [CrossRef]
  35. Charreire, H.; Weber, C.; Chaix, B.; Salze, P.; Casey, R.; Banos, A.; Badariotti, D.; Kesse-Guyot, E.; Hercberg, S.; Simon, C.; et al. Identifying built environmental patterns using cluster analysis and GIS: Relationships with walking, cycling and body mass index in French adults. Int. J. Behav. Nutr. Phys. Act. 2012, 9, 59. [Google Scholar] [CrossRef]
  36. Kinnafick, F.E.; Thøgersen-Ntoumani, C. The effect of the physical environment and levels of activity on affective states. J. Environ. Psychol. 2014, 38, 241–251. [Google Scholar] [CrossRef]
  37. Calvey, J.C.; Shackleton, J.P.; Taylor, M.D.; Llewellyn, R. Engineering condition assessment of cycling infrastructure: Cyclists’ perceptions of satisfaction and comfort. Transp. Res. Part A Policy Pract. 2015, 78, 134–143. [Google Scholar] [CrossRef]
  38. Vos, J.D.; Mokhtarian, P.L.; Schwanen, T.; Acker, V.V.; Witlox, F. Travel mode choice and travel satisfaction: Bridging the gap between decision utility and experienced utility. Transportation 2016, 43, 771–796. [Google Scholar] [CrossRef]
  39. Campos Ferreira, M.; Costa, P.D.; Abrantes, D.; Hora, J.; Felício, S.; Coimbra, M.; Dias, T.G. Identifying the determinants and understanding their effect on the perception of safety, security, and comfort by pedestrians and cyclists: A systematic review. Transp. Res. Part F Traffic Psychol. Behav. 2022, 91, 136–163. [Google Scholar] [CrossRef]
  40. Völker, S.; Heiler, A.; Pollmann, T.; Claßen, T.; Hornberg, C.; Kistemann, T. Do perceived walking distance to and use of urban blue spaces affect self-reported physical and mental health? Urban For. Urban Green. 2018, 29, 1–9. [Google Scholar] [CrossRef]
  41. Song, Q.; Huang, Y.; Li, W.; Chen, F.; Qiu, W. Unraveling the effects of micro-level street environment on dockless bikeshare in Ithaca. Transp. Res. Part D. Transp. Environ. 2024, 132, 104256. [Google Scholar] [CrossRef]
  42. Wang, R.; Lu, T.; Wan, C.; Sun, X.; Jiang, W. Measuring the Effects of Streetscape Characteristics on Perceived Safety and Aesthetic Appreciation of Pedestrians. J. Urban Plan. Dev. 2023, 149, 5023020. [Google Scholar] [CrossRef]
  43. Annear, M.; Fristedt, S.; Laddawong, T. Walkability in Japan’s aging neighborhoods: A comparative audit analysis of pedestrian journeys in urban Tokyo. J. Transp. Health 2024, 35, 101755. [Google Scholar] [CrossRef]
  44. Karndacharuk, A.; Wilson, D.J.; Dunn, R. A Review of the Evolution of Shared (Street) Space Concepts in Urban Environments. Transp. Rev. 2014, 34, 190–220. [Google Scholar] [CrossRef]
  45. Ettema, D.; Friman, M.; Gärling, T.; Olsson, L.E. Travel Mode Use, Travel Mode Shift and Subjective Well-Being: Overview of Theories, Empirical Findings and Policy Implications; Springer: Berlin/Heidelberg, Germany, 2016; pp. 129–150. [Google Scholar] [CrossRef]
  46. Forum, I.T. Zero Road Deaths and Serious Injuries: Leading a Paradigm Shift to a Safe System; OECD Publishing: Paris, France, 2016. [Google Scholar] [CrossRef]
  47. Luo, Y.; Liu, Y.; Xing, L.; Wang, N.; Rao, L. Road Safety Evaluation Framework for Accessing Park Green Space Using Active Travel. Front. Environ. Sci. 2022, 10, 1–19. [Google Scholar] [CrossRef]
  48. Jing, J. Seeing Streetscapes as Social Infrastructure: A Paradigmatic Case Study of Hornsbergs Strand, Stockholm. Urban Plan. 2022, 7, 510–522. [Google Scholar] [CrossRef]
  49. Barton, J.; Pretty, J. What is the best dose of nature and green exercise for improving mental health—A multi-study analysis. Environ. Sci. Technol. 2010, 44, 3947–3955. [Google Scholar] [CrossRef] [PubMed]
  50. Forsyth, A.; Oakes, J.M. Cycling, the Built Environment, and Health: Results of a Midwestern Study. Int. J. Sustain. Transp. 2015, 9, 49–58. [Google Scholar] [CrossRef]
  51. Capitanio, M. Attractive streetscape making pedestrians walk longer routes: The case of Kunitachi in Tokyo. J. Archit. Urban. 2019, 43, 131–137. [Google Scholar] [CrossRef]
  52. Huang, D.; Jiang, B.; Yuan, L. Analyzing the effects of nature exposure on perceived satisfaction with running routes: An activity path-based measure approach. Urban For. Urban Green. 2022, 68, 127480. [Google Scholar] [CrossRef]
  53. INSEE. Bilan Démographique 2023 de l’Île-de-France: Des Naissances Toujours en Baisse, 2024. Report on Population Census. Available online: https://www.insee.fr/fr/statistiques/8062506 (accessed on 1 November 2024).
  54. L’observatoire Parisien des Mobilités. Le Bilan des Déplacements en 2022 à Paris. Mairie de Paris, Direction de la Voirie et des déPlacements. 2022. Available online: https://cdn.paris.fr/paris/2023/12/19/paris_ra2022-18-12-copie-web-ZmS8.pdf (accessed on 1 November 2024).
  55. Mendenhall, W.M.; Sincich, T.L. Statistics for Engineering and the Sciences, 6th ed.; CRC Press Taylor & Francis Group: Abingdon, UK, 2016. [Google Scholar]
  56. Yang, W.; Fei, J.; Li, Y.; Chen, H.; Liu, Y. Unraveling nonlinear and interaction effects of multilevel built environment features on outdoor jogging with explainable machine learning. Cities 2024, 147, 104813. [Google Scholar] [CrossRef]
  57. Bedimo-Rung, A.L.; Mowen, A.J.; Cohen, D.A. The Significance of Parks to Physical Activity and Public Health A Conceptual Model. Am. J. Prev. Med. 2005, 28, 159–168. [Google Scholar] [CrossRef] [PubMed]
  58. Gao, J.; Kamphuis, C.B.M.; Dijst, M.; Helbich, M. The role of the natural and built environment in cycling duration in the Netherlands. Int. J. Behav. Nutr. Phys. Act. 2018, 15, 82. [Google Scholar] [CrossRef] [PubMed]
  59. Gkekas, F.; Bigazzi, A.; Gill, G. Perceived safety and experienced incidents between pedestrians and cyclists in a high-volume non-motorized shared space. Transp. Res. Interdiscip. Perspect. 2020, 4, 100094. [Google Scholar] [CrossRef]
  60. Sugiyama, T.; Neuhaus, M.; Cole, R.; Giles-Corti, B.; Owen, N. Destination and Route Attributes Associated with Adults’ Walking. Med. Sci. Sport. Exerc. 2012, 44, 1275–1286. [Google Scholar] [CrossRef]
  61. Boettge, B.; Hall, D.M.; Crawford, T. Assessing the bicycle network in St. Louis: A place-based user-centered approach. Sustainability 2017, 9, 241. [Google Scholar] [CrossRef]
  62. Smith, G.; Gidlow, C.; Davey, R.; Foster, C. What is my walking neighbourhood? A pilot study of English adults’ definitions of their local walking neighbourhoods. Int. J. Behav. Nutr. Phys. Act. 2010, 7, 34. [Google Scholar] [CrossRef]
  63. Ashe, M.C.; Winters, M.; Hoppmann, C.A.; Dawes, M.G.; Gardiner, P.A.; Giangregorio, L.M.; Madden, K.M.; McAllister, M.M.; Wong, G.; Puyat, J.H.; et al. “Not just another walking program”: Everyday Activity Supports You (EASY) model-a randomized pilot study for a parallel randomized controlled trial. Pilot Feasibility Stud. 2015, 1, 4. [Google Scholar] [CrossRef] [PubMed]
  64. Fliess-Douer, O.; Woude, L.H.V.D.; Vanlandewijck, Y.C. Development of a new scale for perceived self-efficacy in manual wheeled mobility: A pilot study. J. Rehabil. Med. 2011, 43, 602–608. [Google Scholar] [CrossRef]
  65. Ramezani, S.; Hasanzadeh, K.; Rinne, T.; Kajosaari, A.; Kyttä, M. Residential relocation and travel behavior change: Investigating the effects of changes in the built environment, activity space dispersion, car and bike ownership, and travel attitudes. Transp. Res. Part A Policy Pract. 2021, 147, 28–48. [Google Scholar] [CrossRef]
  66. Feuillet, T.; Salze, P.; Charreire, H.; Menai, M.; Enaux, C.; Perchoux, C.; Hess, F.; Kesse-Guyot, E.; Hercberg, S.; Simon, C.; et al. Built environment in local relation with walking: Why here and not there? J. Transp. Health 2016, 3, 500–512. [Google Scholar] [CrossRef]
  67. Beck, B.; Winters, M.; Nelson, T.; Pettit, C.; Leao, S.Z.; Saberi, M.; Thompson, J.; Seneviratne, S.; Nice, K.; Stevenson, M. Developing urban biking typologies: Quantifying the complex interactions of bicycle ridership, bicycle network and built environment characteristics. Environ. Plan. Urban Anal. City Sci. 2023, 50, 7–23. [Google Scholar] [CrossRef]
  68. Chan, E.T.H.; Schwanen, T.; Banister, D. The role of perceived environment, neighbourhood characteristics, and attitudes in walking behaviour: Evidence from a rapidly developing city in China. Transportation 2021, 48, 431–454. [Google Scholar] [CrossRef]
  69. Battistini, R.; Nalin, A.; Simone, A.; Lantieri, C.; Vignali, V. How do University Student Cyclists Ride? The Case of University of Bologna. Appl. Sci. 2022, 12, 11569. [Google Scholar] [CrossRef]
Figure 1. Classification of Parisian neighborhoods based on their access to (left) waterbodies and (right) parks.
Infrastructures 09 00235 g001
Figure 2. Distribution of walking and cycling frequencies in the past week.
Infrastructures 09 00235 g002
Figure 3. Percentage of walking and cycling purposes for each classification.
Infrastructures 09 00235 g003
Figure 4. Score distribution of infrastructure satisfaction.
Infrastructures 09 00235 g004
Figure 5. Score distribution of subjective perception.
Infrastructures 09 00235 g005
Table 1. Respondents’ characteristics for each neighborhood group concerning the access to waterbodies (N = 109).
Walking (N = 58)Cycling (N = 51)
GA (N = 22)BA (N = 36)GA (N = 14)BA (N = 37)
Duration of living (years) *12.4 (14.4)20.2 (16.4)15.9 (16.9)21.9 (18.5)
Age (years) *35.4 (15.9)43.4 (12.2)38.6 (15.1)45.2 (13.9)
Gender (%)
   Male40.966.735.770.3
   Female59.133.364.329.7
Car ownership (unit) *0.6 (0.7)0.4 (0.5)0.4 (0.6)0.4 (0.6)
Bicycle ownership (unit) *No dataNo data1.6 (1.7)2 (2)
Active mobility frequency (days) *5.9 (1.6)6.4 (1.3)1.4 (2.3)3.2 (2.7)
Active mobility purpose (%)
   Utilitarian59.17528.654.1
   Recreational13.619.414.310.8
   Physical activity27.35.605.4
   No activity0057.129.7
* Mean (standard deviation); GA: good access; BA: bad access.
Table 2. Respondents’ characteristics for each neighborhood group concerning the access to parks (N = 109).
Walking (N = 58)Cycling (N = 51)
GA (N = 7)BA (N = 51)GA (N = 10)BA (N = 41)
Duration of living (years) *13.3 (14.4)17.8 (16.3)29.6 (15.7)18 (18.1)
Age (years) *36.6 (17.3)40.8 (13.8)43 (13.7)43.5 (14.7)
Gender (%)
   Male42.958.85063.4
   Female57.141.25036.6
Car ownership (unit) *0.7 (0.8)0.4 (0.6)0.3 (0.5)0.4 (0.7)
Bicycle ownership (unit) *No dataNo data1.8 (2)1.9 (2)
Active mobility frequency (days) *6.3 (1.5)6.2 (1.4)2.9 (3)2.7 (2.6)
Active mobility purpose (%)
   Utilitarian42.972.55046.3
   Recreational019.61012.2
   Physical activity57.17.804.9
   No activity004036.6
* Mean (standard deviation); GA: good access; BA: bad access.
Disclaimer/Publisher’s Note: The statements, opinions and data contained in all publications are solely those of the individual author(s) and contributor(s) and not of MDPI and/or the editor(s). MDPI and/or the editor(s) disclaim responsibility for any injury to people or property resulting from any ideas, methods, instructions or products referred to in the content.

