Figure 1.
Typical aggregate profile image segmentation and geometric feature recognition for (a–c) different specimens #1~#3.
Figure 1.
Typical aggregate profile image segmentation and geometric feature recognition for (a–c) different specimens #1~#3.
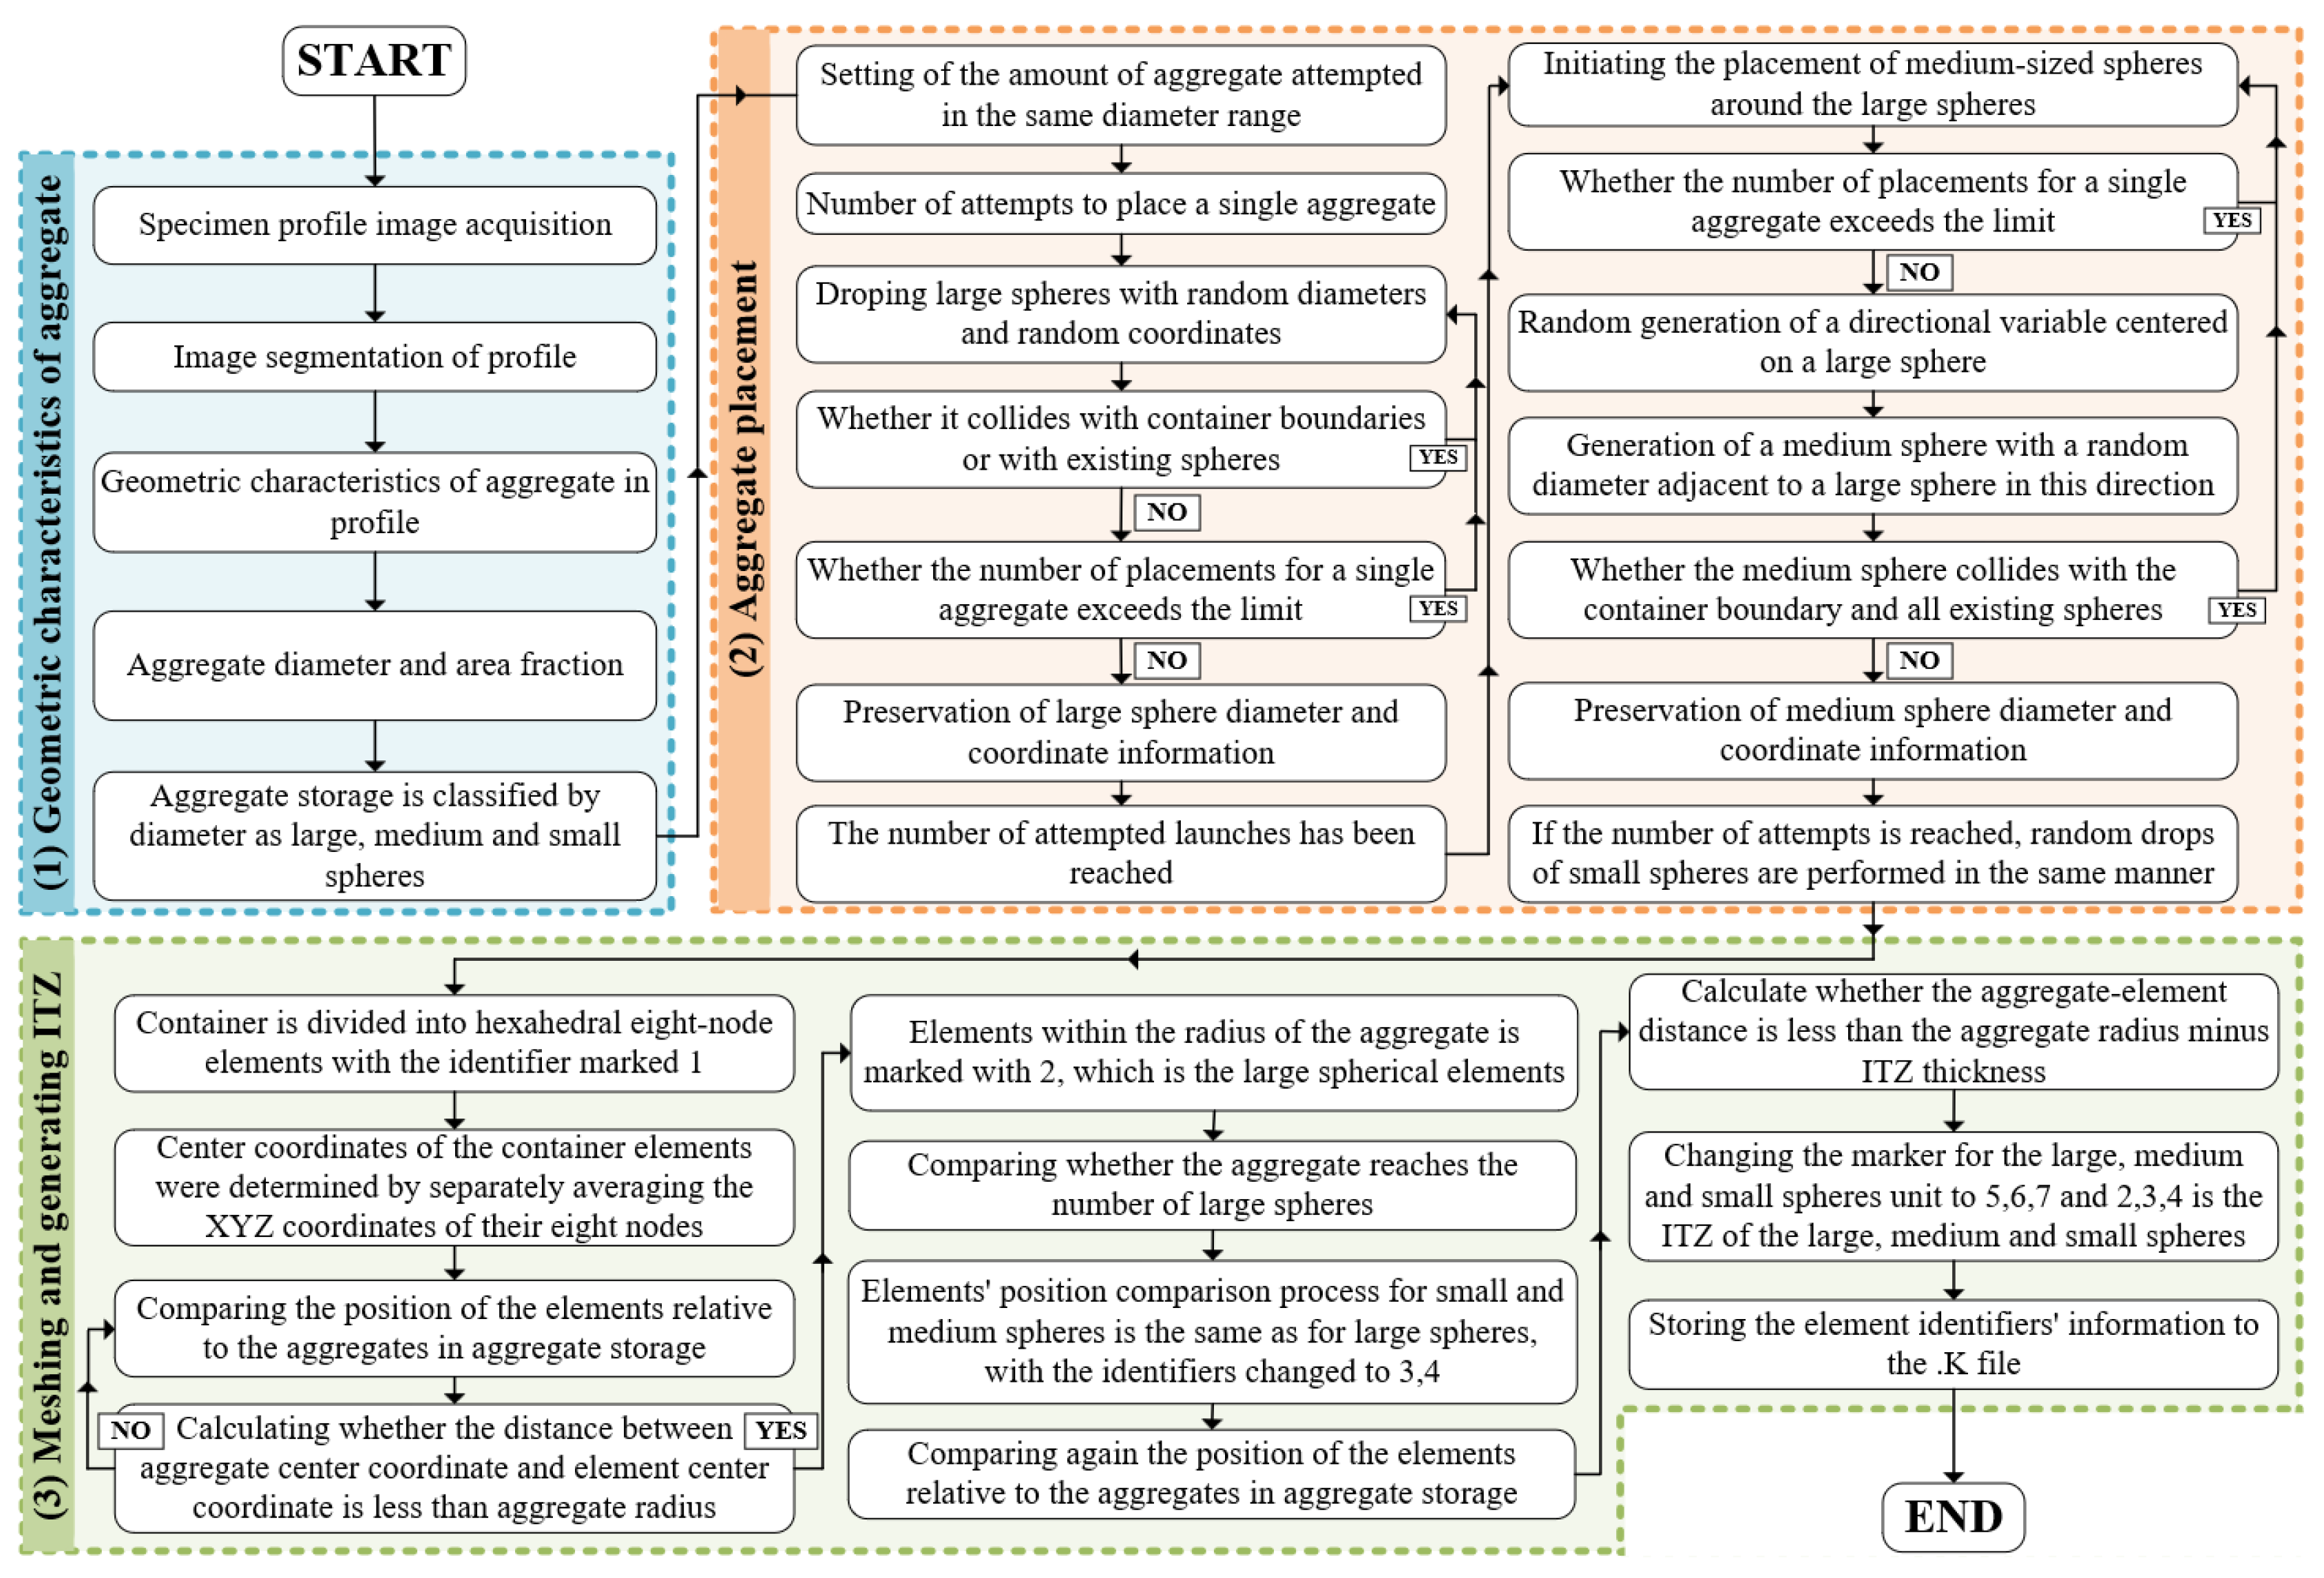
Figure 2.
Micro-modeling process of concrete with fissure-based filling method.
Figure 2.
Micro-modeling process of concrete with fissure-based filling method.
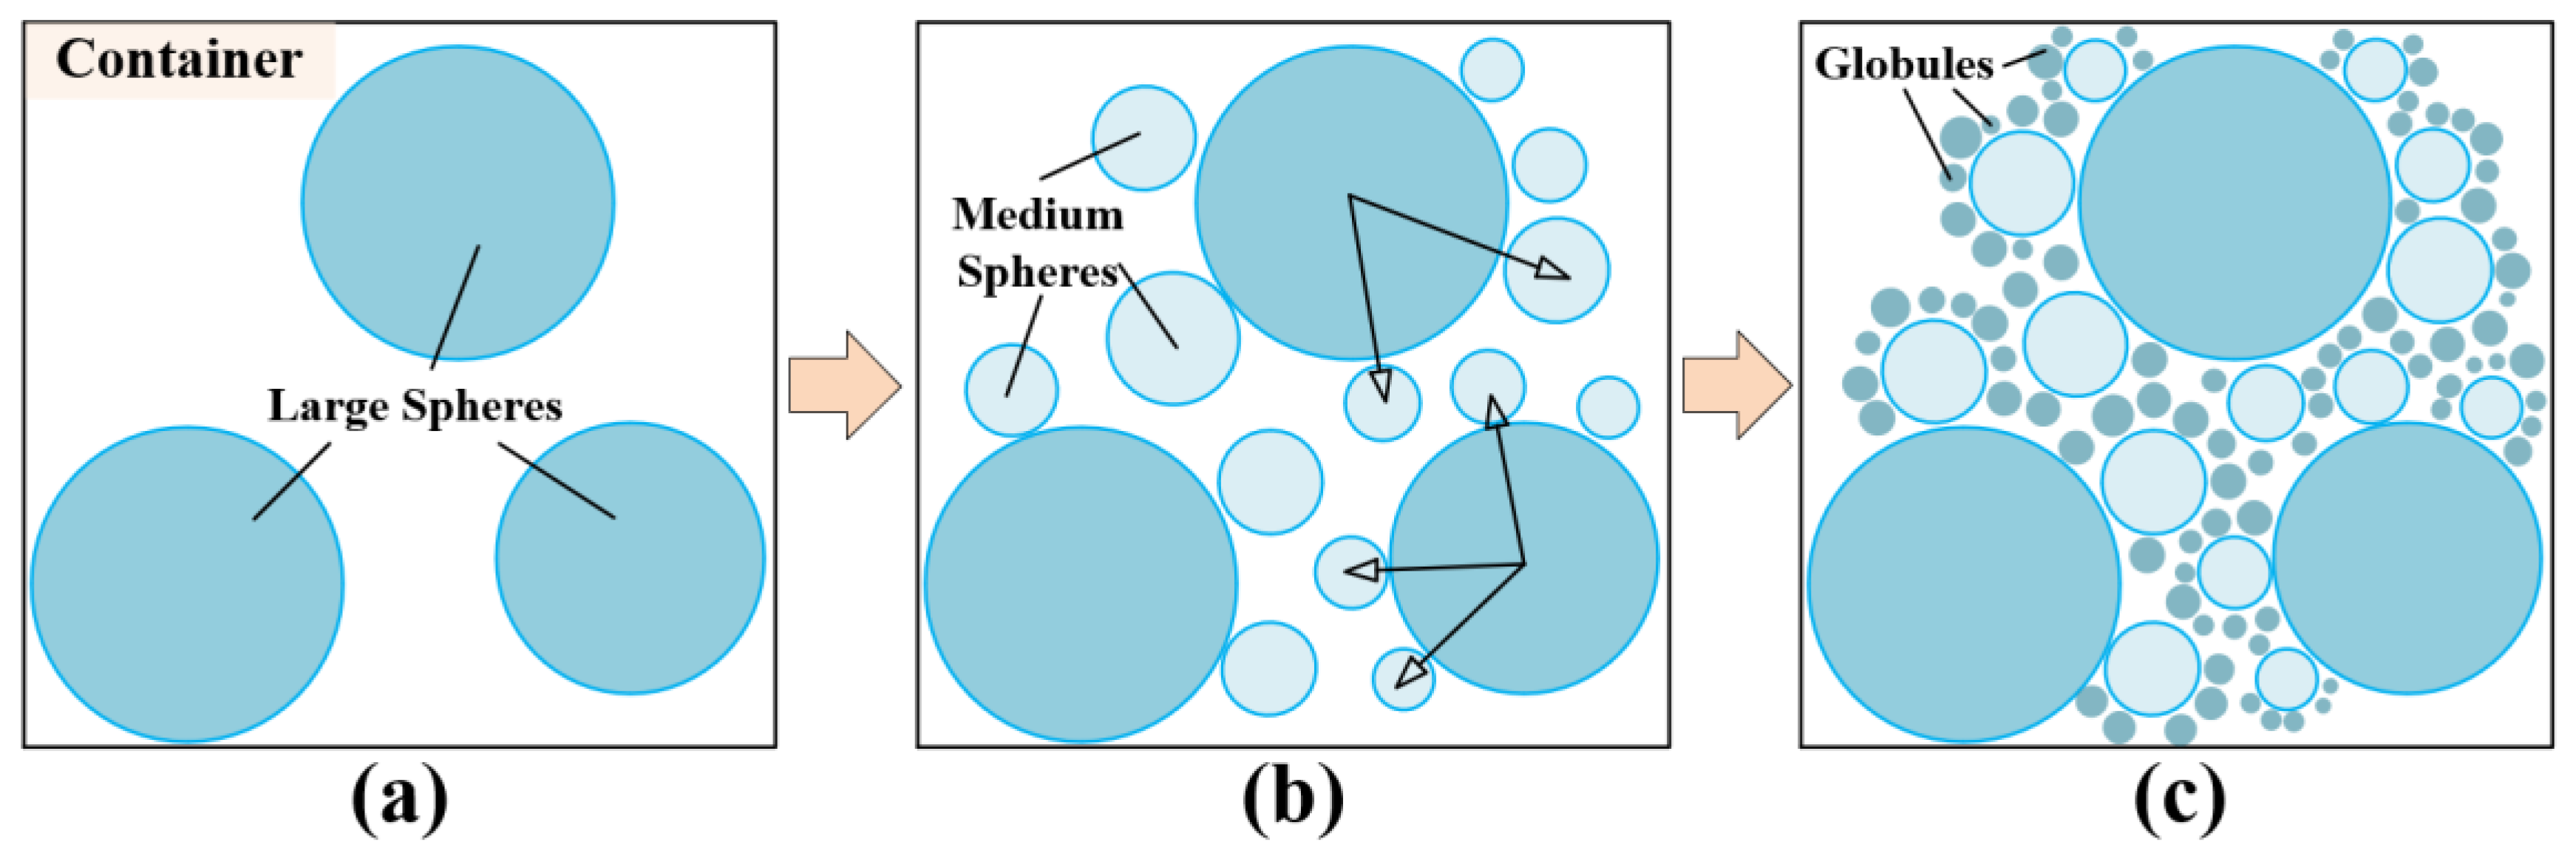
Figure 3.
Cracking filling process diagram for fissure-based filling method: (a) Droping large spheres (b) Generating random direction vectors and droping medium spheres (c) Generating small spheres.
Figure 3.
Cracking filling process diagram for fissure-based filling method: (a) Droping large spheres (b) Generating random direction vectors and droping medium spheres (c) Generating small spheres.
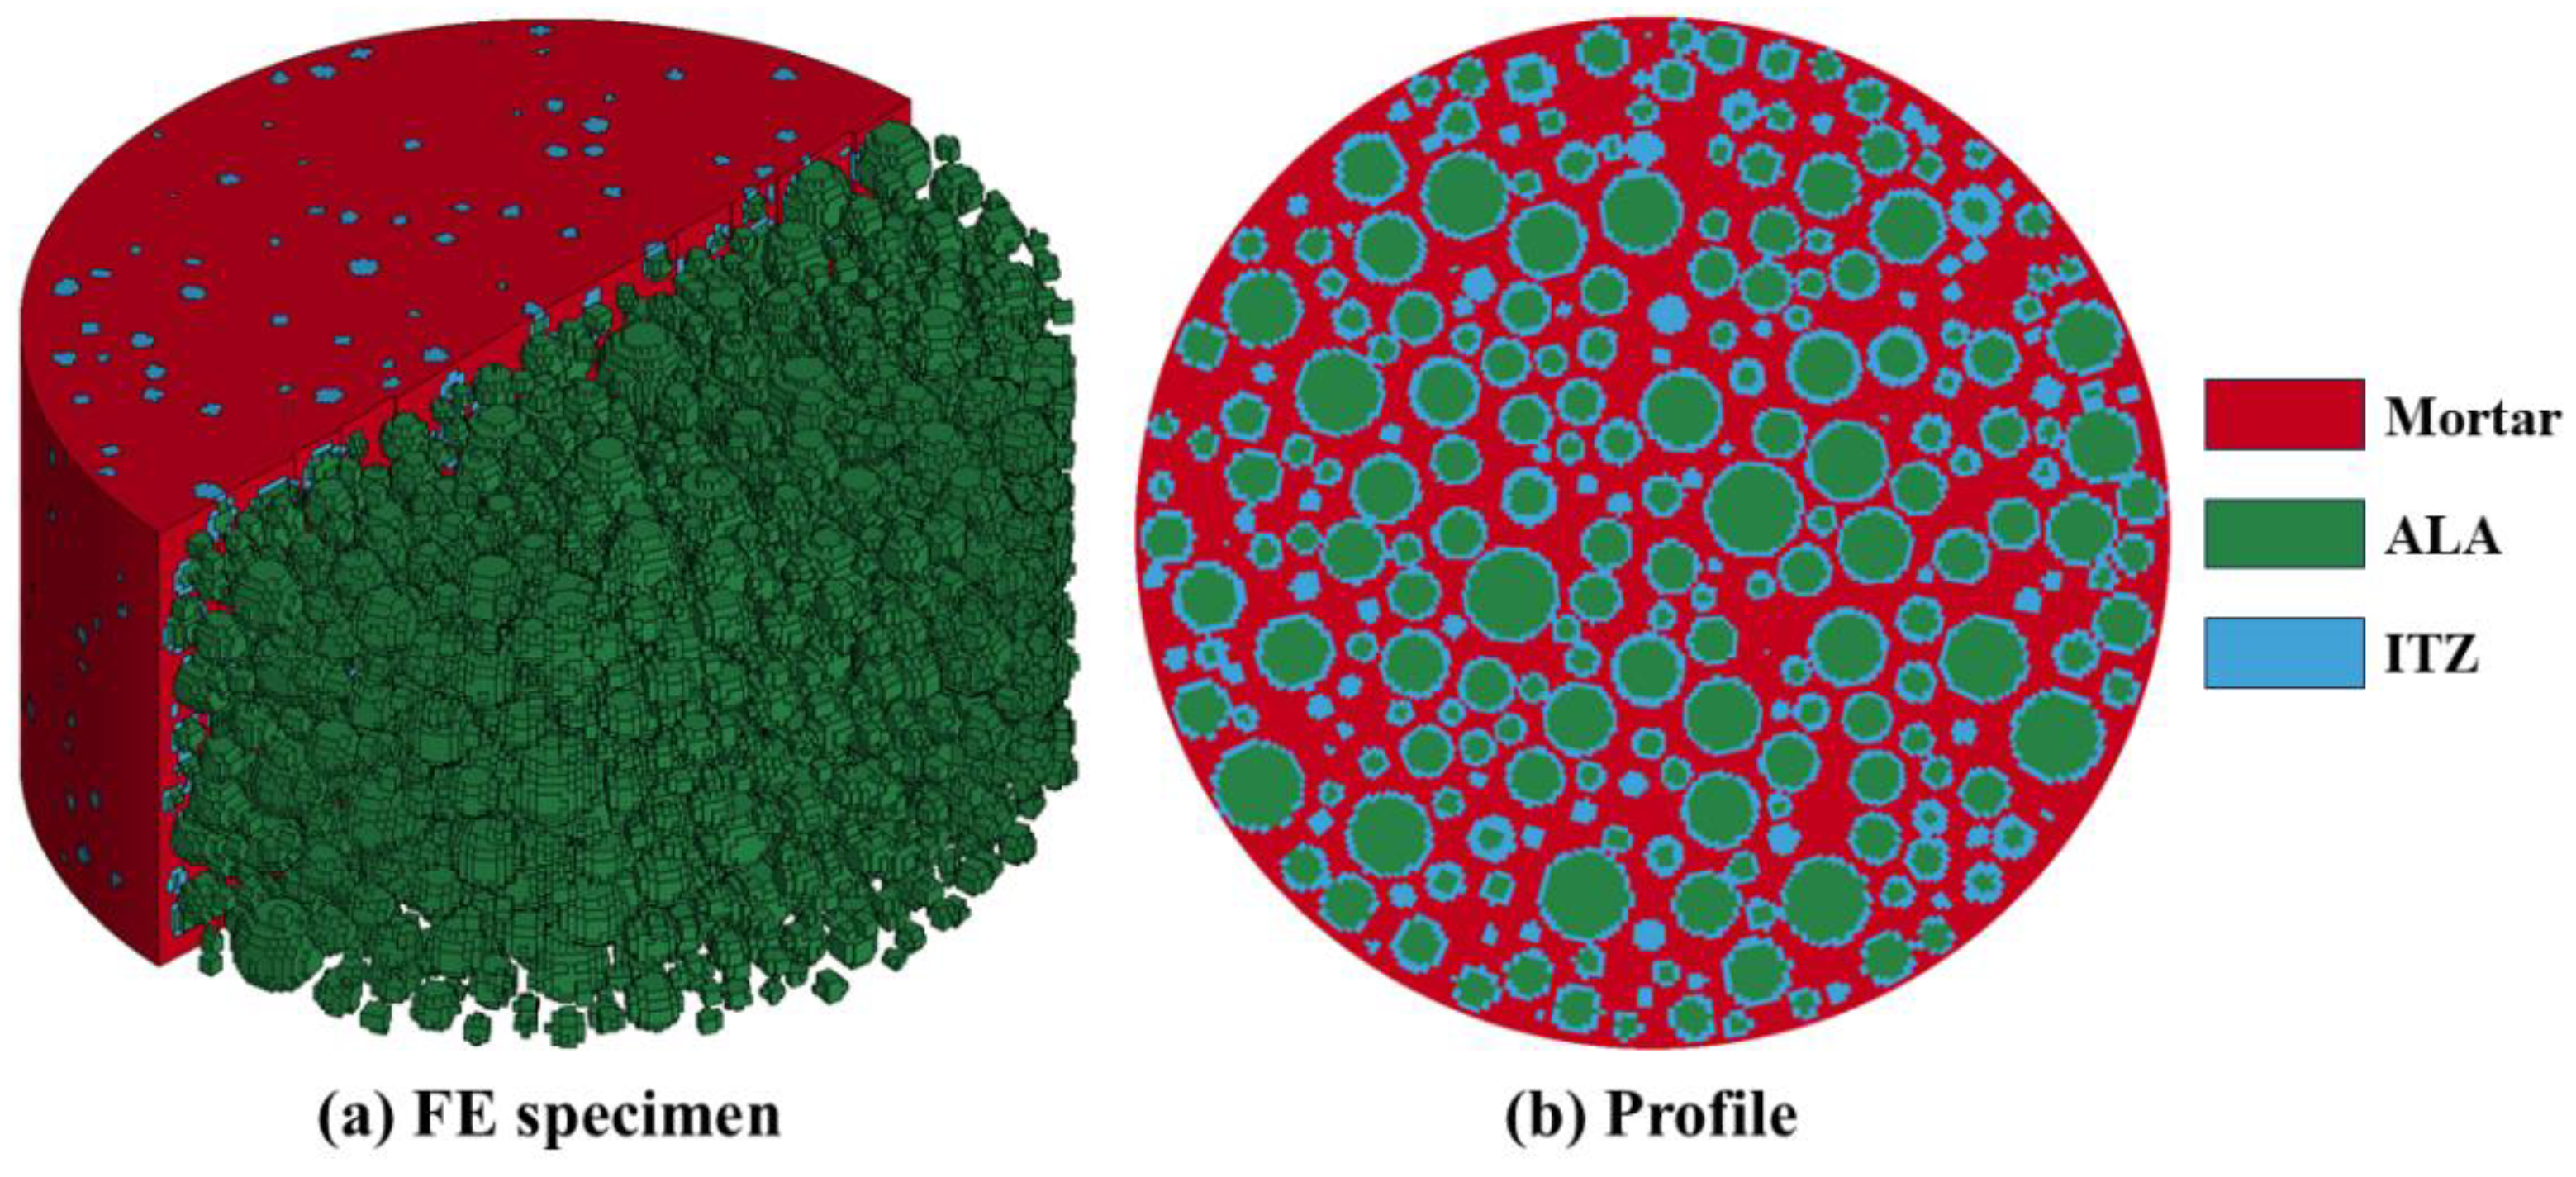
Figure 4.
The process of aggregate unit and ITZ generation: (a) comparison of the position of aggregate and element; (b) matching of cell identifiers; (c) ITZ generation of a certain thickness; and (d) ITZ, ALA, and mortar in FE model.
Figure 4.
The process of aggregate unit and ITZ generation: (a) comparison of the position of aggregate and element; (b) matching of cell identifiers; (c) ITZ generation of a certain thickness; and (d) ITZ, ALA, and mortar in FE model.
Figure 5.
Three relative positions between spheres and their identification: (a) separate, (b) touching and (c) overlap.
Figure 5.
Three relative positions between spheres and their identification: (a) separate, (b) touching and (c) overlap.
Figure 6.
Meso-FE model: (a) mortar, aggregate, and ITZ assemblage; (b) specimen profile.
Figure 6.
Meso-FE model: (a) mortar, aggregate, and ITZ assemblage; (b) specimen profile.
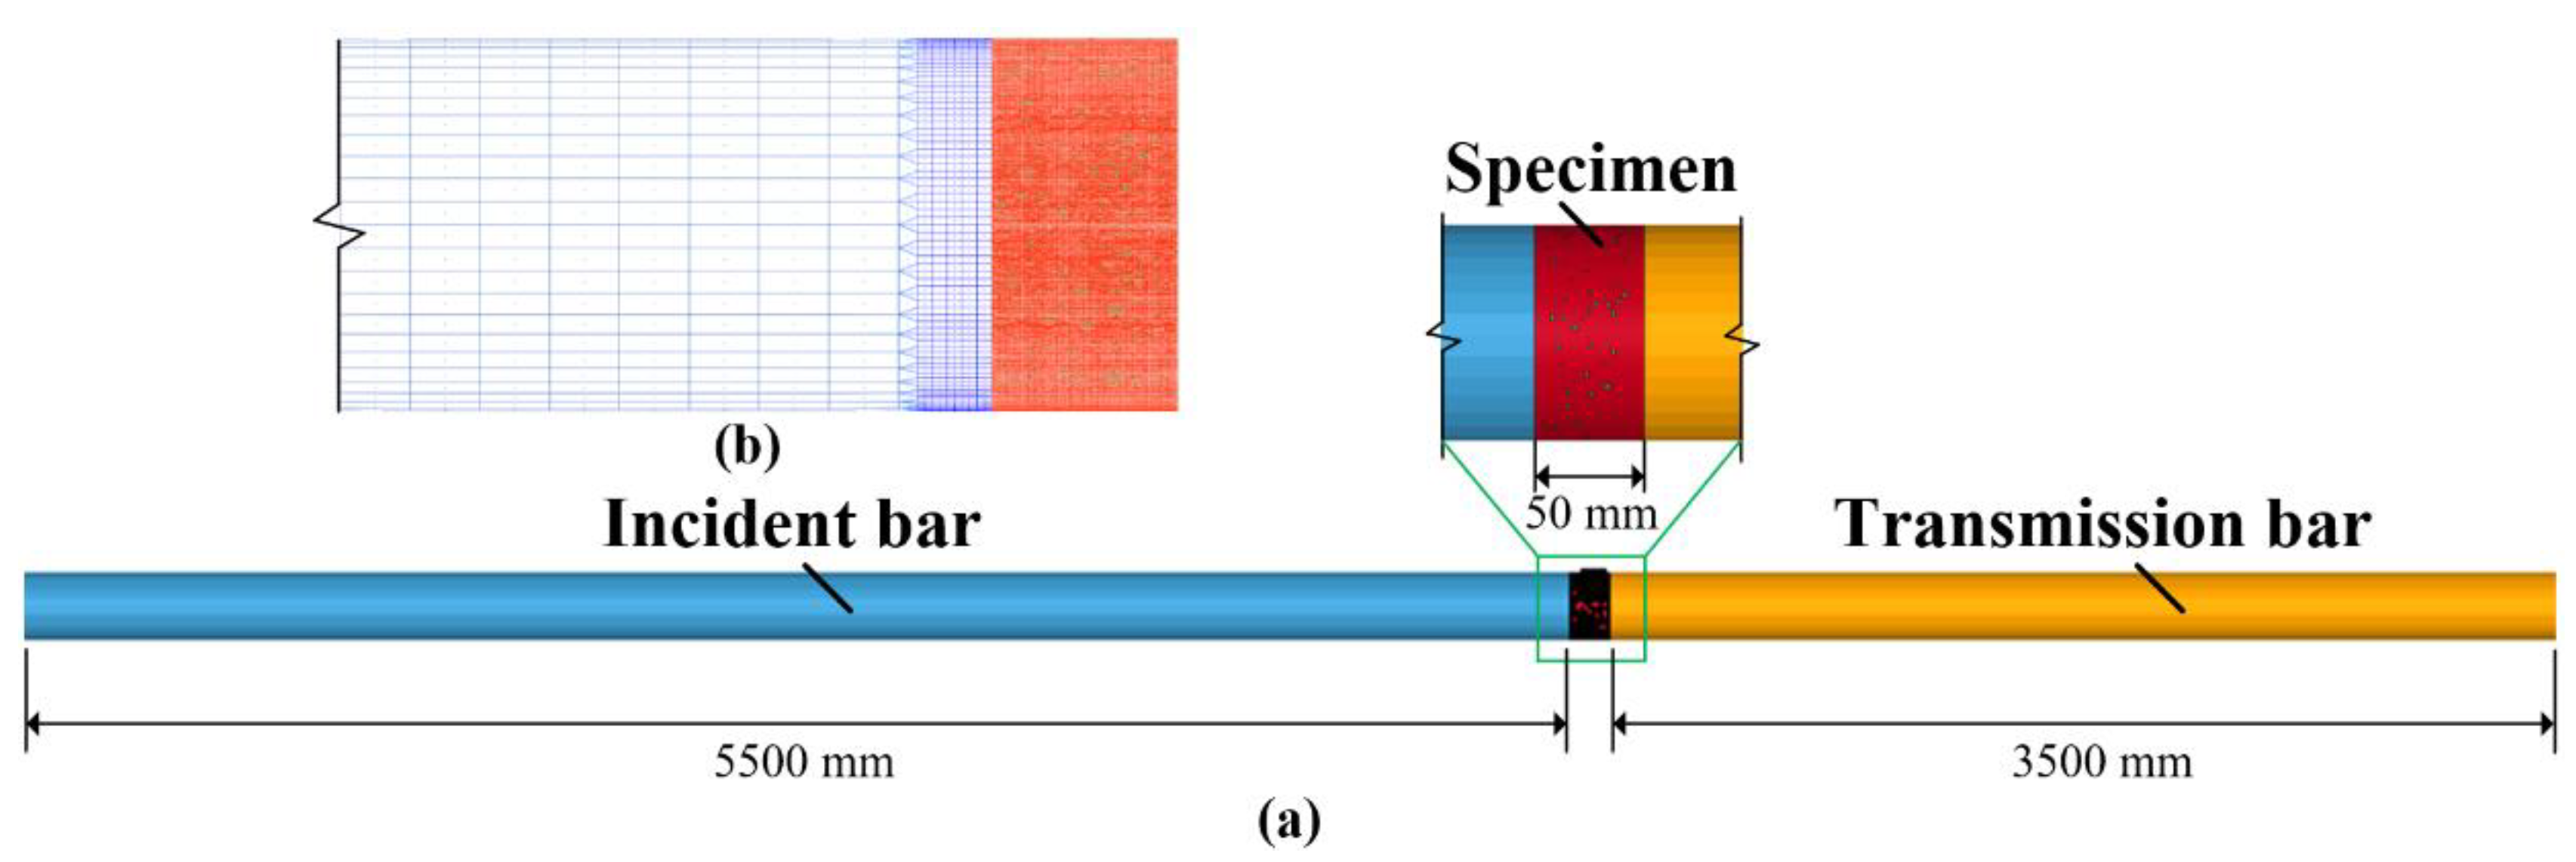
Figure 7.
FE model of SHPB test system: (a) overall system diagram; (b) subdivision and coarse division grid schematic.
Figure 7.
FE model of SHPB test system: (a) overall system diagram; (b) subdivision and coarse division grid schematic.
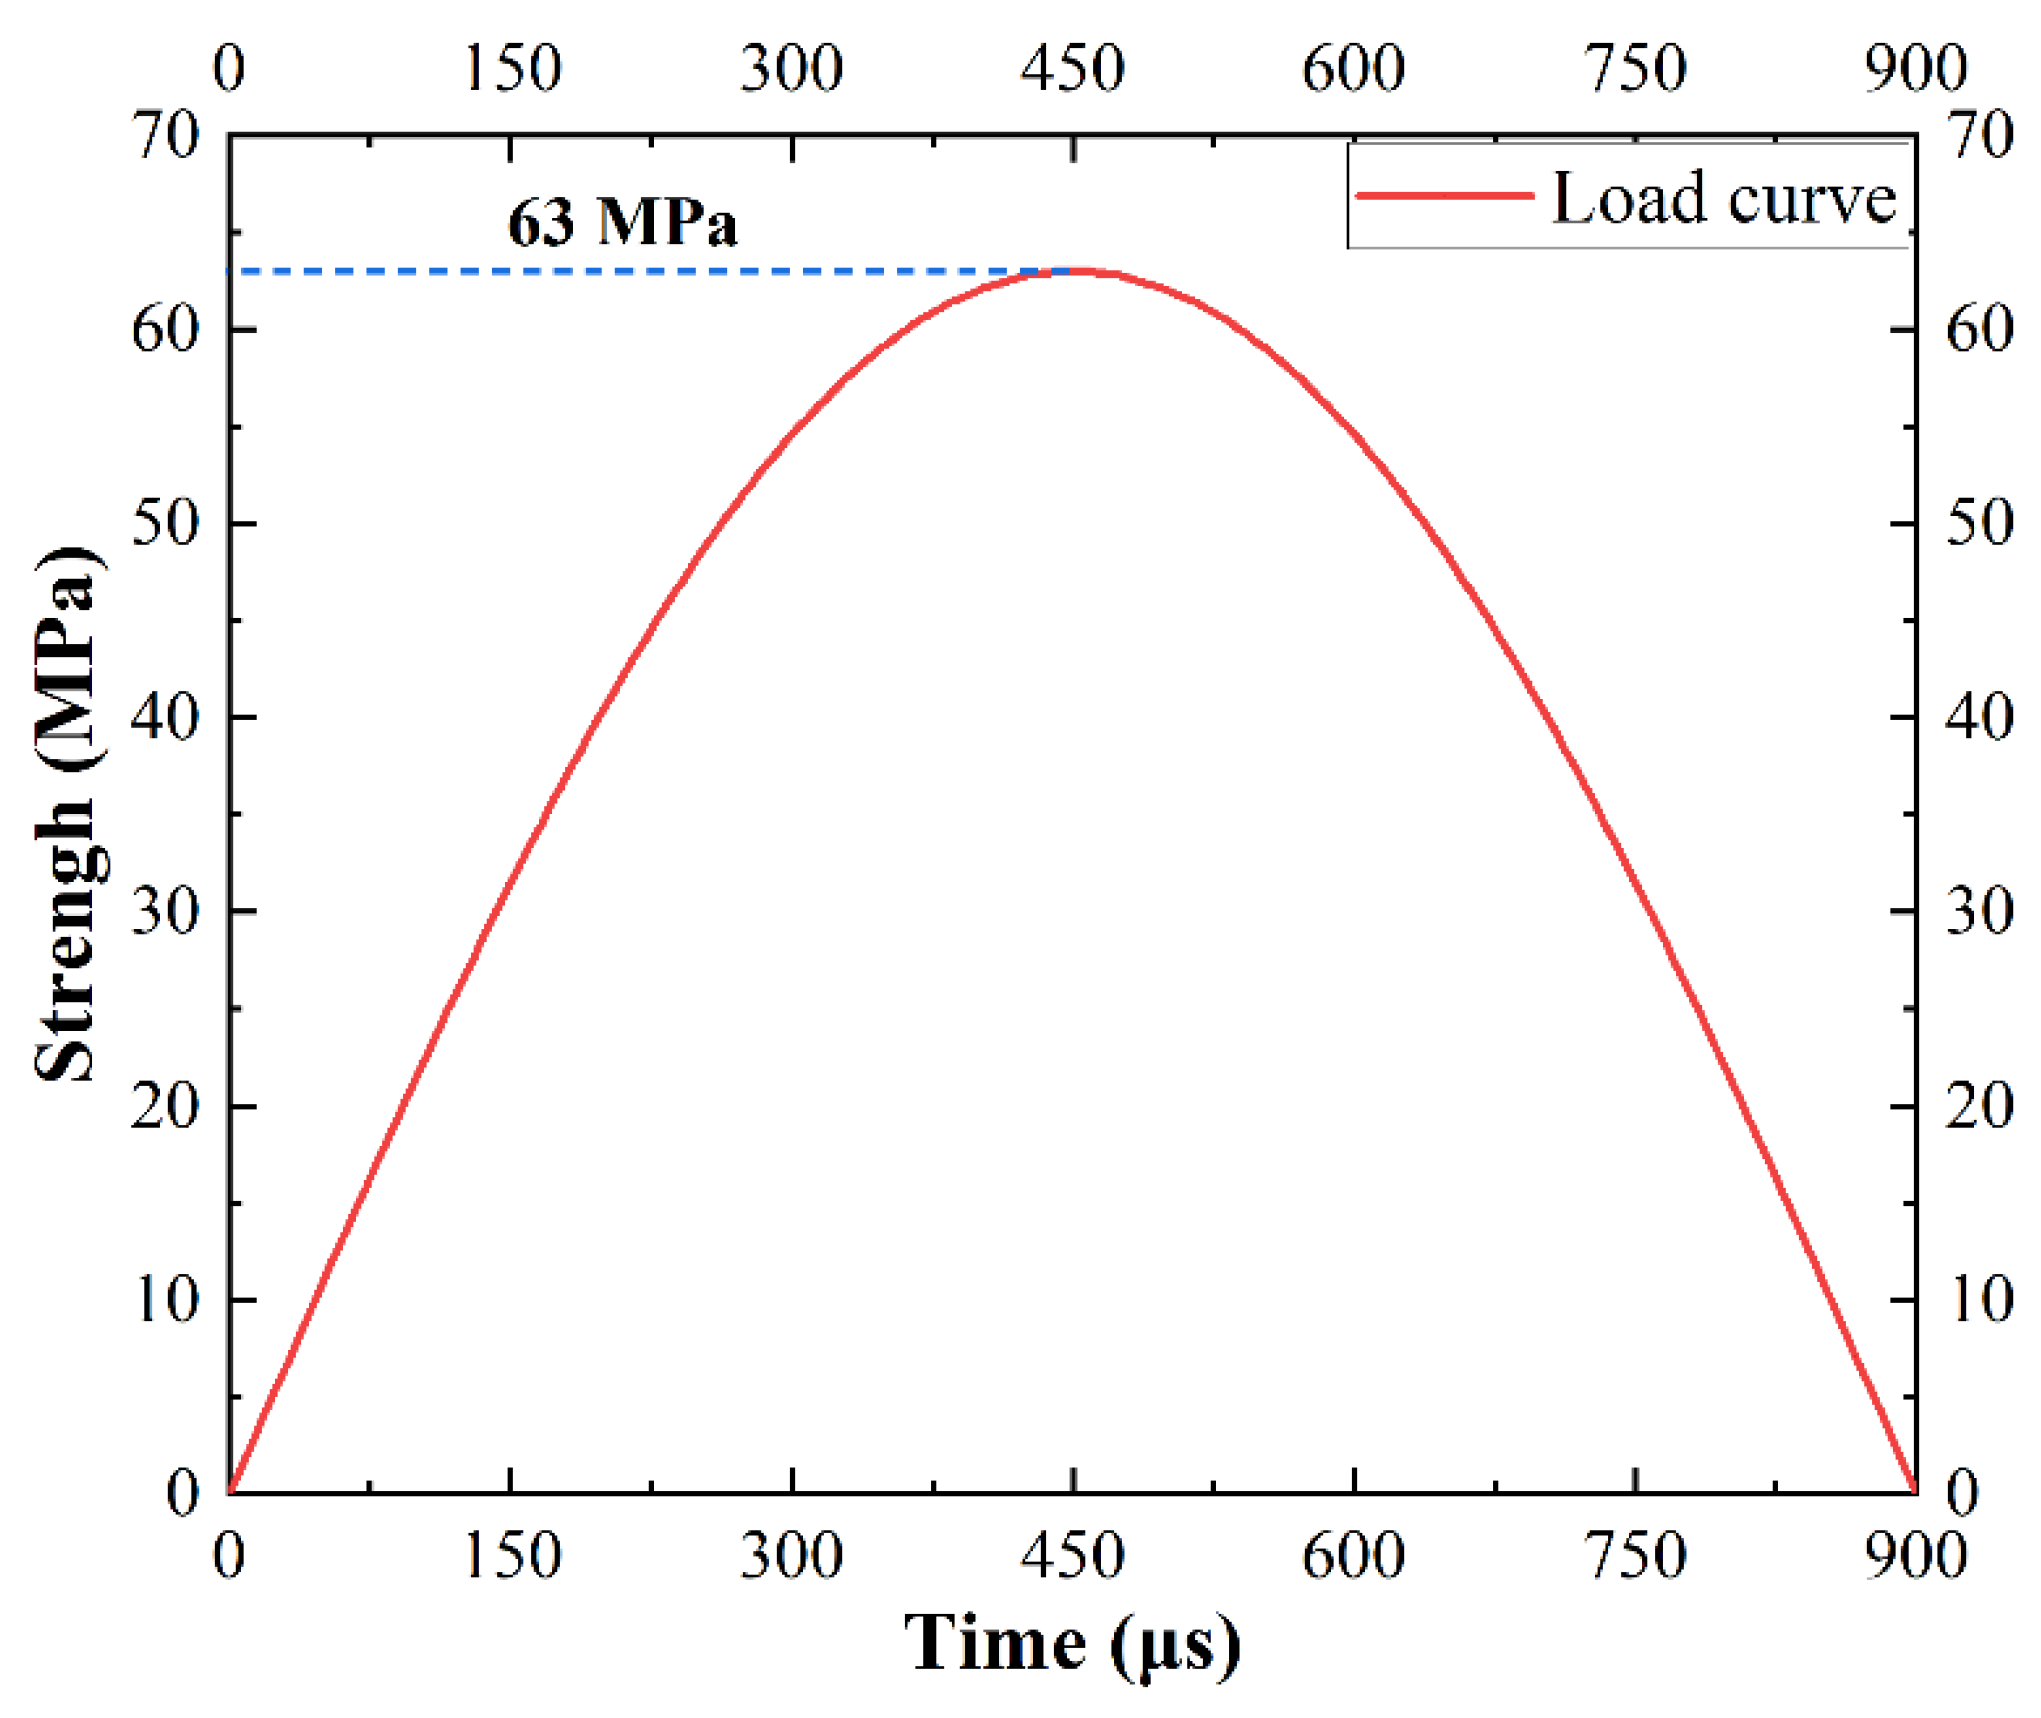
Figure 8.
Half-sinusoidal load curve.
Figure 8.
Half-sinusoidal load curve.
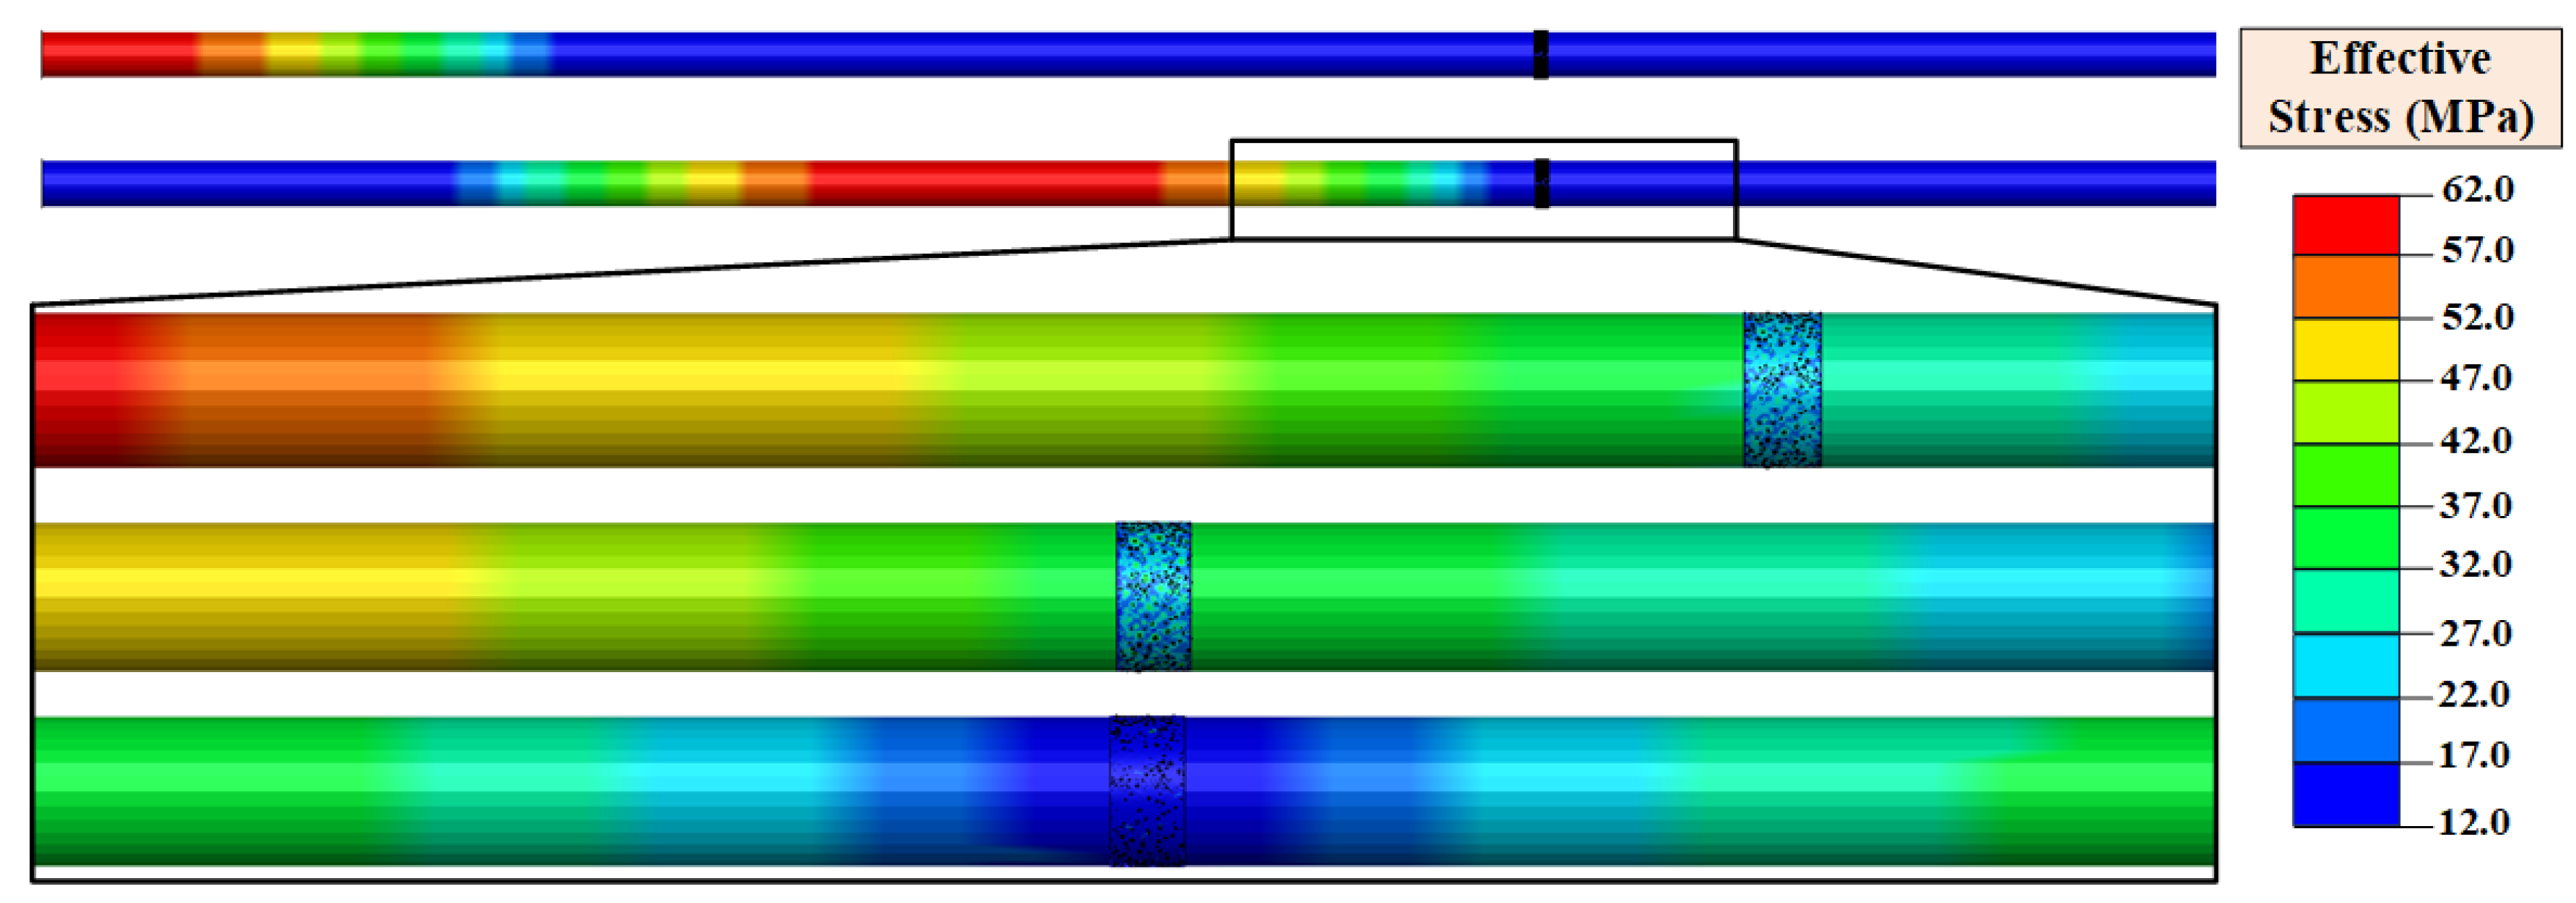
Figure 9.
Stress wave propagation process.
Figure 9.
Stress wave propagation process.
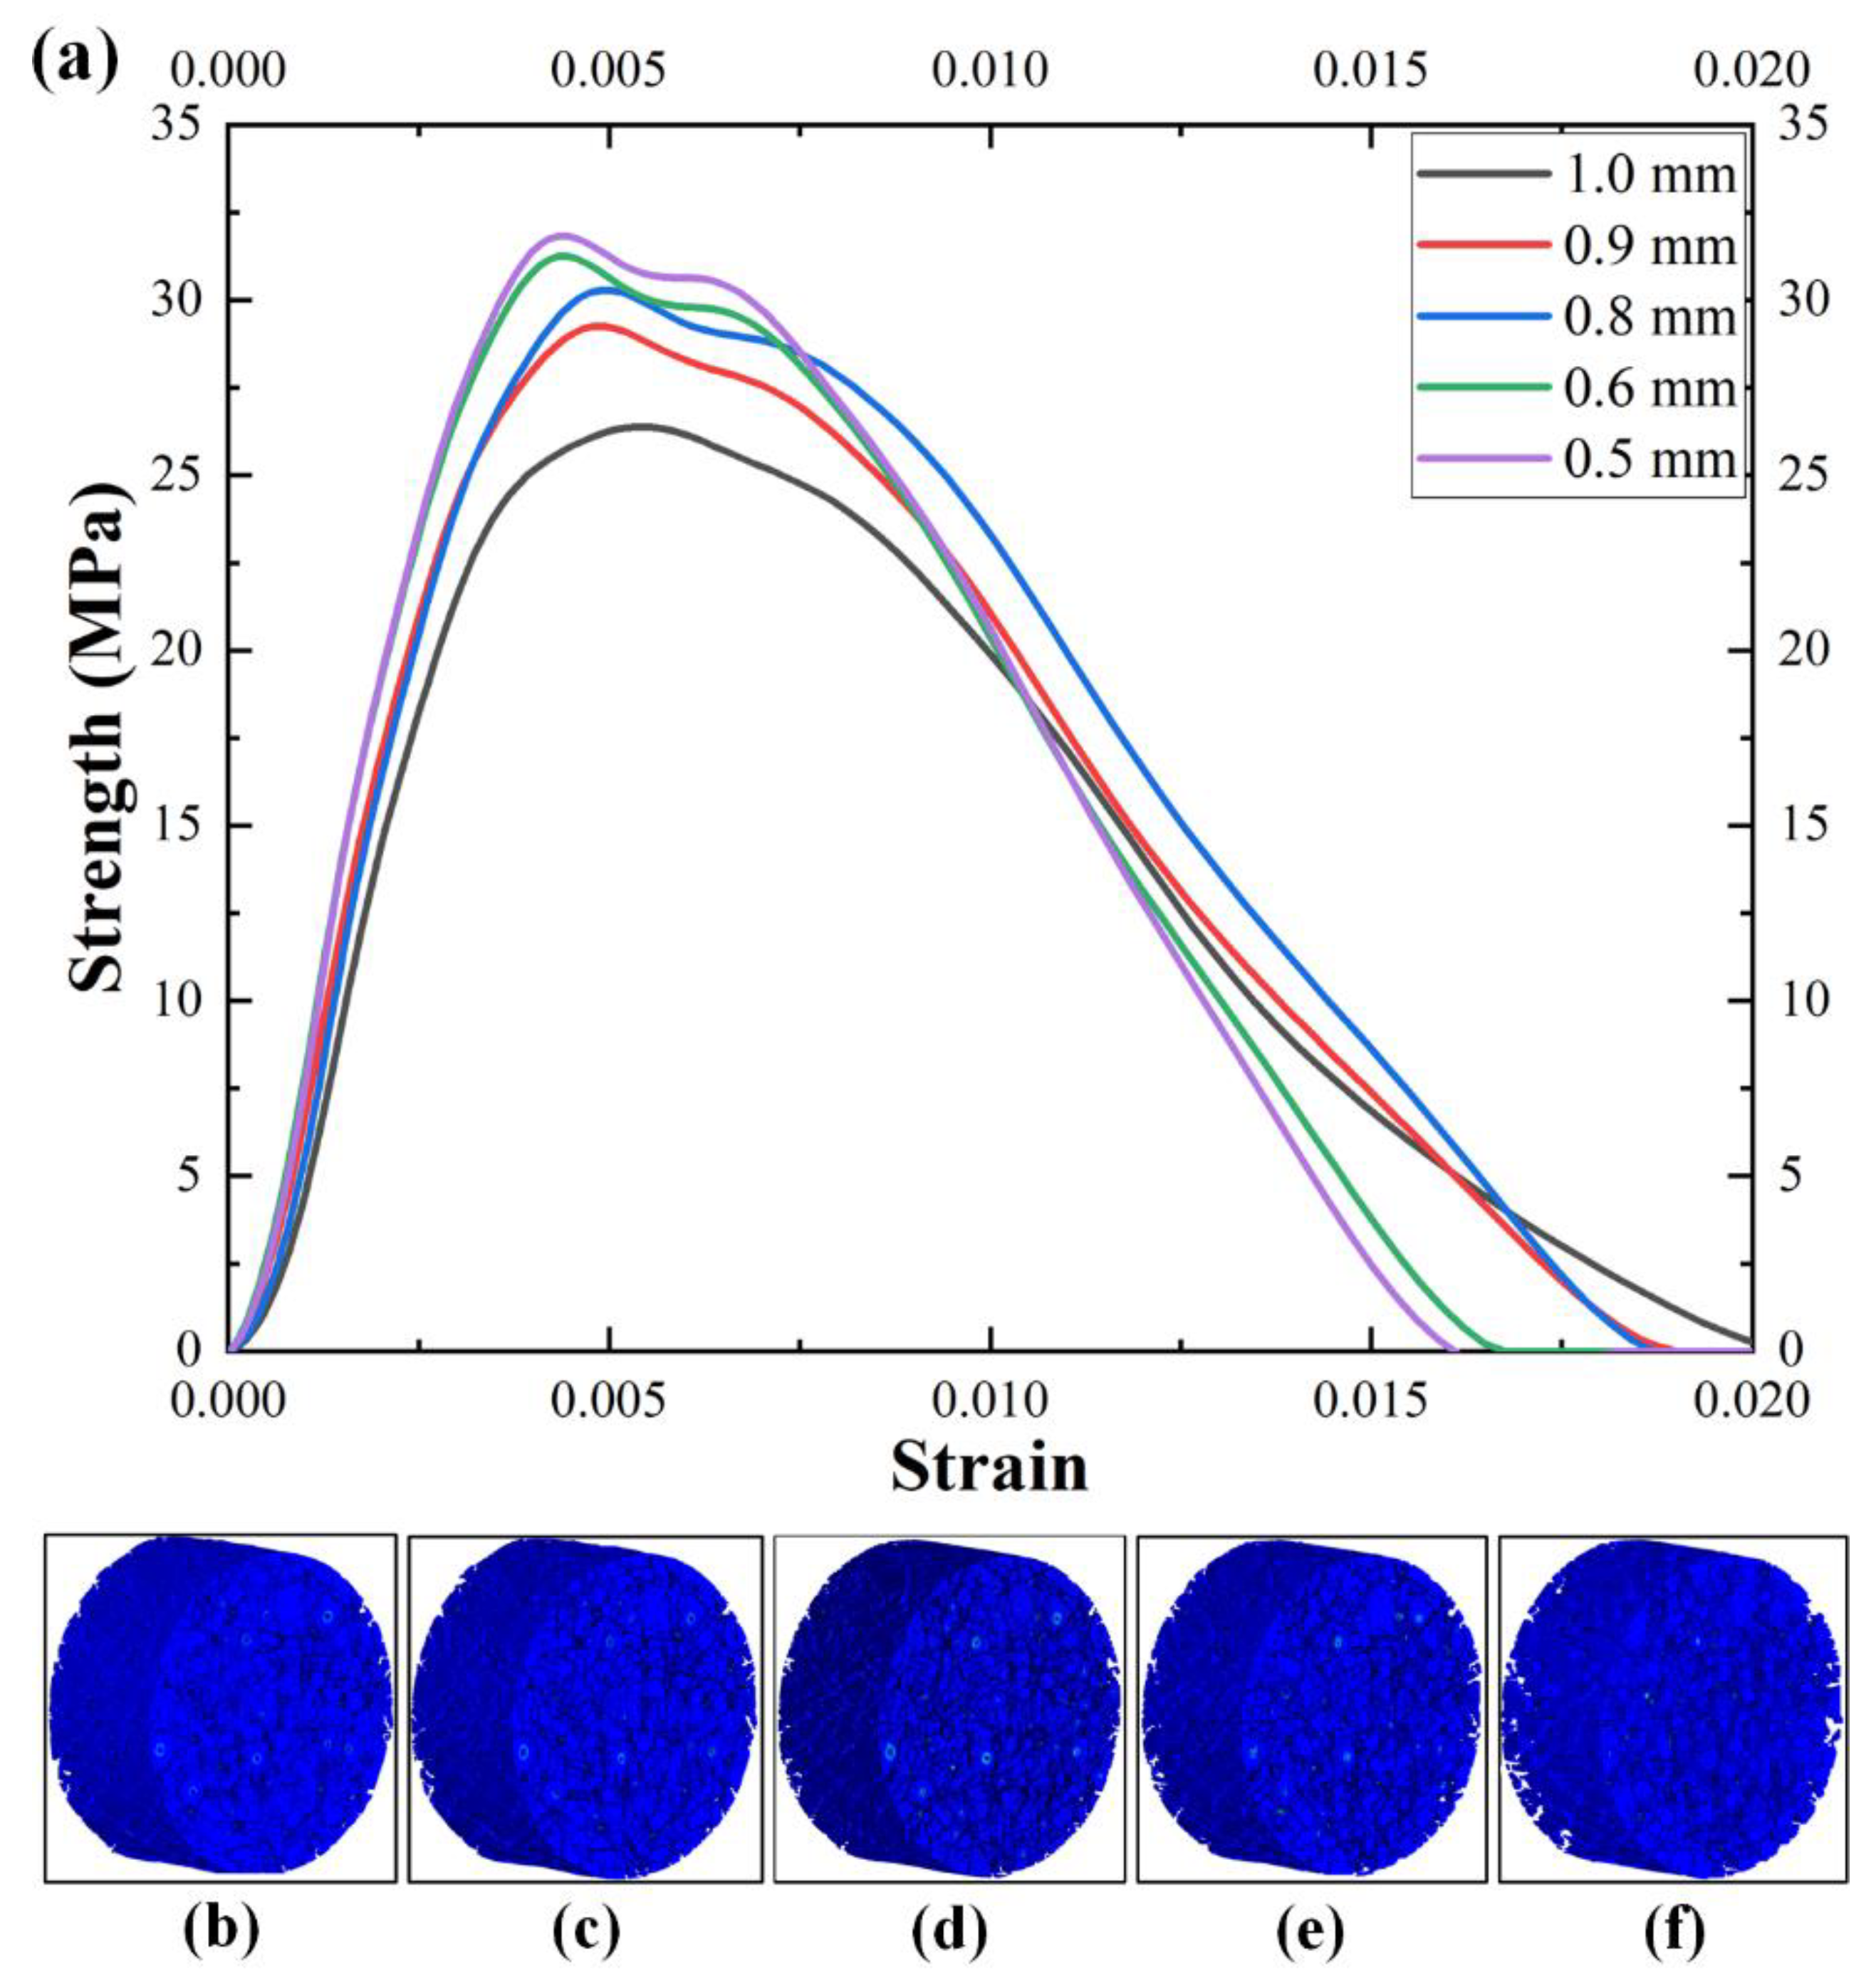
Figure 10.
The predicted results of specimens with different mesh sizes: (a) predicted stress–strain curves; (b–f) failure modes with mesh sizes of 0.5 mm, 0.6 mm, 0.8 mm, 0.9 mm, and 1.0 mm.
Figure 10.
The predicted results of specimens with different mesh sizes: (a) predicted stress–strain curves; (b–f) failure modes with mesh sizes of 0.5 mm, 0.6 mm, 0.8 mm, 0.9 mm, and 1.0 mm.
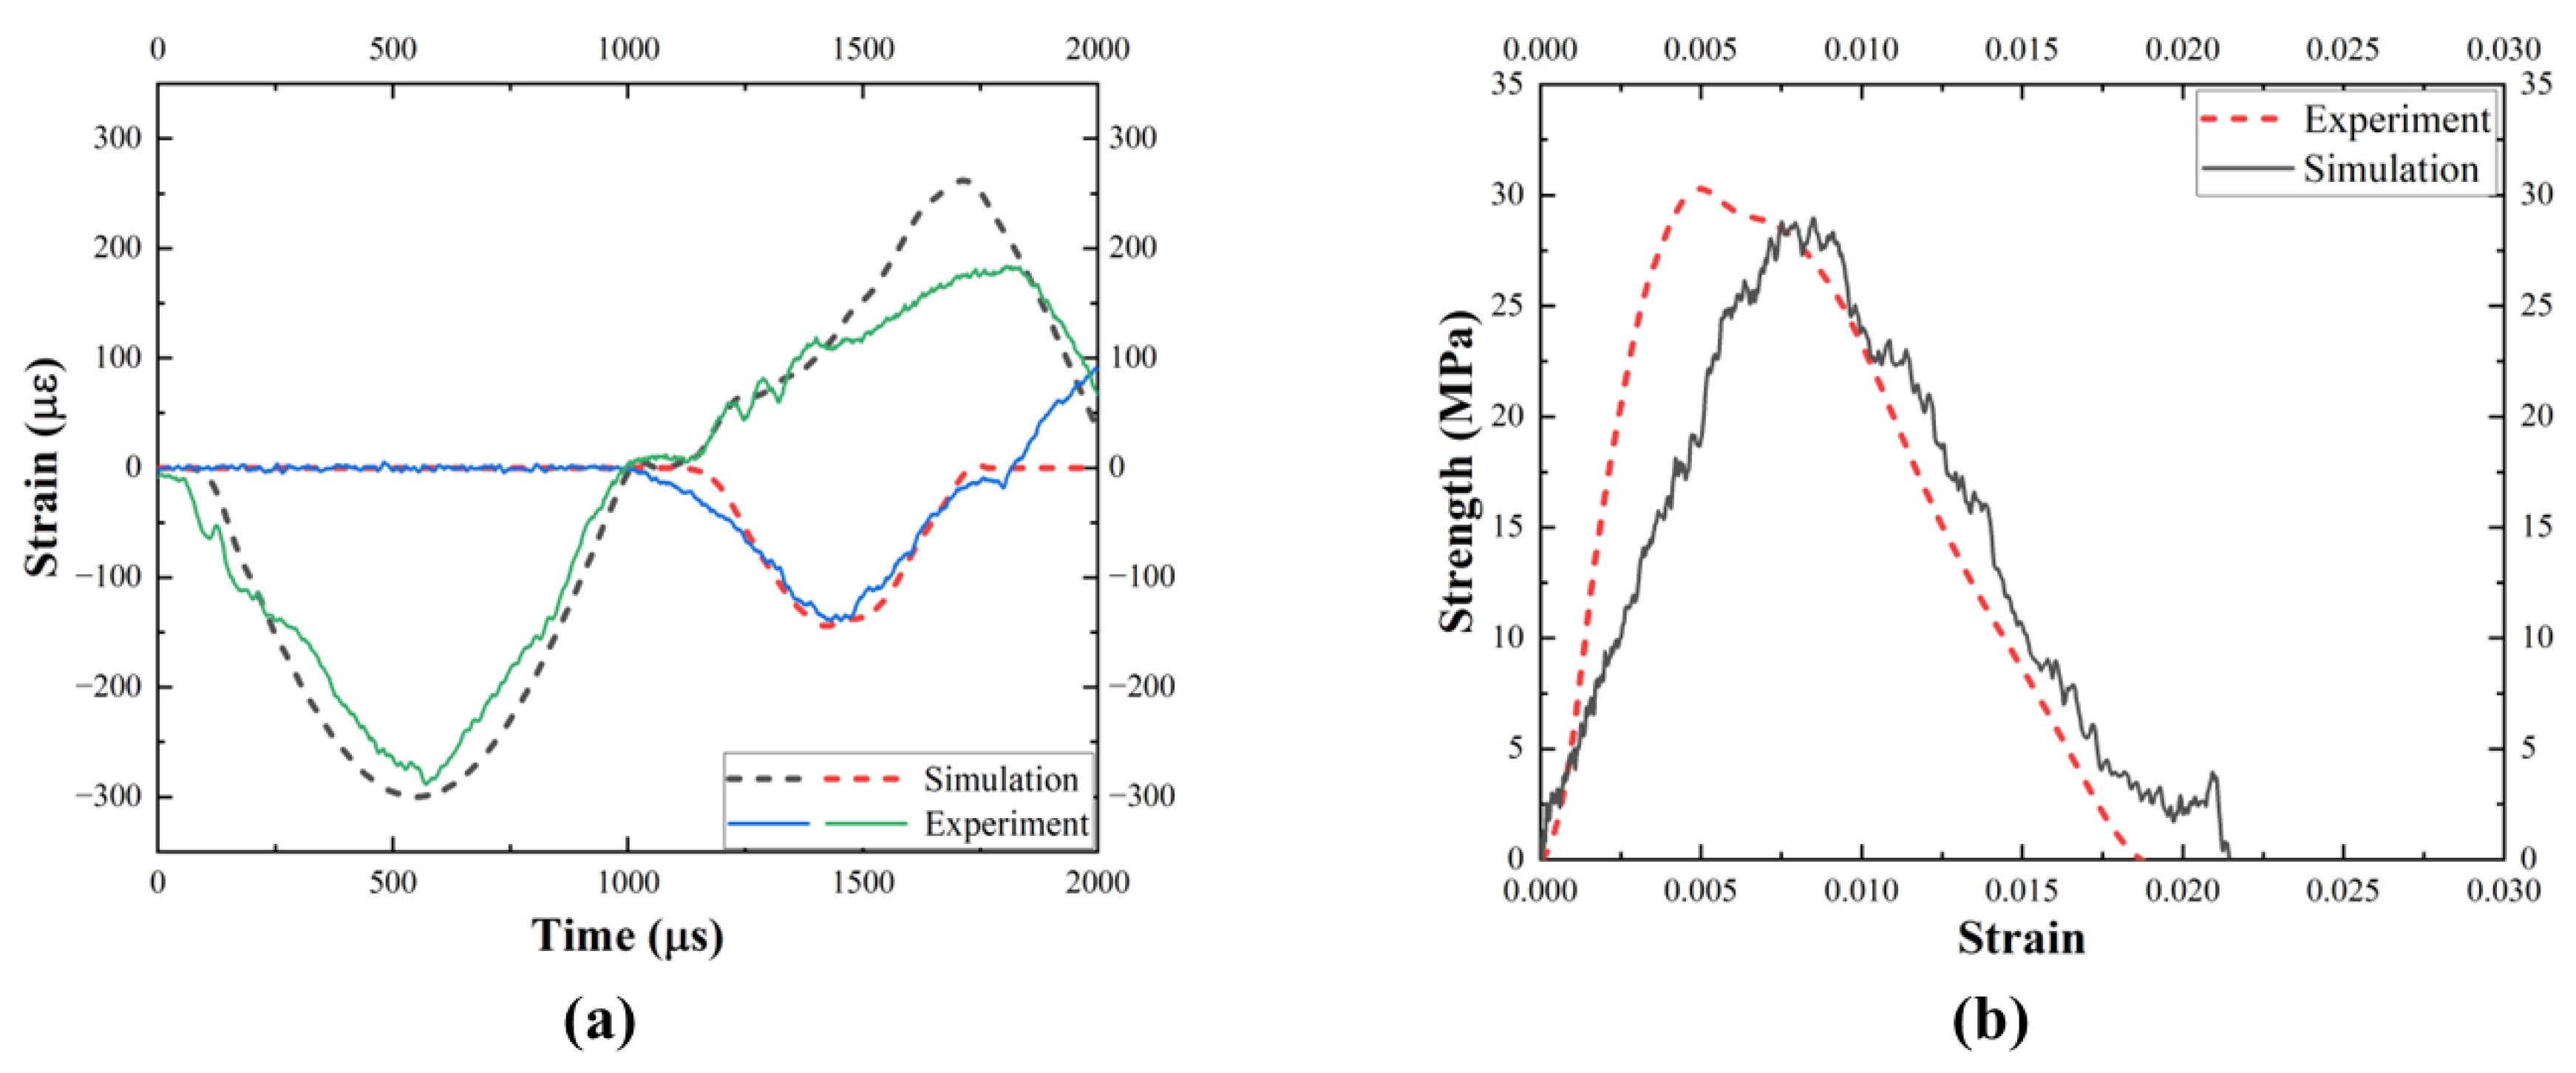
Figure 11.
Comparison of simulation prediction and experiment: (a) waveform diagram; (b) dynamic stress-strain curves.
Figure 11.
Comparison of simulation prediction and experiment: (a) waveform diagram; (b) dynamic stress-strain curves.
Figure 12.
Comparison of failure modes between experiment and simulation: (a) experimental side failure; (b) predicted side damage; (c) predicted integral damage.
Figure 12.
Comparison of failure modes between experiment and simulation: (a) experimental side failure; (b) predicted side damage; (c) predicted integral damage.
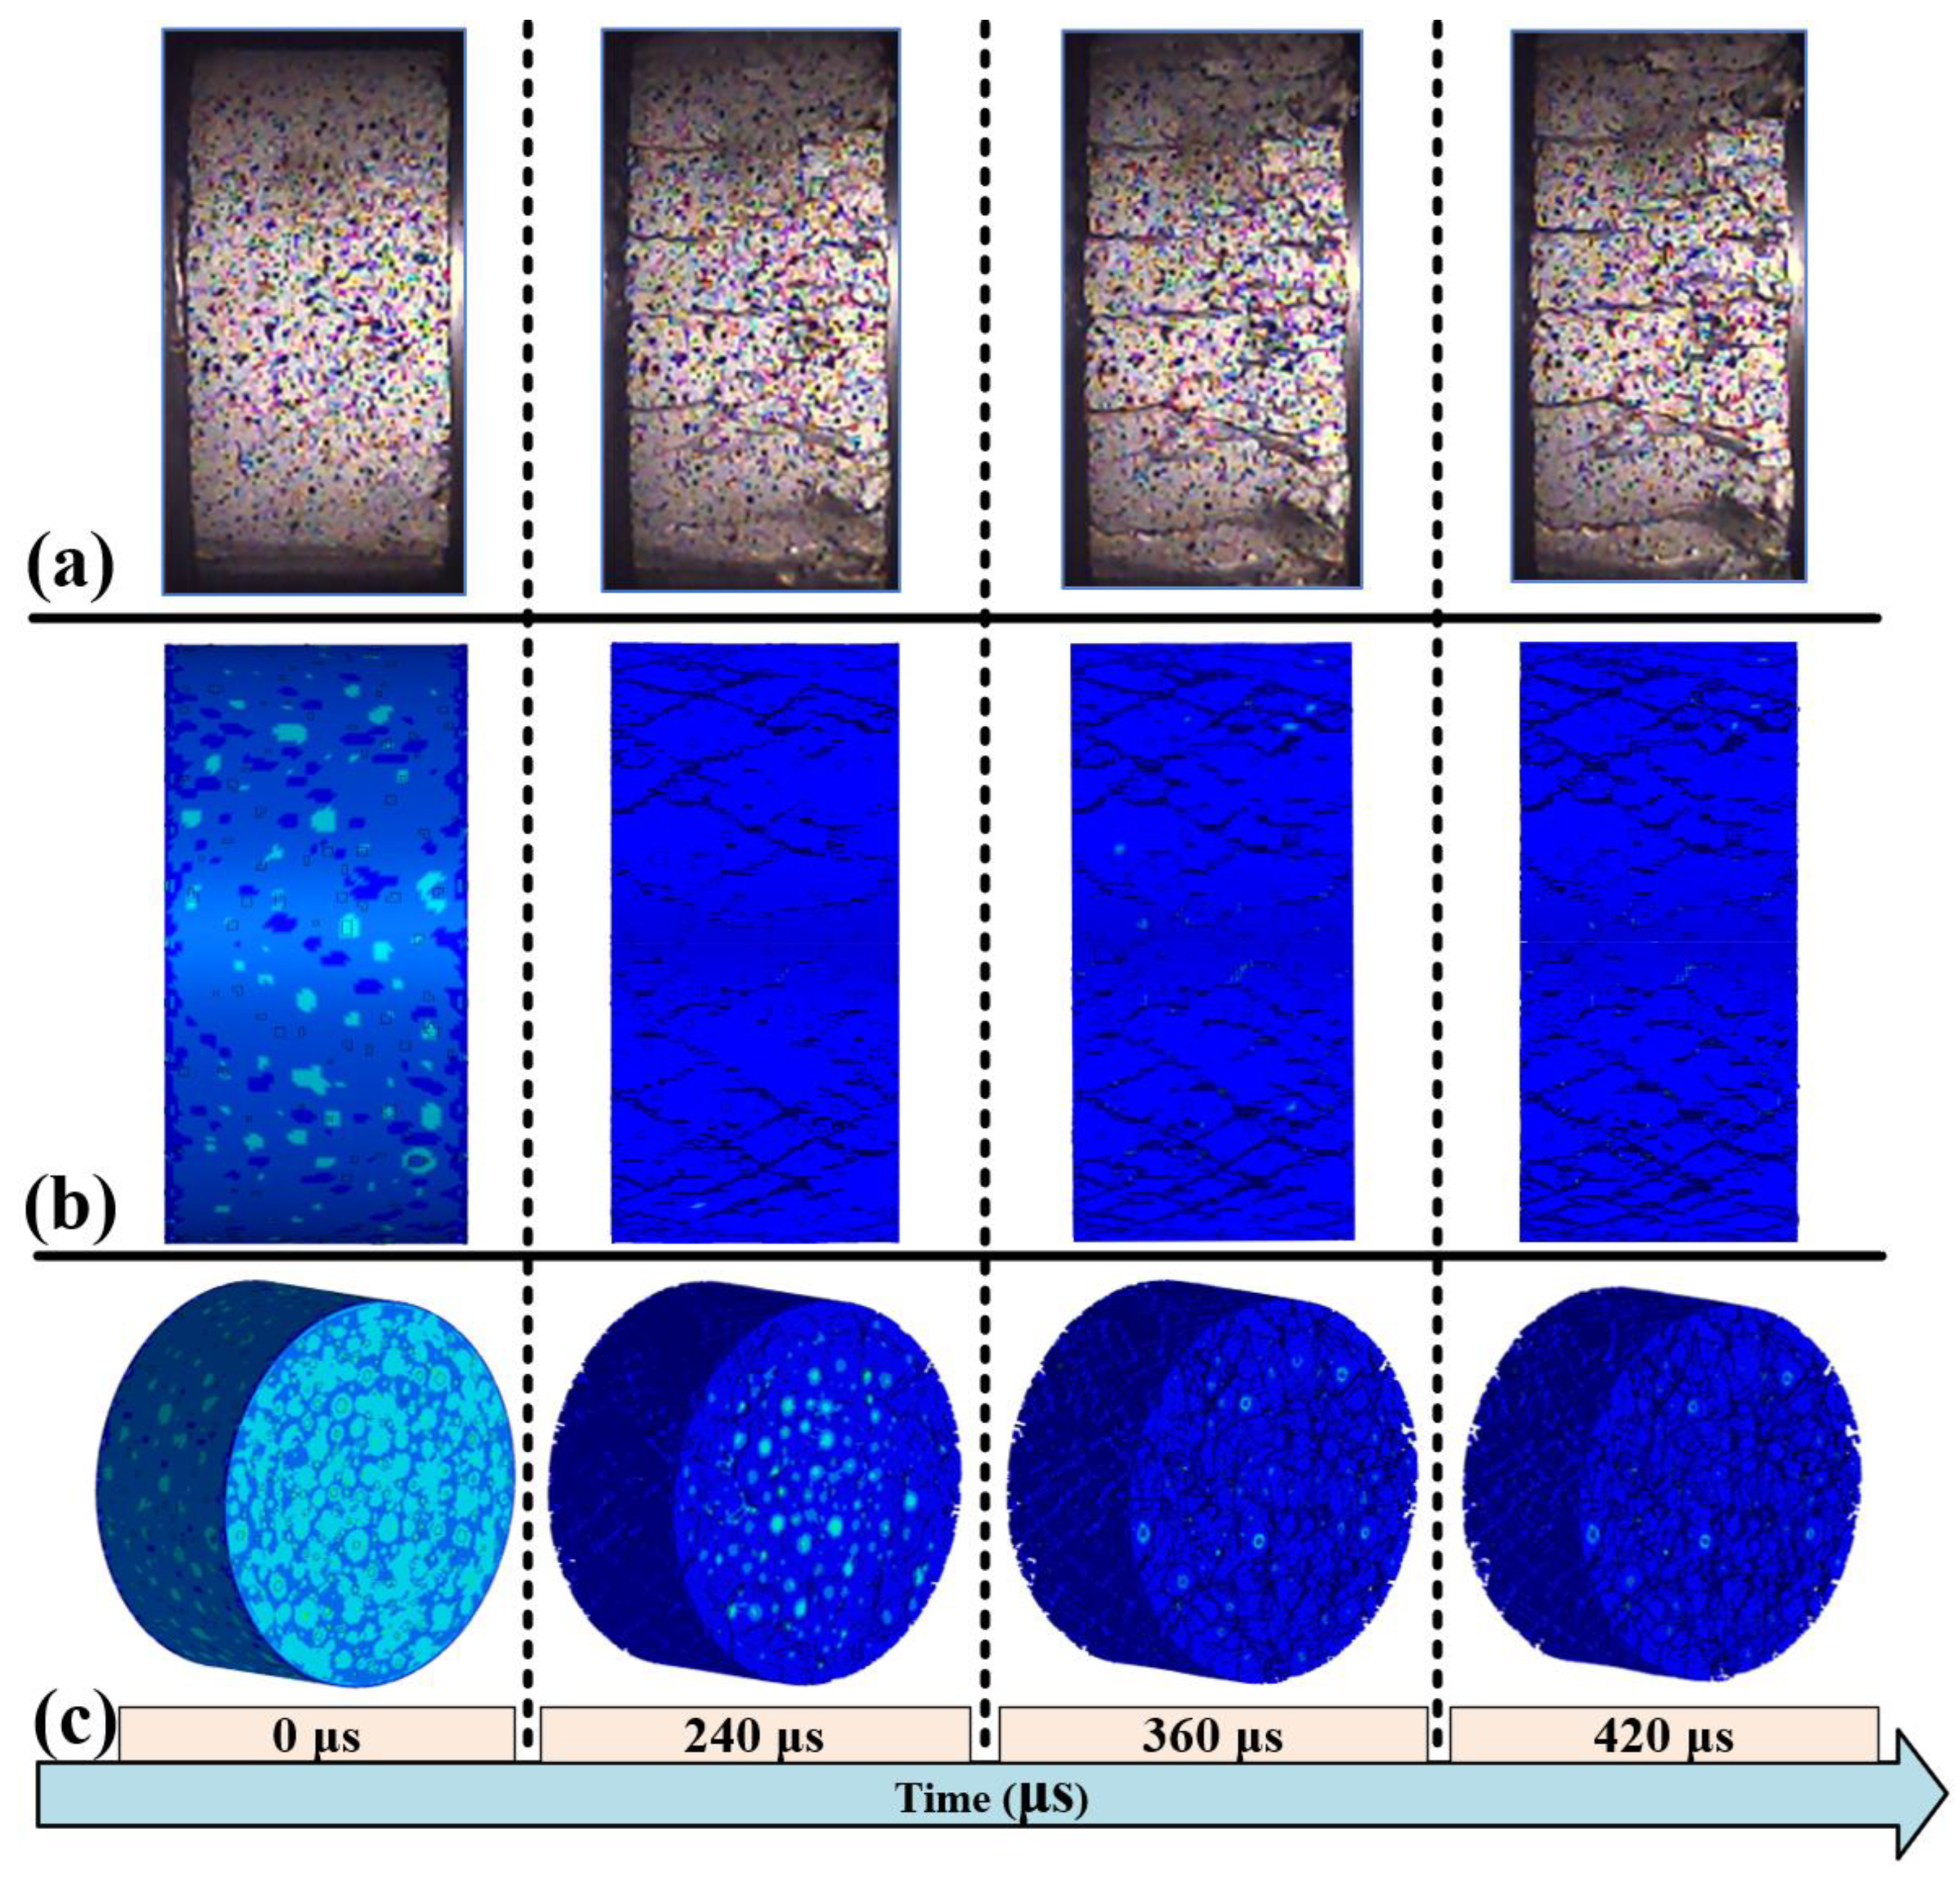
Figure 13.
Subuliform failure in the longitudinal profile: (a) profile location; (b) upper layer; (c) middle layer; (d) lower layer.
Figure 13.
Subuliform failure in the longitudinal profile: (a) profile location; (b) upper layer; (c) middle layer; (d) lower layer.
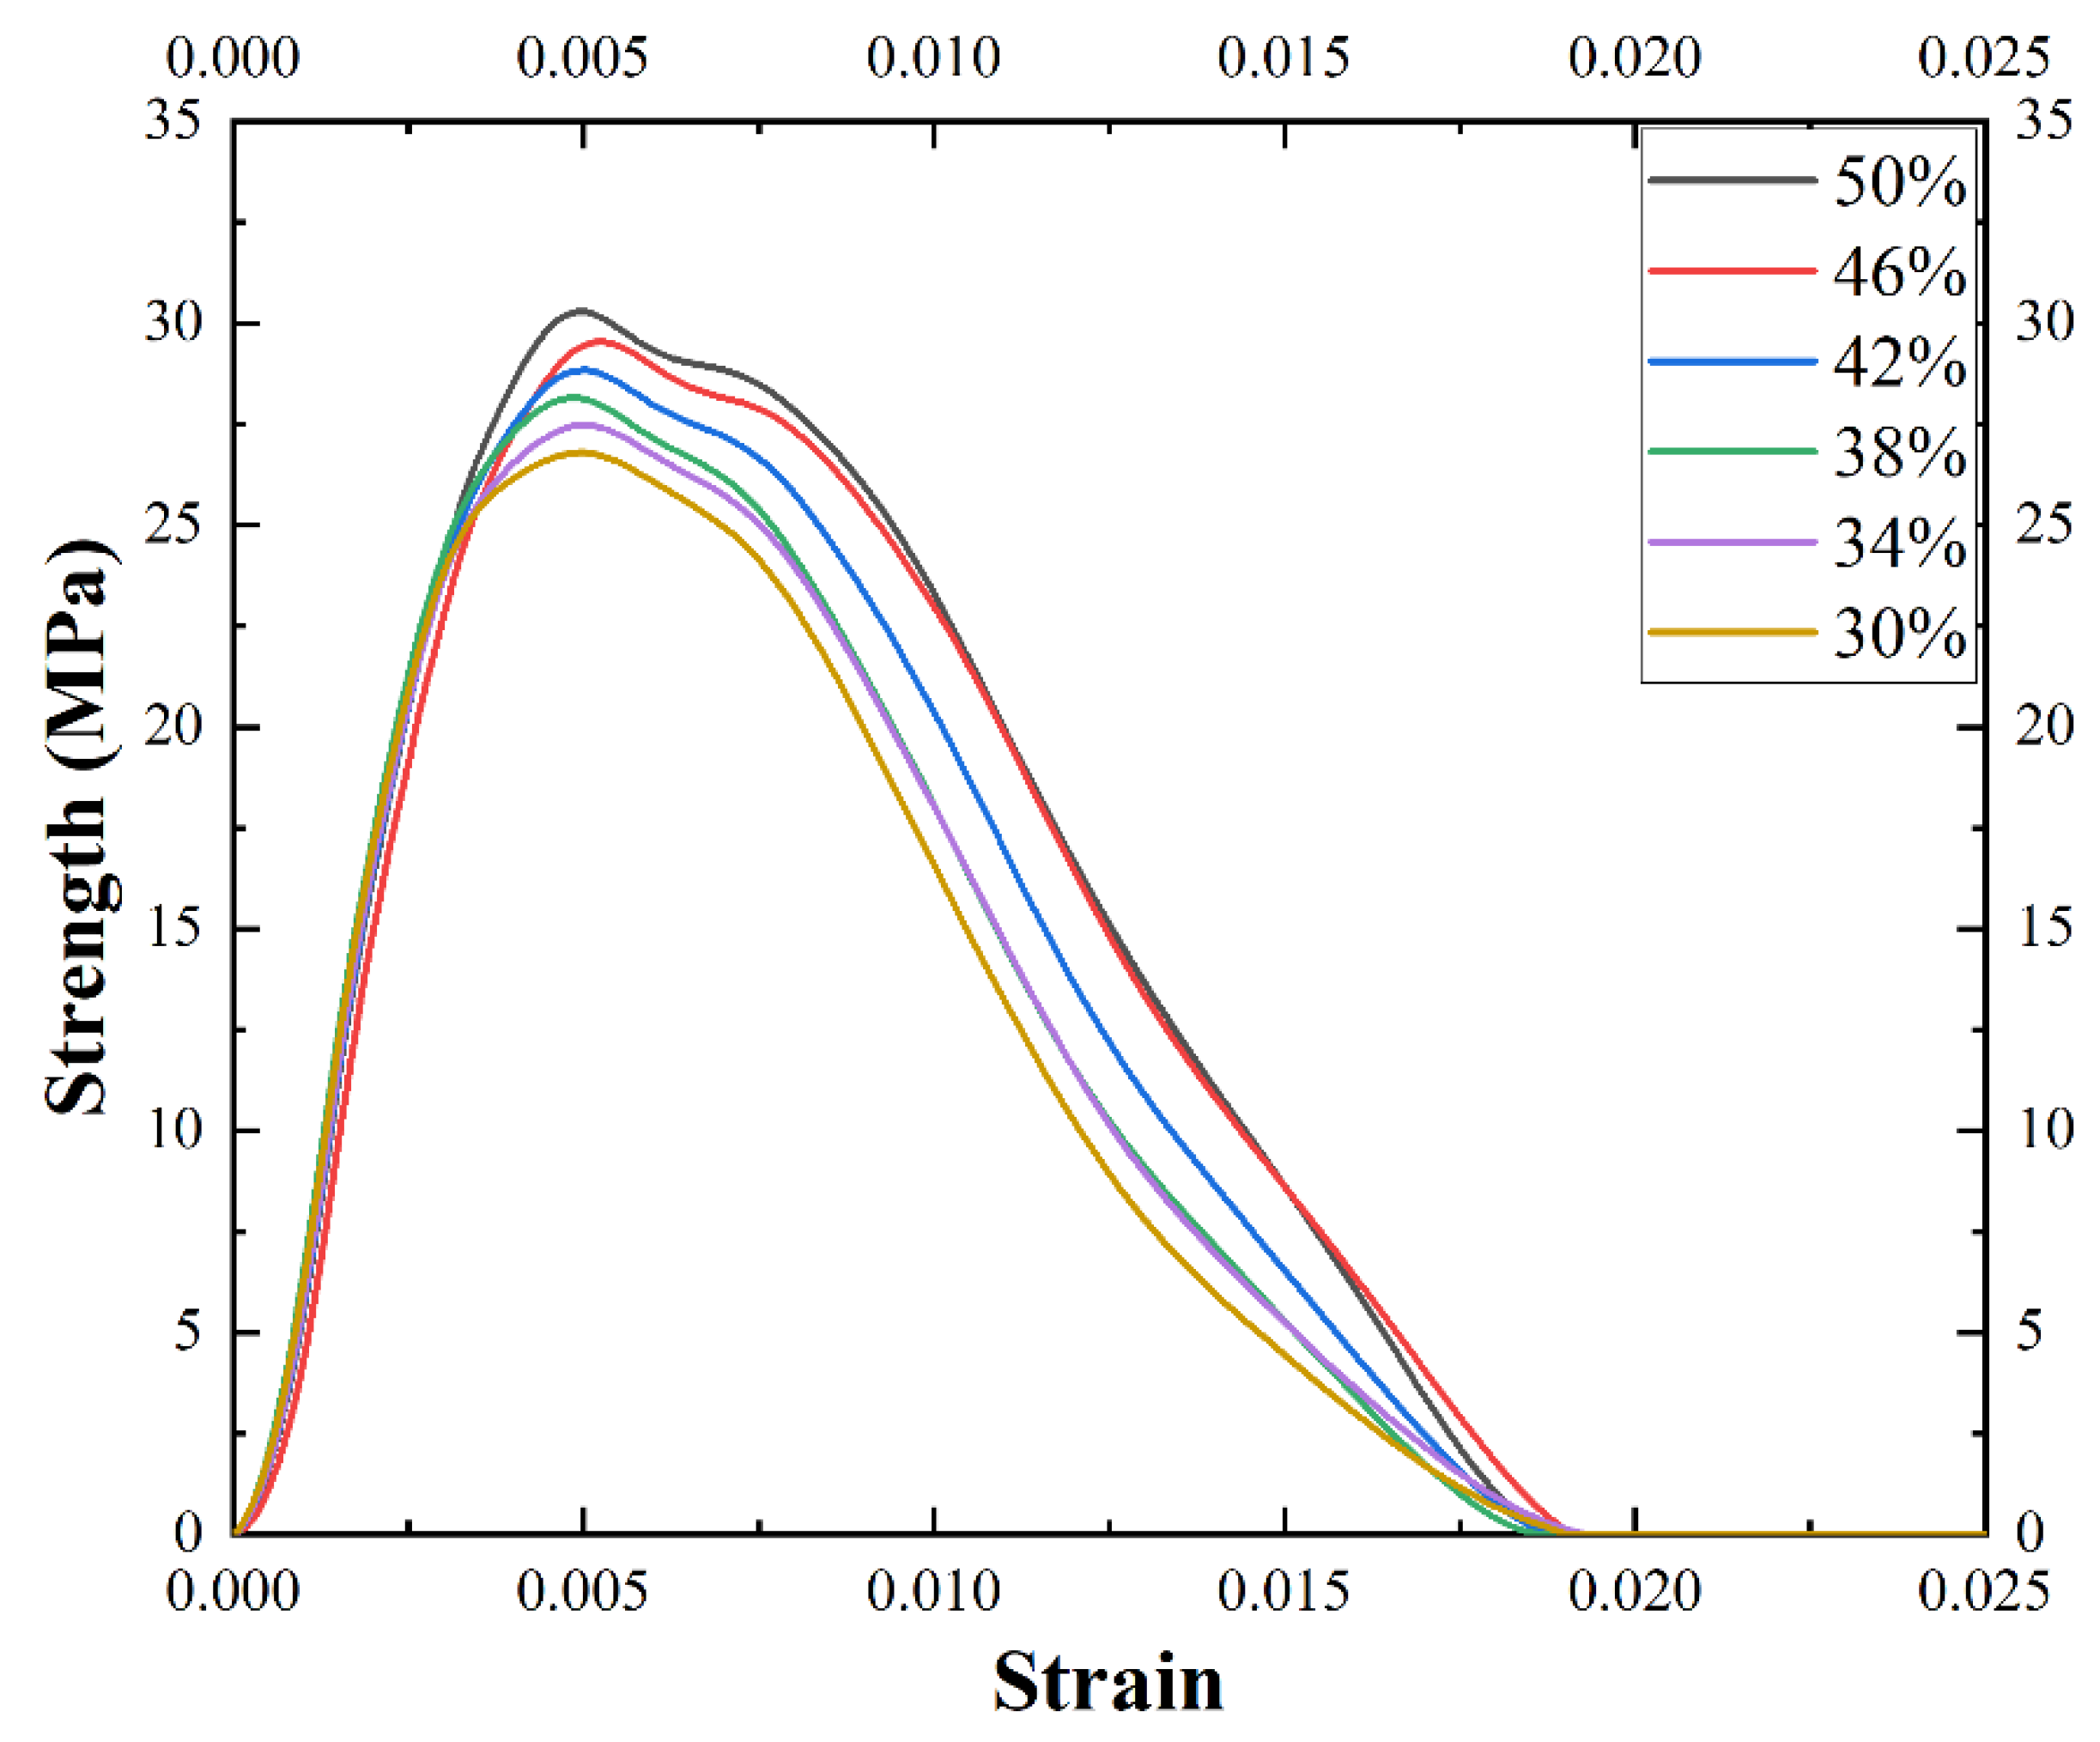
Figure 14.
Dynamic stress–strain curves of SLAC with different aggregate contents.
Figure 14.
Dynamic stress–strain curves of SLAC with different aggregate contents.
Figure 15.
Failure modes, longitudinal profile failures, and aggregate distributions of specimens with aggregate contents of (a) 50%, (b) 46%, (c) 42%, (d) 38%, (e) 34%, and (f) 30%.
Figure 15.
Failure modes, longitudinal profile failures, and aggregate distributions of specimens with aggregate contents of (a) 50%, (b) 46%, (c) 42%, (d) 38%, (e) 34%, and (f) 30%.
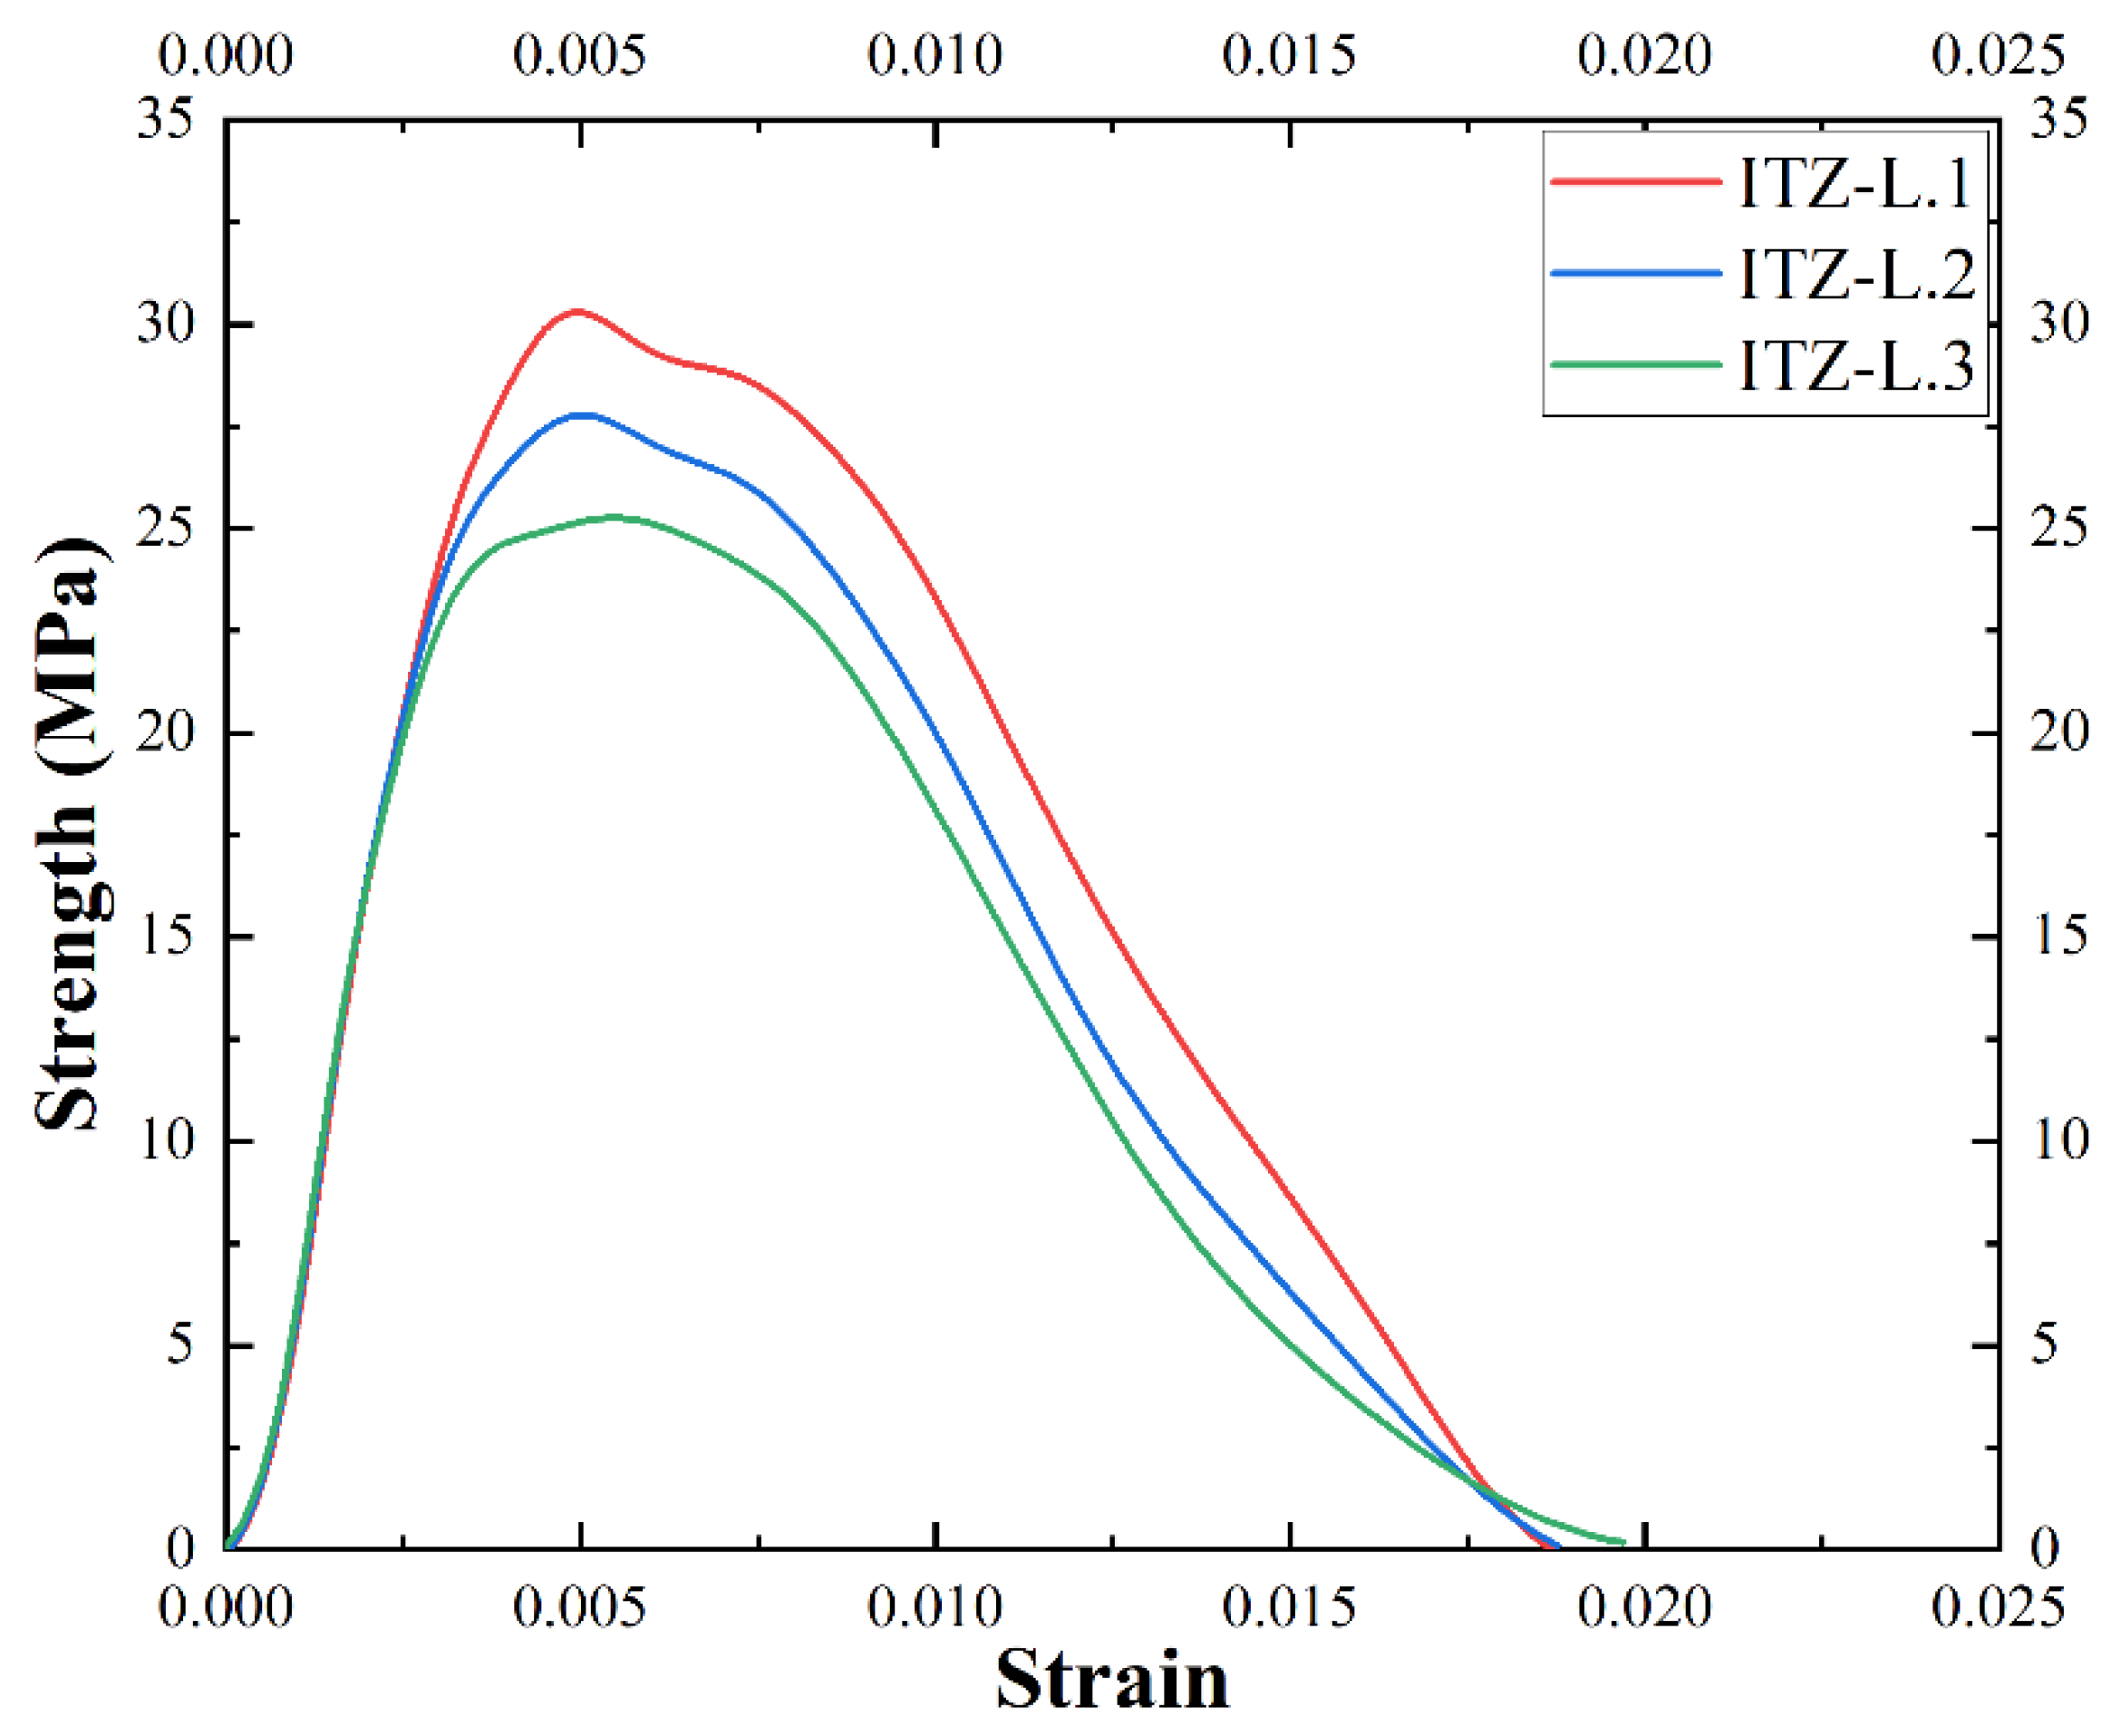
Figure 16.
Stress–strain curves of different ITZ layers.
Figure 16.
Stress–strain curves of different ITZ layers.
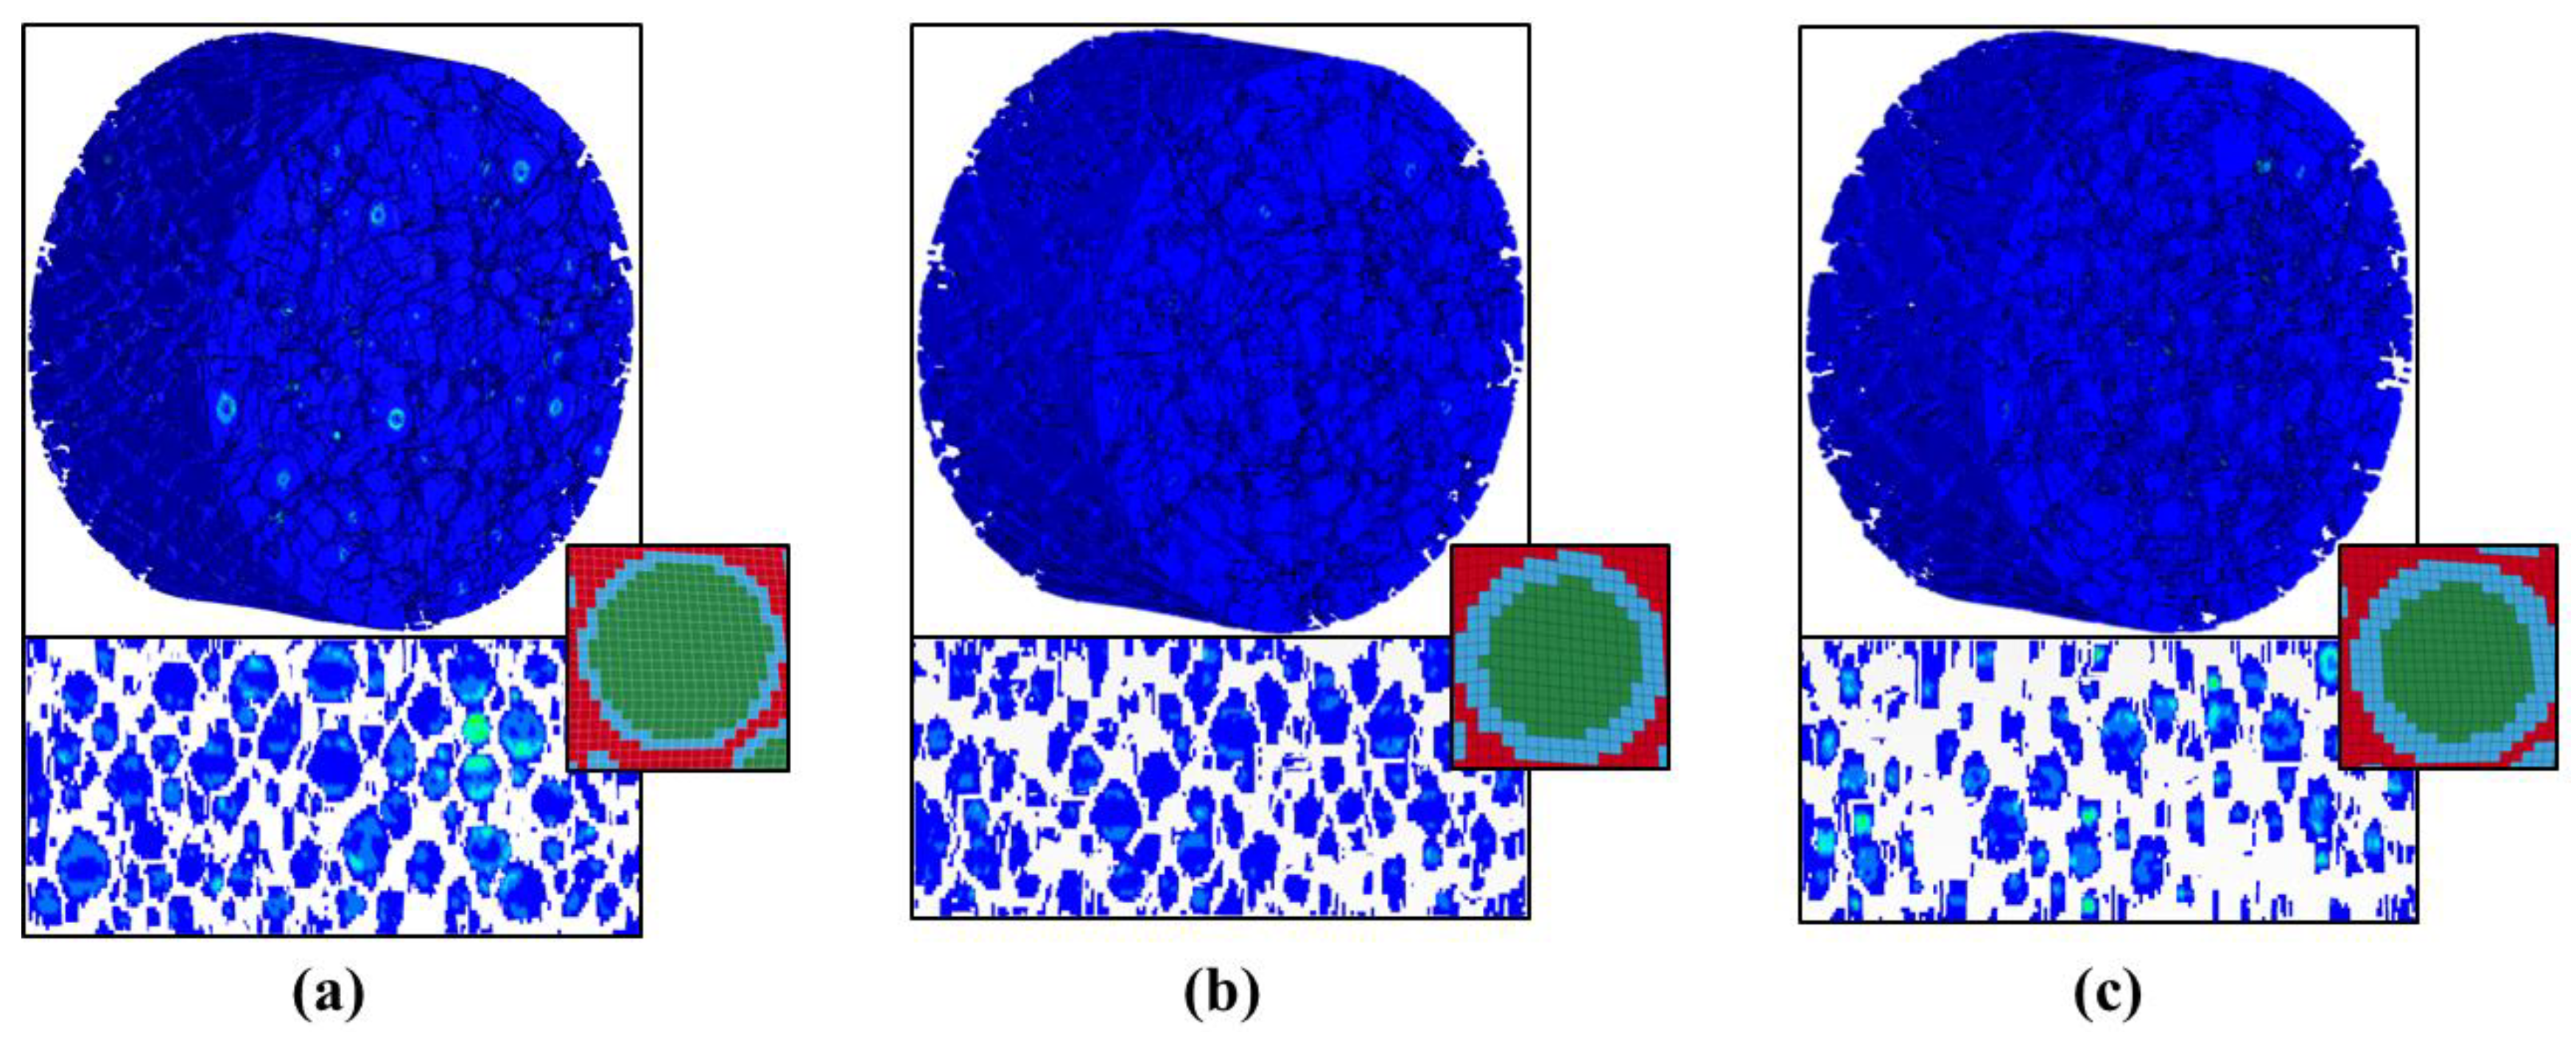
Figure 17.
Failure modes, longitudinal profile failures, and aggregate distribution of ITZ layers (a) one, (b) two, and (c) three.
Figure 17.
Failure modes, longitudinal profile failures, and aggregate distribution of ITZ layers (a) one, (b) two, and (c) three.
Table 1.
Mass mix ratio of lightweight aggregate concrete (kg/m3).
Table 1.
Mass mix ratio of lightweight aggregate concrete (kg/m3).
| Composition | Mass Mixing Ratio |
|---|
| Cement | Water | Sand | ALA |
|---|
| SLAC | 398 | 210 | 609 | 756 |
Table 2.
Statistics of aggregate area fraction in profiles.
Table 2.
Statistics of aggregate area fraction in profiles.
| Number | Aggregate Number in Profile | Aggregate Area (mm2) | Profile Area (mm2) | Aggregate Area Fraction |
|---|
| 1 | 126 | 4783 | 7306 | 65.5% |
| 2 | 117 | 4666 | 7443 | 62.7% |
| 3 | 121 | 4316 | 7330 | 58.9% |
Table 3.
Aggregate delivery program parameter setting and actual delivery situation.
Table 3.
Aggregate delivery program parameter setting and actual delivery situation.
| Diameter Range (mm) | 3~5 | 5~8 | 8~10 |
|---|
| Number of attempt drops | 3,510,000 | 27,000 | 180 |
| Number of iterations | 50 | 140 | 80 |
| Actual number of drops | 2240 | 842 | 178 |
Table 4.
Keyword parameters of mortar and ITZ [
23,
24,
25].
Table 4.
Keyword parameters of mortar and ITZ [
23,
24,
25].
| Param. | /(g·cm−3) | | | | | | | | |
|---|
| Mortar | 2.40 | 1.90 × 10⁻⁴ | 0.495 | 240 | 5.08 × 10⁻⁵ | 0.492 | 1930 | 0.754 | 116 |
| ITZ | 2.20 | 1.62 × 10⁻⁴ | 0.495 | 243 | 4.93 × 10⁻⁵ | 0.492 | 2084 | 0.765 | 126 |
Table 5.
Keyword parameters of lightweight aggregate [
26].
Table 5.
Keyword parameters of lightweight aggregate [
26].
| Param. | /(g·cm−3) | G/GPa | A | B | /(MPa) | C | N |
| Value | 0.927 | 5.83 | 0.54 | 2.25 | 52.2 | 0.007 | 1.36 |
| Param. | | /(MPa) | | | | /MPa | |
| Value | 7.0 | 2.40 | 0.04 | 1.0 | 0.01 | 17.4 | 0.0022 |
| Param. | /MPa | | /Mbar | /Mbar | /Mbar | FS | |
| Value | 900 | 0.12 | 0.85 | −1.71 | 2.08 | 0.004 | |
Table 6.
Peak stress and peak strain with aggregate contents of 30%, 34%, 38%, 42%, 46%, and 50%.
Table 6.
Peak stress and peak strain with aggregate contents of 30%, 34%, 38%, 42%, 46%, and 50%.
| Content | 30% | 34% | 38% | 42% | 46% | 50% |
|---|
| Peak stress (MPa) | 26.8 | 27.5 | 28.2 | 28.8 | 29.5 | 30.3 |
| Peak strain | 0.0050 | 0.0050 | 0.0048 | 0.0050 | 0.0053 | 0.0049 |
Table 7.
Peak stress and peak strain of different ITZ layers.
Table 7.
Peak stress and peak strain of different ITZ layers.
| ITZ Layer | L.1 | L.2 | L.3 |
|---|
| Peak stress (MPa) | 30.3 | 27.8 | 25.3 |
| Peak strain | 0.0049 | 0.0050 | 0.0055 |


