
Smartphone-Based Cost-Effective Pavement Performance Model Development Using a Machine Learning Technique with Limited Data


Abstract
1. Introduction
2. Literature Review
2.1. Pavement Performance Model Types
2.2. Modeling Techniques
2.3. Pavement Performance Modeling Procedure
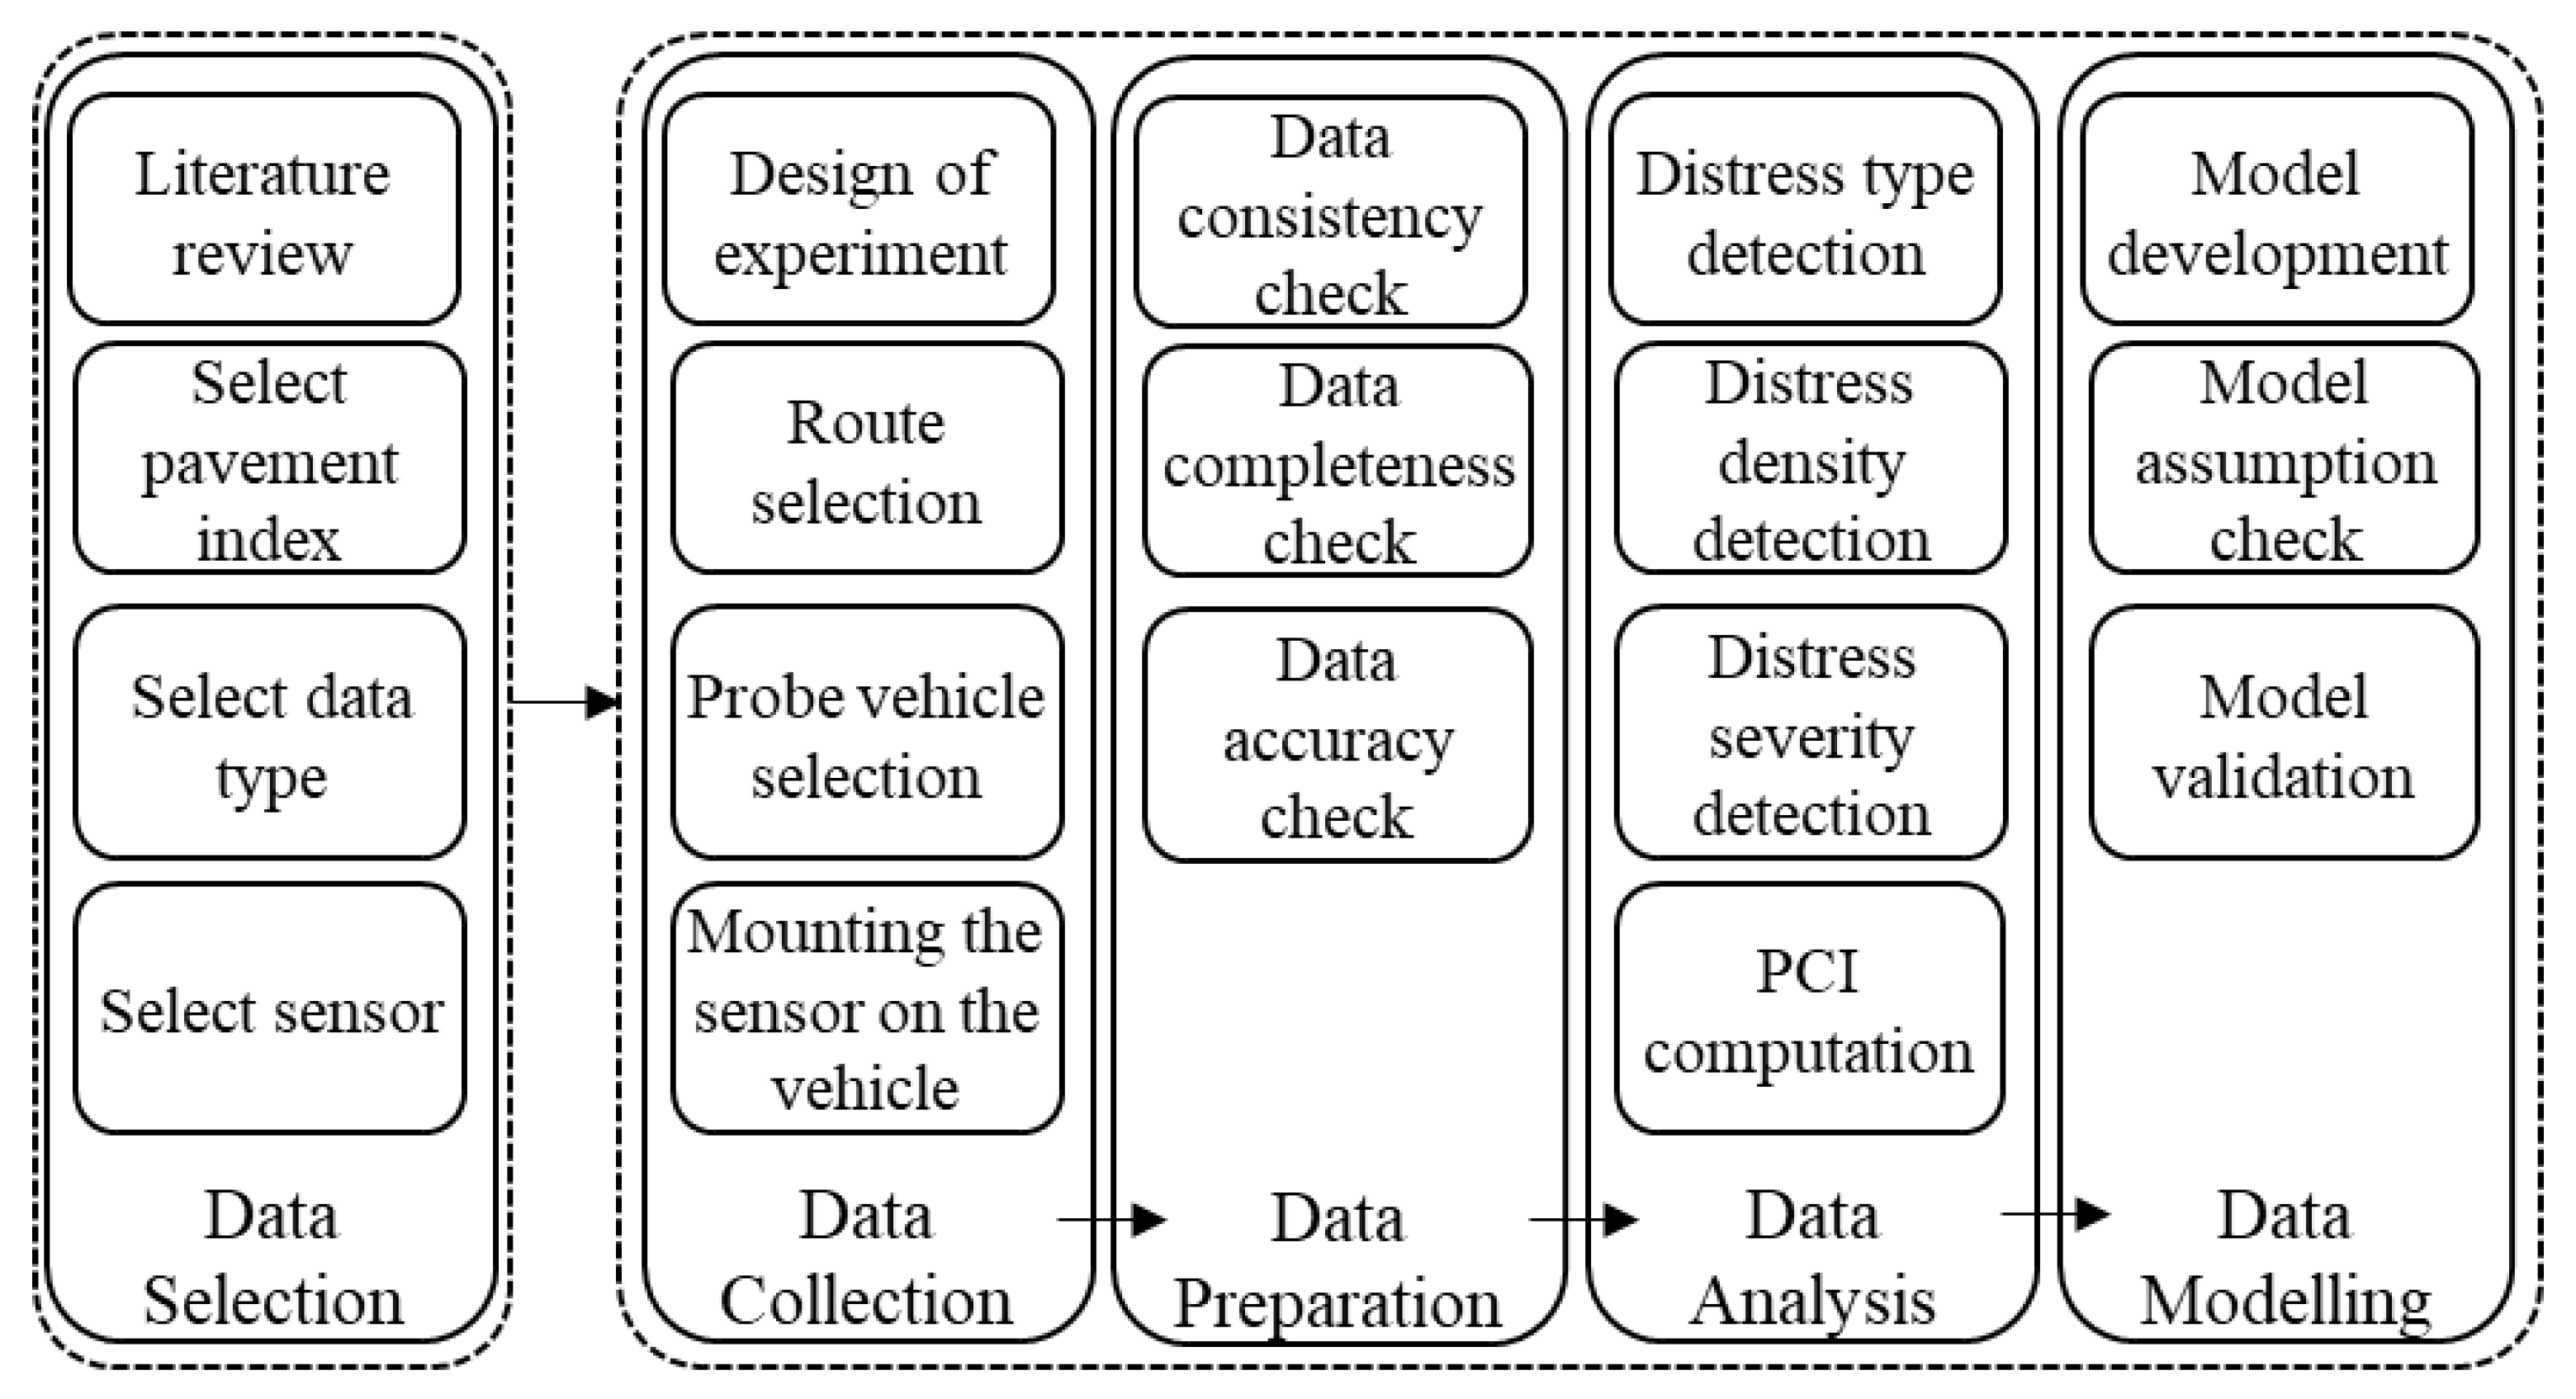
3. Research Methodology
3.1. Data Selection
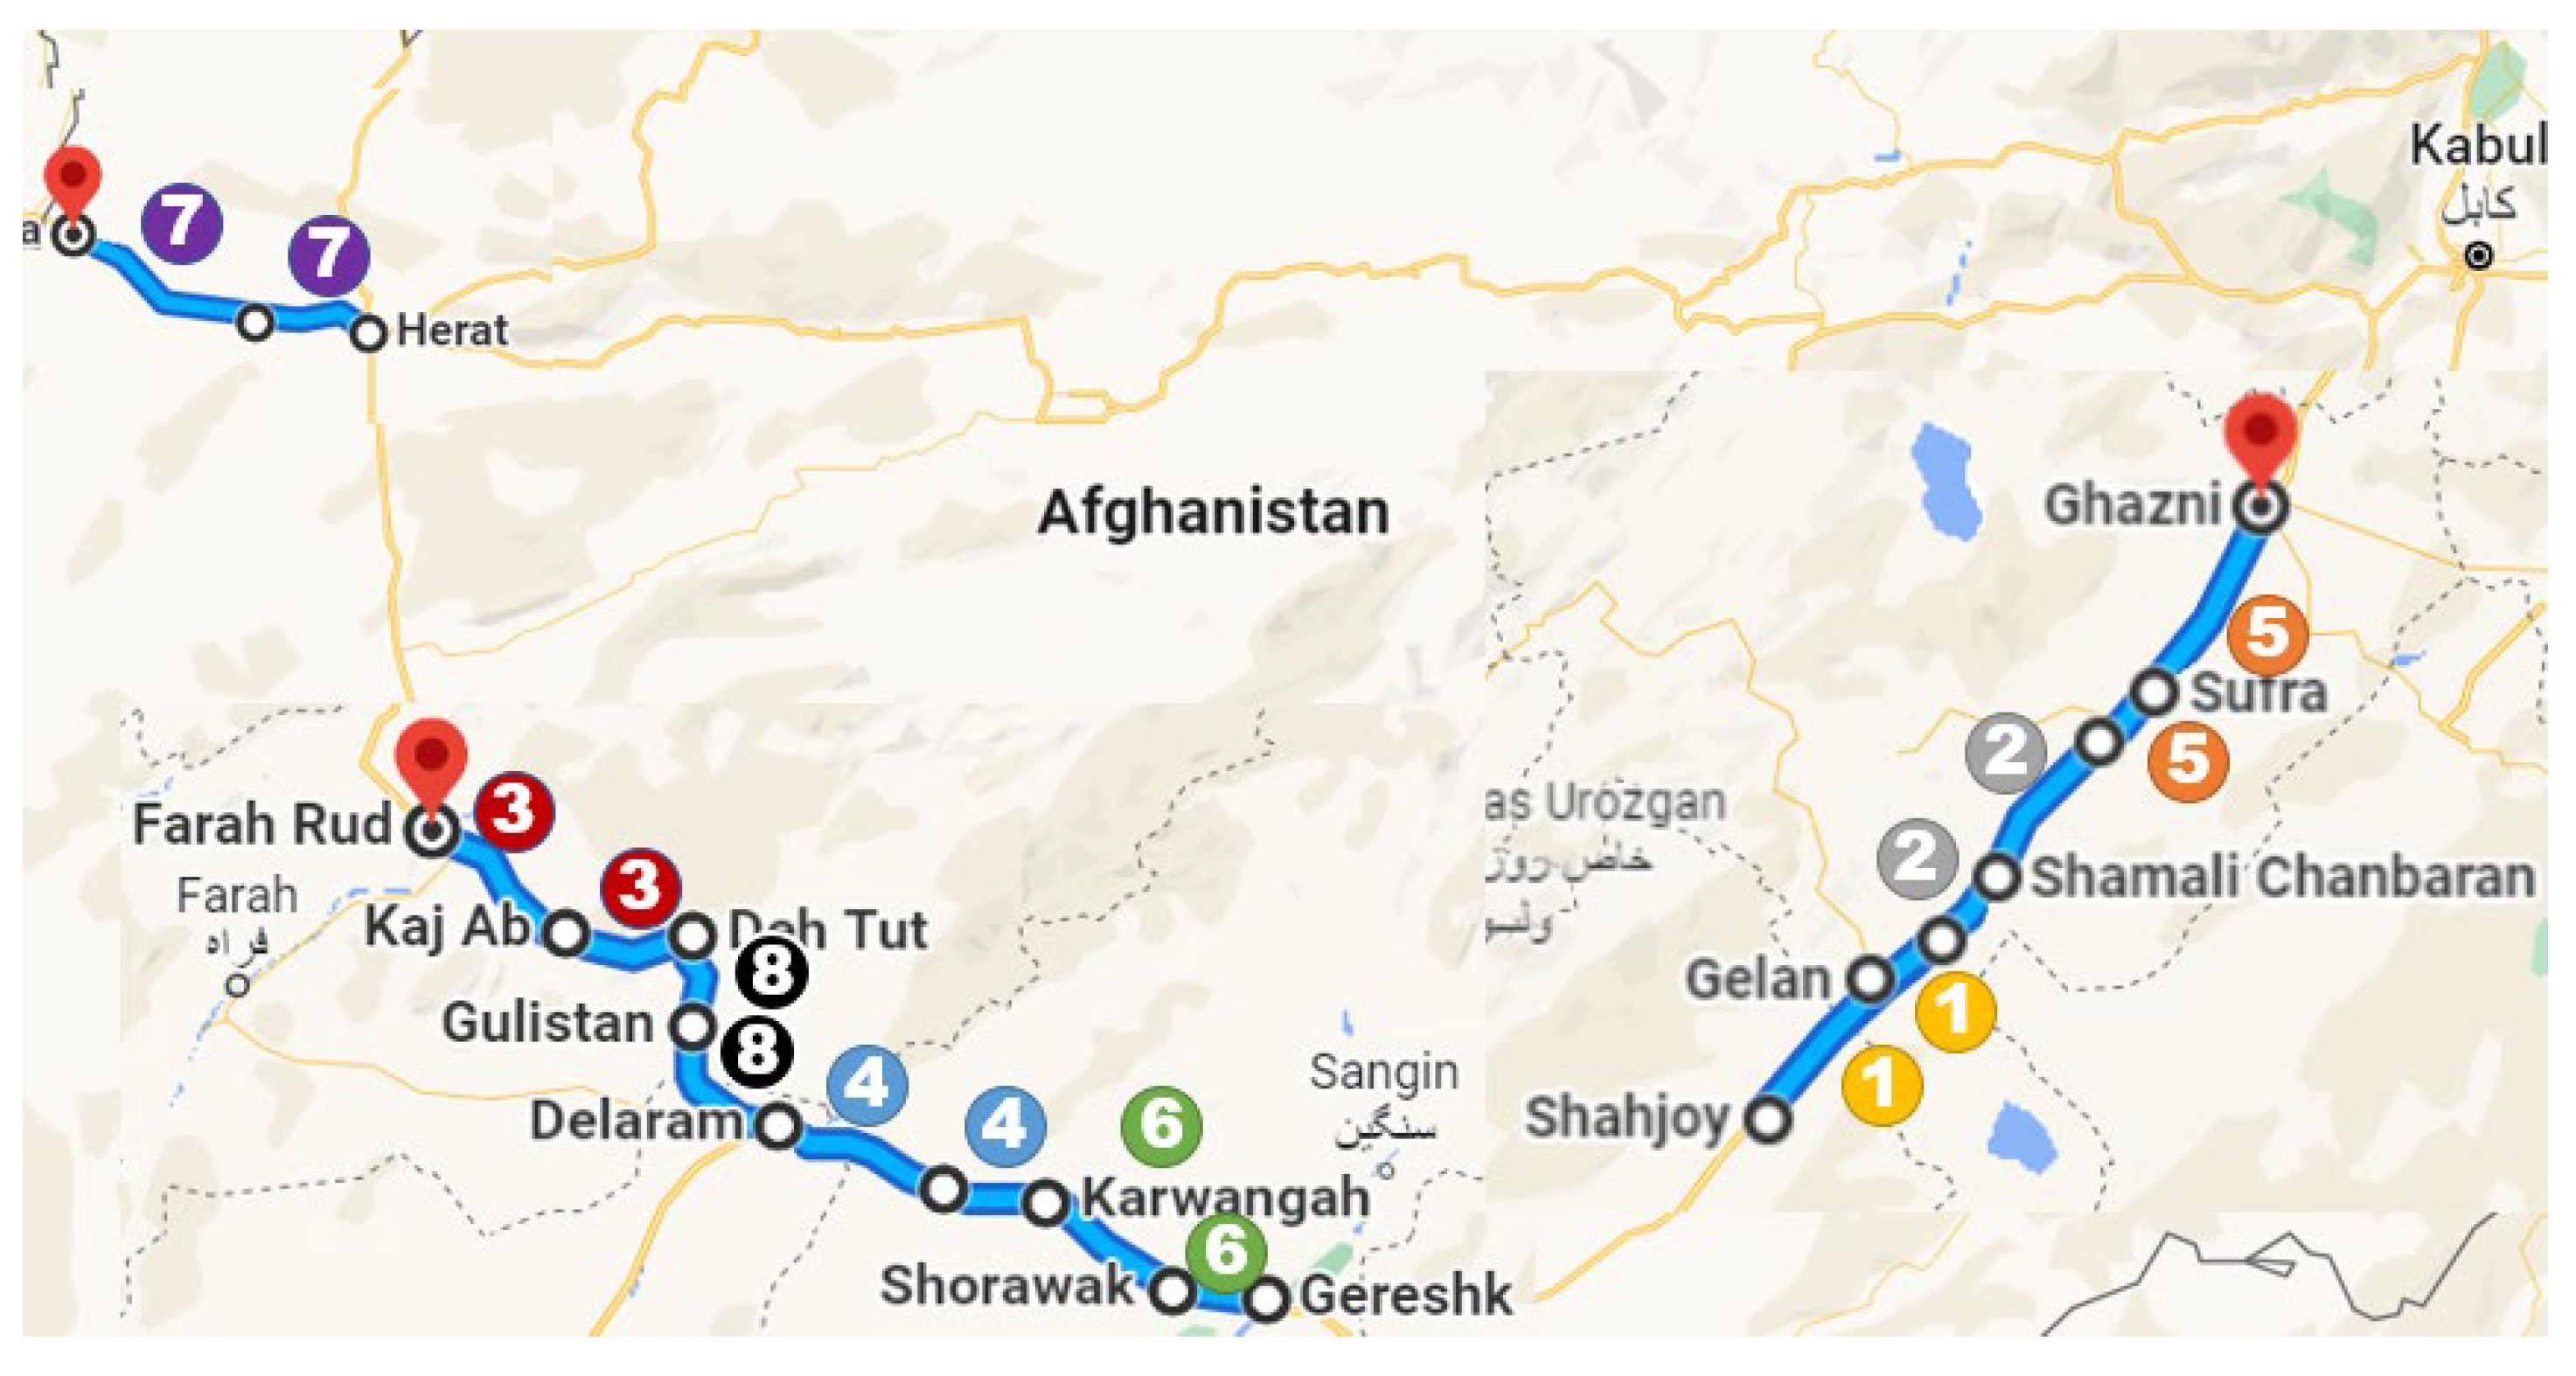
3.2. Data Collection
3.3. Data Preparation
- The subsection length with minimum pavement condition variability was considered to be ten meters. Nevertheless, to tackle the problem of the inaccurate location of collected data, ten adjacent subsections were combined to build a section (100 m long) with the average condition of the subsections.
- The outliers were not detected in the dataset i.e., the PCI value is not out of the range of three times the standard deviation from the mean PCI.
- The data set did not contain the missing pavement age data. Therefore, removing the missing data was not applied in the modeling process.
- There was no need for data scaling as the order of magnitude of the variables in the model, i.e., PCI and pavement age, would not have a significant difference.
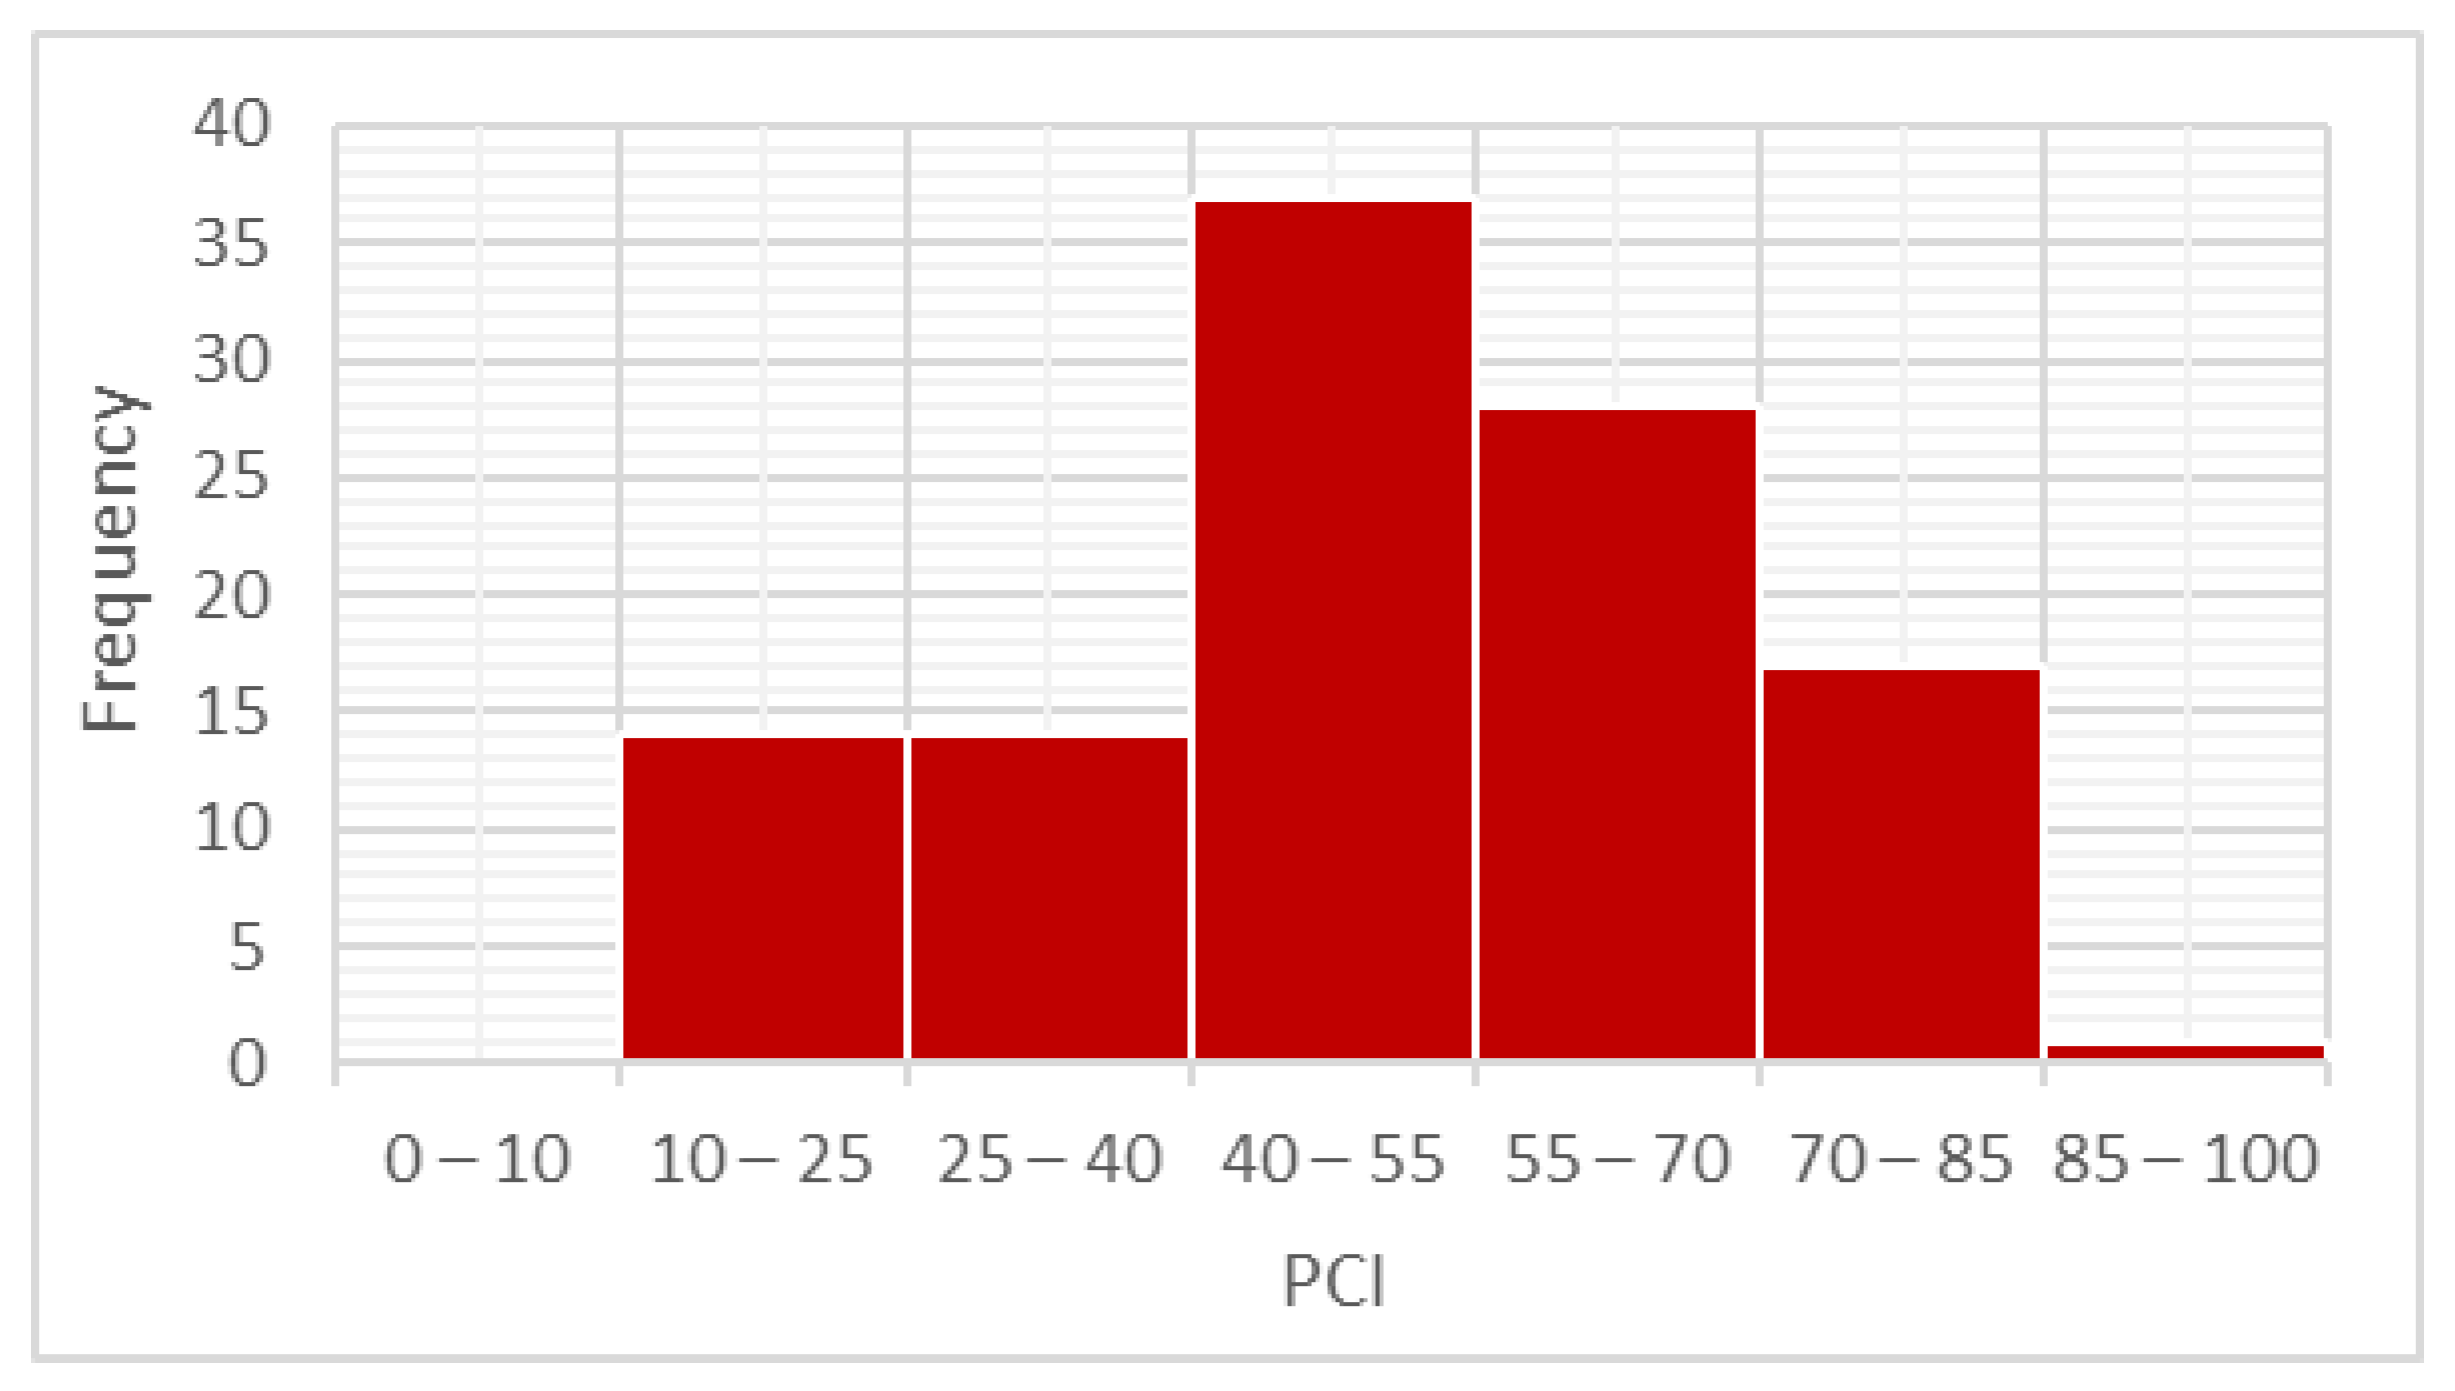
3.4. Data Analysis
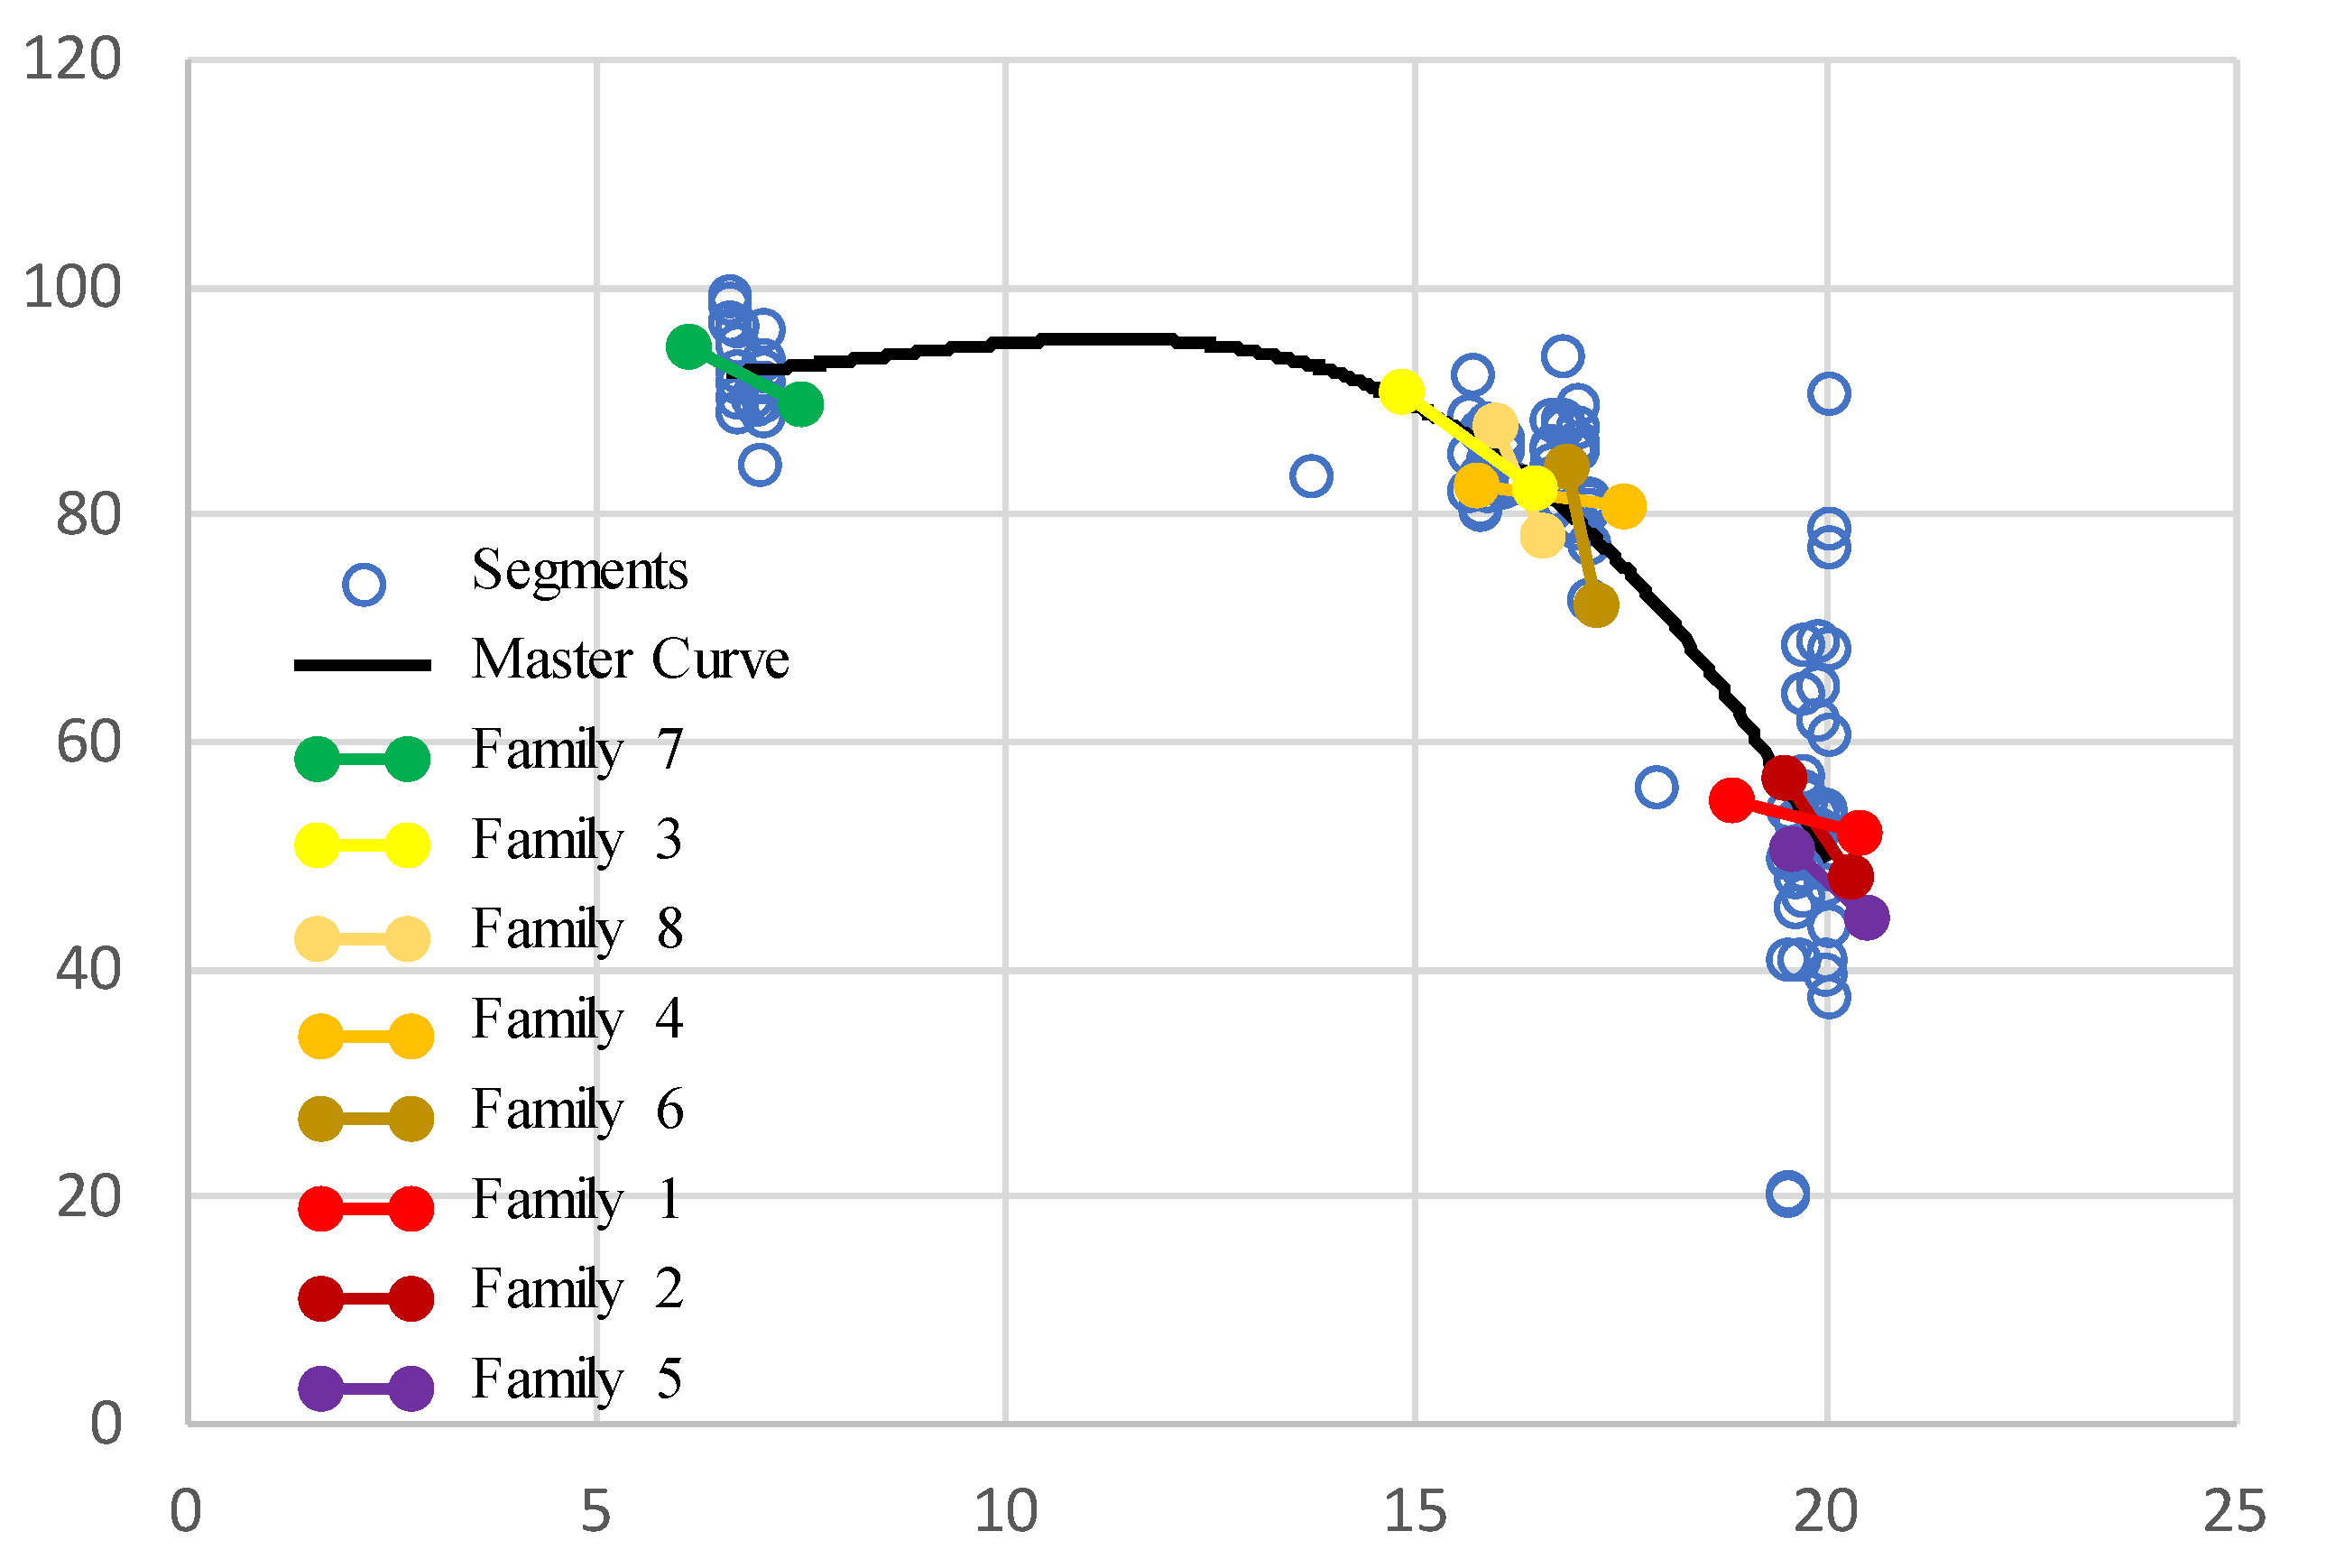
3.5. Data Modeling
3.5.1. Model Development
3.5.2. Model Assumptions
3.5.3. Model Validation
4. Conclusions
- (1)
- Pavement performance model development was not feasible for each pavement family due to the limited range of pavement age and lack of sample data.
- (2)
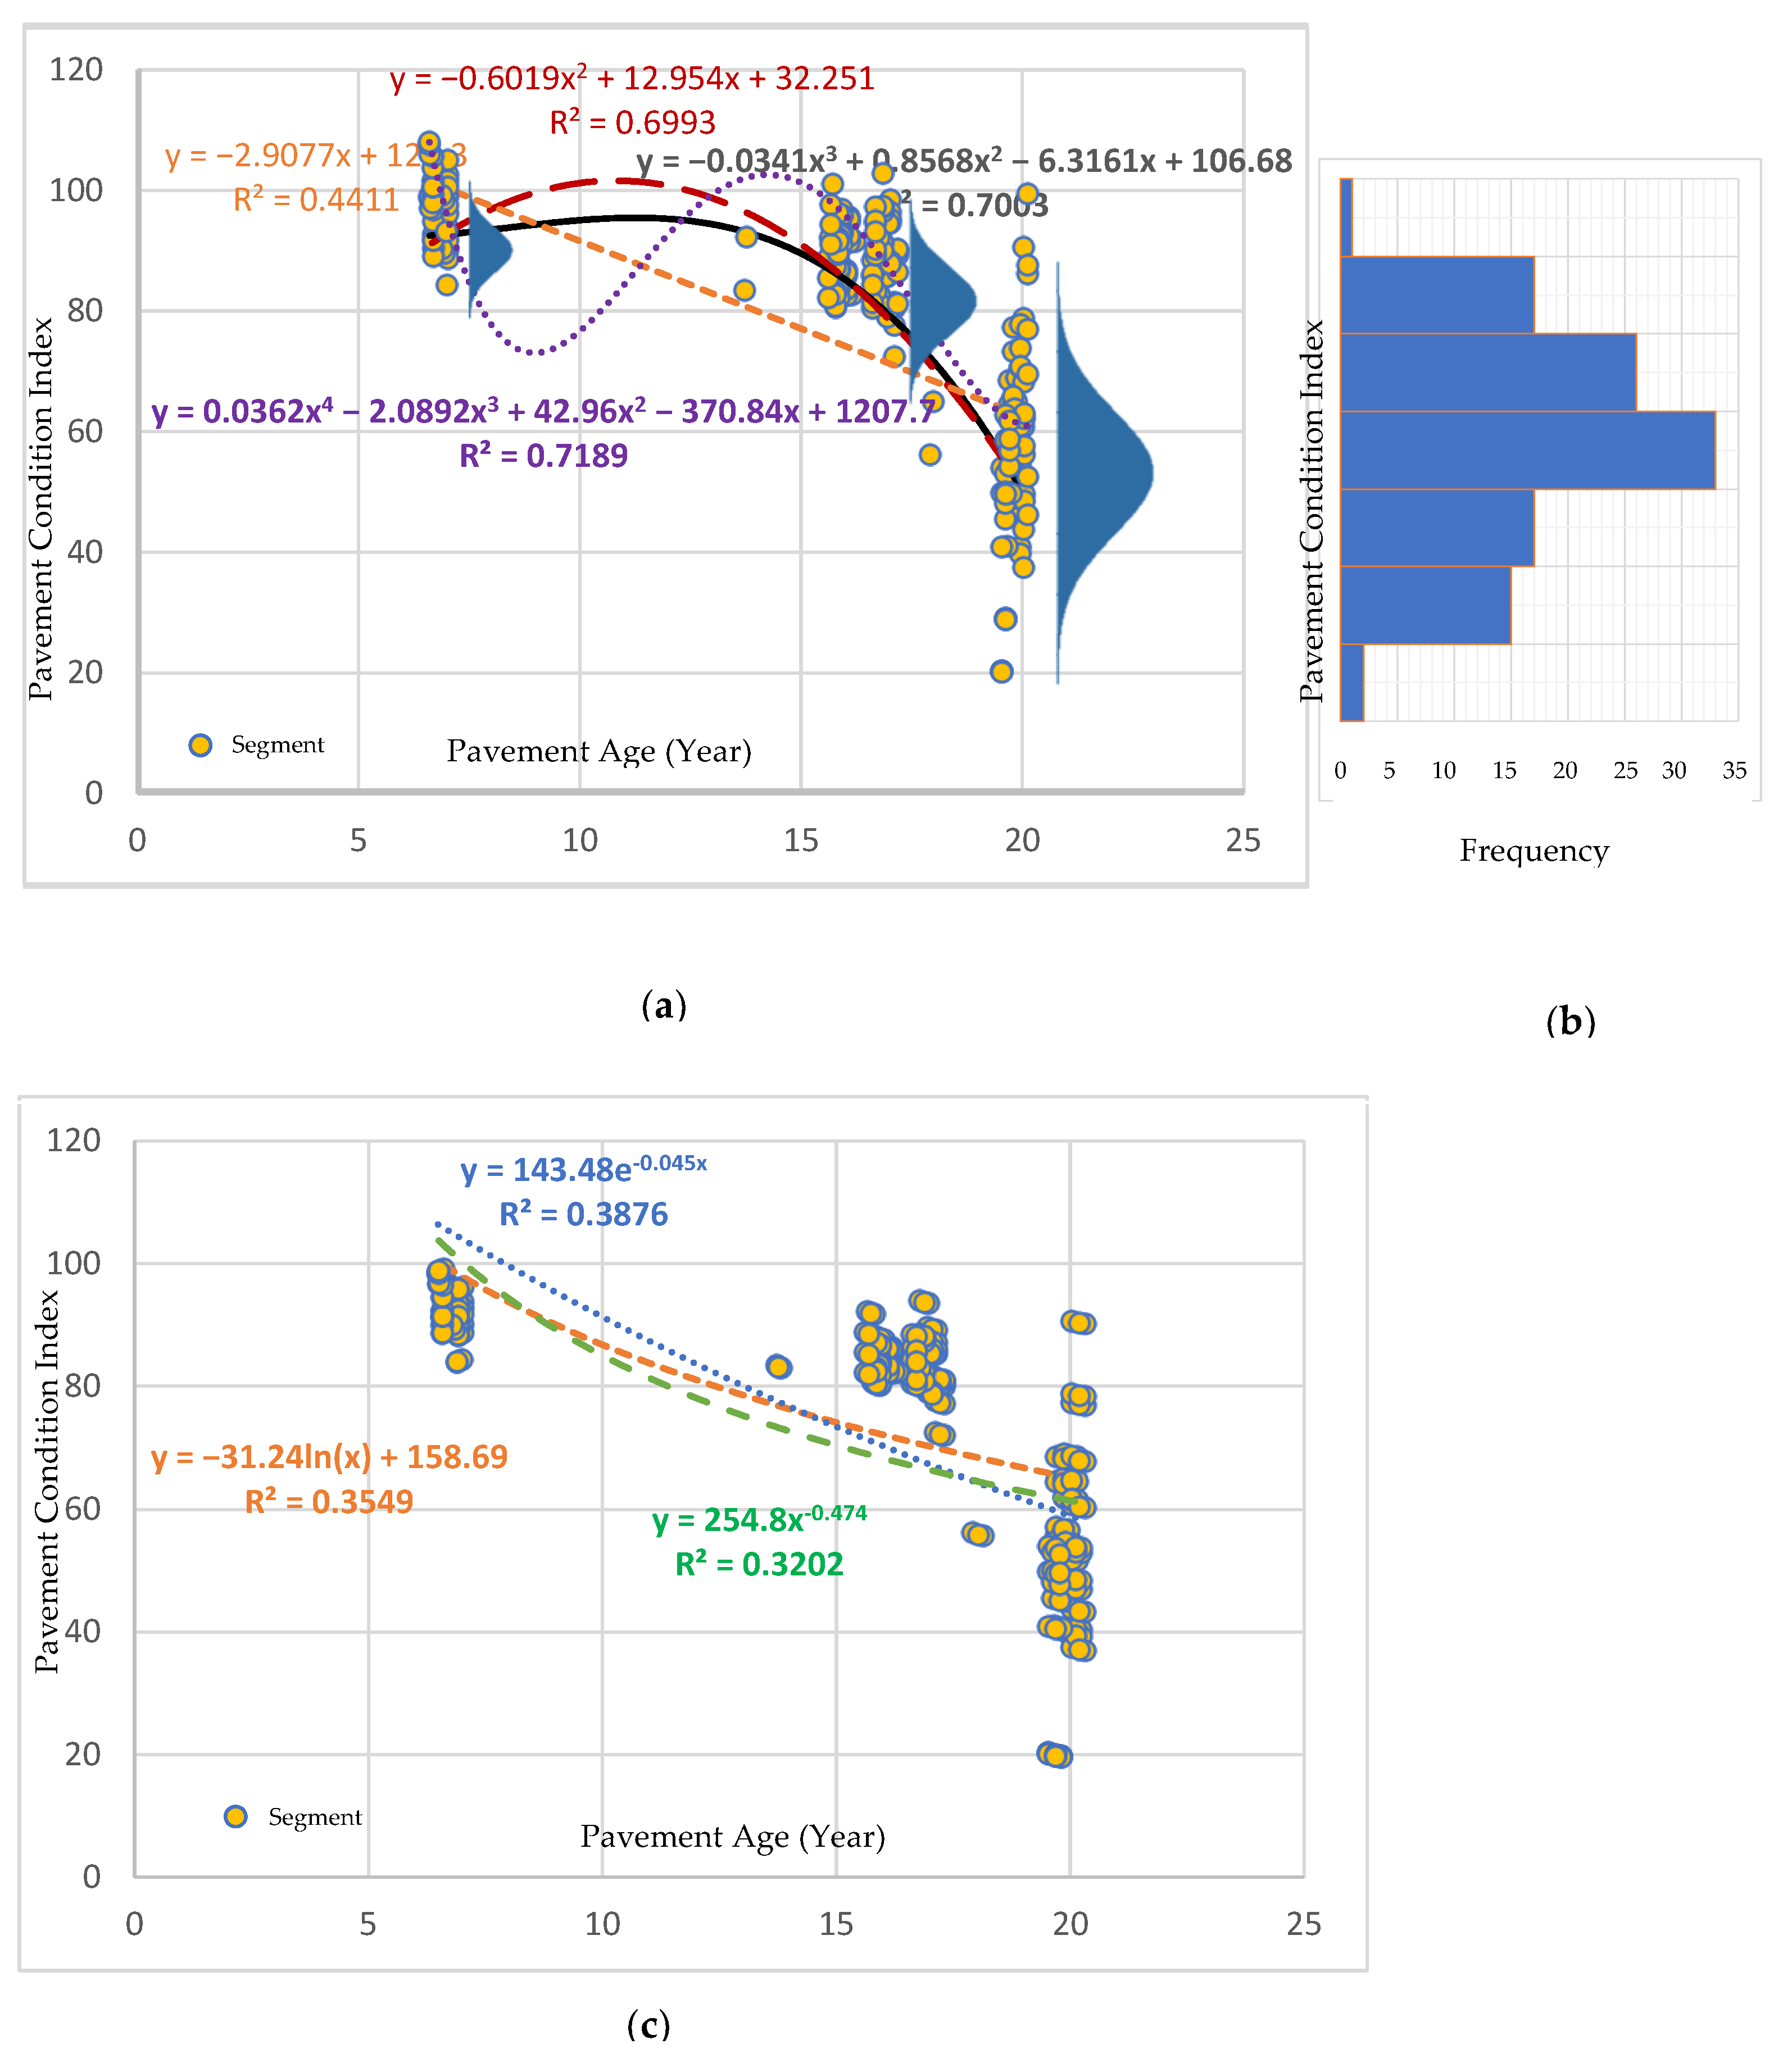
- Simple linear, polynomial, and non-linear regression models were fitted to the pavement condition data (PCI) to find the best performance. The best-performing model was the third-order polynomial model.
- (3)
- The third-order polynomial model’s coefficient of determination and root mean squared error were 0.70 and 10.5, respectively.
- (4)
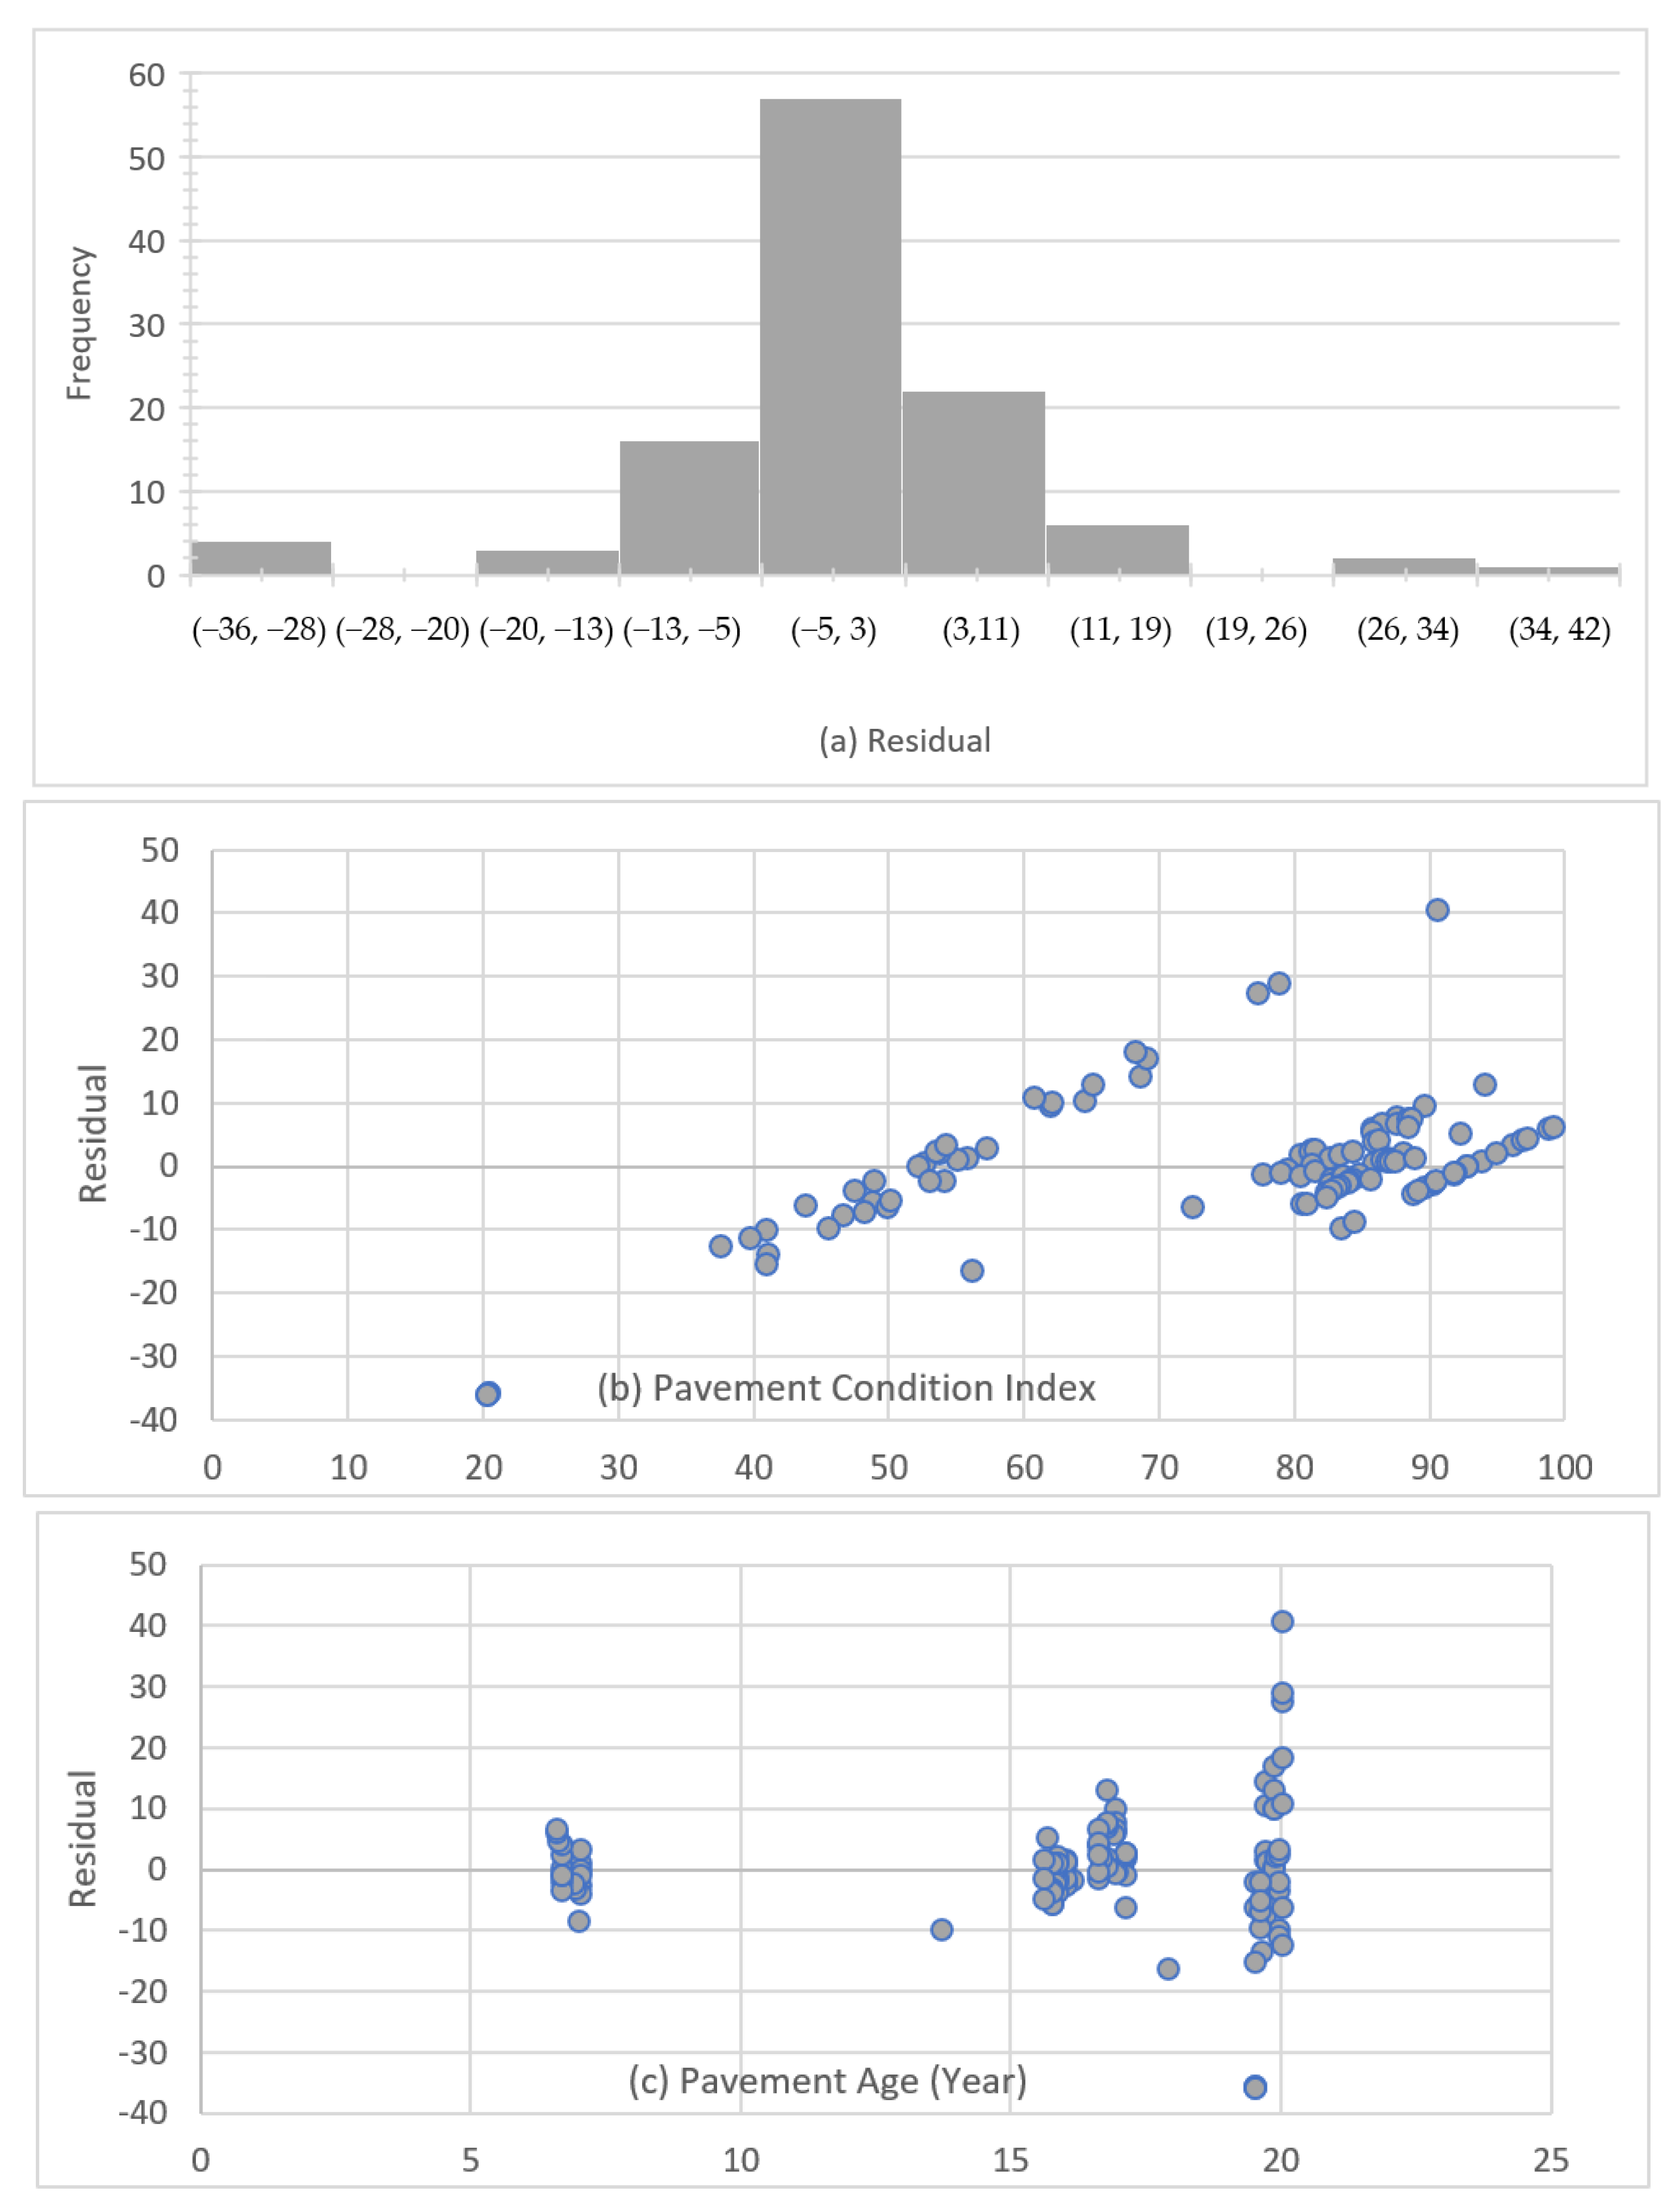
- The model regression assumptions were successfully checked, including uniformity of residuals, homoscedasticity, no multicollinearity, and no autocorrelation.
- (5)
- The model was successfully validated with unseen or test data (20% of the total dataset) via the checking of a two-sample t-test and a high correlation between the predicted and actual PCI.
- (6)
- Other developing countries with limited budgets and a lack of sophisticated automated pavement data collection tools can apply the proposed systematic approach in this research.
- (7)
- The limitation of this study was the lack and sparsity of sample data over the lifespan of asphalt pavement, which resulted in the development of a primary pavement performance model. The model can only predict the PCI in the range of data fed into it between 6 and 20 years.
- (8)
- The other limitation is that the model presents a general pavement deterioration trend over all pavement conditions, regardless of pavement criteria such as pavement structure, traffic loading, and weather conditions. The model cannot specifically predict the future condition of pavement for a region with a specific pavement criterion.
- (9)
- It is suggested that other indices, such as the IRI, can be captured via embedded smartphone sensors such as an accelerometer and gyroscope. The combination of PCI and IRI can be utilized for pavement maintenance planning.
- (10)
- It is suggested that the primary model (prior probability), such as that developed in this study, can be combined with more future field investigation data, resulting in increasing model accuracy (posterior probability) via a technique such as the Bayesian model.
Author Contributions
Funding
Data Availability Statement
Conflicts of Interest
References
- NCHRP. Pavement Management Systems: Putting Data to Work; The National Academies Press: Washington, DC, USA, 2017. [Google Scholar] [CrossRef]
- He, Z.; Qin, X.; Wang, H.; Comes, C. Implementing Practical Pavement Management Systems for Small Communities: A South Dakota Case Study. Public Work. Manag. Policy 2017, 22, 378–391. [Google Scholar] [CrossRef]
- Al-Dabbagh, M. A Low-Cost Method to Develop an Initial Pavement Management System. Master’s Thesis, Concordia University, Montreal, QC, Canada, 2014. [Google Scholar]
- Aggarwal, S.; Jain, S.S.; Parida, M. Pavement management system for a national highway network in India. In Proceedings of the 6th International Conference on Managing Pavements, Brisbane, QLD, Australia, 19–24 October 2004. [Google Scholar]
- Bhardwaj, B.; Goswami, S. Road asset management system in developing countries-implementation and challenges. Int. J. Civ. Eng. Technol. 2019, 10, 1227–1232. Available online: https://www.researchgate.net/profile/Bibhuti-Bhardwaj/publication/332251206_Road_asset_management_system_in_developing_countries-implementation_and_challenges/links/5d935099a6fdcc2554a9c70a/Road-asset-management-system-in-developing-countries-implementation-and-challenges.pdf (accessed on 10 October 2023).
- Khedr, S.; El Dimeery, I. Pavement Management System for Provinces in Developing Countries: Implementation in Fayoum, Egypt. Transp. Res. Rec. 1994, 1455, 101. Available online: http://onlinepubs.trb.org/Onlinepubs/trr/1994/1455/1455-013.pdf (accessed on 20 October 2023).
- Al-Abdul Wahhab, H.; Ramadhan, R.; Asi, I.; Yazdani, J. Development of pavement management system for municipality roads, Saudi Arabia. In Transportation Research Board; Academia.edu: San Francisco, CA, USA, 2002; Available online: https://www.researchgate.net/publication/228888072_Development_of_Pavement_Management_System_for_Municipality_Roads_Saudi_Arabia (accessed on 20 October 2023).
- Chamorro, A.; Tighe, S. Development and Application of a Sustainable Management System for Unpaved Rural Road Networks. Transp. Res. Rec. J. Transp. Res. Board 2019, 2673, 891–901. [Google Scholar] [CrossRef]
- Zofka, A.; Josen, R.; Paliukaitė, M.; Vaitkus, A.; Mechowski, T.; Maliszewski, M. Elements of pavement management system: Case study. Balt. J. Road Bridge Eng. 2014, 9, 1–9. [Google Scholar] [CrossRef]
- Picado-Santos, L.; Ferreira, A.; Antunes, A.; Carvalheira, C.; Santos, B.; Bicho, M.; Quadrado, I.; Silvestre, S. Pavement management system for Lisbon. Proc. Inst. Civ. Eng. Munic. Eng. 2004, 157, 157–165. [Google Scholar] [CrossRef]
- Montoya-Alcaraz, M.; Mungaray-Moctezuma, A.; García, L. Sustainable road maintenance planning in developing countries based on paveme0nt management systems: Case study in Baja California, México. Sustainability 2019, 12, 36. [Google Scholar] [CrossRef]
- Golroo, A.; Tighe, S.L. Development of panel rating protocol and condition evaluation model for pervious concrete pavement. J. Transp. Eng. 2012, 138, 315–323. [Google Scholar] [CrossRef]
- Prieto, A.J.; Guiñez, F.; Ortiz, M.; González, M. Fuzzy Inference System for Predicting Functional Service Life of Concrete Pavements in Airports. Infrastructures 2022, 7, 162. [Google Scholar] [CrossRef]
- Ali, A.; Heneash, U.; Hussein, A.; Eskebi, M. Predicting Pavement Condition Index Using Fuzzy Logic Technique. Infrastructures 2022, 7, 91. [Google Scholar] [CrossRef]
- Alimoradi, S.; Golroo, A.; Asgharzadeh, S.M. Development of pavement roughness master curves using Markov Chain. Int. J. Pavement Eng. 2020, 23, 453–463. [Google Scholar] [CrossRef]
- Hanandeh, S. Introducing mathematical modeling to estimate pavement quality index of flexible pavements based on genetic algorithm and artificial neural networks. Case Stud. Constr. Mater. 2022, 16, e00991. [Google Scholar] [CrossRef]
- Ayasrah, U.B.; Tashman, L.; AlOmari, A.; Asi, I. Development of a temperature prediction model for flexible pavement structures. Case Stud. Constr. Mater. 2023, 18, e01697. [Google Scholar] [CrossRef]
- Ansarilari, Z.; Golroo, A. Integrated airport pavement management using a hybrid approach of Markov Chain and supervised multi-objective genetic algorithms. Int. J. Pavement Eng. 2020, 21, 1864–1873. [Google Scholar] [CrossRef]
- Kadar, P.; Martin, T.; Baran, M.; Sen, R. Addressing Uncertainties of Performance Modeling with Stochastic Information Packages—Incorporating Uncertainty in Performance and Budget Forecasts. In Proceedings of the 9th International Conference on Managing Pavements, Washington, DC, USA, 18–21 May 2015; Available online: https://vtechworks.lib.vt.edu/bitstream/handle/10919/56395/ICMPA9-000126.PDF?sequence=2&isAllowed=y (accessed on 20 October 2023).
- Zhang, Q.; Gu, X.; Liang, J.; Yu, Z.; Dong, Q.; Jiang, J. Application of a stochastic damage model to predict the variability of creep behavior for asphalt mixtures. Case Stud. Constr. Mater. 2023, 18, e02078. [Google Scholar] [CrossRef]
- Golroo, A.; Tighe, S.L. Pervious Concrete Pavement Performance Modeling Using the Bayesian Statistical Technique. J. Transp. Eng. 2012, 138, 603–609. [Google Scholar] [CrossRef]
- Di Benedetto, A.; Fiani, M.; Gujski, L.M. U-Net-Based CNN Architecture for Road Crack Segmentation. Infrastructures 2023, 8, 90. [Google Scholar] [CrossRef]
- Hammouch, W.; Chouiekh, C.; Khaissidi, G.; Mrabti, M. Crack Detection and Classification in Moroccan Pavement Using Convolutional Neural Network. Infrastructures 2022, 7, 152. [Google Scholar] [CrossRef]
- Liu, X.; Al-Qadi, I.L. Mechanistic Excess Fuel Consumption of a 3D Passenger Vehicle on Rough Pavements. J. Transp. Eng. Part B Pavements 2023, 149, 04022065. [Google Scholar] [CrossRef]
- Kang, S.; Ozer, H.; Al-Qadi, I.L.; Spencer, B.F. Stochastic analysis of rolling resistance energy dissipation for a tractor-trailer model. Transp. Res. Rec. 2019, 2673, 593–603. [Google Scholar] [CrossRef]
- FHWA. Pavement Management & Performance—Pavements—Federal Highway Administration; Federal Highway Administration: Washington, DC, USA, 2021. Available online: https://www.fhwa.dot.gov/pavement/mana.cfm (accessed on 20 October 2023).
- Ganji, M.R.; Ghelmani, A.; Golroo, A.; Sheikhzadeh, H. Asphalt pavement macrotexture monitoring in cracked surfaces by using an acoustical low-cost continuous method. Autom. Constr. 2021, 132, 103932. [Google Scholar] [CrossRef]
- Firoozi Yeganeh, S.; Mahmoudzadeh, A.; Azizpour, M.A.; Golroo, A. Validation of Smartphone-Based Pavement Roughness Measures. AUT J. Civ. Eng. 2017, 1, 135–144. [Google Scholar] [CrossRef]
- Raffaniello, A.; Bauer, M.; Safiuddin, M.; El-Hakim, M. Traffic and Climate Impacts on Rutting and Thermal Cracking in Flexible and Composite Pavements. Infrastructures 2022, 7, 100. [Google Scholar] [CrossRef]
- Premkumar, L.; Vavrik, W.R. Enhancing pavement performance prediction models for the Illinois Tollway System. Int. J. Pavement Res. Technol. 2016, 9, 14–19. [Google Scholar] [CrossRef]
- Sidess, A.; Ravina, A.; Oged, E. A model for predicting the deterioration of the international roughness index. Int. J. Pavement Eng. 2022, 23, 1393–1403. [Google Scholar] [CrossRef]
- Abdelaziz, N.; Abd El-Hakim, R.T.; El-Badawy, S.M.; Afify, H.A. International Roughness Index prediction model for flexible pavements. Int. J. Pavement Eng. 2020, 21, 88–99. [Google Scholar] [CrossRef]
- Radwan, M.; Mostafa, A.H.; Hashem, M.; Faheem, H. Modeling pavement performance based on LTPP database for flexible pavements. Tek. Dergi 2020, 31, 10127. [Google Scholar] [CrossRef]
- Younos, M.A.; Abd El-Hakim, R.T.; El-Badawy, S.M.; Afify, H.A. Multi-input performance prediction models for flexible pavements using LTPP database. Innov. Infrastruct. Solut. 2020, 5, 27. [Google Scholar] [CrossRef]
- Gao, L.; Hong, F.; Ren, Y.-H. Impacts of Seasonal and Annual Weather Variations on Network-Level Pavement Performance. Infrastructures 2019, 4, 27. [Google Scholar] [CrossRef]
- Karim, F.M.A.; Rubasi, K.A.H.; Saleh, A.A. The road pavement condition index (PCI) evaluation and maintenance: A case study of Yemen. Organ. Technol. Manag. Constr. Int. J. 2016, 8, 1446–1455. [Google Scholar] [CrossRef]
- Hafizyar, R.; Mosaberpanah, M.A. Evaluation of flexible road pavement condition index and life cycle cost analysis of pavement maintenance: A case study in Kabul Afghanistan. Int. J. Sci. Eng. Res. 2018, 9, 1909–1919. [Google Scholar]
- Mallika, L.; Ratnam, D.V.; Raman, S.; Sivavaraprasad, G. Performance analysis of Neural Networks with IRI-2016 and IRI-2012 models over Indian low-latitude GPS stations. Astrophys. Space Sci. 2020, 365, 124. [Google Scholar] [CrossRef]
- Chen, C.; Zhang, J. Comparisons of IRI-Based pavement deterioration prediction models using New Mexico pavement data. In Proceedings of the Geo-Frontiers 2011, Dallas, TX, USA, 13–16 March 2011; Advances in Geotechnical Engineering. pp. 4594–4603. [Google Scholar]
- Semnarshad, S.; Golroo, A.; Kavousi, A. Development of a Pavement Overall Deterioration Index (Case Study: Iran). AUT J. Civ. Eng. 2021, 5, 359–376. [Google Scholar]
- Ahmed, N.G.; Awda, G.J.; Saleh, S.E. Development of pavement condition index model for flexible pavement in Baghdad City. J. Eng. 2008, 14, 2120–2135. [Google Scholar]
- Tchemou, G.; Minsili, L.S.; Mokotemapa, A.M.; Eko, R.M.; Manguelle, J.H. Prediction of flexible pavement degradation: Application to rutting in Cameroonian highways. Electron. J. Geotech. Eng. EJGE 2011, 16, 1301–1319. [Google Scholar]
- JICA. The Project Formulation Study on Road Maintenance and Management Sector in Afghanistan Final Report: Report of Actual Condition of Road Maintenance and Management System in Regions; Katahira & Engineers International: Pasig City, Philippines, 2006; Available online: https://openjicareport.jica.go.jp/614/614/614_301_11838679.html (accessed on 20 October 2023).
- MPW. Road Sector Strategy 2019-23. Government of Islamic Republic of Afghanistan. May 2018. Available online: https://mot.gov.af/sites/default/files/2019-09/Road%20Sector%20Strategy%20Eng.pdf (accessed on 20 October 2023).
- ASTM D6433-20; Standard Practice for Roads and Parking Lots Pavement Condition Index Surveys. ASTM International: West Conshohocken, PA, USA, 2020. Available online: https://www.astm.org/Standards/D6433.htm (accessed on 20 October 2023).
- NCHRP. Automated Pavement Distress Collection Techniques; The National Academies Press: Washington, DC, USA, 2004. [Google Scholar] [CrossRef]
- Sholevar, N.; Golroo, A.; Esfahani, S.R. Machine learning techniques for pavement condition evaluation. Autom. Constr. 2022, 136, 104190. [Google Scholar] [CrossRef]
- Elhadidy, A.A.; El-Badawy, S.M.; Elbeltagi, E.E. A simplified pavement condition index regression model for pavement evaluation. Int. J. Pavement Eng. 2021, 22, 643–652. [Google Scholar] [CrossRef]
- Wu, K. Development of PCI-Based Pavement Performance Model for Management of Road Infrastructure System; Arizona State University: Tempe, AZ, USA, 2015. [Google Scholar]
- Kargah-Ostadi, N.; Zhou, Y.; Rahman, T. Developing Performance Prediction Models for Pavement Management Systems in Local Governments in Absence of Age Data. Transp. Res. Rec. 2015, 2673, 334–341. [Google Scholar] [CrossRef]


| Road Class | Asphalt | Gravel | Earthen | Total | ||||
|---|---|---|---|---|---|---|---|---|
| km | % | km | % | km | % | km | % | |
| National highways | 4598 | 59 | 2042 | 20 | 214 | 20 | 6854 | 35 |
| Provincial Roads | 813 | 10 | 464 | 4 | 117 | 11 | 1394 | 7 |
| District Roads | 2482 | 31 | 7853 | 76 | 744 | 69 | 11,079 | 58 |
| Total | 7893 | 40 | 10,359 | 54 | 1075 | 6 | 19,327 | 100 |
| Distress Type | Severity | Density (sqm or m) | ||||
|---|---|---|---|---|---|---|
| Mean | Std | Min | Max | Sum | ||
| Alligator Cracking | Low | 1311 | 1869 | 0 | 6108 | 20,969 |
| Medium | 1383 | 1383 | 59 | 5983 | 22,121 | |
| High | 552 | 552 | 25 | 2364 | 8835 | |
| Bleeding | Low | 6 | 6 | 0 | 47 | 96 |
| Medium | 5 | 5 | 0 | 27 | 77 | |
| High | 2 | 2 | 0 | 26 | 26 | |
| Block Cracking | Low | 21 | 21 | 0 | 236 | 338 |
| Medium | 157 | 157 | 0 | 1604 | 2507 | |
| High | 34 | 34 | 0 | 325 | 551 | |
| Corrugation | Low | 0 | 0 | 0 | 0 | 0 |
| Medium | 0 | 0 | 0 | 0 | 0 | |
| High | 0 | 0 | 0 | 0 | 0 | |
| Depression | Low | 0 | 0 | 0 | 0 | 0 |
| Medium | 5 | 5 | 0 | 39 | 78 | |
| High | 0 | 0 | 0 | 0 | 0 | |
| Bumps and Sags | Low | 196 | 196 | 0 | 1537 | 3139 |
| Medium | 269 | 269 | 0 | 1517 | 4298 | |
| High | 284 | 284 | 0 | 1863 | 4538 | |
| Lane/Shoulder Drop-off | Low | 0 | 0 | 0 | 0 | 0 |
| Medium | 3 | 3 | 0 | 40 | 40 | |
| High | 0 | 0 | 0 | 0 | 0 | |
| Joint Reflection Cracking | Low | 0 | 0 | 0 | 0 | 0 |
| Medium | 0 | 0 | 0 | 0 | 0 | |
| High | 9 | 9 | 0 | 92 | 149 | |
| Longitudinal & Transverse Cracking | Low | 429 | 429 | 0 | 1671 | 6871 |
| Medium | 1383 | 1383 | 41 | 5348 | 22,126 | |
| High | 258 | 258 | 0 | 792 | 4121 | |
| Edge Cracking | Low | 80 | 80 | 0 | 654 | 1277 |
| Medium | 67 | 67 | 0 | 405 | 1070 | |
| High | 129 | 129 | 0 | 628 | 2064 | |
| Patching & Utility Cut Patch | Low | 122 | 122 | 0 | 1002 | 1945 |
| Medium | 7 | 7 | 0 | 38 | 119 | |
| High | 1 | 1 | 0 | 20 | 20 | |
| Potholes | Low | 0 | 0 | 0 | 0 | 0 |
| Medium | 3 | 3 | 0 | 50 | 50 | |
| High | 1738 | 1738 | 0 | 8240 | 27,800 | |
| Polished Aggregate | Low | 36 | 36 | 0 | 210 | 580 |
| Medium | 81 | 81 | 0 | 400 | 1300 | |
| High | 65 | 65 | 0 | 270 | 1032 | |
| Ravelling | Low | 13 | 13 | 0 | 140 | 200 |
| Medium | 3 | 3 | 0 | 35 | 49 | |
| High | 3837 | 3837 | 0 | 53,066 | 61,391 | |
| Weathering (Surface Wear) | Low | 17,097 | 17,097 | 0 | 147,669 | 273,558 |
| Medium | 2362 | 2362 | 685 | 4765 | 37,798 | |
| High | 912 | 912 | 26 | 3795 | 14,588 | |
| Rutting | Low | 1321 | 1321 | 0 | 5590 | 21,138 |
| Medium | 2723 | 2723 | 0 | 10,619 | 43,560 | |
| High | 16,165 | 16,165 | 0 | 137,726 | 258,641 | |
| Shoving | Low | 555 | 555 | 0 | 4100 | 8887 |
| Medium | 802 | 802 | 0 | 3724 | 12,837 | |
| High | 446 | 446 | 0 | 2772 | 7142 | |
| Railroad Crossing | Low | 0 | 0 | 0 | 0 | 0 |
| Medium | 0 | 0 | 0 | 0 | 0 | |
| High | 0 | 0 | 0 | 0 | 0 | |
| Slippage Cracking | Low | 0 | 0 | 0 | 0 | 0 |
| Medium | 0 | 0 | 0 | 8 | 8 | |
| High | 0 | 0 | 0 | 0 | 0 | |
| Swell | Low | 0 | 0 | 0 | 0 | 0 |
| Medium | 0 | 0 | 0 | 0 | 0 | |
| High | 0 | 0 | 0 | 6 | 6 | |
| Section ID | Start | End | Length (km) | Family # | # of Section | Major Distress | Pavement Age (yr) | PCI_Avg | PCI_Std |
|---|---|---|---|---|---|---|---|---|---|
| NH01 | Gelan | Moqor | 21.7 | 1 | 217 | Weathering | 19.6 | 48.56 | 20.76 |
| NH02 | Shahjoy | Gelan | 38.6 | 1 | 386 | Weathering | 19.6 | 31.01 | 19.33 |
| NH03 | Moqor | Shamali | 34 | 2 | 340 | Weathering | 19.7 | 56.54 | 21.00 |
| NH04 | Shamali | Qarabagh | 36.2 | 2 | 362 | Aligator Crack | 19.9 | 60.35 | 28.23 |
| NH05 | Deh Tut | Kaj Ab | 32.9 | 3 | 329 | Weathering | 15.8 | 82.74 | 16.38 |
| NH06 | Kaj Ab | Farah | 22.6 | 3 | 226 | Weathering | 15.6 | 86.37 | 14.41 |
| NH07 | Washer | Delaram | 33.6 | 4 | 336 | Weathering | 16.6 | 83.42 | 13.56 |
| NH08 | Karwangah | Washer | 33.7 | 4 | 337 | Weathering | 16.8 | 86.73 | 13.51 |
| NH09 | Qarabagh | Sufra | 32.1 | 5 | 321 | Long & Tran Crack | 20.0 | 47.11 | 17.11 |
| NH10 | Sufra | Ghazni | 36.2 | 5 | 362 | Long & Tran Crack | 20.0 | 66.54 | 23.85 |
| NH11 | Gereshk | Shorawak | 33.6 | 6 | 336 | Rutting | 17.1 | 77.41 | 20.24 |
| NH12 | Shorawak | Karwangah | 33.6 | 6 | 336 | Rutting | 17.0 | 85.32 | 16.29 |
| NH13 | Herat | Shakiban | 45.1 | 7 | 451 | Rutting | 7.0 | 90.76 | 8.53 |
| NH14 | Shakiban | Islam Qala | 54.6 | 7 | 546 | Weathering | 6.7 | 94.17 | 7.07 |
| NH15 | Delaram | Golistan | 33.8 | 8 | 338 | Rutting | 16.0 | 84.72 | 14.48 |
| NH16 | Golistan | Deh Tut | 38.5 | 8 | 385 | Raveling | 15.9 | 85.38 | 11.07 |
| Family Number | Pavement Structure | Traffic Load | Weather Condition |
|---|---|---|---|
| 1 | Thick | Low | Harsh |
| 2 | Thick | Low | Mild |
| 3 | Thick | Heavy | Harsh |
| 4 | Thick | Heavy | Mild |
| 5 | Thin | Low | Harsh |
| 6 | Thin | Low | Mild |
| 7 | Thin | Heavy | Harsh |
| 8 | Thin | Heavy | Mild |
| Type | Equation | R2 | RMSE | ES | RL | UO |
|---|---|---|---|---|---|---|
| First-order polynomial | 0.4411 | 14.54 | Yes | No | Yes | |
| Second-order polynomial | 0.6993 | 10.67 | No | No | Yes | |
| Third-order polynomial | 0.7003 | 10.65 | Yes | Yes | No | |
| Fourth-order polynomial | 0.7189 | 10.34 | No | No | Yes | |
| Exponential | 0.3876 | 15.93 | No | No | No | |
| Power | 0.3202 | 16.54 | No | No | No | |
| Logarithmic | 0.3549 | 15.63 | No | No | No |
| Metrics | Actual PCI | Predicted PCI |
|---|---|---|
| Mean | 73.68485 | 74.2665 |
| Variance | 530.5308 | 280.558 |
| Observations | 22 | 22 |
| Pooled variance | 405.5444 | NA |
| Hypothesized mean difference | 0 | NA |
| df | 42 | NA |
| t Stat | −0.09579 | NA |
| P (T ≤ t) two-tail | 0.924139 | NA |
| t Critical two-tail | 2.018082 | NA |
Disclaimer/Publisher’s Note: The statements, opinions and data contained in all publications are solely those of the individual author(s) and contributor(s) and not of MDPI and/or the editor(s). MDPI and/or the editor(s) disclaim responsibility for any injury to people or property resulting from any ideas, methods, instructions or products referred to in the content. |
© 2024 by the authors. Licensee MDPI, Basel, Switzerland. This article is an open access article distributed under the terms and conditions of the Creative Commons Attribution (CC BY) license (https://creativecommons.org/licenses/by/4.0/).
Share and Cite
Wasiq, S.; Golroo, A. Smartphone-Based Cost-Effective Pavement Performance Model Development Using a Machine Learning Technique with Limited Data. Infrastructures 2024, 9, 9. https://doi.org/10.3390/infrastructures9010009
Wasiq S, Golroo A. Smartphone-Based Cost-Effective Pavement Performance Model Development Using a Machine Learning Technique with Limited Data. Infrastructures. 2024; 9(1):9. https://doi.org/10.3390/infrastructures9010009
Chicago/Turabian StyleWasiq, Samiulhaq, and Amir Golroo. 2024. "Smartphone-Based Cost-Effective Pavement Performance Model Development Using a Machine Learning Technique with Limited Data" Infrastructures 9, no. 1: 9. https://doi.org/10.3390/infrastructures9010009
APA StyleWasiq, S., & Golroo, A. (2024). Smartphone-Based Cost-Effective Pavement Performance Model Development Using a Machine Learning Technique with Limited Data. Infrastructures, 9(1), 9. https://doi.org/10.3390/infrastructures9010009