1. Introduction
Numerous techniques for measuring strain and displacement are described in international books and papers. Conventional measurement methodologies comprise, among others, of extensometers and linear variable differential transformers. These measurement technologies need much preparatory work and costly equipment and apparatus.
3D-DIC is a technique that can detect the 3-dimensional position, total displacement, and stretch field of an object without touching it. It is a very effective and flexible tool for measuring the shape, movement, and deformation of different materials and structures. Using CCD (charged-coupled device) cameras and a constant white light source, it takes images of the object at predetermined intervals, first while the undeformed piece is still in the reference state and then continuously while it is deforming. The cameras can measure the deformation accurately and precisely if the three main components are present. The first element is for applying the appropriate pattern, then taking the necessary images, and finally analyzing the saved images using analytical software [
1,
2].
Digital Image Correlation can be applied in research, projects, and studies related to the following fields: (i) engineering, (ii) material science, (iii) physics and astronomy, (iv) computer sciences, (v) Earth and planetary sciences, (vi) chemical engineering, (vii) chemistry, (viii) environmental science, (ix) agricultural and biological sciences, (x) energy, (xi) biochemistry, genetics and molecular biology, (xii) medicine, (xiii) arts and humanities, (xiv) dentistry, (xv) neuroscience, etc. Since this paper explores engineering and material science, the authors would like to describe some examples from these fields in the following paragraphs. In addition, it should be noted that the introduced literature covers only a small part of the possibility of the application of the DIC technique, as more than 80,000 papers have been published on the topic of DIC since 1990 on the Google Scholar database (these data are approx. 17,000 in Scopus and about 12,500 in Web of Science). It is worth mentioning that compared to these values, the traditional ESPI technology (i.e., electronic speckle pattern interferometry) has 10,000, 1700, and 900, respectively).
Referring to the above paragraph, approximately 160 and 12 articles have been published in 2022 and 2023, respectively, indexed in the Scopus database, with titles that contain the word DIC. Furthermore, there are approximately a thousand documents between 2001 and 2023. Engineering, material sciences, physics, and astronomy are the most significant areas. The top-cited papers are the following [
3,
4,
5,
6,
7]. Among the new articles, [
8,
9,
10,
11,
12] documents are worth mentioning. According to the above trends, DIC techniques are and will be significant parts of research and development in the future.
The most relevant literature is described and summarized in the following paragraphs and
Section 1.1 and
Section 1.2.
Ye et al. [
13] configured a reflection-assisted multi-view DIC system that contains a stereo-DIC (SDIC) unit and a reflection-assisted stereo-DIC (RSDIC) unit. They aimed to apply simultaneous measurement for external and internal surface shape and deformation using the DIC technique, focusing on cavity structure. Their laboratory tests proved that the accuracy of shape and thickness measurements could be within 0.03 mm, while the deformation measurement accuracy is within 62 microns. Ye et al. showed that their method is adequate and helpful for the aero-engine casing.
Pupurs et al. [
14] applied DIC measurement methodology for stiffness determination of damaged laminates. The main goal was the solution of the related validation as well as the introduction and representation of the connecting engineering approach. Their study dealt with composite cross-ply laminates with evolving micro-damage during 4-point bending tests. The considered structures were carbon/epoxy and glass/epoxy cross-laminated plywood. They aimed to determine the midplane curvature of these structures. There were composed finite element (FE) models for validating DIC measurements. They concluded that the combination of applied beam theory and the DIC deformation measurement solution was appropriate enough; however, the considered beam theory underestimated a little bit the real deformations.
Suthar et al. [
15] carried out research regarding the post-necking behavior of aluminum alloys and special friction stir weldings (FSW) using these materials. They performed laboratory experiments and considered rectangular tensile specimens during uniaxial tensile tests. The DIC technique supplemented the measurements with two cameras that monitored the deformation of the specimens. The applied method is similar to GOM ARAMIS, also utilized in the current study. For validation, the so-called Hill’s normal anisotropic yield criterion was considered; it helped determine post-necking behavior. In addition, the shown experimental method successfully forecasts the area in the FSW joint at the necking section, where the existing inhomogeneity is challenging to capture using an analytical approximation.
Bhuiyan et al. [
16] presented solutions for using DIC in learning traditional mechanics. This paper demonstrates how a simple, quickly transportable experimental setup, the SB-DIC (stress-block coupled DIC), demonstrates how deformation fields on a surface change under different external loads and how this experiment helps students improve their learning process. It can also be used in a real but interactive classroom, too. The authors investigated how this procedure and methodology help students better understand classical mechanics at school and at home. After conducting a qualitative and quantitative data analysis, Bhuiyan et al. found that SB-DIC enhances students’ previous knowledge.
Zhou et al. [
17] examined sandstone using DIC. The authors’ goal was to determine red sandstone’s failure and mechanical behaviors if it has a flaw (mainly pre-existing) during compressive-shear loading. The specimens were square-shaped, and the dimensions were 100 × 100 × 30 mm (width × height × thickness, respectively). The single flaw inside them was approximately 20–40 mm long and 1–3 mm wide, mainly located diagonally, but there were also at 15, 30, and 60-degree directions. Zhou et al. analyzed the die angle on failure behaviors considering the pre-flaw characteristics. The results can be formed based on the laboratory tests supplemented by DIC measurements. The authors took into consideration the novel crack’s dominant parameter during the evaluation process of the results.
Wang et al. [
11] investigated thin films and their out-of-plane displacements with the application of the DIC method. The considered DIC technique was a special mechanical constrained-based 3D-DIC. To be able to determine the films’ displacement, a mesh of 8-node rectangular hemispheres (i.e., shell elements) was used. The main principle was to ensure spatial continuity. In addition, a blistering test was carried out, and the results demonstrate that the 3DMC-DIC (three-dimensional subset-based digital image correlation) method can achieve a spatially continuous and highly accurate thin film planar displacement field at the sample edge.
Li et al. [
18] dealt with the mechanical behavior of anchored rock with an infilled joint under uniaxial loading. The applied methods were acoustic emission and DIC. The connecting tests were laboratory experiments, The considered rock was sandstone, and the filling material was cement. The cement slurry specimens were cured for seven days considering constant humidity and temperature. First, Brazilian tests were conducted to determine the materials’ mechanical characteristics, i.e., tensile strength values. After that, additional specimens were tested with bolts (type 304 stainless steel, diameter of 3.5 mm, an elastic modulus of 198 GPa, a Poisson’s ratio of 0.3, and a tensile yield strength of 450 MPa). Epoxy resin was applied as the bonding material between the bolt and rock. This bolt simulated the so-called anchor during the laboratory experiments, i.e., the direct shear tests. Specimens were categorized into three groups: crack evolution of specimens with an angle of 30°, 60°, and 90°. All of the measurements were evaluated using the video recording of DIC measurements.
Among the above-introduced examples, the DIC optical measurement technology and assessment method can be applied in the future, e.g., in engineering structures [
2,
19,
20], railroads [
21,
22,
23,
24,
25], road construction [
26,
27,
28,
29], aircraft [
30,
31], “nautics” (or in other words, navigation) [
32], astronautics [
33,
34], and so on.
In this research, the authors applied an approach regarding railway and automotive vehicles and their car body sheets.
1.1. Overview of DIC Technology
The DIC technique, therefore, offers the possibility of mechanical, qualitative, and quantitative testing of materials under load conditions. The images taken by the CCD camera are counted as a single load step. The standard cameras use a photosensitive cell with 1024 × 1280 pixels or more. Each pixel stores one of the grayscale values corresponding to the intensity of the reflected light. The method runs a 2 × 2 window through the binary image, with the frames weighted by powers of 2, representing 1, 2, 4, and 8 values, respectively. It identifies a patch with a well-defined unique feature and then runs it through the entire sequence of deformation images to obtain the local deformation of the patches. These deformations are then fitted to the mesh, which can register the deformation properties of each element.
The DIC technique has long been known as “speckle correlation”. However, this name is not “random”, as the system can only perform the necessary measurements if it has a good view of the object, which is made possible by the pattern applied to the surface. To be able to obtain a good pattern, it is essential to take into account four factors: the size of the speckles, contrast, spatial distribution, and sharpness of the edges of the speckles [
35].
The size of the spots is one of the critical points, as the aim is usually to keep them as small as possible, but they may eventually become so small that the system can no longer detect them. Research shows that the optimum size is at least three pixels, but this value does not tell someone how many millimeters it should be physically. If the spots are smaller than three pixels, they cannot be detected. Therefore, not only the size of the patches is essential, but also the size of the subset. It is also a critical point in measurements, as a subset must contain at least three spots [
36,
37].
Regarding the density of spots, it is ideal to have the same size of the white and black area. With printing, this is very easy to do, as everything can be adjusted manually. However, with spray paint, it is not so easy; it is easy to overdo it, as the mist can quickly spread over the object, resulting in poor contrast [
36].
The patches’ spatial distribution is vital in the horizontal and vertical directions and plays a decisive role in the analysis from all orientation directions. Having patches in all directions is essential, which is why random sampling is preferable. Care should be taken to ensure that, where possible, the orientation is also random [
38].
Overall, based on the above, it is imperative that the pattern on the surface has high contrast, that the greyscale intensity varies, and that it is random, not periodic, and not repetitive. A spot should be somewhere between three and five pixels. A good pattern should adhere tightly to the surface and deform with the surface of the specimen [
1].
Different methods of speckle patterning are known in the literature. One of the best-known methods is spraying white or black paint using a gas-powered bottle or airbrush. With this method, many variables must be considered, such as the nozzle diameter, the substrate, the distance between the nozzle and the piece, the pressure, and even the viscosity of the solution. These factors all affect the spots’ size, distribution, and dispersion. In most cases, commercially available white or black spray paints are applied, whose application is recommended at room temperature by the manufacturer [
39,
40].
1.2. Formability Tests Using DIC Measurement
There are various tests for the formability of metal sheets. One of the simplest and most frequently used is Erichsen’s tensile test [
41], along with the more complex Nakajima and Marciniak tests [
42,
43]. The Erichsen test can be used to test formability and extensibility under constant load. The Nakajima and Marciniak tests are usually applied to obtain a forming limit diagram (FLC) using a 100 mm hemispherical forming punch using specimens with different geometries. One of the most well-known plate formability methods is the Erichsen test. The test can be performed for plates thinner than 3 mm. The measurement lasts until the crack appears on the surface of the test piece. The displacement of the punch measured at the time of cracking will give the result of the Erichsen test, the
IE number [
44,
45].
The total displacement and strain field of sheet metal specimens subjected to the Erichsen test can be determined using multi-camera DIC equipment. These DIC devices track the deformation of the specimen during the stretching-drawing process. The only problem with 2D-DIC systems is that the camera must be well-aligned for accurate measurement; otherwise, it cannot handle out-of-focus deformations during the forming process. The improved stereo DIC tracks 3D deformation; the camera positioning is flexible [
46].
In the research on this topic, it was suggested that multi-camera DIC tools employ a so-called master camera that should be selected from all the cameras, which takes the initial captured camera image as a reference, and the other images are all corrected and compared with this reference image [
47].
Erichsen tests have been performed to determine the resistance of coatings to failure [
48]. The process and forming involve using a hemispherical punch to test the fracture (destruction) of the coating layer. Similar tests in industrial applications are primarily evaluated for quality control purposes. The result is a yes/no rating based on whether the coating meets the deformation specifications. Color coatings are mainly applied for external aesthetic purposes, possibly for protection. When evaluating coatings, it is essential to note that resistance to crack is a fundamental requirement, but it should be remembered that good adhesion to the substrate is also of paramount importance. The authors of the mentioned article use a finite element model (FEM) to demonstrate the surface deformations during the implementation of the Erichsen test. The article compares the predicted deformations and the deformations experimentally determined by DIC. The deformation characteristics were evaluated for each result, and the expected location of the coating failure was subsequently predicted. The experiment was performed using GOM ARAMIS, and the results were analyzed using GOM Correlate Professional software. In the experiment conducted by Sorce et al. [
48], the steel plate failed before coating in all of the Erichsen cupping tests, indicating that the ductility of the coating was more adequate than the steels [
48].
It is clear from the literature reviewed that the quality and accuracy of the DIC test result depend on the quality of the painted speckle pattern and the optimum paint adhesion to the test specimen. This research focuses on testing primer paints for DIC testing on aluminum sheet materials. The surface preparation techniques are also crucial in the paint qualification since proper paint adhesion can only be achieved on a well-prepared surface. Ease of application and accessibility were the main criteria for selecting paints and preparation (cleaning) materials. The aim of the tests is to determine the methods to prepare aluminum sheets used in the automotive industry and the production of railway carriages or motor train bodies for DIC tests. The results will allow someone to safely carry out DIC test preparation operations for laboratory tests and DIC measurements under real conditions of use. The research is also relevant because there is very little literature on the control of paint adhesion, which is of paramount importance since the results of DIC testing can only be as good as the ability to achieve a properly adhesive basecoat.
1.3. The Novelty of the Current Study and the Structure of the Paper
Based on the literature review shown in
Section 1.1 and
Section 1.2, the authors have decided to investigate the suitability and applicability of a combination of commercially available cleaning agents and paint sprays on five different types of aluminum plates for DIC-based optical deformation measurements combined with Erichsen cupping tests. The authors applied DIC measurements. The instrument was a GOM ARAMIS 5M system. The qualification of the paintings started with a series of measurements according to international standards. These were the so-called pre-filters for the Erichsen cupping test.
The structure of the paper is the following: in
Section 2, the applied materials and methods are detailed.
Section 3 describes the results, and
Section 4 contains the derived conclusions.
3. Results and Discussion
For each test (see
Section 2.2), the painting/cleaning techniques are highlighted where they have scored positively or negatively.
3.1. Wet Paint Film Thickness Measurement
Table 4 summarizes the related measurements’ results, demonstrating that all paints coat the base plate in almost the same layer. It should be mentioned that only one paint (P11) resulted in relevant variations. The paint layer can crack during drying in the case the paint’s thickness is too big, which means danger. When the results (
Table 4) are evaluated and analyzed, it can be concluded that there are no significant and considerable differences between the different cleaning methods and raw materials used.
3.2. Touch Test
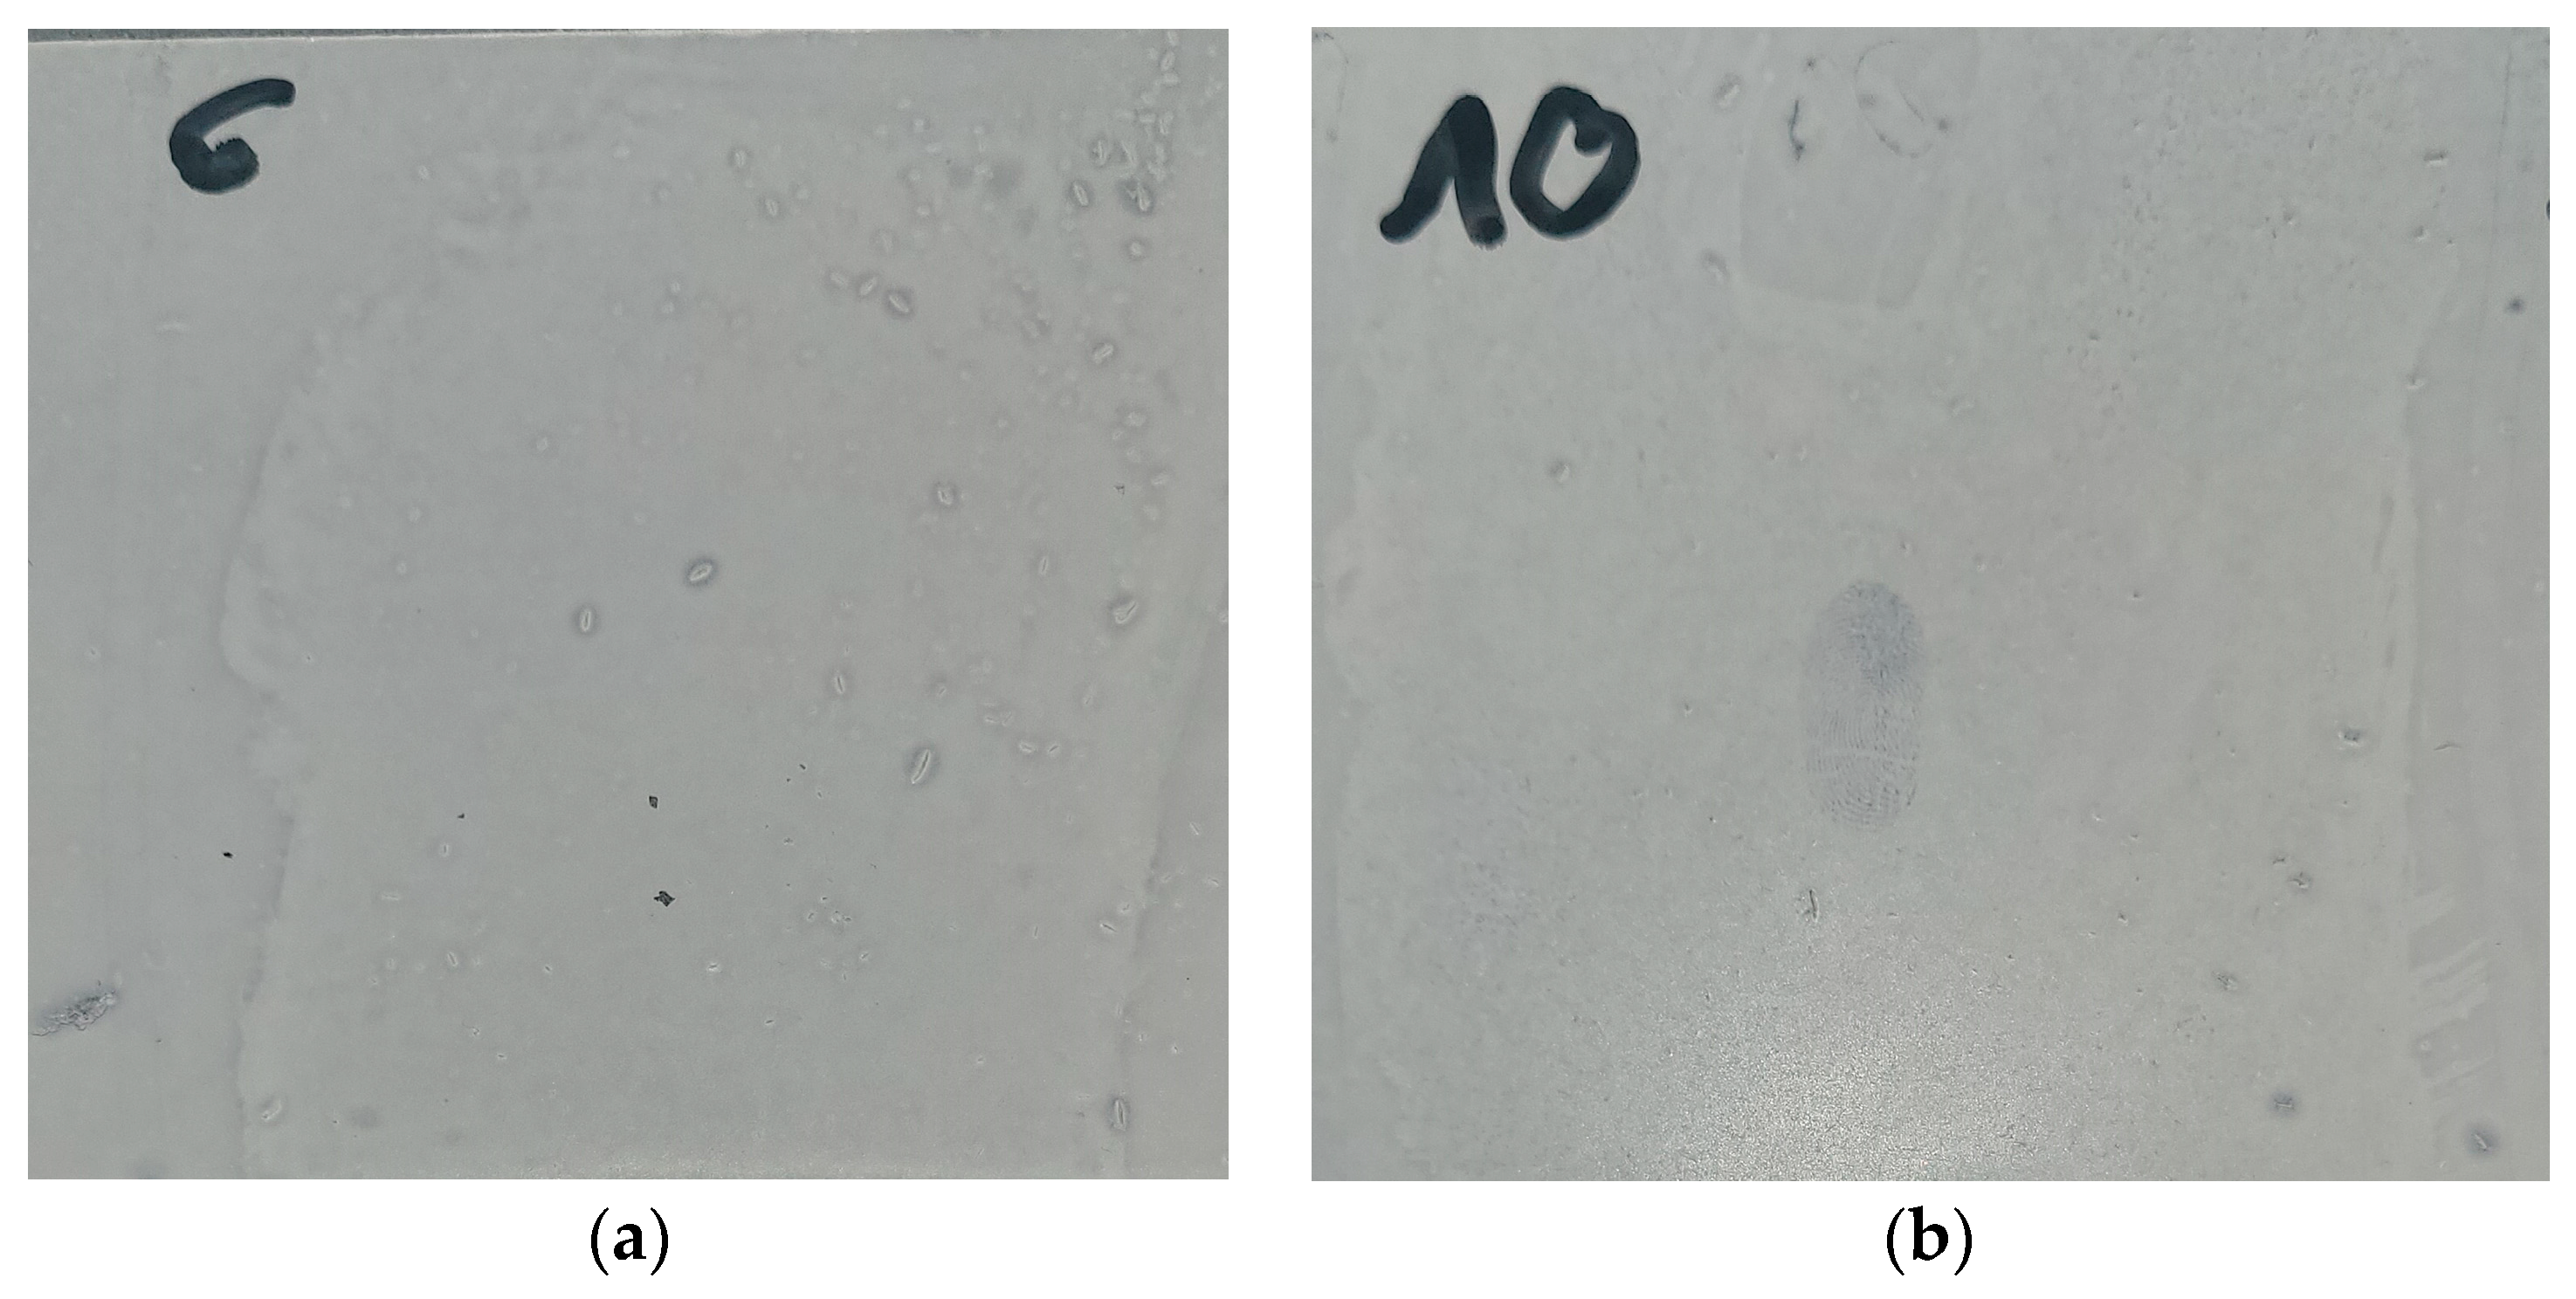
Since the dyes resulted in a bubbly, blotchy surface on some materials, it was necessary to exclude two cleaning agents (SC6, SC10). These cleaning procedures were not used in further tests because using such dyes is inappropriate and not allowed for the DIC measurement procedure.
Table 5 presents the results of the touch test.
The surface defects are shown in
Figure 1. SC6 left bubbles and SC10 left spots on the test surfaces. The results summarized in
Table 5 show that there were no significant differences between the different cleaning methods and the raw materials used. Therefore, these results are not shown in
Table 5.
3.3. Print-Free Test
The timing of the touch tests marked the start of the print-free tests. After this time, the measurement windows followed each other every 15 min. Drying times up to 1000 g are shown in
Table 6.
The results were assessed without excluding either paints or other cleaning processes. No differences could be detected between the different cleaning methods and raw materials used; therefore, these data are not included in
Table 6.
3.4. Cross-Cut Test
Table 7 shows the results of the cross-cut test. From the results, many deductions can be derived. All the Al1–Al5 samples behaved similarly as there was no difference in the measurement results for the different raw materials. From this, it can be drawn that neither the substrate nor the plate thickness has any relevant role in the paint adhesion, only the surface quality. Different results than expected were also obtained concerning test times. Even after 0 (immediate measurement after print-free drying time), 6, 12, or 24 h, there were no difference in results. The “OK” samples tested well both at the beginning and at the end of the measurements. The “NOK” samples did not perform well in some measurement phases and were disqualified from further testing. Stains P1, P2, P6, P7, P10, and P11 failed and had to be disqualified from further testing. Cleaners SC3, SC7, and SC11 were disqualified because they did not ensure good adhesion to the plate, even for paints that achieved good ratings.
Based on the analysis of the measurement results obtained, it can also be concluded that proper adhesion can be achieved within 24 h after the print-free test, independently of the quality of the plate, utilizing a reasonable staining/cleaning procedure. For this reason, in order to verify formability, the following sequential tests were performed only and exclusively for the remaining combinations.
3.5. Bending Test
According to the bending test results, the first conclusion was that P5 and P8 paints were poorly milky when all the other residual cleaning agents were used in the tests (see
Table 8). The bending test, combined with the cross-cut test, provided the result that the paint did not follow the deformation of the plate along the cut of the paint because it was separated from the plate. This phenomenon and result are illustrated by the photos of the tested samples under the microscope in
Figure 2.
The photos (see
Figure 2) show the paint peeling off, while
Figure 3 shows the corresponding paint layers. It can be seen that good contact (adhesion) was achieved between the paint and the base aluminum plate (see
Figure 3).
3.6. Erichsen Test Results by Visual Inspection
The Erichsen test was first used to detect the appearance of staining. It was determined that the measurements accurately simulated the deformations expected during plate tests or plate forming processes, and thus appropriate deductions could be drawn about the paint-plate relationships.
Table 9 shows the results and clearly shows that the remaining three paints tested well with all seven cleaning agents (SC0, SC1, SC2, SC4, SC5, SC8, SC9).
3.7. Results of DIC Tests, Comparison of Thickness Reductions
The Erichsen tests were carried out with the DIC measurement technique considering the remaining staining/cleaning procedures. In the first round of measurements, the paints were visually qualified; see
Section 2 in [
49]. Thickness reduction (–eps3) values were determined for each specimen during DIC measurements, which could be performed after the rating.
All specimen types achieved a satisfactory (1) rating within 24 h using three painting (P3, P4, and P9) and seven cleaning procedures (SC0, SC1, SC2, SC4, SC5, SC8, SC9)—taking into account the results of the visual inspection. No differences in ratings were observed, and the analysis continued with the DIC assessment.
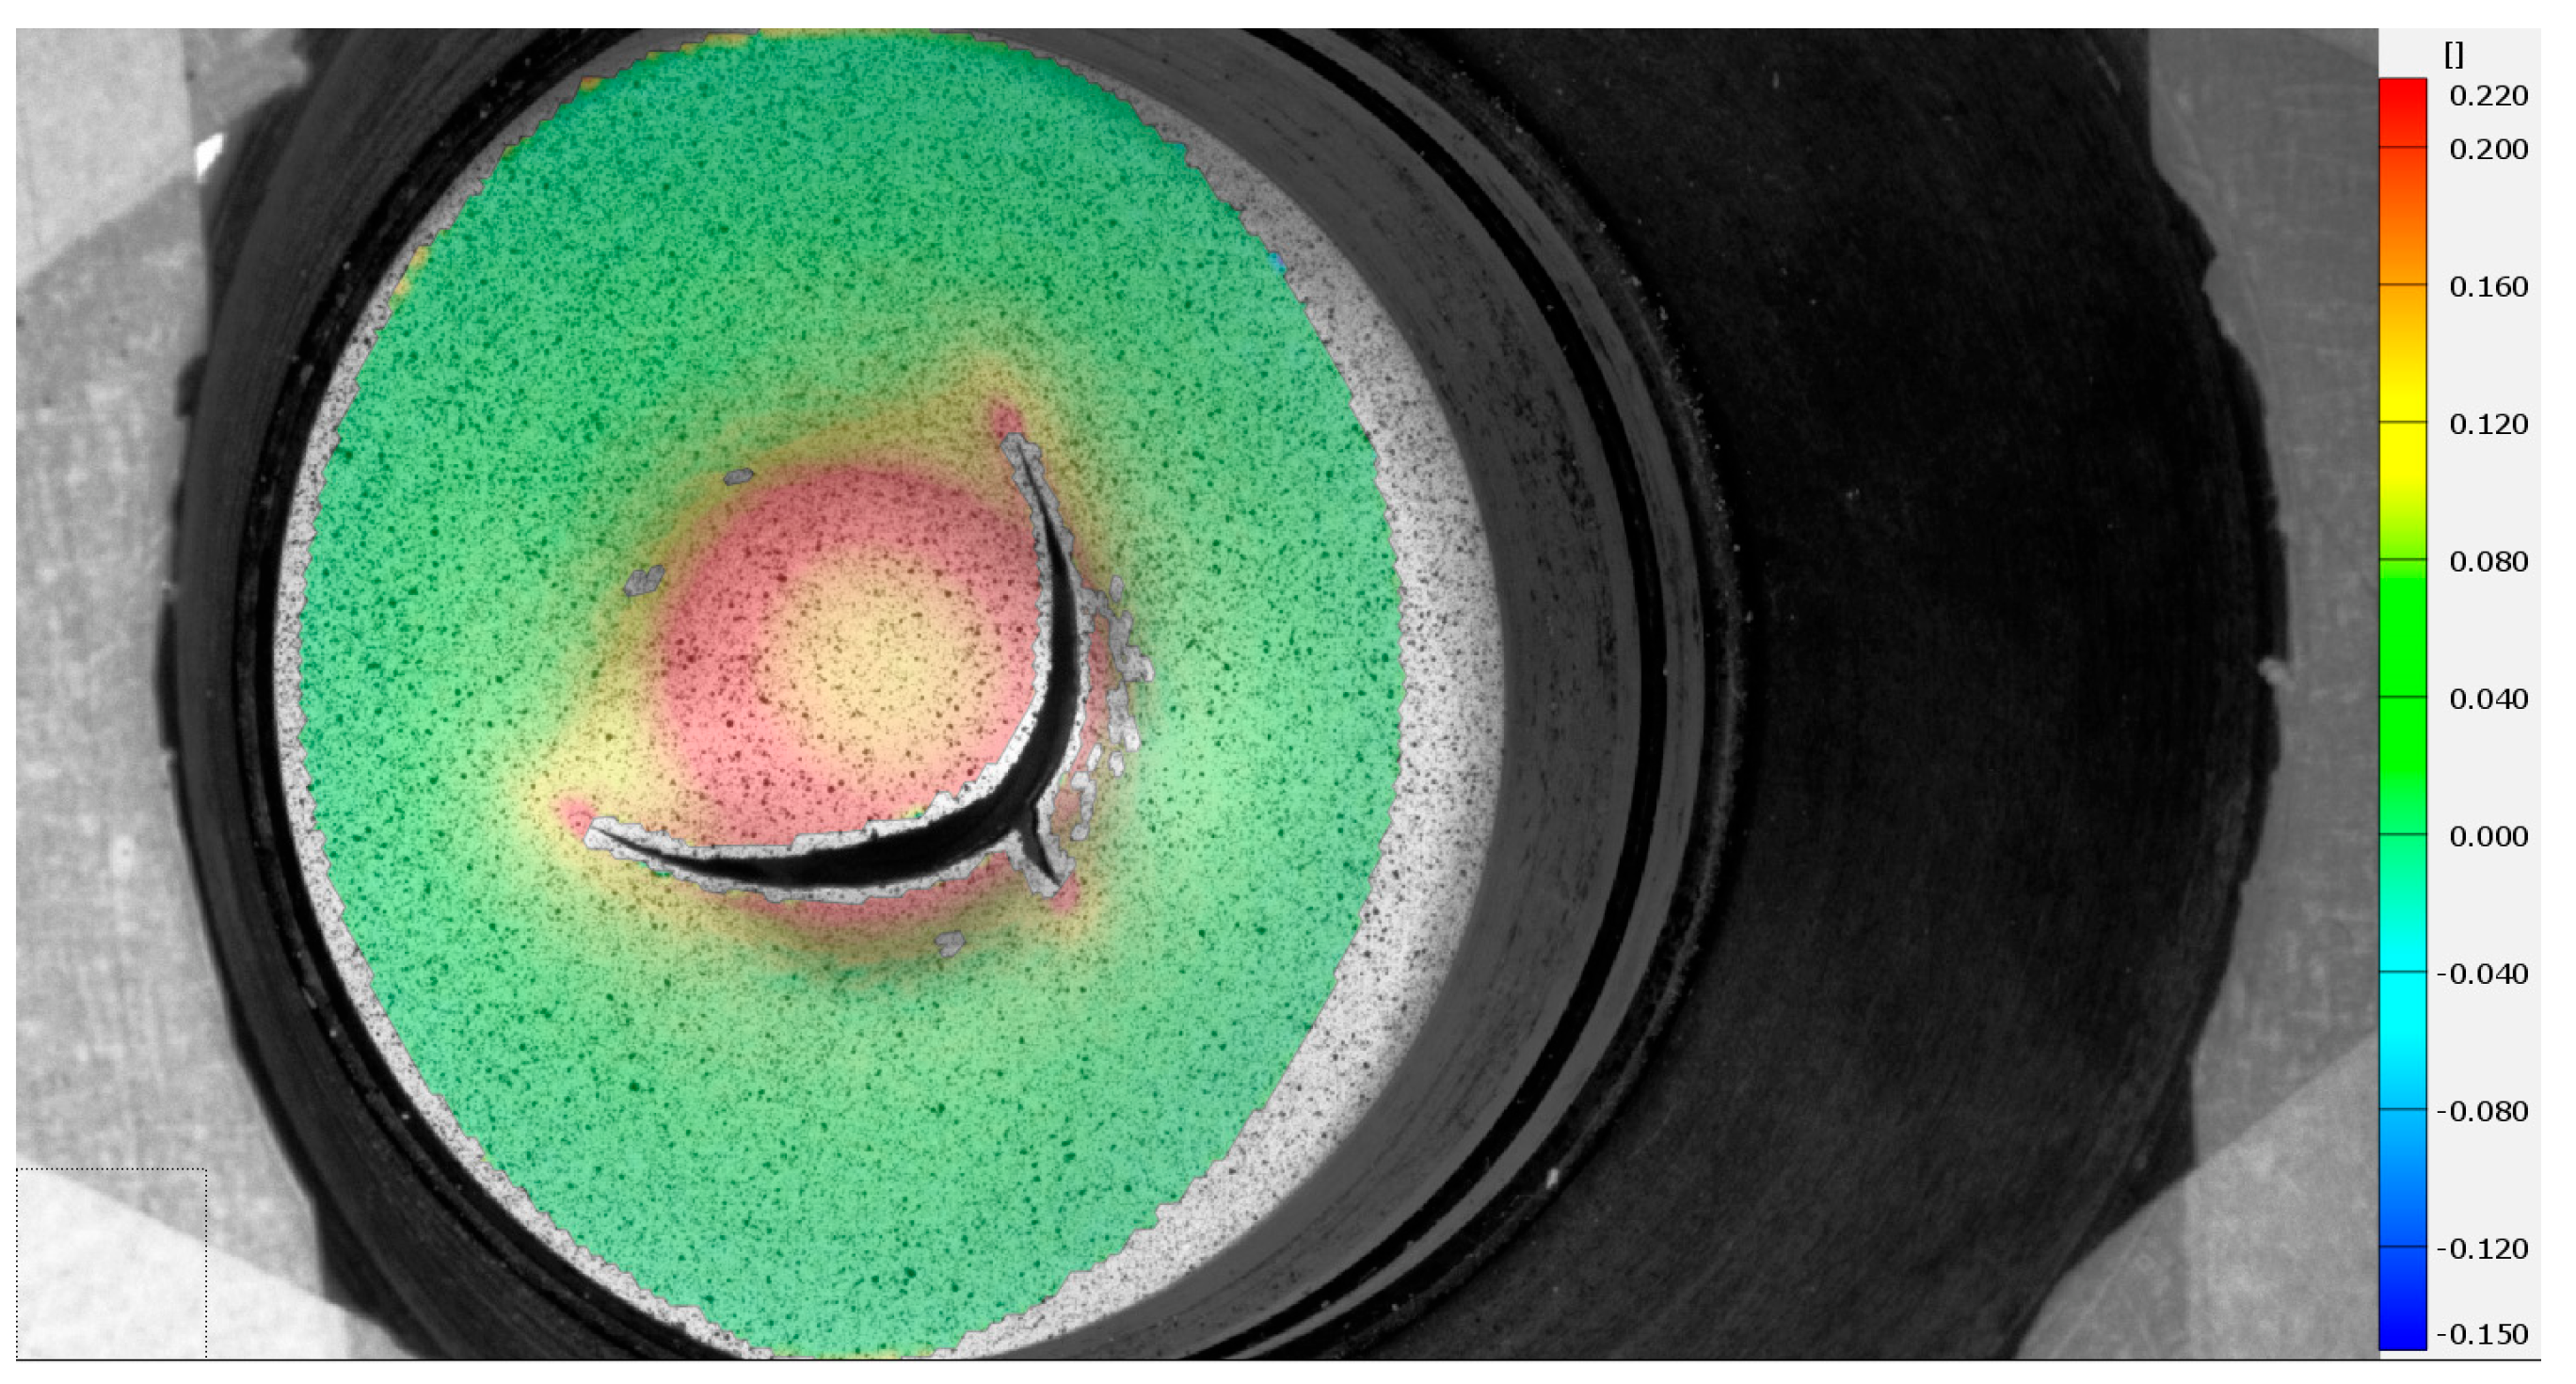
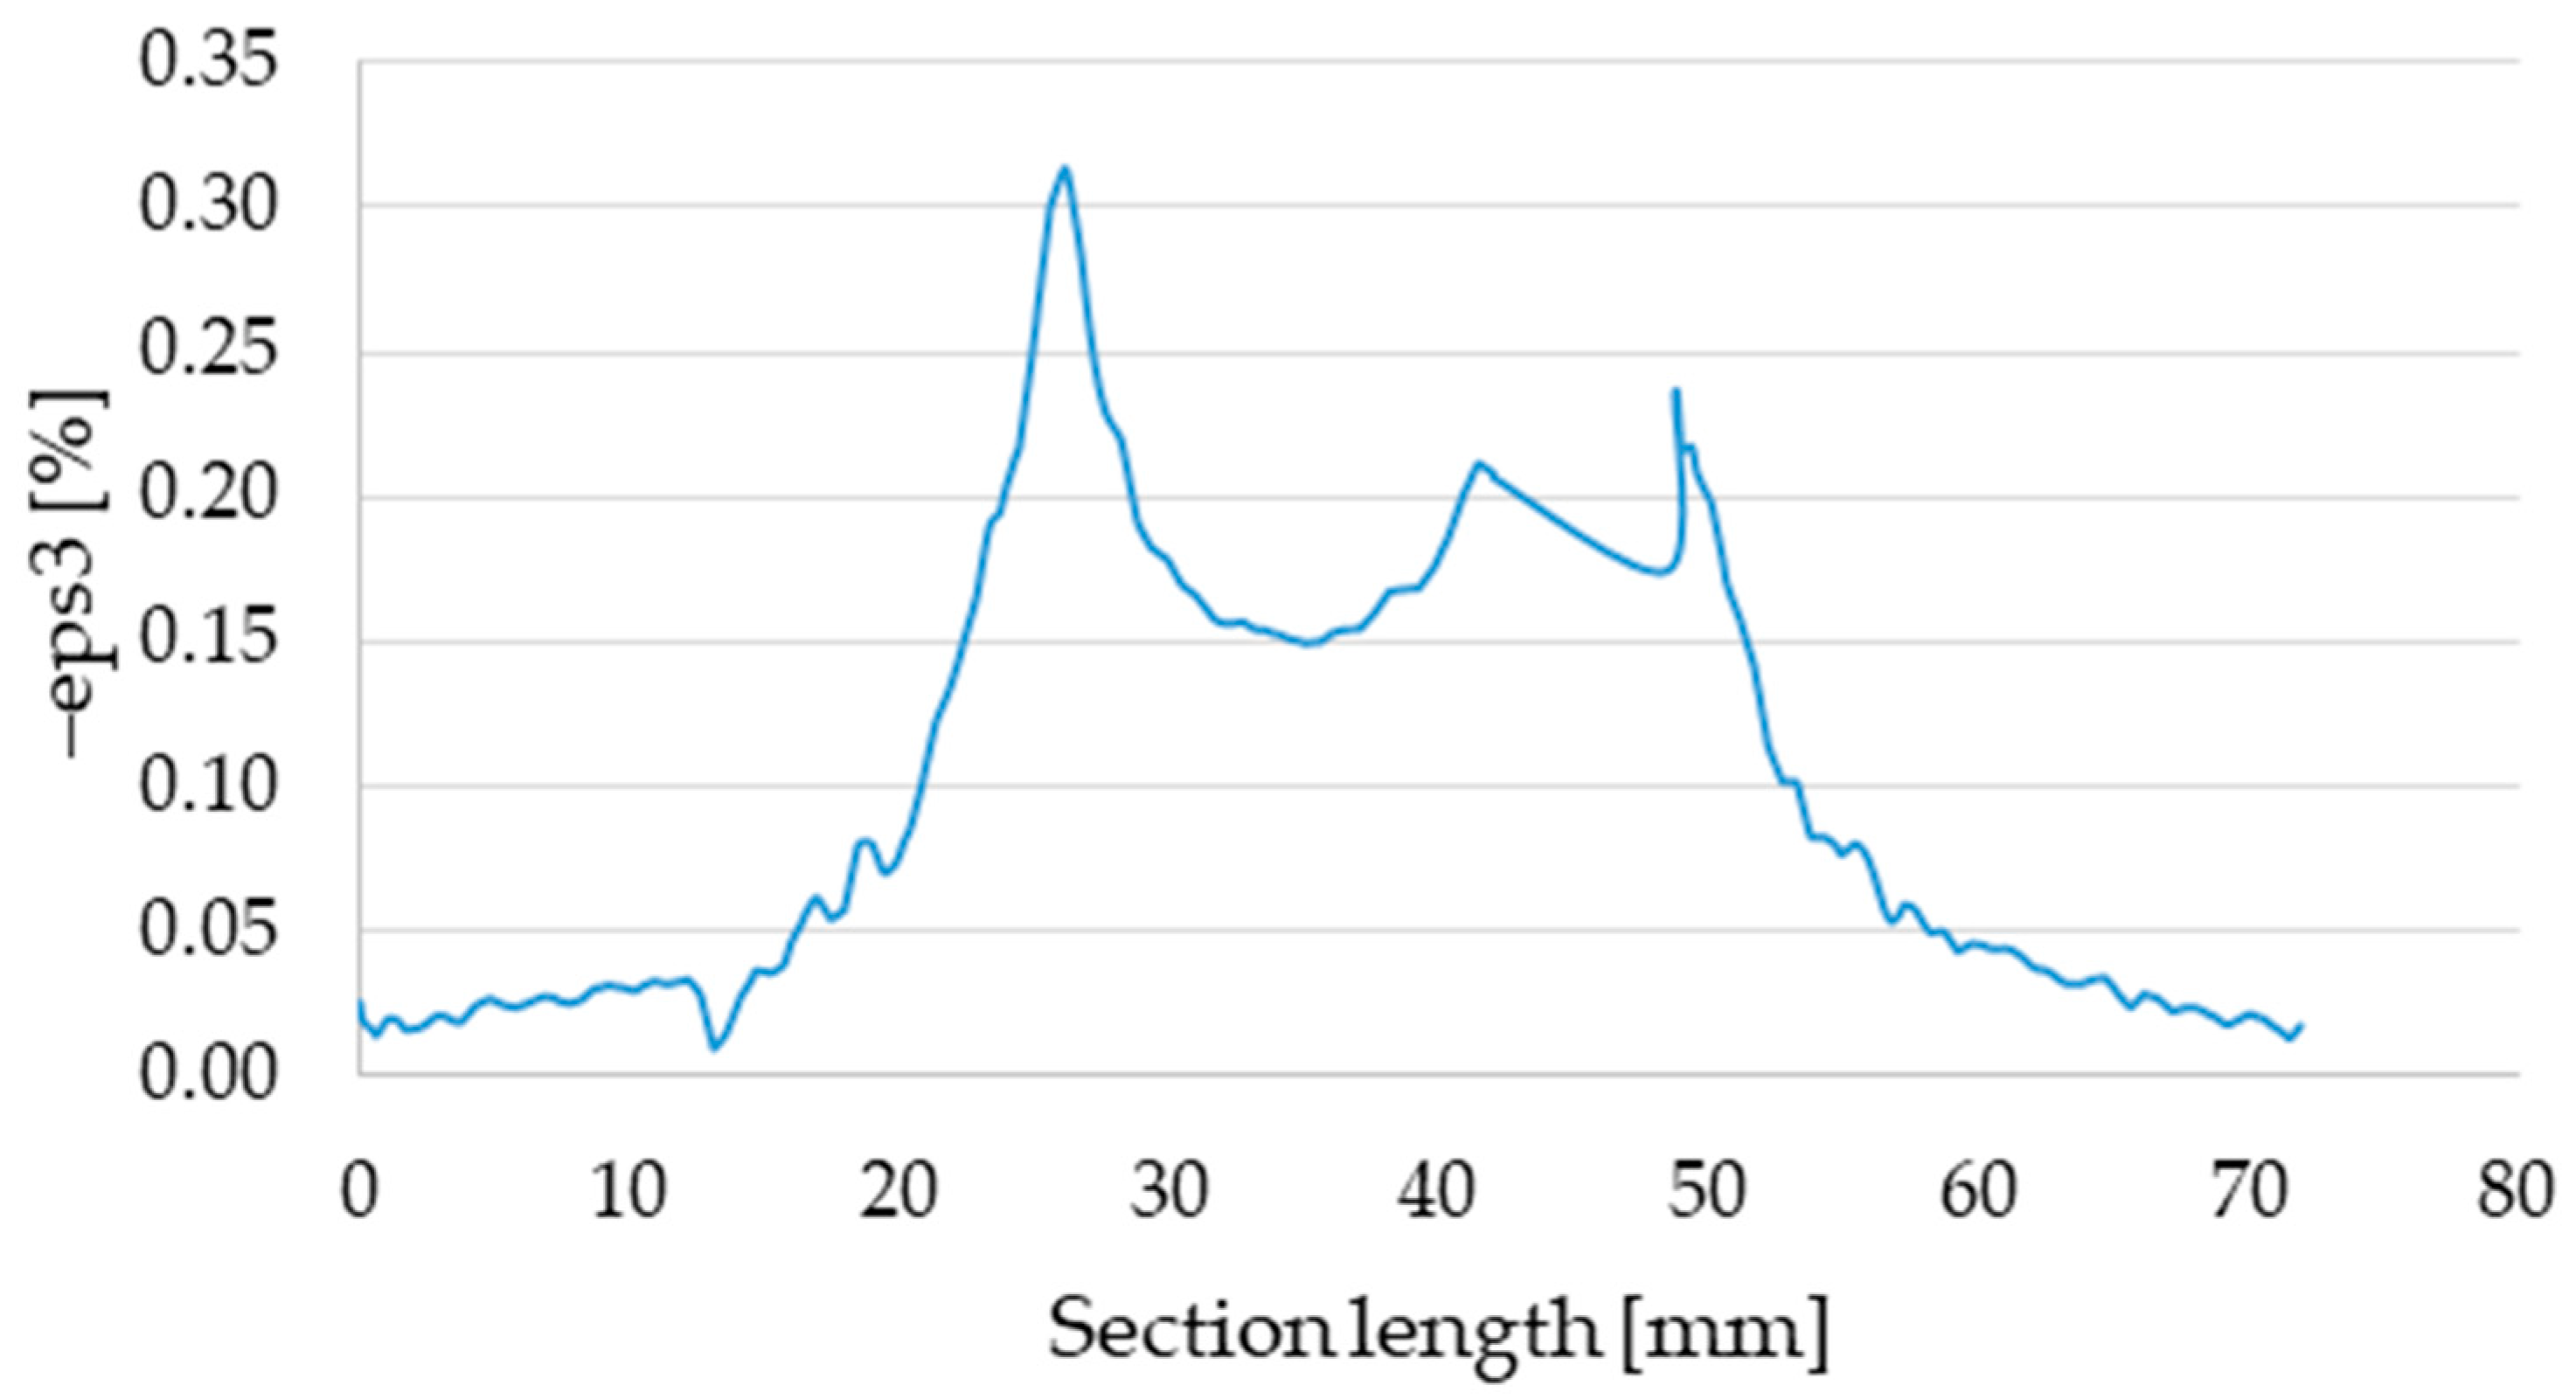
Figure 4 and
Figure 5 show the GOM ARAMIS assessment pictures of the aluminum specimen plate and the thickness reduction results along the length section of the sample. For each painting and cleaning procedure, this evaluation method was performed on each specimen.
To study the performance of the coatings (paintings) further, the thickness reduction values at the peak and their average were collected for each sample.
Table 10 provides a summary of these results.
During the DIC measurements, the GOM ARAMIS system determines the engineering elongations; the software updates the –eps3 values when calculating the thickness reduction. Therefore, to compare the thickness, it is necessary to establish a connection between the parameters of the engineering and logarithmic elongations. This relationship is described in the following formulas (Equations (1)–(3)).
where ε is the engineering elongation (%),
is the elongated length of the specimen (mm),
is the undeformed length of the specimen (mm), and
φ is the logarithm elongation (%).
After the calculation of the plate thickness changes, the relationships in Equations (4) and (5) can be achieved, from which the accurate thickness value can be determined.
where
φs is the logarithm elongation in thickness direction (%),
s0 is the initial plate thickness (mm),
s1 is the thinned plate thickness (mm), and
e is the Euler-number.
Table 11 compares the results obtained by using the relationship in Equation (5) with the calculated results. The values of thickness reduction at the peak taken from ARAMIS and the results of the hourly measurements are represented in
Table 11. The painting/cleaning process can be assessed because since the results are close, the tested process is suitable for DIC technology.
It can be stated, based on the above results, that it is clear that the deviations are all within the measurement error of the dial gauge (0.02 mm), so the DIC measurements give good results, i.e., the primer painting methods convey the shape change well.
The research deducted that thicker Al2 plates with a surface quality corresponding to a polished surface quality (Ra 0.005-0.05, ISO 2768 [
57]) performed worse in this test (see
Table 12).
The results in the table above show more significant differences of over 15%. However, the other samples, which typically have a matt and “rougher” surface, show similar variations to
Table 10. Therefore, it can be concluded that for excellent, almost polished surface aluminum, DIC measurement results can show a variation of 10–15%, and, therefore, surface roughening may be justified during surface preparation if the research task allows.
3.8. Durability Tests
A longer-term usability test was conducted to complement the results of the DIC studies. The Al2 sheet material was selected for testing with P3, P4, and P9 paints because these paints have tested best in previous measurements. For the selection of the cleaning agents, the three most readily available types (SC1, SC4, SC9), which are also used in industry, were selected from the seven types remaining in the “tank”. The Erichsen tests were repeated after a 24-h, one week, and two weeks waiting period. The study aimed to define the time window during which specimens can still be utilized. The test can simulate an extended shutdown of a measurement laboratory, where it is crucial to know whether or not a limited number of samples can still be used for DIC measurements.
Table 13 shows the averaged thickness measurement results, including the dial gauge and the ARAMIS measurements. It can be clearly seen that after one week, the paints were still well-behaved (also on the other Al samples), but after two weeks, the P4 and P9 paints were already destroyed, regardless of the surface cleaning procedure. Although the P3 sample did not peel and the measurement went all the way through, cracking had already appeared.
Table 14 shows the rating results calculated from the measurement results, where deviations below 10% are adequate, but those above this can no longer be used safely to analyze plate formability processes. The 10% threshold is based on previous pre-experiments, and a 10% deviation is, in fact, a 10% measurement error, which is a significant and unacceptable deviation.
Figure 6 shows the Al2 sample painted with P9 paint and prepared with SC4 cleaner. The pick-up and flaking of the dye are clearly visible, which makes the DIC measurement practically unreadable.
The results show that the P3 paint can be used for up to two weeks with the SC1, SC4, and SC9 surface cleaning agents, but the same is not true for the other paints.
The following conclusions can be drawn based on the studies and results presented. Seven out of twelve surface cleaning agents showed promising results on all five materials, but it can be concluded that their effect is not indifferent. SC6 and SC10 produced a painted surface with all stains and on all materials, which cannot be used for DIC tests because if the base color is not homogeneous, it will cause a measurement error when evaluating the speckle pattern. The results of the grid cut tests are significant as they will show whether the paint/cleaner combinations can provide the correct adhesion to the surface of the plate samples.
The P1, P2, P6, P7, P10, and P11 paints did not produce satisfactory results with any of the cleaners within 24 h. Also, SC3, SC7, and SC11 were excluded here. These detergents failed to produce good adhesion with any paints and bases. The results at this point support the hypothesis that it is not indifferent as to which paint is used on aluminum materials and that attention should be paid to the choice of surface cleaning method.
The bending test combined with scratching also gave essential results. The procedure can well characterize hidden paint peeling. In the pre-tests, it was repeatedly found that the bent test specimen did not crack the paint, showing no sign of poor adhesion. However, in combination with the scratch, it is possible to see whether the paints adhere properly along the scratch.
These results are essential because, for example, in the tensile test, it is vital to accurately measure the history of deformation even when cracking, which can only be achieved with a properly adherent basecoat. In the test, P5 and P8 were excluded as they separated from the surface of all five of the seven remaining cleaners. The Erichsen tests had a dual role in the research, serving both a validation and a qualification function. In the first phase of the Erichsen tests, visual inspection was used to verify that the paints P3, P4, and P9 passed on all materials after pre-treatment with the remaining (SC0, SC1, SC2, SC4, SC5, SC8, SC9) cleaning agents.
From the ARAMIS evaluations of the Erichsen tests, the thickness reductions at the top of the specimens were collected and compared with the results of the gauge thickness measurements. Interesting conclusions can be drawn from the results. With the typically matte finish materials (Al1, Al3, Al4, Al5), the remaining paint/finish combinations performed well with defects below 10%. However, the Al2 sample showed defects above 15%, with some specimens showing defects above 20–25%. The surface of the Al2 sample is much shinier and has an outstanding surface quality compared to the other materials.
For surface qualities with an Ra of 0.005–0.05, the adhesion of the tested paints no longer gives a stable result for a DIC test, so it may be worthwhile to roughen the surface. This conclusion is supported by the durability tests’ results, where Al2 samples also performed worse. A further result of the durability test is that the P3 and the P9 paints can still be applied one week after surface was prepared, and in fact, the P3 paint can still be applied at two weeks. This experience may be helpful for longer-term DIC tests.
4. Conclusions
First of all, the authors must note that the manufacturers do not give an exact, usable chemical compositions for the cleaning agents or the paints; they only list the ingredients. Therefore, providing results and conclusions that can be supported scientifically and stand up to interpretation is not easy. It was the reason why the authors did not address this in the recording and formulation of the conclusions.
Secondly, the authors have more than 10 years’ experience in recording DIC measurements, enabling us to guarantee adequate and appropriate preparation, and ensuring identical speckle patterns for all specimens.
The experiments and their results presented in this paper have demonstrated that different surface cleaning agents and spray formulations of white/clear paints behave differently on aluminum sheet materials. It has been demonstrated that the present part of cleaning agents or paints cannot be used in the preparatory operations of DIC tests. It has been shown that paints that appear to be good by visual inspection do not adhere properly to the material and separate from the surface when deformed, so the transmission of deformations is not achieved, giving incorrect results. It was found that the P3, P4, and P9 paints performed well on all samples in conjunction with the cleaning agents SC0, SC1, SC2, SC4, SC5, SC8, and SC9. Considering also the results of the long-term endurance tests, P3 performed the best, which is significant for tests of long duration or even several weeks.
With regard to future research opportunities, the authors suggest and anticipate obtaining larger quantities of aluminum sheets, cleaners, and spray paints from the same batch and storing them in different but strictly controlled environments so that they are exposed to different temperatures, humidity, UV radiation, etc.; this creates the opportunity to analyze to what extent and how these environmental factors affect the behavior of the paints when they are applied to the sheets. Such a study could combine the series of tests described previously here with the Erichsen cupping test and DIC measurements. Furthermore, it could be exciting to expose pre-painted plates to different effects. However, these would require a significant number of combinations and would also present a major challenge to researchers in terms of cost and measurement time.


 ,
, 


