Article

Numerical Study of the Influence of the Interaction Distance, the Polymeric Strips Pre-Tensioning, and the Soil–Polymeric Interaction on the Performance of Back-to-Back Reinforced Soil Walls

by
Abdelaziz Brouthen
1,*,
Mohamed Nabil Houhou
1 and
Ivan Puig Damians
2,3,4
1
MN2I2S Laboratory, Civil Engineering and Hydraulic Department, Biskra University, BP 145, Biskra 07000, Algeria
2
Department of Civil and Environmental Engineering (DECA), School of Civil Engineering, Universitat Politècnica de Catalunya-BarcelonaTech (UPC), Jordi Girona 1-3, 08034 Barcelona, Spain
3
International Centre for Numerical Methods in Engineering (CIMNE), UPC Campus Nord, Gran Capità s/n, 08034 Barcelona, Spain
4
VSL Construction Systems, Av. Granvia de l’Hospitalet 179, 08908 Hospitalet de Llobregat, Spain
*
Author to whom correspondence should be addressed.
Infrastructures 2022, 7(2), 22; https://doi.org/10.3390/infrastructures7020022
Submission received: 18 December 2021 / Revised: 9 February 2022 / Accepted: 10 February 2022 / Published: 16 February 2022

Abstract

:
This study describes the results of a series of 2D finite element method (FEM) numerical models of 6 m high back-to-back reinforced soil walls using the geotechnical software PLAXIS. These structures are used to support embankments, especially for bridge abutment approaches. The quantitative influence of problem geometry, strip pre-tensioning, strip type, and surcharging on horizontal displacements, development of soil shear and plastic zones, lateral earth pressure, and reinforcement loads is presented. The numerical results demonstrate how this type of reinforced soil walls perform jointly at a certain distance of interaction between the two opposite walls. The walls of the two opposing sides clearly interact with each other when they are close enough and with an overlapping reinforcement layout. Pre-tensioning load can contribute to achieving vertical wall-facing alignment at the end of construction. Using perforated/holed strips, the tensile loads at the end of construction were reduced by about 30% due to the improved polymeric–soil interface strength and stiffness.

1. Introduction

Reinforced soil walls have been broadly used as earth retaining structures, providing clear environmental, economic, and technical/functional advantages over conventional/traditional earth retaining alternatives such as gravity or cantilever concrete walls [1]. One of the main technical/functional advantages of reinforced soil structures is their greater tolerance to differential settlements. Due to their ability to yield during seismic events, they imply higher resistance to seismic loading compared with other rigid concrete structures [2]. Back-to-back reinforced soil walls are appealing solutions for the support of embankment bridge approaches when compared with alternative solutions. Design methodologies for back-to-back reinforced soil wall systems can be found in design guidance documents such as the Federal Highway Administration (FHWA [2]), where back-to-back walls are defined in two cases:
Case 1: if the interaction distance Di between the back of the reinforced soil zone for opposite walls is less than the active zone:
D i < H 1 tan 45 ° ϕ 2 0.5 H 1
where H1 is the maximum height of the parallel walls and ϕ is the friction angle of the backfill. The failure surface cannot be fully developed in Case 1, so the lateral earth pressure is reduced and the two wall sides cannot be independently designed. However, for design, it is assumed that for values of:
D i > H 1 tan 45 ° ϕ 2 0.5 H 1
Then, full active thrust is mobilized and the walls can be designed independently.
Case 2: there is an overlapping of the reinforcement layers such that the two walls interact with each other. When the overlap length (LR) is greater than 0.3H2, where H2 is the shorter of the walls, no active earth thrust from the backfill needs to be considered for external stability calculations.
For intermediate geometries between cases 1 and 2, when:
  0 < D i < H 1 tan 45 ° ϕ 2 0.5 H 1
FHWA recommends linearly interpolation between full active earth pressures in Case 1 and zero earth pressure in Case 2.
The back-to-back reinforced soil walls design methodology under working stress conditions has been long-established by numerical analysis. Han and Leshchinsky [3] adopted finite difference numerical methods based on FLAC software for the study, as well as limit-equilibrium approaches. The objective was to investigate the effect of the wall width to height ratio (W/H) and the quality of the backfill material (friction angle ϕ) on the behavior of back-to-back reinforced soil walls under self-weight. It is shown that two back-to-back walls perform independently when W/H > 3, and still interact with each other once W/H ranges 2 to 3 and with D tending to 0. El-Sherbiny et al. [4] performed FEM analysis of the effect of the normalized distance between the back-to-back reinforced soil walls on the distribution of earth pressure, and the results showed that when the normalized distance is small, especially in Case 2, evident interaction can be noticed, but no obvious/clear failure surfaces are generated. Benmebarek et al. [5] showed that the factor of safety increases with increased reinforcement overlap for 0.8HW ≤ 1.4H, and for W < 1.0H, overlapping reinforcement layers provide a higher level of safety than do continuous layers of reinforcement attached to both wall faces. Benmebarek and Djabri [6] studied the influence that the overlapping length of reinforcement (LR) has on the factor of safety and facing displacements of this kind of structure. The study concluded that the use of the overlapping reinforcements could allow a reduction in the length of reinforcement to 0.6H. Sravanam et al. [7] analyzed the tensile loads in connected and unconnected reinforcements between both back-to-back wall sides. The reinforcements tensile for the connected case was found to be uniform along the length of the reinforcement (except in greater confinement layers). However, although these mentioned studies are regarding numerical research conducted on back-to-back reinforced walls under static loading, the dynamic behavior of this type of reinforced soil structure has not been studied extensively. The main exceptions are the studies from Dram et al. [8] and Samee et al. [9]. Both studies also found that, numerically [8] and experimentally [9], a continuous layer of reinforcements by the connection of opposite walls significantly reduced the dynamic loads on the walls compared with those on unconnected walls [8]. Furthermore, despite showing the worst performance in terms of lateral displacements increase, reinforcement layouts with reduced overlap, or even separated opposite walls, were proven to reduce the dynamic reinforcement loads [9].
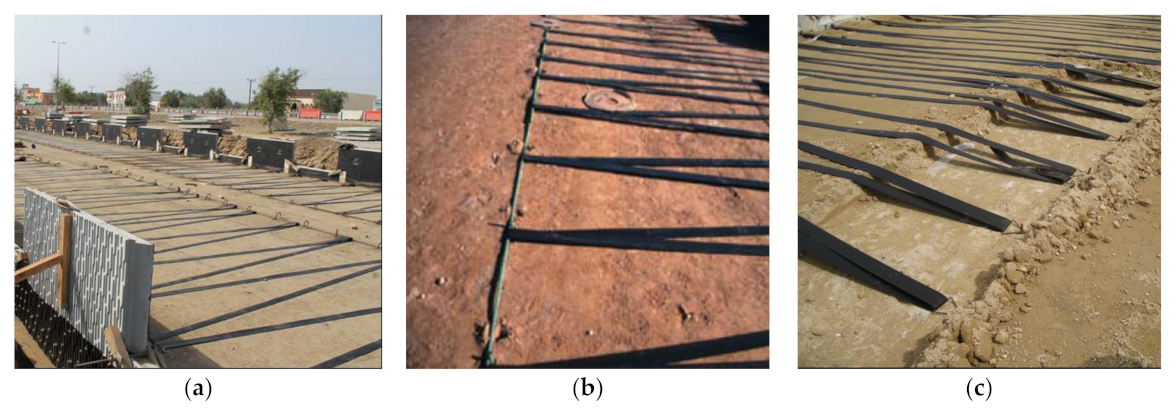
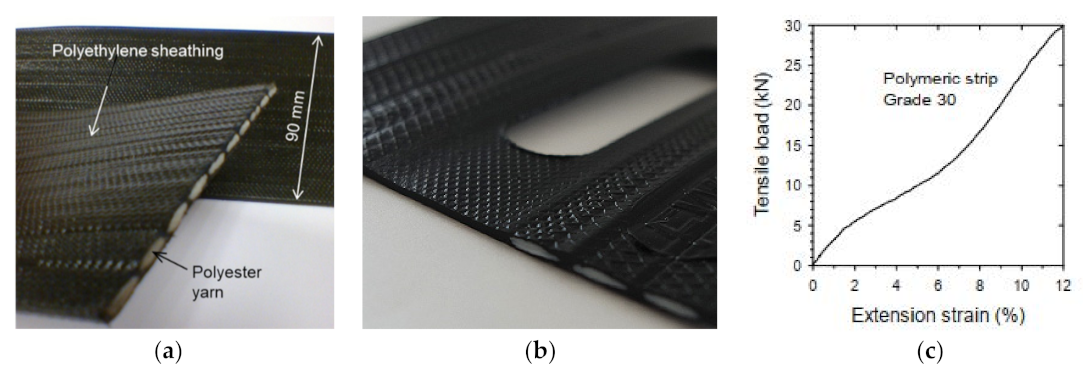
This study describes the results of a series of numerical method simulations that were carried out on an idealized 6 m high wall with geometrical cases 1 and 2 shown in Figure 1. The reinforced soil wall is composed of precast concrete panel facing and polymeric strip reinforcements. The polymeric strips are made from bundled high-tenacity polyester yarns (providing tensile strength) that are encased in a polyethylene sheath (providing interface frictional strength, alignment, and protection of the inner yarns). The strips may be placed in a continuous wrapped arrangement (loops) as in Figure 2a, or placed as single strips (free tail ends). The strips ending at the back of the reinforced backfill (i.e., at L distance from facing) are fixed to the ground using different methods such as rear anchorage bars for the case of continuous strip loops (Figure 2b), using trenches that provide tension during backfilling and compaction (Figure 2c), or single steel triangles or plates attached or clamped to the strips and pegs drilled or staked into the backfill (for continuous and single strips). Prior to backfilling over each extensible reinforcement layer, the current construction practice is to apply some tension to the reinforcements with the purpose of removing any slack and to minimize any facing deformation during the mobilization of the reinforcement tensile forces [2,10]. To achieve this initial tight condition for polymeric strips, pre-tensioning the load by hand is typically enough. However, in some cases, a constant and uniform pre-tensioning load level may be required for all reinforcement strips in a layer.
In this study, single layers connected to both facing walls with ratio W/H = L = 0.7H, two different ratios of LR/H = 0.3 and 0.6, and three different ratios of Di/H = 0, 0.3, and 0.6 are considered together with no pre-tensioning and two different pre-tensioning loads applied to all reinforcement layers during construction. The influence of small uniform surcharge loads due to a thin pavement layer and traffic is also examined for the case with the largest interaction distance between opposing reinforced soil zones. The study also considers polymeric strip reinforcement with smooth and perforated sheathing treatments, which generate different soil-reinforcement interaction performance. A two-dimensional numerical analysis of a back-to-back reinforced soil wall is carried out using the finite element method (FEM) commercial software PLAXIS [12].

2. Finite Element Modeling

2.1. General

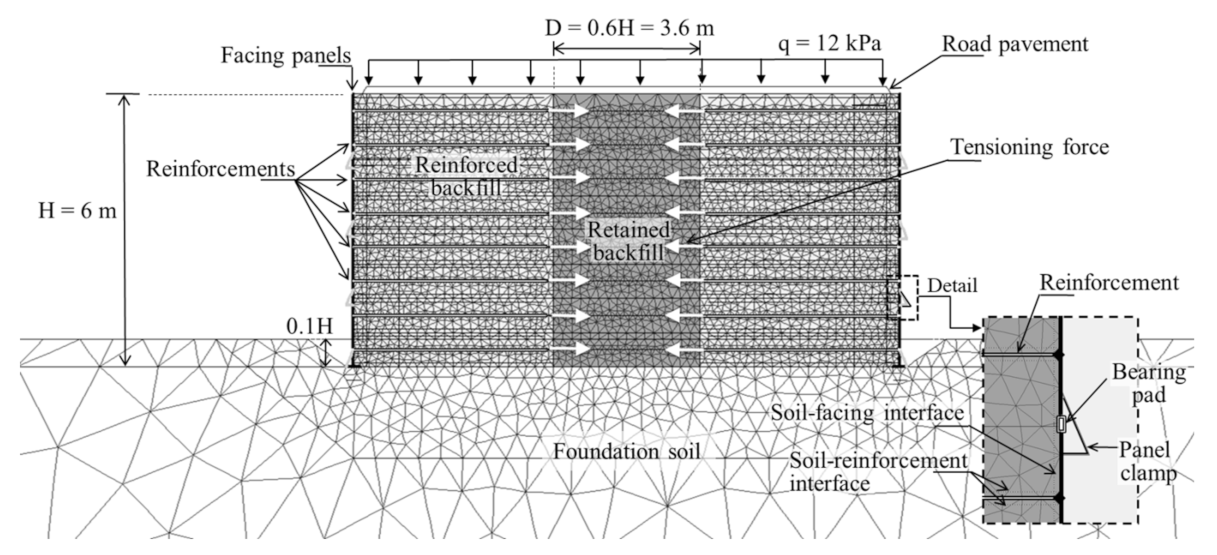
The 2D PLAXIS FEM program was used to model the construction and post-construction performance of back-to-back reinforced soil wall simulations. The FEM mesh including geometry details for the baseline model used in this study is shown in Figure 3. The assumed foundation soil was 10 m deep and 50 m long. The height of both wall facings (H) was kept constant and equal to H = 6 m, with toe embedment depth of 0.6 m (i.e., equal to 0.1H). The walls were assumed to comprise eight reinforcement layers within the structural height (i.e., vertical reinforcement spacing of 0.75 m). The length of the polymeric strip reinforcement elements was taken as L = 0.7H (typical minimum value recommended in many international codes in the Design of Mechanically Stabilized Earth Walls and Reinforced Slopes (FHWA) [2], the Load Resistance Factor Design (LRFD) Bridge Design Specifications (AASHTO) [13], and the Code of Practice for Strengthened/Reinforced Soils and Other Fills (BSI) [14]). The soil zones were modeled using 15-node triangular elements (69,737 nodes from 7891 elements). The element areas were reduced to 0.005 m2 at soil-facing and soil-reinforcement interfaces, and to 0.0001 m2 adjacent to the horizontal panel joints where elastomeric bearing pads are modeled. In order to achieve a better wall performance in terms of horizontal facing displacements, staged construction was modeled using a sequence of 0.375 m thick layers.
Compaction effects were not modeled directly but the soil modulus was modified in the vicinity of the facings to at least partially account for the compaction method, as discussed later. Panel installation was performed using temporary stiff beam element connections (see Figure 3—panel clamp detail). During construction, these beam elements were prevented from rotating to simulate the panel clamp and/or propping devices typically used in practice to temporarily sustain and provide the required panel unit alignment [15].

2.2. Soil and Road Pavement

The material properties for the soil material zones (i.e., backfill and foundation) and road pavement are summarized in Table 1. For simplicity, the soil was modeled as linear elastic perfectly plastic with Mohr–Coulomb failure criterion. The thin pavement layer was modeled as a linear-elastic material to avoid any unexpected and non-relevant behavior (for the scope of this study) at that location. A lower soil elastic modulus within 1 m distance of the wall facing was used to model the influence of lighter compaction equipment typically used close to the facing.

2.3. Facing: Precast Panels and Bearing Pads

The wall facing was modeled assuming discrete panels of 1.5 m height. Panels and bearing pads were simulated using linear-elastic beam elements. Material properties for the precast concrete facing panels and the high-density polyethylene (HPDE) bearing pads are summarized in Table 2. Bearing pads are typically installed in the horizontal joints between adjacent vertical panels. They have the practical function to smoothly distribute vertical loads between the facing panels and to prevent concrete-to-concrete panel contact by accommodating differential facing–backfill settlements [17,18]. In the present study, two units of 20 mm thick high density polyethylene (HDPE) bearing pads were assumed at each horizontal joint between 1.5 m wide panels.

2.4. Reinforcement

Polymeric strips were modeled using “geogrid” PLAXIS elements. In 2D representation, the 1D discrete strip elements are simplified and converted to equivalent continuous sheets. In this study, the equivalent linear-elastic axial stiffness (EA) of the polymeric strip reinforcements was computed as follows:
  E A polymeric   strips = F ε n strips L panel
where F* is the ultimate tensile load capacity of the strip, ε is the strain at nominal ultimate load F* (ε ≈ 0.10–0.12 from Figure 4c), and nstrips is the number of strips per panel width Lpanel (i.e., nstrips = 6 units matching the 3 connections for each Lpanel = 1.5 m); hence (nstrips/Lpanel) = 4 strips/m corresponds to the number of strips per plane-strain model meter. In this study, the polymeric strips are Grade 30 kN-type, with different strip sheathing shapes (regular-smooth and with center-line perforations); see Figure 4a,b, respectively, with a resulting linear-elastic axial stiffness of (EA)polymeric strips = 1 MN/m.

2.5. Interface Properties and Boundary Conditions

Facing and reinforcement elements transfer load to the surrounding soil through interface shear. The key parameter quantifying the interaction between the soil and the interface material is the strength–stiffness reduction factor (Ri ≤ 1.0). It may be applied to the properties of the adjacent soil (default option in PLAXIS) or, as in this study, for a more accurate approach, by defining the interface as a separate “interface” material with the following properties (Equations (5)–(9)):
c i = R i c soil
ϕ i = tan 1 R i tan ϕ soil
  ψ i =   0                       R i < 1.0   ψ soil           R i 1.0
G i = R i 2 G soil
where csoil and ci are the cohesion of the soil and the interface material, respectively; ϕsoil and ϕi are the friction angle of the soil and the interface; ψsoil and ψi are the dilatancy angle of the soil and the interface; Gsoil and Gi are the shear modulus of the soil and the interface, respectively; and νi = 0.45 (i.e., assuming oedometric conditions at the interface). In this study, an interface reduction factor of Ri = 0.3 was assumed for the soil-facing interface, which is in line with values computed from an instrumented field structure [21] and numerical analyses reported in the literature [22,23]. From Equation (8) and elastic stiffness relations, Young’s modulus of the interface can be computed as follows:
E i = 2 G i 1 + ν i
For the soil-strip reinforcement interface considering the 3D to 2D conversion for the strip reinforcement elements, the parameter Ri for each “geogrid” reinforcement layer was computed using the following equation:
R i = 1 A layer C i soil A soil / layer + C i strip A strip / layer
where: Alayer is the total surface area of each reinforcement layer equal to the panel width (Lpanel = 1.5 m) multiplied by the strip length (Lstrip = 0.7H = 4.2 m); Astrip/layer is the soil-strip contact area (which depends on the number of strips per meter nstrips/Lpanel, the strip width (90 mm), and the strip length); Asoil/layer is the soil–soil contact area per layer (i.e., AlayerAstrip/layer); Ci refers to the coefficient of interaction defined as Ci = tan ϕi/tanϕsoil. Therefore, Ci(soil) corresponds to the soil–soil interaction coefficient (Ci(soil) = 1) and Ci(strip) is the soil-reinforcement interaction coefficient, assumed equal to 0.8 as per product default specifications for the smooth strip case. However, according to pull-out tests performed on high adherence perforated strips (FASTEN FW product [20]; see Figure 4b) and with the same or similar soil, an additional case with variable values of Ci(strip) from 1.51 (bottom layer) to 3.15 (top layer) was assumed. These values are much higher than the typical values for smooth soil–polymeric strip interaction assuming frictional/shear strength only (i.e., Ci(strip) < 1). However, the perforated strip materials generate significant additional interface strength through bearing capacity due to granular particle interlock in the perforations (similar to the passive soil resistance developed by the transverse members in steel ladders and grids). Nevertheless, no design recommendations are currently available to account for this additional capacity. The assumptions made in this paper for the perforated strips are for preliminary purposes only and to demonstrate potential improvement in wall performance using these materials. The corresponding interface property values assumed for the soil-facing interface and soil reinforcements are shown in Table 3 for both smooth and perforated strip types.

2.6. Numerical Modeling Verification

In order to develop confidence with 2D PLAXIS finite element modeling, a comparison with a representative 6.0 m high full-scale model was performed. The full-scale monitored structure considered for this purpose was the one reported by Jayakrishnan [24] (see previous reference for full details). Note that the single-faced reinforced soil wall data was used in this study as no experimental study results on representative back-to-back reinforced soil walls were found available in the literature. This reinforced soil wall was constructed using polymeric strip reinforcements with a vertical spacing of 0.75 m and a horizontal spacing of 0.76 m placed in the backfill and connected to 1.48 m square concrete facing panels. The length of the polymeric strips changed according to the depth from 4.08 m at the lower levels to 5.08 m at the top. The value of the ultimate tensile load (i.e., strips grade) was about 45 kN per strip, while the strain at failure was 12%. The axial stiffness (EA) for a single geostrip is about 375 kN and the equivalent axial stiffness EAequivalent is about 1 MN. The soil properties used for verification modeling were the same as the experimental data (see Table 4). Detailed information of the field instrumentation can be found in [24,25]. Figure 5 shows details of the FE numerical model and mesh generated for the full-scale reinforced soil wall comparison and verification purposes.
Figure 6 presents reinforcement tensile load results comparison between the calculated FE model and experimental data measurements from the experimental full-scale test [24]. As can be seen, both maximum and tensile reinforcement axial loads distribution comparisons with the calculated results were consistent, which verified the reliability of the modeling methodology and modeling assumptions involved using PLAXIS 2D.

3. Numerical Results and Discussion

3.1. General

Facing displacement, lateral earth pressure, and reinforcement tensile load distributions were computed for cases with different interaction distance between the back of the reinforced soil zone for opposite walls (base case Di = 0.6H, Di = 0.3H, Di = 0; continuous or discontinuous strips from one wall face to the opposite wall face), different overlapping distance (LR = 0.3H, LR = 0.6H), and single layers connected to both walls facing (W = L = 0.7H). The magnitude of pre-tensioning load (no-tension, 0.5 kN/strip, and 1 kN/strip), and soil-reinforcement interaction (Ri constant or variable; see Table 3). The unconnected strip reinforcement case (Di = 0) was generated assuming a 10 cm distance between the opposite tail ends. Due to symmetry of the general problem, results are presented for the left half of the problem domain. In addition to the facing displacements, lateral earth pressure and reinforcement loads, shear strain contours and plastic (failure) zones are also given for some cases when relevant. The results of sensitivity analyses were performed around the base case scenario with Di = 0.6H geometry at the end of construction (EoC), without pre-tensioning and constant Ri (i.e., smooth strips). As noted in the introduction, construction method and quality (e.g., panel placement and alignment, and soil placement and compaction) will influence wall performance. These factors cannot be captured in numerical models of the type used here.

3.2. Effect of the Interaction Distance (Di) between Back-to-Back Walls

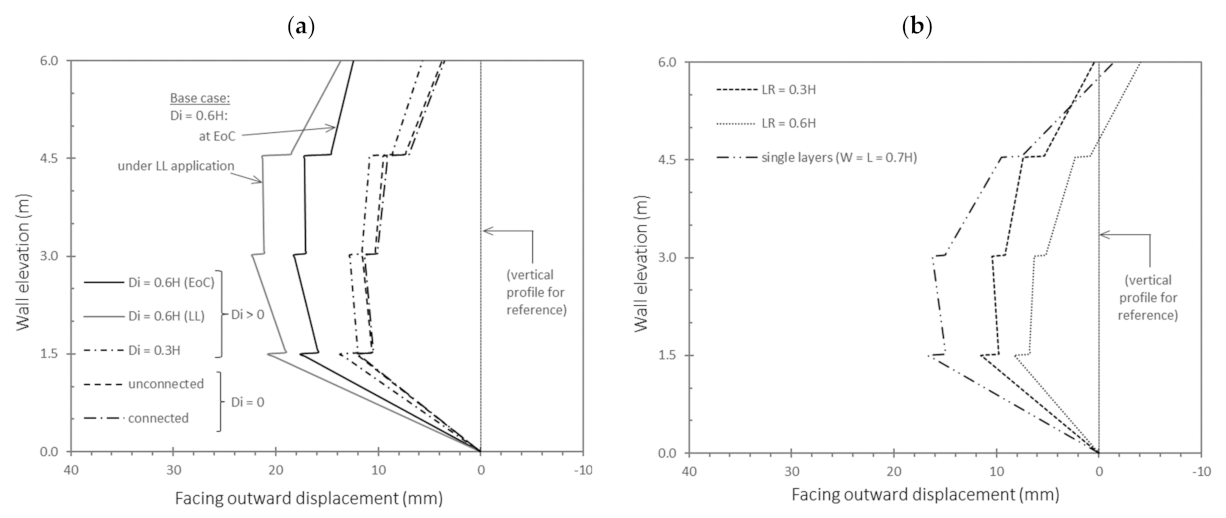
Figure 7 presents computed horizontal facing displacements at the end of construction (EoC) for different back-to-back interaction distances (Di), overlapping length reinforcement distances (LR), and single reinforcement layers attached between both opposite facing walls (W = L = 0.7H). As expected, the greater the overlapping distance (LR = 0.6H), the smaller the outward wall displacement. However, when Di was decreased from 0.6H to LR = 0.6H, the permanent displacement decreased more than 50%. For brevity, the influence of the equivalent road pavement surcharge pressure (about 4 kPa) and live load (LL) surcharge application (q = 12 kPa) are shown for the base case Di = 0.6H only. The influence of other interaction distances (Di) and overlapping distance (LR) can be estimated by interpolation. For the case of Di = 0, whether or not the reinforcement layers were connected did not make a practical difference on wall displacements due to the self-weight loading conditions (uniform loading) used in the models.
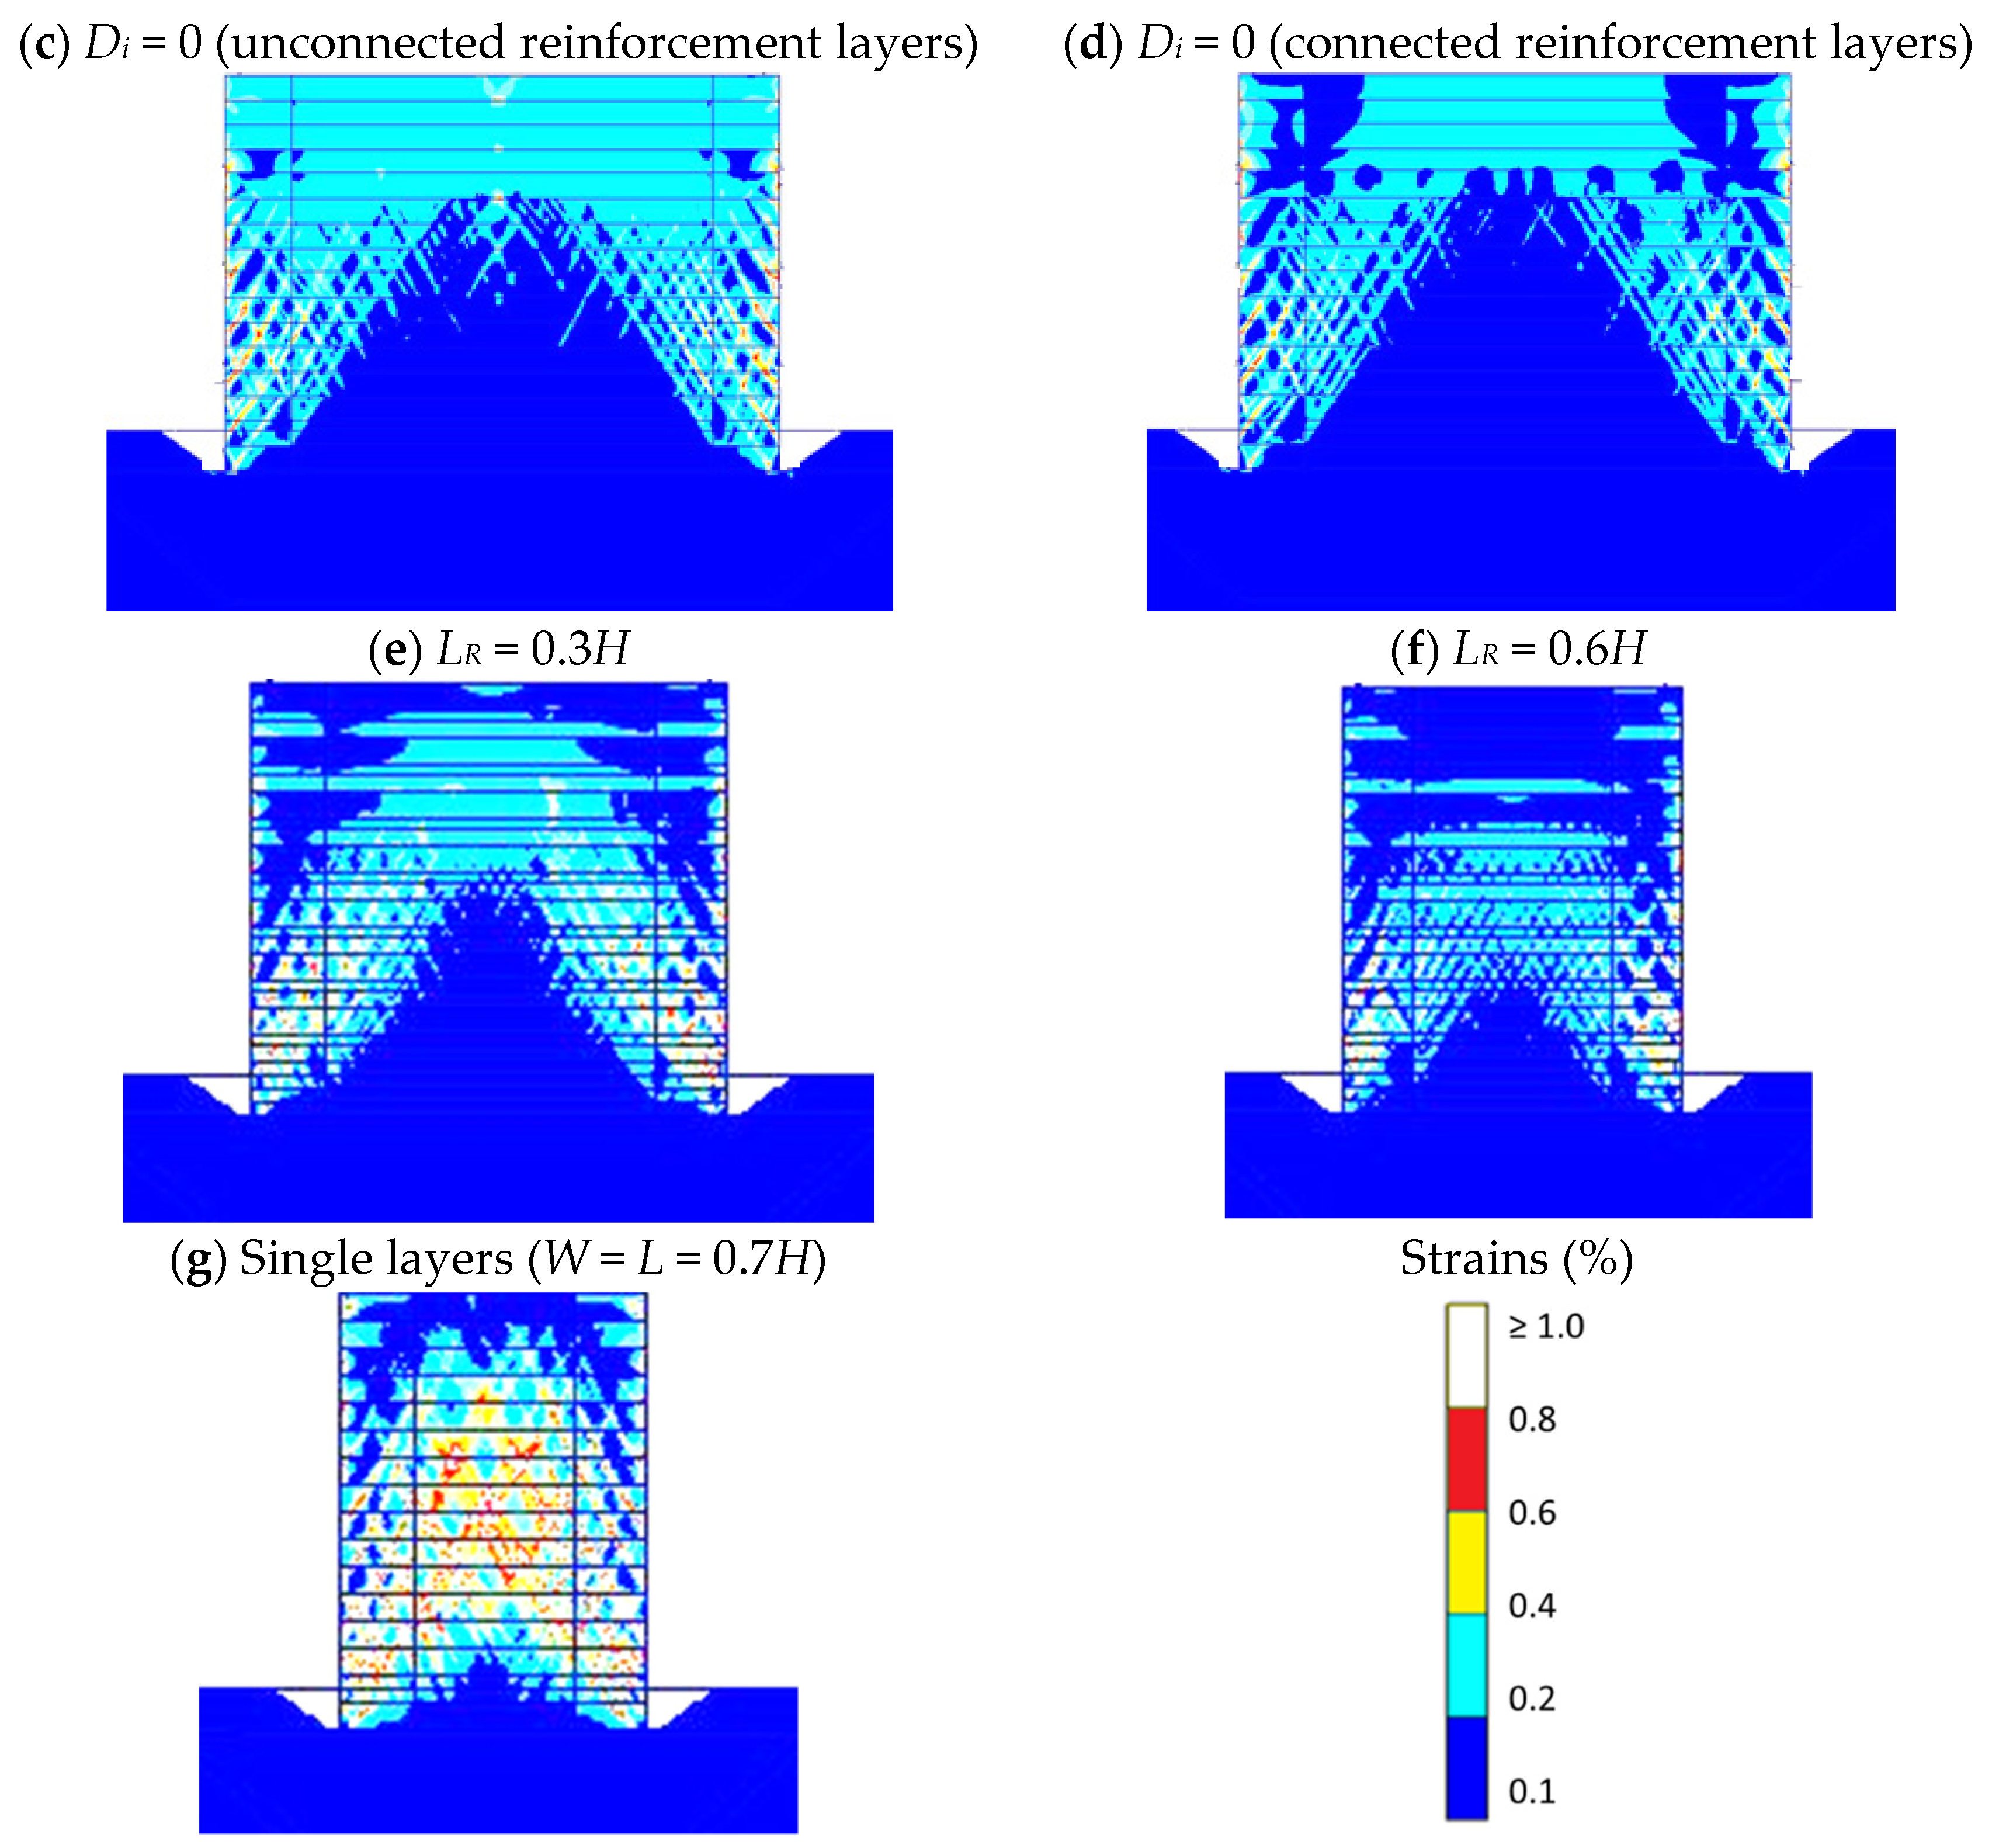
Contour plots of shear strains achieved at the end of the construction are shown in Figure 8 for back-to-back wall interaction distances of Di = 0 (connected and unconnected strip), 0.3H and 0.6H, and with overlapping length reinforcement distances of LR = 0.3H and LR = 0.6H, in addition to single strip connected to both of the facing walls (W = L = 0.7H). The internal soil shear zones fall within the 0–1% strain range (i.e., working stress conditions for polymeric strip reinforced soil systems [26]). Relatively high shear strains can be seen to propagate from the toe of the walls. While there were some isolated shear strains, even greater than those shown in Figure 8, they were not contiguous which is consistent with the notion of end-of-construction working stress conditions assumed in this study. The shear strain fields for Di = 0.3H and Di = 0.6H cases are similar. However, soil shear strains were attenuated to almost zero to below the upper third of the height of the wall for Di = 0 to LR = 0.6H cases due to the presence of the reinforcement layers, but regarding the single layer case (W = L = 0.7H), the soil shear strain return increased to less than the upper third of the wall height (from H/3 to H/1.14). This is due to the reduction in the reinforcements layers (single not double).
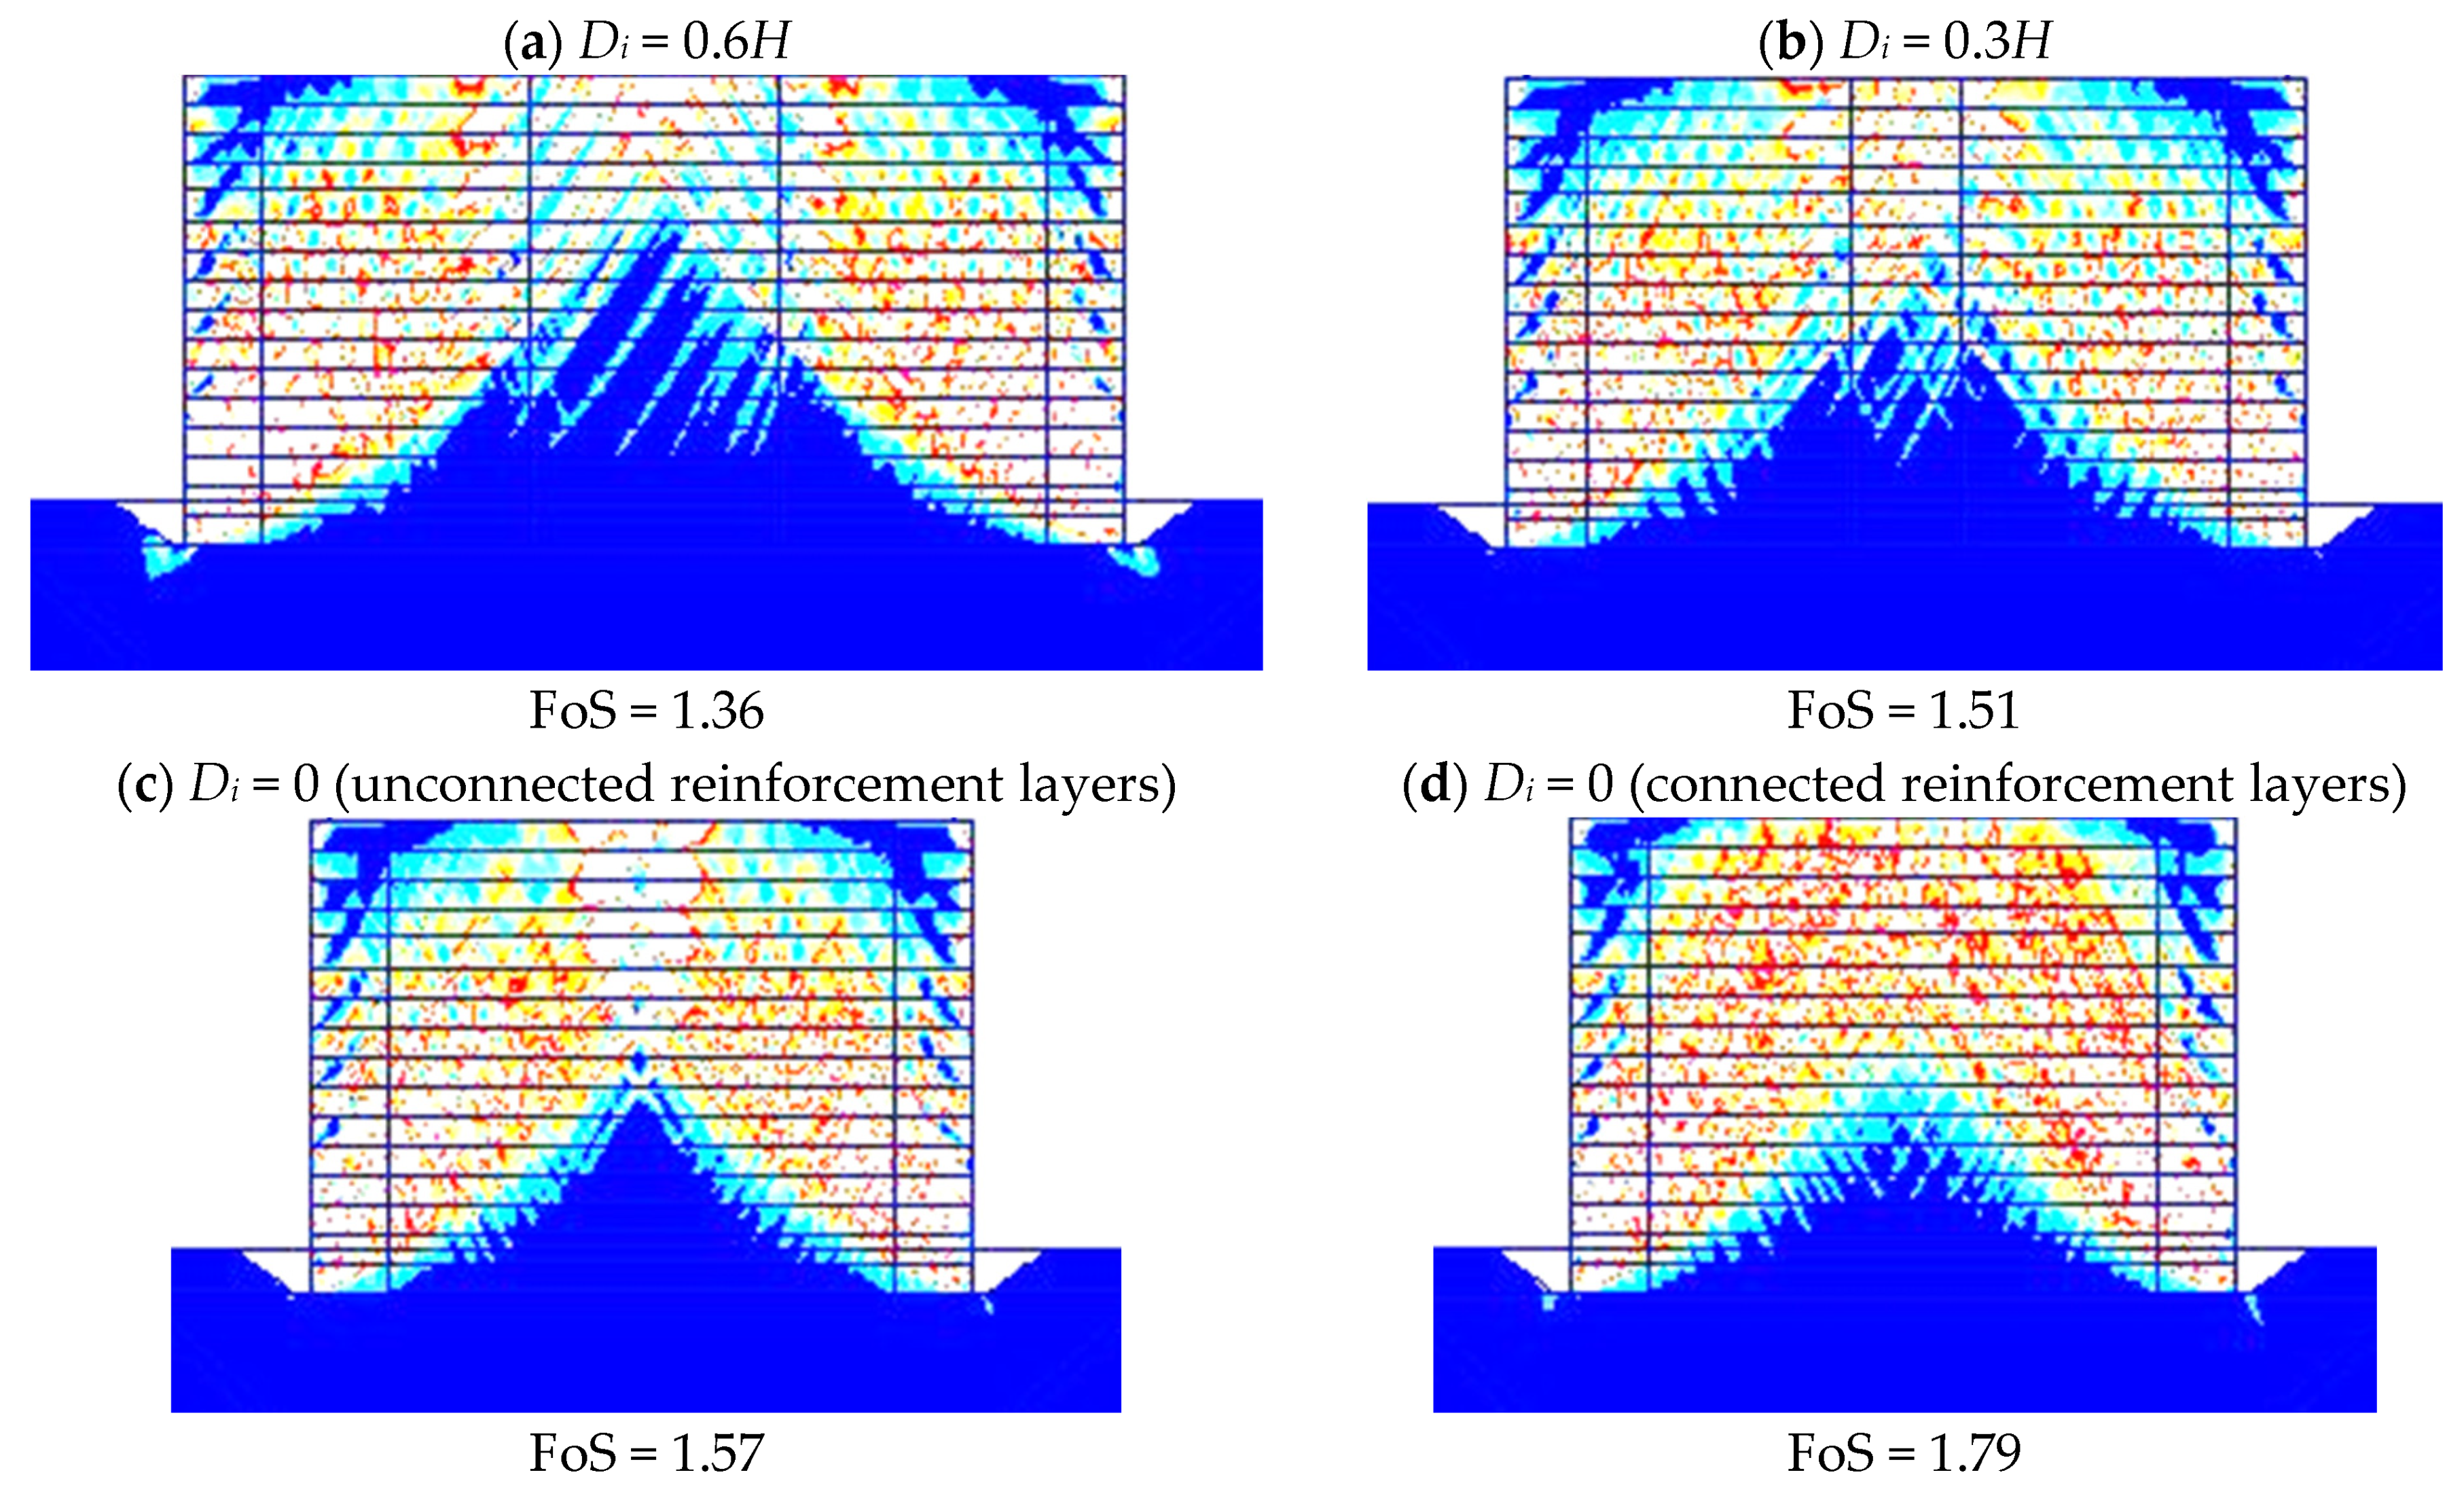
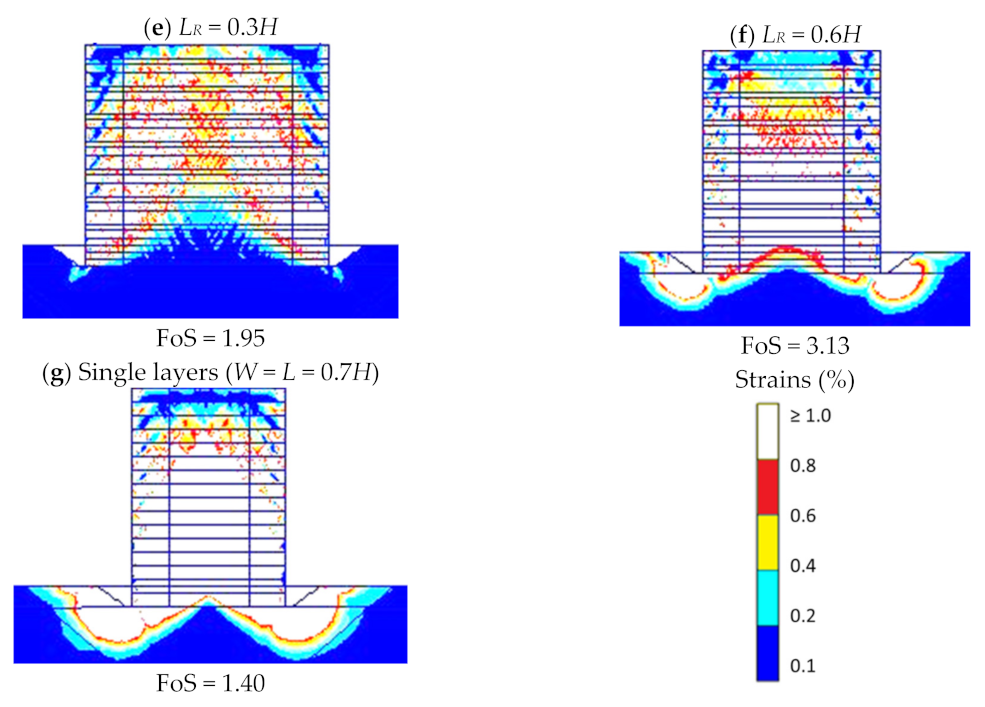
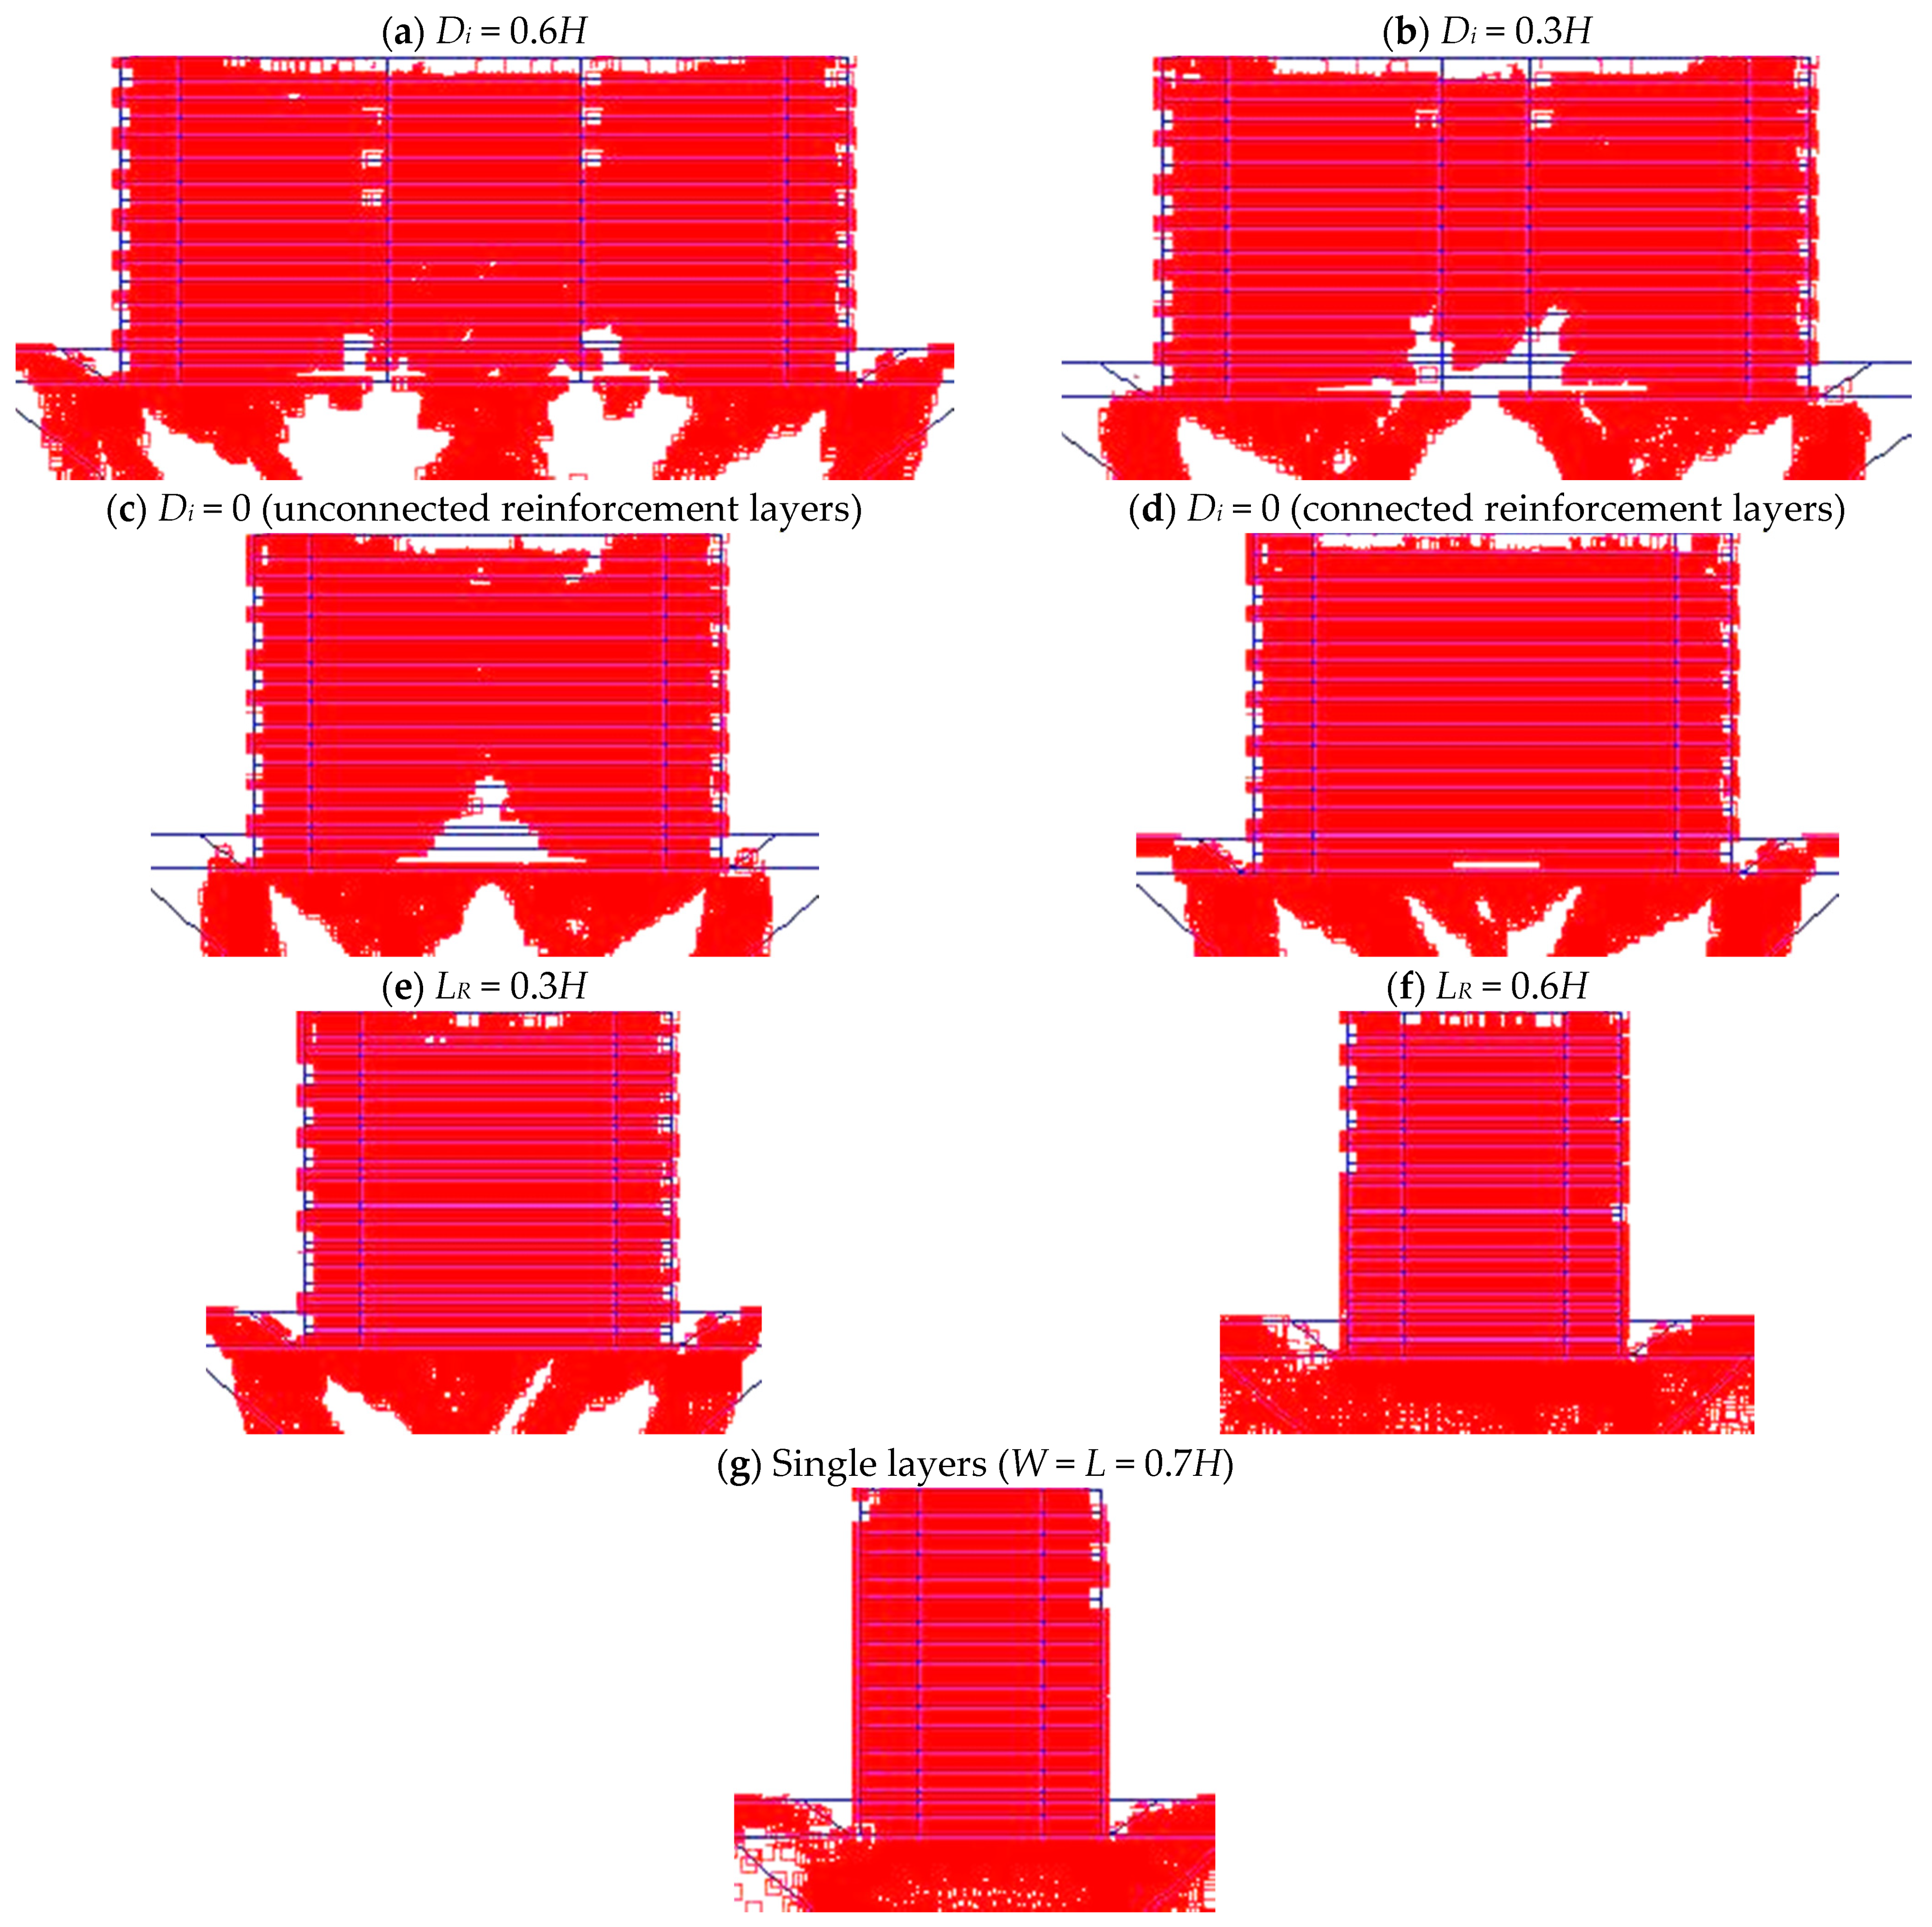
Figure 9 shows the shear strains achieved at failure with the c-ϕ reduction method at the end of construction for back-to-back walls with different interaction distances (Di), from 0–1% deformation. Relatively high shear strains can be seen to propagate from the toe to the top of the walls. As shown, the shear strain within back-to-back walls in both cases, Di = 0.6H and 0.3H, intercept each other from two sides; more interactions occur as the interaction distance (Di) decreases. The interaction distance (Di) based on the FHWA design guideline can be determined using Equation (1), which is equal 0.42H. In other words, when the interaction distance Di is greater than H1 tan(45°−ϕ/2) (0.42H assumed in this case study) the back-to-back wall should perform independently, but when the interaction distance Di is lower than H1 tan(45°−ϕ/2), it should not perform independently. However, Figure 9 shows that the back-to-back walls still interact with each other when Di = 0.6H. Thus, this assumption in the FHWA design guideline is apparently not supported by the obtained numerical results. However, the FHWA assumption provides more conservative results. For the case Di = 0 with unconnected and connected layers as demonstrated in Figure 9, the shear strain in the two opposing walls enter the reinforced zone from another side, as the area of entrance increases when the layers are connected. For the overlapping cases LR = 0.3H, 0.6H and single layers case (W = L = 0.7H), it can be seen, in general, that the interaction distance between the opposite facing walls have a signifying influence in the development of shear strain which expands from the top to bottom until reaching a clear base-failure at the toe of the structure. In addition, the shear strain zone is located at the end of the overlapping reinforcements. The factor of safety (FoS) increases about 130% from Di = 0.6H to LR = 0.6H case. On the other hand, the factor of safety (FoS) increases just 3% from Di = 0.6H to the single layers case (W = L = 0.7H).
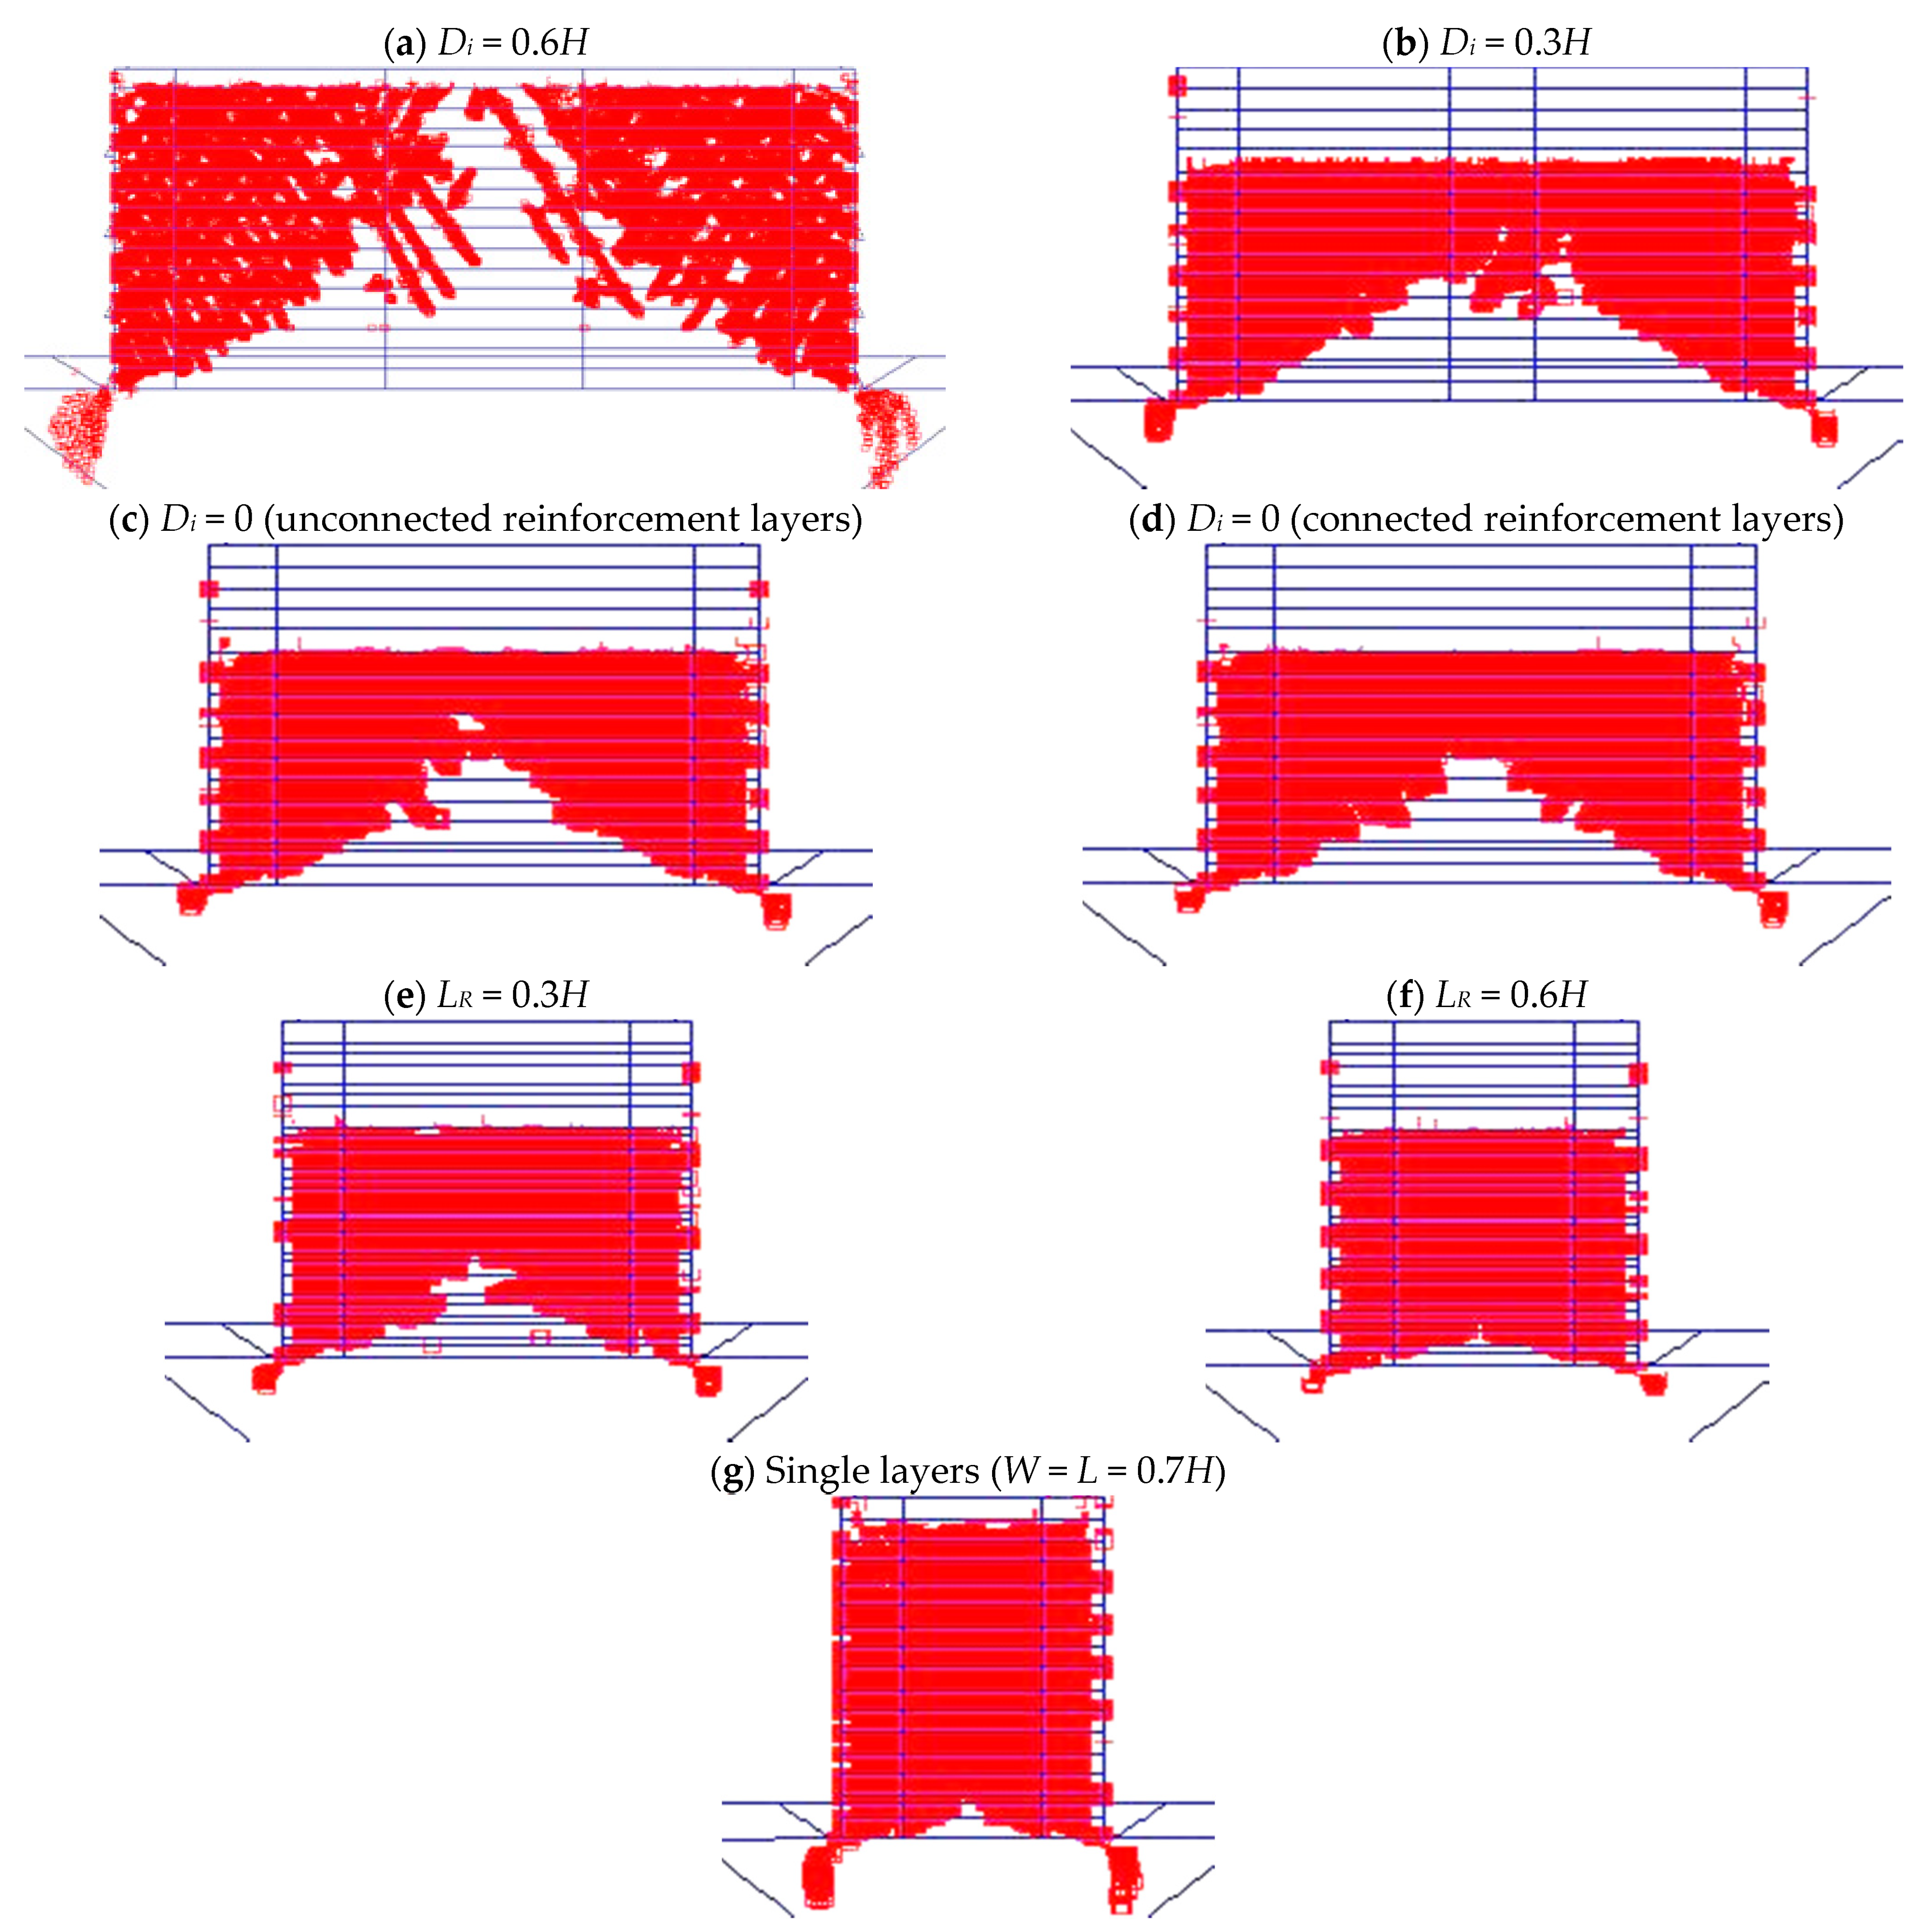
Contour plots of plastic (failure) points for walls with different interaction distances (Di) at the end of construction and at failure with the c-ϕ reduction method are presented in Figure 10 and Figure 11, respectively. At the end of construction (EoC), the interaction distance reduction (i.e., from Di = 0.6H to LR = 0.6H case) allows a tensile crack to develop at the wall top (from 0.375 m to 1.9 m), but regarding the single layers case (W = L = 0.7H), the tensile crack development occurs just at about 0.5 m depth from the top of the wall. As the interaction distance decreases, the failure points become swollen forming a slope approximately 65° from the facing element. At failure, the mass of plastic points becomes larger as the interaction distance between the back-to-back reinforced soil wall decreases (i.e., from Di = 0.6H to LR = 0.6H case, and also the single layer case, W = L = 0.7H).
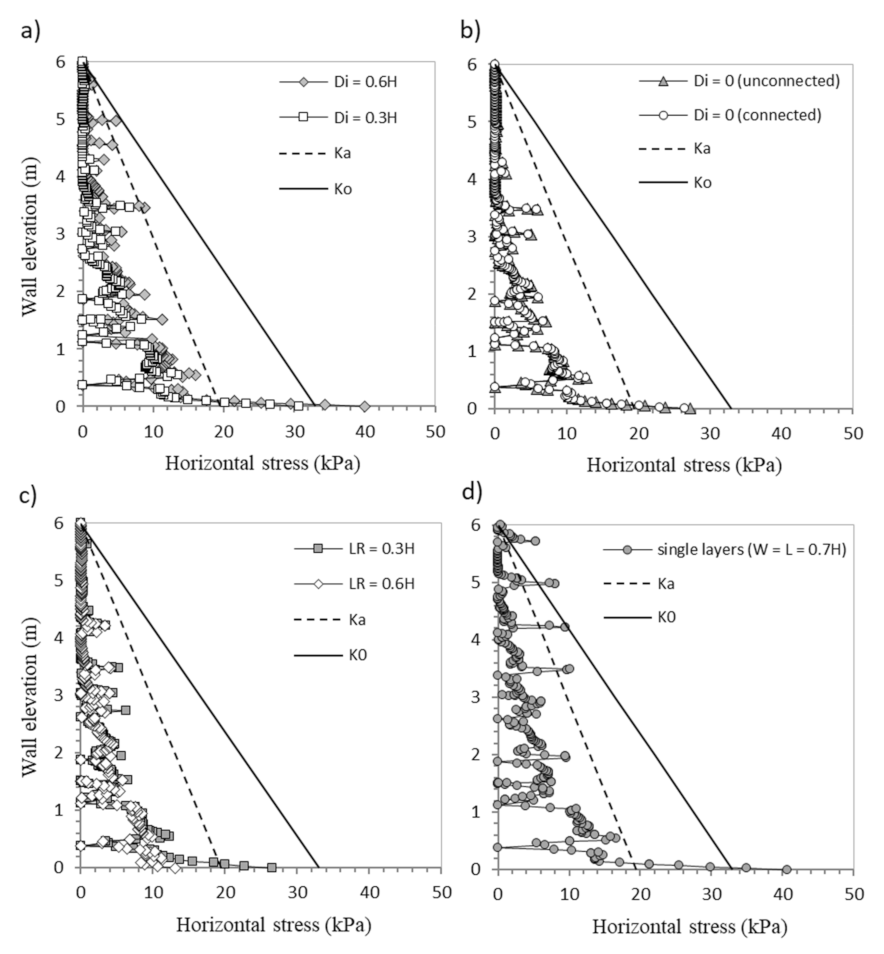
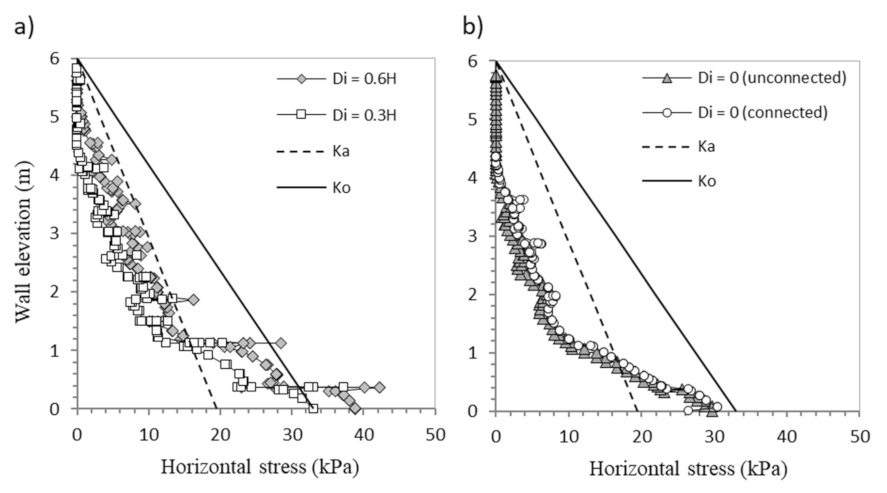
Numerical results for horizontal pressures at different cross-section plane distances from facing panels, and calculated values of total horizontal stress from the Rankine coefficient of active earth pressure (Ka) and the coefficient of earth pressure at rest (K0), at facing, at 1 m from facing, and behind the reinforcements (i.e., at L-distance from facing), are plotted in Figure 12, Figure 13 and Figure 14, respectively. It is noted that the numerical results for lateral earth pressure at facing (Figure 12) are lower than the analytical ones. The closest agreement is obtained with the active Rankine lateral earth pressure when the interaction distance is large (i.e., Di = 0.6H and Di = 0.3H) except for the upper half-height for single layers case (where a less yielding structural scenario closer to the at-rest stress state (K0) is generated; see Figure 13d) and the base of the wall for cases from Di = 0.6H to LR = 0.3H and single layers (W = L = 0.7H) (due to the restraint imposed at the base of the walls by the toe embedment, as also observed by wall displacements). Similar observations have been made from full-scale walls [27,28]. However, when the interaction distance (Di) decreases from 0.6H to 0 and the overlapping LR increases from 0.3H to 0.6H, the lateral earth pressure decreases. For the case Di = 0 with unconnected or connected layers, the lateral pressures in both were almost the same.
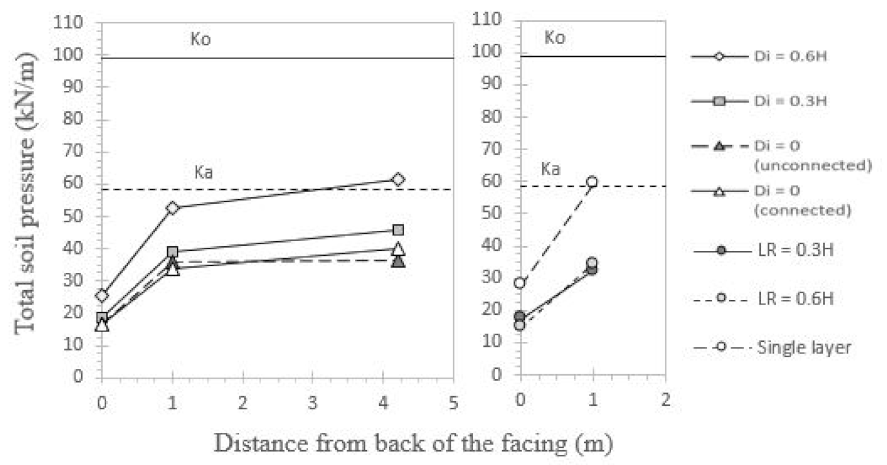
As for the single layers case (W = L = 0.7H), higher values of lateral earth pressure are obtained compared with the other cases. For lateral earth pressure at 1 m from facing (Figure 13), there is an over predicted horizontal pressure for all cases compared with the lateral earth pressure acting as the facing. Behind the reinforced zone cases for Di > 0 and Di = 0 (Figure 14), an increase in lateral earth pressure was recorded compared with the results obtained at other distances from the facing. However, a decrease in lateral earth pressure is obtained at the bottom for all cases compared with the results obtained at 1 m distance from facing. As is shown, for Di = 0 cases (both connected and unconnected layer scenarios) the lateral earth pressure is generated behind the reinforced zone. However, the FHWA guidelines [2] suggested that the lateral earth pressure for external analysis should be ignored if Di = 0. This suggestion would yield an unsafe design. However, FHWA guidelines indicate that the active thrust is reduced when there is a decrease in Di (i.e., Di = 0.6H to Di = 0.3H), which is confirmed by the FEM method. The total soil pressure for all the cases discussed above and recorded at different distances from the facing are presented in Figure 15.
The analytical linear trends from the active Rankine (Ka) and the at-rest lateral earth pressure (K0) were based on the analyses of one side wall, therefore, no interaction of two opposite back-to-back walls was considered. A decrease in the interaction distance between the opposing walls from Di = 0.6H to LR = 0.6H decreases the lateral thrust at facing and at 1 m from facing, and from Di = 0.6H to Di = 0 behind the reinforced zone. This trend of reduction in the lateral thrust is qualitatively in agreement with FHWA [2].
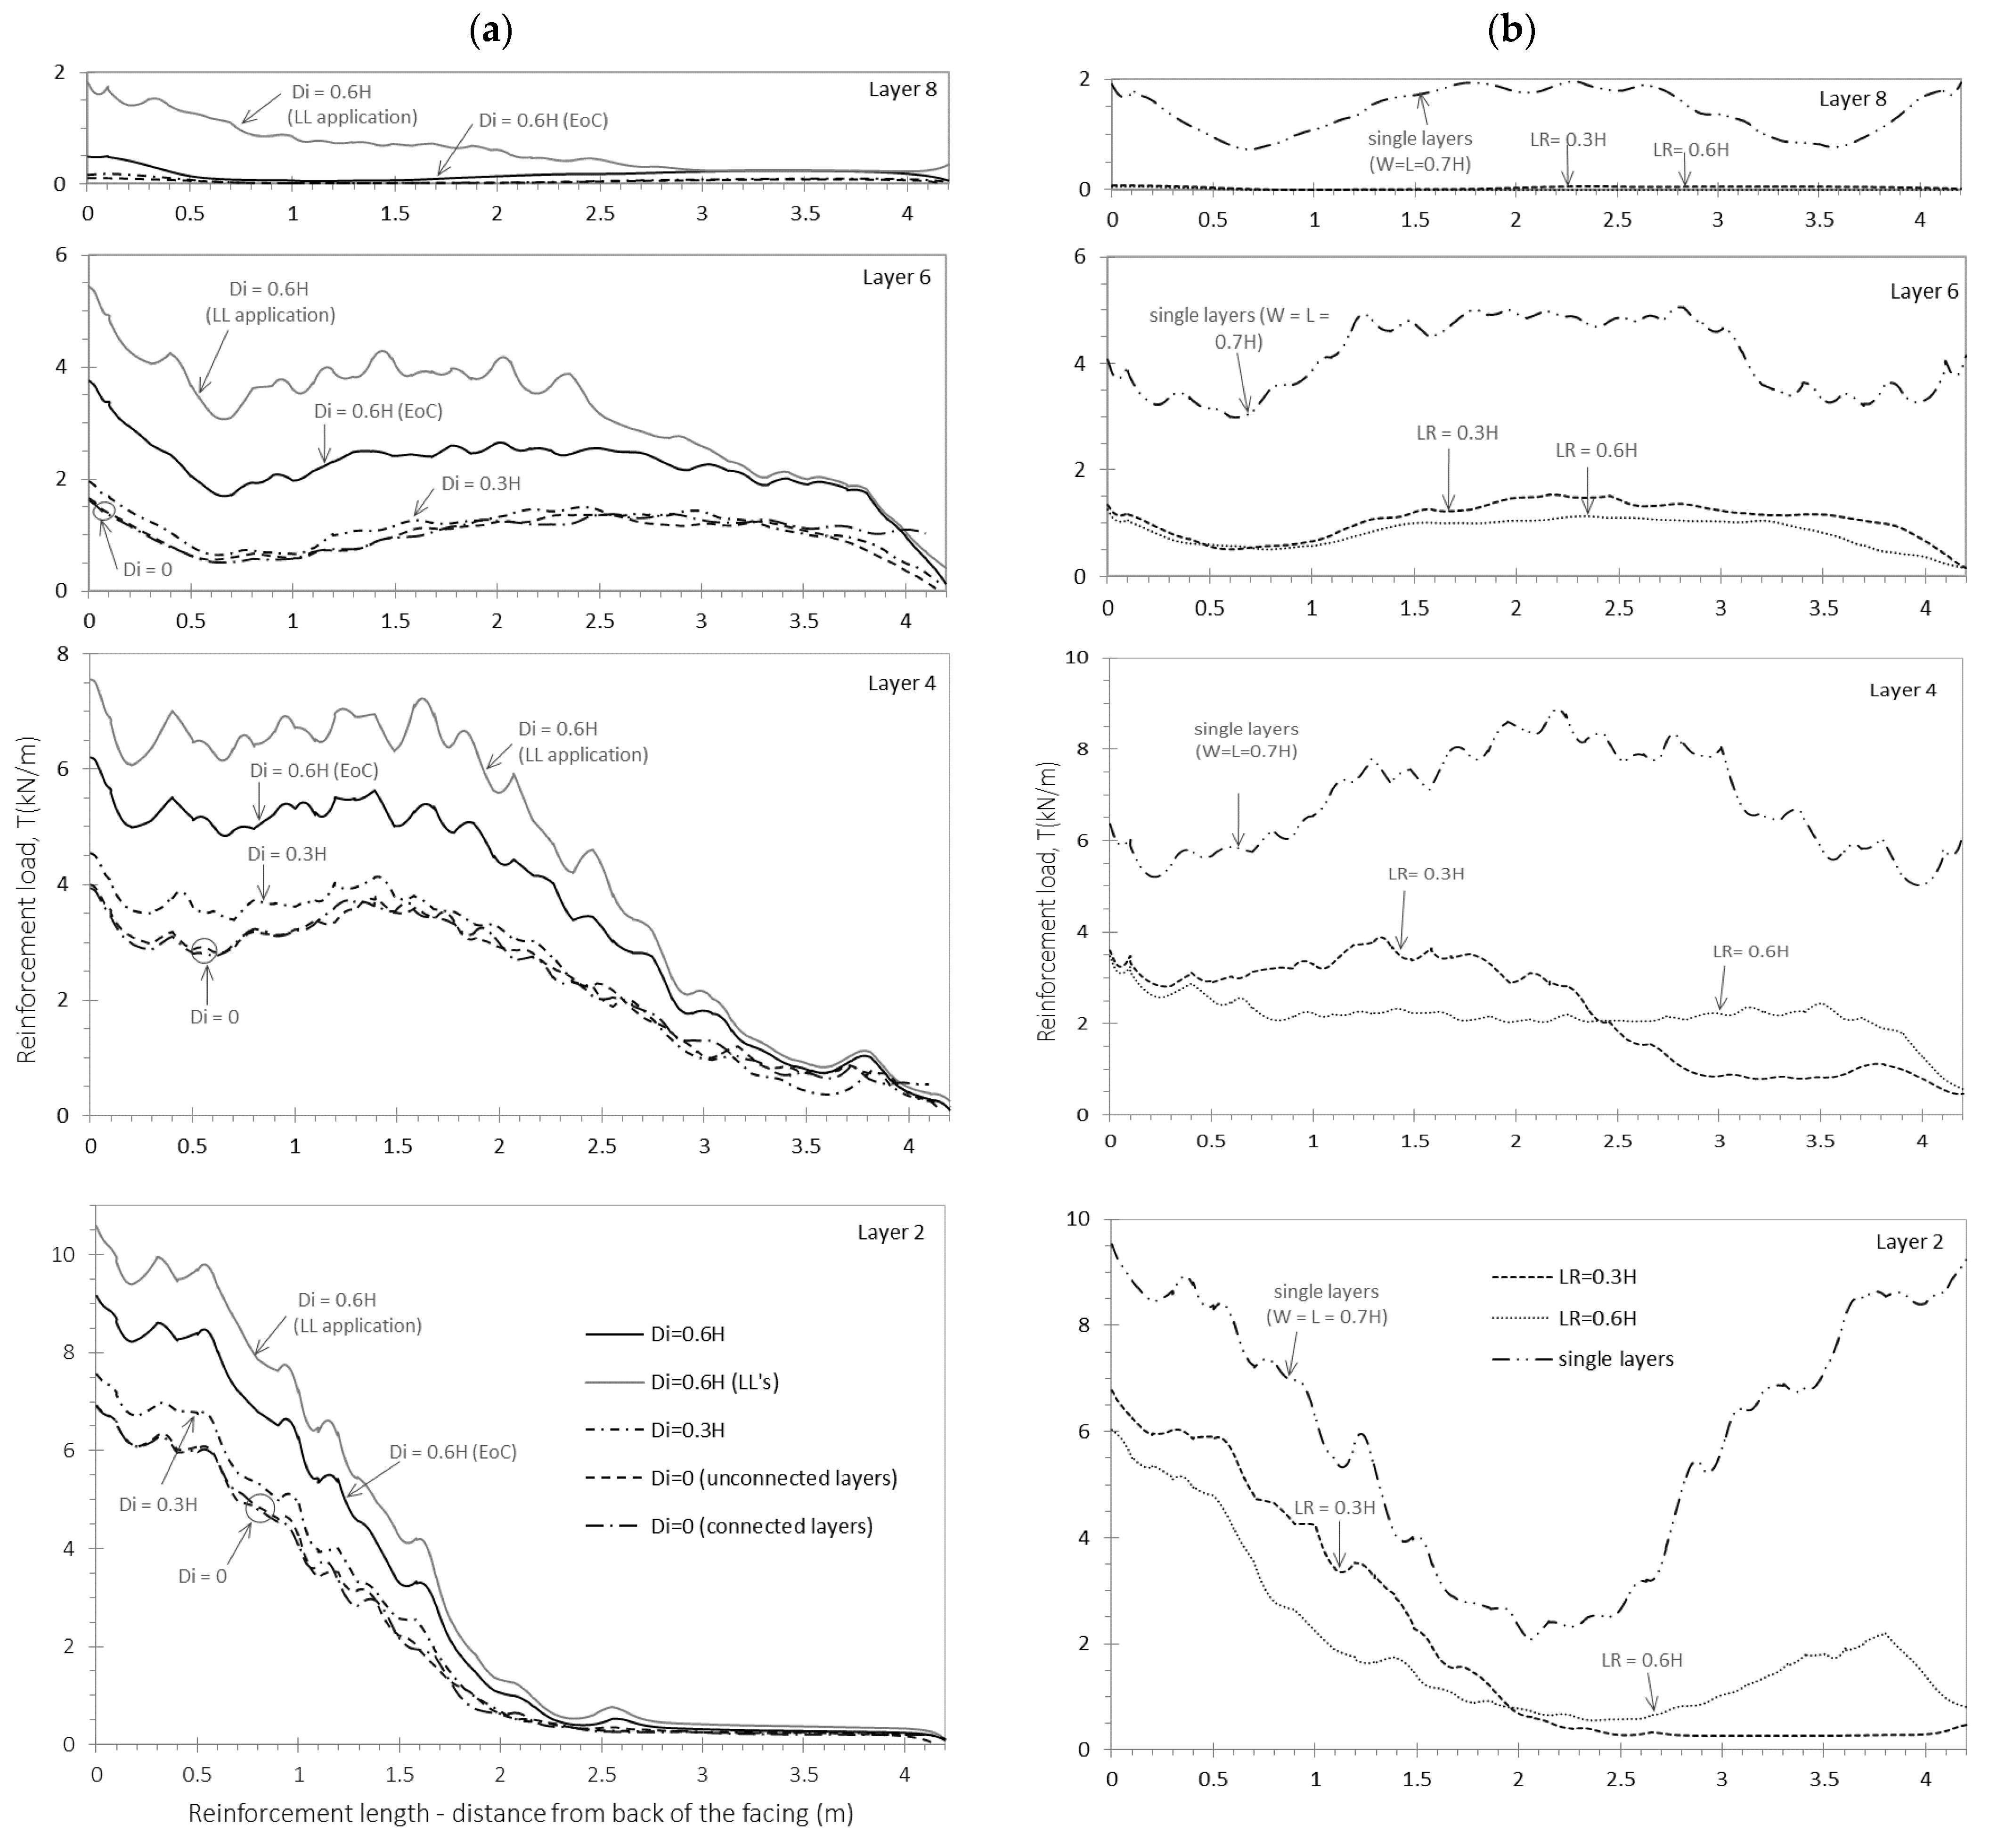
Figure 16 presents reinforcement load distributions along the length of selected reinforcement layers. As Di becomes smaller, the magnitude of tensile loads becomes smaller. However, from a practical point of view, the tensile load magnitudes and distributions are similar for Di = 0.6H and Di = 0.3H cases. The figure plots also show much less tensile load is generated for the Di = 0 cases over the bottom half of the wall height and there are negligible differences for unconnected and connected cases. However, when the reinforcement layers extend as single strips from wall to wall (connected case) there is a small tensile load that is generated at the mid-point between walls. The influence of the pavement layer plus equivalent live load surcharge are shown in Figure 16 for the base case Di = 0.6H only. The influence of these surface loadings on tensile loads are detectable but judged to be negligible from a practical point of view. The cases of the overlapping LR = 0.3H and LR = 0.6H show a very slight and disparate decrease in tensile loads, respectively, compared with the other cases. However, for the LR = 0.6H there is an increase in the last two meters of reinforcements for the lower half height of the wall. Regarding the single layers, the figure shows an increase in reinforcement load in the middle of reinforcements below the mid-height of the wall.
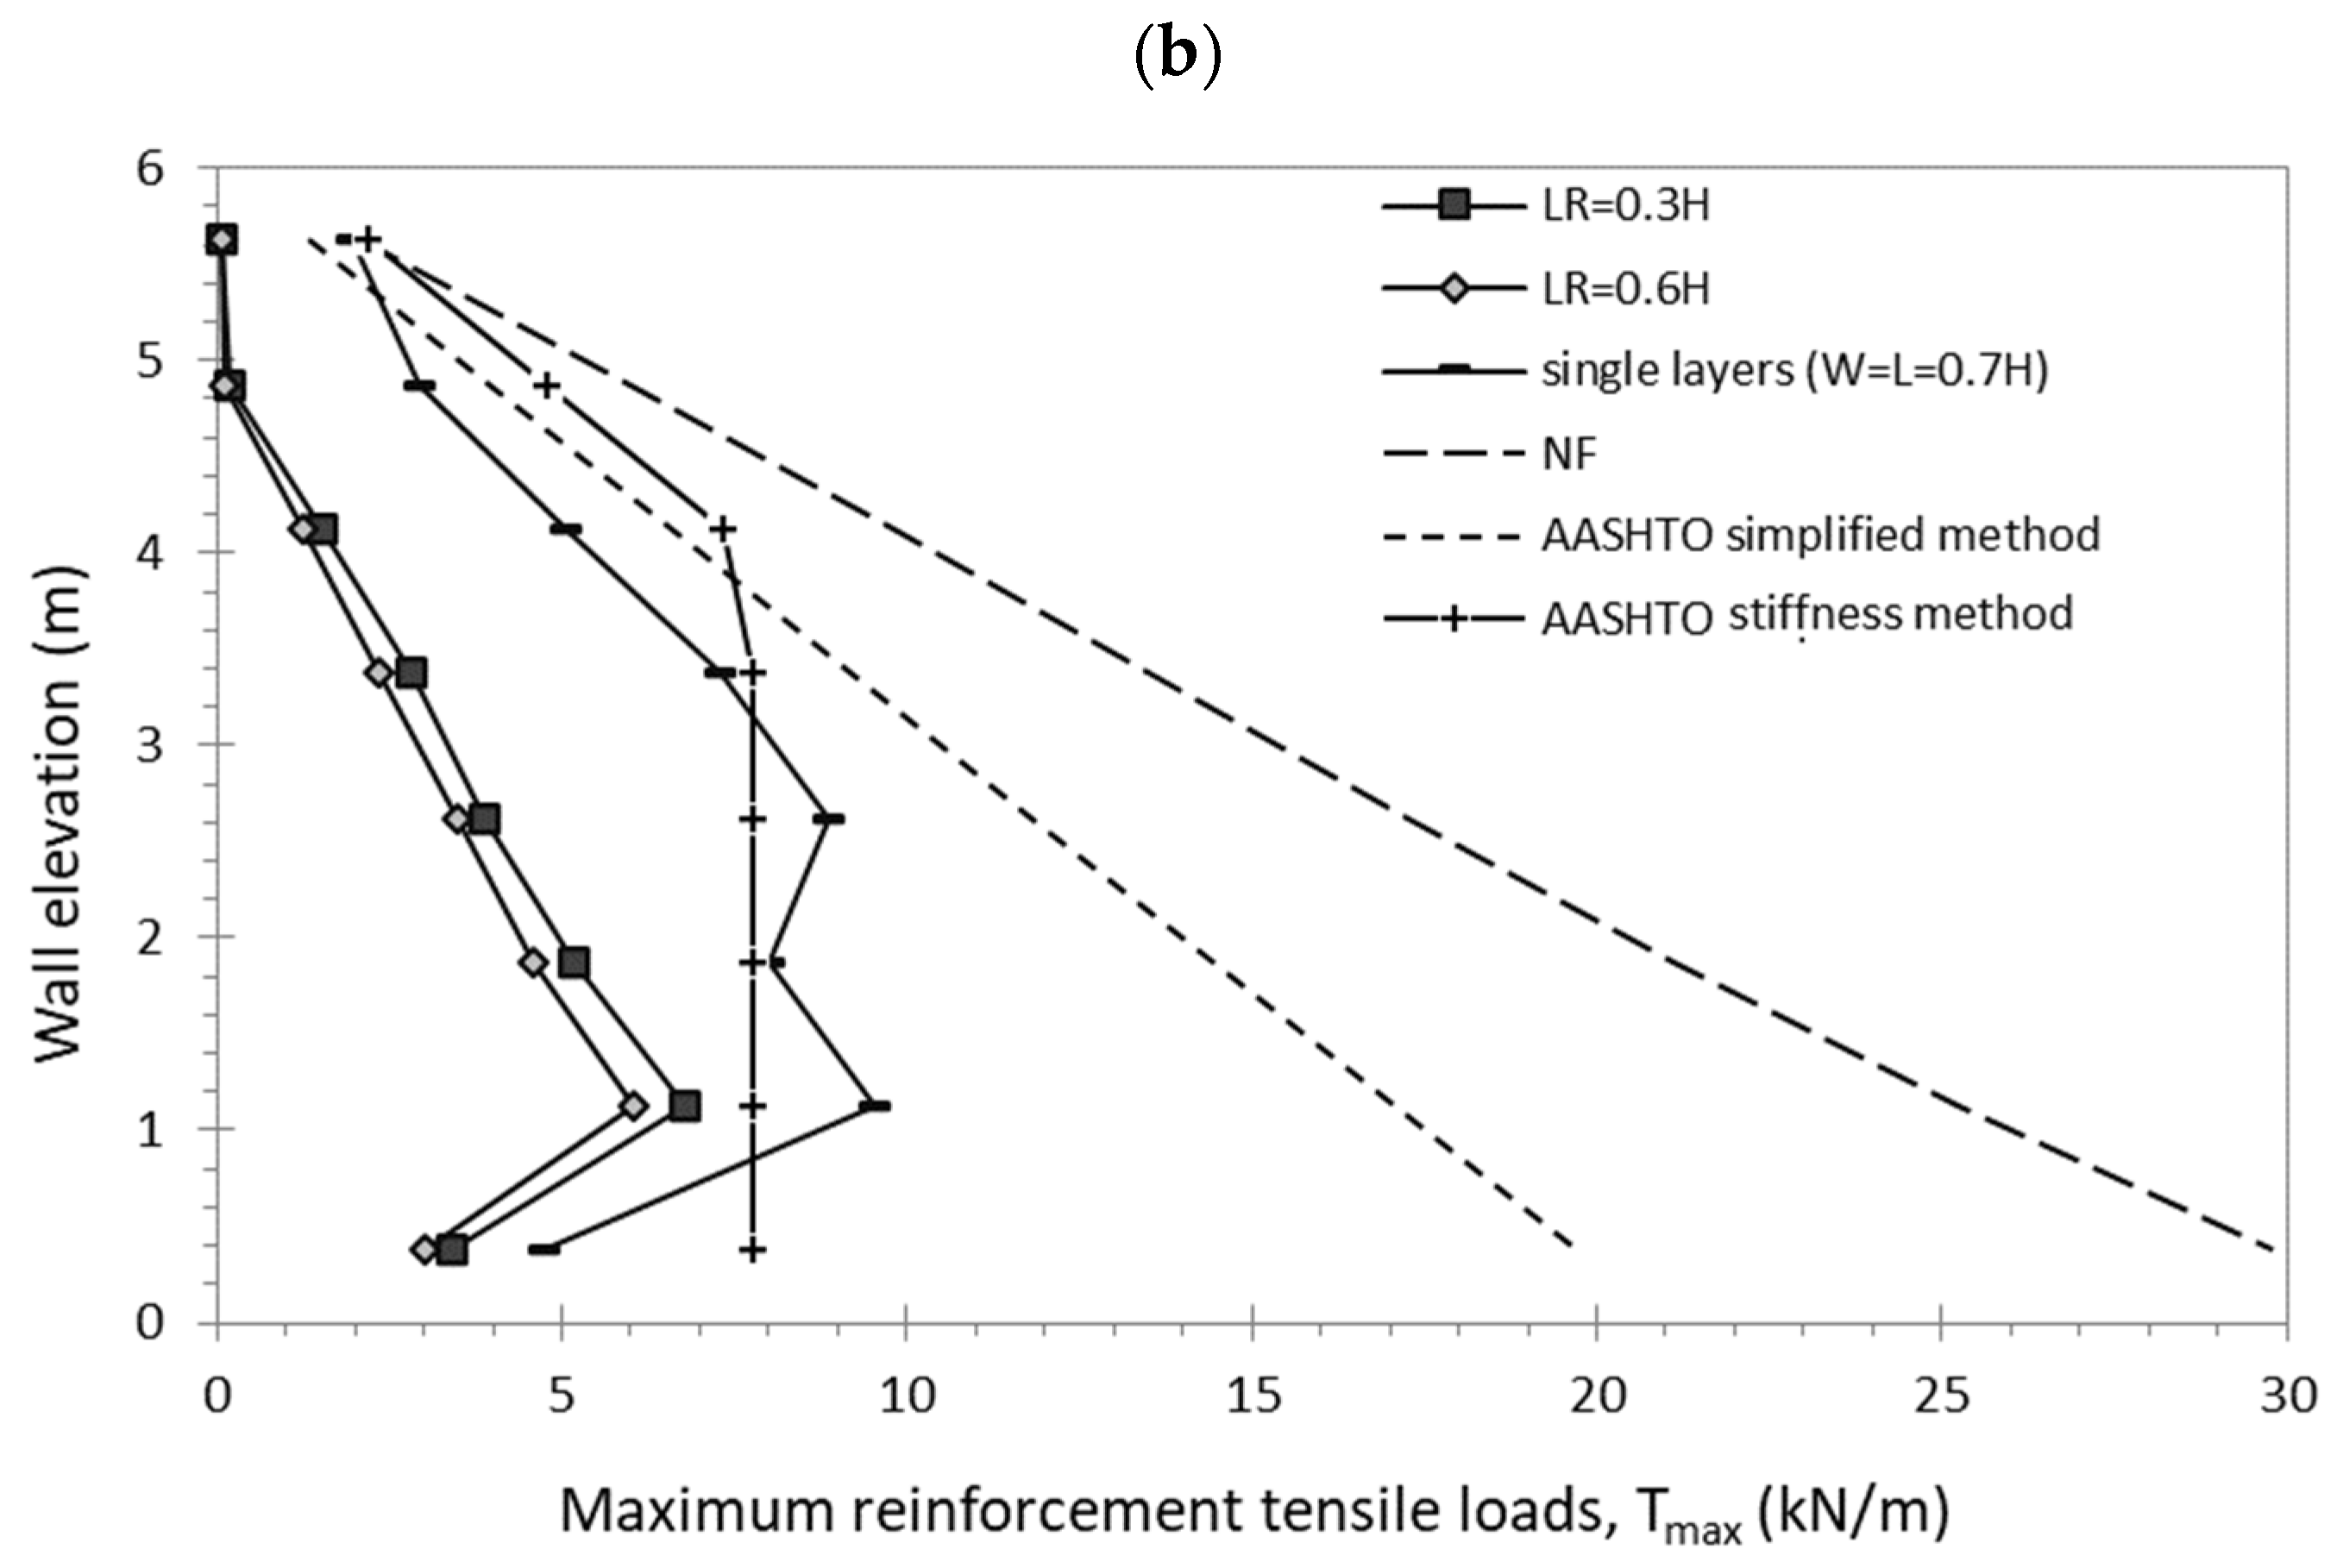
Figure 17 presents the maximum numerically computed tensile loads and loads computed using the closed-form analytical methods recommended in the American (AASHTO Simplified Method and AASHTO Stiffness Method) and French (NF Coherent Gravity Method; NF P94-270) design codes [13,29], respectively. As expected from previous results, the tensile loads become less with decreasing interaction distance Di. Differences in numerical results for Di = 0 cases with and without connected reinforcement layers are negligible from a practical point of view. The single layers case produced higher maximum tensile loads values compared to other cases because the lesser yielding structural scenario is generated. The two design methods (AASHTO Simplified Method and NF P94-270 Coherent Gravity Method) give excessively conservative tensile loads that increase in value and conservativeness with depth. The AASHTO Simplified Stiffness Method provides a small improvement in the magnitude and distribution of Tmaximum predictions than the other design methods, but remain non-conservative with depth for the single layers cases.

3.3. Effect of the Pre-Tensioning (Ti)

Figure 18 presents the computed facing displacements at the end of construction for the different pre-tension load cases. The plots show that the wall displacements decrease more than 50% when increasing the pre-tension load. A practical observation from these plots is that it may be possible to achieve an almost vertical facing alignment by applying a pre-tension load in the range of Ti = 0.5 kN/strip (i.e., 2 kN/m in the model) and 1 kN/strip (i.e., 4 kN/m in the model) for all reinforcement layers, assuming all other factors including method and good quality of construction remain the same.
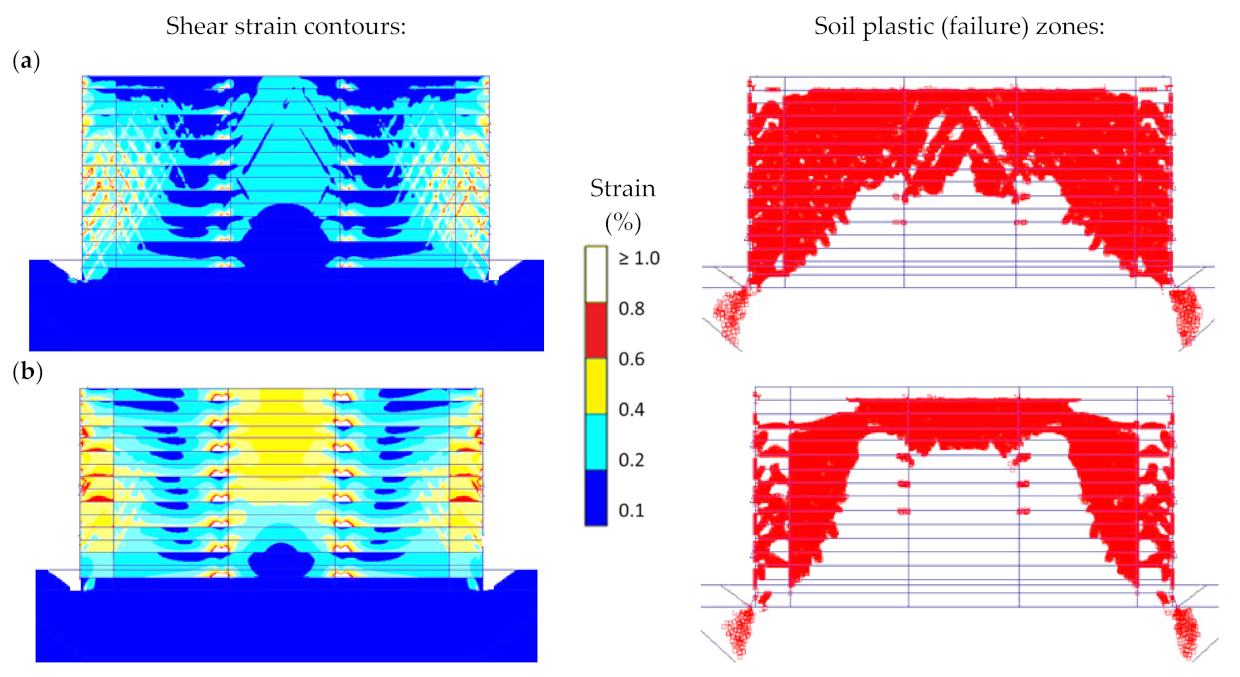
Figure 19 presents the contour plots of shear strain development and plastic (failure) zones generation for the Di = 0.6H case at EoC with and without pre-tensioning. The achieved internal soil shear zones fall within the 0–1% strain range. As shown, there is a reduction in shear strains and zones of plasticity in the reinforced soil zone with higher pre-tensioning load (i.e., tension points somehow overlap plastic points). The shear strain plots show that load transfer between the soil and reinforcement extends to the tail of the reinforcement layers for the pre-tension cases which is not the case for the no-tension case (see Figure 8a).
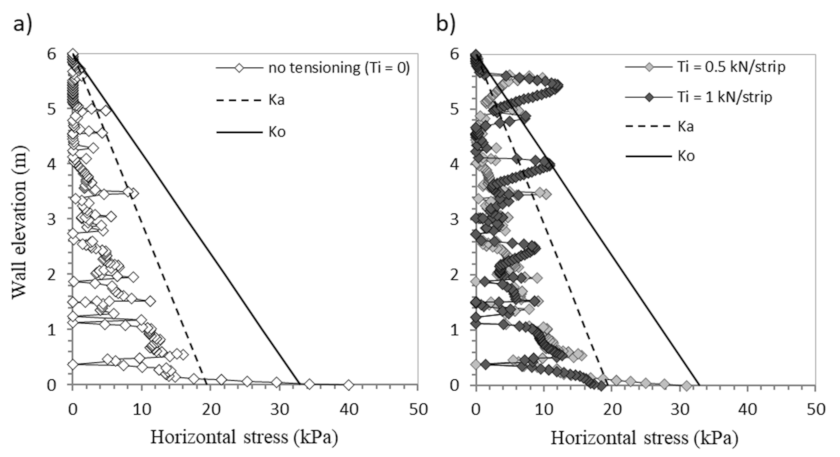
Horizontal earth pressures acting at the back of the facing are presented in Figure 20. Sharp jumps can be observed in the pressure profiles against the facing with higher pre-tensioning load at the top of the wall and the opposite occurred at the bottom of the wall.
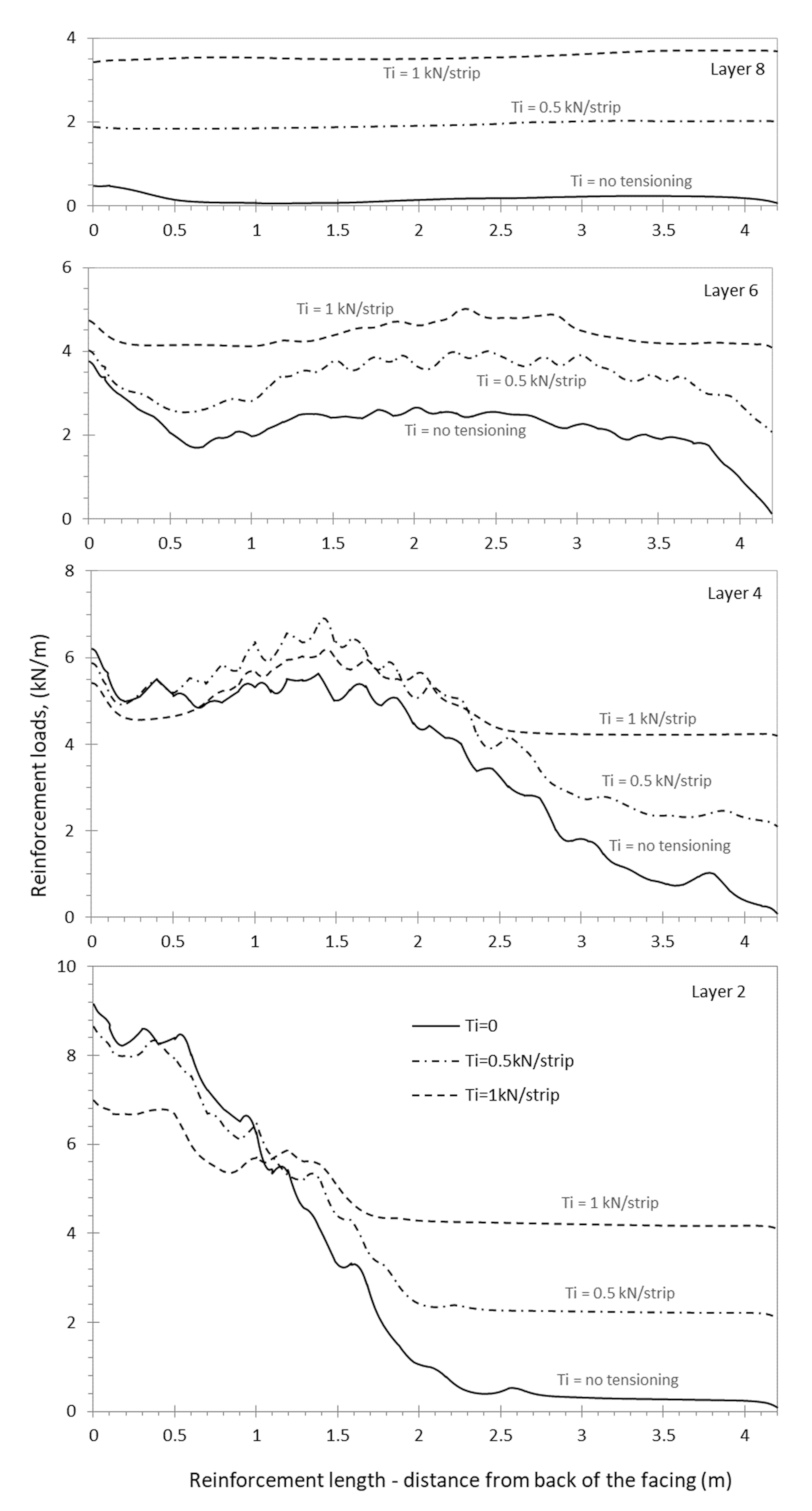
Figure 21 shows the computed reinforcement tensile loads for the Di = 0.6H base case at the end of construction. A reinforcement tensile loads redistribution was generated due to strip pre-tensioning. For the top third of the structure (see layers 6 and 8), the pre-tension load of 1 kN/strip exceeds the load that is naturally developed in the case of no-tension at all locations along the strips, whereas the no-tension case resulted in a higher connection load over the bottom half of the structure.

3.4. Effect of the Soil–Polymeric Interaction (Ri)

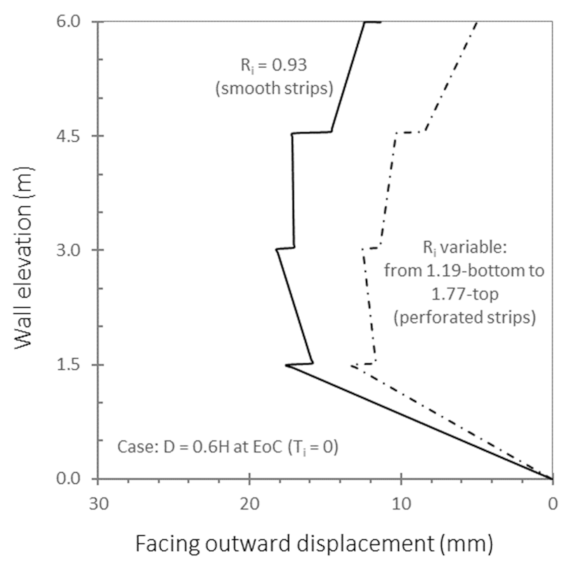
Numerical results assuming a variable and significantly higher soil–polymeric strength and stiffness interaction than for cases investigated thus far are shown in Figure 22. The data plots show that facing displacements are up to about 30% less when perforated reinforcement strips are used.
The computed plastic (failure) zones at the end of construction are presented in Figure 23. There is a detectable reduction in the size of the plastic zones for the case with larger Ri values (i.e., greater interface of polymeric–soil strength and stiffness) compared with small and constant Ri values (see Figure 23a).
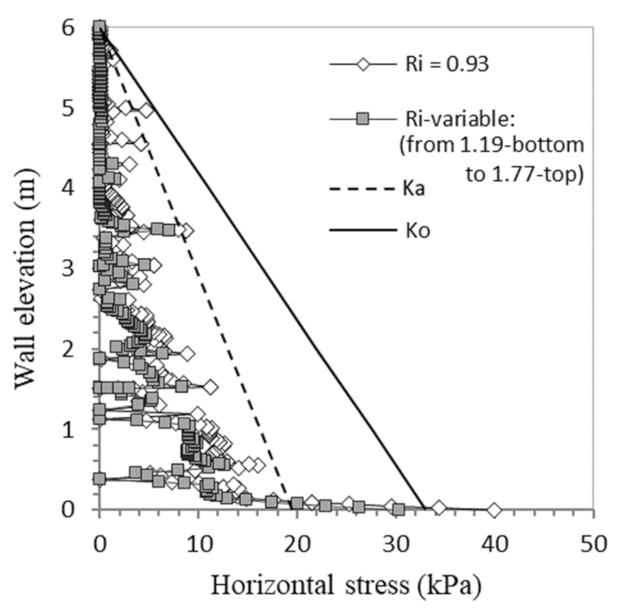
The horizontal earth pressure generated from the facings is presented in Figure 24. Record low values were observed when the perforated polymeric strips were used compared with the smooth strips case. Small but detectable reductions in reinforcement loads were also detectable for the perforated strips as shown in Figure 25 with the exception of the top layer where soil confining pressure is least. The computed maximum strain for both cases is about 1%, which is a typical maximum value observed in instrumented and monitored field walls under operational (EoC) conditions by Miyata et al. [26].

4. Conclusions

Numerical simulation of a pair of idealized 6 m high back-to-back reinforced soil walls constructed with polymeric reinforcement strips are reported. The results of the simulation show that back-to-back reinforced soil walls behave jointly when they are far apart, and also interact with each other when they are close and overlapping. The FEM results demonstrate that the length of the reinforcement (L = 0.7H) in the overlapping case (LR > 0.3H) complies with what is recommended by FHWA (L ≥ 0.6H). Back-to-back reinforced soil walls with single layers of reinforcements that are connected to both wall facings produce a lesser yielding structural scenario, resulting in much higher reinforcement tensions than the other cases. This is conceptually consistent with those of FHWA design guideline, but without achieving in the modelled cases with polymeric strip reinforcements any global at-rest stress state. The average lateral pressure at the facing of the reinforced zone is close to the theoretical active Rankine lateral thrust when the interaction distance (Di) is large except for the special case with the single layers. The interaction distance will change the location and shape of the critical failure surface, and the distribution of plastic points. The comparison of the Tmaximum for each method shows that the AASHTO Simplified Method is the most conservative (i.e., safest for design), the FEM Method and AASHTO Stiffness Method are similar and the least conservative, and the results of the NF P94-270 fall generally between the results using these three methods.
The polymeric strip installation procedure according to the pre-tension load applied to polymeric strips during construction as well as the continuous strip installation from one face to the other opposite face can have a significant effect on the quantitative behavior of these walls at end-of-construction (working stress) conditions. For example, very modest pre-tensioning loads may assist to maintain a target vertical or near-vertical facing panels alignment. Compared with the no-pretension cases, pre-tensioning of strip reinforcements did generate larger tensile loads in the reinforcement layers and a redistribution of tensile loads particularly at the back of the layers. In order to achieve improvements in wall performance due to pre-tensioning at the time of construction, it may be necessary to use a tensioning device that can measure, control, and apply uniform or properly distributed initial tension load to all reinforcement layers at the back anchorage point.
Compared with smooth strips, polymeric strips with relatively higher interface friction reduced facing displacements by up to about 30% and reinforcement loads by small but detectable amounts. While not investigated in the current study, there is evidence that pull-out capacity is enhanced using the perforated polymeric strips. This has the practical benefit of improving the margin of safety for the pull-out limit state in conventional design practice.
Hence, the effect of the pre-tensioning and soil-reinforcement interaction provides a support for the basic point which is the distance between the back of the reinforced soil zones for the two opposing walls. This procedure can be utilized under the guidance of the designers of back-to-back reinforced soil walls to improve the behavior of these structures.

Author Contributions

Conceptualization, A.B. and I.P.D.; methodology, A.B. and I.P.D.; software, A.B. and I.P.D.; validation, A.B.; investigation, A.B. and I.P.D.; writing—original draft preparation, A.B. and I.P.D.; writing—review and editing, I.P.D.; visualization, A.B. and I.P.D.; supervision, I.P.D. and M.N.H. All authors have read and agreed to the published version of the manuscript.

Funding

This research received no external funding.

Institutional Review Board Statement

Not applicable.

Informed Consent Statement

Not applicable.

Data Availability Statement

Not applicable.

Acknowledgments

The authors wish to acknowledge the support of the Algerian Ministry of Higher Education and Scientific Research, the Universitat Politècnica de Catalunya-BarcelonaTech (DECA-UPC), the support of the International Centre for Numerical Methods in Engineering (CIMNE) Severo Ochoa Centre of Excellence (2019-2023), and GECO Industrial (Korea, Rep.) for providing data for polymeric straps (FASTEN products) from reliability assessment testing records.

Conflicts of Interest

The authors declare no conflict of interest.

References

  1. Damians, I.P.; Bathurst, R.J.; Adroguer, E.; Josa, A.; Lloret, A. Sustainability assessment of earth retaining wall structures. ICE Environ. Geotech. 2018, 5, 187–203. [Google Scholar] [CrossRef]
  2. Berg, R.R.; Christopher, B.R.; Samtani, N.C. Design of Mechanically Stabilized Earth Walls and Reinforced Soil Slopes, No. FHWA-NHI-10-024; National Highway Institute, Federal Highway Administration: Washington, DC, USA, 2009. [Google Scholar]
  3. Han, J.; Leshchinsky, D. Analysis of back-to-back mechanically stabilized earth. Geotext. Geomembr. 2010, 28, 262–267. [Google Scholar] [CrossRef]
  4. El-Sherbiny, R.; Ibrahim, E.; Salem, A. Stability of back-to-back mechanically stabilized earth walls. In Geo-Congress Stability and Performance of Slopes and Embankments III; American Society of Civil Engineers (ASCE): Reston, VA, USA, 2013; pp. 555–565. [Google Scholar]
  5. Benmebarek, S.; Attallaoui, S.; Benmebarek, N. Interaction analysis of back-to-back mechanically stabilized earth walls. J Rock Mech. Geotech. Eng. 2016, 8, 697–702. [Google Scholar] [CrossRef] [Green Version]
  6. Benmebarek, S.; Djabri, M. FEM to investigate the effect of overlapping-reinforcement on the performance of back-to-back embankment bridge approaches under self-weight. Transp. Geotech. 2017, 11, 17–26. [Google Scholar] [CrossRef]
  7. Sravanam, S.M.; Balunaini, U.; Madhira, R.M. Behavior of Connected and Unconnected Back-to-Back Walls for Bridge Approaches. Int. J. Geomech. 2020, 20, 06020013. [Google Scholar] [CrossRef]
  8. Dram, A.; Balunaini, U.; Benmebarek, S.; Mouli, S. Earthquake response of connected and unconnected back-to-back geosynthetic-reinforced soil walls. ASCE Int. J. Geom. 2021, 21, 04021223. [Google Scholar] [CrossRef]
  9. Samee, A.A.; Yazdandoust, M.; Ghalandarzadesh, A. Performance of back-to-back MSE walls reinforced with steel strips under seismic conditions. Transp. Geot. 2021, 30, 100540. [Google Scholar] [CrossRef]
  10. EN 14475. Execution of Special Geotechnical Works—Reinforced Fill; European Committee for Standardization (CEN): Brussels, Belgium, 2006. [Google Scholar]
  11. VSL Construction Systems—VSoL® Retained Earth System. Available online: www.vsl.com (accessed on 9 February 2022).
  12. PLAXIS. PLAXIS 2D Reference Manual Version 9, PLAXIS; Delft University of Technology: Delft, The Netherlands, 2008. [Google Scholar]
  13. LRFD Bridge Design Specifications, American Association of State Highway and Transportation Officials (AASHTO), 9th ed.; AASHTO: Washington, DC, USA, 2020.
  14. BS8006-1 2010+A1. Code of Practice for Strengthened/Reinforced Soil and Other Fills; British Standards Institution (BSI): Milton Keynes, UK, 2010. [Google Scholar]
  15. Damians, I.P.; Bathurst, R.J.; Lima, J.; Lloret, A.; Josa, A. Numerical study of the use of actively-tensioned polymeric strips for reinforced soil walls. In Proceedings of the XVI European Conference on Soil Mechanics and Geotechnical Engineering, Geotechnical Engineering for Infrastructure and Development, Edinburgh, UK, 13–17 September 2015; pp. 3834–3838. [Google Scholar]
  16. Brouthen, A.; Damians, I.P.; Bathurst, R.J.; Houhou, M.N. FE analysis of the effect of soil-reinforcement interaction and reinforcement pre-tensioning on the behaviour of back-to-back polymeric strip reinforced soil walls. In Proceedings of the 7th European Geos Conference (EuroGeo7), Warsaw, Poland, 4–7 September 2022. [Google Scholar]
  17. Damians, I.P.; Bathurst, R.J.; Josa, A.; Lloret, A. Vertical facing panel-joint gap analysis for steel-reinforced soil walls. Int. J. Geomech. 2016, 16, 04015103. [Google Scholar] [CrossRef] [Green Version]
  18. Damians, I.P.; Bathurst, R.J.; Josa, A.; Lloret, A.; Albuquerque, P.J.R. Vertical facing loads in steel reinforced soil walls. J. Geotech. Geoenviron. Eng. 2013, 139, 1419–1432. [Google Scholar] [CrossRef]
  19. Damians, I.P.; Bathurst, R.J.; Josa, A.; Lloret, A. Numerical study of the influence of foundation compressibility and reinforcement stiffness on the behavior of reinforced soil walls. Int. J. Geotech. Eng. 2014, 8, 247–259. [Google Scholar] [CrossRef]
  20. GECO Industrial Co. Ltd. Available online: http://gecoind.com/en/product/fasten.php (accessed on 9 February 2022).
  21. Runser, D.J.; Fox, P.J.; Bourdeau, P.L. Field performance of a 17 m-high reinforced soil retaining wall. Geosynth. Int. 2001, 8, 367–391. [Google Scholar] [CrossRef]
  22. Damians, I.P.; Bathurst, R.J.; Josa, A.; Lloret, A. Numerical analysis of an instrumented steel reinforced soil wall. Int. J. Geomech. 2015, 15, 04014037. [Google Scholar] [CrossRef]
  23. Yu, Y.; Bathurst, R.J.; Miyata, Y. Numerical analysis of a mechanically stabilized earth wall reinforced with steel strips. Soils Found 2015, 55, 536–547. [Google Scholar] [CrossRef]
  24. Jayakrishnan, P.V. Report on Full Scale Instrumented MacRes Wall at Jundiai-Brazil; Officine Maccaferri S.p.A.: Bologna, Italy, 2013. [Google Scholar]
  25. Capilleri, P.P.; Ferraiolo, F.; Motta, E.; Scotto, M.; Todaro, M. Static and dynamic analysis of two mechanically stabilized earth walls. Geosynth. Int. 2019, 26, 26–41. [Google Scholar] [CrossRef]
  26. Miyata, Y.; Bathurst, R.J.; Allen, T.M. Evaluation of tensile load model accuracy for PET strap MSE walls. Geosynth. Int. 2018, 25, 656–671. [Google Scholar] [CrossRef]
  27. Won, M.S.; Kim, Y.S. Internal deformation behavior of geosynthetic-reinforced soil walls. Geotex. Geomem. 2007, 25, 10–22. [Google Scholar] [CrossRef]
  28. Huang, B.; Bathurst, R.J.; Hatami, K.; Allen, T.M. Influence of toe restraint on reinforced soil segmental walls. Cana. Geotech. J. 2010, 47, 885–904. [Google Scholar] [CrossRef]
  29. NF P 94-270. Calcul Géotechnique: Ouvrages de Soustènement. Remblais Renforcés et Massifs en Soil Cloué; Norme française, Association Française de Normalisation (AFNOR): La Plaine Saint-Denis, France, 2009. [Google Scholar]
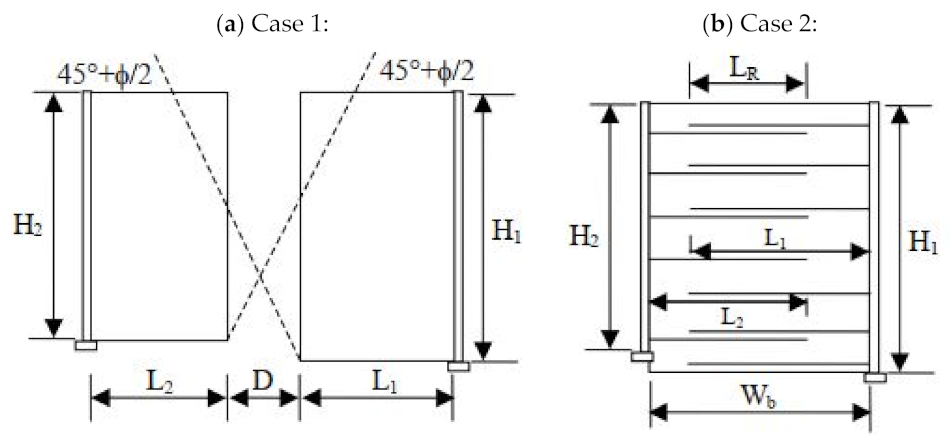
Figure 1. Back-to-back reinforced soil wall definitions: Case 1 (a) and Case 2 (b). (Source: FHWA [2]).
Infrastructures 07 00022 g001
Figure 2. On-site polymeric strip installation examples: (a) back-to-back wall case, (b) longitudinal bar back anchorage and pegs, and (c) trench and triangle anchorage. (Photographs courtesy of VSL Construction Systems—VSoL® Retained Earth System [11]).
Infrastructures 07 00022 g002
Figure 3. Detail of the FEM model and mesh for the base case with Di = 0.6H. Note: foundation soil zone has dimensions of 50 m wide and 10 m deep. (Modified from [16]).
Infrastructures 07 00022 g003
Figure 4. Polymeric strip products from GECO [20]: (a) FASTEN FS and (b) FW (perforated), and (c) typical load-extension behavior of grade 30 strip. (Modified from [16]).
Infrastructures 07 00022 g004
Figure 5. Detail of the FEM model and mesh of experimental wall used for calibration.
Infrastructures 07 00022 g005
Figure 6. Comparison between the FE model results and the experimental data [24]: (a) maximum reinforcement axial force per strip, and (b) distribution of axial force along reinforcement strips.
Infrastructures 07 00022 g006
Figure 7. Facing displacements at the end of construction (EoC) for different interaction distances (Di) between the back of the reinforced soil zone for opposite walls: (a) Di > 0 and Di = 0, and (b) Di < 0.
Infrastructures 07 00022 g007
Figure 8. Shear strain contours at end of construction (EoC) for walls with different interaction distance (Di) between the back of the reinforced soil zones for opposite walls. Note: results ranging from 0 to 1%.
Infrastructures 07 00022 g008aInfrastructures 07 00022 g008b
Figure 9. Shear strain contours at failure with the c-ϕ reduction at end of construction (EoC) for walls with different interaction distances (Di) between the back of the reinforced soil zones for opposite walls. Note: results range from 0–1%.
Infrastructures 07 00022 g009aInfrastructures 07 00022 g009b
Figure 10. Plastic zones (Mohr–Coulomb points) in the soil at the end of construction (EoC) for walls with different interaction distances. (Di) between the back of the reinforced soil zones for opposite walls. (Note: white zones on top of the models represent the location of tension cut-off points).
Infrastructures 07 00022 g010
Figure 11. Plastic zones (Mohr–Coulomb points) in the soil at failure with the c-ϕ reduction method at end of construction (EoC) for walls with different interaction distance (Di) between the back of the reinforced soil zones for opposite walls. (Note: white zones on top of the models represent the location of tension cut-off points).
Infrastructures 07 00022 g011
Figure 12. Lateral earth pressure at the facing at the end of construction (EoC) for different interaction distances (Di) between back-to-back reinforced soil walls: (a) Di > 0, (b) Di = 0, and (c,d) Di < 0.
Infrastructures 07 00022 g012
Figure 13. Lateral earth pressure at 1 m from the back of the facing at the end of construction (EoC) for different interaction distances (Di) between back-to-back reinforced soil walls: (a) Di > 0, (b) Di = 0, and (c,d) Di < 0.
Infrastructures 07 00022 g013
Figure 14. Lateral earth pressure behind the reinforcements (i.e., at L-distance from facing) at the end of construction (EoC) for different interaction distances (Di) between back-to-back reinforced soil walls: (a) Di > 0 and (b) Di = 0.
Infrastructures 07 00022 g014
Figure 15. Total earth pressure at the facing, at 1 m from the facing, and behind the reinforcements (i.e., at L-distance from the facing) at the end of construction (EoC) for different interaction distances (Di) between back-to-back reinforced soil walls.
Infrastructures 07 00022 g015
Figure 16. Reinforcement loads at end of construction (EoC) for walls with different interaction distances (Di) between the back of the reinforced soil zones for opposite walls: (a) Di > 0 and Di = 0, and (b) Di < 0.
Infrastructures 07 00022 g016
Figure 17. Numerical maximum tensile load for walls with different interaction distances (Di) between the back of the reinforced soil zones for opposite walls: (a) Di > 0 and Di = 0, and (b) Di < 0, and both cases compared with maximum tensile loads computed using AASHTO (×2) and NF design codes.
Infrastructures 07 00022 g017aInfrastructures 07 00022 g017b
Figure 18. Facing displacements for Di = 0.6H case at the end of construction (EoC) and different pre-tensioning scenarios. (Modified from [16]).
Infrastructures 07 00022 g018
Figure 19. Shear strain contours and plastic (failure) zones in the soil at the end of construction for the Di = 0.6H case. Strip pre-tension loads: (a) Ti = 0.5 kN/strip and (b) 1 kN/strip. Note: results range from 0–1% for shear strain contours, and white zones on top of the models represent the location of tension cut-off points for soil plastic zones). (Modified from [16]).
Infrastructures 07 00022 g019
Figure 20. Horizontal earth pressure at the facing for the Di = 0.6H case at the end of construction (EoC): (a) no tension case and (b) different pre-tensioning loads.
Infrastructures 07 00022 g020
Figure 21. Reinforcement loads for Di = 0.6H case at the end of construction (EoC) and different pre-tensioning loads. (Modified from [16]).
Infrastructures 07 00022 g021
Figure 22. Facing displacements computed at the end of construction (EoC) using different polymeric–soil interface strengths and stiffness (Ri -factor) for the Di = 0.6H case with no pre-tensioning. (Modified from [16]).
Infrastructures 07 00022 g022
Figure 23. Plastic zones (Mohr-Coulomb points) at end of construction for Di = 0.6H case with no pre-tensioning and polymeric–soil interface factor assumptions: (a) Ri = 0.93 (constant), and (b) Ri = from 1.19 to 1.77 (variable). (Note: white zones on top of the models represent tension cut-off points location). (Modified from [16]).
Infrastructures 07 00022 g023
Figure 24. Horizontal earth pressure at the facing for the Di = 0.6H case at the end of construction (EoC) using different polymeric–soil interface strengths and stiffness (Ri -factor) for the Di = 0.6H case with no pre-tensioning.
Infrastructures 07 00022 g024
Figure 25. Reinforcement loads at end of construction (EoC) using different polymeric–soil interface strengths and stiffness (Ri -factor) for the Di = 0.6H case with no pre-tensioning. (Modified from [16]).
Infrastructures 07 00022 g025
Table 1. Model properties for backfill, foundation soil, and pavement materials.
ParameterBackfillFoundationRoad Pavement (20 cm Thick)
(Distance from Face (a)):
>1 m<1 m
Unit weight, γ (kN/m3)182023
Friction angle (b), ϕ (°)4440-
Dilatancy angle, ψ (°)1410-
Cohesion, c (kPa)110-
Elastic modulus, E (MPa)50251000 (c)3500
Poisson’s ratio, ν (-)0.30.30.35
(a) Backfill properties were assumed to vary due to lower compaction effort near the facing. (b) Peak friction angle assuming plane-strain boundary conditions (equivalent to about 36–37° under triaxial conditions [17]). (c) Foundation assumed to be rigid enough to not generate undesired/out of this paper’s scope instabilities. Extended sensitivities regarding foundation stiffness variations can be found in Damians et al. [17,18,19].
Table 2. Precast concrete panel and bearing pad (joint) properties.
ParameterFacing Panels (Concrete)Bearing Pads (HPDE)
Axial stiffness, EA (MN/m)60001.1
Bearing stiffness, EI (kN/m2/m)11,0002.1
Weight, w (kN/m/m)4.50.1
Poisson’s ratio, ν (-)0.150.40
Table 3. Interface material properties.
ParametersSoil-Facing InterfaceSoil-Reinforcement Interface:
Smooth StripPerforated Strip
(Distance from Back of the Facing):
>1 m<1 m>1 m<1 m
Cohesion, ci (kPa)0.30.931.19 to 1.77
Friction angle, ϕi (°)164249 to 60
Dilatancy angle, ψi (°)0014
Shear modulus, Gi (MPa)0.98.416.727.0–60.413.5–30.2
Elastic modulus, Ei (MPa)2.5244878.3–175.239.2–87.6
Interface strength–stiffness reduction factor, Ri (Equation (7))0.30.93variable: from 1.19 (bottom) to 1.77 (top)
Table 4. Soil properties (taken from [24]).
ParameterSandy BackfillSoil below and behind the Wall
Material modelMohr–CoulombMohr–Coulomb
Unit weight, γ (kN/m3)1718.5
Elastic modulus, E (MPa)5060
Poisson’s ratio, ν (-)0.30.3
Cohesion, c (kPa)020
Friction angle, ϕ (°)4238
Publisher’s Note: MDPI stays neutral with regard to jurisdictional claims in published maps and institutional affiliations.