Abstract
For the safe and efficient operation of dams, frequent monitoring and maintenance are required. These are usually expensive, time consuming, and cumbersome. To alleviate these issues, we propose applying a wave-based scheme for the location and quantification of damages in dams. To obtain high-resolution “interpretable” images of the damaged regions, we drew inspiration from non-linear full-multigrid methods for inverse problems and applied a new cyclic multi-stage full-waveform inversion (FWI) scheme. Our approach is less susceptible to the stability issues faced by the standard FWI scheme when dealing with ill-posed problems. In this paper, we first selected an optimal acquisition setup and then applied synthetic data to demonstrate the capability of our approach in identifying a series of anomalies in dams by a mixture of reflection and transmission tomography. The results had sufficient robustness, showing the prospects of application in the field of non-destructive testing of dams.
1. Introduction
Tomography is a well-established technique in the non-destructive testing of bodies and structures. It is based on a technique in which signals of a particular physical domain are sent through a system. Computer programs evaluate the measurements of the reflected and transmitted signals and visualize the interior conditions, e.g., by the prognosis of the material distribution inside. In the analysis of structures in civil engineering, most tomographic methods are based on mechanical waves. This technique is well known, e.g., in the field of geotechnical exploration via seismic tomography [1,2,3,4,5,6,7,8,9,10,11,12,13,14]. The wave equation is the basis, and by an inversion, the layers of different densities and stiffnesses are detected by reflection tomography. The current paper puts forward the first steps in the adoption of this technique for the assessment of the structural condition of dams. As is well known, dams are important structures employed for the generation of hydro-electricity, the provision of water supply, and flood defense. However, a large number of the dams that are in operation today were built some decades ago, and their structural condition is not properly known. The effects of damage, aging, chemical reactions, and internal erosion may have deteriorated the material properties. It is of the utmost importance to assess the structural condition carefully to make further trustworthy predictions of the structure’s reliability [15]. Unfortunately, the conventional inspection methods are generally time consuming, expensive, and not precise enough; see, for example [16]. To tackle these challenges, a series of methods was proposed by [17,18,19,20,21,22,23,24,25,26,27,28]. These methods were designed to find anomalies in technical structures, mainly for coupled hydro–mechanical systems or strongly related systems.
Using classic ultrasonic exploration methods, such as the synthetic aperture focusing technique (SAFT) or the total focusing method (TFM), will not provide the desired penetration depth, and only areas close to the surface might be assessed, as all the information of the ultrasonic waves is not used. However, with the recent technological improvements in computational capabilities and transducer technology, the usage of the FWI originating from seismic wave probing may be extended to structures of smaller scales than those typical in sub-surface exploration. The challenge in dealing with this is that visibly shorter wavelengths occur, which, first of all, require efficient solvers of the wave equation itself. Moreover, this is a critical effect using higher excitation frequencies that results in an increase in the ill-posedness of the parameter identification problem (finding anomalies in dams). A straight-forward application of FWI seems, therefore, impossible, and algorithmic extensions need to be made, which is the main contribution of this work.
FWI, initially proposed by [29,30] and further developed in the last few decades, can be regarded as a modern seismic imaging technique. As the subsurface properties do influence waves, in particular, pressure and shear waves, they can be utilized to probe heterogeneous domains. FWI is actually an inverse parameter identification problem based on the wave equation. It may consider recorded signals as the input for a fixed time according to some dynamic excitation. The information in the signals includes the effects of reflection, refraction, diffusion, and amplitude. Thus, they are comparatively rich in information to infer the mediums’ material parameters. The approach of this method, based on the minimization of the misfit between recorded and numerically generated data (or a regularized version of them), allows for the estimation of the parameters influencing the propagation of the seismic body waves’ velocities and density [31]. From the wave velocities, the Lamé parameters, defining the stress tensor, can be derived. FWI offers unique advantages in terms of flexibility and increased resolution (e.g., compared to linearized approaches) and is, hence, capable of imaging the arbitrarily heterogeneous compression and shear wave velocity profiles of objects of any shape [2].
Based on the successful application of full-waveform inversion (FWI) in geotechnical exploration and non-destructive testing (NDT) [32,33,34,35], especially with subsurface and engineering structures, the presented method extends this with an application to dams. In addition to this, the algorithm was formulated as a cyclic multi-frequency stage inversion exploiting the potentials of FWI in a robust extraction of the complete waveform information to produce high-resolution images.
Of course, inverting wave equations is itself computationally demanding. Embedding FWI into a cyclic multi-frequency-stage algorithm increases the demands even more. On the other hand, no other known inspection tool offers such a high accuracy that the increased computational demands are justified; compare, e.g., [16,36].
In the upcoming sections of this paper, we take an in-depth look at the following:
- Materials and methods: the formulation/algorithm of the forward model and its boundary conditions, the inverse model, and the inversion process.
- Numerical simulation: the geometry of the dam, the acquisition geometry, the wave parameters, and the cyclic multi-stage implementation under different conditions.
- Results: FWI results for different acquisition geometries, cyclic multi-stage inversion, and for different levels of noise.
- Conclusion: a summary of the applicability of our approach to identifying damages in dams.
2. Materials and Methods
The paper at hand proposes the characterization of a dam’s structural properties by applying FWI. Therefore, both the forward and inverse model are presented in the sequel, including some computational details and the extension of the existing theory by introducing a cyclic multi-frequency-stage inversion scheme.
2.1. Forward Model
The wave equation belongs to the class of hyperbolic partial differential equations. The equation is merely describing the propagation of a wave through a medium. Its solution gives the wavefield at given time and space. The full-waveform inversion is mainly making use of the wave equation formulated as the acoustic wave equation or the elastic wave equation.
The system of partial differential equations in Equation (1) is characterizing the elastic waves propagating in a 2D isotropic linear-elastic medium. Furthermore, only non-zero displacements in the horizontal direction and depth (x-z-plane) are described [1,37].
where i and j represent the directions x or z and perfectly matched layers are used as the boundary conditions. are the particles velocities, t is the time, are the Lamé parameters, is the density, are the stress tensor components and are the directed body force. Accordingly, the particle velocities can be calculated from the Lamé parameters using
The elastic wave equation is solved numerically for the particle velocities , stresses , density and Lamé parameters () using a time domain finite difference scheme. It is discretized in time and space, with each of the parameters placed on a staggered grid [38,39]. The discretization needs to satisfy certain spatial and temporal sampling conditions in order to avoid numerical artifacts and instabilities in the finite difference calculation.
The grid spacing is chosen by the number of grid points for the smallest wavelength in the system. This approach is undertaken to prevent grid dispersion in the simulation. Furthermore, the Courant–Friedrichs–Lewy criterion (CFL) [40] needs to be fulfilled in order to stabilize the simulations, and the time stepping needs to take less than the time needed for the wave to travel between two neighboring grid points with distance . Due to the complex free surface of the dam, we apply the Improved Vacuum Formulation (IVF), proposed by [41] at the air-medium boundary (i.e., top) and the convolutional perfectly matched layers (C-PML) are applied at the other boundaries to ensure stability and accuracy of the results.
2.2. Inverse Analysis
The main part of the inverse analysis is the definition of the forward operator, also called the parameter-to-solution mapping. In this publication, it uses the following notations
Here, X is a finite dimensional space of parameters (describing material distributions, and ), Y is a finite dimensional space of time-dependent measurements. Furthermore, and are denoting the model parameters (material distributions) and the model responses, i.e., wavefields at the sensor locations.
The main concept behind the inverse analysis is formulated through the solution of the following nonlinear equation:
where comprises measurement errors and model uncertainties. As the solution of Equation (4) may not exist as the measured data are not in the range of F, we follow a least-square solution approach, as given in Equation (5). As a measure for the misfit between modeled and field data, an objective function based on the -norm of the data residuals is therefore defined:
where the excitation of the waves is achieved with frequency .
We use an iterative procedure which results in a discrete gradient-type procedure
where are the iterates at iteration n, is the step length, is the gradient and an approximation of the Hessian matrix at iteration n. An inexact parabolic line search is employed when estimating the [42], while the time-domain gradients are calculated using the adjoint-state method as presented in [43,44,45,46,47]. For the Hessian, either the identity is chosen, which renders the algorithm a steepest-descent method, or we choose an approximation according to a Broyden–Fletcher–Goldfarb–Shanno (BFGS) updating scheme.
The gradient direction is computed by solving the stress-displacement () elastic wave formulation adjoint problem in Equation (7). Here, the perturbation caused by anomaly in the data space is back propagated from the receivers into the unperturbed medium [48]
The full-waveform inversion procedure is implemented in the DENISE (subwavelength DEtail resolving Nonlinear Iterative SEismic inversion) 2D time domain C-based code [49] and shown by the flow chart in Figure 1.
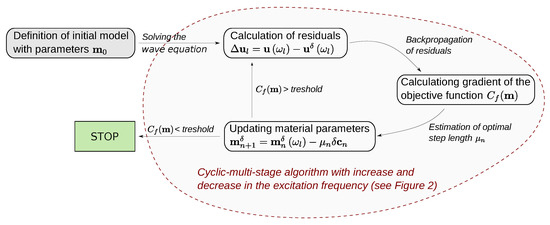
Figure 1.
Flow chart of full-waveform inversion procedure.
Inherent to all inverse problems in engineering are the “ill-posedness” and the non-linearity of the problem, which need to be attenuated. In the case of FWI, the first step is to formulate a good starting model, where the model properties are close to a global minimum. Therefore, the parts of the long wavelengths from the “true” model should be represented by the starting model as satisfactorily as possible. Additionally, pre-conditioning or regularization should be applied. A reliable tool was found when carrying out the inversion at different stages, i.e., for different excitation frequencies, to cope with the non-linearity and ill-posedness of the problem. Each stage is carried out with a certain frequency, and according to [50], the low frequencies are more linearly related to the model perturbations compared to high frequencies. Thus, the inversion stages start with lower frequencies and increase to higher-frequency components of the data. The inversion output of each stage is used as the input for the next stage; thus, regions of high and low particle velocities are being captured. As mentioned, higher stages have the advantage of providing a better resolution; however, stability of the inversion deteriorates even with careful and early stopping. We observe divergence at many positions in the domain, which finally would lead to incorrect interpretations. To mitigate this and to further regularize, the process is repeated by going back to lower frequencies and then increasing again. This results in a cyclic multi-stage algorithm, which embraces the updating of the model parameters by setting borders in the frequency range; described here as cycles. A graphical sketch of the idea of this algorithm is given in Figure 2. As shown, on each intersection with a horizontal line, a FWI is run with a different excitation frequency. Frequencies increase and then decrease in one cycle. Repeating this provides chances to obtain high-resolution identification and keeps the effects of noise and resulting artifacts in the images low. Thus, the initially strongly ill-posed problem could be regularized sufficiently so that it might be applied in practice. In particular, for the first cycle(s), it is recommended not to probe with the highest excitation frequencies. The last cycle should be followed by an increase towards the maximal frequency.
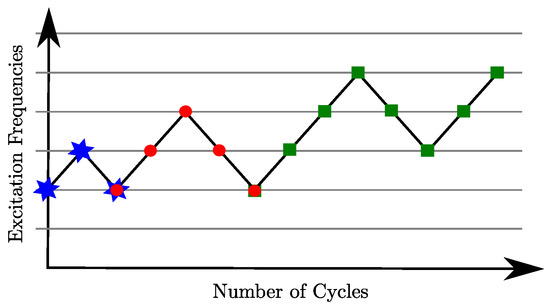
Figure 2.
Scheme of a cyclic multi-stage full-waveform inversion with three full cycles (★ 1st cycle, • 2nd cycle, ■ 3rd cycle).
3. Numerical Simulation Example
For the numerical simulation, a dam model (true model) is used, and the material properties are defined as seismic velocities and densities that are summarized in Table 1 and the true, the initial and the residual model are depicted in Figure 3. The distribution of the model parameters is given here, where the defects which ought to be detected are not contained in the initial model. The residual model is giving the difference between the true and the initial model.

Table 1.
Dam material properties for true model.
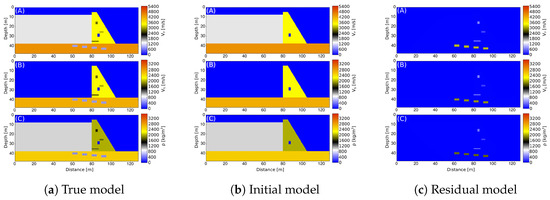
Figure 3.
Distribution of seismic velocities and density in the air, water, foundation and dam structure: (A) distribution, (B) distribution (note shear waves only travel through solids) and (C) distribution.
The wave source and sensor/receiver setups are shown in Figure 4. They are used to collect the required waveform data to perform the inversion. Hence, changes in source wave properties due to reflection, refraction, diffraction, etc., are detected by the sensors. Three different acquisition setups are considered (Figure 4) for the FWI.
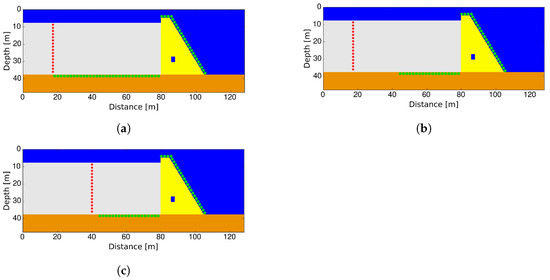
Figure 4.
Acquisition setup showing distribution of sources (★) and sensors/receivers (•) in the domain. Sensors are placed at the bottom of the reservoir to pick up reflections resulting from anomalies in the foundation. (a) Setup 1 (b) Setup 2 (c) Setup 3.
Setup 1 consists of 28 excitation sources 65 m away from the dam surface and a total of 165 sensors/receivers on the dam and the reservoir bed/foundation. Receivers are placed at an interval of m on the dam and 1 m on the foundation. Setup 2 is similar to setup 1, in the way that the same number of excitation sources is employed; however, in total, 135 sensors are used. The receivers on the dam foundation are placed within 35 m of the dam’s face. Lastly, the same numbers of sources and receivers in setup 2 are applied to setup 3; the difference here is the distance of the excitation sources from the dam’s face. The excitation sources are closer to the dam’s face (i.e., 35 m away) than in the other setups.
The acquisition geometry can be set up in practice by placing ocean bottom cables (OBC) on the reservoir floor using boats or remotely operated vehicles (ROV). These four-component receivers consist of 3-axial geophones to measure the wave speeds and a hydrophone for the pressure wavefield. In addition to these, an array of geophones can also be installed on the downstream part of the dam. Similarly, the wave sources are placed by boats/ROV and can be changed after every shot or to adapt to different acquisition geometries. The OBCs are preferred for this setup, since the effect of noise from surrounding activities or water waves are minimized this way.
The true model of the dam contains anomalies both in the structure of the dam and in the foundation. The anomalies represent weaknesses in different regions and of different sizes. In the dam structure, the top anomaly represents a 20% reduction in the parameter values , and , the second weakening has a 10% reduction and the third one (i.e., crack zone) possesses a 30% reduction. All the anomalies in the foundation are reduced by 70% in the material parameter values. The entire simulation domain has a height of 48 m and a length of 128 m. This includes the dam structure with 28 m height, the crest of the dam is m wide and it measures 19 m at the bottom. The water reservoir has a size of 30 m times 80 m, the foundation is modeled with 10 m of depth and the surrounding air is also considered, but there is no change in the air parameters included in the inversion process (they are fixed). A 2D finite difference scheme on a staggered grid is used to solve the elastic wave equation. The computational domain is replaced by a m (equal to 10 grid points) thick border with convolutional PML (C-PML) on both sides and at the bottom of the domain. Owing to the high number of the systems’ global degrees of freedom (i.e., identifying three parameters for each node in a domain with 512 × 192 = 98,304 nodes), the only meaningful strategy for retrieving a solution is via an adjoint state method embedded into a Quasi-Newton method. Here, the quasi-Newton limited memory Broyden–Fletcher–Goldfarb–Shanno (l-BFGS) method is used [42,51,52].
Since the FWI, based on local optimization, is sensitive to the initial model, an initial model containing the long-wave part of the model to be resolved is required to enable convergence to the global minimum. In contrast with geophysical exploration, which requires a series of field experiments to obtain information for the initial model, a priori information on the parameters of the dam material can often be obtained, since most of these structures are man-made. Therefore, the material properties can be used as the upper limit during construction, as in this case. A closer look at Figure 3 shows that the true model in Figure 3a and the initial model in Figure 3b differ only in the inclusion of regions with deteriorated material properties in the true model (see Figure 3c). Therefore, the “as-built” material properties of the dam are taken as the initial model. To study the dam material, spike wavelets are emitted successively from each of the sources (e.g., airguns). A series of low-pass filtered spikes are used here, as shown in Figure 4. For each excitation, the source wavelet as shown in Figure 5 propagates for a duration of s, and the time interval () used for the analysis is s, which satisfies the Courant–Friedrichs–Lewy criterion for stability.
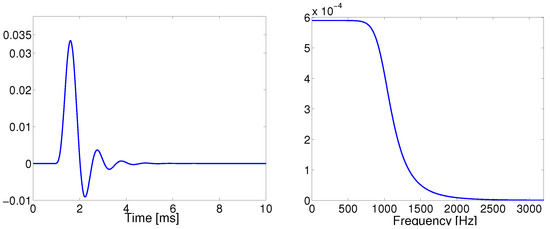
Figure 5.
Source wavelet signal: wavelet in time domain (left) and direct Fourier transform of the wavelet showing the 1000 Hz upper corner frequency (right).
The signals recorded by the 2D receivers as a result of the wave propagating in the medium are shown in a Figure 6. This seismogram corresponds to the acquisition setup 1 (cf. Figure 4a). Similar seismograms can be recorded for setups 2 and 3, where the number of traces is reduced, because the number of sensors is decreased. These synthetically generated seismograms are used as field data for the inverse analysis (i.e., FWI).
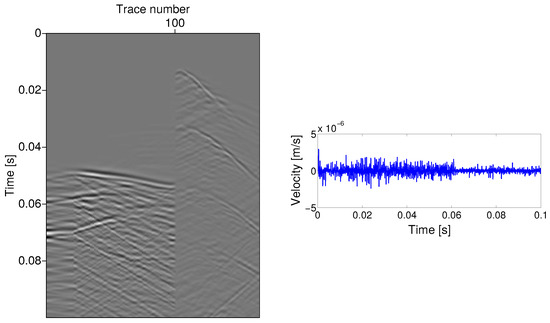
Figure 6.
Sensor response due to propagated waves in medium. (Left): Seismogram of all 165 sensor response (i.e., trace) in x-direction as a result of wave propagation from source 14. Trace 100–165 corresponds to sensors on the reservoir bottom; thus, it picks up the waves first. (Right): Response of trace 53 located on the dam slope.
4. Results
The FWI is carried out in multiple frequency stages, starting from lower frequencies to higher frequencies (i.e., kHz to 1 kHz) to alleviate the non-linearity and the ill-posedness of the problem. The result of the previous inversion with lower frequency is used as the starting model for the following inversion, where a higher frequency is applied. Therefore, with an increasing number of inversions (i.e., increase in frequency per stage), the location and boundaries between different particle velocity regions are delineating, and thus, the quality of the inversion output is enhanced.
Additionally, the cyclic multi-frequency approach introduced in Section 4.3 is improving the inversion results as the cyclic increase and decrease in the frequency band dampens unwanted artifacts.
4.1. Optimal Acquisition Geometry Selection
The different acquisition geometries used are shown in Figure 4. The effects of the acquisition setups on the inversion quality shall be investigated and, therefore, the inversion results for the final stage of each setup are shown in Figure 7 for each of the model parameters. Additionally, the residuals between the inversion results and the true model are given in Figure 8. Overall, the damage in the dam structure can be easily identified on visual inspection. Anomalies in the foundation of the dam were not correctly identified. The best way to identify the anomalies/damage in the dam structure and foundation is to use the parameter instead of using one of the other two material parameters or .
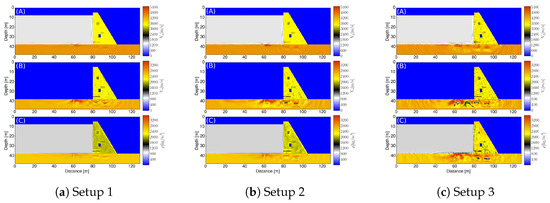
Figure 7.
FWI model for acquisition setups with (A) distribution (B) distribution (note that shear waves only travel through solids) and (C) distribution.
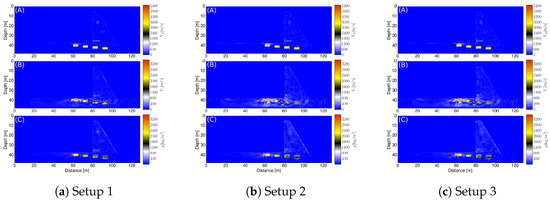
Figure 8.
FWI residuals for acquisition setups as comparison with the true model for (A) , (B) and (C) , respectively.
The comparison of the cost function value for each of the setups after 40 iteration steps in Figure 9 shows that acquisition setup 3 provides the best quality on the inversion results. One inversion cycle stops and proceeds to the next inversion stage when the relative misfit change between the last two iterations is below a predefined value, which is set to in this case. As seen in Figure 9, the transition to the new frequency level may cause an increase in the cost function value at the first iterations of the new stage. The superiority of setup 3 is also confirmed by examining the cross-sectional profile cuts through the regions of damage/anomalies in the dam (see Figure 10). Damage areas saturated with water can be identified by superposition of the models and . Such zones are made visible by looking at the properties of , which are capable of traveling through water (at slower speeds) and Vs which do not travel through fluids but produce better resolution for damaged zones.
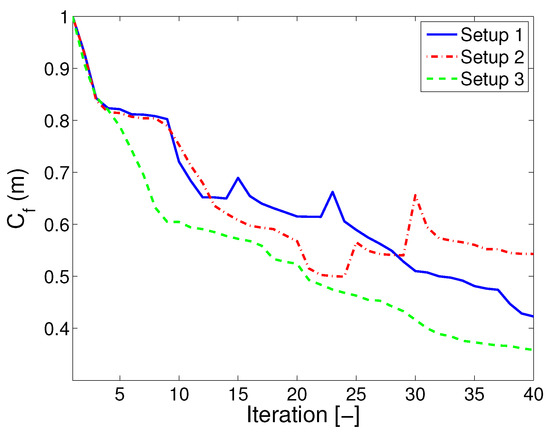
Figure 9.
Cost function value evolution for each iteration: comparison of cost function (normalized) over 40 iterations for each acquisition setup.
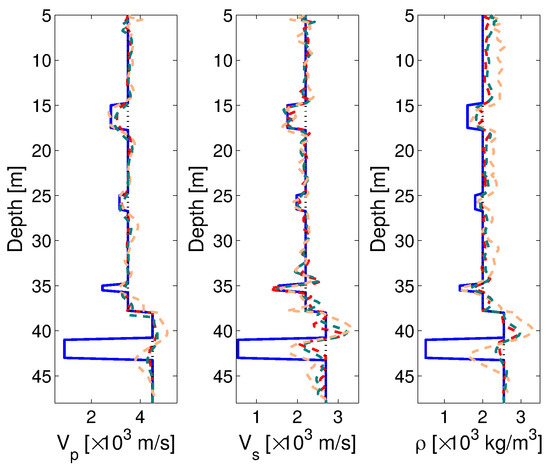
Figure 10.
Profile cut through the dam regions of reconstructed anomalies for acquisition setups 1 to 3 showing a comparison between the true model (—), FWI models (dashed lines: - - setup 1, - - setup 2, - - setup 3) and the initial model (⋯).
4.2. Influence of Noise (Disturbance in Obtained Data) on the Reconstruction Quality/Error
To test the robustness of the proposed FWI method for dams, the effects of random noise on the (synthetically generated) measurement data are studied. This investigation is also necessary, as it tends to factor in some of the uncertainties which may result from the model quality, equipment reliability in data recording, data handling and other factors on the field, such as vibrations resulting from the dams operation and other unknown sources. These can be captured in practice by calibrating/tuning the sensors/receivers (especially on the downstream of the dam) to these “ambient” vibrations and filtering them out during analysis. The synthetically generated field data are corrupted by different levels of Gaussian noise before carrying out the inversion. For each of the sensors used in the acquisition setup, the recorded data are corrupted by 1%, 2%, 5% and 10% noise. A comparison of the cost function after each iteration for different noise levels, and also a comparison of the final cost function values for the noise levels are obtained in Figure 11. As for the comparison of the different setups, the relative misfit change is set to before the inversion proceeds to the next inversion stage or is aborted for the last and final stage. Observations in Figure 11a show that the cost function trend for higher noise levels is shorter compared to lower noise levels. This behavior results from noise-induced velocity values, which are above the threshold set to ensure the CFL stability criterion; hence, the early convergence to a local minimum. Furthermore, in Figure 11b, the cost function values for each noise level at the end of each simulation, and at the end of the shortest inversion, are compared.
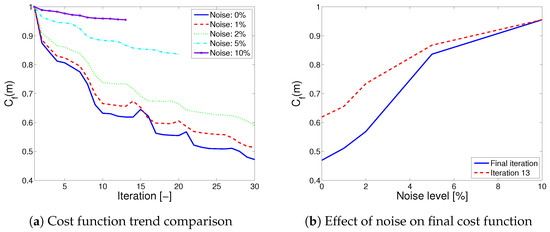
Figure 11.
Cost function comparison for different noise levels: (a) Cost function trend showing shorter trend for higher noise levels. (b) Influence of noise on final cost function at the end of the simulation for each noise level, and also at end of the shortest simulation (13 iterations).
The shortest inversion was for the highest noise level (10%) and had 13 iterations. Comparison of both plots in Figure 11 gives an idea of the quality improvement between the 13th iteration and the last iteration for each noise level. Thus, for higher noise levels, the inversion quality shows little improvement with an increasing number of iterations. The anomaly identification (inverse analysis) results for the noise levels of 1%, 5% and 10% for setup 3 are depicted in Figure 12.
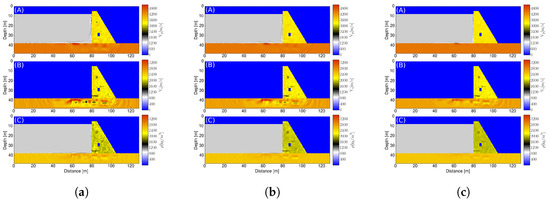
Figure 12.
FWI results for anomaly identification, (a) 1% noise (b) 5% noise (c) 10% noise.
A visual inspection of the FWI results in Figure 12 shows that for each increasing level of noise in the measurement data, there is a corresponding deterioration in the inversion quality, especially in the dam foundation. This behavior is also visible when looking at the cut profiles for the model parameter in Figure 13, because the anomaly identification in the foundation part becomes worse as the noise level increases. However, due to the sensor/receiver arrangement on the dam slope, informative wavefields transmitted through the structure enable better identification of anomalies (in the model) in the dam structure.
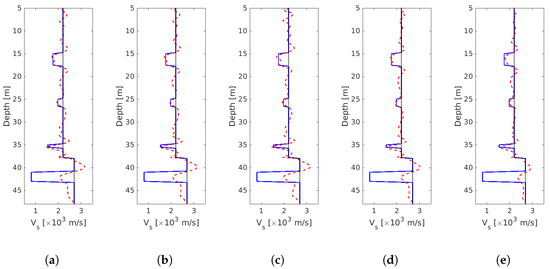
Figure 13.
Profile cut for through the dam in regions of reconstructed anomalies for different noise levels showing a comparison between the true model (—), FWI model (- -) and the initial model (⋯). (a) 0% noise (b) 1% noise (c) 2% noise (d) 5% noise (e) 10% noise.
Considering the results obtained in Figure 11, Figure 12, Figure 13, Figure 14 and Figure 15, it can be deduced that, depending on the noise level in the measured data, an increase in the number of iterations does not necessarily yield better results in relation to the required additional computational effort. The required computation effort (in terms of time) for 13 FWI iterations considering different noise levels is presented in Table 2, which also lists the required iterations for each of the frequency stages depending on the noise level. The analysis is computed on the VEGAS computer cluster at the Digital Bauhaus Lab. A total of 16 processors are used, with 8 processing elements along the x-direction of the finite-difference grid and 2 processing elements along the z-direction of the numerical domain.
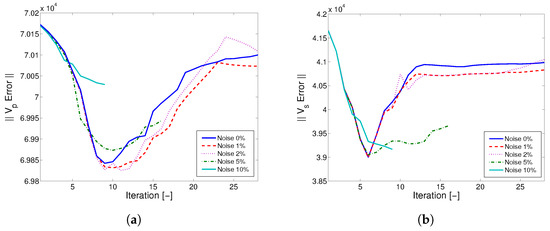
Figure 14.
Reconstruction error considering 0%, 1%, 2%, 5% and 10% noise in the data. (a) reconstruction error (b) reconstruction error.
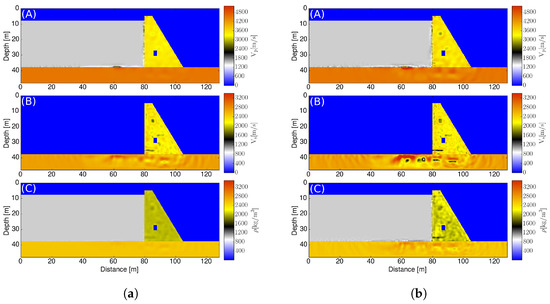
Figure 15.
FWI results at iteration stages 6 and 28 considering a noise level of 2%. (b) shows better anomaly identification despite having a higher reconstruction error. (a) Reconstruction at 6th iteration (b) Reconstruction at 28th iteration (final).

Table 2.
FWI computational time after 13 iterations and number of iterations per frequency stage number both for consideration of noise in data.
In practice, noise interference during data acquisition cannot be totally eliminated. Thus, it becomes necessary to obtain an optimum number of iterations, which leads to acceptable inversion results, prevents ‘over-fitting’ and, at the same time, reduces the computational costs. The following estimate for the reconstruction error in Equation (8) motivates the use of a discrepancy principle that establishes a trade-off between the two terms on the right-hand side of
where denotes the model parameter, represents the true model, is the iteration number, is the noise level being considered and denote quantities effected by noise. Therefore, an attempt is made to efficiently calculate the optimal number of iterations that is required to identify the anomalies in the structure, especially for noisy measurement data. This is realized by stopping it for the first time where and is a measure of the noise level in the (synthetically) collected data. Therefore, the reconstruction errors of the model parameters and are plotted over the number of iterations in Figure 14. Here, it can be observed that the model has its minimum at iteration number , except for the noise level of 10% that stops earlier. In contrast, the minimal reconstruction error of the model lies at . Although the model provided better inversion results than , a comparison between the FWI results after and 28 iterations, which is the final one, is shown in Figure 15. The comparison also intends to check whether the models with the least reconstruction error provide the best results.
The results achieved in Figure 15 differ significantly from what was expected looking at Figure 14. Although the 28th iteration has a higher reconstruction error, it gives the best results according to the visual assessment (i.e., identification of the most damaged regions) at the expense of increased artifacts. A closer look at the FWI results for higher iteration numbers () shows that, though the inversion quality is better, there exist more artifacts, indicating damages in regions that are undamaged. Thus, these artifacts result in a higher reconstruction error, as seen in Figure 14.
4.3. Cyclic Multi-Frequency Stage Inversion
To reduce the effect of these artifacts at higher iterations and stabilize the inversion, cyclic multi-frequency analysis with time damping is applied. Here, for each time frame ( [s]), the inversion is carried out in different stages, starting from lower to higher frequencies (i.e., from kHz to 1 kHz) to alleviate the non-linearity and the ill-posedness of the problem and returning again to lower frequencies. Amplitudes of the acquired signal lying outside of are damped to 0. The output of each time frame is used as an initial model for the next, starting the inversion again, from low to high frequency and back again, as sketched in Figure 2. One cycle is generally completed at the end of each time frame (i.e., when the inversion reverts to a lower frequency after completing a higher-frequency stage). In order to ensure a good resolution of small anomalies, it is necessary to finish with a high frequency. Therefore, it is recommended to increase the frequencies in the last stages towards the maximum used frequency, as also shown in Figure 2. Information on the frequency bands and time frames in each cycle is obtained in Table 3, i.e., the cyclic multi-frequency approach is implemented with , and three cycles are realized. A low-pass frequency filter is applied. The corner frequencies and the window considered are indicated in Table 3. Each time window has an origin of 0 s.

Table 3.
Cyclic frequency bands and time frames.
4.3.1. Influence of Noise (Disturbance in Obtained Data) on the Reconstruction Quality for Cyclic Multi-Frequency Stage Inversion
In opposition to the results gained without the cyclic multi-frequency stages, using these frequency cycles leads to similar identifications of the model parameters which do not strongly depend on the noise level. The results of the cyclic multi-frequency inversion approach are given in Figure 16 under the consideration of different noise levels. When comparing Figure 12 and Figure 16, the identification of the two areal anomalies above the tunnel of the dam has become much clearer regarding all three model parameters, but they are especially visible for the parameter . One drawback of the cyclic multi-frequency stage analysis is the less accurate identification of the crack at the lower dam area. Nevertheless, the crack is visible, yet not as precise as in Figure 14. In total, using cyclic stages for multiple frequencies is reducing artifacts, which is particularly noticeable in the foundation. A second effect is that both model parameters, the density and the primary wave velocity, became more informative than for the multi-frequency inversion approach, as the anomalies can also be identified when looking at these parameters, even though the identification by is still recommended in comparison.
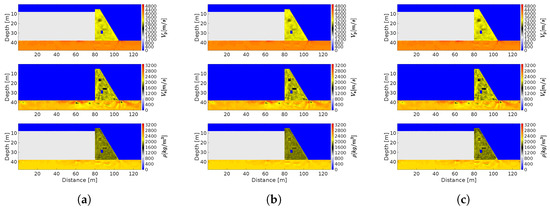
Figure 16.
FWI results for cyclic multi-frequency inversion anomaly identification. (a) 1% noise; (b) 5% noise (c); 10% noise.
In addition to the above, the stability of this regularized method compared to the multi-frequency stage inversion can be seen in the reconstruction error plots in Figure 17. For the plot (Figure 17b), it can be observed that, as the noise increases, the reconstruction plot is decreasing step-wise at lower iteration numbers, but also, it is stabilizing with higher iteration numbers. The total number of iterations is more or less the same for the noise levels of 1%, 2% and 5%, but it is increasing for 10% noise and also for the case of no noise (0%). In total, there are more iterations required for the cyclic multi-frequency approach than for the multi-frequency stage inversion, as there are more frequency bands used during the inversion process, but nevertheless, there are fewer artifacts present in the material parameter results and the quality of reconstruction is increased. This trend is barely noticeable in the plot, but there is some enhancement in the reconstruction error of after the FWI compared to the initial model. This is because most of the damages/anomalies are identified best by the S-waves ().
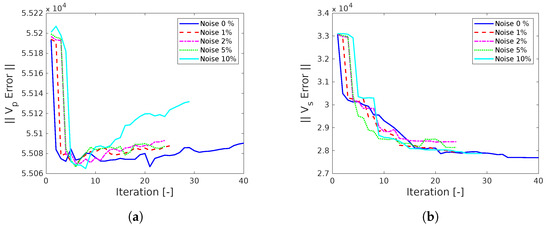
Figure 17.
Reconstruction error for a cyclic multi-frequency stage inversion considering different noise levels in the data. (a) reconstruction error (b) reconstruction error.
4.3.2. Influence of Noise (Disturbance in Obtained Data) and Uncertainty in the Starting Model on the Reconstruction Quality for Cyclic-Multi-Frequency Stage Inversion
In addition to the noise in the data, an important role is played by the starting model in identifying the material parameters correctly. This circumstance is displayed in Figure 18, where the FWI results for −10%, +2% and +10% differences in the material parameters of the starting model from the ones of the dam’s as-built parameters (see Figure 4b) are shown. When the error in the starting model is rather small (e.g., 2%) the results from the FWI are comparable to the ones when there is no deviation in the starting model. Comparing the usage of % (Figure 18a) and +10% (Figure 18c) difference of the material parameters in the initial model, it becomes obvious that the reconstruction of the anomalies performs better in terms of underestimating the real material properties. In that case, all but the middle anomaly can still be detected using the cyclic multi-frequency approach. As the reduction in the material properties of the second anomaly is exactly 10%, it is incorporated by the whole dam. Therefore, it can be stated that anomalies which deviate less or equally from the real model than the starting model cannot be determined by the FWI. Overall, the crack in the lower part of the dam is detected for all displayed differences in the starting model. Small changes in the starting model do not worsen the identification of the real material parameters. Additionally, it is recommended to stay on the safe side with the initial model when underestimating the material properties. From a practical point of view, uncertainties about the true condition in the undamaged state of more than 10% seem unrealistic.
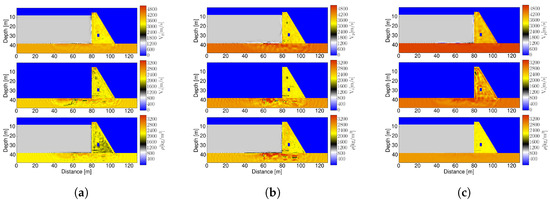
Figure 18.
Cyclic multi-frequency inversion anomaly identification considering certain difference in dam as-built material properties in the starting model having additionally 2% noise in the data. (a) −10% difference in starting model (b) +2% difference in starting model (c) +10% difference in starting model.
5. Conclusions
Our findings in this research paper show the applicability of Full Waveform Inversion (FWI) in the non-destructive testing (NDT) of superstructures as a viable option for the current difficulties and inefficiencies faced in dam monitoring. To overcome the shortcomings of the standard FWI, we apply our cyclic multi-stage approach as discussed in Section 4.3.
The robustness of our approach is shown by the high-resolution reconstruction of the damaged regions, considering the varying intensity of noise used to corrupt the data. Further findings from our research to be considered are as follows:
- The proposed FWI formulation is capable of effectively identifying and quantifying regions of weaknesses (i.e., heterogeneity) in both the dam structure and its foundation.
- The dam’s as-built material properties are used as a starting model for the inversion. This information is, in most cases, readily available, or can be easily estimated. If the material properties are completely unknown, it is recommended to underestimate and not to overestimate them.
- The efficiency of this method is influenced by the data acquisition geometry. Thus, we propose an acquisition setup which encloses regions in which critical damage is expected.
- The damaged regions are generally of lower velocities and smaller scale; thus, the model, with its shorter wavelength, resolves the anomalies better than the and models.
- A superimposition of the and models to identify damaged regions saturated with water increases the robustness of the method by leveraging the advantages of both models.
- The identified damages in the dam body had a better quality than the ones in the dam foundation for data corrupted with high noise levels. Thus, we propose, where possible, an acquisition setup which favors the recording of transmitted waves.
An outlook for future work would consider excitation sources placed within the dam structure, especially with regard to the reconstruction of better and models.
Author Contributions
Conceptualization, M.A. and I.R.; methodology, M.A.; software, D.K.; validation, M.A. and I.R.; formal analysis, M.A. and I.R.; investigation, M.A.; data curation, M.A. and I.R.; writing—original draft preparation, M.A. and I.R.; writing—review and editing, I.R. and T.L.; visualization, M.A. and I.R.; supervision, T.L.; project administration, T.L.; funding acquisition, T.L. and F.W. All authors have read and agreed to the published version of the manuscript.
Funding
The authors gratefully acknowledge the financial support of the German Research Foundation (DFG) under the grant LA—2869/10-1, and that of the DFG research training group 1462 “Evaluation of Coupled Numerical and Experimental Partial Models in Structural Engineering”. Further, parts of the research are supported by BMWi-ZIM/AiF within the project “Hochfrequentes seismisches Betonprüfverfahren zur hochaufgelösten zerstörungsfreien Prüfung von großvolumigen Betonbauwerken am Anwendungsfall einer Talsperre”. We acknowledge support from the German Research Foundation (DFG) and Bauhaus-Universität Weimar within the program of Open Access Publishing.
Institutional Review Board Statement
Not applicable.
Informed Consent Statement
Not applicable.
Data Availability Statement
Please contact the corresponding author.
Acknowledgments
This research was supported in part through computational resources provided on the VEGAS cluster at the Digital Bauhaus Lab in Bauhaus-Universität Weimar, Germany.
Conflicts of Interest
The authors declare no conflict of interest.
References
- Dokter, E.; Köhn, D.; Wilken, D.; Nil, D.; Rabbel, W. Full-waveform inversion of SH-and Love-wave data in near-surface prospecting. Geophys. Prospect. 2017, 65, 216–236. [Google Scholar] [CrossRef]
- Fichtner, A.; Kennett, B.L.; Igel, H.; Bunge, H.P. Full waveform tomography for radially anisotropic structure: New insights into present and past states of the Australasian upper mantle. Earth Planet. Sci. Lett. 2010, 290, 270–280. [Google Scholar] [CrossRef]
- Köhn, D.; De Nil, D.; al Hagrey, S.; Rabbel, W.; Khaledi, K.; König, D.; Schanz, T. Monitoring elastic parameter changes in the vicinity of salt caverns due to cyclic loading by seismic waveform inversion. In Proceedings of the Energy Geotechnics: Proceedings of the 1st International Conference on Energy Geotechnics, ICEGT 2016, Kiel, Germany, 29–31 August 2016; CRC Press: Boca Raton, FL, USA, 2016; p. 45. [Google Scholar]
- Nguyen-Tuan, L.; Lahmer, T.; Datcheva, M.; Stoimenova, E.; Schanz, T. A novel parameter identification approach for buffer elements involving complex coupled thermo-hydro-mechanical analyses. Comput. Geotech. 2016, 76, 23–32. [Google Scholar] [CrossRef]
- Operto, S.; Virieux, J.; Dessa, J.X.; Pascal, G. Crustal seismic imaging from multifold ocean bottom seismometer data by frequency domain full-waveform tomography: Application to the eastern Nankai trough. J. Geophys. Res. Solid Earth 2006, 111, B09306. [Google Scholar] [CrossRef]
- Operto, S.; Miniussi, A.; Brossier, R.; Combe, L.; Métivier, L.; Monteiller, V.; Ribodetti, A.; Virieux, J. Efficient 3-D frequency-domain mono-parameter full-waveform inversion of ocean-bottom cable data: Application to Valhall in the visco-acoustic vertical transverse isotropic approximation. Geophys. J. Int. 2015, 202, 1362–1391. [Google Scholar] [CrossRef]
- Peter, D.; Komatitsch, D.; Luo, Y.; Martin, R.; Le Goff, N.; Casarotti, E.; Le Loher, P.; Magnoni, F.; Liu, Q.; Blitz, C.; et al. Forward and adjoint simulations of seismic wave propagation on fully unstructured hexahedral meshes. Geophys. J. Int. 2011, 186, 721–739. [Google Scholar] [CrossRef]
- Plessix, R.E.; Perkins, C. Thematic Set: Full waveform inversion of a deep water ocean bottom seismometer dataset. First Break 2010, 28, 71–78. [Google Scholar] [CrossRef]
- Sirgue, L.; Barkved, O.; Dellinger, J.; Etgen, J.; Albertin, U.; Kommedal, J. Thematic set: Full waveform inversion: The next leap forward in imaging at Valhall. First Break 2010, 28, 65–70. [Google Scholar] [CrossRef]
- Tape, C.; Liu, Q.; Maggi, A.; Tromp, J. Seismic tomography of the southern California crust based on spectral-element and adjoint methods. Geophys. J. Int. 2010, 180, 433–462. [Google Scholar] [CrossRef]
- Tran, K.T.; Luke, B. Full waveform tomography to resolve desert alluvium. Soil Dyn. Earthq. Eng. 2017, 99, 1–8. [Google Scholar] [CrossRef]
- Tran, K.T.; McVay, M. Site characterization using Gauss–Newton inversion of 2-D full seismic waveform in the time domain. Soil Dyn. Earthq. Eng. 2012, 43, 16–24. [Google Scholar] [CrossRef]
- Vigh, D.; Jiao, K.; Watts, D.; Sun, D. Elastic full-waveform inversion application using multicomponent measurements of seismic data collection. Geophysics 2014, 79, R63–R77. [Google Scholar] [CrossRef]
- Zhu, H.; Bozdağ, E.; Peter, D.; Tromp, J. Structure of the European upper mantle revealed by adjoint tomography. Nat. Geosci. 2012, 5, 493–498. [Google Scholar] [CrossRef]
- Tang, W.H.; Yen, B.C. Dam safety inspection scheduling. J. Hydraul. Eng. 1991, 117, 214–229. [Google Scholar] [CrossRef]
- Alalade, M. An Enhanced Full Waveform Inversion Method for the Structural Analysis of Dams. Ph.D. Thesis, Bauhaus-Universität Weimar, Weimar, Germany, 2019. [Google Scholar] [CrossRef]
- Lee, W.; Hoopes, J.A. Prediction of cavitation damage for spillways. J. Hydraul. Eng. 1996, 122, 481–488. [Google Scholar] [CrossRef]
- Mata, J.; Leitão, N.S.; de Castro, A.T.; da Costa, J.S. Construction of decision rules for early detection of a developing concrete arch dam failure scenario. A discriminant approach. Comput. Struct. 2014, 142, 45–53. [Google Scholar] [CrossRef]
- Nanthakumar, S.; Lahmer, T.; Zhuang, X.; Zi, G.; Rabczuk, T. Detection of material interfaces using a regularized level set method in piezoelectric structures. Inverse Probl. Sci. Eng. 2016, 24, 153–176. [Google Scholar] [CrossRef]
- Xu, X.; Wu, J.; Shen, J.; He, Z. Case study: Application of GPR to detection of hidden dangers to underwater hydraulic structures. J. Hydraul. Eng. 2006, 132, 12–20. [Google Scholar] [CrossRef]
- Lahmer, T.; Könke, C.; Bettzieche, V. Optimal Monitoring of Gravity Dams by Multifield Considerations. 2011. Available online: http://www.talsperren.info/assets/applets/optimalmonitoring.pdf (accessed on 18 November 2022).
- Lahmer, T. Crack identification in hydro-mechanical systems with applications to gravity water dams. Inverse Probl. Sci. Eng. 2010, 18, 1083–1101. [Google Scholar] [CrossRef]
- Alalade, M.; Nguyen-Tuan, L.; Wuttke, F.; Lahmer. Inverse Analysis of Coupled Hydro-Mechanical Problem in Dynamically Excited Dams. In Proceedings of the 7th International Workshop on Reliable Engineering Computing: Computing with Polymorphic Uncertainty Data, Bochum, Germany, 15–17 June 2016; Freitag, S., Rafi, L., Muhanna, R.L.M., Eds.; 2016. Available online: https://www.researchgate.net/publication/308674834_Inverse_Analysis_of_Coupled_Hydro-Mechanical_Problem_in_Dynamically_Excited_Dams (accessed on 18 November 2022).
- Alalade, M.; Nguyen-Tuan, L.; Wuttke, F.; Lahmer, T. Damage identification in gravity dams using dynamic coupled hydro-mechanical XFEM. Int. J. Mech. Mater. Des. 2018, 14, 157–175. [Google Scholar] [CrossRef]
- Nguyen-Tuan, L.; Könke, C.; Lahmer, T. Damage identification using inverse analysis for 3D coupled thermo-hydro-mechanical problems. Comput. Struct. 2018, 196, 146–156. [Google Scholar] [CrossRef]
- Nguyen-Tuan, L.; Könke, C.; Bettzieche, V.; Lahmer, T. Damage identification using inverse analysis in coupled thermo-hydro-mechanical problems applied to masonry dams. Int. J. Numer. Anal. Methods Geomech. 2018, 42, 256–273. [Google Scholar] [CrossRef]
- Yao, F.H.; Guan, S.H.; Yang, H.; Chen, Y.; Qiu, H.F.; Ma, G.; Liu, Q.W. Long-term deformation analysis of Shuibuya concrete face rockfill dam based on response surface method and improved genetic algorithm. Water Sci. Eng. 2019, 12, 196–204. [Google Scholar] [CrossRef]
- Dou, S.Q.; Li, J.J.; Kang, F. Health diagnosis of concrete dams using hybrid FWA with RBF-based surrogate model. Water Sci. Eng. 2019, 12, 188–195. [Google Scholar] [CrossRef]
- Lailly, P.; Bednar, J. The seismic inverse problem as a sequence of before stack migrations. In Conference on Inverse Scattering: Theory and Application; SIAM: Philadelphia, PA, USA, 1983; pp. 206–220. [Google Scholar]
- Tarantola, A.; Santosa, F. The seismic reflection inverse problem. Inverse Probl. Acoust. Elastic Waves 1984, 14, 104–181. [Google Scholar]
- Métivier, L.; Brossier, R.; Mérigot, Q.; Oudet, E.; Virieux, J. Measuring the misfit between seismograms using an optimal transport distance: Application to full-waveform inversion. Geophys. J. Int. 2016, 205, 345–377. [Google Scholar] [CrossRef]
- Ntengue Chatue, P. Towards the Application of 2D Elastic Full-Waveform Inversion to Ultrasonic Data for Non-Destructive Testing. Master’s Thesis, Karlsruher Institut für Technologie (KIT), Karlsruhe, Germany, 2021. [Google Scholar] [CrossRef]
- Jazayeri, S.; Kruse, S.; Hasan, I.; Yazdani, N. Reinforced concrete mapping using full-waveform inversion of GPR data. Constr. Build. Mater. 2019, 229, 117102. [Google Scholar] [CrossRef]
- Krischer, L.; Strobach, E.; Boehm, C.; Afanasiev, M.; ANGST, U. Full-waveform inversion of ultrasonic echo signals to evaluate grouting quality of tendon ducts in post-tensioned concrete structures. In Proceedings of the NDT-CE 2022-The International Symposium on Nondestructive Testing in Civil Engineering, Zurich, Switzerland, 16–18 August 2022. [Google Scholar]
- Chen, J.; Wang, H.; Song, D.; Ge, X. A Frequency-Domain Full Waveform Inversion Method of Elastic Waves in Quantitative Defection Investigation; NISCAIR-CSIR: New Delhi, India, 2019. [Google Scholar]
- Alalade, M.; Kafle, B.; Wuttke, F.; Lahmer, T. Inverse analysis of cyclic constitutive models for unsaturated soil under consideration of oscillating functions. In Proceedings of the E3S Web of Conferences. EDP Sciences, Krakow, Poland, 17–19 May 2016; Volume 9, p. 08012. [Google Scholar]
- Aki, K.; Richards, P.G. Quantitative Seismology, Theory and Methods; WH Freeman & Co.: New York, NY, USA, 1980; Volume 1. [Google Scholar]
- Virieux, J. P-SV wave propagation in heterogeneous media: Velocity-stress finite-difference method. Geophysics 1986, 51, 889–901. [Google Scholar] [CrossRef]
- Levander, A.R. Fourth-order finite-difference P-SV seismograms. Geophysics 1988, 53, 1425–1436. [Google Scholar] [CrossRef]
- Courant, R.; Friedrichs, K.; Lewy, H. On the partial difference equations of mathematical physics. IBM J. 1967, 11, 215–234. [Google Scholar] [CrossRef]
- Zeng, C.; Xia, J.; Miller, R.D.; Tsoflias, G.P. An improved vacuum formulation for 2D finite-difference modeling of Rayleigh waves including surface topography and internal discontinuities. Geophysics 2012, 77, T1–T9. [Google Scholar] [CrossRef]
- Nocedal, J.; Wright, S. Numerical Optimization; Springer Science & Business Media: Berlin/Heidelberg, Germany, 2006. [Google Scholar]
- Shipp, R.M.; Singh, S.C. Two-dimensional full wavefield inversion of wide-aperture marine seismic streamer data. Geophys. J. Int. 2002, 151, 325–344. [Google Scholar] [CrossRef]
- Tarantola, A. Inverse Problem Theory and Methods for Model Parameter Estimation; SIAM: Philadelphia, PA, USA, 2005; Volume 89. [Google Scholar]
- Plessix, R.E. A review of the adjoint-state method for computing the gradient of a functional with geophysical applications. Geophys. J. Int. 2006, 167, 495–503. [Google Scholar] [CrossRef]
- Köhn, D. Time Domain 2D Elastic Full Waveform Tomography. Ph.D. Thesis, Christian-Albrechts-Universität zu Kiel, Kiel, Germany, 2011. Available online: http://nbn-resolving.de/urn:nbn:de:gbv:8-diss-67866 (accessed on 12 October 2022).
- Köhn, D.; De Nil, D.; Kurzmann, A.; Przebindowska, A.; Bohlen, T. On the influence of model parametrization in elastic full-waveform tomography. Geophys. J. Int. 2012, 191, 325–345. [Google Scholar] [CrossRef]
- Köhn, D.; De Nil, D.; Kurzmann, A.; Rabbel, W. Full Waveform Tomography-Part 1 Theory. 2015. Available online: https://www.yumpu.com/en/document/view/21547351/full-waveform-tomography-part-1-theory (accessed on 18 November 2022).
- Köhn, D.; Kurzmann, A.; De Nil, D.; Groos, L. DENISE—User Manual. 2014. Available online: https://danielkoehnsite.wordpress.com/software/ (accessed on 12 October 2022).
- Sirgue, L.; Pratt, R.G. Efficient waveform inversion and imaging: A strategy for selecting temporal frequencies. Geophysics 2004, 69, 231–248. [Google Scholar] [CrossRef]
- Métivier, L.; Brossier, R.; Virieux, J.; Operto, S. Full waveform inversion and the truncated Newton method. SIAM J. Sci. Comput. 2013, 35, B401–B437. [Google Scholar] [CrossRef]
- Pratt, R.G.; Shin, C.; Hick, G.J. Gauss–Newton and full Newton methods in frequency–space seismic waveform inversion. Geophys. J. Int. 1998, 133, 341–362. [Google Scholar] [CrossRef]
Publisher’s Note: MDPI stays neutral with regard to jurisdictional claims in published maps and institutional affiliations. |
© 2022 by the authors. Licensee MDPI, Basel, Switzerland. This article is an open access article distributed under the terms and conditions of the Creative Commons Attribution (CC BY) license (https://creativecommons.org/licenses/by/4.0/).