Article

Investigating the Influence of Initial Water pH on Concrete Strength Gain Using a Sensors and Sclerometric Test Combination

by
Yelbek Utepov
1,2,
Assel Tulebekova
1,2,
Aliya Aldungarova
1,3,
Timoth Mkilima
1,4,*,
Shyngys Zharassov
1,2,*,
Zhanbolat Shakhmov
2,
Daniyar Bazarbayev
5,
Temirkhan Tolkynbayev
2 and
Zhanar Kaliyeva
5
1
CSI Research & Lab. (LLP), Astana 010000, Kazakhstan
2
Department of Civil Engineering, L.N. Gumilyov Eurasian National University, Astana 010008, Kazakhstan
3
School of Architecture and Construction, D. Serikbayev East Kazakhstan Technical University, Ust-Kamenogorsk 070004, Kazakhstan
4
Department of Environmental Engineering, Ardhi University, Plot No 3, Block L, University Road, Dar es Salaam P.O. Box 35176, Tanzania
5
Department of Technology of Industrial and Civil Engineering, L.N. Gumilyov Eurasian National University, Astana 010008, Kazakhstan
*
Authors to whom correspondence should be addressed.
Infrastructures 2022, 7(12), 159; https://doi.org/10.3390/infrastructures7120159
Submission received: 2 October 2022 / Revised: 16 November 2022 / Accepted: 21 November 2022 / Published: 23 November 2022

Abstract

:
Concrete strength gain can be significantly affected by the initial characteristics of the raw materials. Unfortunately, information on the potential influence of the initial water pH on concrete strength gain is still scarce. In this study, the potential effects of the initial water pH on concrete strength gain were investigated using a combination of sensors and a sclerometric test. The impact of initial pH on the strength gain process was investigated using three distinct pH values (4.0, 7.0, and 12). The primary variables examined were pH variations over time, internal temperature, and strength gain. The problem was further examined using a number of statistical techniques, including Single-way Analysis of Variance, Scheffé’s approach, and Correlation Matrixes. When the temperature data from 4.0, 7.0, and 12 pH values were put through the Analysis of Variance, a p-value of 2.4 × 10−261 was retrieved. Additionally, when the strength gain data from 4.0, 7.0, and 12 pH values were subjected to the Analysis of Variance, a p-value of 2.9 × 10−168 was retrieved. The results showed that the differences in the list data retrieved from the investigated pH values were statistically significant. Based on the results, we can state that the initial pH level in the mixing water can have noticeably varied consequences in terms of the strength gain of the concrete and should be carefully considered during the preparation process of concrete. The findings retrieved from this study provide a piece of useful information in the construction field, especially with concrete strength management.

1. Introduction

During the building of a structure, concrete is utilized to give strength, applicability, and durability. Due to its exceptional qualities, concrete is a dependable and long-lasting material choice for both commercial and residential structures. However, the usability of concrete is highly dependent on its quality in terms of strength [1]. Gaining concrete strength is a rather complex process. Different internal and external processes have an impact on the concrete’s increase in strength. All of this is relevant to the long-term functionality of concrete during the course of its life cycle [2]. Throughout its lifetime of use, a concrete structure should be secure, reliable, usable, and sustainable [3]. To protect structures from collapsing, stability represents a fundamental challenge in solid mechanics that must be solved [4,5,6]. Generally speaking, concrete structures are anticipated to perform satisfactorily for the duration of their service life with minimal maintenance. However, due to things such as concrete deterioration, overburden, or physical damage, such expectations are typically not met [7]. The quality of the raw materials, the proportion of water to cement, the coarseness and fineness of the aggregate, the age of the concrete, the degree of compaction, the temperature, the relative humidity, and the curing process all have an impact on the strength of the concrete [8]. Therefore, it is crucial to keep moisture loss under control throughout the entire hardening process, whereby the process of controlling the rate and amount of moisture loss from concrete during cement hydration is known as curing [9,10]. Curing is accomplished by continually misting the exposed surface to stop moisture loss.
In this regard, water is an essential ingredient in the processes of hardening and preparing concrete. Unfortunately, while being an essential component, water quality should always be checked before being used in the process of making concrete. According to the study conducted by Nikhil [11], the findings show that using potable water improves the strength qualities of concrete and increases compressive strength by 33.34% when compared to using sewage water. That is to say, the pH of the water used to prepare concrete is one of the most crucial water quality parameters to be examined [12]. It should also be noted that the main causes of damage to concrete in all its forms worldwide are moisture and pH fluctuations [13]. Therefore, it is significantly important to investigate the potential of pH in the initial mixing water to provide the construction industry with a piece of crucial information for the production of high-quality concrete.
Due to the porous nature of concrete, moisture can rather quickly infiltrate the material, changing the pH and hastening the carbonation process. The pH scale has a range of 0 to 14, with a neutral or “basic” pH of 7. Acidity is indicated by numbers less than 7, and the lower the value, the more acidic. Contrarily, a reading greater than 7 indicates that the substance being measured is alkaline, and the closer readings are to 14, the more alkaline is the substance [14]. Portland cement, the binding component in concrete, has a pH of 12, and if this pH varies too much, the cement loses its ability to bond as it is broken down [15]. As a result, the concrete will develop more pores and cracks, significantly speeding up the process and causing an increase in issues and deterioration. There may be problems with pH and moisture levels when it comes to the making of concrete [16]. The pH level of the concrete mix can change depending on the location’s water, and this issue can be sped up if too much water is utilized during the concrete-making process. Concrete will show visible disintegration and surface damage if the pH falls below 7, as the cement will no longer be able to hold the concrete together. If ignored, it will keep getting more acidic, which will eventually cause the concrete to lose its structural integrity and require replacement [17].
Temperature is another essential factor, in addition to pH, that governs how concrete gains strength over time [18,19]. Unfortunately, little to no effort is made to look at how internal temperature may affect concrete strength increase; the majority of temperature-related studies on concrete are based on external temperature. It should also be noted that Delayed Ettringite Formation is more likely to occur when internal concrete temperatures are high (DEF). DEF is a material-related problem that may result in significant cracking [20,21].
The strength and maturity of concrete at any given time are two of the most crucial factors to understand during a construction process [22,23]. This information has previously been gathered by contractors through protracted break tests conducted in laboratories, but in recent years, new technology has made it possible for contractors to acquire concrete strength and maturity in place and in realtime [24,25]. Many issues that plagued the engineering and construction sectors for a while have been resolved thanks to smart technology, including challenges with data compilation, data sharing, and time-consuming data collection procedures. In that matter, the use of monitoring sensors in concrete has gained more interest in the recent past [9,26,27].
The timing of these technological developments could not be more ideal as the complexity and cost of construction projects expand globally. The early age strength growth of concrete, which is closely correlated with the cementitious paste’s history of hydration temperature, can be predicted using in-situ concrete maturity data [28]. Contractors may incur costs due to inaccurate data on concrete maturity and strength. Contractors either act prematurely by removing formwork and moving on to the next stage of the project before optimal results have been achieved, wasting valuable time and lengthening the project timeframe, or they wait too long for results.
In this work, mechanical-electrical sensors are used to examine any potential impacts of the initial water pH on the concrete strength gain. Utilizing three different pH values, the effect of initial pH on the strength-gain process was examined (4.0, 7.0, and 12). The interior temperature, strength increase, and pH changes over time are the main factors evaluated. A number of statistical methods, such as Single-way Analysis of Variance, Scheffé’s method, and Correlation Matrixes, are used to further analyze the problem.

2. Materials and Methods

2.1. Experimental Setup and Materials

For the experiment, concrete B20 grade M250 (Llc Stella, Almaty, Kazakhstan) was employed. Cement M400, crushed stone fractions of 5–20 cm, and washed fine-grained river sand were the main ingredients of the concrete mixture, and their proportions were 1:3, 9:2, and 1 correspondingly. All components were carefully inspected and weighed on a scale with a 5 kg weight limit before being mixed together in a metal container. As indicated earlier, the study looked at three primary groups of pH conditions: the first group was an acidic environment with a pH below 4; the second group was a neutral environment with a pH of approximately 7; the third group was an environment with a pH above 11. This was accomplished by lowering the pH of the distilled water by adding an acid and raising the pH by adding an alkaline material. Normal Portland cement (CEM I 42.5) (Jambyl Cement LLP, Almaty, Kazakhstan) was used in the study in conjunction with coarse aggregate from crushed limestone with a density of approximately 2.7 kg/m3, an average particle size of 12 cm, and a fineness modulus of approximately 5.59. The fine aggregate had a fineness modulus of 2.83 and was composed of crushed limestone and quartz sand. In every mixing, the volume percentages of fine and coarse aggregate were maintained.
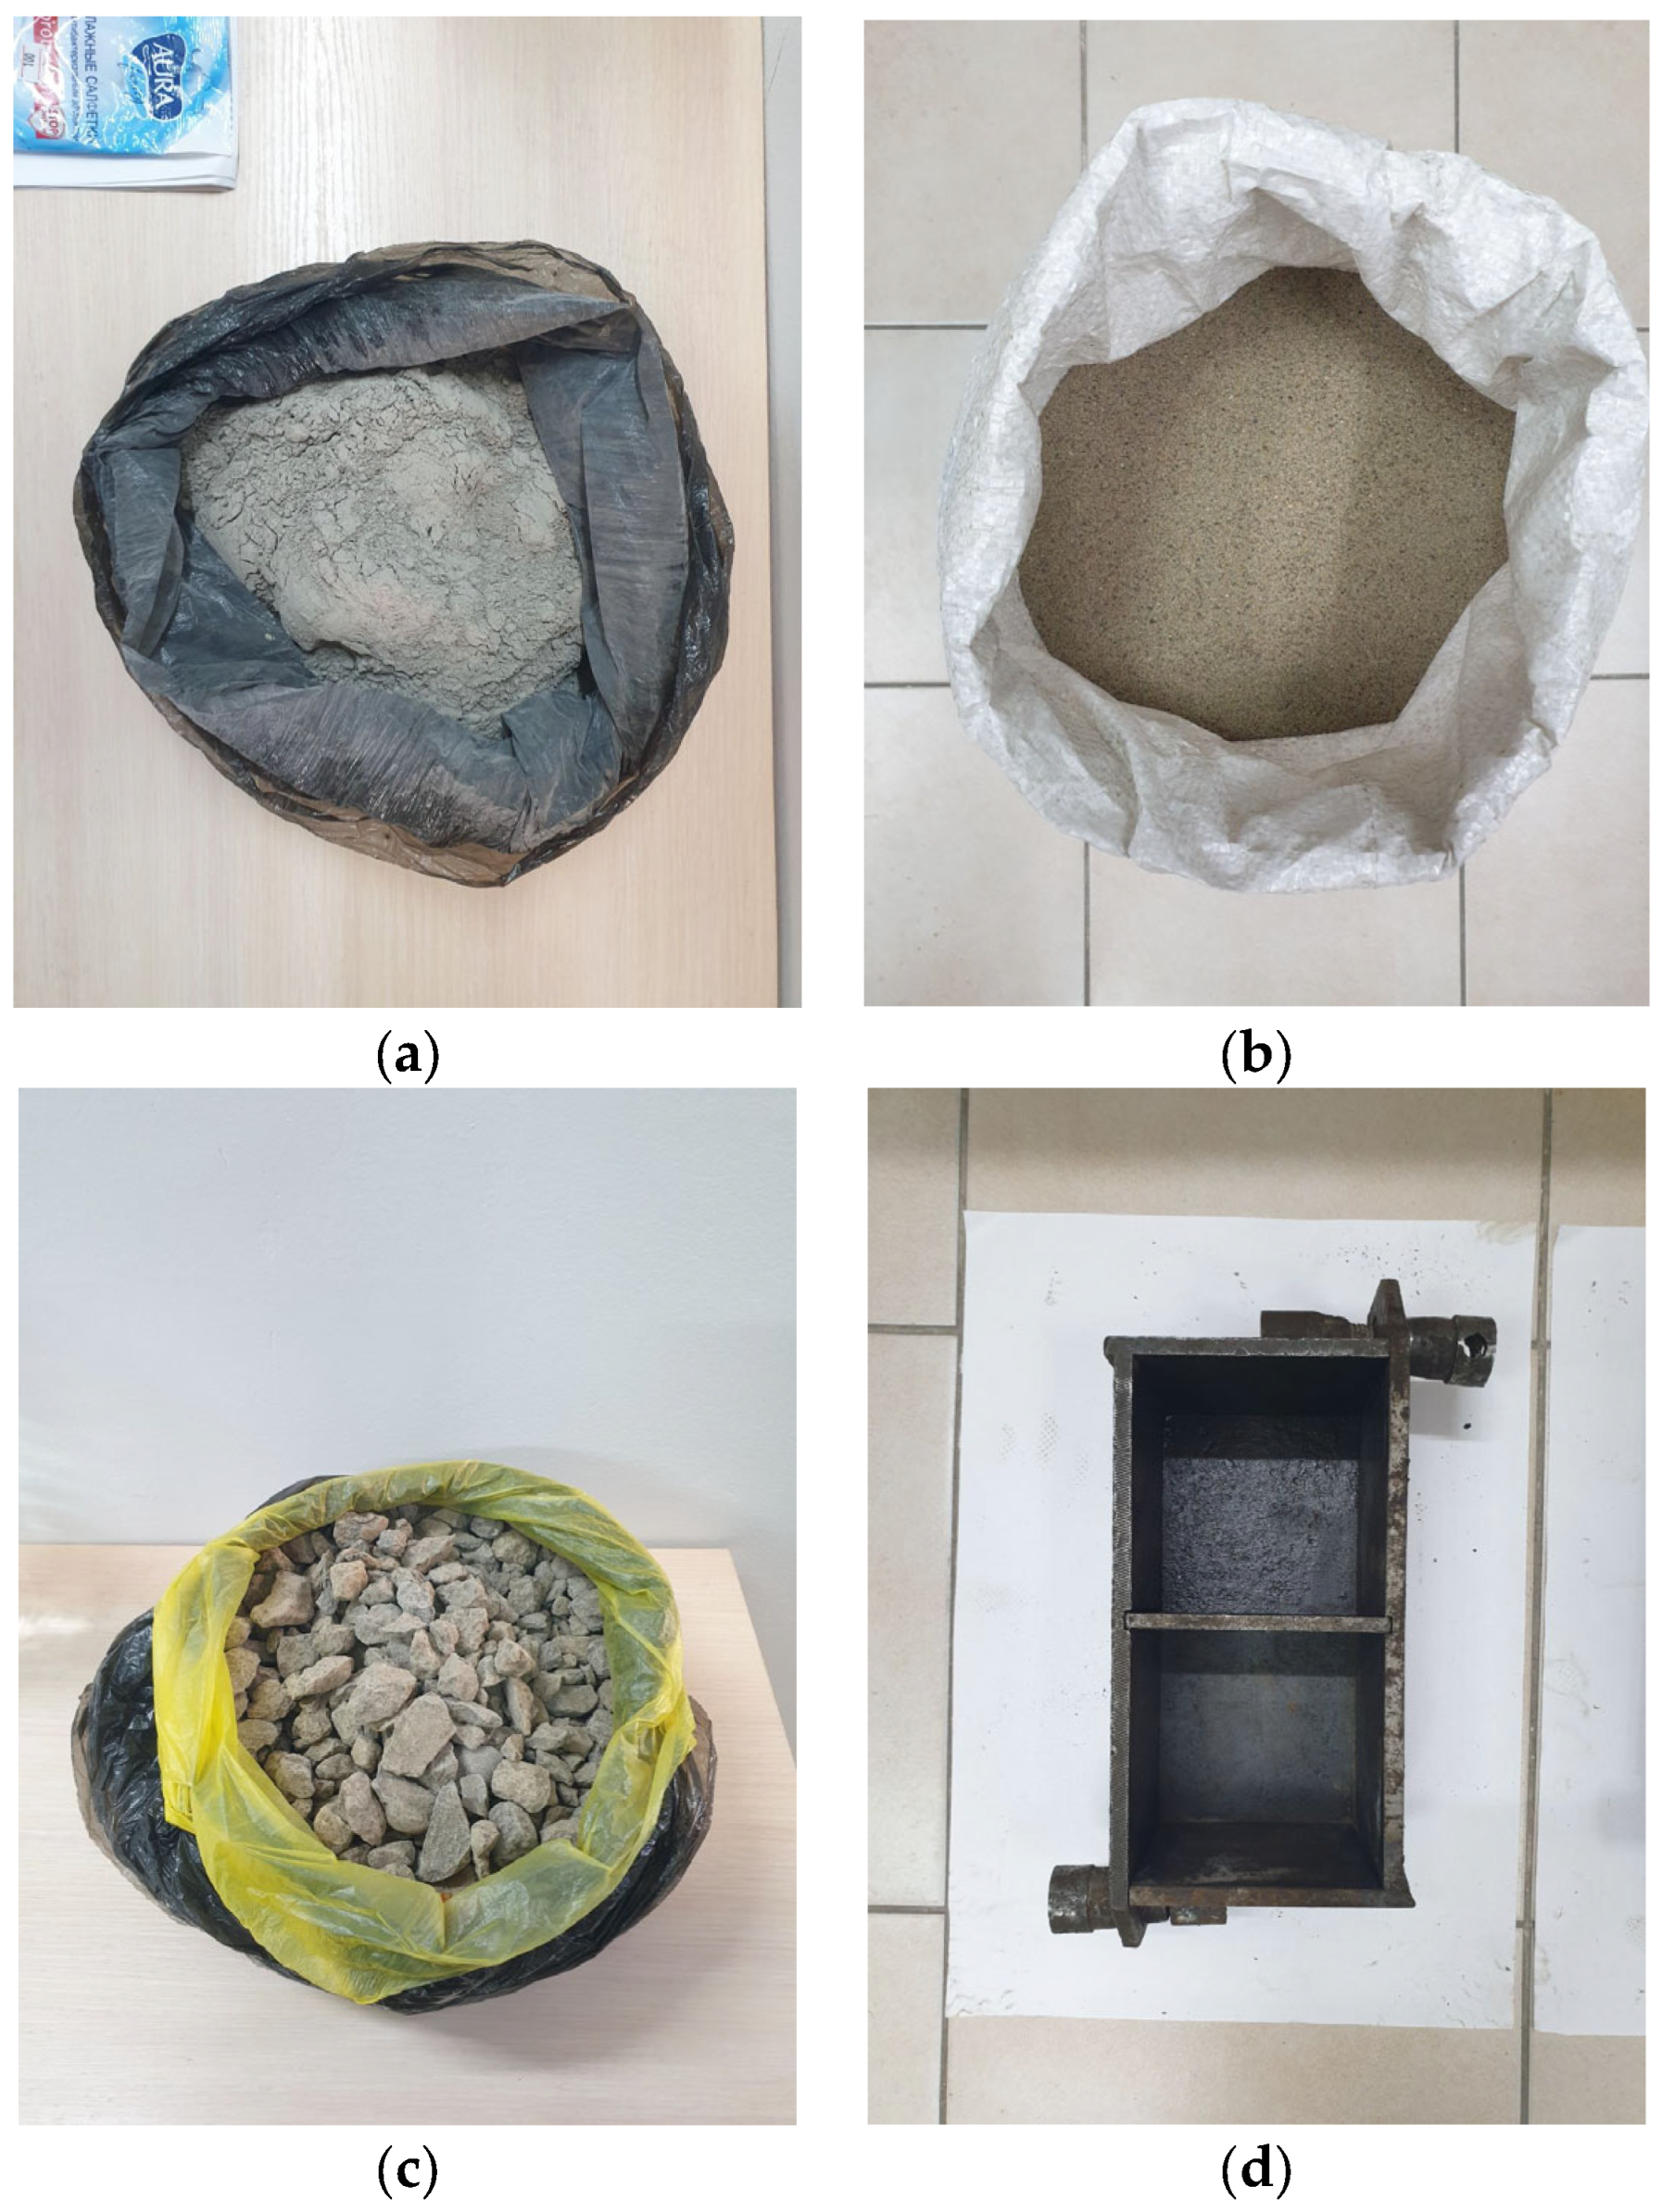
After preparing the mixtures under different pH conditions, the mixtures were then placed within the metallic formworks and then monitored for 28 days. Some of the materials used in the study are presented in Figure 1. The cube-shaped samples used in this study were prepared using formworks that adhered to the recommendations in the GOST 22685-89 standard [29]. The metal molds (2FK-100) (GK-Tasimal LLP, Almaty, Kazakhstan) had a dimension of 10 × 10 × 10 cm each. Table 1 provides a summary of the physicochemical parameters of the Portland cement used in the study.
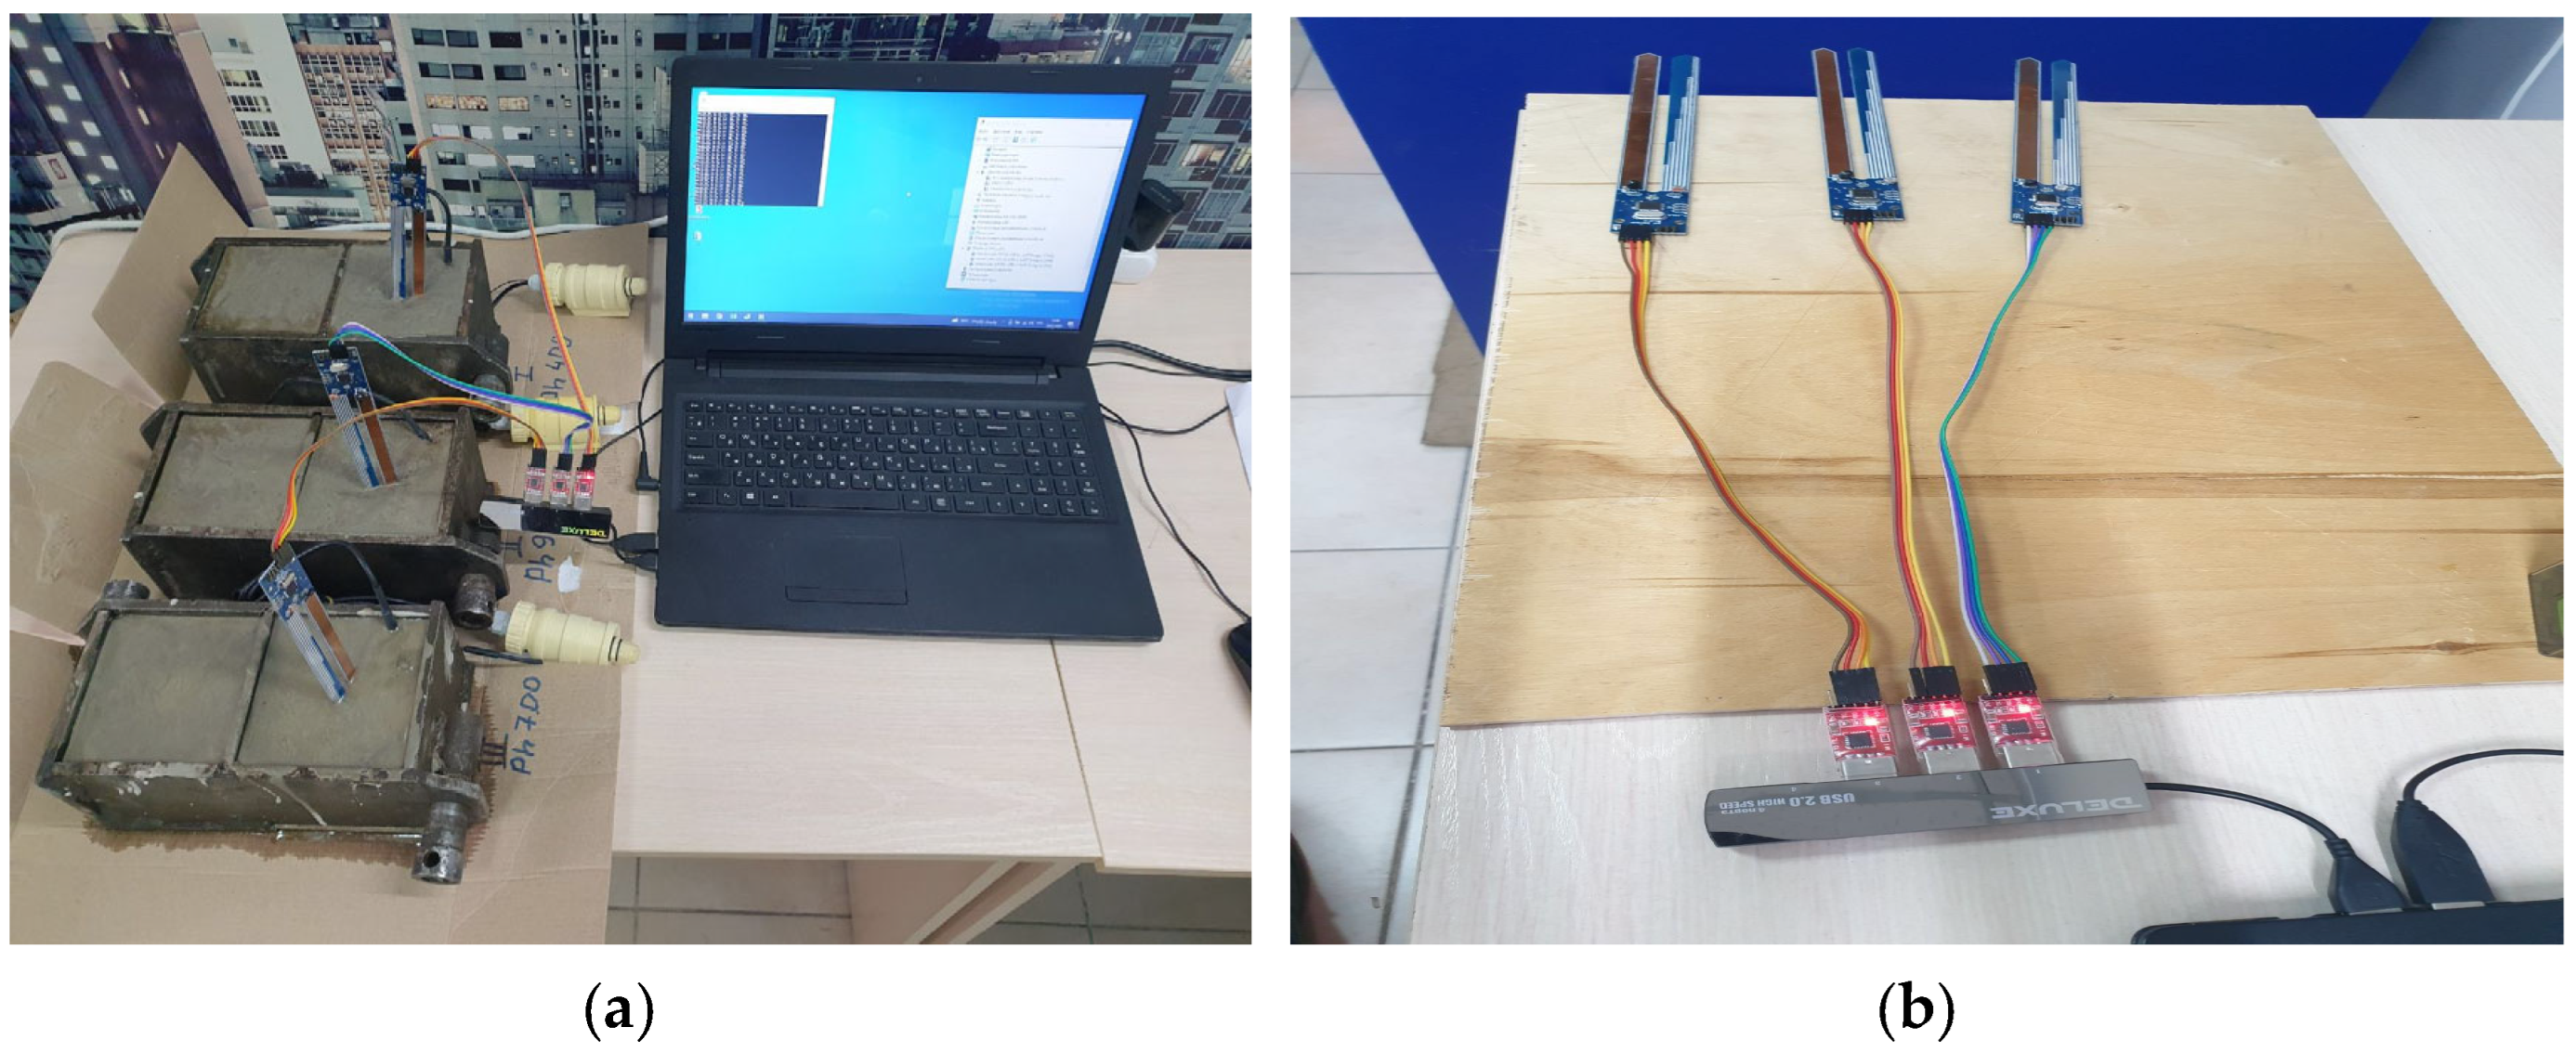
All of the investigations were carried out in a standard laboratory setting with a constant external temperature of approximately 20 °C. The experiment’s general technical process consisted of the following components and procedures that enabled simultaneous data collection from three pH-level sensors using a single personal computer (Figure 2):
  • Test setup and equipment calibration;
  • Preparing water with various pH content;
  • Preparing 3 types of concrete mixtures with a volume of 2 × 10⁻³ m3 each (Materials, Weighing machine (METTLER TOLEDO, Greifensee, Switzerland) with capacity of 5 kg, Plastic bottles with a volume of 5 L, Bucket, Standard formworks for 10 × 10 × 10 cm concrete cubes (GK-Tasimal LLP, Almaty, Kazakhstan), Concrete mixer (Gilson Company Inc., Lewis Center, OH, USA);
  • Preparing cubic specimens;
  • Monitoring pH and Curing temperature each 30 min till the concrete age of 28 days;
  • Measure the concrete strength of specimen of each type using a sclerometer (nondestructive ultrasound method GOST 22690 [30]) once a day on each side to get a daily average;
  • Estimate concrete strength by Maturity method (ASTM C1074 [31]) using temperature history and strength-maturity relationship retrieved for all 3 types of compositions preliminarily in the lab—average for each day;
  • Estimate strength values for each 30 min from the functions of the strength curves of GOST 22690 [30] and ASTM C1074 [31];
  • Measure the concrete strength of a specimen of each type using a Hydraulic press (destructive method GOST 10180 [32]) on the 28th day;
  • Correlation analysis to explore the interrelationship between parameters and the impact of pH on the concrete strength gain.

2.2. Measurements of the Concrete Density and Porosity

According to the ASTM D4404 standard, mercury intrusion porosimetry tests were conducted to assess the pore volume and pore volume distribution of cement mortars made with water that has various pH values [33]. By applying pressure to mercury, which is non-wetting, mercury porosimetry estimates the pore size distribution and measures the related intrusion amount. With this technique, the pore size may be quickly determined and ranges from a few nm to 1000 µm [33].

2.3. X-ray Diffraction

To stop the hydration process, the solidified cement pastes were broken into small pieces and submerged in anhydrous ethanol for 24 h. The powdered cement paste particles were further ground to a particle size of less than 80 microns and baked at a temperature of 60 °C in a vacuum oven (TEFIC Biotech, Weiyang District, Xi’an, China). By using X-ray Diffraction Instrument (Bourevestnik, JSC, Saint Petersburg, Russia) with a scan rate of 10°/min and a scanning range of 5–85° (2θ), the cement powders were analyzed. In order to achieve various calcium-silicate-hydrate (C-S-H) gel structures during their hydration, a series of experiments with pure synthetic tri-calcium silicate (C3S) and bi-calcium silicate (C2S) (major components of the Portland cement clinker) were planned.

2.4. Statistical Analysis

2.4.1. Parameters’ Correlation

The correlation indices were computed based on concrete strength gain parameters of interest. The strength of the relationship between the selected concrete strength gain parameters was determined in large part by these indices. According to the indices, a high correlation generally indicated that two or more variables were strongly associated with one another. If there was little connection, the variables were not strongly correlated. The correlation was rated as follows: “poor,” “moderate,” “strong,” and “very strong” (0.3–0.49, 0.5–0.69, and 0.7–1, respectively).

2.4.2. Data Distribution Analysis

Utilizing box and whisker graphs, the data distributions among the prescribed concrete strength gain parameters were assessed. Data quartiles, sometimes referred to as percentiles and averages, were used to assess the distribution of data based on the skewness of the numerical data.

2.4.3. Analysis of Variance

Additionally, a Single-factor Analysis of Variance (ANOVA) was used in this study to assess the statistical significance of the differences in the strength gain parameters. Using samples from each group, the approach assesses the level of variation within each group of data from the investigated parameters. The significance level was evaluated using the difference between the p-values and alpha (0.05) values. It’s also crucial to remember that the alpha number reflects your likelihood of rejecting the null hypothesis even if it is accurate. If the p-value is more than the alpha value, the null hypothesis is accepted. However, the p-value indicates the likelihood of obtaining a result that is more extreme than the one you got from the experiment.

2.4.4. Tukey’s Honest Significance Test

Moreover, the investigation used Tukey’s Honest Significance Test, a single-step multiple comparison procedure and statistical test. It was employed to ascertain whether there were any statistically significant variations in the means of the parameters under investigation.

3. Results

3.1. pH Analysis

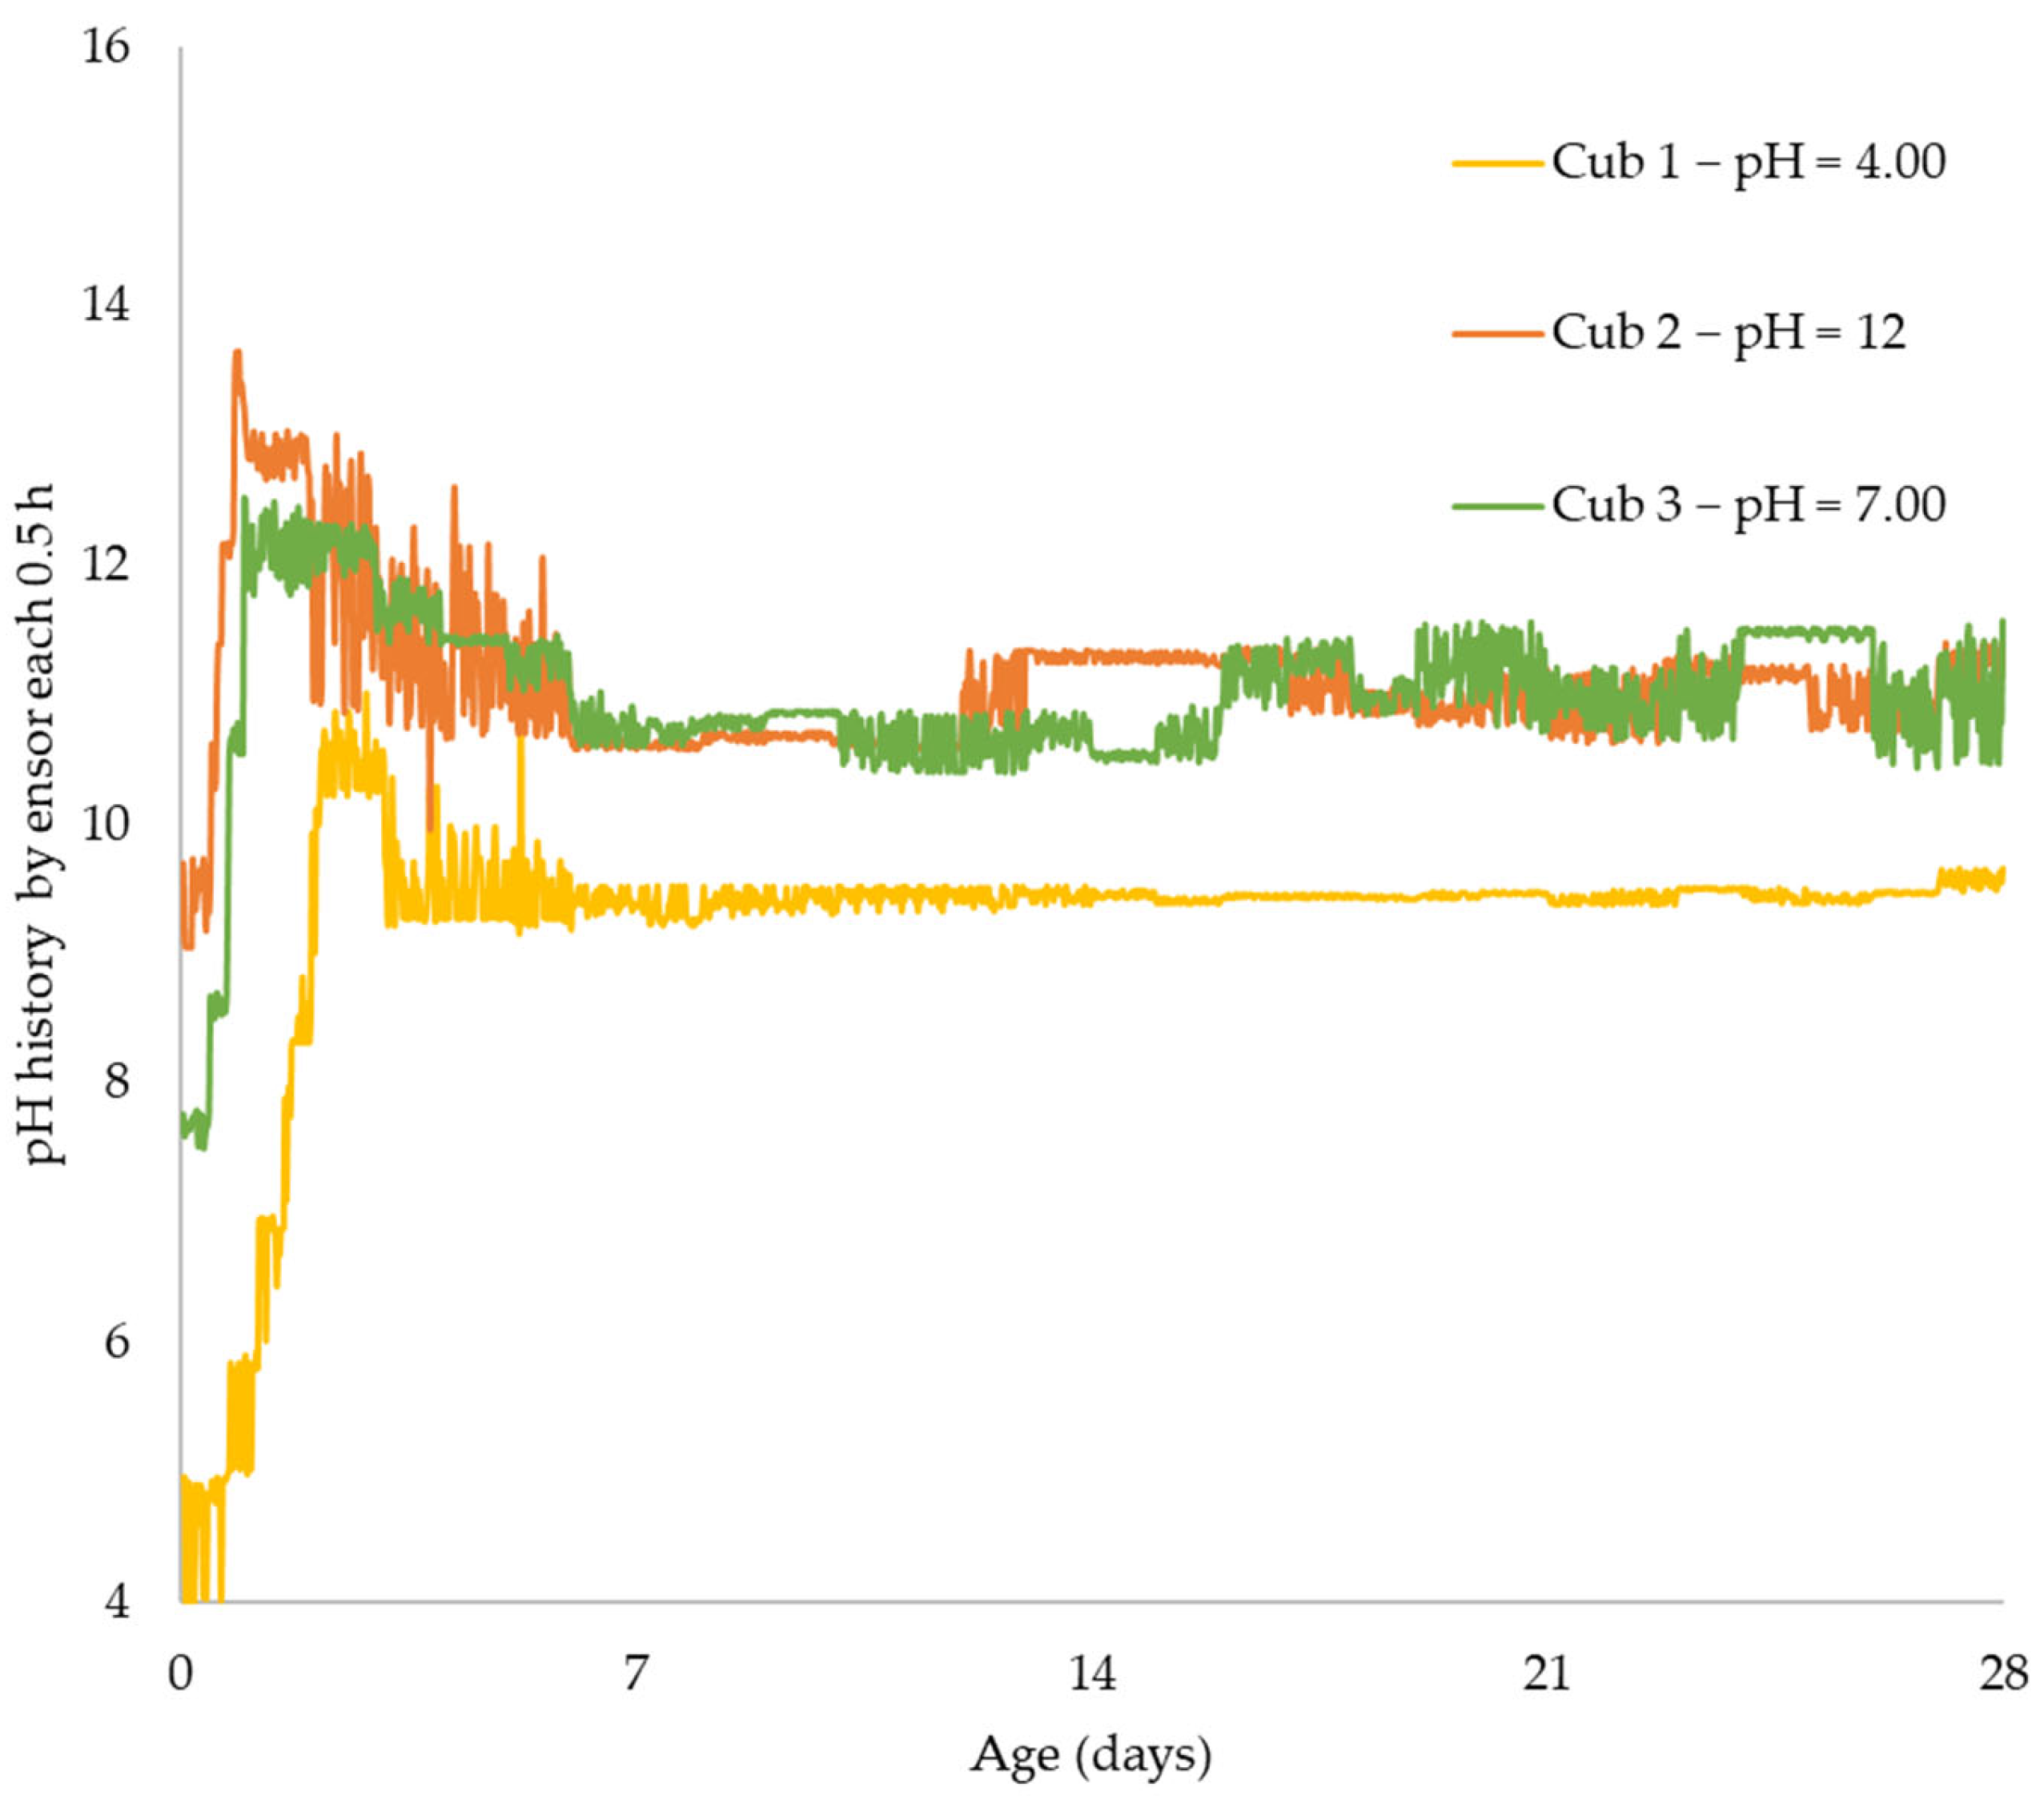
After mixing, the sensors were used to keep track of the samples’ pH trends. This was done to investigate how the pH in the samples generally changed over time. From Figure 3 it can be seen that the pH from all the samples increased rapidly during the first days of the experiment and then slightly decreased with time. It should be noted that, although the pH of concrete is initially high, it usually decreases over time. The phenomenon can be linked to the fact that almost any substance that comes into contact with the concrete and has a pH lower than 7 will interact with its alkalis and neutralize its basic nature. The pH of the concrete then decreases as a result of this interaction. Moreover, it is worth noting that fresh concrete interacts with acids so quickly that even atmospheric carbon dioxide starts to balance the alkalis.
In general, concrete pH remains to be an important aspect because concrete begins to suffer consequences when its pH falls below a level of approximately 11. When that happens, the chemical makeup of the cement will have changed sufficiently so that it can no longer tightly connect the aggregate particles. As a result, the concrete can start to crack. The exterior layers of the concrete are first impacted by this type of damage. The broad term for flaking, chipping, or other types of concrete damage is spalling [34]. Deeper parts of the slab will be more easily affected by carbonation when the concrete’s surface begins to break away, whereby the concrete might soon be beyond repair due to damage. According to Pacheco et al. [35], Carbonation is a significant factor in the deterioration of concrete structures, which necessitates costly maintenance and conservation measures.

3.2. Temperature Monitoring

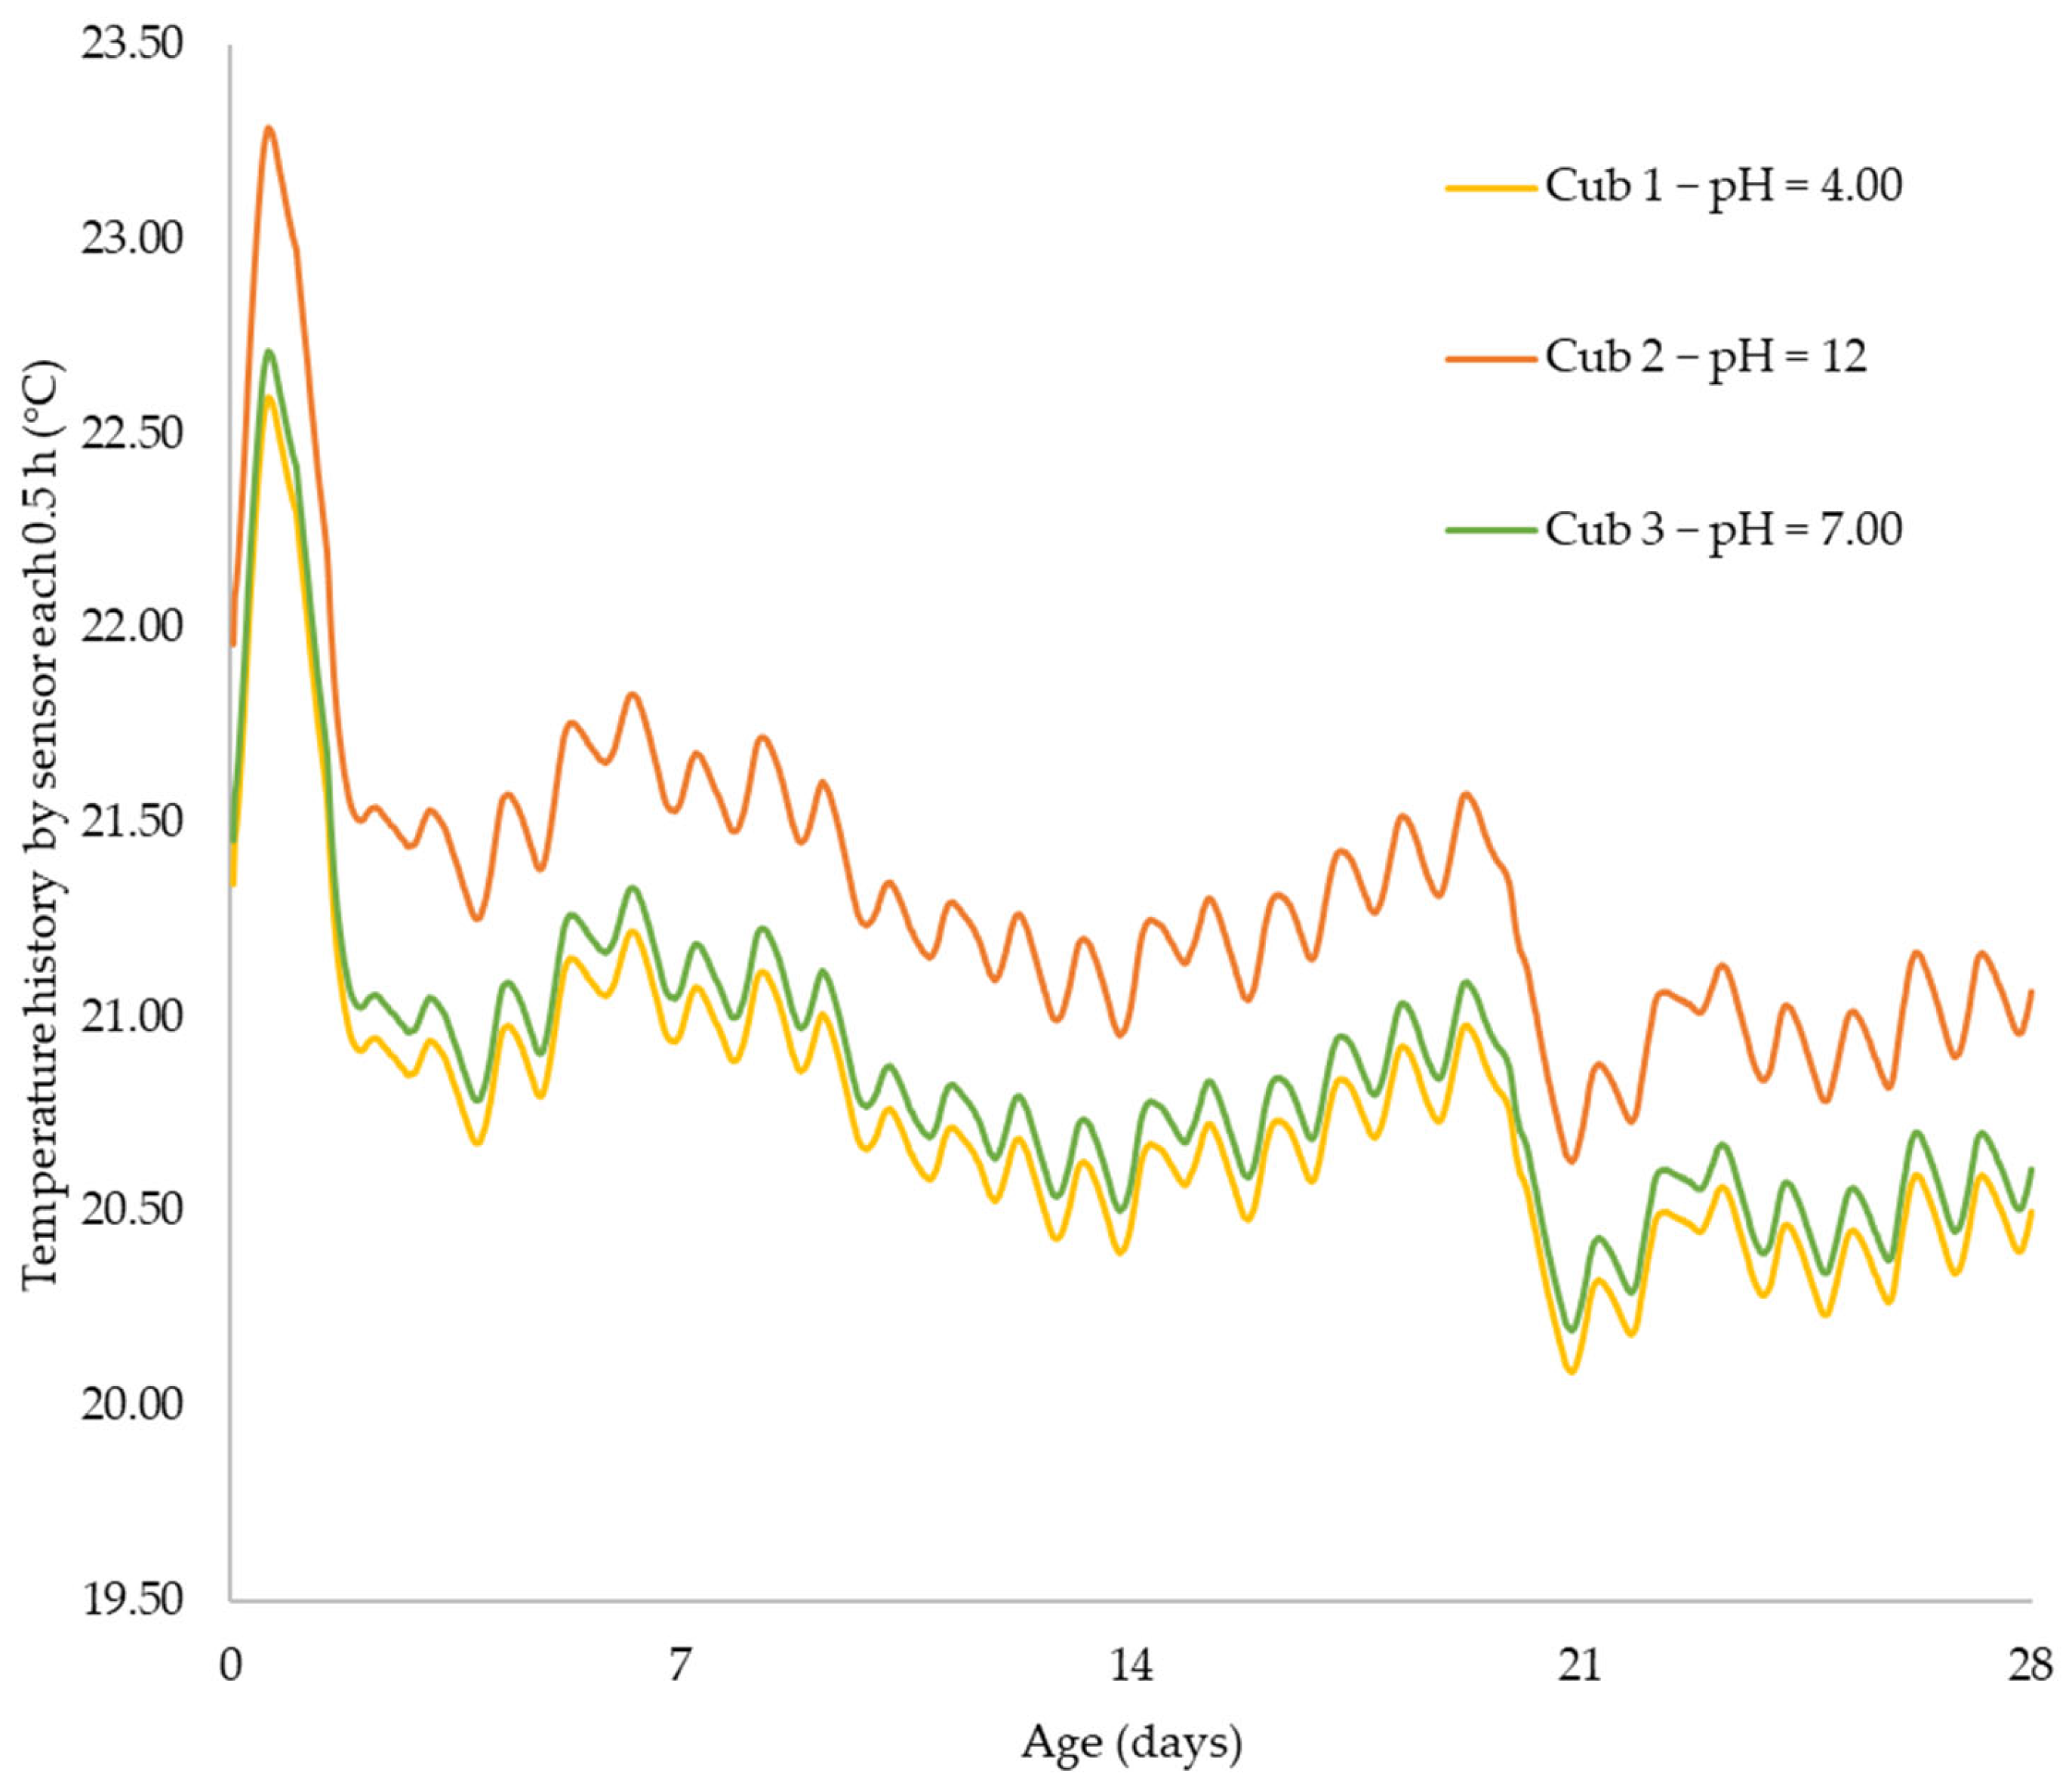
Similarly, the recorded temperature from the investigated samples was observed to increase rapidly during the first days of the monitoring process and then slightly reduced after one day (Figure 4). The circumstance is related to the fact that the cement hydration reactions cause the concrete to heat up in the early stages as it gains strength and it then cools down once the majority of the hydration is complete. The concrete is more susceptible to cracking during the early age cooling stage. Although the tensile strength of the concrete is rising, it is still low, and due to restraint, tension is also rising in the concrete as it cools. If the strength capacity of the concrete is not more than the produced tension at any point during this early stage, cracking will happen [36].
Table 2 also shows that the samples’ highest temperatures were produced under alkaline conditions. According to the Table, the minimum temperature value under acidic conditions was 20.1 °C, and the highest temperature value was 22.6 °C. Additionally, under acidic conditions, a minimum temperature of 20.6 °C was observed, with a high-temperature value of 23.3 °C. Furthermore, when the neutral conditions were applied, a minimum temperature of 20.2 °C was measured, with a maximum temperature value of 22.7 °C.

3.3. Physicochemical Properties

Density Monitoring

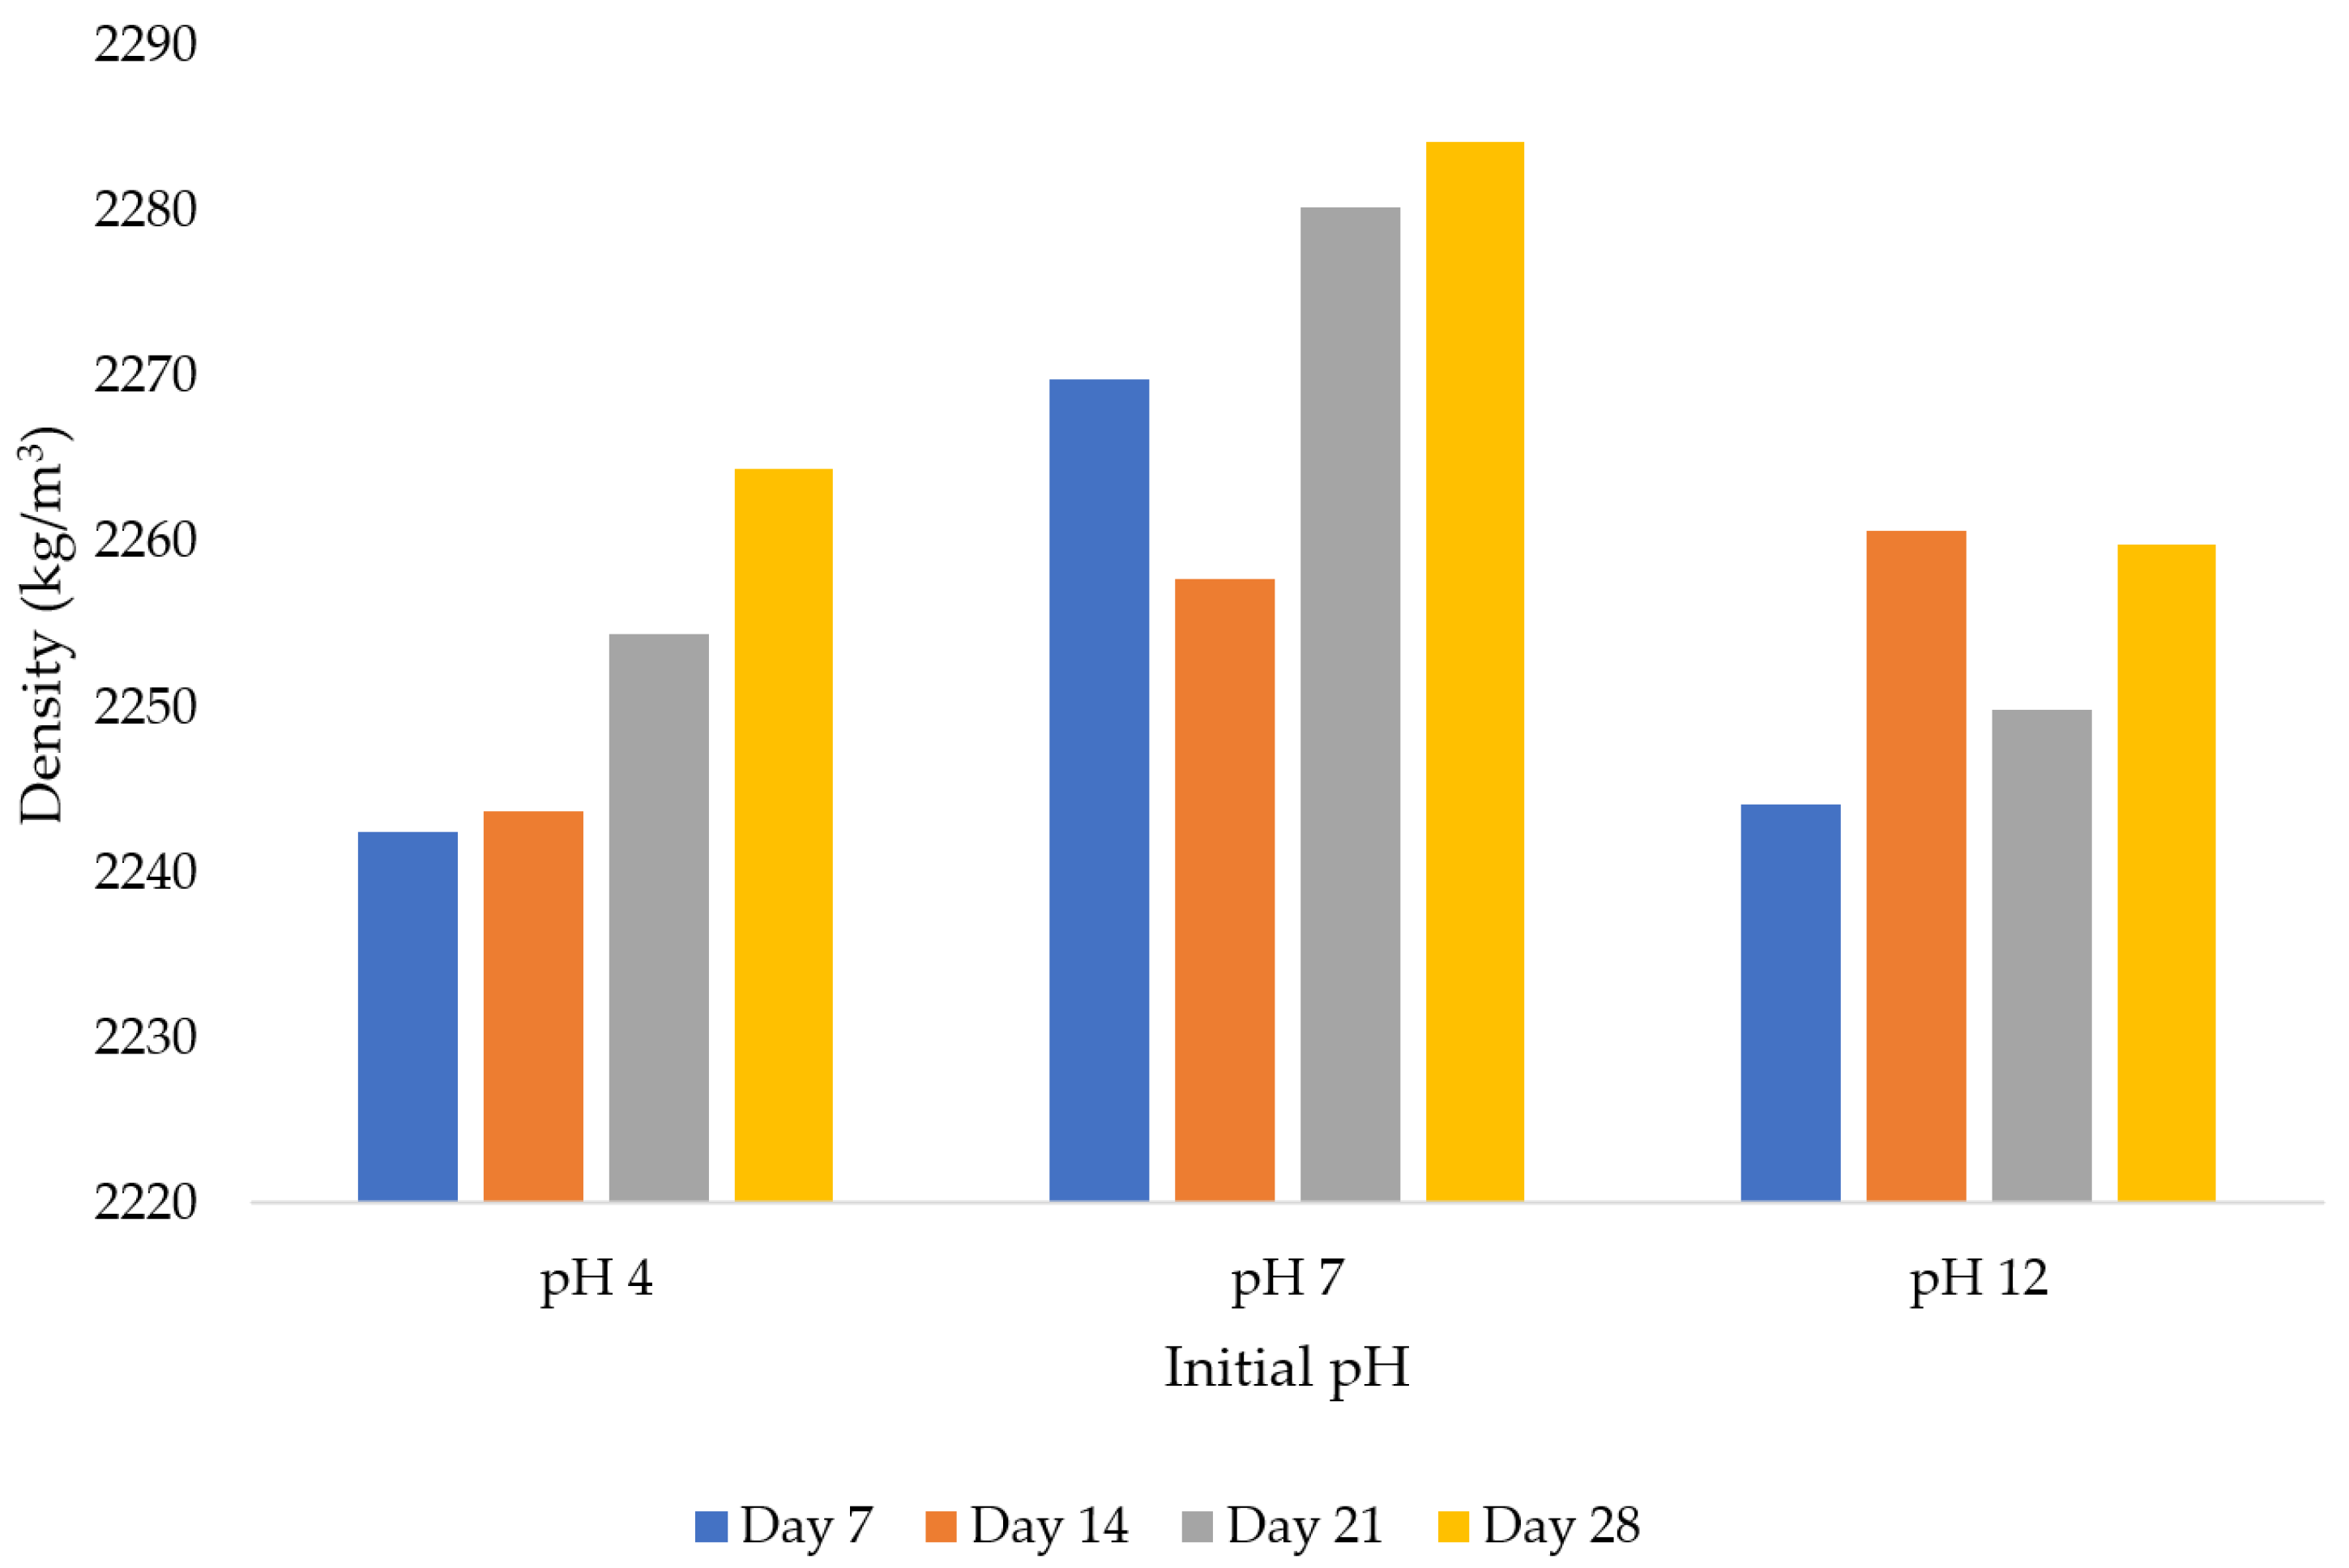
Figure 5 provides the summary of the average densities of the samples as determined by the initial mixing water pH levels and the curing time. From Figure 5, it can be seen that the density under the combination of pH = 4 and day 7 was 2242.4 kg/m3. The observed density under the combination of pH = 4 and day 7 was 2242.4 kg/m3 is equivalent to 1.21% less compared to the obtained within the same day under pH = 7 (2269.8 kg/m3). In addition, an average density of 2244.1 kg/m3 was retrieved from the combination of pH = 12 and day 7. From the results, we can state that the highest density was retrieved when the initial mixing water had a pH close to neutral. Similarly, the combination of pH = 7 and day 21 produced 2280.2 kg/m3 as an average density, which is approximately 1.13% higher than that of pH = 4 and 1.33% higher than that of pH = 12. However, it should also be noted that there were no appreciable differences in the densities retrieved from the samples.

3.4. Strength Gain Monitoring Using Sensors

3.4.1. Data Distribution

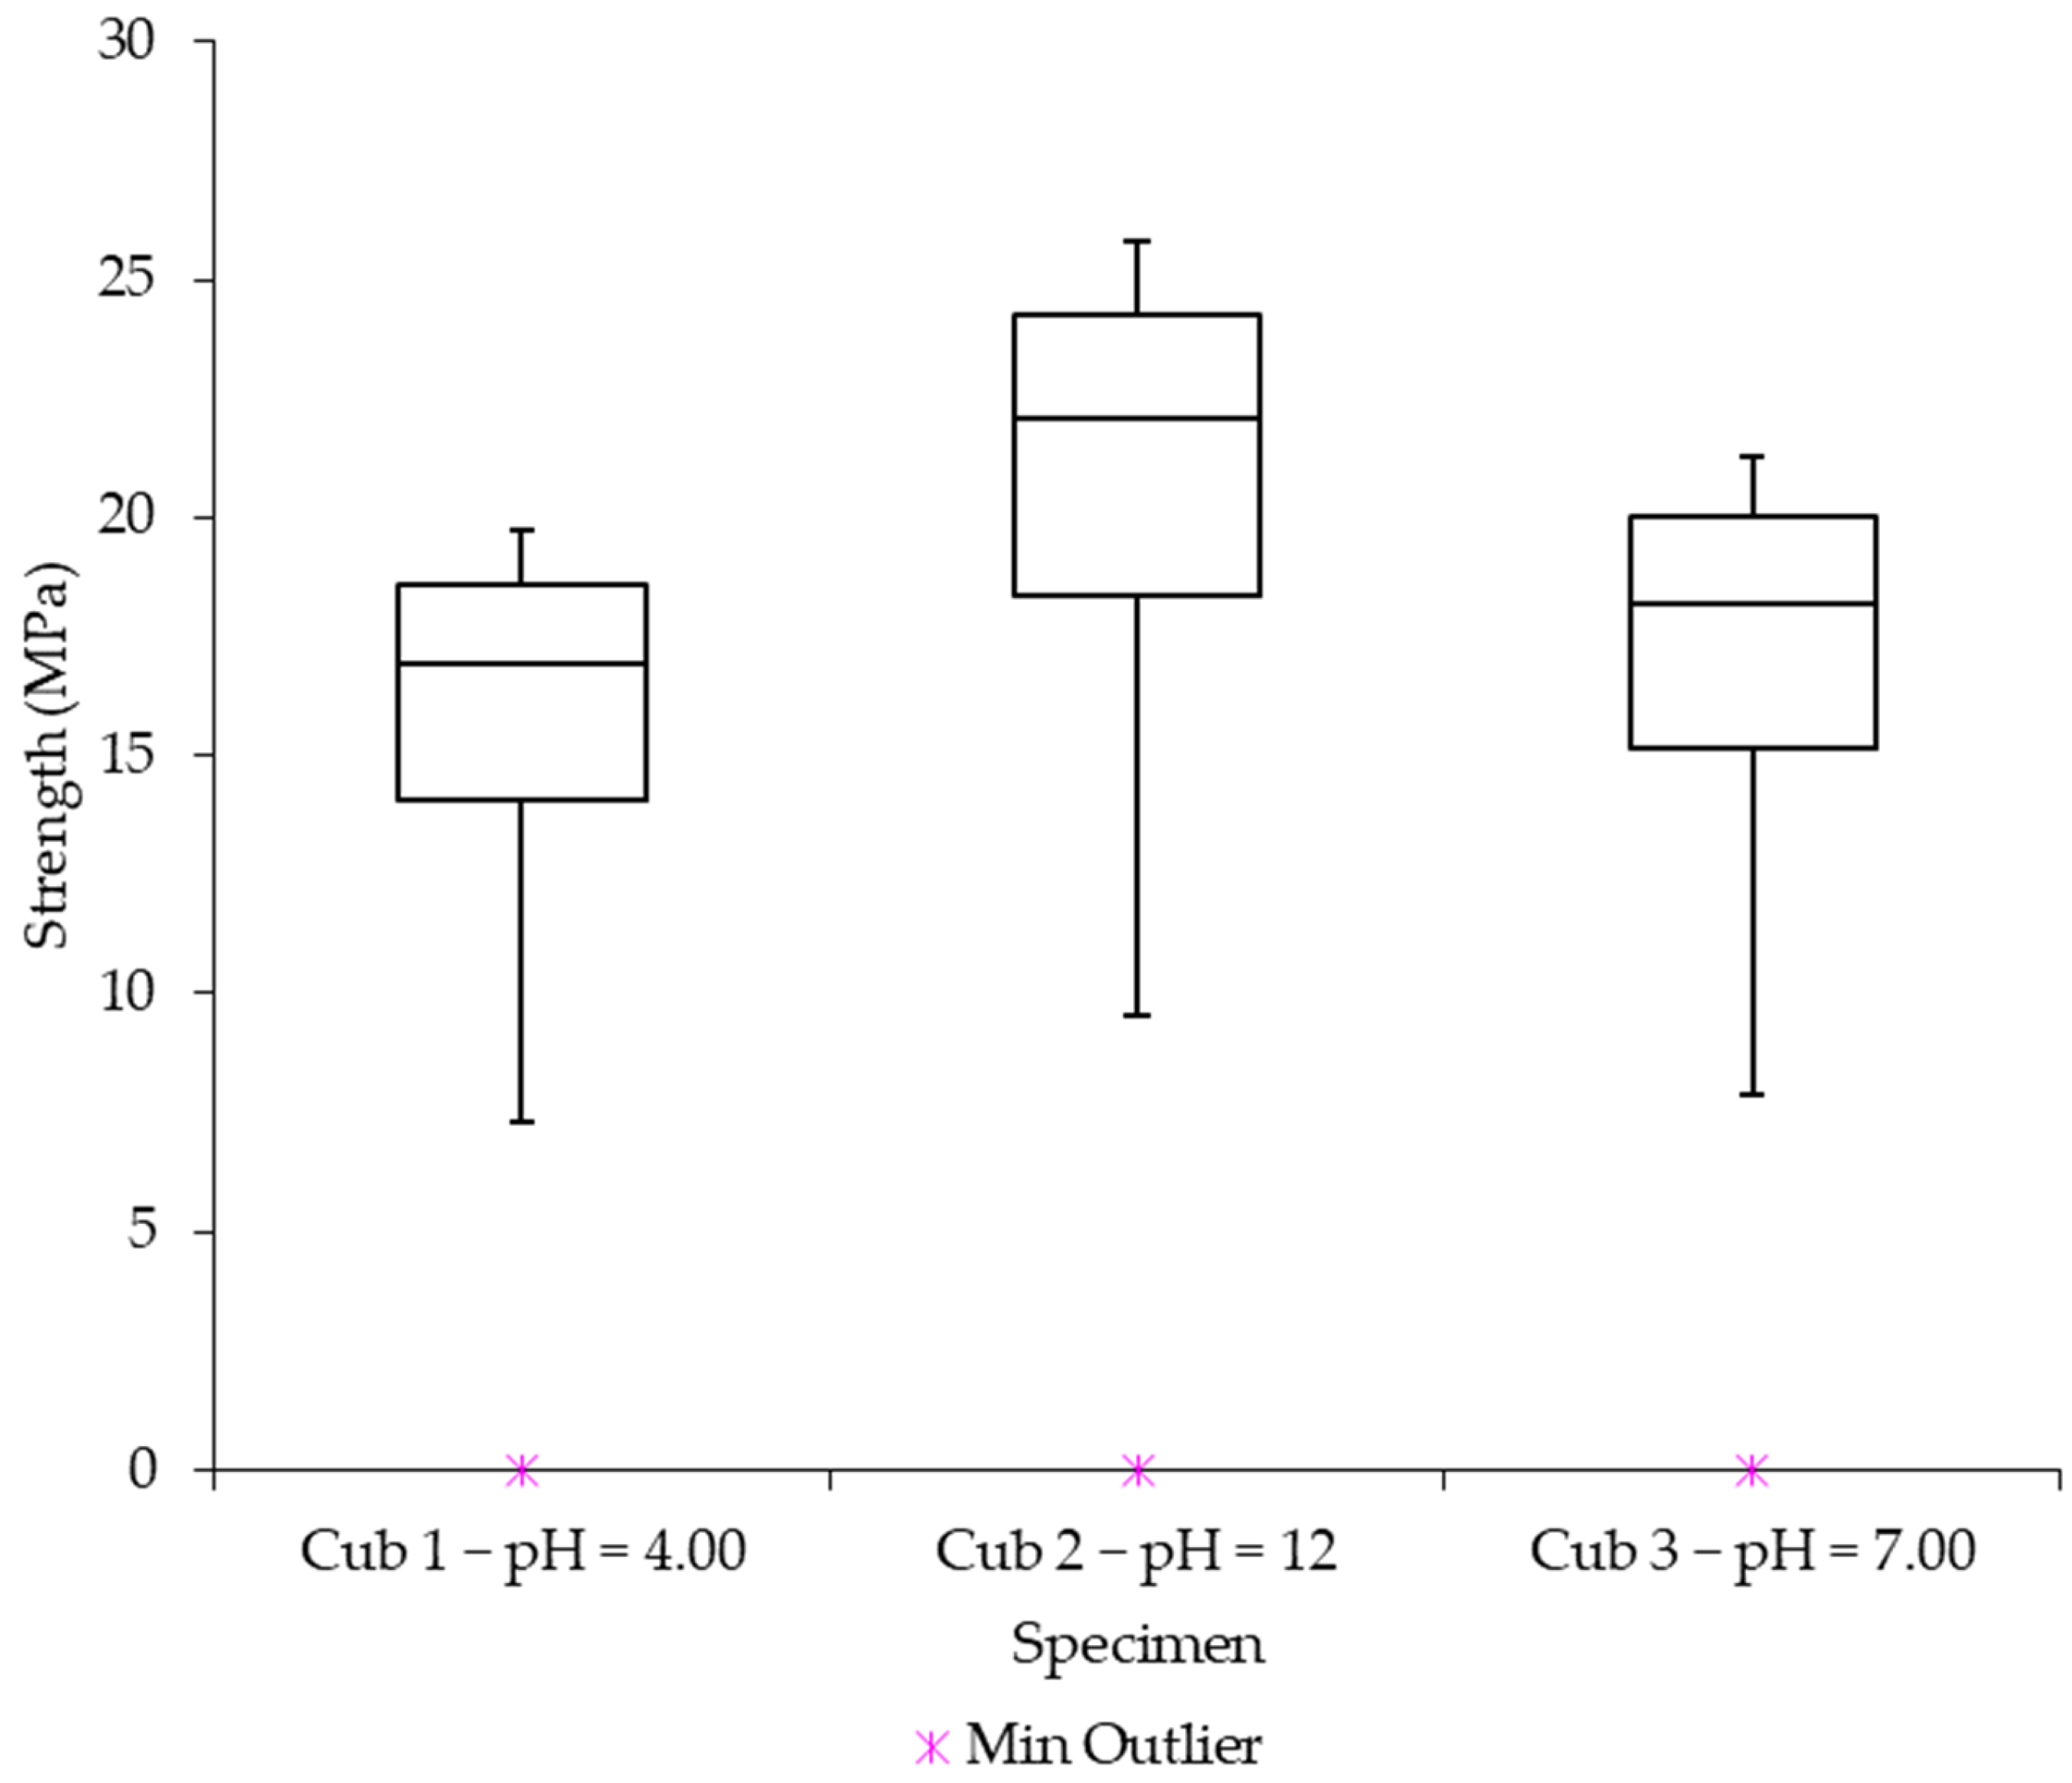
As noted earlier, box and whisker plots were created to evaluate the distribution of data from the monitored strength gain data based on the studied pH levels. The distribution of the data is depicted as being negatively asymmetrical in Figure 5 by the slight shift of the line defining the median of the median lines towards the upper quartile (Q3). This indicates that more low strength gain data values than low values within the data series make up the recorded strength data values in the monitored concrete samples. Additionally, Figure 6 shows that the samples developed the greatest strength when exposed to alkaline conditions (pH = 12).

3.4.2. Strength Gain Trend

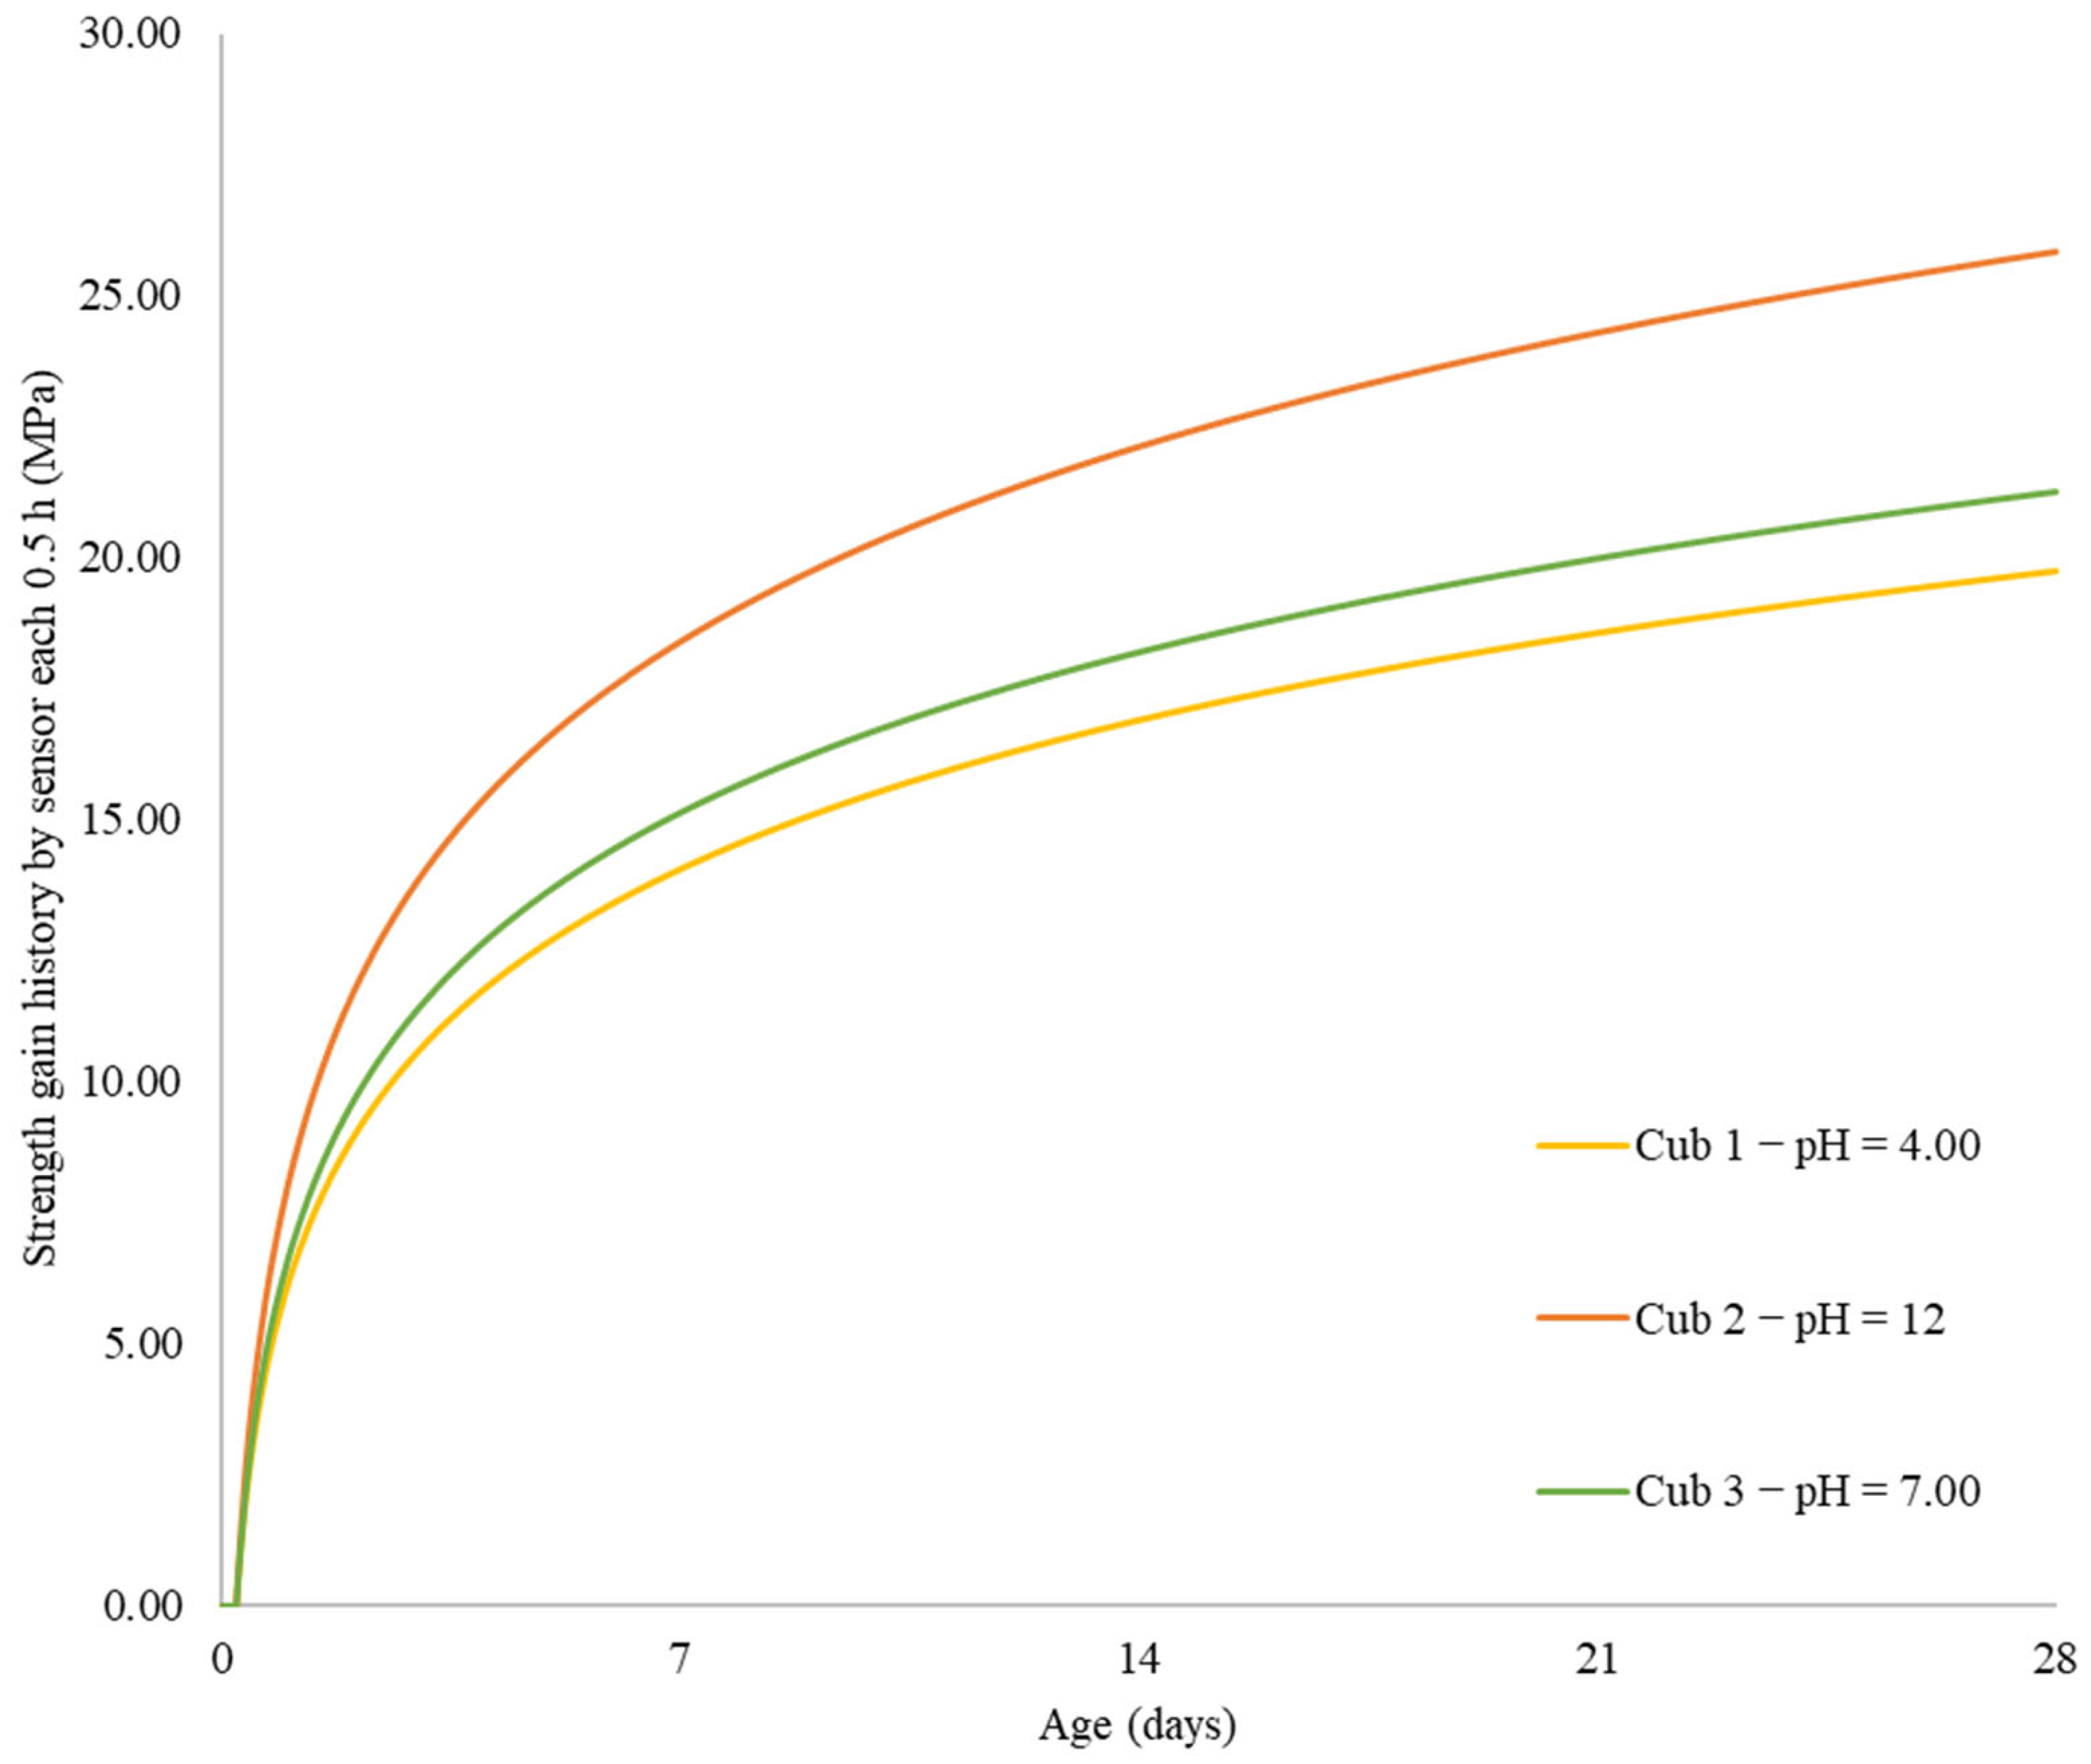
An overview of the strength gain data is shown in Figure 7 the sensor collected after each 0.5-h interval. The figure shows that concrete increased much of its strength within the first 7 days of the curing process, with a sharp strength gain within the first three days. In the literature [37,38], it has been observed that the concrete increases in strength by more than 15% in a day, approximately 40% in 3 days, 65% in 7 days, 90% in 14 days, and 99% in 28 days. As a result, the first two weeks after casting see a rapid increase in concrete’s strength (90% in just 14 days). As previously highlighted, when using sensors to monitor concrete strength gain with time, the concrete is equipped with sensors to measure different parameters including its temperature and humidity. In order to examine the maturity and strength-gain characteristics of concrete, concrete sensors continuously track the parameters of interest. However, it is also worth noting that the strength of the concrete is among its most significant indication of quality. Therefore, the most crucial factor that paints a picture of the overall quality of concrete is strength.

3.5. Strength Gain Analysis Using Sclerometer

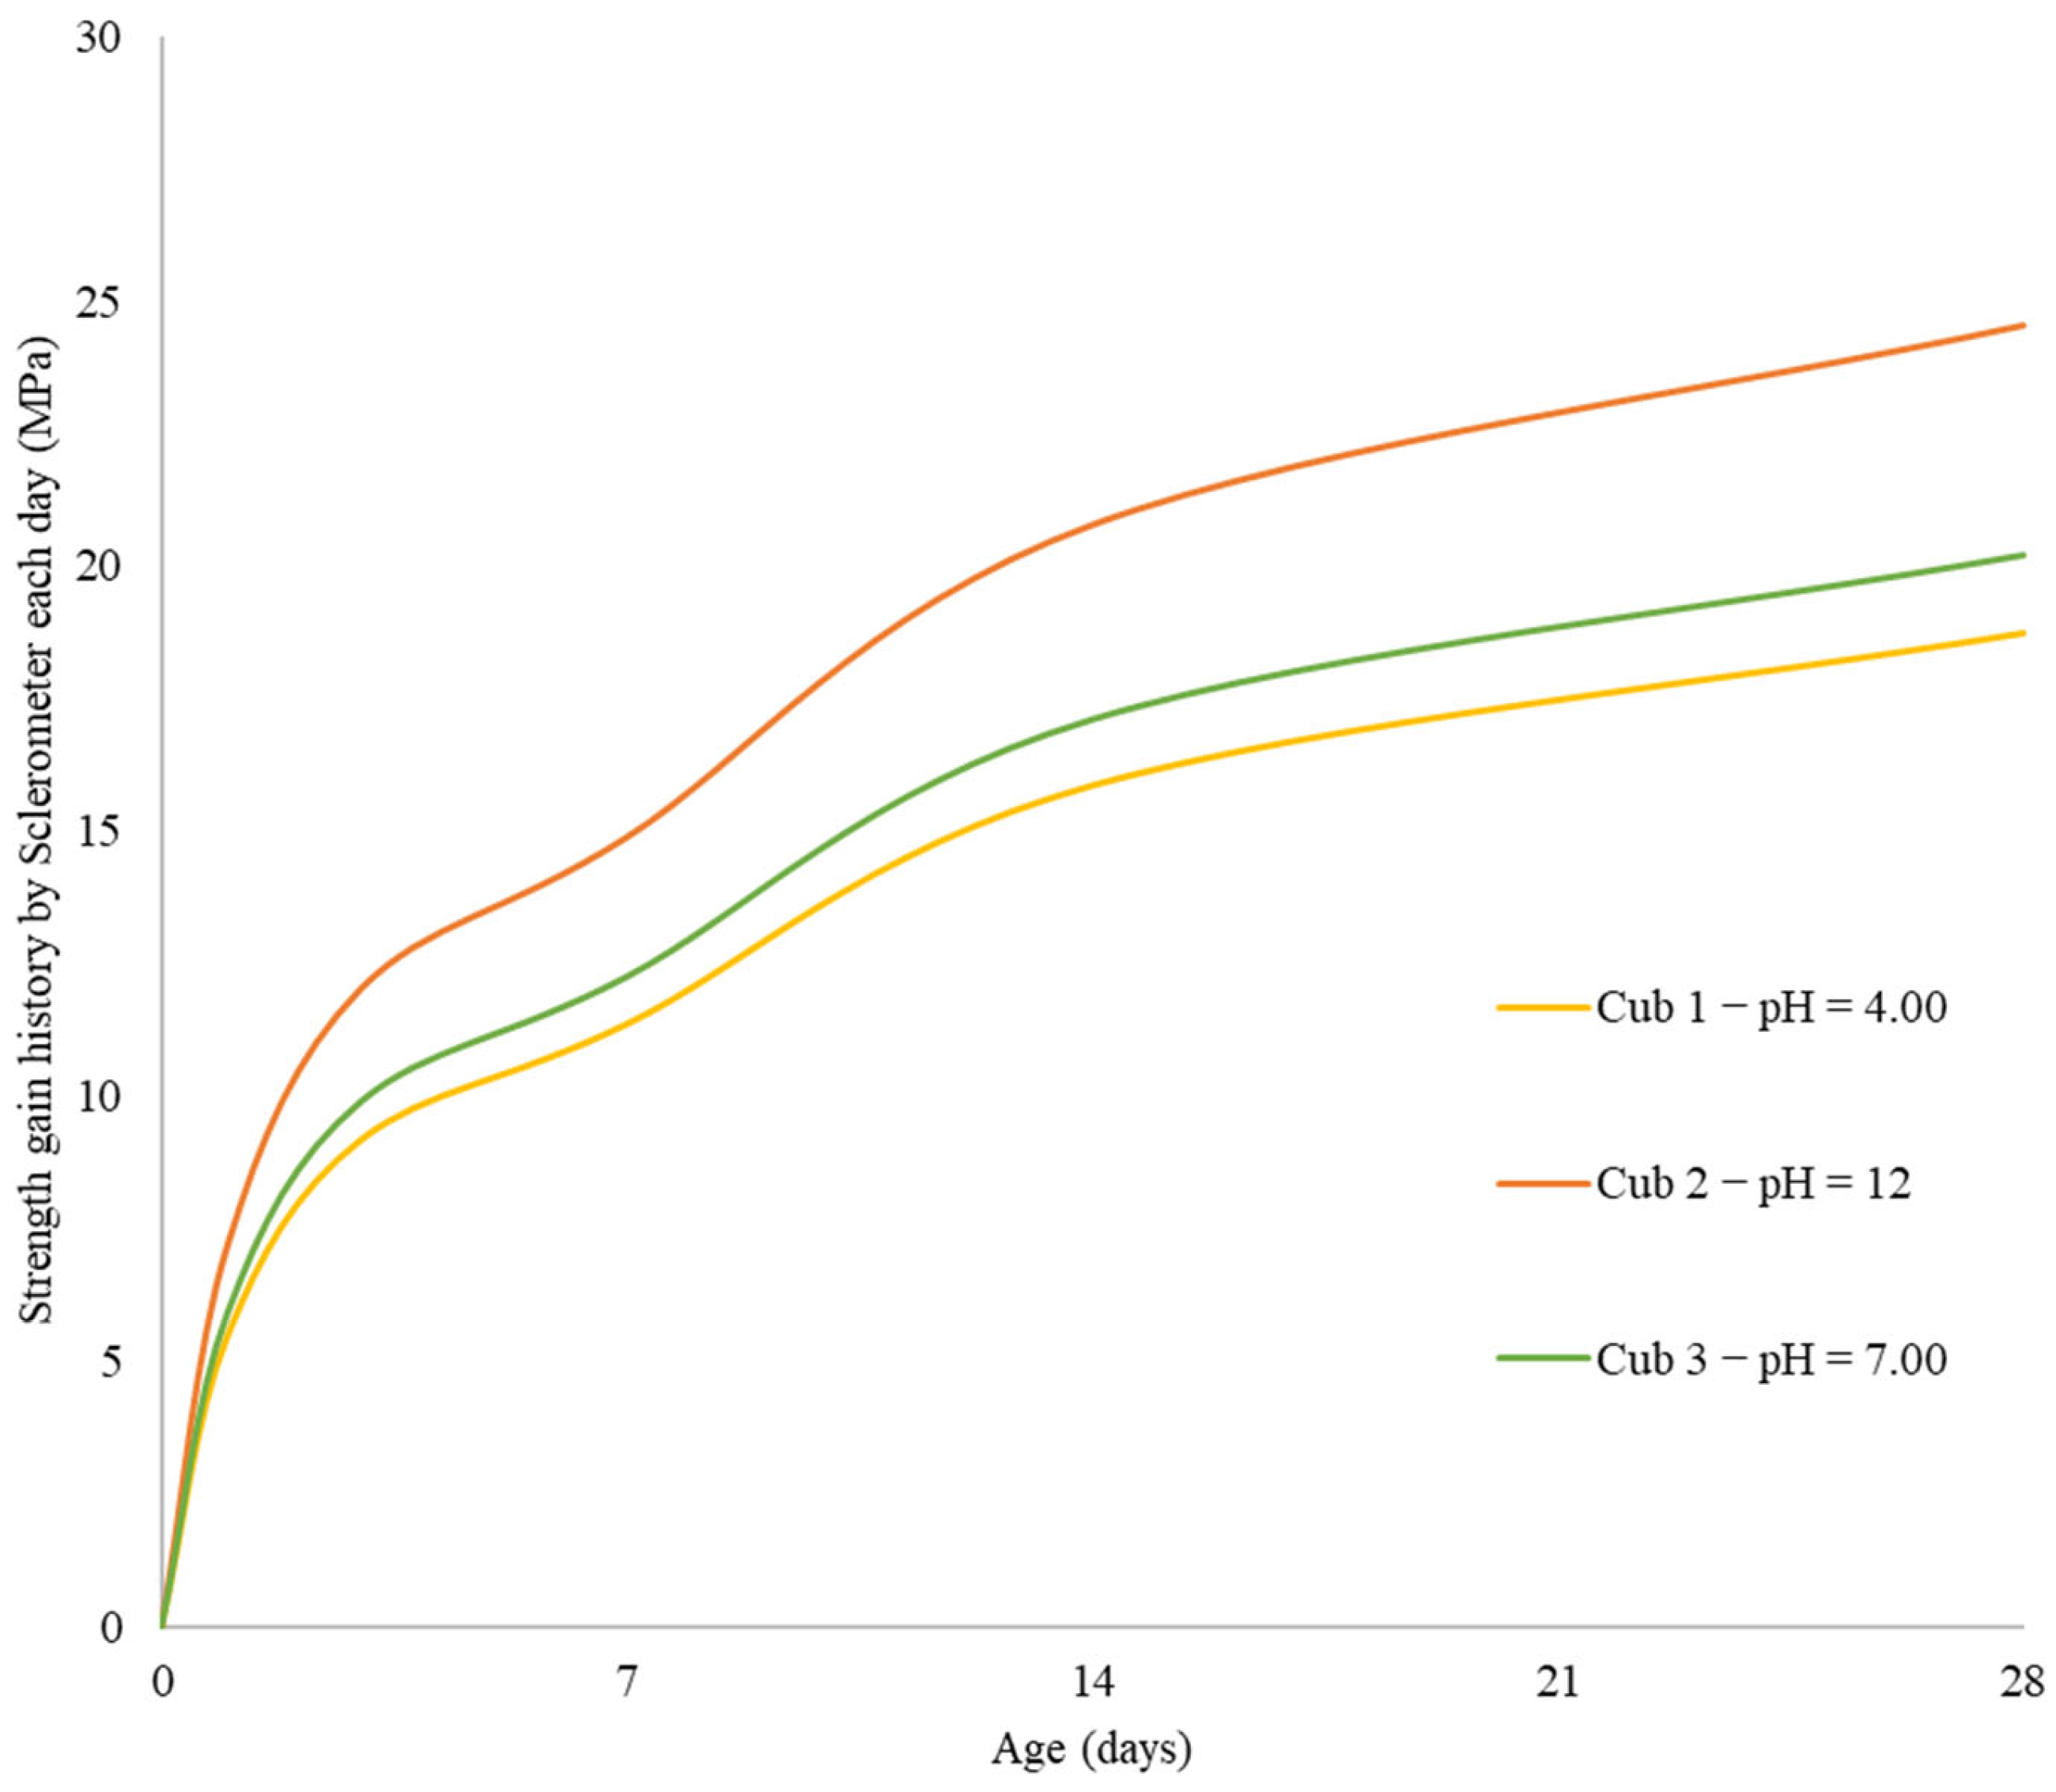
A summary of the findings from the strength gain monitoring using the Sclerometer is shown in Figure 8. The graph shows that concrete increased much of its strength throughout the first 7 days of the curing process, with a dramatic strength gain within the first three days, practically following the same trend as observed from the data gathered using the sensors. The foundation of the sclerometric test is the relationship between the compressive strength and surface hardness of concrete. A spring system releases a hammer mass after applying a sclerometer to the element. The mass strikes a plunger that is in touch with the concrete surface and subsequently bounces back at a specific distance, known as the rebound number [39].

3.6. Compressive Strength Monitoring

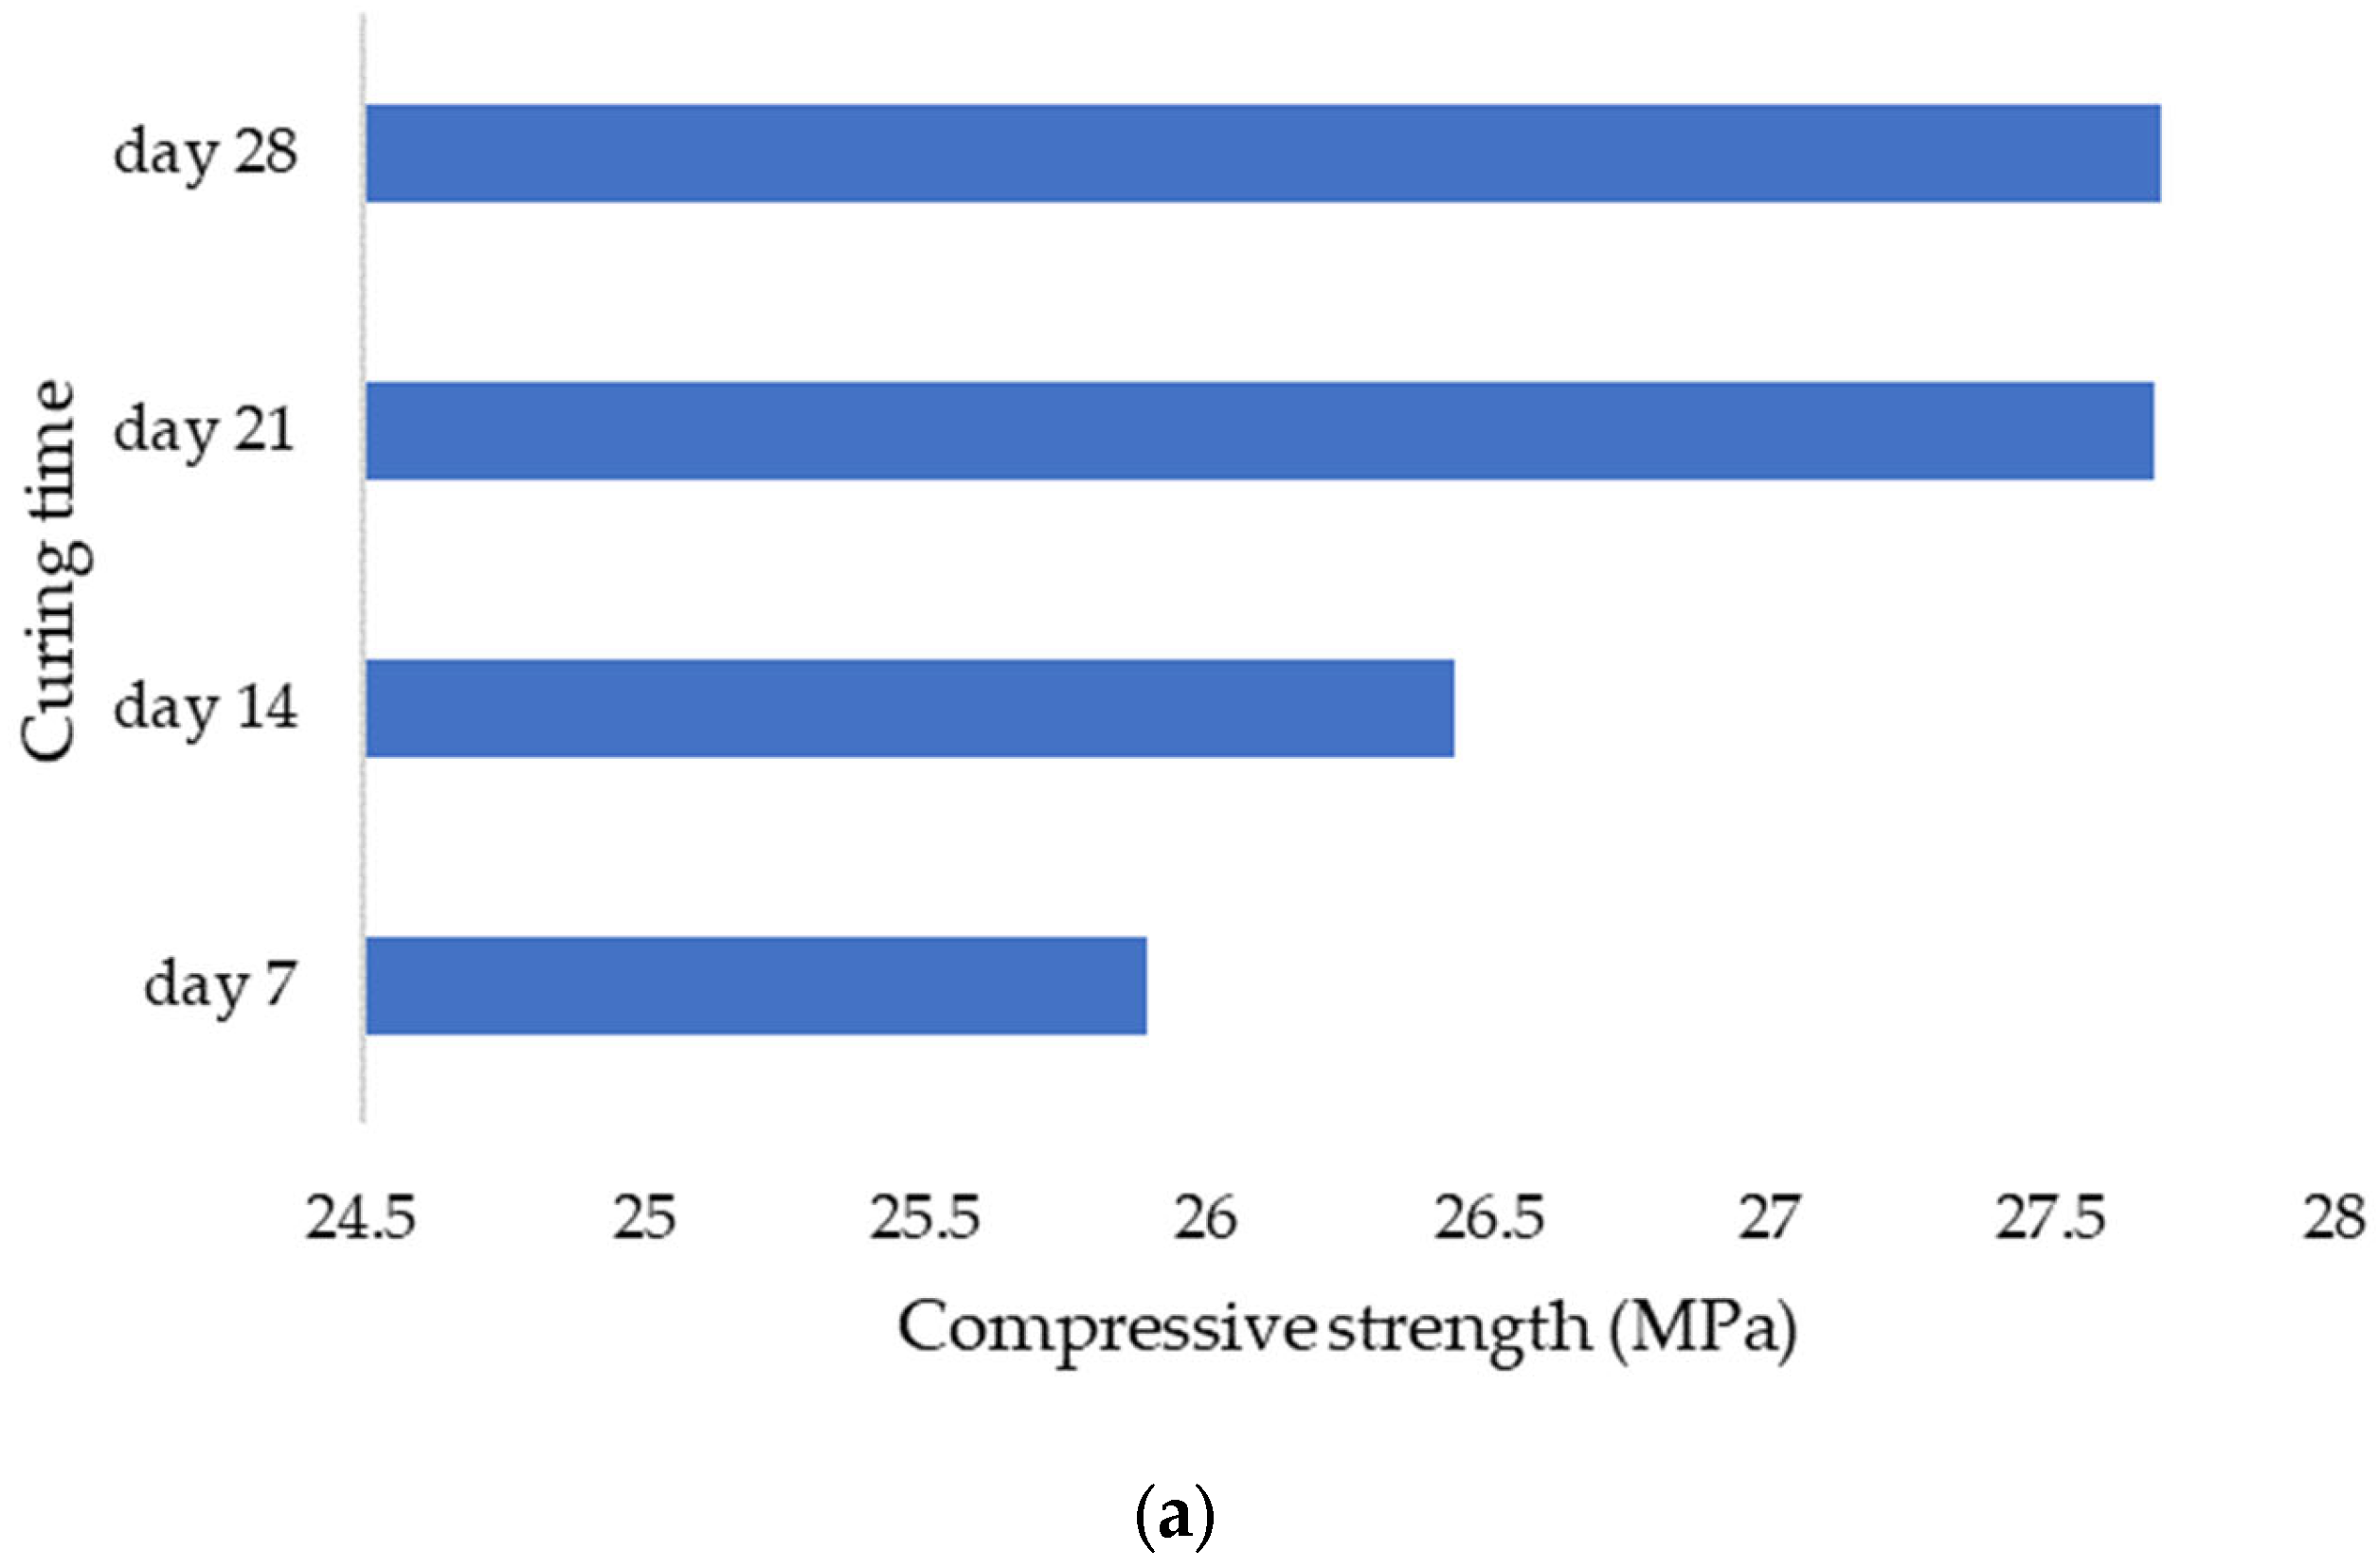
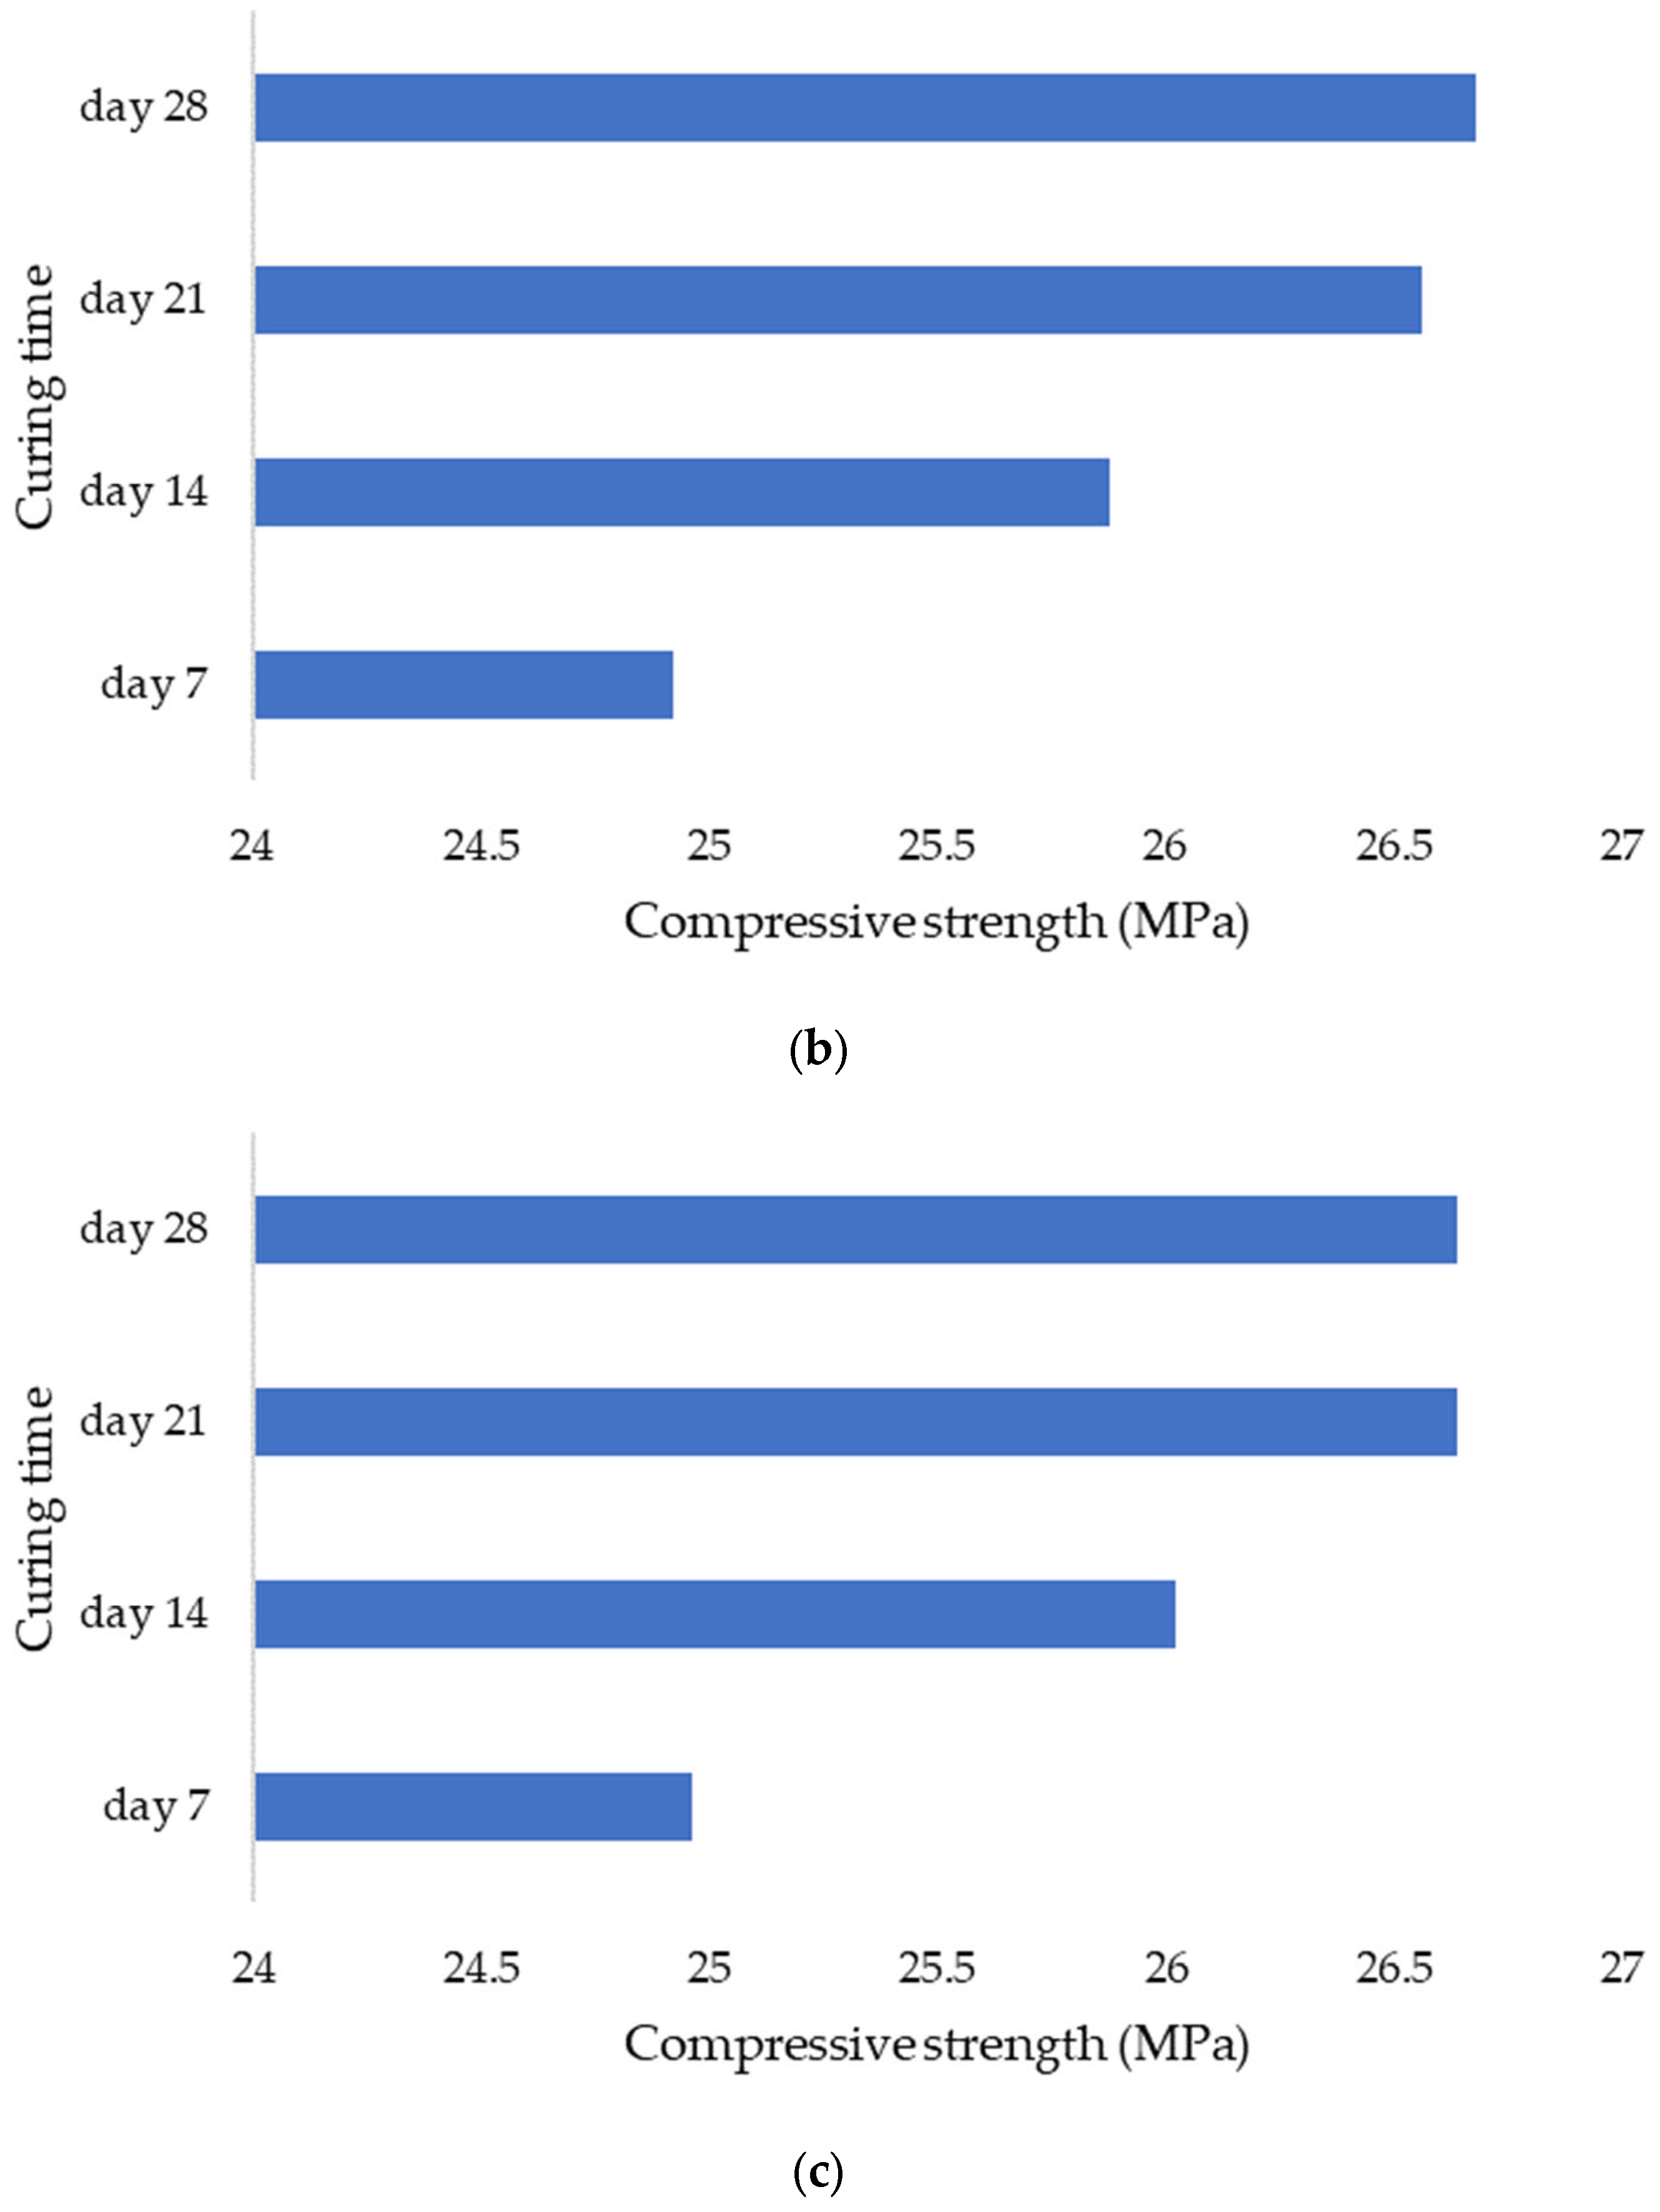
The use of acidic water as a concrete ingredient has an impact on the quality of the concrete, according to the results. Concrete that was made using water with a pH of 7 had compressive strengths of 25.89, 26.44, 27.68, and 27.69 MPa at 7, 14, 21, and 28 days, respectively. While that of pH = 4 under days 7, 14, 21, and 28 had compressive strengths of 24.92, 25.88, 26.56, and 26.68 MPa, respectively. On the other hand, 24.96, 26.02, 26.64, and 26.64 MPa were retrieved from days 7, 14, 21, and 28, respectively, when the initial pH in the mixing water was 12. The summary of the results is presented in Figure 9.

3.7. Pore Distribution

Pore distribution with respect to pH values was estimated using cumulative intruded pore volume. This was an important aspect because almost 50% of the water must evaporate when new concrete is placed. The network of capillary pores in the concrete are left behind as this extra water rushes to the top. A water molecule cannot compare to the size of the pores. Three distinct pore diameters (10, 10–100, and 100–200 μm) were used to analyze the results of the pore distribution. From the results, it was observed that the pore sizes smaller than 10 μm increased when pH values increased. However, there was a decrease in the distribution of pores larger than 10–100 and 100–200 μm.

3.8. Cement Hydration Process and the Properties

As previously highlighted, the samples from different pH values were subjected to X-ray diffraction as part of investigating the cement hydration process and its properties. From the study, it was observed that the phase content of erosion products varies significantly depending on the initial pH values in the mixing water. C3S and C2S are gradually consumed during the early stages of cement hydration to create a tiny quantity of the ettringite (AFt)—AH3 and Ca(OH)2 [40]. Moreover, according to the results, it was observed that an alkaline atmosphere can aid in the hydration of cement since the diffraction peaks of dicalcium silicate and tricalcium silicate were observed to be weaker than those of cement slurry. The calcium hydroxide level peaked at 7 days, and by the time hydration reached 28 days, the calcium hydroxide diffraction peak in an alkaline environment had greatly diminished. The ettringite (AFt)—AH3 was gradually converted to the monosulfate (AFm)—aluminum hydroxide (AH3) at the late stage of hydration, whereby a gradual appearance of the diffraction peak of the monosulfate (AFm)—aluminum hydroxide (AH3) was observed.

3.9. Analysis of Variance

3.9.1. Analysis of Variance (ANOVA)

Usually, ANOVA is used to determine whether differences between data sets are statistically significant. It works by examining the levels of variance present within each group using samples drawn from each [41]. The temperature data from the samples of pH 4.0, pH 7.0, and pH 12 were subjected to the Single-factor Analysis of Variance. Table 3 displays a summary of the p-values obtained from the ANOVA. Notably, when the p-value is less than 0.05, the null hypothesis that there is no difference between the means is rejected, concluding that there is a significant difference. As can be seen in Table 2, the temperature data from the investigated pH levels generated a p-value of 2.4 × 10−261, which is less than 0.05 (alpha-value), making the data variances statistically significant.
The Single-factor Analysis of Variance was used to the strength data from the pH 4.0, 7.0, and 12 sample sets. A summary of the ANOVA findings from the calculations is shown in Table 4. The null hypothesis that there is no difference between the means is rejected when the p-value is less than 0.05, as was previously mentioned, indicating that there is a significant difference. The strength data from the studied pH levels produced a p-value of 2.9 × 10−168, which is less than 0.05 (alpha-value), making the data variations statistically significant, as can be seen in Table 3.

3.9.2. Scheffé Method

Compared to the Tukey–Kramer technique which only considers pairwise differences, Scheffé’s method is a single-step multiple comparison procedure that applies to the set of estimates of all potential contrasts among the factor level means [42]. When determining the significant level of the mean differences in terms of the investigated temperature and strength data from various pH values, the variances in the results were further investigated using the Scheffé multiple comparison techniques. According to Table 5, there was a significant difference (p < 0.01) between pH 4.0 and pH 12, pH 4.0 and pH 7.0, and pH 12 and pH 7.0.
Table 6 shows that there was a difference between pH 4.0 and pH 12, pH 4.0 and pH 7.0, and pH 12 and pH 7.0 that was statistically significant (p < 0.01). That is to say, there were large discrepancies between the datasets obtained from the investigated pH levels. From the results, we understand that different pH levels in the initial mixing water can lead to different concrete properties and characteristics with time. According to [43], water is a crucial component that significantly affects how well concrete performs. The pH of the mixing water has a big effect on how durable the concrete is because it changes how cementitious elements respond when they hydrate.

3.10. Correlation Analysis

Correlation analysis was an important part of the study to investigate the relationship among the investigated parameters of interest. In general, correlation studies are used to show important connections between several measures or sets of metrics; therefore, knowing more about those linkages might open up fresh perspectives and highlight interdependencies [44]. From Table 7, Table 8 and Table 9 it can be seen that despite some slight individual differences in the correlation coefficients but there was a similar trend in terms of the relationship in the parameters. In general, a “strong” to “very strong” correlation was observed between temperature and pH; the phenomenon can be linked to molecular vibrations. Normally, a solution’s molecular vibrations increase as its temperature rises, which causes the solution to ionize and produce H+ ions. Acidic behavior increases with the amount of H+ ions. The pH level of the solution alters as a result of temperature variations. As a result, pH drops as temperature rises [45].
Additionally, a strong negative correlation can be seen between pH and concrete strength, with correlation coefficients ranging from −0.657 to −0.860. In addition, a “very strong” negative correlation between temperature and concrete strength can be observed.

4. Discussion

Using sensors and a sclerometric test, the potential impact of the initial water pH on the increase in concrete strength was examined in this study. Utilizing three different pH values, the effect of initial pH on the strength-gain process was examined (4.0, 7.0, and 12). The main factors investigated were changes in pH over time, body temperature, and strength increase. All of the samples’ pH levels were seen to dramatically rise in the early days of the experiment before gradually falling over time. That is to say, the concrete still goes through chemical reactions over time, changing the overall pH in the concrete in addition to the starting pH level given by the pH in the mixing water. The temperature data also revealed a similar phenomenon. As previously highlighted, the main cause of the pH of new concrete being between 12 and 13 is normally the presence of calcium hydroxide, which is typically a byproduct of cement hydration. Through a process known as carbonation, the pH of a concrete surface gradually decreases to approximately 8.5 when it reacts with the carbon dioxide in the air. For the installation of flooring and the performance of adhesives, a dry, typically carbonated concrete surface is desirable. Flooring failures can result from floor coverings being damaged and adhesives being broken down on a surface with a high pH and lots of moisture.
The temperature and strength gain data from the pH 4.0, 7.0, and 12 samples were subjected to the Single-factor Analysis of Variance. The temperature data from the investigated pH levels showed statistically significant differences with a p-value of 2.4 × 10−261, which is less than 0.05 (alpha-value). The strength data for the investigated pH levels had a p-value of 2.9 × 10−168, which is less than 0.05 (alpha-value), suggesting that the data variances are statistically significant. It is also worth noting that ANOVA is used to evaluate for differences between three or more population mean values. It permits numerous comparisons while maintaining a predetermined degree of risk for a type I error (rejection of the correct null hypothesis). In an ANOVA, the variance estimates owing to chance components alone and chance factors plus the treatment effect are compared (if there is a treatment effect) [46]. We may therefore conclude from the retrieved p-values that variations in the pH of the initial mixing water caused noticeably varied strength gain results, whereby we may also draw the conclusion that variations in the pH of the initial mixing water can significantly affect the concrete strength gain during the curing process. Similar observations are made in the literature; according to the study conducted by Wei et al. [47], which focused on the low-pH self-compacting concrete’s engineering characteristics for concrete plugs; it was observed that the compressive strength of mixture reached up to 61.66 MPa when the pH value was 10.6 after 90 days. The phenomenon highlights the impact of pH on a concrete’s overall strength increase over time.
The study also looked into concrete density as a significant element. It is important to note that, concrete’s density significantly influences its mechanical characteristics. Greater strength and fewer voids and porosities are often benefits of dense concrete. Concrete is less vulnerable to water and soluble substances because of the minimal number of voids in the material. It was then observed that the density was 2242.4 kg/m3 when pH = 4 from day 7. The recorded concrete density in this study at pH = 4 on day 7 is 1.21% smaller than the density attained at pH = 7 on the same day (2269.8 kg/m3). Moreover, the combination of pH = 12 and day 7 yielded an average density of 2244.1 kg/m3. According to the findings, the initial mixing water’s pH was near neutral when the highest density was recovered. Similar to the pH = 4 and pH = 12 combinations, pH = 7 and day 21 yielded an average density of 2280.2 kg/m3, which is roughly 1.13% higher than those of pH = 4 and 1.33% higher than those of pH = 12. However, as previously highlighted there were no discernible variations in the densities obtained from the samples. Moreover, in the literature, it is reported that, typically, barite, magnetite, or hematite aggregates are used to increase concrete density. Concrete has a density of approximately 3400 kg/m3 when barite aggregate is used, which is 45% denser than regular concrete; 3500 kg/m3 when magnetite aggregate is used, which is 50% denser than regular concrete; and 3600 kg/m3 when hematite aggregate is used, which is 53% more dense [48].
In addition, as previously highlighted, the cumulative intruded pore volume was used to estimate the distribution of pores with respect to pH values. The results of the pore distribution were examined using three different pore diameters: 10, 10–100, and 100–200 μm. Pore diameters less than 10 μm grew when pH levels rose. However, there was a reduction in the distribution of pores between 100 and 200 μm and between 10 and 100 μm. According to a study by Sun et al. [49], adding alkaline water to concrete can reduce its overall porosity and boost its strength by 21%. On concrete, porosity can have a variety of impacts. Concrete that contains hollow (air-filled) spaces is said to have porosity. Some of these voids might be linked together or not. Generally speaking, the strength of concrete will decrease as porosity increases. This is significant when thinking about permeability. Concrete will often be more permeable if it has more pores. This is crucial in colder locations because water expands up to 9% when it freezes [50]. If the pores are totally saturated, water may produce cracking or pop-outs as it seeps into the concrete’s pores and freezes. In order to make up for this, the air-entrained admixture is used to create sphere-shaped bubbles that provide a space inside the concrete where the water can expand. Additionally, reinforced concrete may be damaged by water and air penetration due to the linked pores in concrete. The corrosion process can be accelerated by chloride ions’ ability to penetrate [51]. Additionally, carbonation can happen because concrete is a porous substance. This reaction occurs as water in the pores of the concrete and calcium compounds in the concrete react with air carbon dioxide. This causes the pH of the concrete pore solution to fall, which can damage the reinforcement bars’ passive protective layer. The rebars are subject to corrosion as a result.
Under various hydration environments, notably, the impact of pH value on the hydration reaction, the microscopic properties of cement paste’s hydration products change significantly [52]. The microstructure of cement hydration products, the development of C-S-H structures during hydration, and even the penetration and diffusion of water and sulfate ions can all be affected by pH value variations [53], which can also modify the concentration and distribution state of Ca2+ and SO42−. The pH value affects the corrosion resistance of cement by altering the diffusion mode of the corrosion medium in cement pores. The sulfate resistance of cement-based materials is related to its composition and the pH value of the sulfate environment. Due to the change in the pH value of the sulfate medium, the porosity of cement-based materials’ hydration products is greatly increased, notably in terms of mass loss and final compressive strength [54].
At the late stage of hydration, the ettringite (AFt)—aluminum hydroxide (AH3) was gradually transformed into the monosulfate (AFm)—aluminum hydroxide (AH3). As a result, a gradual appearance of the monosulfate (AFm)—aluminum hydroxide (AH3) diffraction peak was detected. It is also important to note that, if a mixture contains enough CaSO42H2O, ettringite will develop. When all the CaSO42H2O used in the manufacture of ettringite is gone, the compound is changed into monosulfate. In-situ synchrotron X-ray powder diffraction is normally used to study the reactions in the temperature range of 25 to 170 °C [40].
The pH level of the concrete can be impacted by a variety of natural events in addition to issues that may develop during the mixing and manufacture of the concrete. Depending on the environment, anything that raises the moisture level can cause problems for concrete. For instance, acid rain, which has a pH below 7, significantly lowers the pH level of the concrete mixture overall [55]. Salt, which is frequently utilized as a remedy to alleviate ice conditions, is still another major problem. In the same manner that acid rain corrodes nearby objects and lowers pH, salt will seep into concrete pores and any cracks it may have.
There is a process that gradually erodes the concrete’s structural integrity even in the absence of the input of acids from saltwater or acid rain. This can happen when any type of water seeps into the porous concrete or even just when carbon dioxide in the air reacts with the cement in the concrete. In addition to lowering the concrete’s pH, carbonation can have a more catastrophic impact on any reinforcements that are there [56], causing them to expand, breaking the surrounding concrete, and ultimately leading to the collapse of the building [57].
Additionally, the findings of this study provide some crucial information for the building sector, particularly in relation to controlling concrete strength.
5. Conclusions

The potential effects of the initial water pH on the concrete strength gain have been investigated using the combination of sensors and a sclerometric test. The impact of initial pH on the strength gain process was investigated using three distinct pH values (4.0, 7.0, and 12). The primary variables examined were pH variations over time, internal temperature, and strength gain. From the results, the following conclusions are made:
  • It was observed that the pH from all the samples increased rapidly during the first days of the experiment and then slightly decreased with time. That is to say that, apart from the initial pH level determined by the pH in the mixing water, the concrete still undergoes chemical reactions with time altering the general pH in the concrete. A similar phenomenon was also observed from the temperature data.
  • Single-factor Analysis of Variance was applied to the temperature and strength gain data from the pH 4.0, 7.0, and 12 samples. With a p-value of 2.4 × 10−261, which is less than 0.05 (alpha-value), the temperature data from the studied pH levels had differences that were statistically significant. The pH levels under study provided a p-value for the strength data of 2.9 × 10−168, less than 0.05 (alpha-value), indicating that the data variances are statistically significant.
  • Additionally, there was a significant difference (p < 0.01) between pH 4.0 and pH 12, pH 4.0 and pH 7.0, and pH 12 and pH 7.0 based on the Scheffé method from temperature and strength increase data. The findings demonstrated that there were statistically significant changes in the list data retrieved from the investigated pH;
  • Despite some minor individual variations in the correlation coefficients, the correlation analysis revealed a consistent pattern in the parameters’ correlation. Temperature and pH generally showed a “strong” to “very strong” correlation;
  • Furthermore, pH and concrete strength showed a substantial negative correlation with correlation coefficients ranging from −0.657 to −0.860. Additionally, it was discovered that there was a “very strong” negative correlation between concrete strength and temperature;
  • The concrete density that was measured in this study on day 7 at pH = 4 is 1.21% lower than the density that was achieved on day 7 at pH = 7 (2269.8 kg/m3);
  • Additionally, the results from the X-ray diffraction showed that the phase content of erosion products varies significantly depending on the initial pH values in the mixing water. Furthermore, it was discovered that an alkaline environment can help cement to hydrate;
  • The calcium hydroxide concentration peaked on day 7, and by day 28 of hydration, the calcium hydroxide diffraction peak in an alkaline environment had significantly decreased;
  • Moreover, the results of this study offer some important information for the construction industry, particularly with regard to concrete strength control.

Author Contributions

Conceptualization, Y.U.; methodology, T.M. and S.Z.; software, A.T.; validation, A.A. and T.T.; formal analysis, D.B. and T.T.; investigation, Z.S.; resources, D.B. and Z.K.; data curation, Z.K.; writing—original draft preparation, T.M. and S.Z.; writing—review and editing, T.M., A.A. and Z.S.; visualization, A.T.; supervision, Y.U.; project administration, A.T.; funding acquisition, Y.U. All authors have read and agreed to the published version of the manuscript.

Funding

This research was funded by the Science Committee of the Ministry of Science and Higher Education of the Republic of Kazakhstan. (Grant No.: AP08052033).

Data Availability Statement

Available on request.

Conflicts of Interest

The authors declare no conflict of interest. The funders had no role in the design of the study; in the collection, analyses, or interpretation of data; in the writing of the manuscript; or in the decision to publish the results.

References

  1. Saint-Pierre, F.; Philibert, A.; Giroux, B.; Rivard, P. Concrete Quality Designation Based on Ultrasonic Pulse Velocity. Constr. Build. Mater. 2016, 125, 1022–1027. [Google Scholar] [CrossRef]
  2. Zhang, B.; Li, Q.; Ma, R.; Niu, X.; Yang, L.; Hu, Y.; Zhang, J. The Influence of a Novel Hydrophobic Agent on the Internal Defect and Multi-Scale Pore Structure of Concrete. Materials 2021, 14, 609. [Google Scholar] [CrossRef] [PubMed]
  3. Mo, Y.L.; Gautam, A.; Chen, Y.; Chen, J.; Joshi, B. Electrical Impedance of Carbon Nanofiber Aggregates. In Smart Nanoconcretes and Cement-Based Materials; Elsevier: Amsterdam, The Netherlands, 2020; pp. 333–349. ISBN 9780128178553. [Google Scholar]
  4. Utepov, Y.B.; Aldungarova, A.K.; Mkilima, T.; Pidal, I.M.; Tulebekova, A.S.; Zharassov, S.Z.; Abisheva, A.K. Dynamics of Embankment Slope Stability under Combination of Operating Water Levels and Drawdown Conditions. Infrastructures 2022, 7, 65. [Google Scholar] [CrossRef]
  5. Mkilima, T. Modeling the Impact of Soil Cohesiveness on Embankment Stability under Rapid Drawdown. Technobius 2022, 2, 16. [Google Scholar] [CrossRef]
  6. Mkilima, T. Toe Drain Size and Slope Stability of Homogeneous Embankment Dam under Rapid Drawdown. Technobius 2021, 1, 1. [Google Scholar] [CrossRef]
  7. Al-Mahaidi, R.; Kalfat, R. Rehabilitation of Concrete Structures with Fiber-Reinforced Polymer; Elsevier: Amsterdam, The Netherlands, 2018; ISBN 9780128115107. [Google Scholar]
  8. Ahmed, M.; Mallick, J.; Abul Hasan, M. A Study of Factors Affecting the Flexural Tensile Strength of Concrete. J. King Saud Univ.—Eng. Sci. 2016, 28, 147–156. [Google Scholar] [CrossRef] [Green Version]
  9. Cabezas, J.; Sánchez-Rodríguez, T.; Gómez-Galán, J.A.; Cifuentes, H.; Carvajal, R.G. Compact Embedded Wireless Sensor-Based Monitoring of Concrete Curing. Sensors 2018, 18, 876. [Google Scholar] [CrossRef] [Green Version]
  10. Ahmad, J.; Zaid, O.; Pérez, C.L.-C.; Martínez-García, R.; López-Gayarre, F. Experimental Research on Mechanical and Permeability Properties of Nylon Fiber Reinforced Recycled Aggregate Concrete with Mineral Admixture. Appl. Sci. 2022, 12, 554. [Google Scholar] [CrossRef]
  11. Nikhil, T.R.; Sushma, R.; Gopinath, S.M.; Shanthappa, B.C. Impact of Water Quality on Strength Properties of Concrete. Indian J. Appl. Res. 2011, 4, 197–199. [Google Scholar] [CrossRef]
  12. Zhang, D.; Liu, T.; Shao, Y. Weathering Carbonation Behavior of Concrete Subject to Early-Age Carbonation Curing. J. Mater. Civ. Eng. 2020, 32, 04020038. [Google Scholar] [CrossRef]
  13. Morshed, A.Z.; Shao, Y. Influence of Moisture Content on CO 2 Uptake in Lightweight Concrete Subject to Early Carbonation. J. Sustain. Cem. Mater. 2013, 2, 144–160. [Google Scholar] [CrossRef]
  14. Bates, R.G.; Popovych, O. The Modern Meaning of PH. CRC Crit. Rev. Anal. Chem. 1981, 10, 247–278. [Google Scholar] [CrossRef]
  15. Machner, A.; Hemstad, P.; De Weerdt, K. Towards the Understanding of the PH Dependency of the Chloride Binding of Portland Cement Pastes. Nord. Concr. Res. 2018, 58, 143–162. [Google Scholar] [CrossRef] [Green Version]
  16. Behnood, A.; Van Tittelboom, K.; De Belie, N. Methods for Measuring PH in Concrete: A Review. Constr. Build. Mater. 2016, 105, 176–188. [Google Scholar] [CrossRef]
  17. Hadigheh, S.A.; Gravina, R.J.; Smith, S.T. Effect of Acid Attack on FRP-to-Concrete Bonded Interfaces. Constr. Build. Mater. 2017, 152, 285–303. [Google Scholar] [CrossRef]
  18. Fernandes, B.; Carré, H.; Mindeguia, J.-C.; Perlot, C.; La Borderie, C. Effect of Elevated Temperatures on Concrete Made with Recycled Concrete Aggregates—An Overview. J. Build. Eng. 2021, 44, 103235. [Google Scholar] [CrossRef]
  19. Le, Q.X.; Dao, V.T.N.; Torero, J.L.; Maluk, C.; Bisby, L. Effects of Temperature and Temperature Gradient on Concrete Performance at Elevated Temperatures. Adv. Struct. Eng. 2018, 21, 1223–1233. [Google Scholar] [CrossRef] [Green Version]
  20. Paul, A.; Rashidi, M.; Kim, J.-Y.; Jacobs, L.J.; Kurtis, K.E. The Impact of Sulfate- and Sulfide-Bearing Sand on Delayed Ettringite Formation. Cem. Concr. Compos. 2022, 125, 104323. [Google Scholar] [CrossRef]
  21. Taylor, H.F.; Famy, C.; Scrivener, K. Delayed Ettringite Formation. Cem. Concr. Res. 2001, 31, 683–693. [Google Scholar] [CrossRef]
  22. Nandhini, K.; Karthikeyan, J. The Early-Age Prediction of Concrete Strength Using Maturity Models: A Review. J. Build. Pathol. Rehabil. 2021, 6, 7. [Google Scholar] [CrossRef]
  23. Xuan, D.; Zhan, B.; Poon, C.S. A Maturity Approach to Estimate Compressive Strength Development of CO 2 -Cured Concrete Blocks. Cem. Concr. Compos. 2018, 85, 153–160. [Google Scholar] [CrossRef]
  24. John, S.T.; Roy, B.K.; Sarkar, P.; Davis, R. IoT Enabled Real-Time Monitoring System for Early-Age Compressive Strength of Concrete. J. Constr. Eng. Manag. 2020, 146, 05019020. [Google Scholar] [CrossRef]
  25. Zuo, Z.; Huang, Y.; Pan, X.; Zhan, Y.; Zhang, L.; Li, X.; Zhu, M.; Zhang, L.; De Corte, W. Experimental Research on Remote Real-Time Monitoring of Concrete Strength for Highrise Building Machine during Construction. Measurement 2021, 178, 109430. [Google Scholar] [CrossRef]
  26. Zhou, S.; Deng, F.; Yu, L.; Li, B.; Wu, X.; Yin, B. A Novel Passive Wireless Sensor for Concrete Humidity Monitoring. Sensors 2016, 16, 1535. [Google Scholar] [CrossRef] [Green Version]
  27. Taheri, S. A Review on Five Key Sensors for Monitoring of Concrete Structures. Constr. Build. Mater. 2019, 204, 492–509. [Google Scholar] [CrossRef]
  28. Bašková, R.; Struková, Z.; Kozlovská, M. Construction Cost Saving Through Adoption of IoT Applications in Concrete Works. In Lecture Notes in Civil Engineering; Springer: Berlin/Heidelberg, Germany, 2020. [Google Scholar]
  29. Shmidt, I.V.; Degtyareva, A.S. Development and Testing of Concrete Mix for Machine Tool Base Elements. Procedia Eng. 2017, 206, 1215–1220. [Google Scholar] [CrossRef]
  30. Korolev, A.S.; Kopp, A.; Odnoburcev, D.; Loskov, V.; Shimanovsky, P.; Koroleva, Y.; Vatin, N.I. Compressive and Tensile Elastic Properties of Concrete: Empirical Factors in Span Reinforced Structures Design. Materials 2021, 14, 7578. [Google Scholar] [CrossRef] [PubMed]
  31. Pehlivan, A.O.; Yazgan, A.U. Testing of Maturity Methods for Concrete Quality Cured Using Various Temperatures. Int. J. Eng. Technol. IJET 2021, 7, 1–8. [Google Scholar] [CrossRef]
  32. Shcherban’, E.M.; Stel’makh, S.A.; Beskopylny, A.; Mailyan, L.R.; Meskhi, B.; Shuyskiy, A. Improvement of Strength and Strain Characteristics of Lightweight Fiber Concrete by Electromagnetic Activation in a Vortex Layer Apparatus. Appl. Sci. 2021, 12, 104. [Google Scholar] [CrossRef]
  33. Aligizaki, K.K. Mercury Intrusion Porosimetry. In Pore Structure of Cement-Based Materials; CRC Press: Boca Raton, FL, USA, 2005; pp. 102–149. [Google Scholar]
  34. Mróz, K.; Hager, I. Evaluation of Nature and Intensity of Fire Concrete Spalling by Frequency Analysis of Sound Records. Cem. Concr. Res. 2021, 148, 106539. [Google Scholar] [CrossRef]
  35. Pacheco Torgal, F.; Miraldo, S.; Labrincha, J.A.; De Brito, J. An Overview on Concrete Carbonation in the Context of Eco-Efficient Construction: Evaluation, Use of SCMs and/or RAC. Constr. Build. Mater. 2012, 36, 141–150. [Google Scholar] [CrossRef] [Green Version]
  36. Smith, P.E. Design and Specification of Marine Concrete Structures. In Marine Concrete Structures; Elsevier: Amsterdam, The Netherlands, 2016; pp. 65–114. [Google Scholar]
  37. Providakis, C.P.; Liarakos, E.V.; Kampianakis, E. Nondestructive Wireless Monitoring of Early-Age Concrete Strength Gain Using an Innovative Electromechanical Impedance Sensing System. Smart Mater. Res. 2013, 2013, 932568. [Google Scholar] [CrossRef]
  38. Ghahri Saremi, S.; Goulias, D. Concrete Strength Gain Monitoring with Non-Destructive Methods for Potential Adoption in Quality Assurance. Constr. Build. Mater. 2020, 260, 120464. [Google Scholar] [CrossRef]
  39. Kowalski, R.; Wróblewska, J. Application of a Sclerometer to the Preliminary Assessment of Concrete Quality in Structures After Fire. Arch. Civ. Eng. 2018, 64, 171–186. [Google Scholar] [CrossRef] [Green Version]
  40. Zhu, Y.; Liu, Y.; Zhang, J. Monitoring the Hydration Behavior of Hardened Cement Paste Affected by Different Environmental PH Regimes. Front. Mater. 2022, 9, 980887. [Google Scholar] [CrossRef]
  41. Stoker, P.; Tian, G.; Kim, J.Y. Analysis of Variance (ANOVA). In Basic Quantitative Research Methods for Urban Planners; Routledge: London, UK, 2020; pp. 197–219. ISBN 9781000769234. [Google Scholar]
  42. Nagasawa, S. Improvement of the scheffé’s method for paired comparisons. Kansei Eng. Int. 2002, 3, 47–56. [Google Scholar] [CrossRef] [PubMed] [Green Version]
  43. Chinmoy, D.; Md Abdur, R.; Md Akhtar, H.; Muhammad Harunur, R. Effect of Mixing Water PH on Concrete. In Proceedings of the 5th International Conference on Civil Engineering for Sustainable Development (ICCESD 2020), Khulna, Bangladesh, 7–9 February 2020; Khulna University of Engineering & Technology: Khulna, Bangladesh, 2020; p. 11. [Google Scholar]
  44. Bujang, M.A.; Baharum, N. Sample Size Guideline for Correlation Analysis. World J. Soc. Sci. Res. 2016, 3, 37–46. [Google Scholar] [CrossRef]
  45. Oyebisi, S.O.; Owolabi, E.F.; Owamah, H.I.; Oluwafemi, J.O.; Ayanbisi, O.W. Strength Prediction of GPC Using Alkali PH, Salinity, Temperature, and Conductivity as Continuous Predictors. IOP Conf. Ser. Mater. Sci. Eng. 2021, 1107, 012145. [Google Scholar] [CrossRef]
  46. King, B.M. Analysis of Variance. In International Encyclopedia of Education; Elsevier: Amsterdam, The Netherlands, 2010; pp. 32–36. [Google Scholar]
  47. Wang, W.-C.; Xue, J.-C.; Huang, W.-H. Study of Engineering Properties of Low-PH Self-Compacting Concrete for Concrete Plug. Case Stud. Constr. Mater. 2022, 16, e01060. [Google Scholar] [CrossRef]
  48. Jóźwiak-Niedźwiedzka, D.; Lessing, P.A. High-Density and Radiation Shielding Concrete. In Developments in the Formulation and Reinforcement of Concrete; Elsevier: Amsterdam, The Netherlands, 2019; pp. 193–228. [Google Scholar]
  49. Sun, B.Q.; Wang, L.J. Study on the Properties of Concrete Mixed with Alkaline Redox Potential Water. Jianzhu Cailiao Xuebao/J. Build. Mater. 2009, 1, 112–115. [Google Scholar]
  50. Huang, S.; Liu, Q.; Liu, Y.; Ye, Z.; Cheng, A. Freezing Strain Model for Estimating the Unfrozen Water Content of Saturated Rock under Low Temperature. Int. J. Geomech. 2018, 18, 04017137. [Google Scholar] [CrossRef]
  51. Peng, Y.; Su, L.; Wang, Y.; Zhang, L. Analysis of the Effect of Porosity in Concrete under Compression Based on DIP Technology. J. Mater. Civ. Eng. 2022, 34, 04021376. [Google Scholar] [CrossRef]
  52. Avet, F.; Scrivener, K. Influence of PH on the Chloride Binding Capacity of Limestone Calcined Clay Cements (LC3). Cem. Concr. Res. 2020, 131, 106031. [Google Scholar] [CrossRef]
  53. Ledesma, E.F.; Lozano-Lunar, A.; Ayuso, J.; Galvín, A.P.; Fernández, J.M.; Jiménez, J.R. The Role of PH on Leaching of Heavy Metals and Chlorides from Electric Arc Furnace Dust in Cement-Based Mortars. Constr. Build. Mater. 2018, 183, 365–375. [Google Scholar] [CrossRef]
  54. Zhang, G.; Wu, C.; Hou, D.; Yang, J.; Sun, D.; Zhang, X. Effect of Environmental PH Values on Phase Composition and Microstructure of Portland Cement Paste under Sulfate Attack. Compos. Part B Eng. 2021, 216, 108862. [Google Scholar] [CrossRef]
  55. Zhang, Y.; Gu, L.; Li, W.; Zhang, Q. Effect of Acid Rain on Economic Loss of Concrete Structures in Hangzhou, China. Int. J. Low-Carbon Technol. 2019, 14, 89–94. [Google Scholar] [CrossRef]
  56. Budelmann, H.; Dreßler, I.; Wichmann, H.-J. Subsequent Sensor Installation for Corrosion Monitoring of Reinforced Concrete Structures. In Life-Cycle of Engineering Systems; CRC Press: Boca Raton, FL, USA, 2016; p. 225. ISBN 9781138028470. [Google Scholar]
  57. Ciolko, A.T. Corrosion and Prestressed Concrete Bridges. In Proceedings of the Structures Congress 2005, New York, NY, USA, 20–24 April 2005; American Society of Civil Engineers: Reston, VA, USA, 2005; pp. 1–12. [Google Scholar]
Figure 1. The main materials used in the study. (a) Portland cement (b) fine sand (c) aggregates (d) metal formworks.
Infrastructures 07 00159 g001
Figure 2. Experimental setup (a) general setup (b) a closer look at the connections of the sensors.
Infrastructures 07 00159 g002
Figure 3. pH data with time recorded by the sensor after every 0.5-h time interval.
Infrastructures 07 00159 g003
Figure 4. Temperature data with time recorded by the sensor after every time interval of 0.5 h.
Infrastructures 07 00159 g004
Figure 5. The density of the samples with time.
Infrastructures 07 00159 g005
Figure 6. Strength gain data distribution.
Infrastructures 07 00159 g006
Figure 7. Strength gain data with time recorded by the sensor after every time interval of 0.5 h.
Infrastructures 07 00159 g007
Figure 8. Strength gain data with time retrieved from the Sclerometer each day.
Infrastructures 07 00159 g008
Figure 9. Concrete density monitoring results (a) pH = 7 (b) pH = 4 (c) pH = 12.
Infrastructures 07 00159 g009aInfrastructures 07 00159 g009b
Table 1. Physicochemical properties of the Portland cement used in the study.
ParameterComposition (%)
SiO222.98
CaO65.58
MgO1.06
Al2O34.41
Fe2O32.1
SO33.32
N2O0.51
Cl0.009
Table 2. Summary of the temperature data from the investigated pH values.
SampleMinMaxMedianMeanSTD
Cub 1 − pH = 4.0020.122.620.720.80.417
Cub 2 − pH = 1220.623.321.321.30.443
Cub 3 − pH = 7.0020.222.720.820.90.419
Table 3. ANOVA results based on temperature.
Summary
GroupsCountSumAverageVariance
Cub 1 − pH = 4.00134427900.2920.759150.174045346
Cub 2 − pH = 12134428677.3221.337290.196137086
Cub 3 − pH = 7.00134428043.4520.865660.175835924
ANOVA
Source of VariationSSdfMSFp-valueF crit
Between Groups254.47612127.238699.08652.4 × 10−2612.997961
Within Groups733.302740290.182006
Total987.77874031
Table 4. ANOVA based on concrete strength data.
Summary
GroupsCountSumAverageVariance
Cub 1 − pH = 4.00134421075.7915.681415.45128547
Cub 2 − pH = 12134427560.6520.5064426.42261243
Cub 3 − pH = 7.00134422697.0116.8876617.91983403
ANOVA
Source of VariationSSdfMSFp-valueF crit
Between Groups16948.6128474.304425.17692.9 × 10−1682.997961
Within Groups80302.98402919.93124
Total97251.594031
Table 5. Analysis of variance using the Scheffé method based on temperature data.
Treatments PairScheffé TT-StatisticScheffé p-ValueScheffé Inference
pH 4.0 vs. pH 1235.12981.11 × 10−16** p < 0.01
pH 4.0 vs. pH 7.06.4728.94 × 10−10** p < 0.01
pH 12 vs. pH 7.028.65781.11 × 10−16** p < 0.01
Note: ** statistically significant.
Table 6. Analysis of variance using the Scheffé method based on concrete strength data.
Treatments PairScheffé TT-StatisticScheffé p-ValueScheffé Inference
pH 4.0 vs. pH 1228.01681.11 × 10−16** p < 0.01
pH 4.0 vs. pH 7.07.00422.58 × 10−11** p < 0.01
pH 12 vs. pH 7.021.01261.11 × 10−16** p < 0.01
Note: ** statistically significant.
Table 7. Correlation analysis results (pH = 4.0).
pHTemperatureStrength
pH1
Temperature0.7053551
Strength−0.86042−0.83541
Table 8. Correlation analysis results (pH = 7.0).
pHTemperatureStrength
pH1
Temperature0.5423621
Strength−0.65684−0.83541
Table 9. Correlation analysis results (pH = 12).
pHTemperatureStrength
pH1
Temperature0.608221
Strength−0.69992−0.83541
Publisher’s Note: MDPI stays neutral with regard to jurisdictional claims in published maps and institutional affiliations.