1. Introduction
In the United States, motor vehicle crashes are considered to be the leading cause of death for children, teens and young adults up to age 34 [
1]. According to the U.S. Department of Transportation (USDOT), highway fatalities account for nearly 93% of the total U.S. transportation-related fatalities [
2]. In addition to causing loss of lives, motor vehicle crashes result in hundreds of thousands of injured victims and billions of dollars in property damages every year [
3].
The year 2011 was important for highway traffic safety. Statistics show that 32,367 people died in motor vehicle crashes in 2011 [
4]. Although this number represents the fewest number of people killed in traffic crashes in a single year since 1949, it also indicates that an average of 89 lives per day were lost in traffic crashes [
5]. Unfortunately, the most recent available statistics show a significant increase from that lowest number of fatalities that was observed in 2011, with 37,133 deaths in 2017 [
6].
All of the facts presented above suggest the importance of highway traffic safety and the need to improve it. When talking about highway traffic safety, it is important to have the roadway, the vehicle, and the roadway user (e.g., drivers) in mind, as research indicates that they contribute to 33%, 10% and 93% of the crashes, respectively [
7]. Motor vehicle crashes have multiple contributing factors. Therefore, to promote highway traffic safety, there needs to be a multidisciplinary approach that encompasses all stakeholders. The most common approach that includes the broad stakeholder communities responsible for making roads safer is known as the ′4 Es′ of highway traffic safety [
7,
8], explained below:
Engineering (e.g., roadway planning, design and traffic engineers, operation, and maintenance);
Enforcement (e.g., city police, sheriff, state, and local law enforcement agencies);
Education (e.g., driver education, state traffic safety offices, schools, citizen advocacy groups); and
Emergency Medical Services (EMS) (e.g., first responders, paramedics, fire, and rescue).
While motor vehicle crashes have multiple contributing factors, the approach that has the potential to have the highest impact in improving highway traffic safety is the one that focuses on the roadway user. A driver (or more accurately driver behavior) is the largest source of causal factors related to crashes. As roadway users contribute to a large percentage of traffic crashes, highway patrol agencies enforce traffic laws in an attempt to catch violators who put their own safety and that of others at risk. Their ultimate goal is to make a positive change in undesirable roadway user behaviors.
In order for highway patrol agencies to improve their overall organizational performance in enforcing traffic laws to prevent crashes, they need to be able to measure their performance in the first place. With a set of unified, consistent and effective performance measures in place, the first step in the process of improving the overall organizational performance could be taken. This first step is internal benchmarking, in order to realize which units of the organization are the best performing ones so that they could be further set as benchmarks for the other units. Through the benchmarking process, other poor performing units could learn their peers’ best practices and apply those in order to improve their own performance.
There are many definitions available on the topic of benchmarking. Construction Industry Institute defines it as “the systematic process of measuring one’s performance against recognized leaders for the purpose of determining best practices that lead to superior performance when adapted and utilized” [
9]. The benchmarking process can be done either internally or externally. In the case of internal benchmarking, a comparative analysis is made against organization’s own projects, while in the case of external benchmarking, projects are sought from other organizations as well, and ultimately the comparison is conducted among multiple organizations [
10]. Internal benchmarking, often considered to be the starting point of the quantitative process examination [
10], would enable decision makers to compare the units of an organization, identify the best performing ones, and learn their best practices so that other units could take advantage and improve their performance as well. The same logic applies to external benchmarking of several organizations that follow the same goal, with the added value of comparing one organization against its competitors [
10].
This research introduces a data envelopment analysis (DEA) based framework that makes it possible to measure and compare the efficiency performance divisions of a highway patrol in an attempt to allow internal benchmarking and thus to improve the overall organizational performance. DEA is a mathematical methodology based on the concepts of optimization and linear programming as will be discussed later in this paper. The concepts discussed in this paper can be implemented by highway patrol agencies in an attempt to assess their overall efficiency while considering the uncontrollable factors affecting such efficiency. The performance measurement and subsequent benchmarking processes outlined in this paper have the potential to facilitate decision and policy-making in highway patrol agencies around the world.
Although DEA has been utilized for organizational performance evaluation in multiple sectors such as banks, insurance companies, hospitals, industrialized manufactures, universities, hotels, military services in governments, transportation, and engineering [
11,
12], literature review to date has not identified any study that has specifically utilized DEA in the context of highway traffic safety from the highway patrol’s perspective. It should be noted that although DEA has been used in both highway safety [
13,
14,
15,
16] and police forces [
17,
18,
19,
20,
21,
22] domains separately, no study was found to combine the two areas together. Given the importance of these two domains and DEA’s potential to help improve highway patrol agencies’ performance and efficiency, this research is believed to contribute to the body of knowledge by serving as a starting point and reference for future studies to advance the methodology of performance measurement and improvement in highway agencies.
2. Genesis of the Research
Established in 1933, Wyoming Highway Patrol (WHP) defines its primary duty as “to keep the motoring public safe as they travel over 6800 miles of highways in the state, including 900 miles of interstate” [
23]. It has 17 geographical divisions covering the state of Wyoming.
To measure and improve its performance, WHP developed seven overall goals that are outlined in its Strategic Plan [
23].
Each of these categories of goals has multiple performance measures. To help understand the specific measures that WHP uses in its strategic plan, the performance measures in the top two categories (i.e., “Reduce highway fatalities, alcohol-related crashes, and injury crashes” and “Maximize our enforcement, educational, and support efforts”) are shown in
Table 1.
Despite the fact that WHP has been using the abovementioned performance measures for quite some time now, Wyoming’s fatality rates are higher than the national average based on the most recently available statistics [
24].
3. Problem Statement and Purpose of Research
It is clear from the discussion presented in the preceding sections that WHP has the potential to improve its organizational performance, and internal benchmarking is a viable starting point given WHP’s existing focus on performance measures. Nevertheless, internal benchmarking becomes a challenging task for a large organization like WHP with 17 divisions, where each of those divisions uses multiple measures to measure performance [
25].
Furthermore, it is important to note that in order to have a fair level of comparison, factors that are affecting the divisions’ performance but are beyond decision makers’ control need to be considered. For instance, what if a division is constantly dealing with high volumes of highway traffic? Is it really fair to compare that division to another division that is patrolling smoothly under light traffic volumes for the majority of the year? Therefore, it is important to lay a level ground for fair comparison among the units.
To take the challenges even one step further, the resource utilization should be taken into account as well, in order to identify at what cost the overall performance is being attained and thus to perform the abovementioned internal benchmarking with respect to efficiency.
The purpose of this research is to tackle the abovementioned challenges by introducing a framework that makes it possible to measure and compare the efficiency performance divisions of a highway patrol in an attempt to allow internal benchmarking and thus to improve the overall organizational performance.
This paper presents all of the implementation stages of the framework in which real data from WHP’s database (for one calendar year which was made available to the authors for this research) is utilized. As a result of this implementation example, WHP’s best-performing (i.e., 100% efficient) divisions are identified as benchmarks, and conclusions (such as peer-relationships and effects of uncontrollable factors on the efficiency of WHP’s divisions) are drawn and presented in this paper.
4. Methodology
Given the need for a performance assessment framework to be utilized by highway patrols to measure their overall efficiency and consequently to benchmark their operations and identify the best practices, different approaches that could potentially accomplish that were investigated. Efficiency is defined as the ratio of outputs to inputs [
26], and there are several approaches that have been used for the measurement and comparison of the efficiencies of systems in the presence of multiple inputs and outputs. This study uses DEA to develop a framework that can measure the overall efficiency performance of WHP’s divisions in the presence of multiple performance measures while also considering the external factors’ effects on that overall performance.
DEA was originally proposed by Charnes, Cooper, and Rhodes in 1978 as an approach that is capable of dealing with processes and systems with multiple measures while not having any of the major drawbacks of the efficiency measurement methods described above [
27]. DEA quantifies how efficiently a unit within an organization transforms inputs (resources) to desired outputs (products) [
28]. The units in the DEA context are referred to as decision making units (DMUs) [
27]. DEA is based on the concepts of optimization, linear programming, and production theory, and is equipped to deal with the presence of multiple measures as well as uncontrollable variables that could affect the performance of a DMU but are beyond the control of the decision makers [
28]. The results obtained from DEA models are [
27]: (i) an envelope (efficient frontier) consisting of 100% efficient DMUs; (ii) the efficiency score assigned to each DMU; and (iii) peers (that are 100% efficient DMUs) of a given DMU, which can be used for the purposes of benchmarking and identifying best practices.
Formulation 1 demonstrates the Charnes, Cooper, and Rhodes (CCR) model for the DMU under investigation (i.e., DMU
0) in which its overall efficiency
(i.e., the ratio of its outputs to inputs) is maximized [
27]:
where n: number of outputs (
i is the output indicator);
m: number of inputs (
j is the input indicator);
Yi,
Xj: known outputs and inputs for a given DMU, all positive.;
Ui,
Vj: outputs’ and inputs’ weights, non-negative values as the result of solving this optimization problem.
What Formulation (1) is demonstrating is called an Input Oriented CCR model. Therefore, as a result of solving the optimization problem and further obtaining the efficiency scores for each DMU, those scores need to be applied to the inputs, to reduce the utilized resources while maintaining a constant level of produced outputs. For instance, in an input-oriented model where the efficiency score (also known as Q) is equal to 0.6, the DMU is performing 60% efficient and in order to get to 100% efficiency, the input level should be reduced by 40%.
To change the perspective of models, DEA also has the Output Oriented approach which is discussed in Formulation (2) for the DMU under investigation (i.e., DMU
0) [
27]. As a result of utilizing this formulation, the inverse of the efficiency score would be applied to the outputs, to increase the amount of generated outputs while keeping the same amount of resources. For instance, if Q equals 0.75 in an output-oriented model, then the DMU is performing under 75 percent of efficiency and to be 100 percent efficient, it needs to increase the amount of outputs by 1.33 times (
.
where
n: number of outputs (
i is the output indicator);
m: number of inputs (
j is the input indicator);
Yi,
Xj: known outputs and inputs for a given DMU, all positive.;
Ui,
Vj: outputs’ and inputs’ weights, non-negative values as the result of solving this optimization problem. The reader is referred to [
12] for a detailed description of the DEA methodology for its use in the transportation domain. The DEA-based framework introduced in this paper consists of six phases, as discussed in detail in the following sections.
5. Phase One: Selecting Decision Making Units (DMUs)
In the context of DEA, DMUs are units within an organization that utilize resources through certain processes to generate desired outputs. There are some criteria that need to be taken into account when identifying the DMUs to include in the model. Following the criteria outlined in [
28,
29,
30], the DMUs in this research are chosen to be the divisions of WHP. As discussed earlier, WHP consists of 17 geographical divisions. These divisions perform patrol operations in an attempt to achieve the goals set by the agency. It should be noted that the conditions and circumstances under which each DMU performs differs. This issue is addressed by the incorporation of uncontrollable variables that represent those conditions into the model, a concept that is discussed in detail in phase three of the framework. The number of DMUs (17) may be low with respect to the discriminating power of DEA models. Therefore, the issue with the discriminating power of the DEA model will be addressed by reducing the number of variables in the model as explained later.
6. Phase Two: Selection of Controllable Variables (Inputs and Outputs)
In the context of DEA, inputs are defined as resources that are utilized by DMUs in the process of generating the outputs. The second phase in the DEA framework is to identify the controllable variables (i.e., inputs and outputs). The reason for calling these variables controllable is to distinguish them from the uncontrollable variables that will be discussed in phase three. Inputs and outputs are referred to as controllable variables because their magnitude can be altered as a result of the decisions made by the decision makers. For instance, if the inputs in a study are the number of employees working in an organization, it is within the decision makers’ control to change that number.
The greater the number of variables in comparison to the number of DMUs, the lower the discriminating power of DEA models would be. In order to identify the initial comprehensive list of inputs and outputs and further refine them to form the final set of variables to be used in the models, several steps were taken including a thorough literature review, interviewing the decision makers (i.e., executive staff at WHP), and holding brainstorming sessions with those decision makers.
6.1. Input
The only resource varying from division to division is the number of troopers. This is the single most important factor contributing to the divisional performance from an input point of view.
6.2. Outputs
An important discovery during the interviews and brainstorming sessions was the fact that the outputs should be defined in a way that signifies two characteristics of patrol operations that are considered valuable to WHP: activity and visibility. Activity measure is concerned with citations and bad driver behaviors, and visibility measure is concerned with enforcement and outreach time as explained below.
6.2.1. Citations and Bad Driver Behaviors
It was mentioned by all of the interviewees that changing drivers’ behavior is the most important overarching goal of WHP that would result in the reduction in all kinds of crashes. Progress toward this goal can only be measured by concurrently considering the number of issued citations aimed at changing bad driver behavior and the number of bad driver behaviors that have resulted in crashes. An important implication of introducing this performance measure (concurrently considering citations aimed at changing bad driver behavior and the number of bad driver behaviors resulting in crashes) would be to help push the idea of issuing meaningful citations, those that focus on bad driver behaviors that actually result in crashes. As detailed in [
31] this approach resulted in the development of normalized measures, an example of which is shown below. It is important to note that this measure is defined in different categories of behavior that WHP is invested in changing. These categories are (1) alcohol and drug (DUI), (2) distracted driving (DIS), (3) lack of proper restraint systems (RES) (4) speeding (SPD) and (5) all other factors.
6.2.2. Enforcement and Outreach Time
As a general note, it should be pointed out that number of hours is considered as an output for the DEA model, since they are produced in the process of enforcement and outreach operations by the input variable in a DMU (i.e., the troopers in a division). This output represents the visibility performance of the patrol. The hours included as output take into account only the enforcement and outreach time, which includes the number of hours that a trooper is out on the field, being visible and proactive or performing outreach activities (such as community visits for traffic safety presentations), and thereby potentially changing bad driver behaviors through that visibility. Thus, it should be noted that the remainder of the overall patrol time during which officers could be engaged in administrative work (e.g., entering citations and crash information into relevant databases, recording evidence, making a court appearance, meeting with the district attorney, etc.) or responding to a call for service or responding to a call for outside help (from sheriff or city police) or attending a training session (for troopers; not for the public) instead of being in the field, visible and proactive is excluded from the output (but instead included as an uncontrollable variable as discussed in phase three).
7. Phase Three: Selection of Uncontrollable Variables
Uncontrollable variables are mostly external factors that affect the production of a process but are beyond the controls of decision makers. Failure to account for these factors in a DEA model may lead to unfair comparisons between the DMUs. Through the review of the literature and discussing patrol operations with decision makers in WHP, four main categories of uncontrollable variables were defined that could potentially be used in this study and a comprehensive list was developed. The reader is referred to [
32] for a complete discussion on that comprehensive list of uncontrollable variables.
After a significant amount of discussions and brainstorming sessions with the key decision makers in WHP on that comprehensive list, the uncontrollable variables to be included in this study were limited to the following six items:
Mileage of divided highways in each division: It is more difficult to enforce the opposing traffic in divided highways.
Roadway mileage with shoulder width more than or equal to six feet in each division: Troopers feel more comfortable in enforcing when there is sufficient shoulder width to pull over the violators.
Number of high-speed intersections in each division: These intersections in highways are difficult to enforce due to the combination of high speeds involved and complex designs of such intersections.
Number of hours away from visibility and proactivity in each division: More of these hours such as entering citations and crash information into relevant databases, recording evidence, making a court appearance, meeting with the district attorney, etc., less time the troopers can spend on highways patrolling and enforcing.
Centerline mileage of highways under the jurisdiction of each division (area served): This is a measure of the area served by the troopers in a division. Larger the area served, more difficult it becomes to patrol and enforce within such area (with the same number of troopers, i.e., resources).
Average Annual Daily Traffic (AADT) and Average Annual Daily Truck Traffic in each division: This is a measure of the amount of traffic that needs to be enforced by the troopers in a division. The greater the traffic amount, the more difficult it becomes to patrol and enforce.
8. Phase Four: Selection of the Appropriate DEA Model
Under original DEA formulations (CCR formulations), processes are considered to perform under constant returns to scale (CRS), which means that a proportionately equal increase (or decrease) in all inputs would lead the same proportional increase (or decrease) in all outputs [
33]. In reality, most systems and processes do not perform under CRS. This means that CCR is a very conservative approach and not very applicable to real-life processes. Therefore, new formulations were proposed by Banker, Charnes, and Cooper in 1984 [
34] who introduced the BCC (Banker, Charnes, and Cooper) formulation. BCC formulation deals with processes operating under variable returns to scale (VRS), under which a proportionately equal increase (or decrease) in all inputs would lead to a proportionally greater or smaller increase (or decrease) in all outputs [
33]. Formulation (3) shows the input-oriented dual BCC formulation for the DMU under investigation (i.e., DMU
0) [
34].
where
t: number of DMUs in the data set (
k is the DMU indicator);
m: number of inputs (
j is the input indicator);
n: number of outputs (
i is the output indicator);
Yi,
Xj: known outputs and inputs for a given DMU, all positive;
Zk: Weight of the efficient peers, non-negative values as the result of solving this optimization problem.
DEA formulations can be modified by introducing new constraints to meet specific requirements of the processes to be modeled. For instance, in order to deal with uncontrollable variables in DEA and to create a fair level of comparison for the DMUs, Banker and Morey (1986) introduced a modification to the traditional DEA formulations. Formulation (4) demonstrates the input-oriented dual BCC model for the DMU under investigation (i.e., DMU
0) with additional constraints to account for uncontrollable variables [
35,
36]:
where
t: number of DMUs in the data set (
k is the DMU indicator);
m: number of controllable inputs (
j is the input indicator);
p: number of uncontrollable inputs (
r is the uncontrollable input indicator);
n: number of outputs, controllable or uncontrollable (
i is the output indicator);
Yi,
Xj,
Wr: known outputs, inputs and uncontrollable variables for a given DMU, all positive.
Zk: Weight of the efficient peers, non-negative values as the result of solving this optimization problem.
As can be seen,
is not multiplied by the amount of the uncontrollable inputs, and as a result, the magnitude of uncontrollable inputs would be unchanged. However, uncontrollable inputs can affect the results of the model through their presence in the additional constraint [
26]. Essentially, what this formulation implies is the answer to the question of “what would be the efficiency of a DMU given the uncontrollable variables it faces?” [
36].
In any DEA study, it is critical to choose and utilize the appropriate model to meet the objectives of the study. To decide which model to use, two questions need to be answered:
Which of the controllable variables (i.e., inputs or outputs) could be modified to increase the efficiency of DMUs?
Under which scale do the processes perform (i.e., CRS or VRS)?
Since the inputs in this research (i.e., the number of troopers in each division) are fixed and cannot be modified, an output-oriented model needs to be selected. As an outcome of the models, inefficient DMUs will need to increase their outputs, while the amount of inputs remains the same. Also, the BCC model is appropriate, since according to the decision makers in WHP, WHP’s patrolling processes are not performed under the concepts of CRS. Given these, the output-oriented BCC model was selected for the purposes of this research. Additionally, to account for the impact of uncontrollable variables, such variables are treated as fixed value inputs in the DEA models.
9. Phase Five: Collecting and Preparing the Data
Discussion on the DMUs and variables decided to be included in this research was presented in earlier phases. This section talks about the data sources and the steps taken to prepare the data. The results of such data preparation efforts and the final data sets used in the models are available at [
32].
The only resource (input) varying from division to division is the number of troopers. Such information was collected on a monthly basis as the number of troopers can fluctuate over the course of the year. To account for this issue, the average of the trooper count was calculated over the calendar year.
The main measures considered as outputs are grouped under citations and bad driver behaviors and enforcement and outreach time as were defined in phase two earlier. The citations and bad driver behaviors have been applied to five different categories of bad behaviors as recognized by WHP. To get the citation counts, a database of all of the issued citations was used. In order to come up with the number of exhibited bad driver behaviors resulting in crashes in each division, WHP’s crash form was used as a guideline to develop a query that could extract the correct number from the database. The second group of outputs is enforcement and outreach time. This time includes the time dedicated to proactive enforcement activities including self-initiated (e.g., making traffic stops, enforcing violators) and uncommitted patrol (i.e., being visible on the field) in addition to time spent on outreach programs as was discussed in phase two. WHP utilizes a form called P-26 to log each trooper’s time during the day. This form consists of 54 line items that were carefully studied and categorized to come up with the enforcement and outreach time for each division. Any time that troopers have to spend away from proactive enforcement activities is excluded from enforcement and outreach time, and depending on its nature, may be included as an uncontrollable variable.
The initial comprehensive list of uncontrollable variables was reduced to the six variables as discussed earlier in phase three. These variables are quantified through working with a number of WHP’s databases.
10. Phase Six: Running the Models
The model selection process was discussed earlier in phase four, and the model applicable to WHP’s case was selected. Several iterations of the selected DEA model were run in order to identify the best way of incorporating the variables into the models. Before continuing with these iterations, it is important to explain the isotonicity concept in DEA. In DEA context, the inputs and outputs need to be isotonic. This means that an increase in the input level should result in an increase (not a decrease) in the output level [
37]. Therefore, the effects of every variable that goes into the DEA model need to be carefully investigated. If the isotonicity concept is not satisfied, the variables need to be redefined. If this is not possible, inversion of variables can be used. Through this transformation, a direct proportion between input and output variables can be satisfied [
30,
38,
39].
In the list of the uncontrollable variables included in this research, some do not satisfy the isotonicity principle. Mileage of divided highways variable works to the disadvantage of a division (as it is difficult to enforce the opposing traffic in a divided highway as was discussed in phase three) and therefore, results in less of the output in case there is more mileage of divided highways. To resolve this issue, this variable was redefined to meet the isotonicity principle and thus converted to mileage of undivided highways to be used in the models. This conversion was performed by subtracting the divided mileage from the total mileage of highway in a division. The variable roadway mileage with shoulder width more than or equal to six feet does not need any change, since it already works to the advantage of a division (troopers feel more comfortable in enforcing when there is sufficient shoulder width to pull over the violators as was discussed in phase three). Following this logic, all of the remaining four uncontrollable variables are inverted in order to meet the isotonicity principle.
The iterations of the DEA models are described below.
10.1. Baseline 1
The model has the input (i.e., number or troopers). The citation/bad driver behavior ratios of all five behavioral categories (i.e., DUI, DIS, RES, SPD and Other) were calculated and included in the model as well as the sum of the enforcement and outreach hours as outputs. All the six uncontrollable variables (albeit in the converted format as discussed above) were included in the model. The results indicated that all of the divisions were 100% efficient. This means that there are too many variables in the models in comparison to the number of divisions and therefore, the model does not have enough discriminating power to identify the poor performing divisions.
10.2. Baseline 2
The inputs and outputs are the same as Baseline 1. Uncontrollable variables were modified in an attempt to reduce the number of variables a follows.
Traffic was combined with area served (i.e., centerline mileage) to form a concept called vehicle miles travelled (VMT). VMT is not isotonic, meaning that the more the VMT in a division, the harder it gets to patrol and enforce in that division. Therefore, = was considered in this baseline.
Mileage with shoulder width greater than or equal to six feet was also added to the mileage of undivided highway. This is a valid modification, since both of those variables have implications on the concept of difficulty in enforcement. Since they both work to the advantage of a division, no inversion is required.
In spite of reducing the number of uncontrollable variables from six to four, the results still indicate that all but one division are 100 percent efficient. This means that further variable refinement is needed to increase the discriminating power of the DEA models.
10.3. Baseline 3
In this iteration, a statistical approach called the principal component analysis (PCA) was utilized to further reduce the number of variables and thus to increase the discriminating power of the model. PCA is a variable reduction method that was identified to be applicable and appropriate for the purposes of our study. PCA is a mathematical procedure that transforms a number of possibly correlated variables into a smaller amount of variables that are uncorrelated, called principal components (PC) [
40]. Every principal component analysis would have the same number of PCs as the original number of variables in the data set. For instance, if PCA is being performed on a total number of eight variables, there will be eight PCs as the result of the analysis. From these eight PCs, the first two or three would explain the majority of the variability in the original dataset (i.e., the extent of the information captured by the original eight variables). The first PC accounts for as much of the variability in the initial set of data as possible and each PC after that account for as much of the remaining variability in the data as possible. PCA extracts uncorrelated PCs through a linear transformation of the original data set, therefore, by considering the first few PCs, the number of variables will be reduced, while at the same time, maintaining most of the variability in the original variables [
40,
41].
To reduce the number of variables, PCA was performed on the six isotonic uncontrollable variables. It was calculated that 83.07% of the variability in the original dataset is explained by using only two principal components. From here on, those principal components are used in place of the six uncontrollable variables in the DEA models.
The model with one input, two principal components as uncontrollable variables (PC1 and PC2) and six outputs (i.e., DUI, DIS, RES, SPD, Other, and the sum of the enforcement and outreach hours) was the third baseline in this study, which was the first time that some inefficient divisions were identified. The results of this model are presented in
Table 2 under the column for Baseline 3.
Baseline 3 is the selected model for the analysis of the results and is further compared against two other models:
Comparison 1: No uncontrollable variables are included in this model. Input and outputs are the same as Baseline 3. A comparison between Baseline 3 and this model shows the effects of including uncontrollable variables.
Table 2 demonstrates the results of this model.
Comparison 2: All of the citations and all of the behaviors were combined together to form one large ratio of citation/bad driver behavior. Therefore, this model only has two outputs (i.e., one output for the entire citations to behaviors ratio and one output for the sum of the enforcement and outreach hours). PC1 and PC2 are the uncontrollable variables in this model and there is one input (i.e., number of troopers). This model is compared against Baseline 3 model to illustrate the impact of including different behavioral categories in the model separately as opposed to combining them.
Table 2 demonstrates the results of this model.
11. Results and Discussion
The results of the models can provide valuable guidance to decision makers regarding inefficient divisions of WHP and benchmarks (peers).
Table 2, Baseline 3 results show that efficiency differences exist between the divisions of WHP. While the efficiency scores of inefficient divisions are not that low, the differences between efficiency scores indicate that even when all divisions are provided with every chance to look their best, i.e., maximize their efficiency through the DEA modeling approach, there are still a few divisions (A, C, E, G, and M) that are not completely efficient. The specific division of concern with the lowest efficiency score is Division M.
One of the most important outcomes of a DEA study, aside from the fact that each DMU gets to know what efficiency level it is performing at, is to identify the efficient peers of the inefficient DMUs. This allows for benchmarking, where divisions could identify the differences between practices that are responsible for better efficiency scores in those divisions labeled as peers. The results presented in
Table 2, Baseline 3 suggest that there are quite a few 100% efficient divisions that can be further set as benchmarks for the inefficient divisions for them to learn from those benchmarks’ best practices and improve their own patrol operations in order to achieve 100% efficiency.
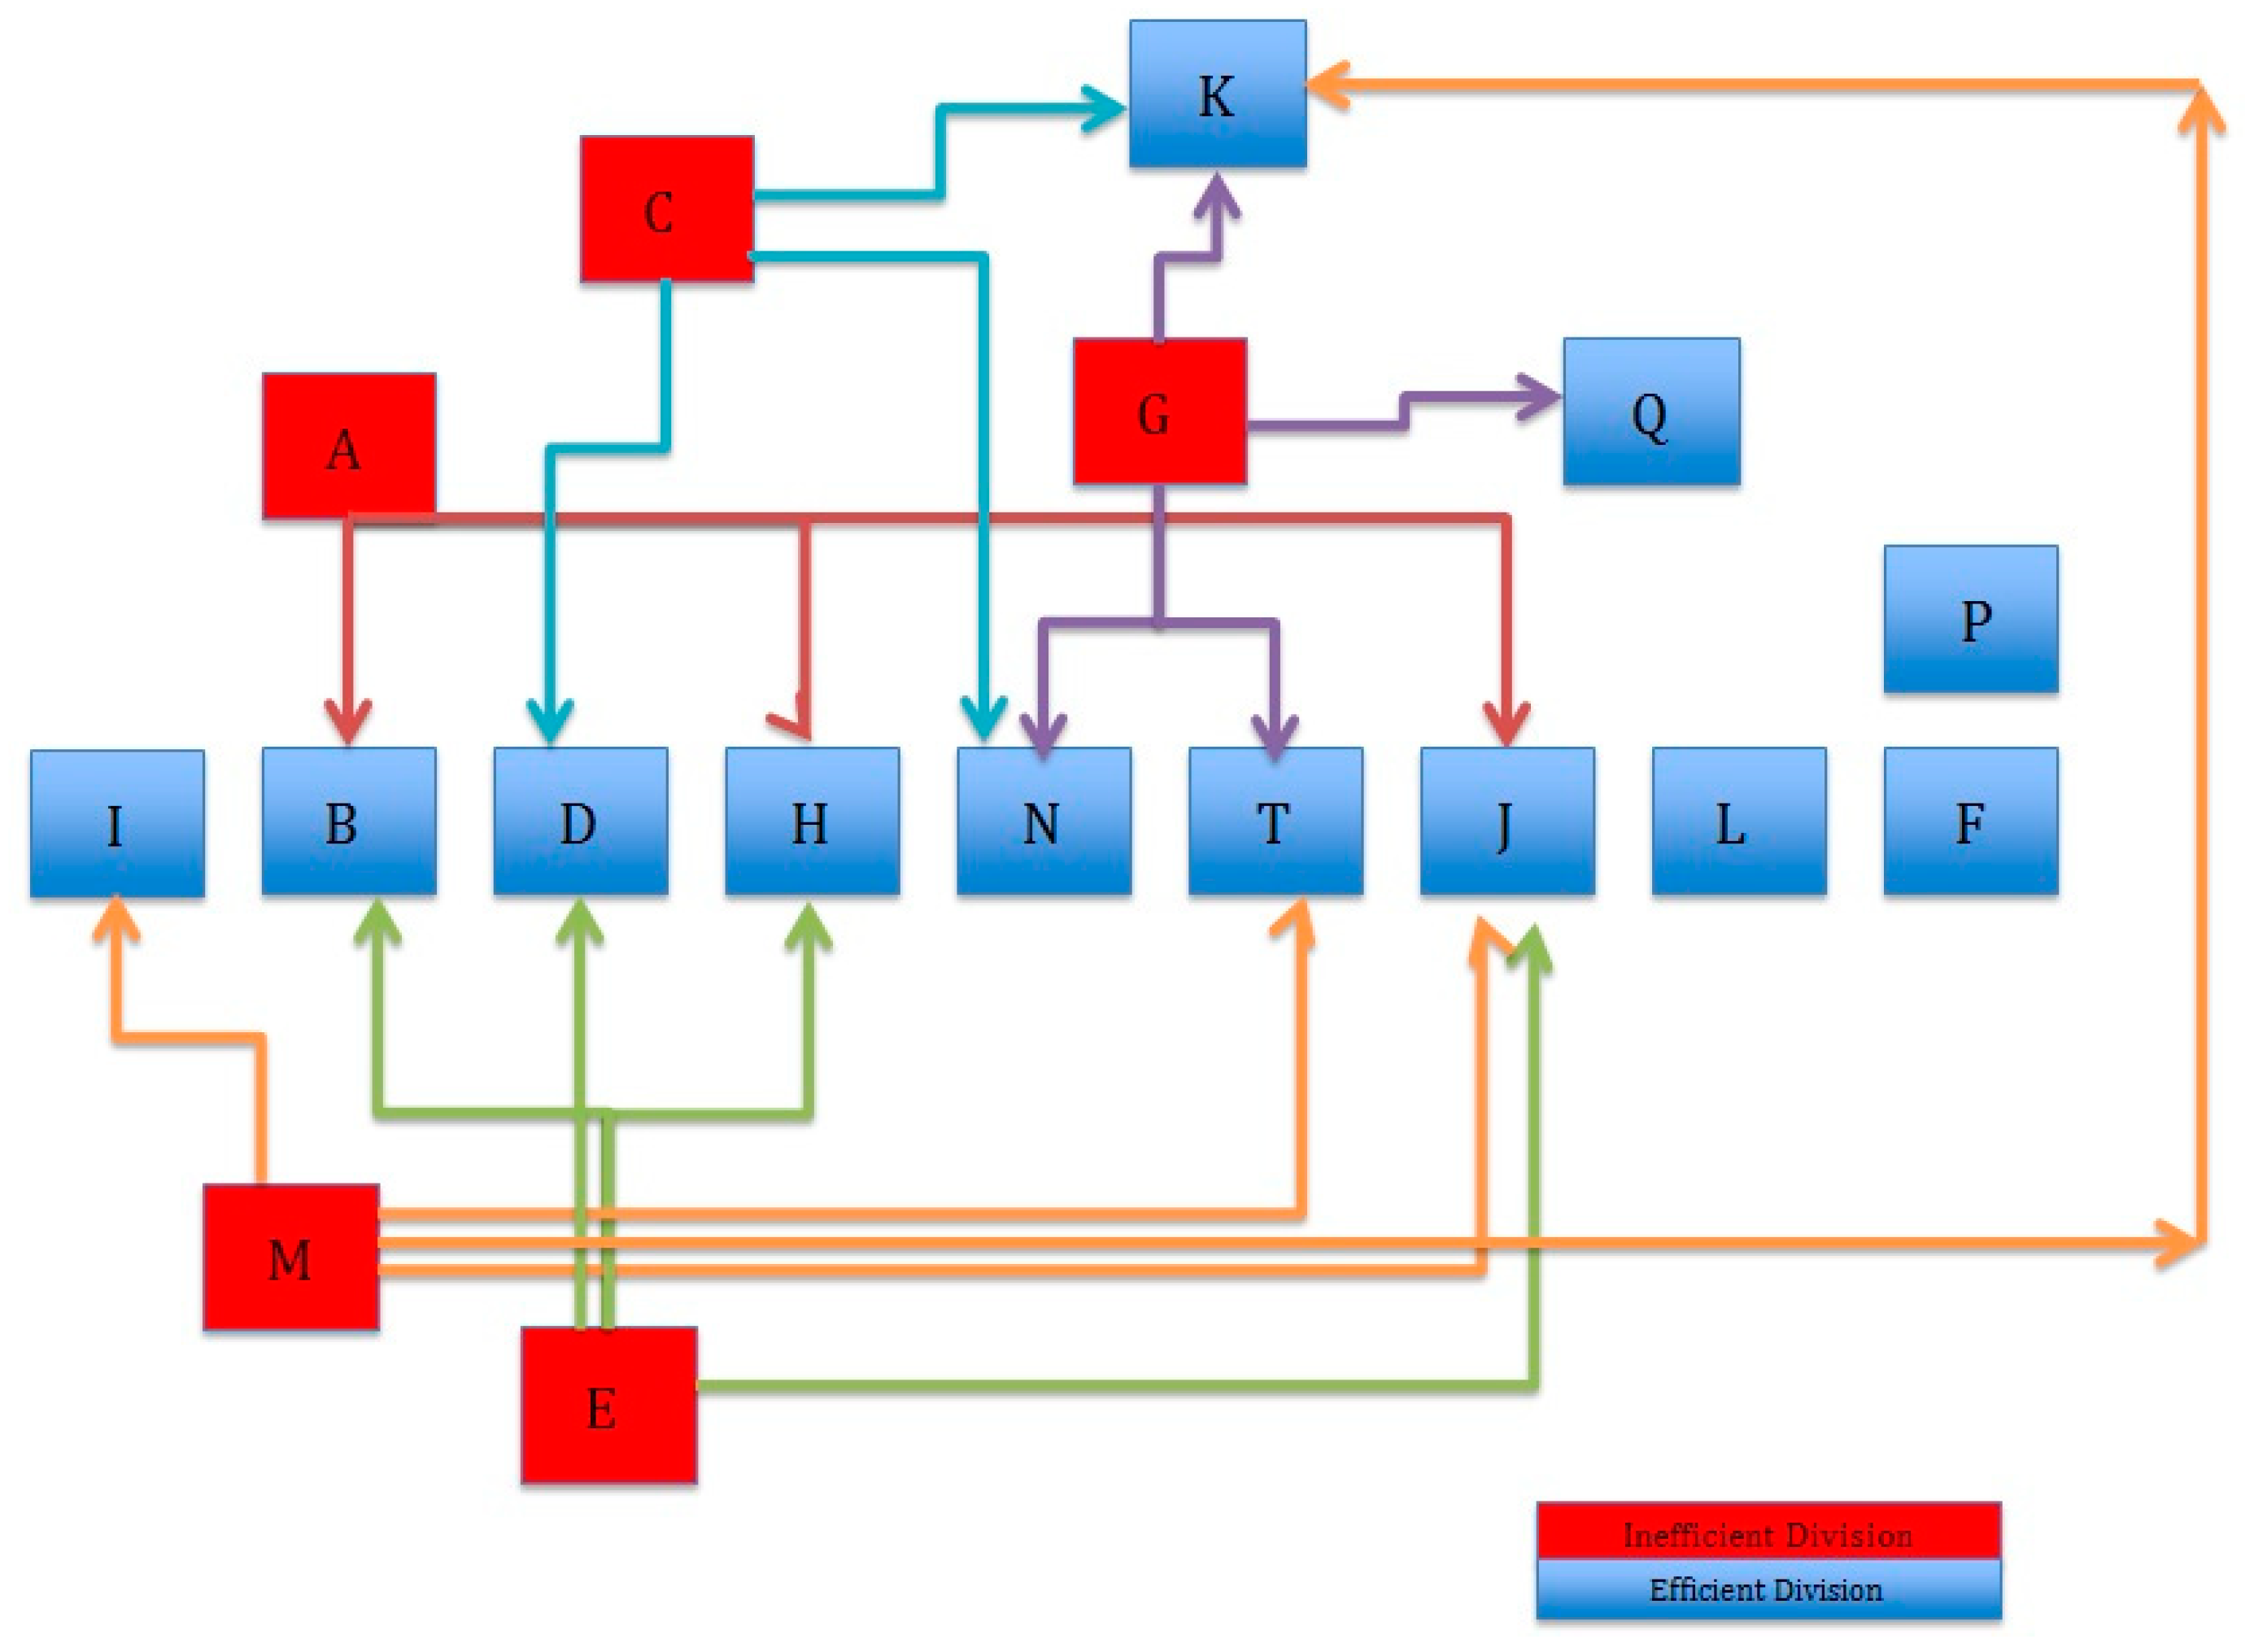
Figure 1 and
Table 3 show the peers in WHP with relation to inefficient divisions.
The importance of the peer relationship diagram shown in
Figure 1 and
Table 3 stems from the fact that it helps the benchmarking process by identifying the peers that a given division needs to work with. For example, while there are other 100% efficient divisions, DEA pinpoints four 100% efficient divisions (Divisions I, J, K, and T) as peers for the inefficient Division M (i.e., the division of concern). DEA model restricts the peer comparison set for Division M to these four divisions because they all operate at similar scales and thus it is more realistic for Division M to identify those four divisions as benchmarks to be able to improve its own operations and efficiency. Therefore, to identify their best practices, Division M should analyze those divisions’ managerial and operational practices. This can allow for benchmarking and implementation of necessary changes to improve the efficiency of Division M.
Figure 1 and
Table 3 also reveal that Division J and Division K are the ones that are most frequently referenced as peers by other divisions.
Results from comparing Baseline 3 and Comparison 1 models in
Table 2 show the significance of uncontrollable variables and including those in DEA models to create a leveled playing field when making the efficiency comparisons. For example, without the inclusion of uncontrollable variables (Comparison 1 model), 12 divisions were inefficient according to the model. Once uncontrollable variables were included (Baseline 3 model) and the comparison between the divisions was leveled, only five inefficient divisions remained, all of which faced increased efficiency scores. Specifically, the division that mostly suffers from the negative effects of uncontrollable factors on patrol operations is Division P. This is because that is the division that has the highest difference in efficiency scores between Baseline 3 (the model in which the effects of uncontrollable factors are considered) and Comparison 1 (the model in which the effects of uncontrollable factors are disregarded) models at 30.4% (100–69.61%). In other words, if the uncontrollable factors were not considered, Division P would receive an efficiency score of 69.61%; but when those factors are incorporated into the framework, Division P turned out to be 100% efficient. This example alone clearly indicates the power of the framework in identifying the efficiency of highway patrol divisions in the presence of uncontrollable factors by considering the effects of those factors on efficiency. By doing so, the framework eliminates the artificial inefficiencies introduced by those uncontrollable factors and thus identifies pure efficiency scores of divisions in performing highway patrol operations. Such pure efficiency scores can serve as important guidance to decision makers in identifying the changes that need to be introduced to the divisions.
A comparison between Baseline 3 and Comparison 2 models in
Table 2 reveals that minor differences exist when all the behavioral categories are combined together (i.e., when the number of variables in the model is significantly reduced). These minor differences point out the fact that a large number of efficient divisions (and relatively high-efficiency scores of inefficient divisions) do not result from a large number of variables (and thus potentially low discriminating power of the DEA models). Even when only two output variables were used (in Comparison 2 model) as opposed to six (in Baseline 3 model), the results are very similar, indicating that efficient divisions did not end up being efficient due to problems with discriminating power.
This research contributes to the body of knowledge in several aspects as discussed below.
Although DEA has been utilized for organizational performance evaluation in multiple sectors such as banks, insurance companies, hospitals, industrialized manufactures, universities, hotels, military services in governments, transportation, and engineering [
11,
12], literature review to date has not identified any study that has specifically utilized DEA in the context of highway traffic safety from the highway patrol’s perspective. It should be noted that although DEA has been used in both highway safety and police forces domains separately, no study was found to combine the two areas together. Given the importance of these two domains and DEA’s potential to help improve highway patrol agencies’ performance and efficiency, this research is believed to contribute to the body of knowledge by serving as a starting point and reference for future studies to advance the methodology of performance measurement and improvement in highway agencies.
Another contribution of the framework developed in this research is that it can be implemented by highway patrol agencies to save lives. All of the crashes happening because of poor driver behaviors are preventable. The benchmarking process proposed in this research provides the first step for the decision makers to familiarize themselves with what best practices are being implemented in each division of a patrol agency. Then decision makers should choose the successful practices in efficient divisions, decide to implement them in less efficient divisions, and undertake associated changes that need to happen in order for those practices to be successfully incorporated in poor performing divisions. By implementing these best practices, divisions of a patrol agency could then concentrate more on the right practices in the most effective areas that could have the highest influence in achieving their desired goals and spend less time in the areas that have no practical returns, ultimately resulting in improving roadway users’ behaviors and thus hopefully saving lives.
Another important contribution of this study is that the proposed framework can improve the overall efficiency of highway patrol agencies. This will allow for more effective utilization of available resources in order to produce more of the desired outcomes, which consequently, could lead to saving time, money and manpower throughout the organization.
12. Conclusions and Future Research
This paper discusses performance measurement and benchmarking concepts for highway patrol agencies and introduces a framework that can be used by highway patrol agencies for performance measurement and benchmarking. The DEA-based framework introduced in this paper can measure and compare the efficiency performance of the divisions of a highway patrol agency in the presence of multiple measures in an attempt to allow internal benchmarking and thus to improve the overall organizational performance. This paper also presents an example implementation of the DEA framework in which real data from WHP’s database (for one calendar year which was made available to the authors for this research) is utilized. As a result of this implementation example, results and discussion were presented as they relate to WHP’s divisions’ efficiency scores, efficient and inefficient divisions, benchmarks, peer-relationships, and effects of uncontrollable factors on the efficiency of WHP’s divisions.
The results obtained from the DEA-based framework can start the process through which decision makers identify the reasons why some divisions are more efficient than others. Specifically, it is recommended that executive level officers investigate the managerial and operational practices of divisions that are identified to be inefficient and their peers (benchmarks) through this framework.
The results and processes introduced in this study could be implemented by other patrol agencies for internal and external benchmarking practices in an attempt to constantly improve organizational performance. The performance measures introduced in this study could also be replicated in other patrolling agencies with similar goals. Also, the approach behind developing the proposed performance measures could be highly beneficial in defining a set of nationwide performance measures in the context of highway traffic safety to be implemented by enforcement agencies for the purposes of external benchmarking.
Although this paper presented an implementation example of the DEA-based framework in which efficient peers were identified through running the DEA models, the process by which benchmarking can be completed is not within the scope of this paper. This presents a great future research opportunity, and the roadmap to such along with potential surveys developed by the authors to facilitate the benchmarking process are available in [
32].

