1. Introduction
Studying the structural performance and service life of highway bridges is essential in the development of an overall efficient traffic system. Fatigue is considered to be one of the most significant problems that affect the structural performance and durability of bridges. The daily flow of traffic that creates repeated stresses and leads to stiffness degradation causes it, eventually resulting in a sudden collapse of the structure [
1]. The fatigue life of a material can be divided into three stages: crack initiation, crack propagation due to tensile stresses, and sudden fracture or brittle-like failure [
2]. Different approaches are used to develop a fatigue stress-life predication model, including the stress-life approach, strain-life approach, and linear elastic fracture mechanics approach [
3].
The stress-life approach is a stress-based method that was developed to understand the fatigue behavior of materials. It is mainly employed to prevent crack initiation for high-cycle fatigue loading when the stresses are within the elastic range [
2]. In a stress-based fatigue test of Reinforced Concrete (RC) beams, the specimens are subjected to constant cyclic loading at different stress ranges. The obtained data points, stress ranges versus a number of cycles to failure, are plotted on a log-log or semi-log graph. Linear-regression analysis is performed with respect to the obtained data in order to establish the S-N curve, which characterizes the fatigue strength of the tested specimens. The S-N curve follows a given slope that intersects with the stress range axis at the static strength. The horizontal line of the S-N model is called the endurance or fatigue limit, at which no fatigue damages are expected within the stress ranges below the line [
4].
The applied standard methods for determining the S-N curve and endurance limit of RC beams are expensive and time-consuming [
5]. Moreover, they require many specimens to be tested for long periods, especially at low stress or strain ranges. A significant amount of data will be generated, and further statistical analysis is necessary to obtain more reliable fatigue stress-life models [
6]. Thus, different accelerated fatigue methods were developed for determining the endurance limit that is based on the hypothesis of linear accumulation damage, as determined by Palmgren and Miner [
7,
8], including the methods that were developed by Prot, Locati, Muratov, Enomoto, Rotem, etc. [
9]. No studies were conducted to investigate the S-N model of RC beams that were developed by an accelerated fatigue method to the knowledge of the authors. This paper examines the ability of the accelerated fatigue approach that was developed by Rotem [
10] for providing a fatigue stress-life model of RC beams. The predictions of the proposed S-N curve are evaluated with respect to experimental data obtained from the literature.
2. Fatigue Life of RC Beams
A highway bridge with 40 years of design life might experience more than 58 × 10
8 cycles of traffic loading over its service life [
11]. This produces cyclic stresses that lead to physical microscopic damages, even at stresses that are below the yield strength of the used construction materials. As the cyclic loads continue, microscopic damages can accumulate until they are developed into a crack [
2]. The cross-sectional area of the materials will be effectively decreased once these minor cracks combine into major cracks. Over time, with the environmental deterioration and the increase of traffic flow, the cumulative damages can potentially lead to sudden fatigue failure when the applied cyclic loads cause higher stresses than what the cross-section can endure [
12]. The fatigue behavior of a material can be represented by the best fit straight line on a semi-log or log-log plot [
2]. The following equations express the line:
where C, D, A, and B are the fitting constants obtained by the least squares regression method. Standard fatigue testing methods are used to determine the fatigue life models of RC beams that are based on different approaches, such as the stress-life approach. That includes applying constant cyclic tension-tension loads at different stress or strain ranges. Helgason and Hanson [
13] tested the deformed reinforcement steel rebars in air under axial fatigue loading and performed a statistical analysis of the obtained experimental data. They proposed the following equation for predicting fatigue life:
where
is stress range in steel rebars in MPa. Likewise, Moss [
14] developed another model that is based on experimental data obtained from axial fatigue loading of steel rebars embedded in concrete:
where
which represents the inverse slope of the S-N curve;
for the mean line of the relationship; and,
for the mean minus two standard deviations line.
ACI Committee 215 [
15] recommends that the maximum allowable stress range in the straight deformed reinforcement in RC beams is given by the following equation:
where
is minimum stress range in steel rebars in MPa (positive for tension and negative for compression). The applied stress range cannot be taken less than 138 MPa.
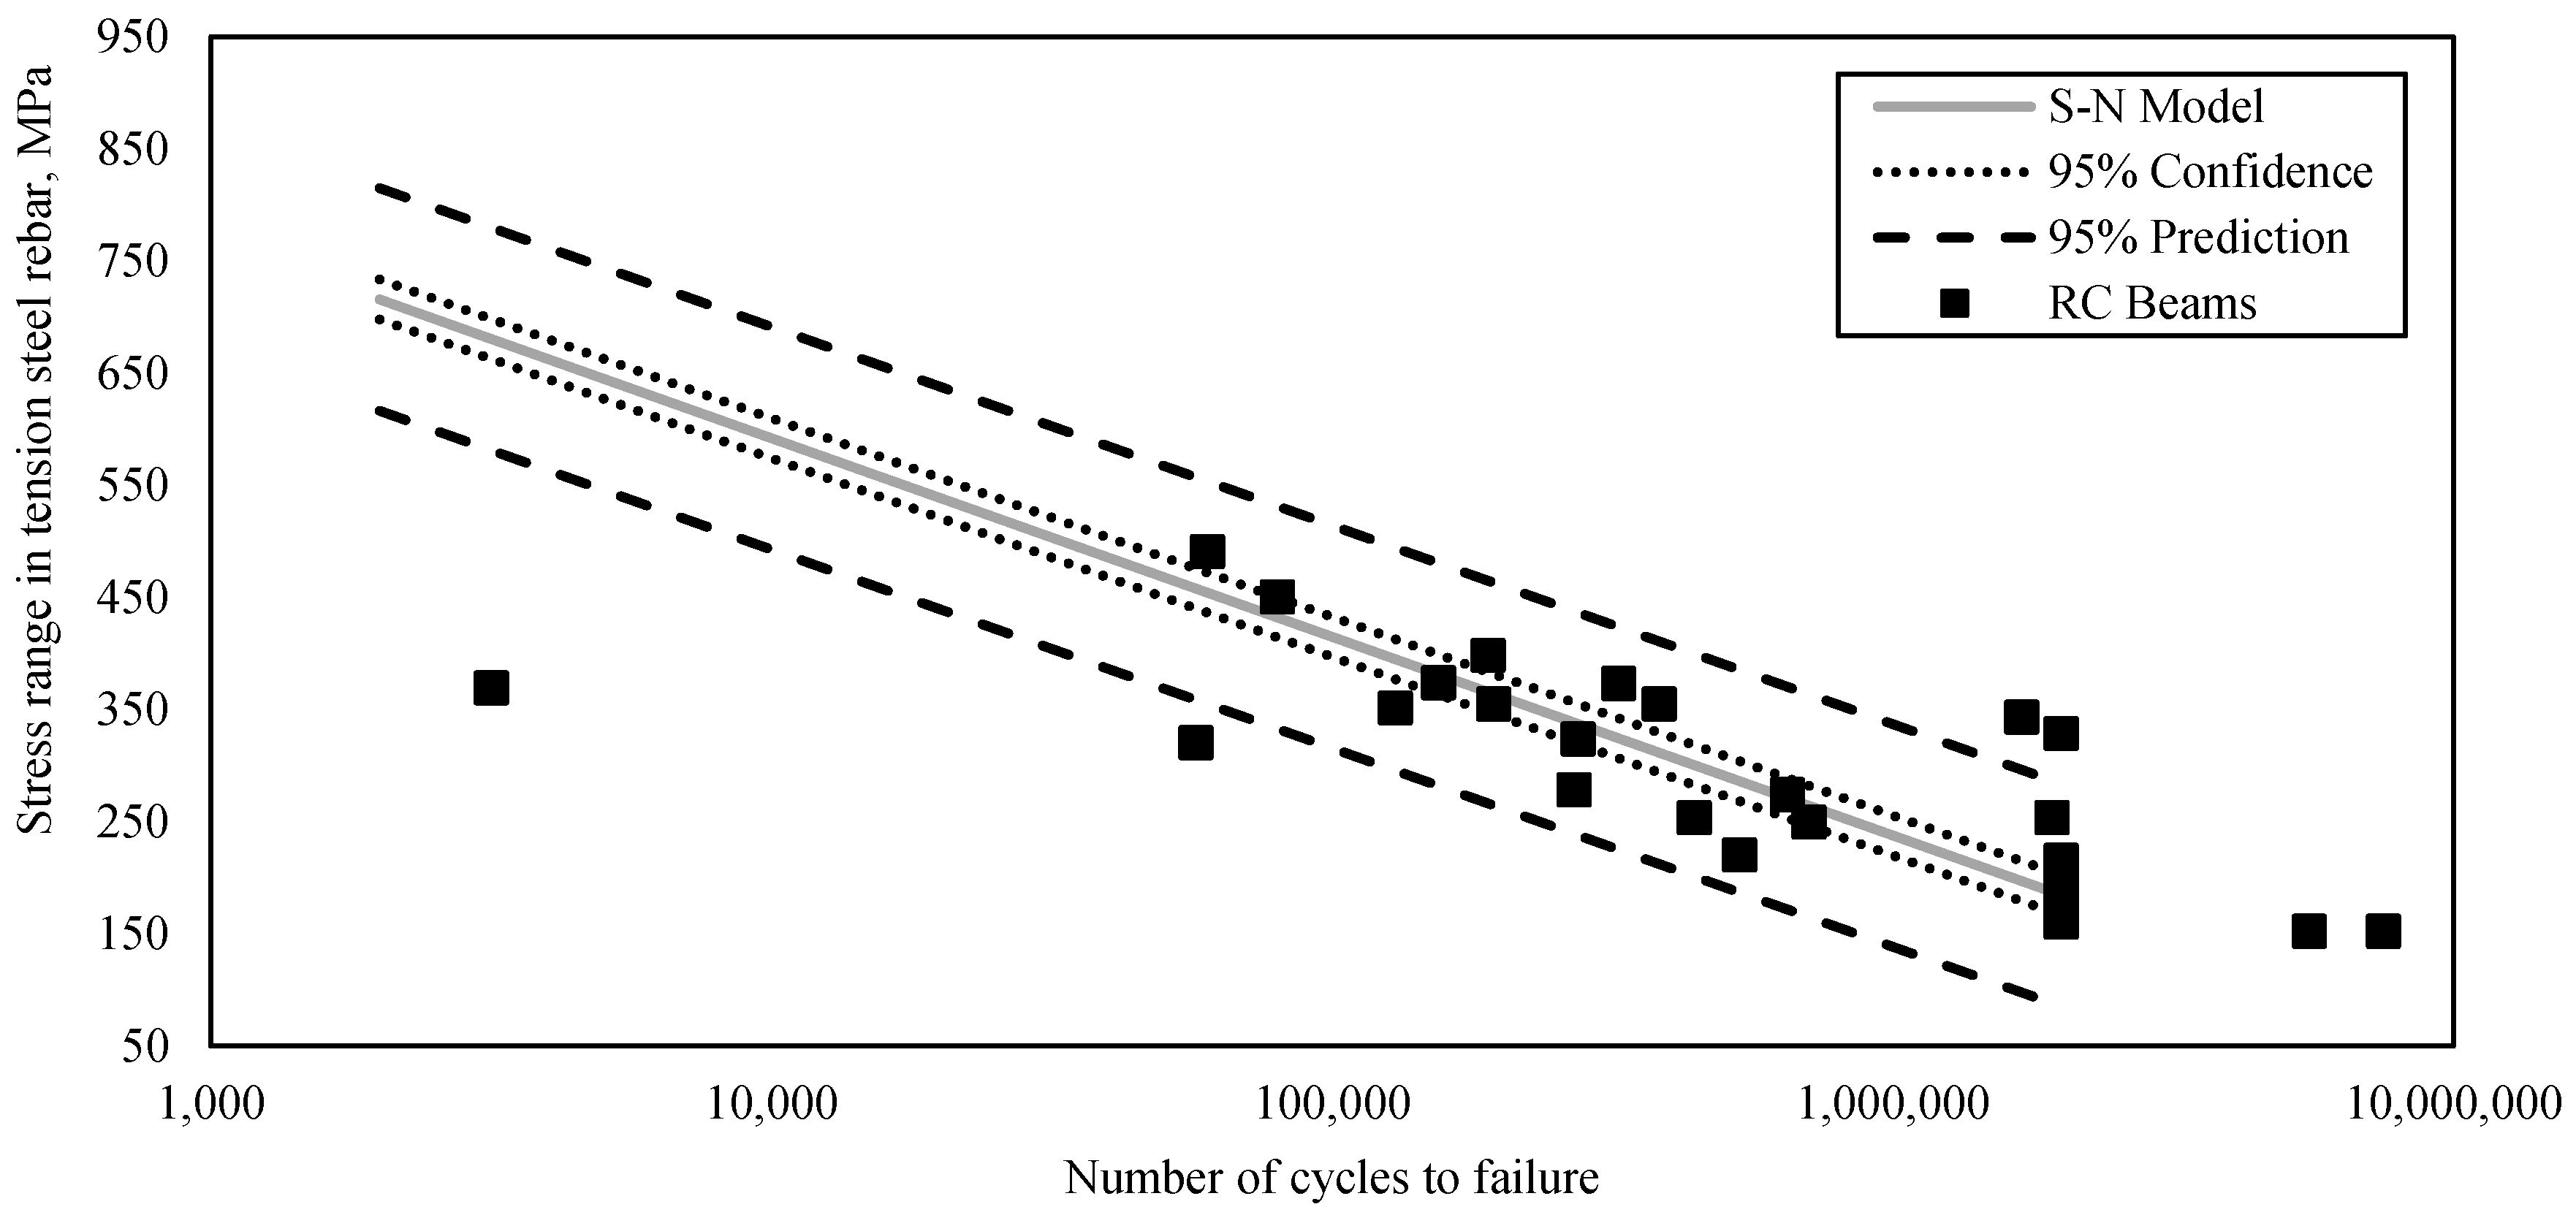
A fatigue stress-life predication model of RC beams was developed while using a power regression analysis. 95% confidence and prediction bands of S-N curves were calculated, as stated in ASTM [
16] and are shown in
Figure 1. The model is based on 26 data points of RC beams that were tested under constant amplitude cyclic loading, as reported by different experimental studies in the literature. The applied stress range is considered to be the dominant factor that affects the fatigue strength of RC beams [
13]. Therefore, the influence of R-ratio was ignored, as it varies the selected data between 0.0 to 0.30. Only RC beams that failed due to the rupture of steel rebars were considered, as addressed in
Table 1. The prediction model is expressed by Equation (6), with a coefficient of determination of R
2 = 0.80:
3. Development of the Accelerated Fatigue Approach
Palmgren [
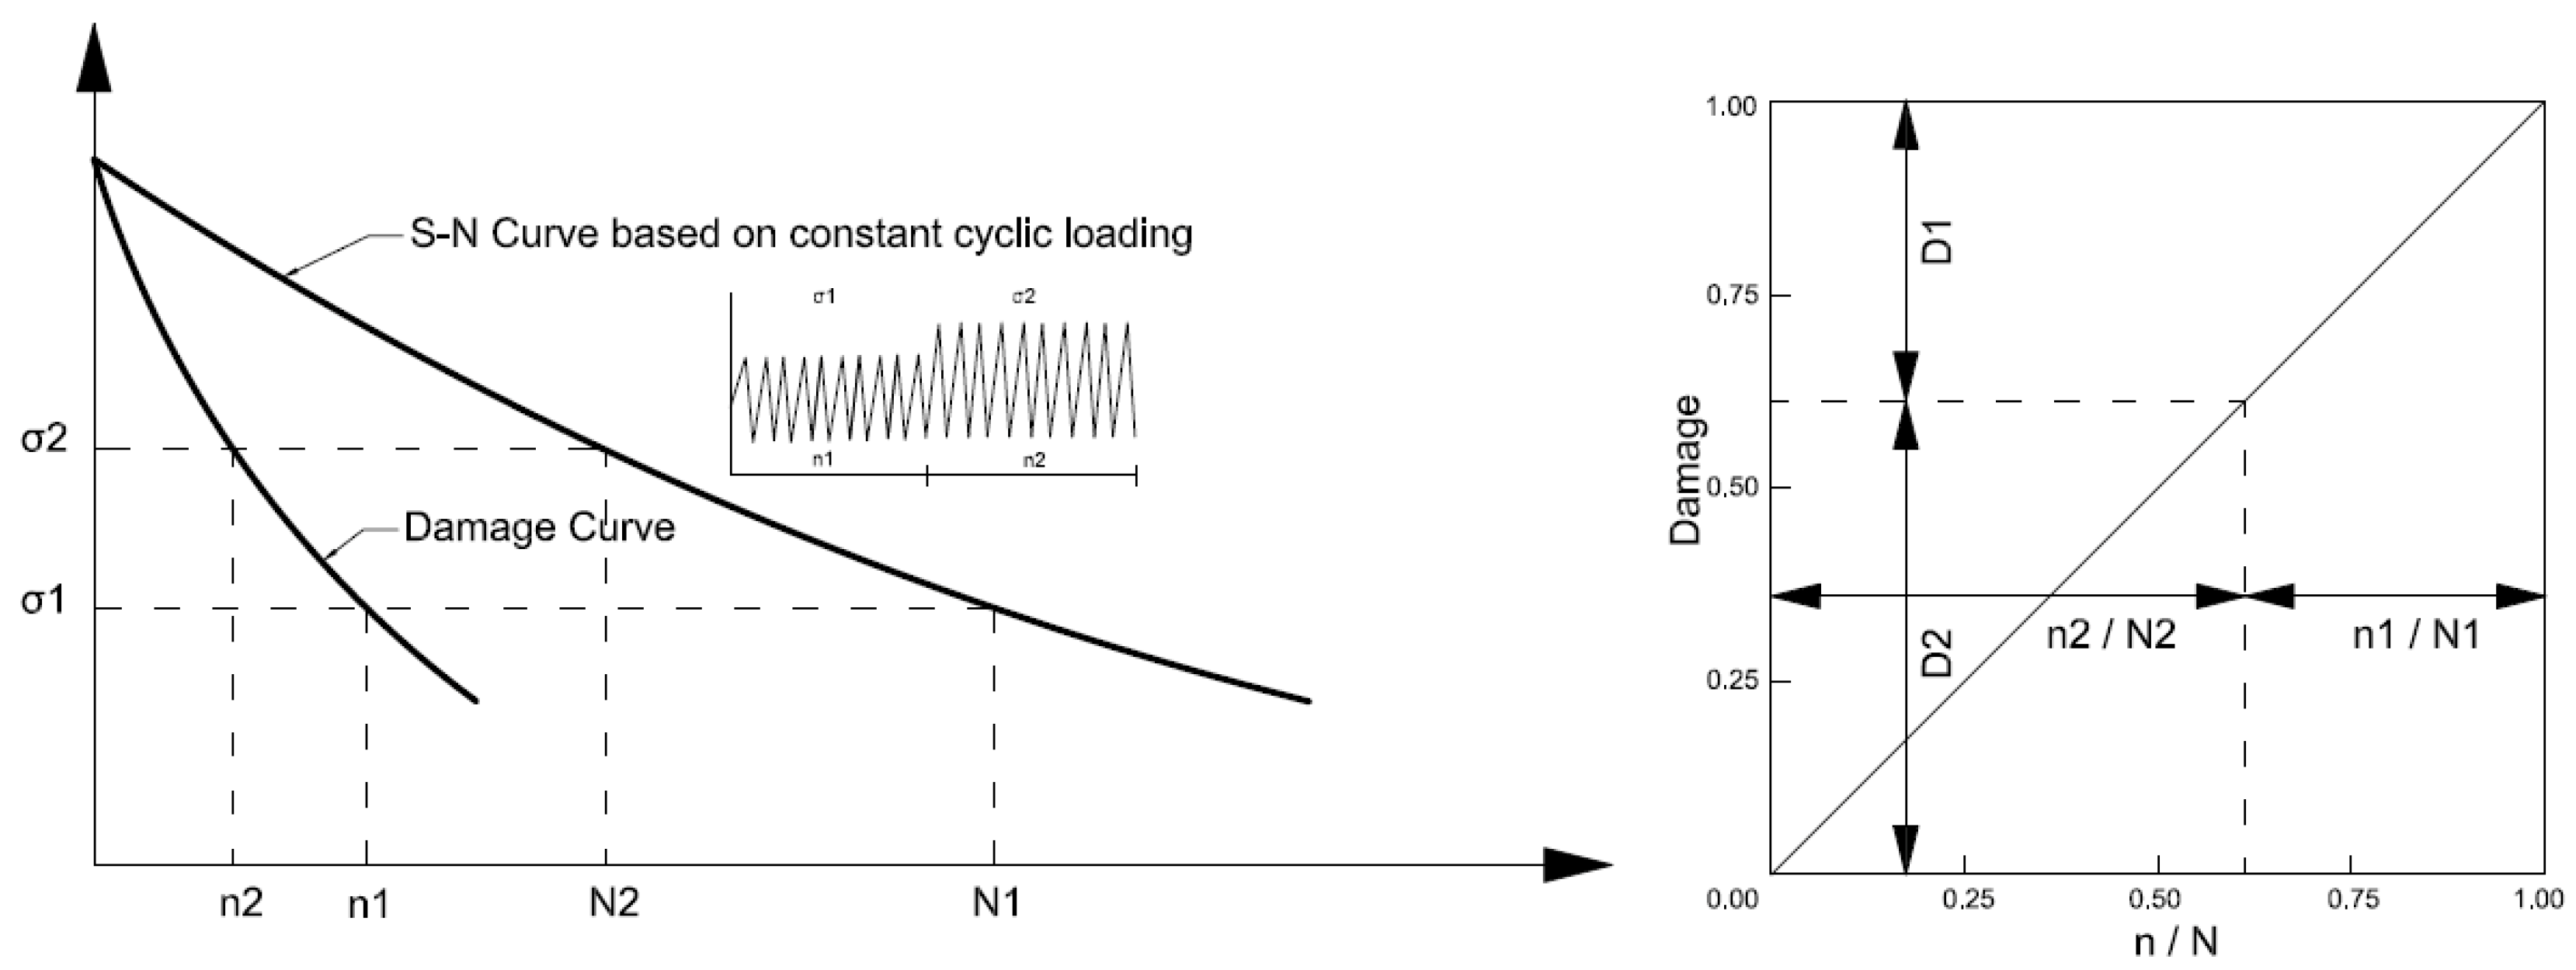
8] was the first to introduce the hypothesis of linear cumulative damage. The hypothesis states that the fatigue resistance of a material, which is subjected to variable cyclic loads, is the total sum of ratios of the applied number of cycles at different stress ranges to the number of cycles to failure due to constant stress ranges. This means that the fatigue failure can only occur once the fatigue resistance is completely consumed, at which the total damage is equal to one, as shown in
Figure 2 and represented Equation (7).
where
is the applied number of cycles at a given stress range during variable fatigue loading and
is the fatigue life at the same stress range during constant fatigue loading.
Miner [
7] proposed a derivation of the linear cumulative damage rule. He examined the rule by conducting fatigue experiments on the unnotched specimens for two to four different blocks of variable cyclic loading. Based on the obtained results, the cumulative damage is varying from 0.61 to 1.45 with an average close to 1.0 [
22].
By taking advantage of the Palmgren–Miner rule, Prot [
23] proposed an accelerated testing approach for determining the endurance limit of materials without using standard fatigue tests under constant cyclic loads. The approach involved applying a stress range that is initially set at about 60–70% of its estimated endurance limit, and then to be increased by a constant rate with respect to the number of cycles up to failure. The approach assumes that the S-N curve is a hyperbola that is asymptotic to the endurance limit. Thus, Port presented a linear relationship between the stress at failure and the root of the applied loading rate at which the endurance limit can be found.
Locati developed another form of accelerated fatigue testing for determining the endurance limit [
24]. The approach is based on the linear cumulative damage of the Palmgren–Miner rule. The applied stress range is increasing in the shape of a staircase and until the specimen fails [
4]. Therefore, Locati suggested that a specimen could be tested at one stress level for a given number of cycles. If the specimen does not fail in the first run, the stress range can be increased by a fixed stress ratio of the initially applied stress range, which was approximately 5% in his tests, then repeat the run for the same number of cycles until failure occurs. This method needs a considerable time, as the first loading stage is started below the expected endurance limit. However, the obtained endurance limit is based on an S-N curve that was developed by standard fatigue approaches.
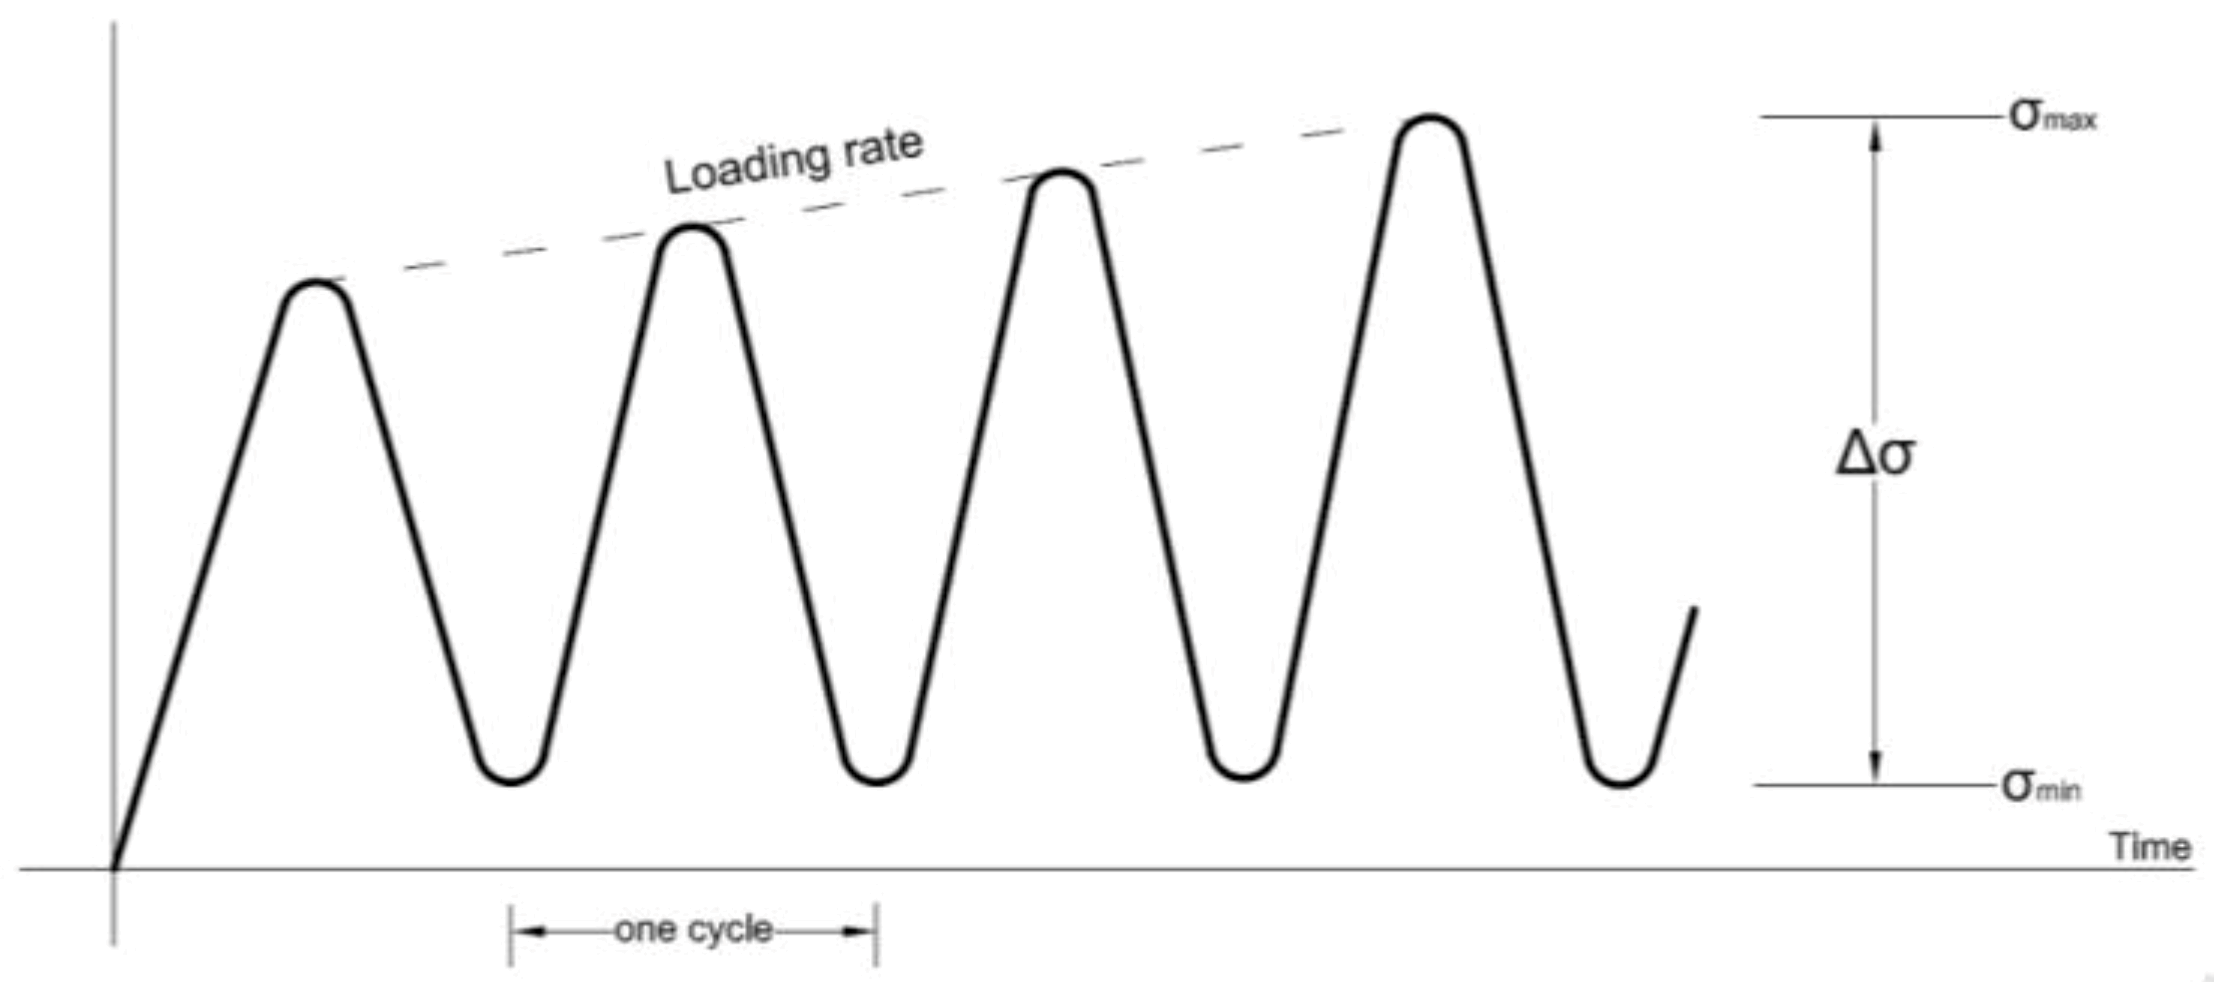
None of the previously proposed accelerated fatigue methods provided the ability to determine the complete fatigue stress-life model. In 1981, Rotem [
10] developed an approach that was based on monotonically increased cyclic loading with respect to the number of cycles until failure, as shown in
Figure 3. The approach reduces the number of cycles, as each test eventually ends with the failure of the specimen. The tested material should be loaded with constant cyclic frequency, temperature, and minimum stress level. This approach is based on the hypothesis of linear accumulation damage of the Palmgren–Miner rule, and it reduces the number of tests that are needed for the determination of both the endurance limit and the S-N curve.
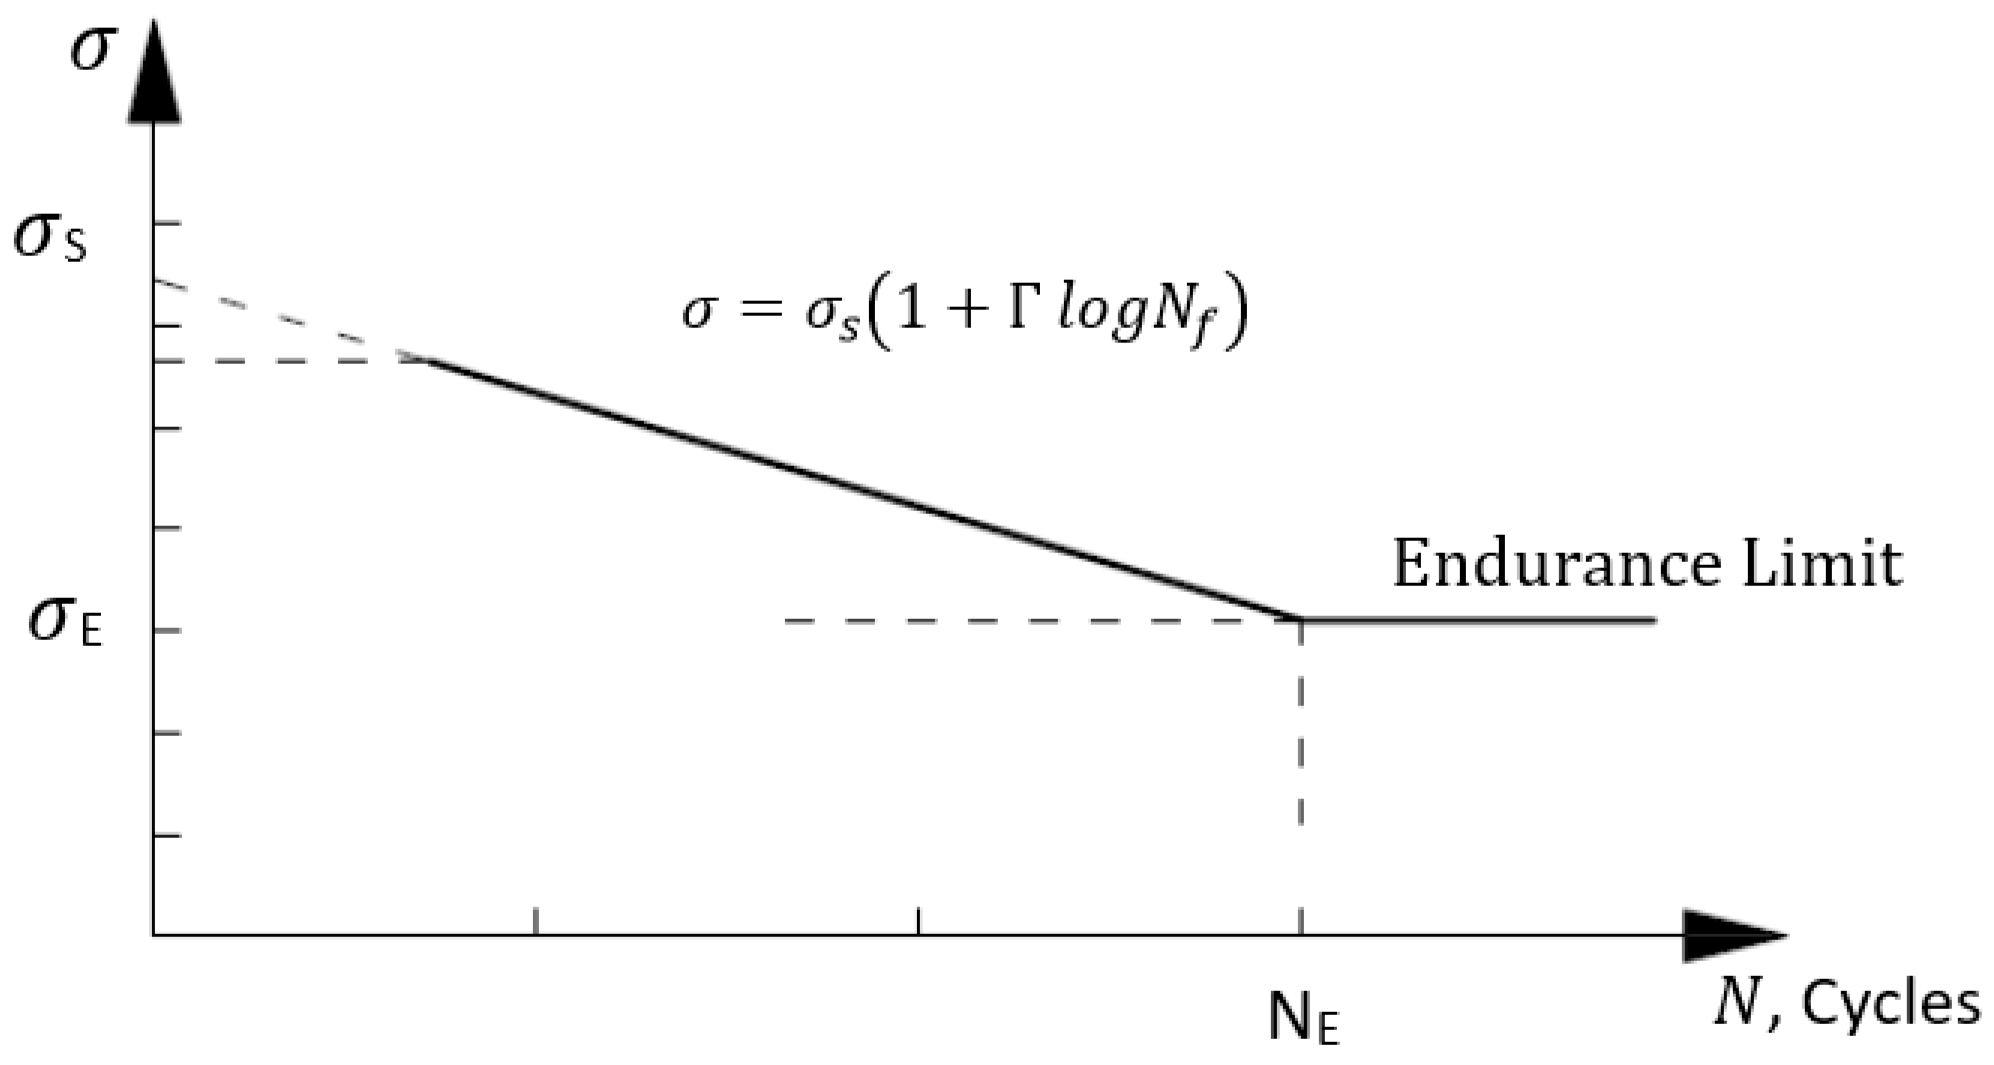
Based on Rotem’s approach, a straight line characterized by three parameters; slope, static strength, and endurance limit, can represent the fatigue stress-life model of RC beams, as shown in
Figure 4. Three specimens are needed for determining the S-N model: two specimens should be tested by an initial stress range above the endurance limit, and the third specimen should be tested by an initial stress range below the endurance limit.
Rotem [
10] derived the accelerated fatigue method for determining a semi-log and log-log S-N curves. A semi-log relation of S-N curve can be written as:
where
is equivalent to the ‘static strength’ and is defined by the value of the S-N curve at N = 1, and
is the slope of the S-N curve.
The number of cycles for a specimen to reach failure can be represented with respect to the applied stress range of the cyclic loading, as follows:
Considering that the linear accumulation damage Palmgren–Miner rule is valid. Subsequently, the total sum of ratios of the applied number of cycles to the number of cycles to failure equals one:
where
is the number of cycles at a constant range
and
is the lifetime at
. While taking into consideration that the monotonically increased cyclic load as multistage loading with continuous successive load
and cycle
increments, Equation (10) becomes:
where
is the lifetime from the S-N curve,
is the initial cyclic stress range, and
is the stress range at failure. In order to solve the above equation, the corresponding life-time by Equation (9) can be expressed as:
The linear change of the cycling load range can be represented by:
where
constant rate of loading, which represents the change in the maximum applied stress level. Now, from Equations (9) and (13):
The derivative of Equation (14) yields:
Subsequently, substituting
into Equation (11) gives:
When considering that the S-N curve has the semi-log form and by rearranging Equation (8), it becomes:
Substituting Equation (17) into (16) yields:
The slope and static strength of a S-N curve can be found by performing two accelerated fatigue tests with different initial conditions, and then solving Equation (18).
Another test is needed to find the endurance limit
, by applying cyclic loading with a stress range that is lower than the expected endurance limit. Equation (16) can be written by dividing the integral into two parts:
Based on the Palmgren–Miner rule, there is no fatigue damage between stress ranges
and
. Accordingly, Equation (19) becomes:
Substituting Equation (16) into (19) gives:
Since both and are known and solving Equation (21), it is possible to find . In order to find the corresponding number of cycles, can be substituted into Equation (8) to give NE.
4. The Numerical Model
ANSYS was used to model three-dimensional finite element RC beam [
25]. The static and fatigue tools were utilized in this study. The fatigue tool allows for the determination of fatigue damage and life using a stress-life approach. By taking advantage of symmetry, half of the RC beam was modeled with proper boundary conditions to reduce the computational time. The displacement was constrained in the perpendicular direction of the symmetry plane. Therefore, the displacement of nodes at the plane of symmetry was set as zero along the X-direction. The support was modeled as a roller, at which the displacement in both the X and Y directions was set as zero to allow rotation, as shown in
Figure 5. The loading and support steel plates were modeled as such to prevent convergence problems and allow for the applied load to transfer in a constant form of pressure. Both of the plates were assumed to have a perfect bond with the concrete. A convergence study was performed to determine the appropriate element size. The model has 9555 elements with a maximum edge of 10 mm. The Newton–Raphson approach was utilized for solving the nonlinearity of the model during the monotonic loading. The static analysis was performed to calibrate the simulated RC beam. The fatigue analysis was performed in increments to obtain the fatigue responses of the model along the fatigue life.
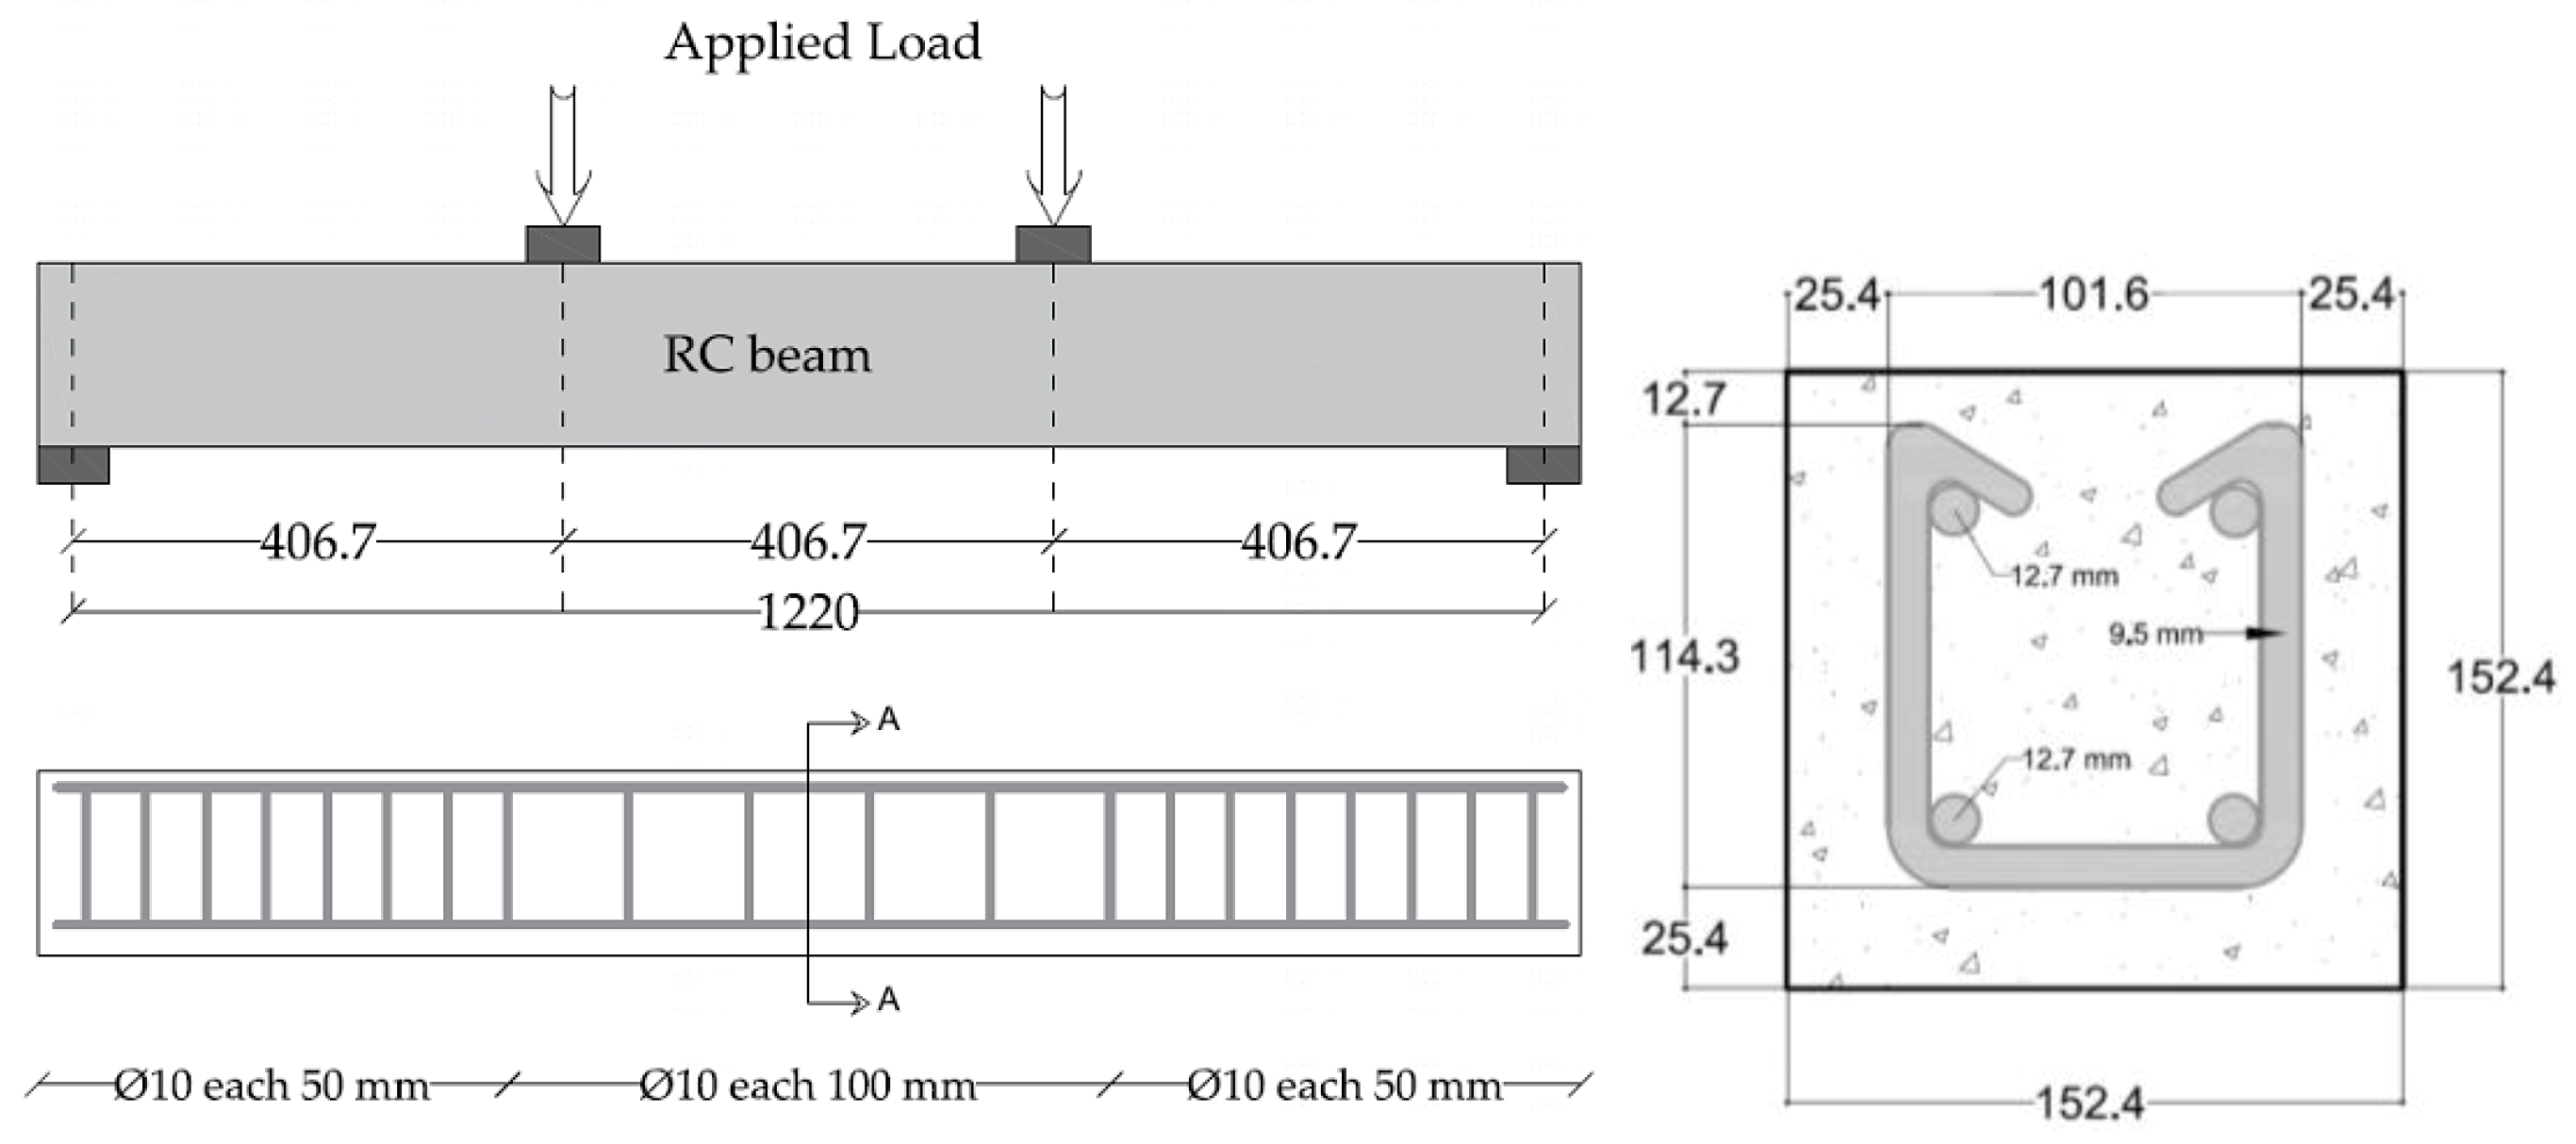
The beam is 1221 mm in length and it has a cross-section of 152.4 × 152.4 mm. As such, these dimensions were selected to calibrate the model with the experimental results that were obtained by Papakonstantinou et al. [
18]. The longitudinal reinforcements are four steel rebars with a diameter of 12.7 mm. U-shaped stirrups of 9.5 mm steel rebars were used as shear reinforcement, with 50 mm spacing within shear spans, and 100 mm spacing within the pure-moment span. The concrete covers for the tensile and compressive steel reinforcement rebars were 25.4 and 12.7 mm, respectively.
Figure 6 illustrates all details.
Element Types and Material Properties
The SOLID65 element was used to model the concrete material. It has eight nodes with three degrees of freedom at each node, translations in the nodal x, y, and z directions. Moreover, the element is capable of predicting the nonlinear behavior of concrete while using the smeared crack approach, which allows for the model to simulate the concrete failure modes, accounting for both cracking in tension, crushing in compression, plastic deformation, and creep in three orthogonal directions [
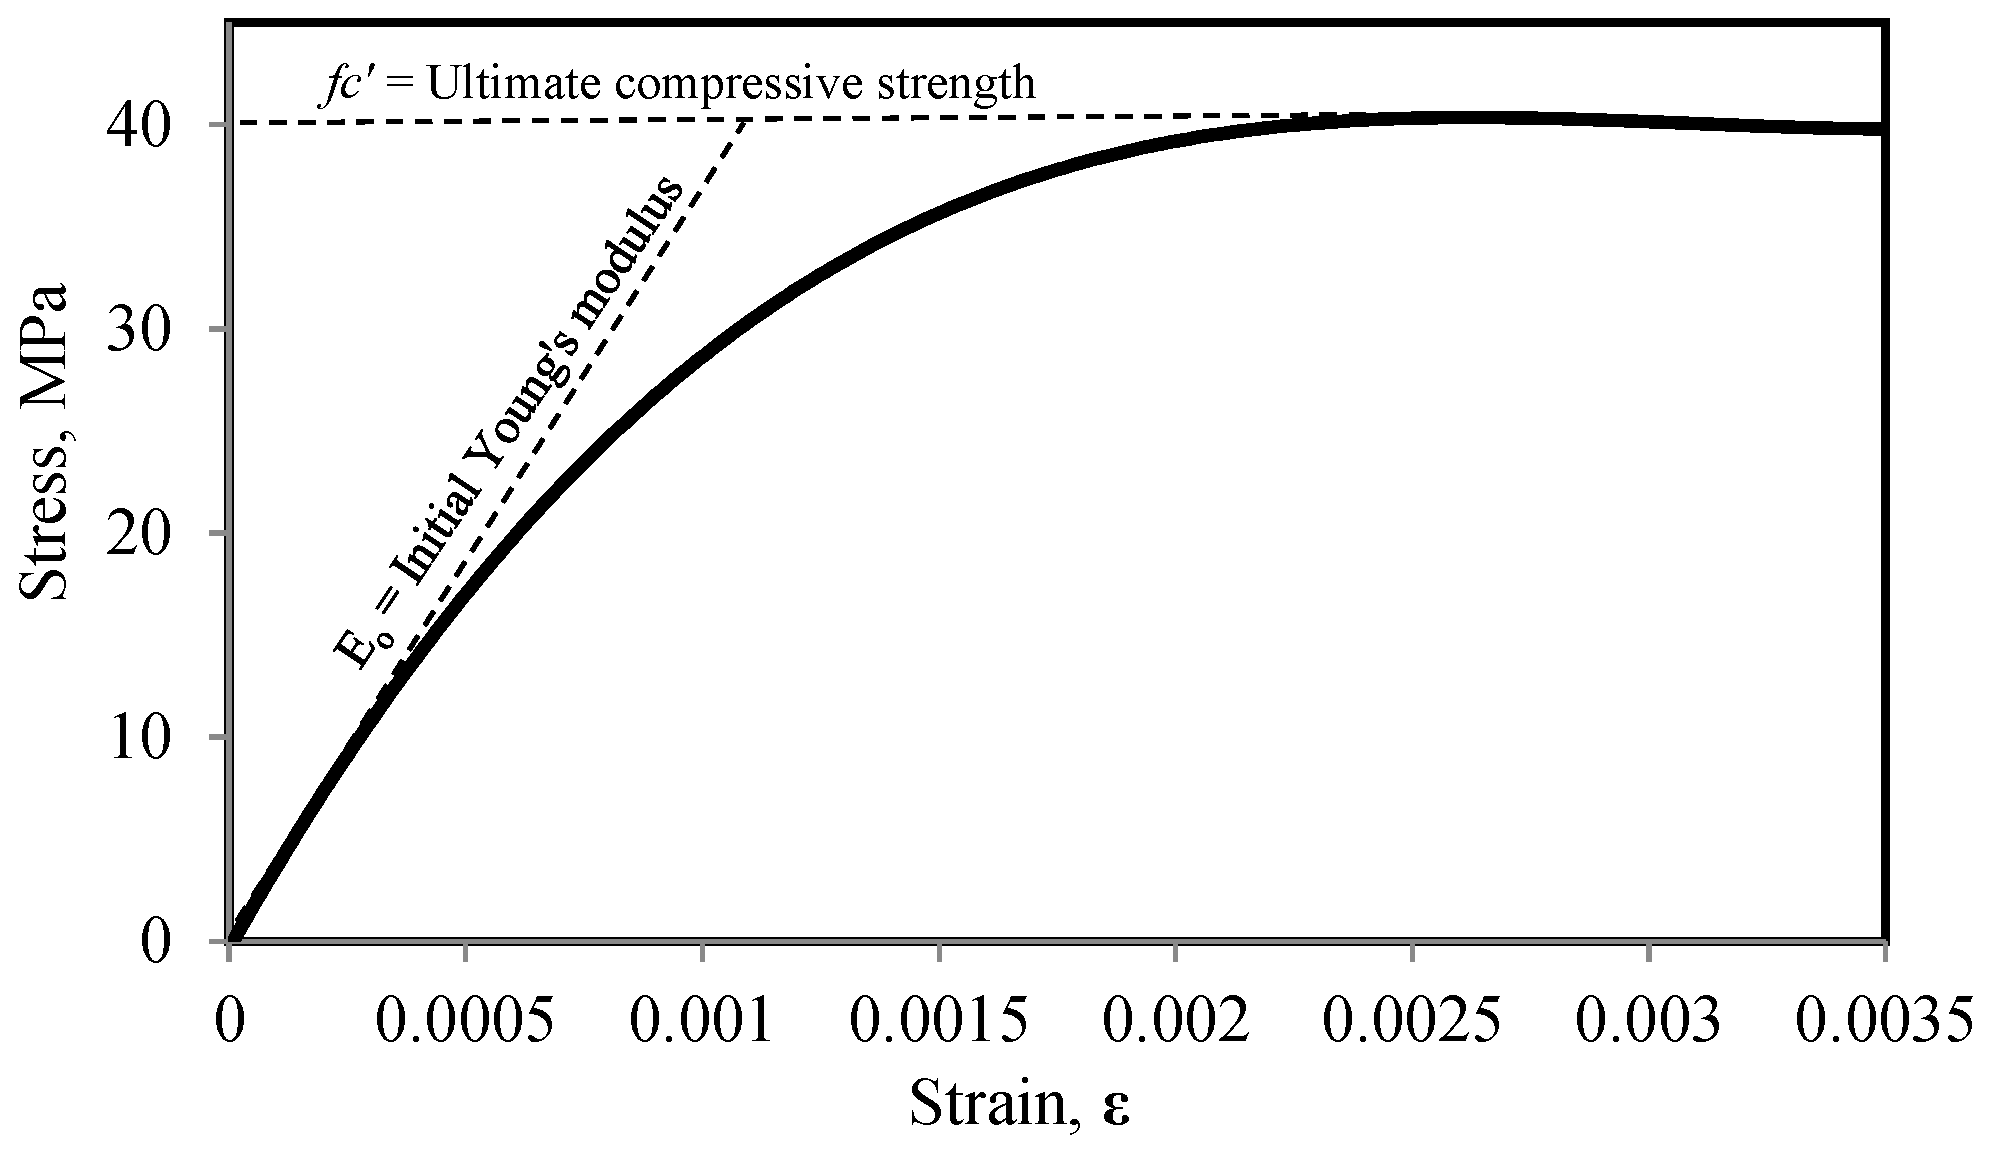
25]. In order to simulate concrete, the SOLID65 element requires defining a multilinear isotropic stress–strain curve. The stress–strain curve was defined using the analytical model that was proposed by Ali et al. [
26], as shown in
Figure 7. The curve was determined based on the experimental value of the compressive strength of concrete, as obtained by Papakonstantinou et al. [
18]. The failure criterion of the SOLID65 element was considered based on the study performed by William and Warnke [
27]. Thus, the failure surface for concrete was defined by the ultimate uniaxial tensile and compressive strengths, which were 4 MPa and 40 MPa, respectively. The initial Young’s modulus of concrete was 29,725 MPa and the Poisson’s ratio was defined as 0.25. The conditions of the crack face were presented by the shear transfer coefficients for an open and closed crack, which were 0.3 and 0.8, respectively. Typical shear transfer coefficients range from 0.0 to 1.0, where 0.0 represents a smooth crack (complete loss of shear transfer) and 1.0 represents a rough crack (no loss of shear transfer). The fatigue properties of the modeled RC beam were defined based on the developed empirical S-N curve, as expressed in Equation (6).
The longitudinal and shear reinforcement steel rebars were modeled using a LINK180 element. It is a uniaxial tension-compression spar element with three degrees of freedom at each node, and it has the ability for translations in the nodal x, y, and z directions. The element is capable of plastic deformation, creep, rotation, large deflection, and large strain. It was modeled as an elastic-plastic bilinear material with an elastic modulus and hardening modulus that is equal to 200 GP and 2000 MPa, respectively. The Poisson’s ratio and yield stress were defined as 0.3 and 470 MPa, respectively. A perfect bond was assumed between concrete and steel reinforcement.
The eight nodes SOLID45 element was used for modeling the support and loading plates. This element has eight nodes with three degrees of freedom at each node, and translations in the nodal x, y, and z directions. SOLID45 element has the capability of plasticity, creep, swelling, stress stiffening, large deflection, and large strain. It was modeled as a linear isotropic element with a modulus of elasticity and Poisson’s ratio similar to LINK180.
5. Discussion
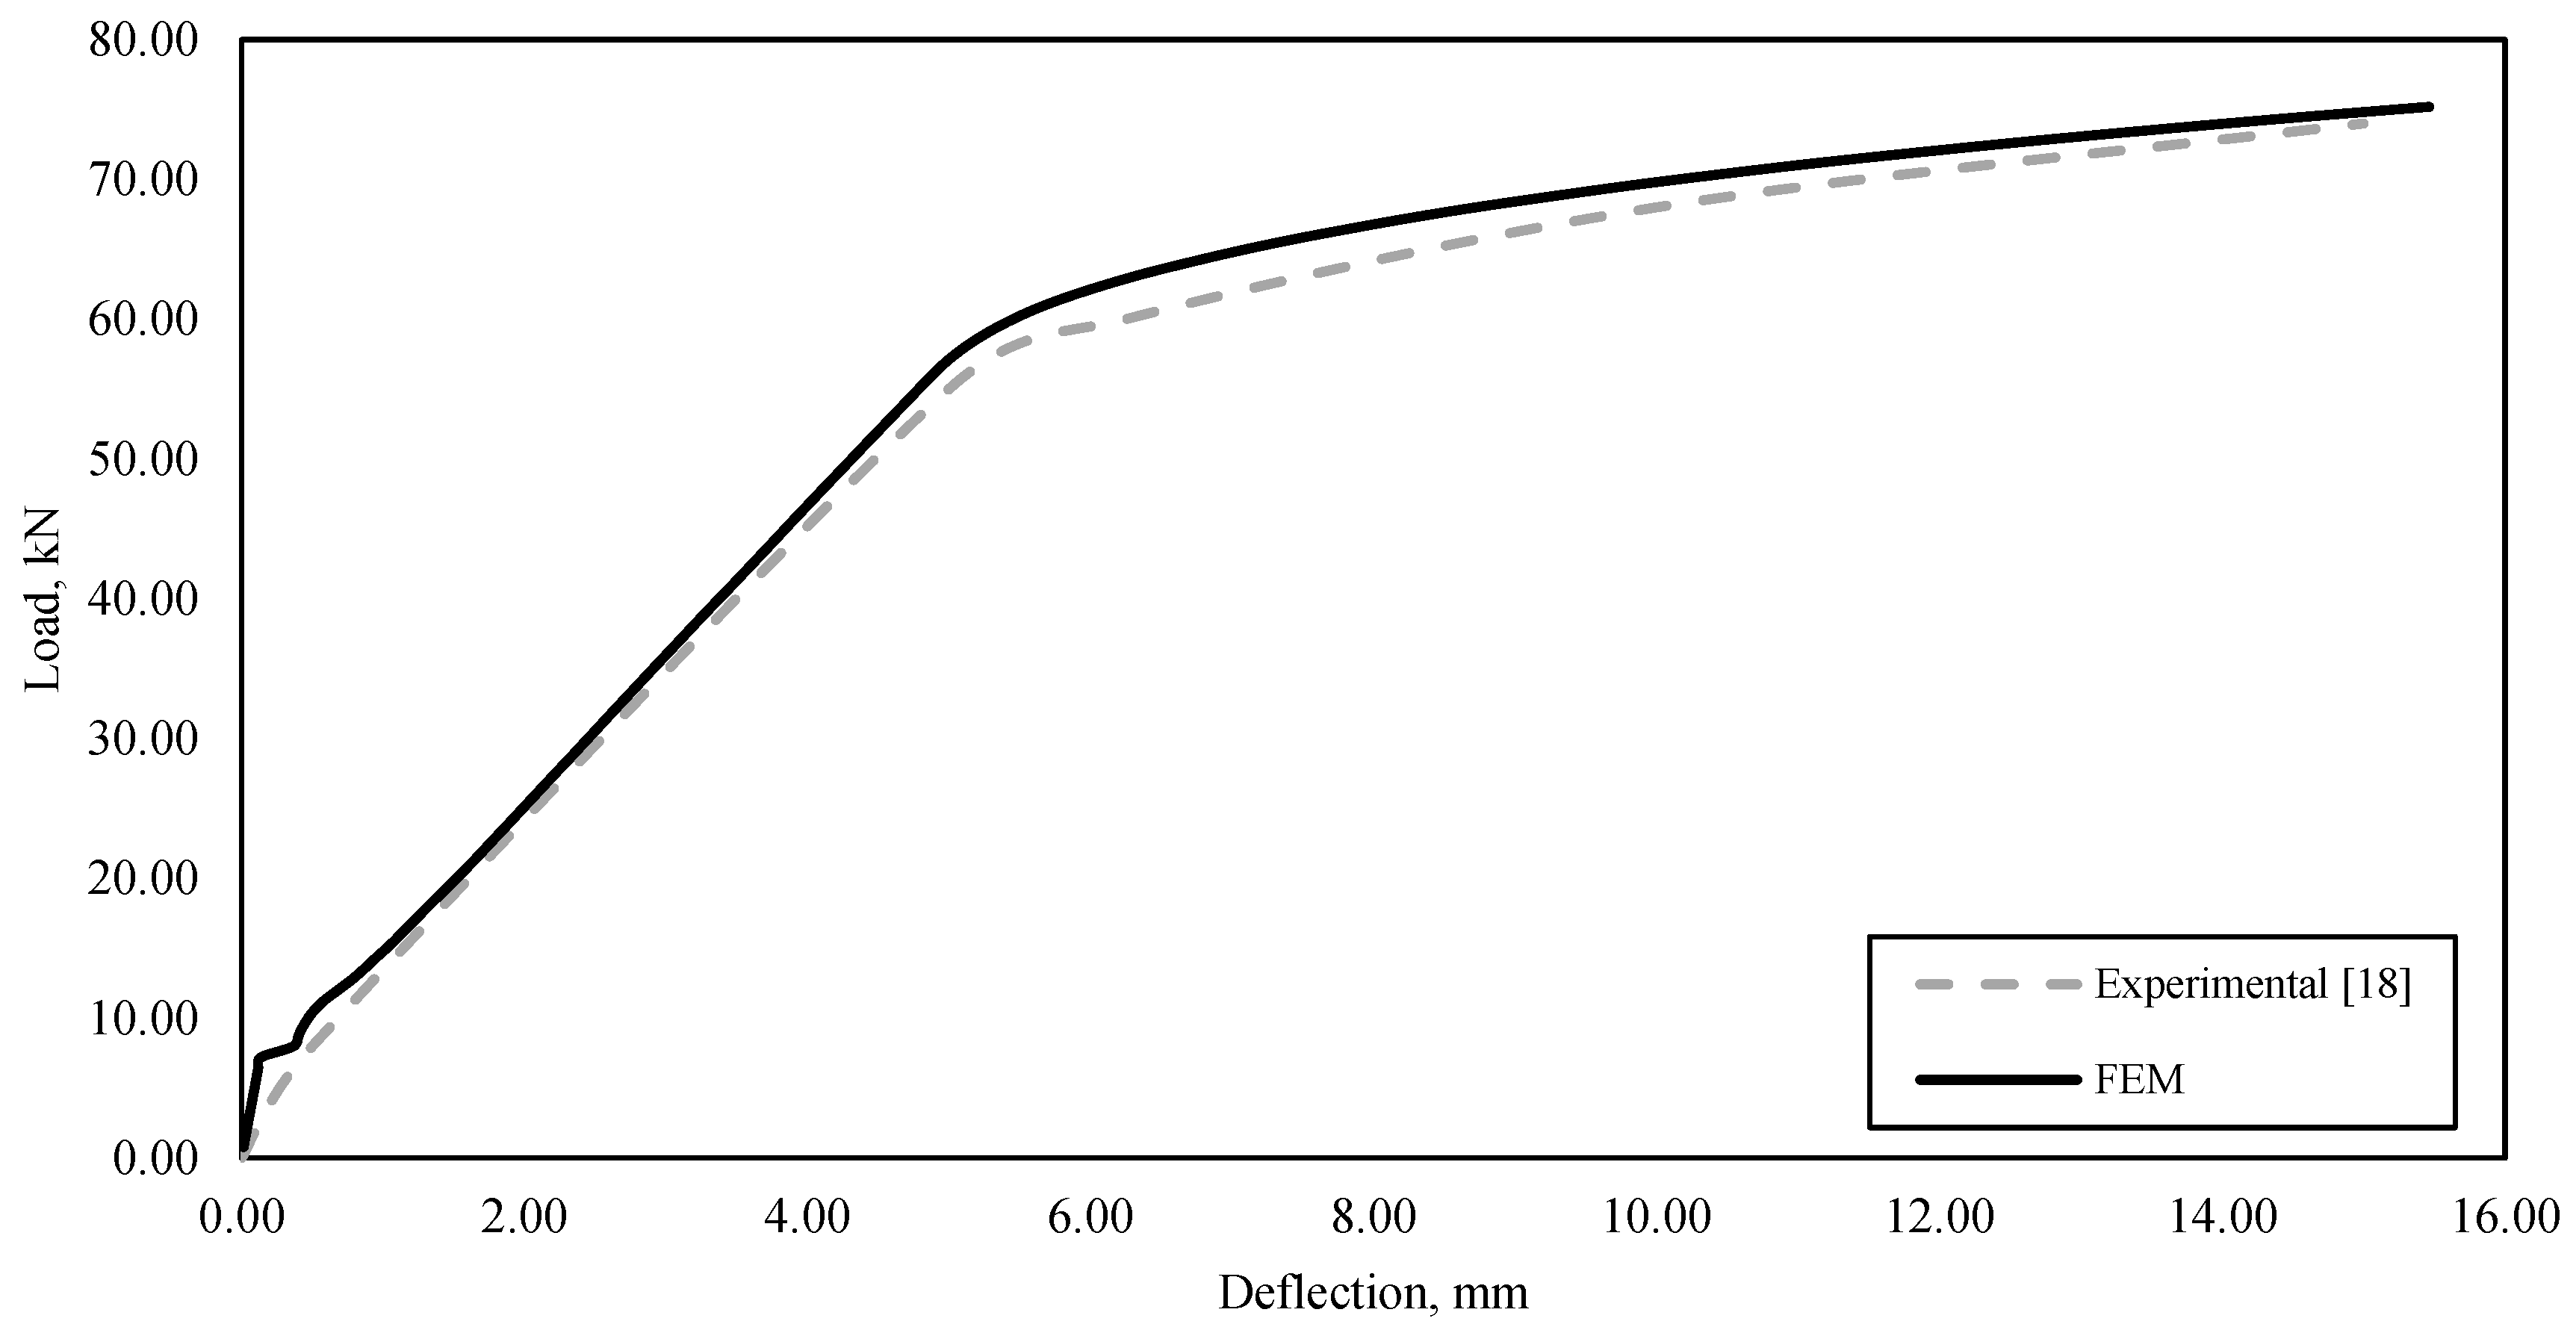
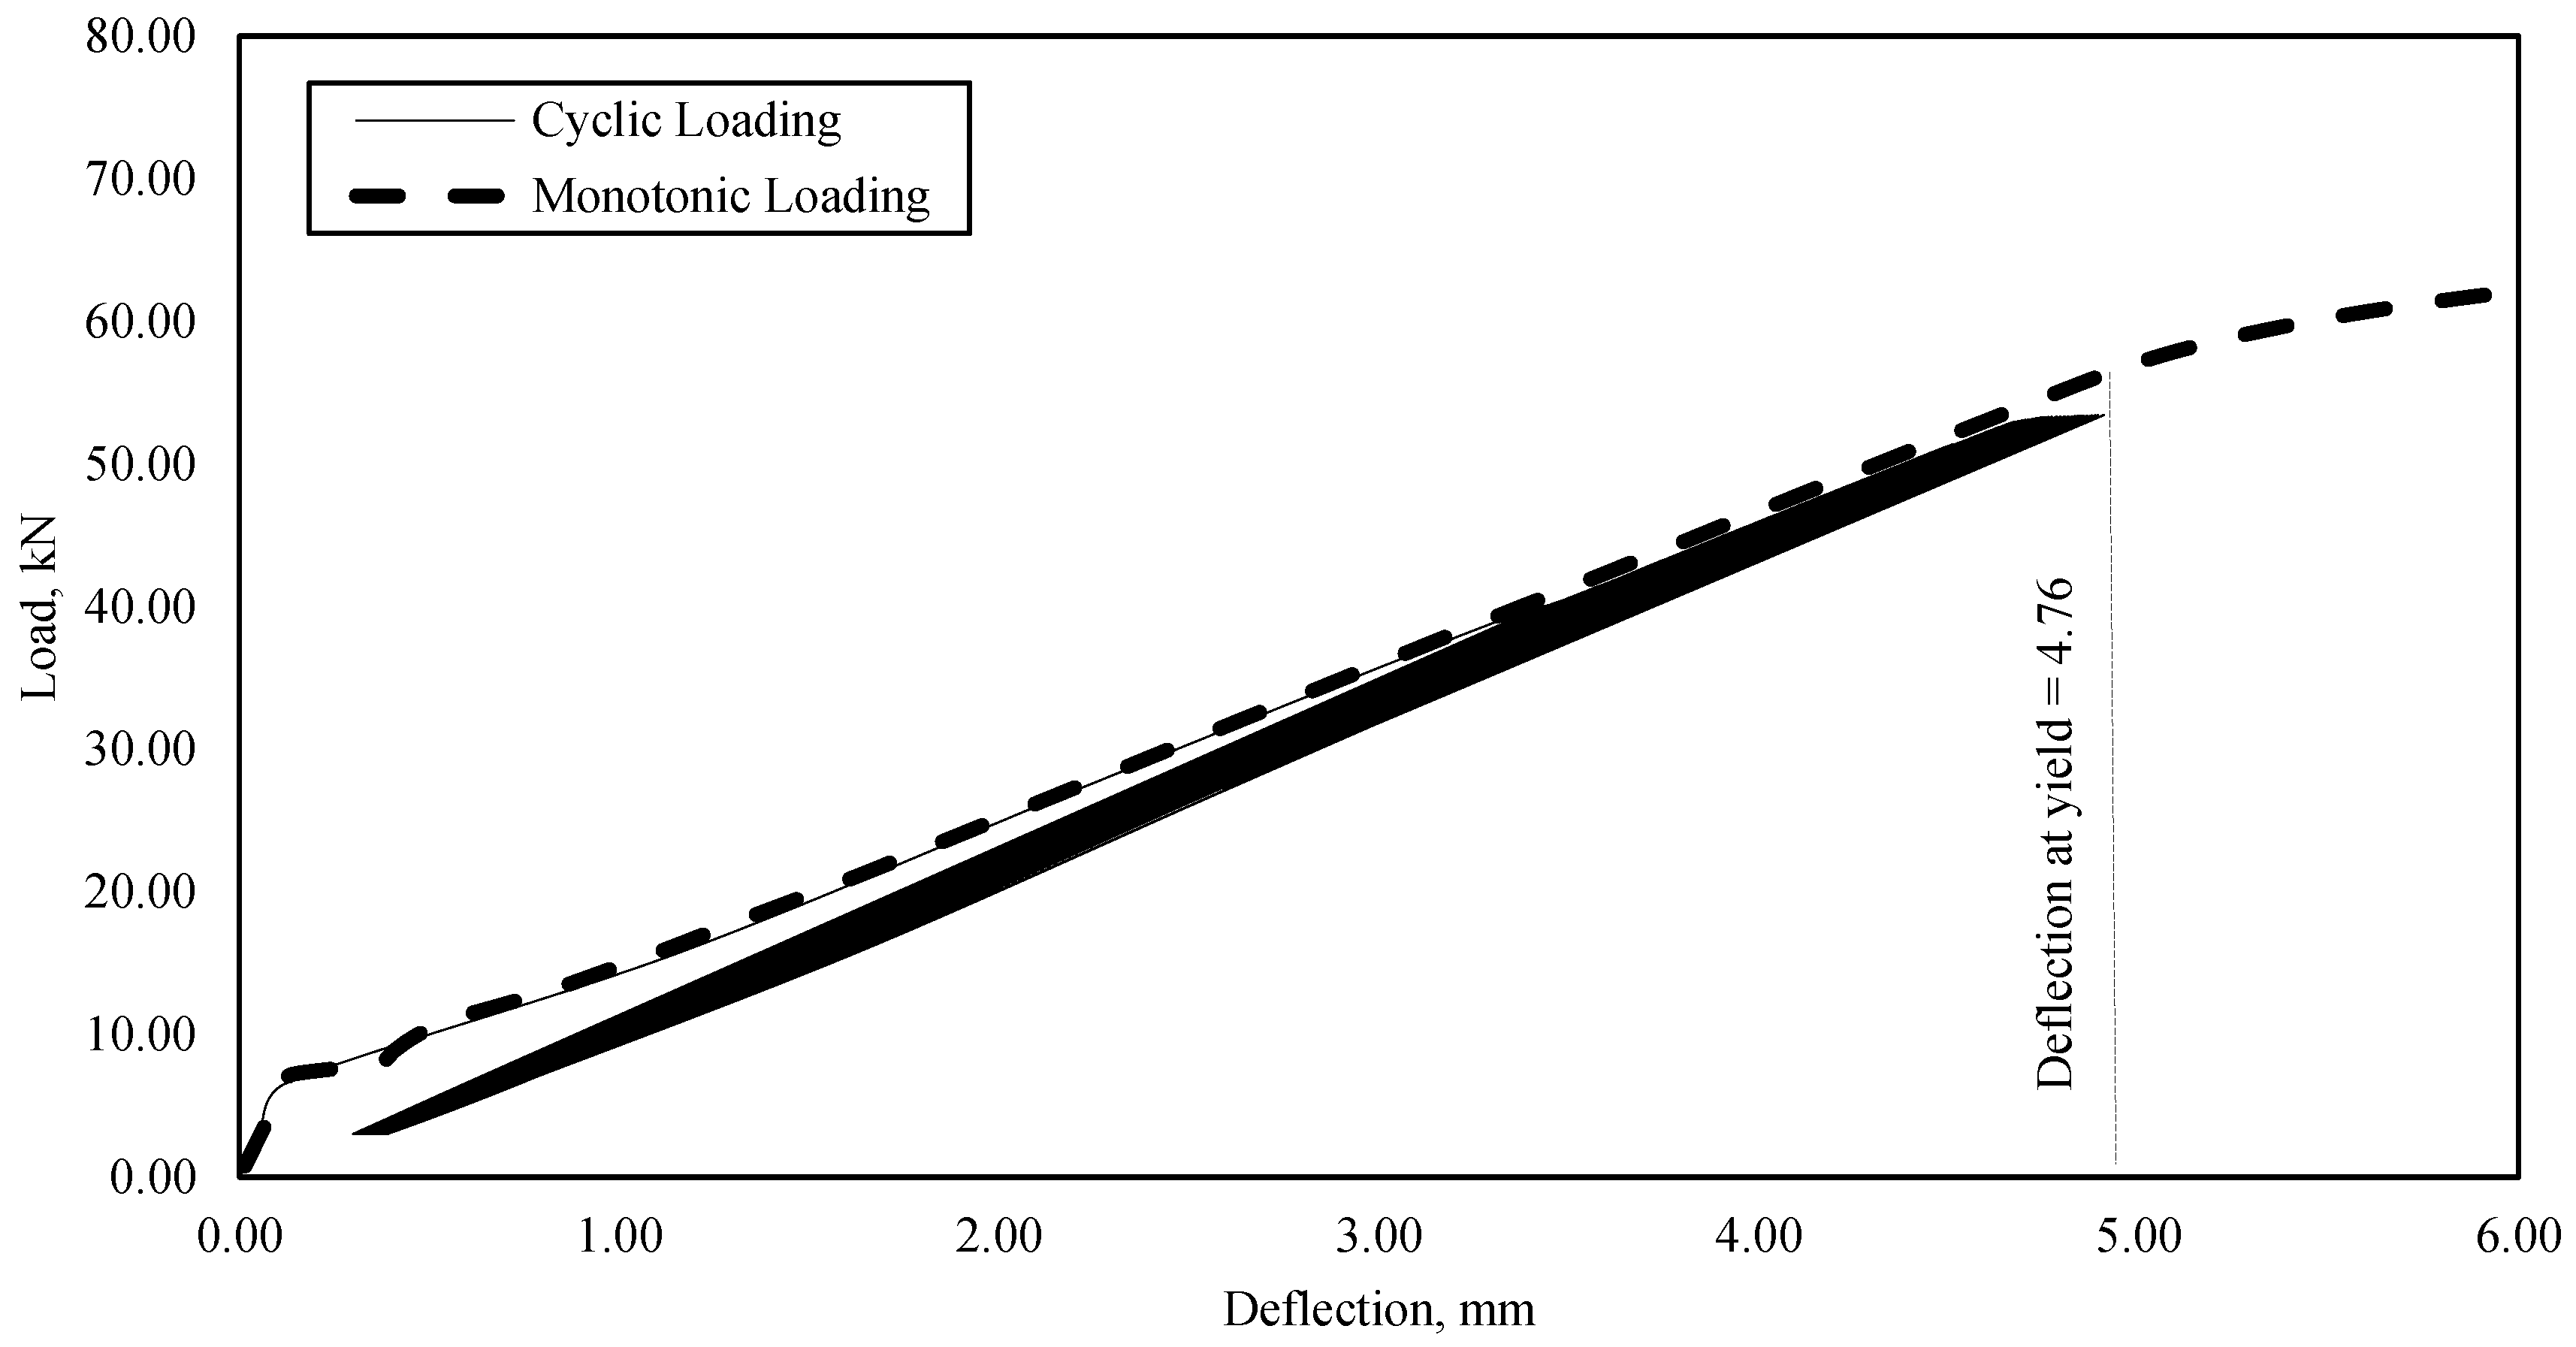
The modeled RC beam was subjected to monotonic and fatigue loading while using a four-point bending configuration with a shear span of 406.7 mm. A monotonic and fatigue analysis were conducted in order to check the validity of the finite element model (FEM), and the results were compared with experimental data obtained by Papakonstantinou et al. [
18]. The model correlates well with the experimental data at all stages of monotonic and fatigue behavior up to failure. The experimental yield load was determined as 56.8 kN at a deflection of 4.96 mm. Where the numerical yield load was 57.6 kN at a deflection of 5.06 mm, as shown in
Figure 8. The response of the constant cyclic loading corresponding to the numerical and experimental testing was almost similar along the fatigue life. The maximum and minimum strains in steel rebars that were obtained by Papakonstantinou et al. [
18] for the beam (N-8) were 1493 microstrain and 124 microstrain, respectively. The maximum and minimum strains in steel rebars that were obtained by the numerical analysis were 1558 microstrain and 115 microstrain, respectively.
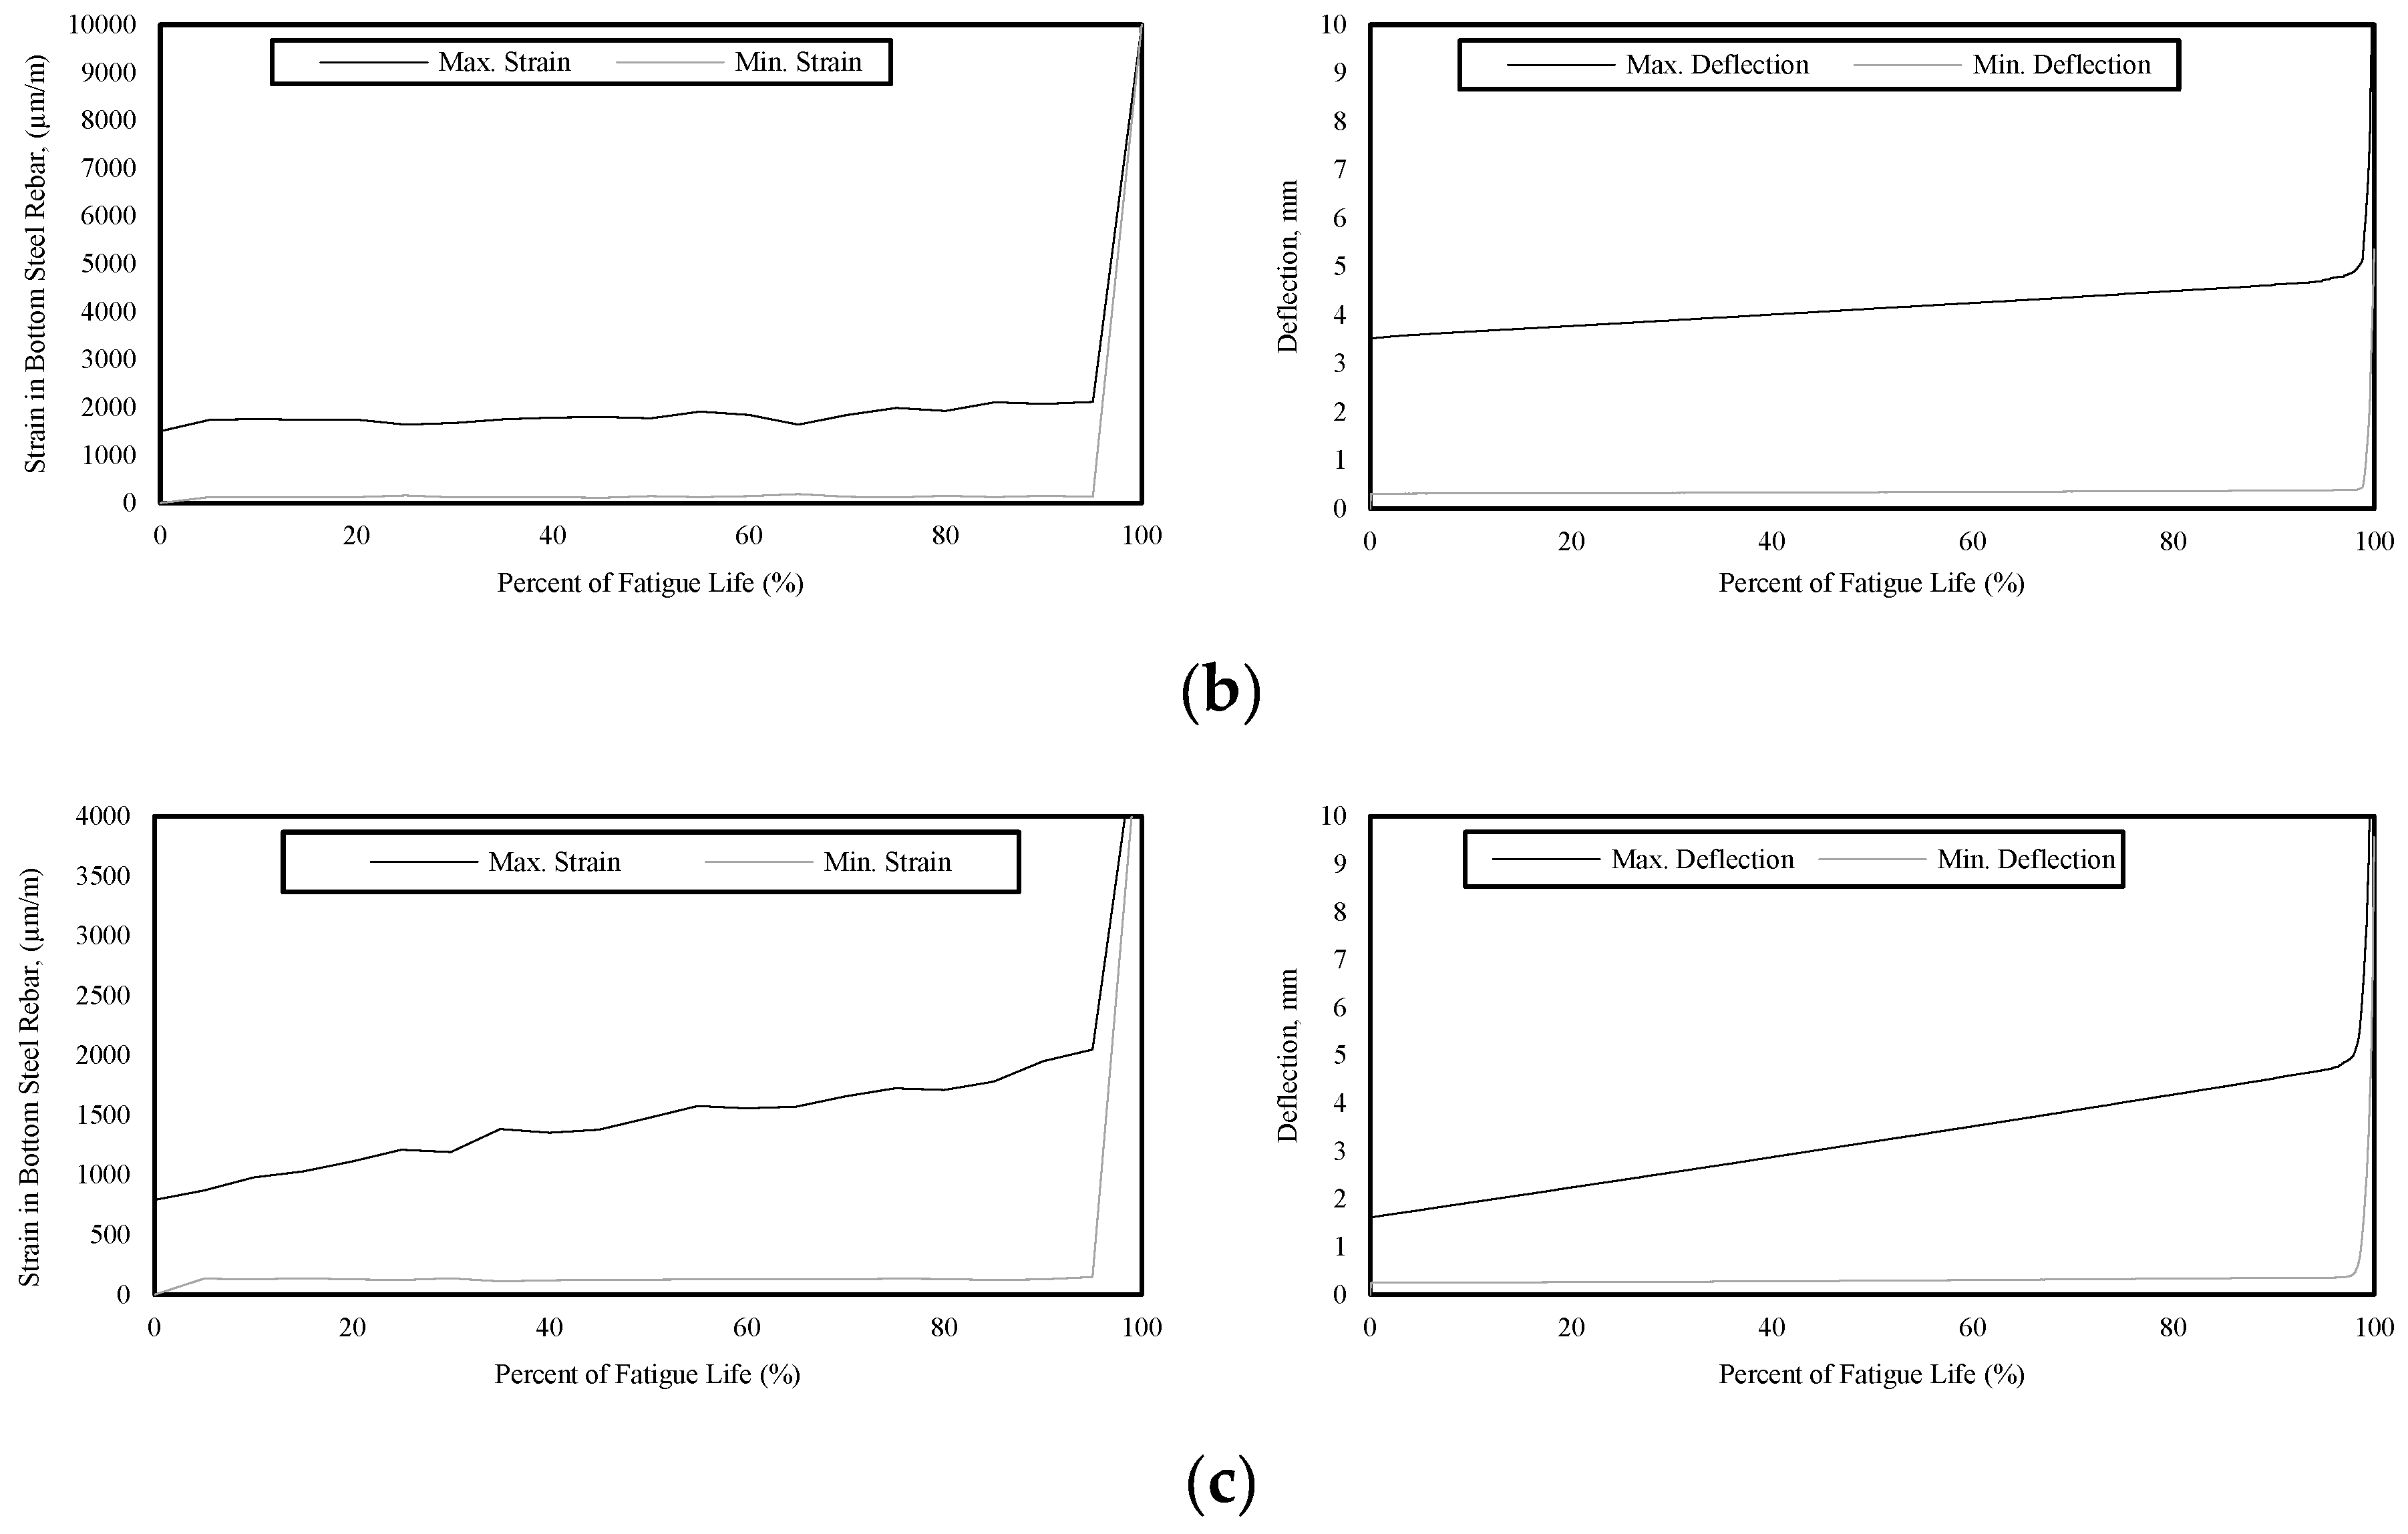
Three RC beams were analyzed in this study, with different initial load ranges and rates of loading. A tension–tension linearly-increased cyclic loading was performed in order to find the static strength, slope, and endurance limit of the fatigue stress-life model. The mid-span deflection and strain readings of steel rebars were obtained with respect to the corresponding number of cycles for each specimen, as shown in
Figure 9. The modeled RC beam fails once the deflection and strain began to significantly drift and behave nonlinearly.
The first specimen “B01” was analyzed with an initial stress range of 281.88 MPa and a rate of loading of 2.0 × 10
−4 MPa/cycle. The specimen failed at a stress range of 388.84 MPa. The second specimen “B02” had a higher initial stress range of 285.85 MPa, with a rate of loading of 1.8 × 10
−4 MPa/cycle. The specimen failed at a stress range of 381.24 MPa. The last analysis was performed to find the endurance limit. Therefore, the third specimen, “B03”, was loaded with an initial stress range of 132.48 MPa and a loading rate of 9.0 × 10
−4 MPa/cycle. The specimen failed at a stress range of 377.88 MPa.
Table 2 summarizes the obtained results of the analyzed specimens in this study.
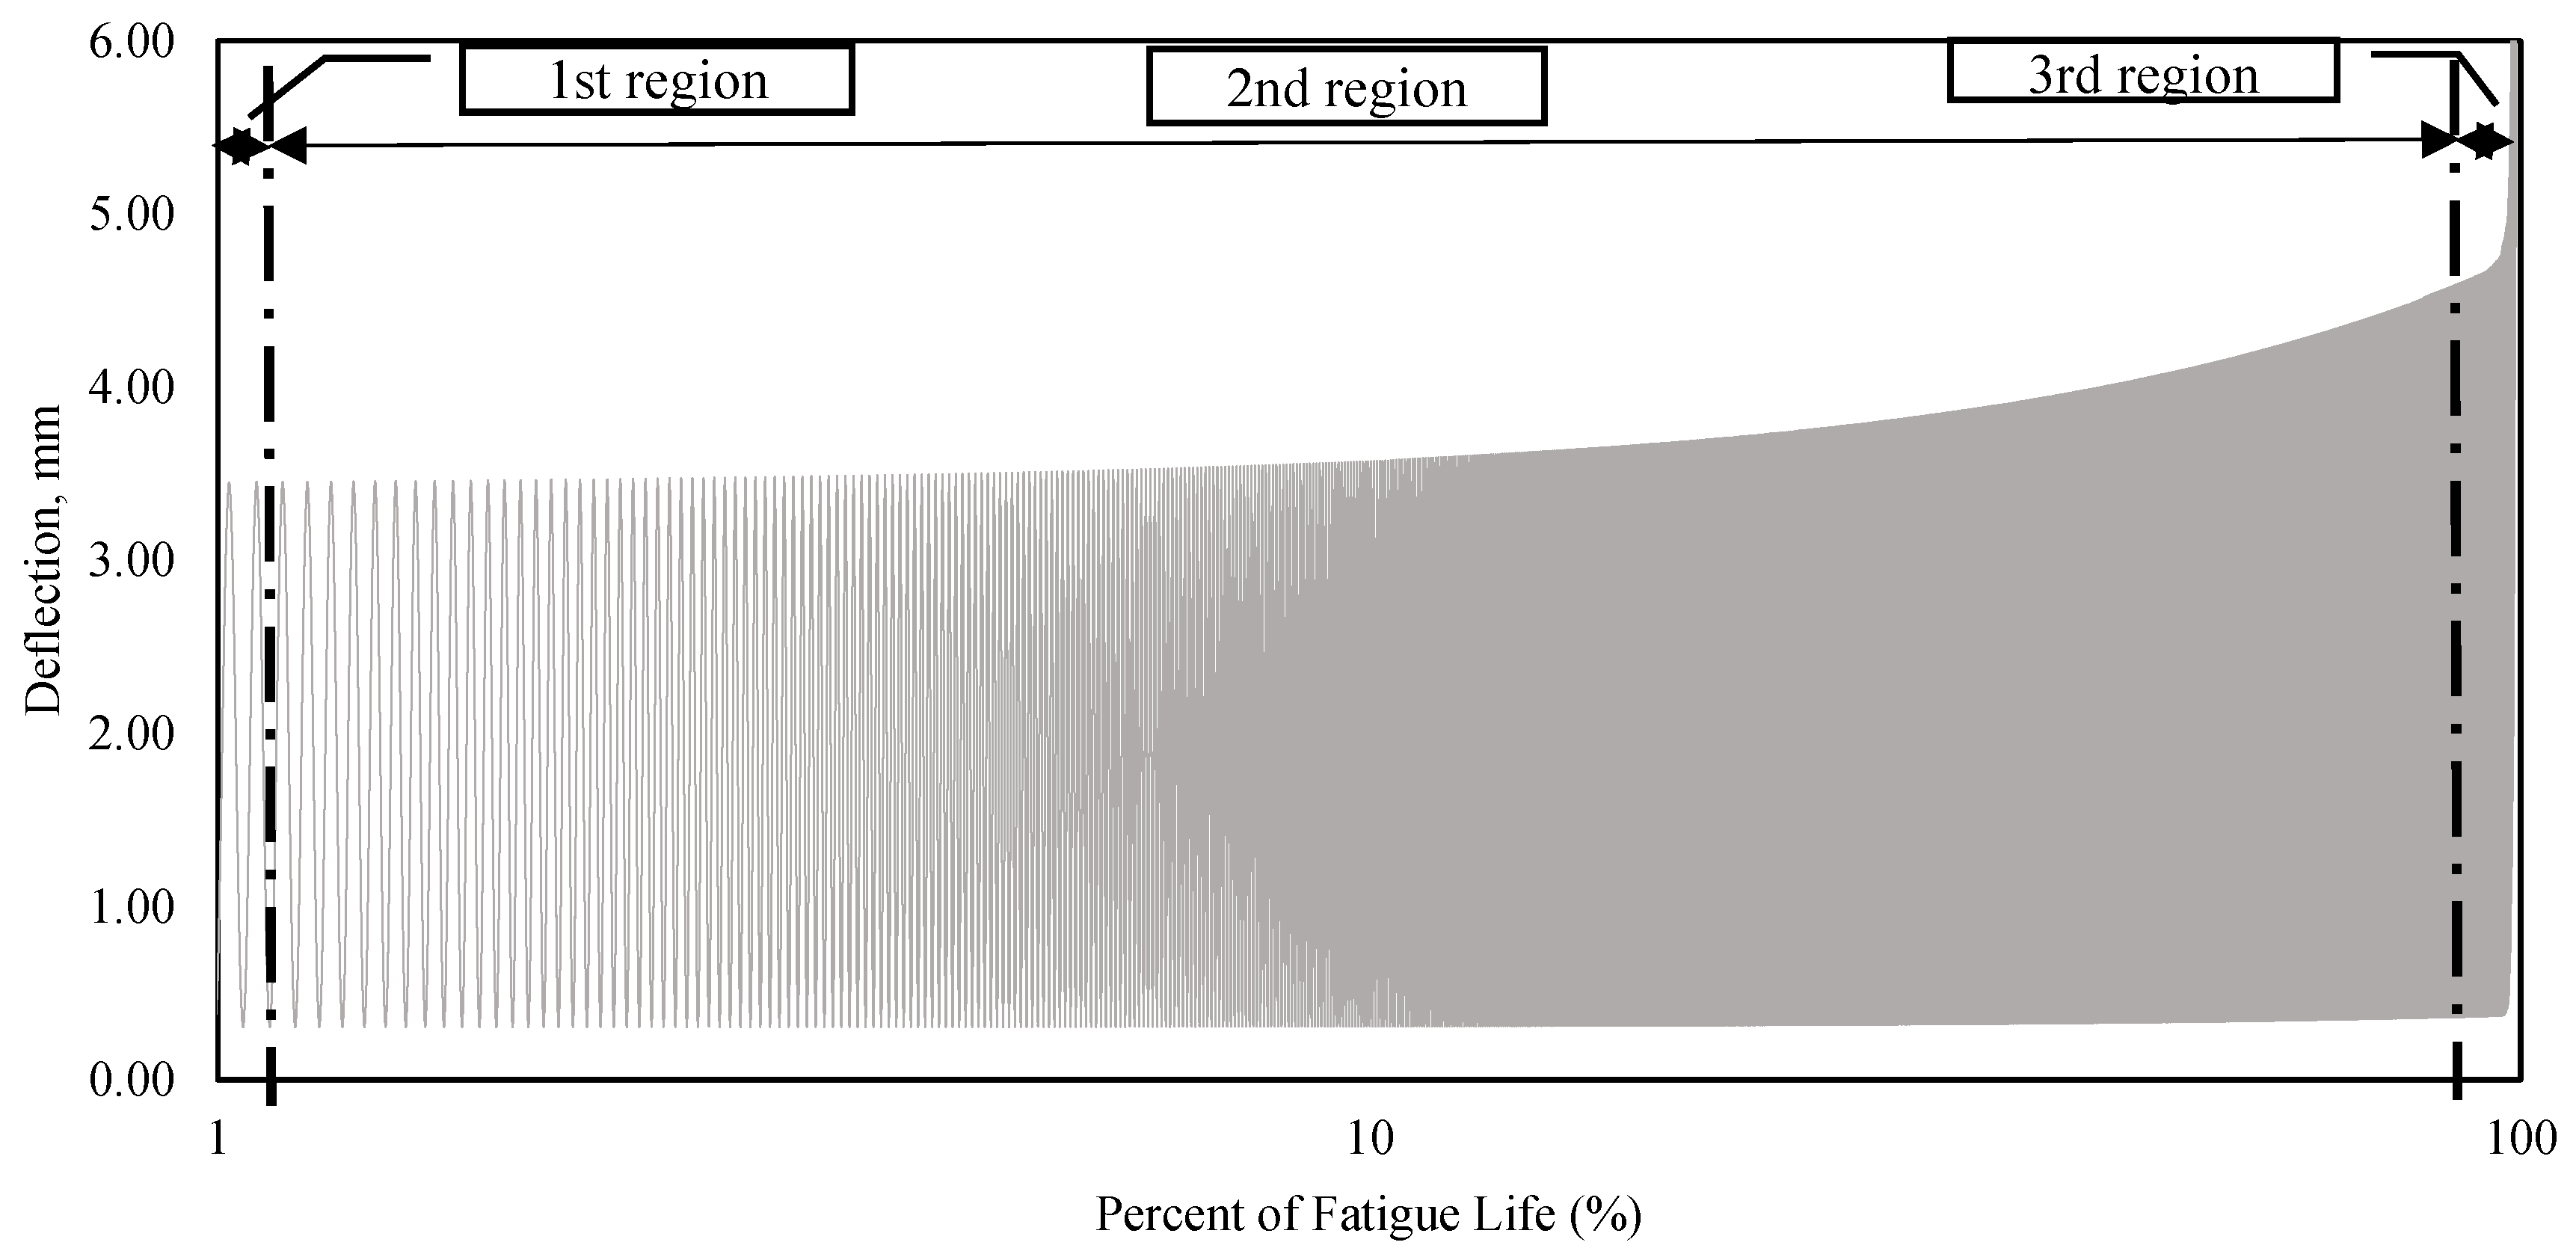
Figure 10 shows the maximum mid-span deflection with respect to the fatigue life of specimen “B01”. The deflection behavior represents the continuous accumulation of fatigue damages after each cycle, which led to failure. Both strain and deflection behavior under the linearly-increased cyclic loading can be divided into three regions: the first region is associated with a sharp increase in the strain and deflection due to the initial applied cyclic loading. Subsequently, the second region represents most of the fatigue life of the RC beam and it shows a linearly-increased accumulation of strain and deflection with an almost constant rate similar to the applied rate of the cyclic loading. The last region involves a dramatic increase in strain and deflection just before failure.
By using Rotem’s approach and solving Equation (18) with respect to the obtained results from specimens “B01” and “B02”. The fatigue stress-life behavior of RC beams subjected to a constant stress range can be represented by the following equation:
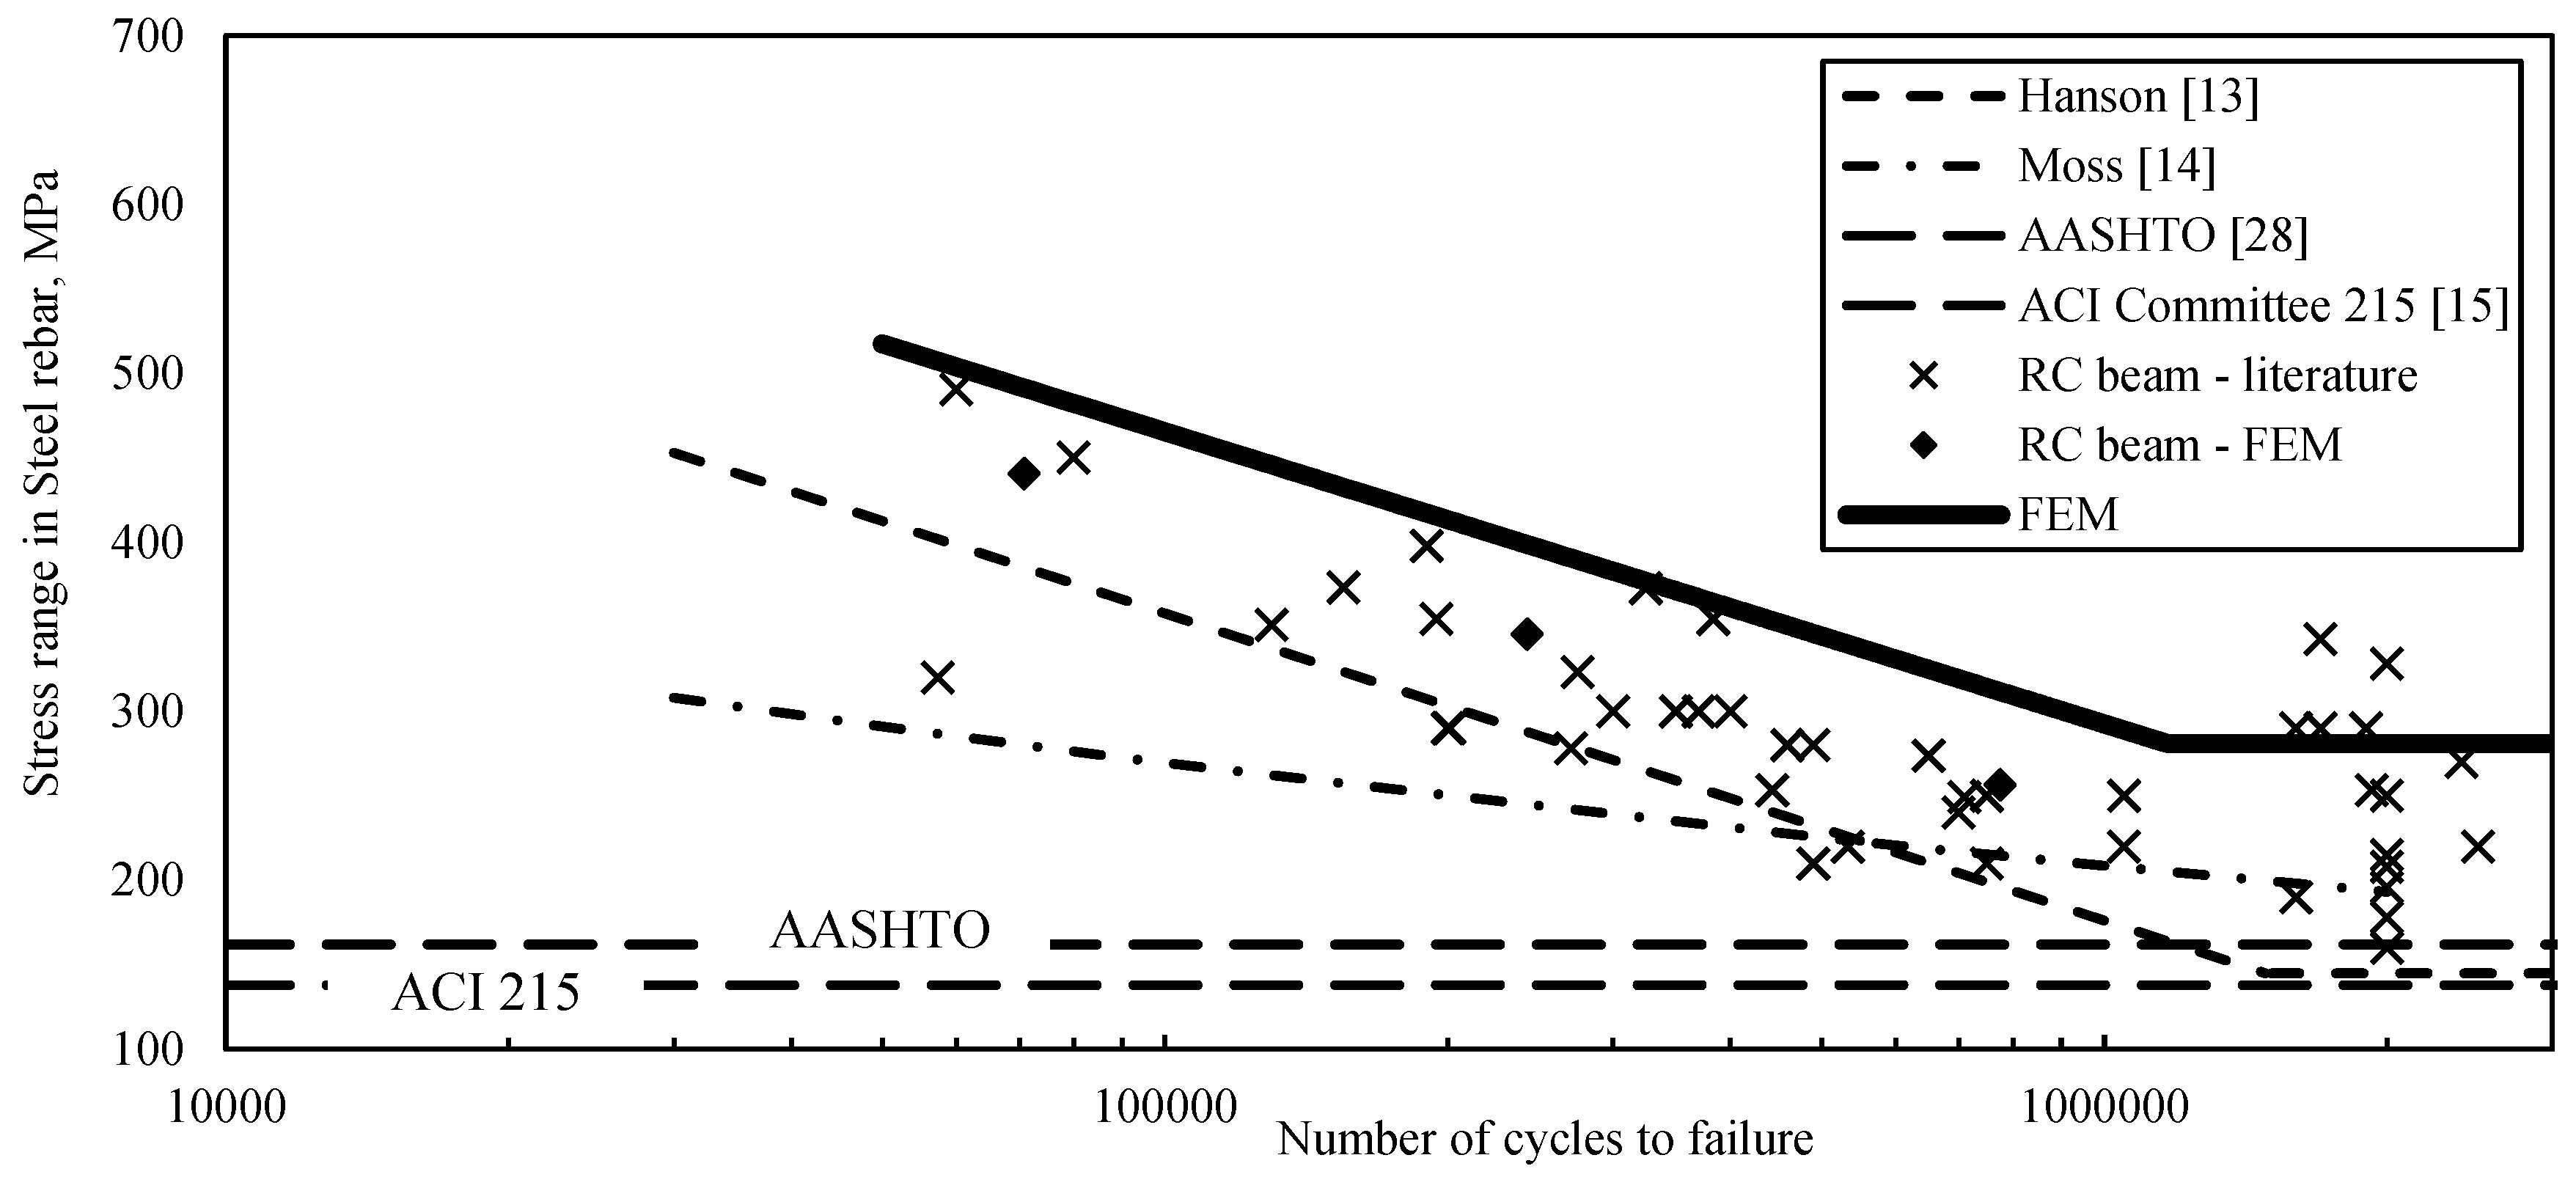
In order to find the endurance limit, Equation (21) was solved with respect to the obtained results from “B03”. The endurance limit was found to be 281.16 MPa at 1,164,570 cycles. To examine the reliability of the developed model, three numerical simulations were carried out with constant cyclic load ranges of 0.4, 0.6, and 0.8 of the monotonic yield load of the RC beam.
Figure 11 shows the developed fatigue stress-life model compared to RC beams tested under constant cyclic loads that were conducted in this study and selected from the literature [
13,
14,
15,
17,
18,
19,
20,
21,
28].
The obtained fatigue stress-life model by the accelerated fatigue method fits 95% of the upper prediction band of RC beams tested under constant cyclic loading [
16]. The mean error of predictions obtained by the developed model is 12.5% when compared to experimental tests of constant amplitude cyclic loads. All the analyzed specimens failed due to unstable cracking of concrete. The modeled RC beam yields at a deflection of 4.76 mm under monotonic loading. While the specimens failed at an average deflection of 4.74 mm under the accelerated fatigue loading.
Figure 12 shows the hysteresis loops of specimen “B01”, at which it failed once the deflection reached the same value of deflection at yield under the monotonic analysis.
According to the Palmgren-Miner rule, the assumption was made that the accumulation of fatigue damages are not affected by the conditions of cyclic loading, such as the sequence of load blocks, the interaction between different loads, and stresses below the endurance limit [
29]. Moreover, the Palmgren-Miner rule shows non-conservative predictions with plain concrete beams as it was found by the experimental investigation of Shah [
30]. The nonlinearity of damage accumulation must be implemented in the accelerated fatigue approach to have more accurate predictions of the fatigue life and to eliminate the non-conservative aspect of the linear damage law.
The linearly-increased cyclic loading affects the fatigue failure mode of the analyzed RC beams. The applied accelerated fatigue method has a higher rate of damage accumulation than standard fatigue testing methods. Accordingly, the testing time was reduced, and the time-dependent’s effect of stiffness degradation was neglected throughout the fatigue life of RC beams. The development of fatigue damages has a major role in the prediction of fatigue life. Thus, further experimental investigations are needed to ensure that the mode of fatigue failure obtained by the accelerated fatigue method is identical with that taking place under the constant cyclic loading.
