
Influence of Moisture on the Shakedown Behavior of Fine Soils for Sustainable Railway Subballast Layers

 , , ,
, , ,  , and
, and
Abstract
1. Introduction
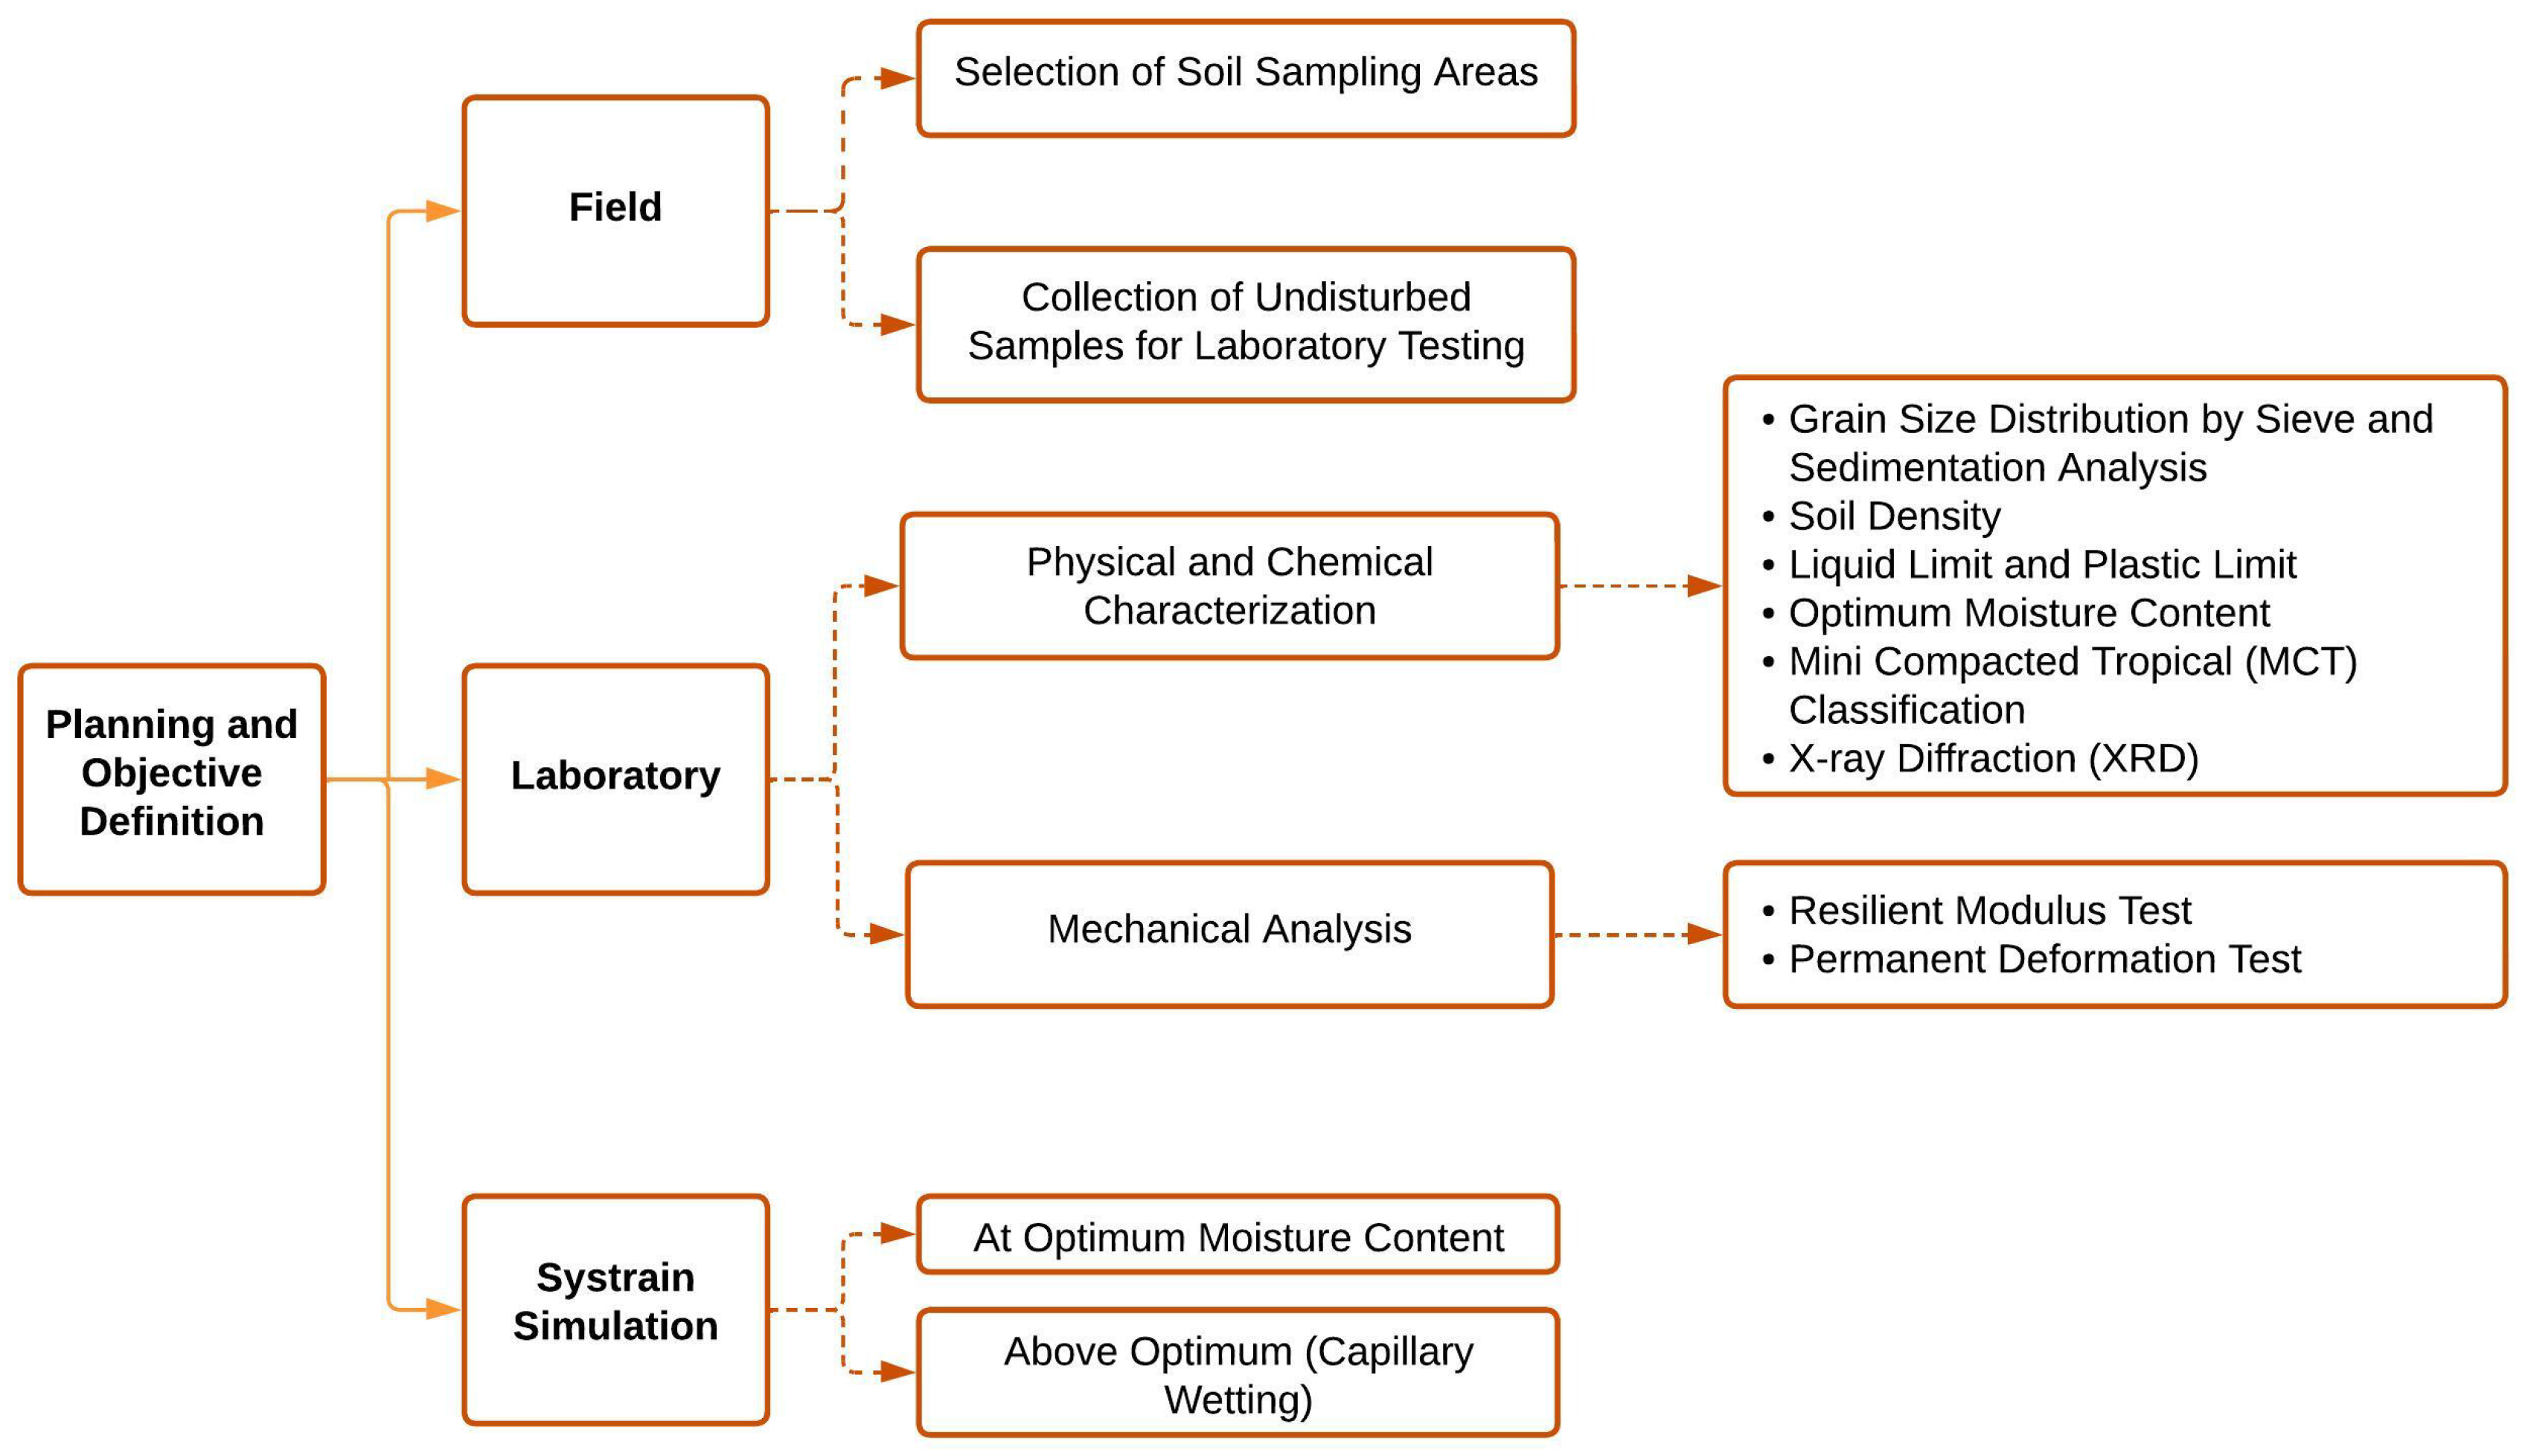
2. Materials and Methods
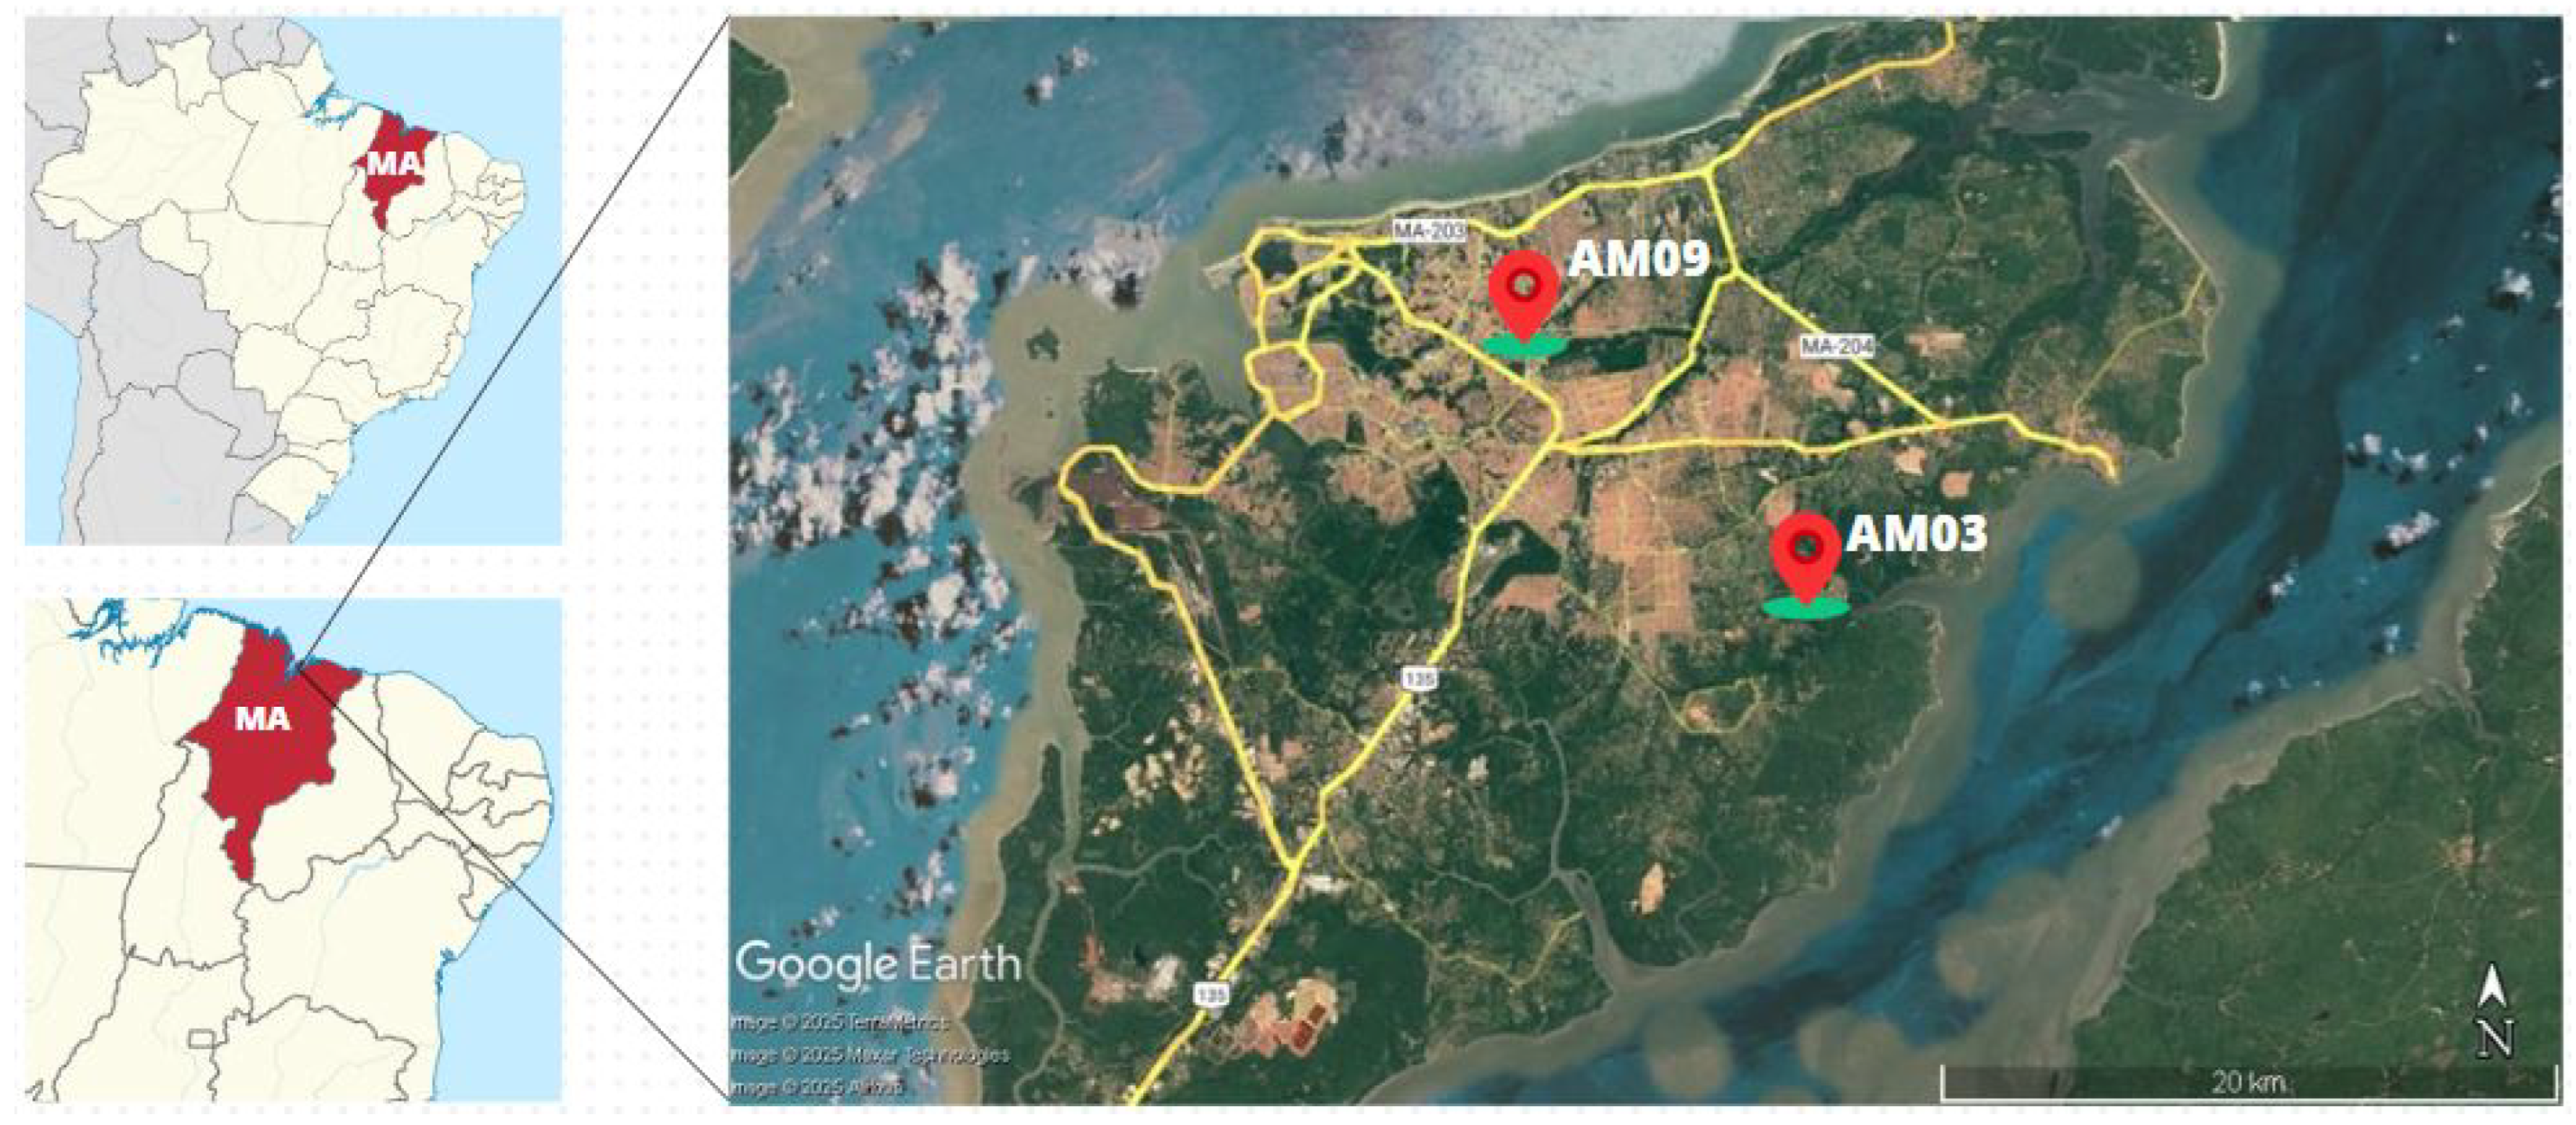
2.1. Materials
2.2. Methods
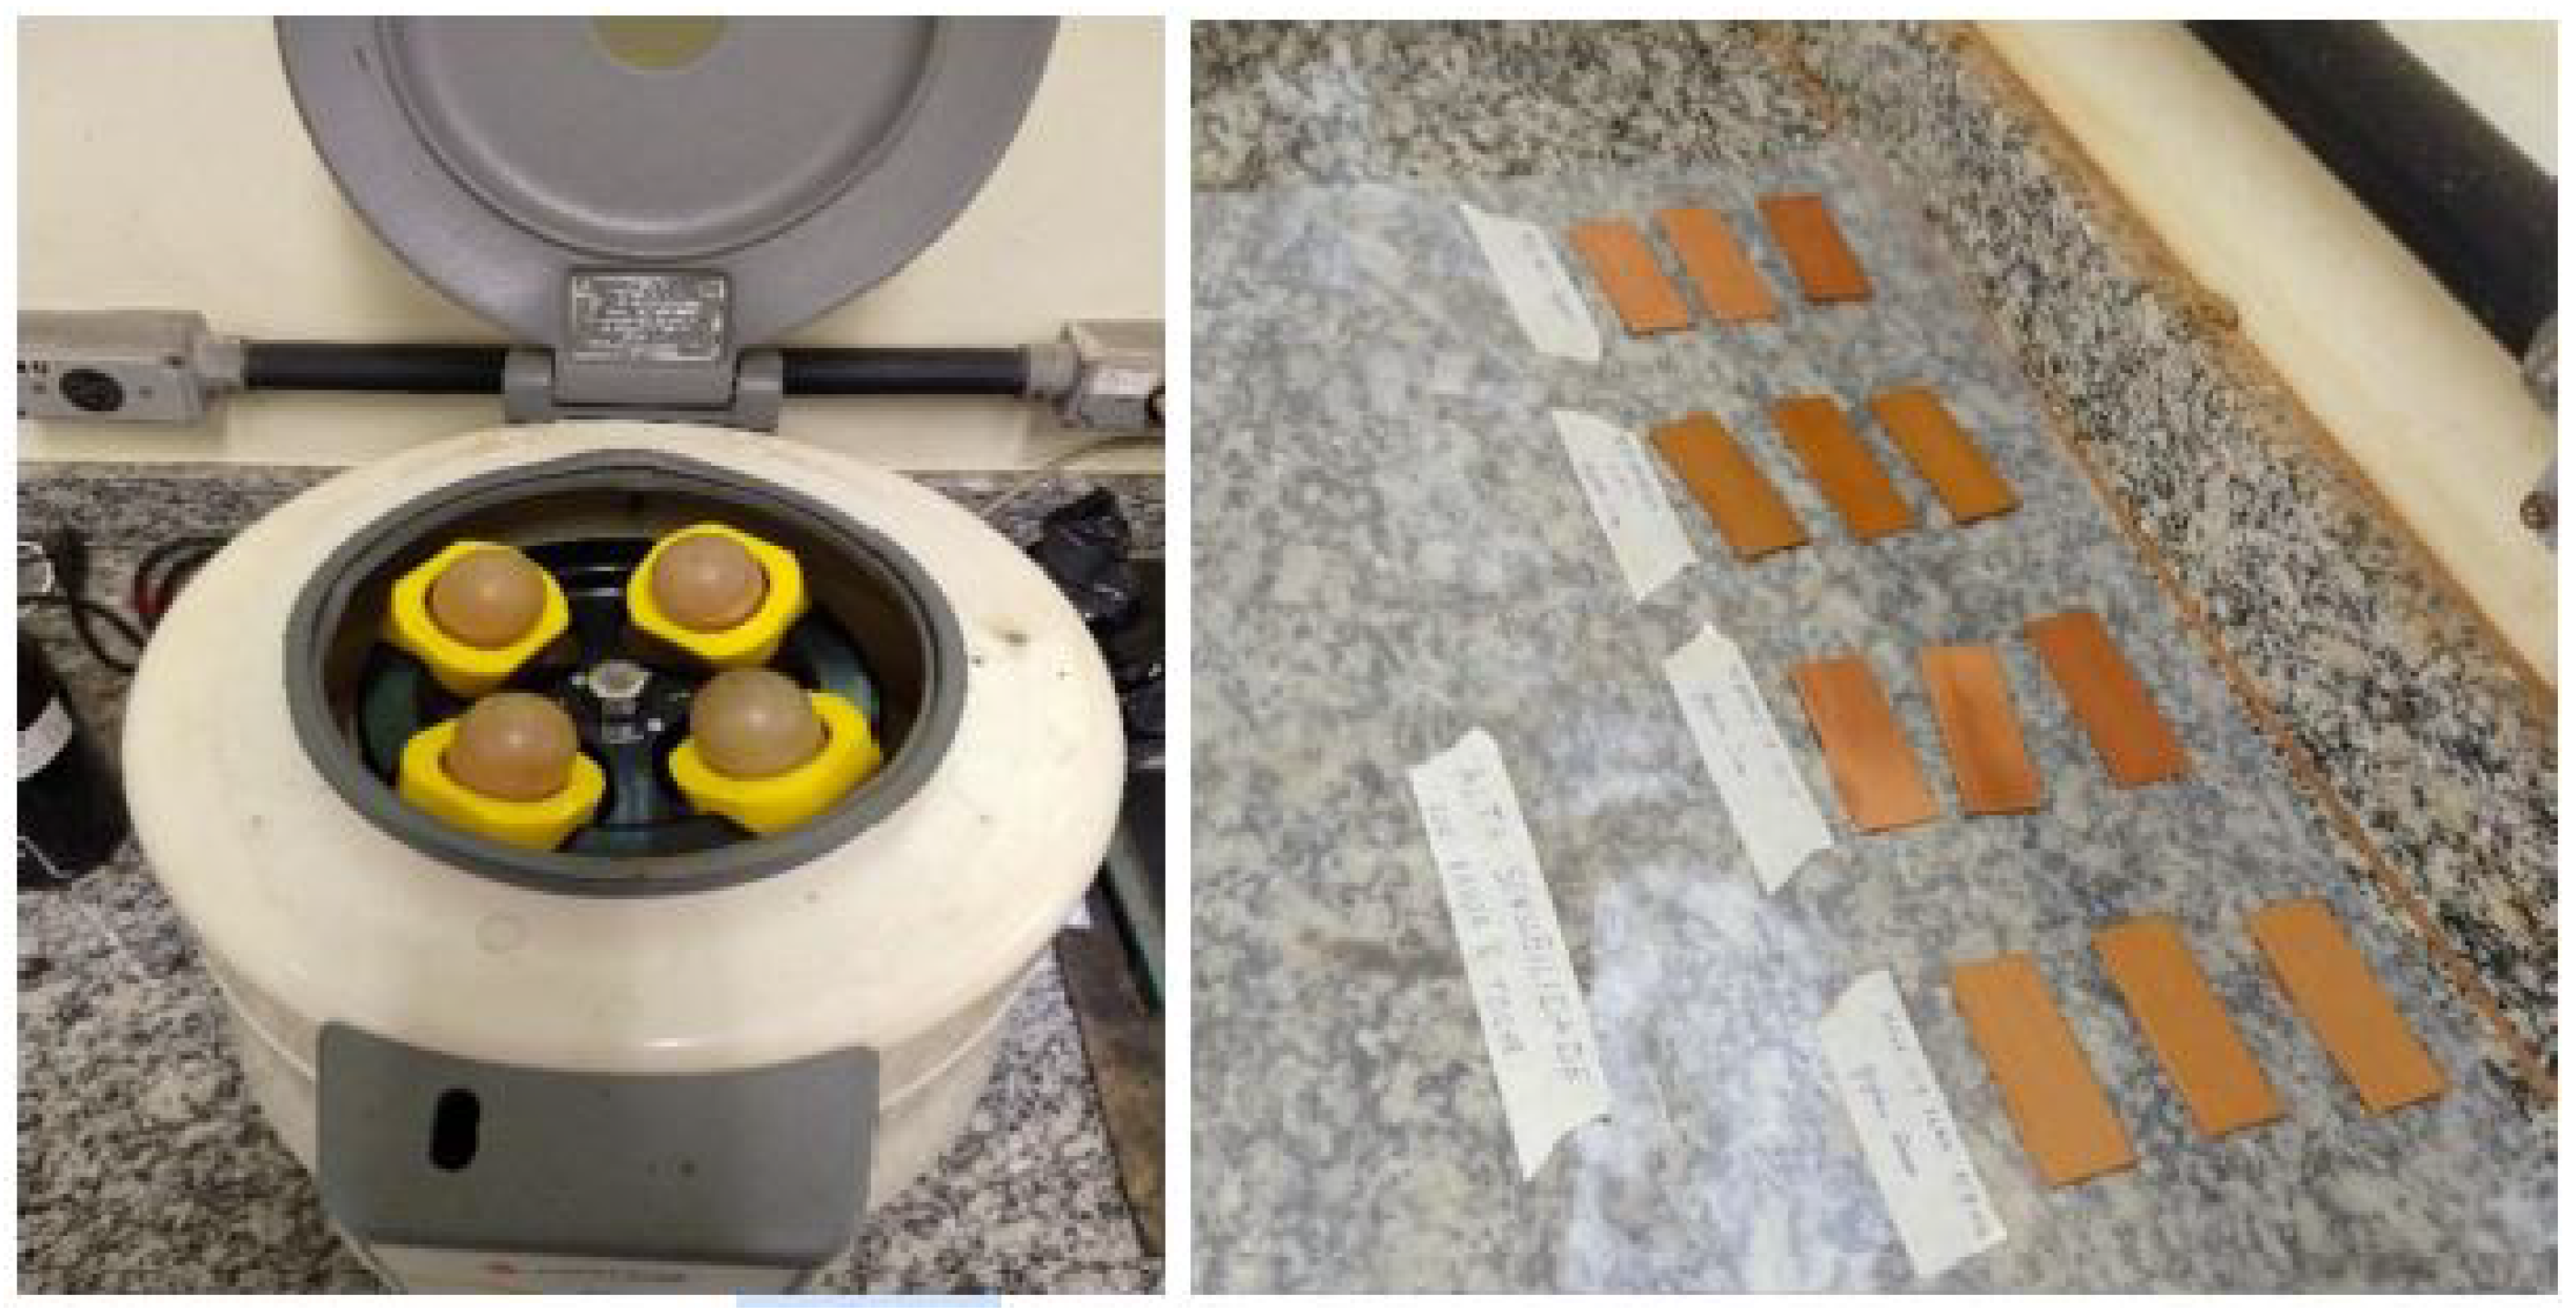
2.2.1. Physical Characterization
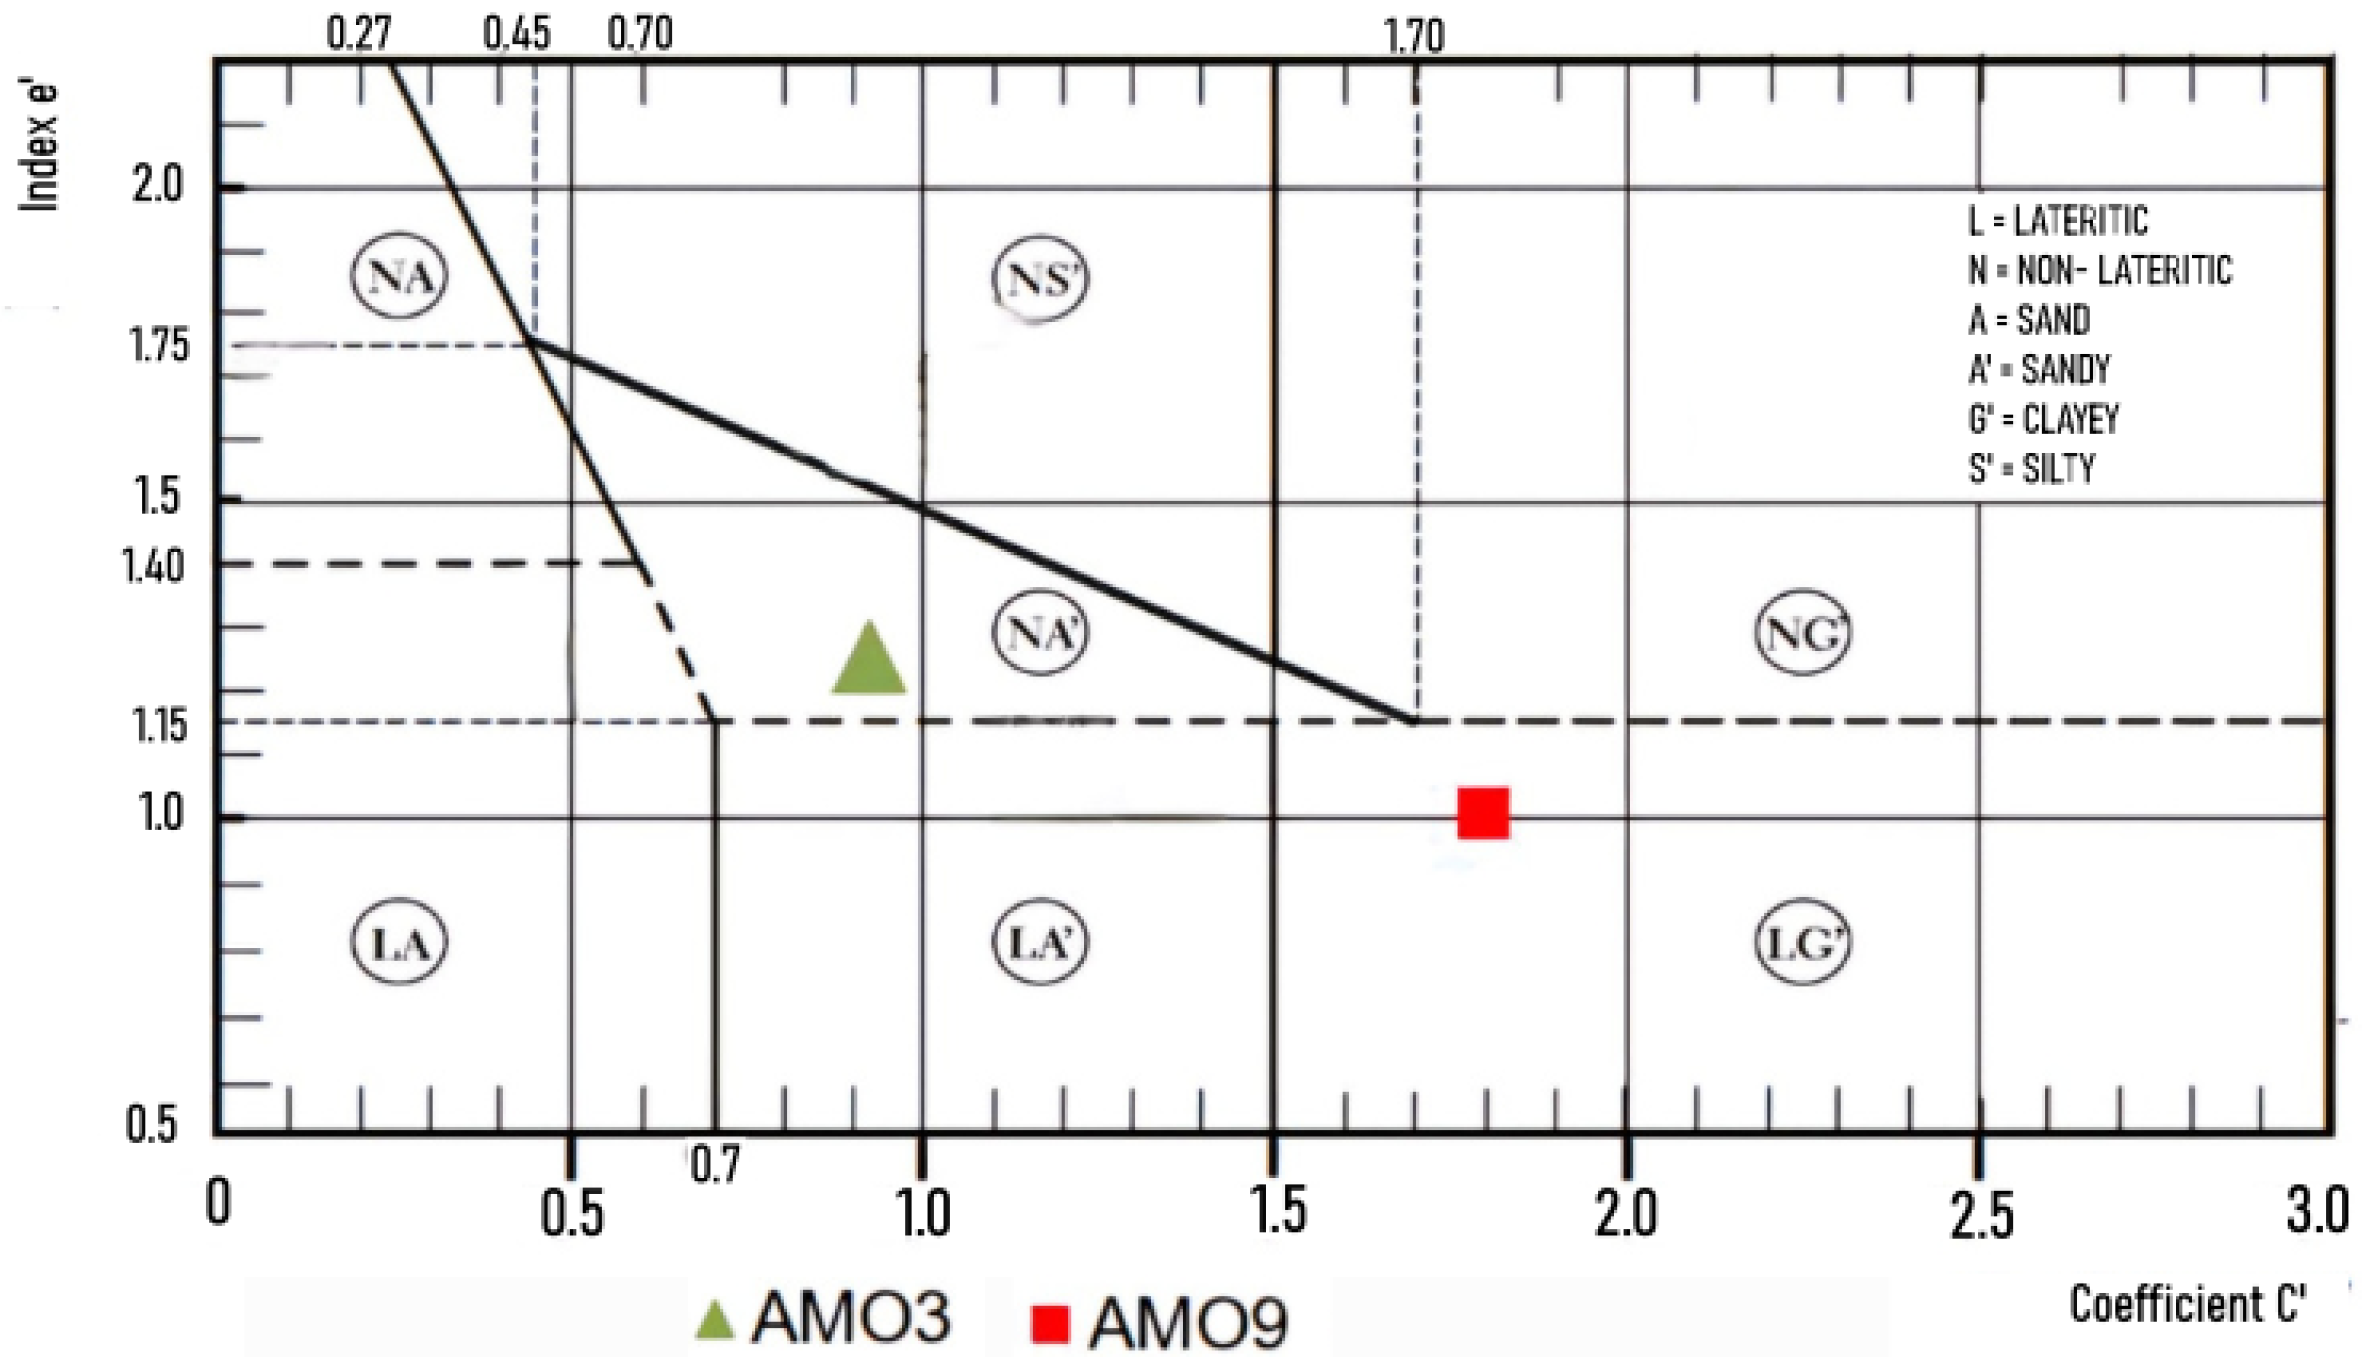
- Categories:
- –
- N—Soils with “non-lateritic” behavior
- ∗
- NA (Sands): Sands, Silty Sands, Silts (l)
- ∗
- NA’ (Sandy): Silty Sands, Clayey Sands
- ∗
- NS (Silty): Silts (k, m), Sandy and Clayey Silts
- ∗
- NG (Clayey): Clays, Clayey Sands, Silty Clays
- –
- L—Soils with lateritic behavior
- ∗
- LA (Sands): Sands with little clay
- ∗
- LA’ (Sandy): Clayey Sands, Clayey Sandy Soils
- ∗
- LG (Clayey): Clays, Clayey Sands
2.2.2. Chemical Characterization
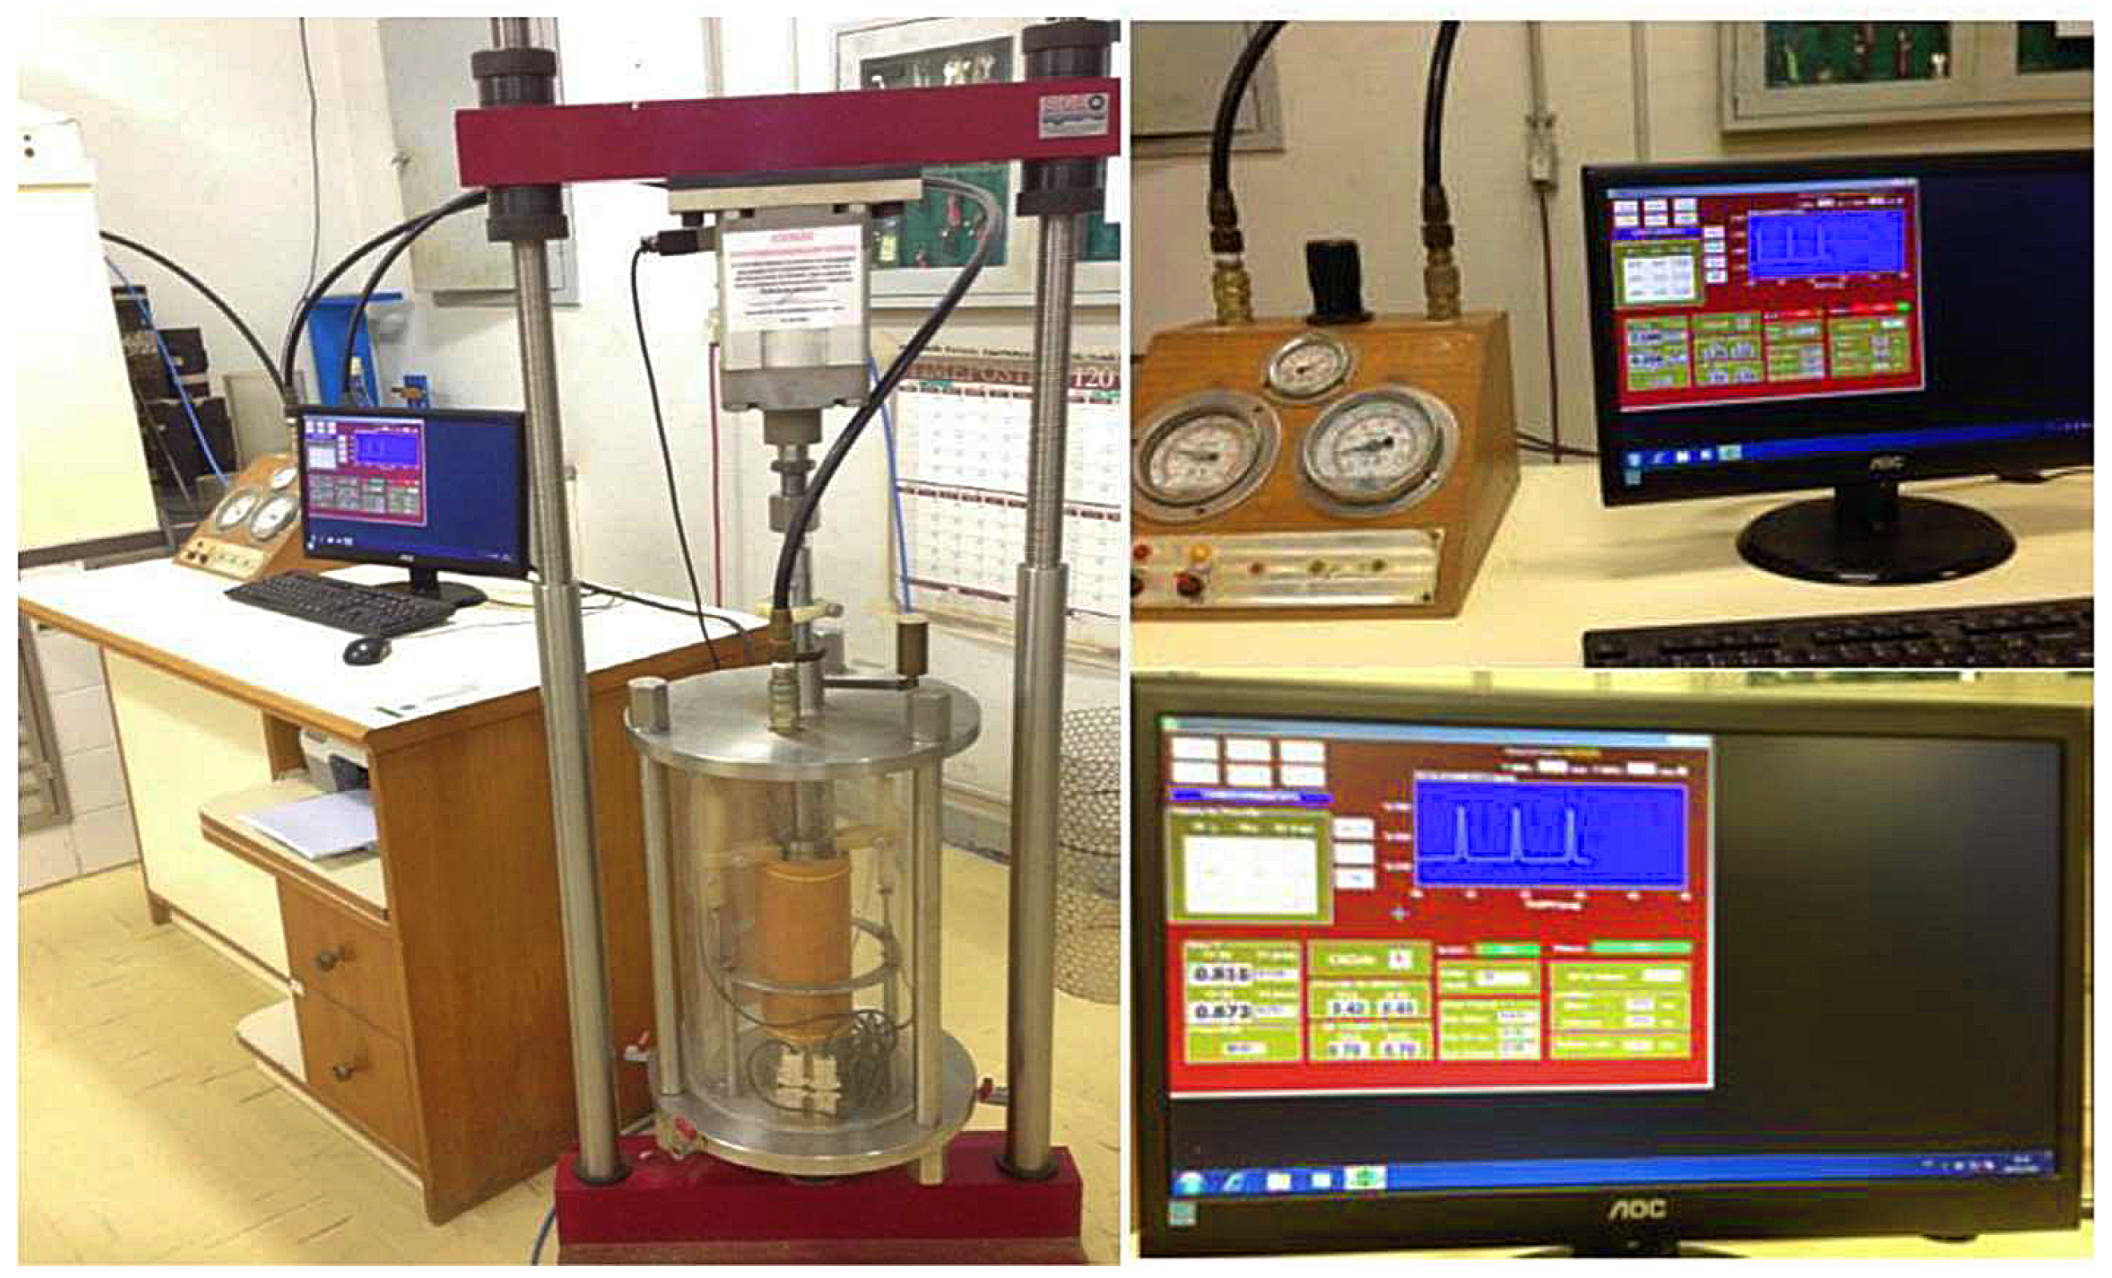
2.2.3. Mechanical Characterization
Resilient Modulus
Permanent Deformation and Shakedown
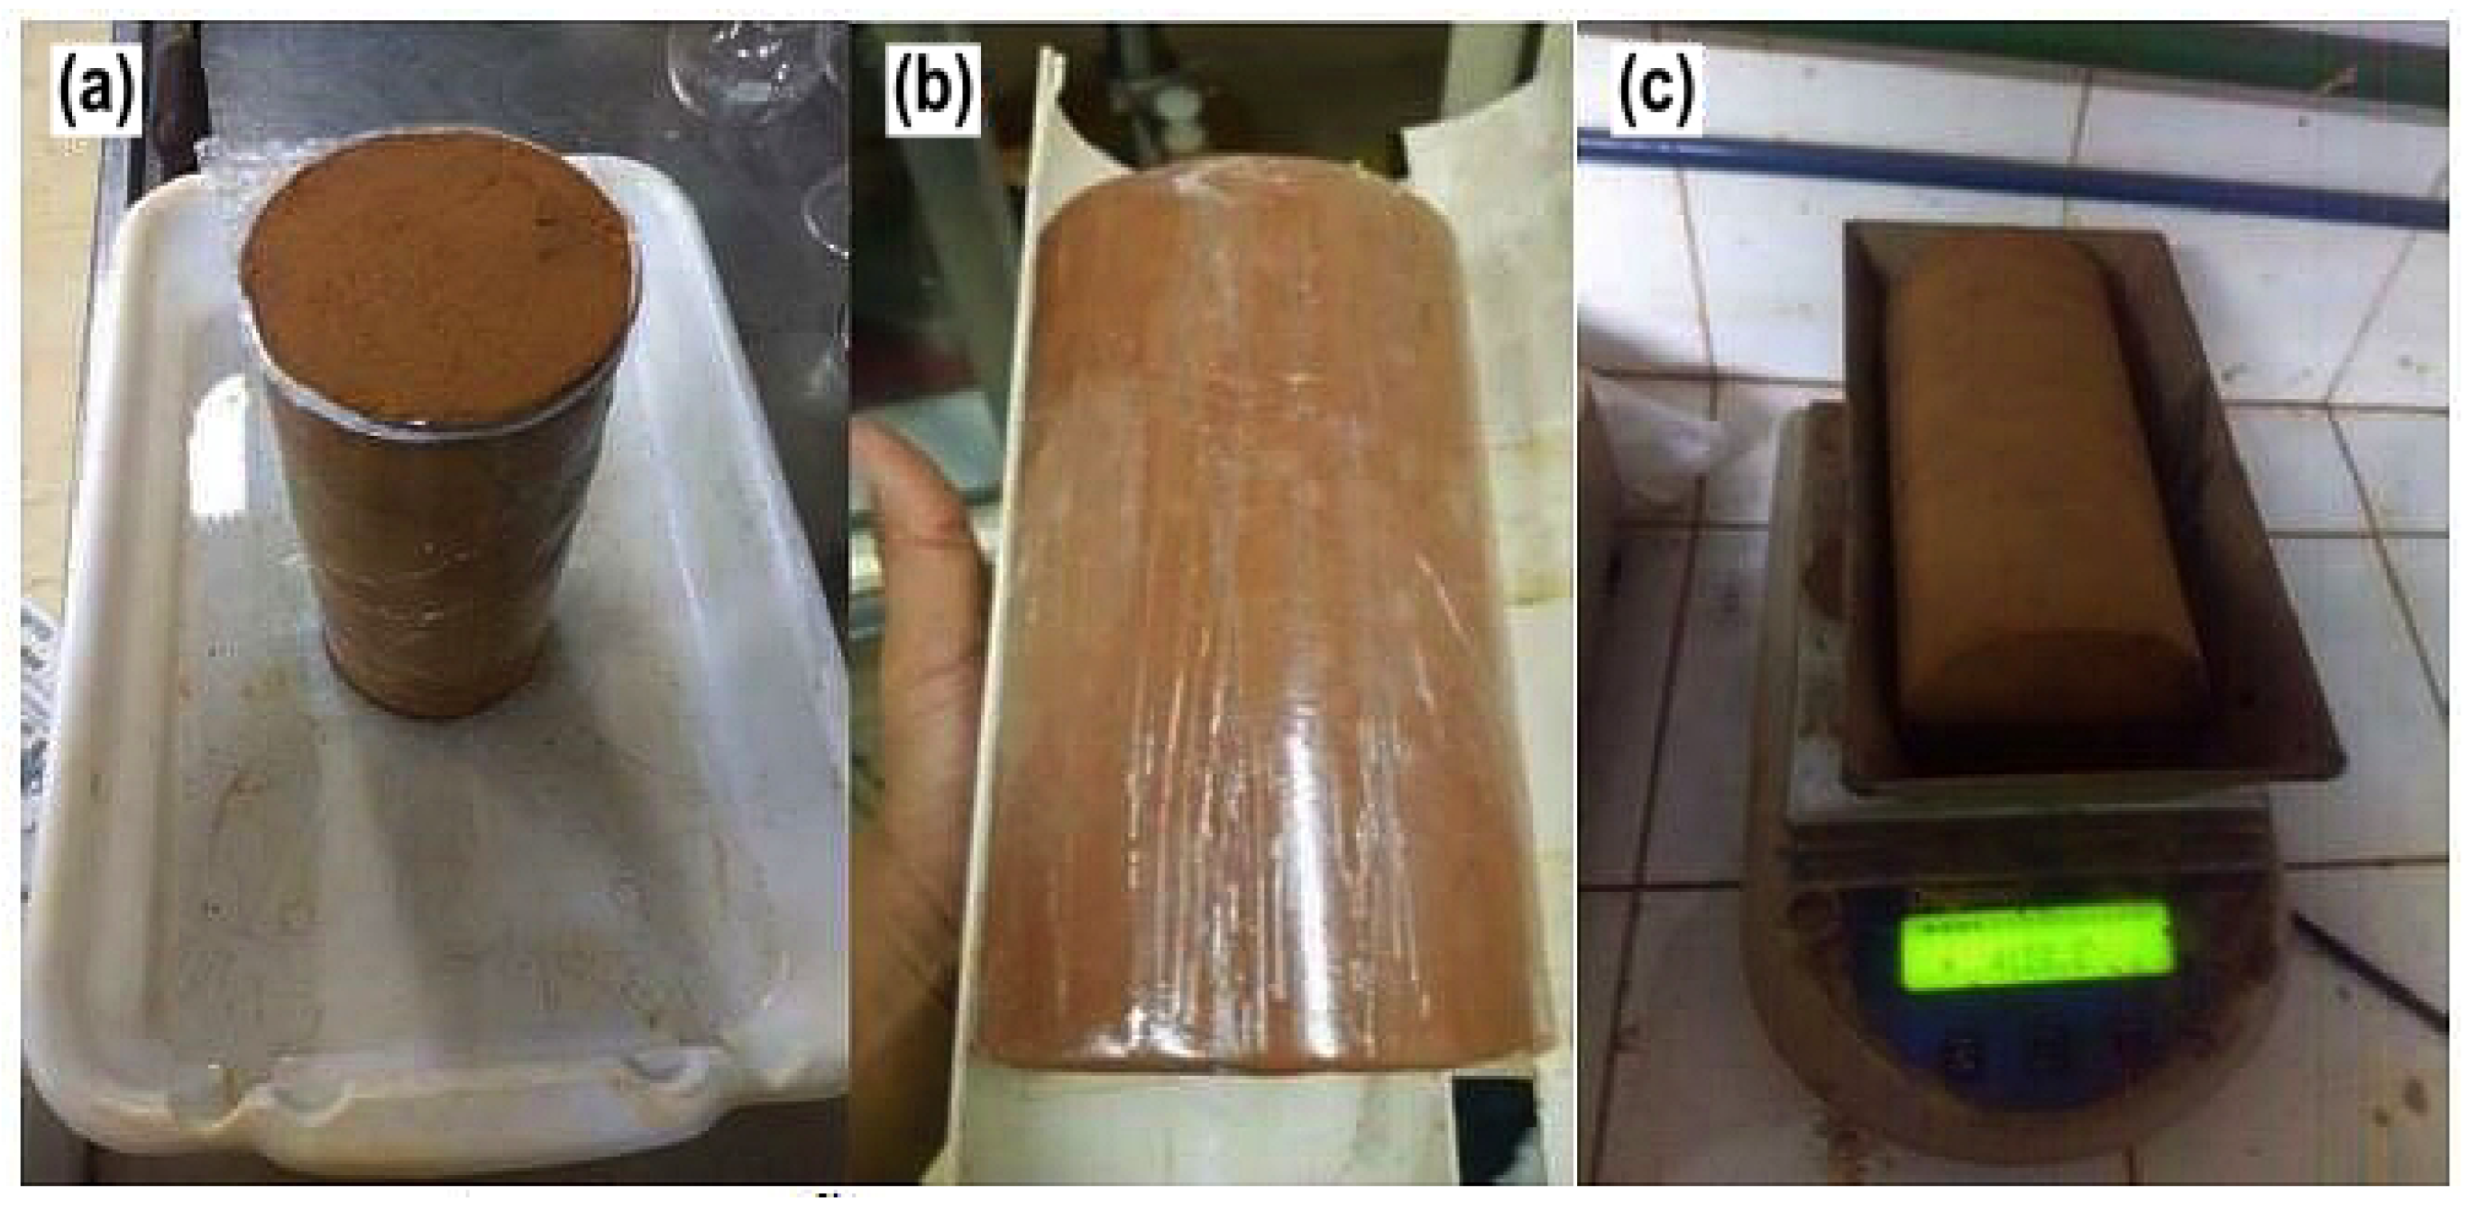
Moisture Conditioning Procedure
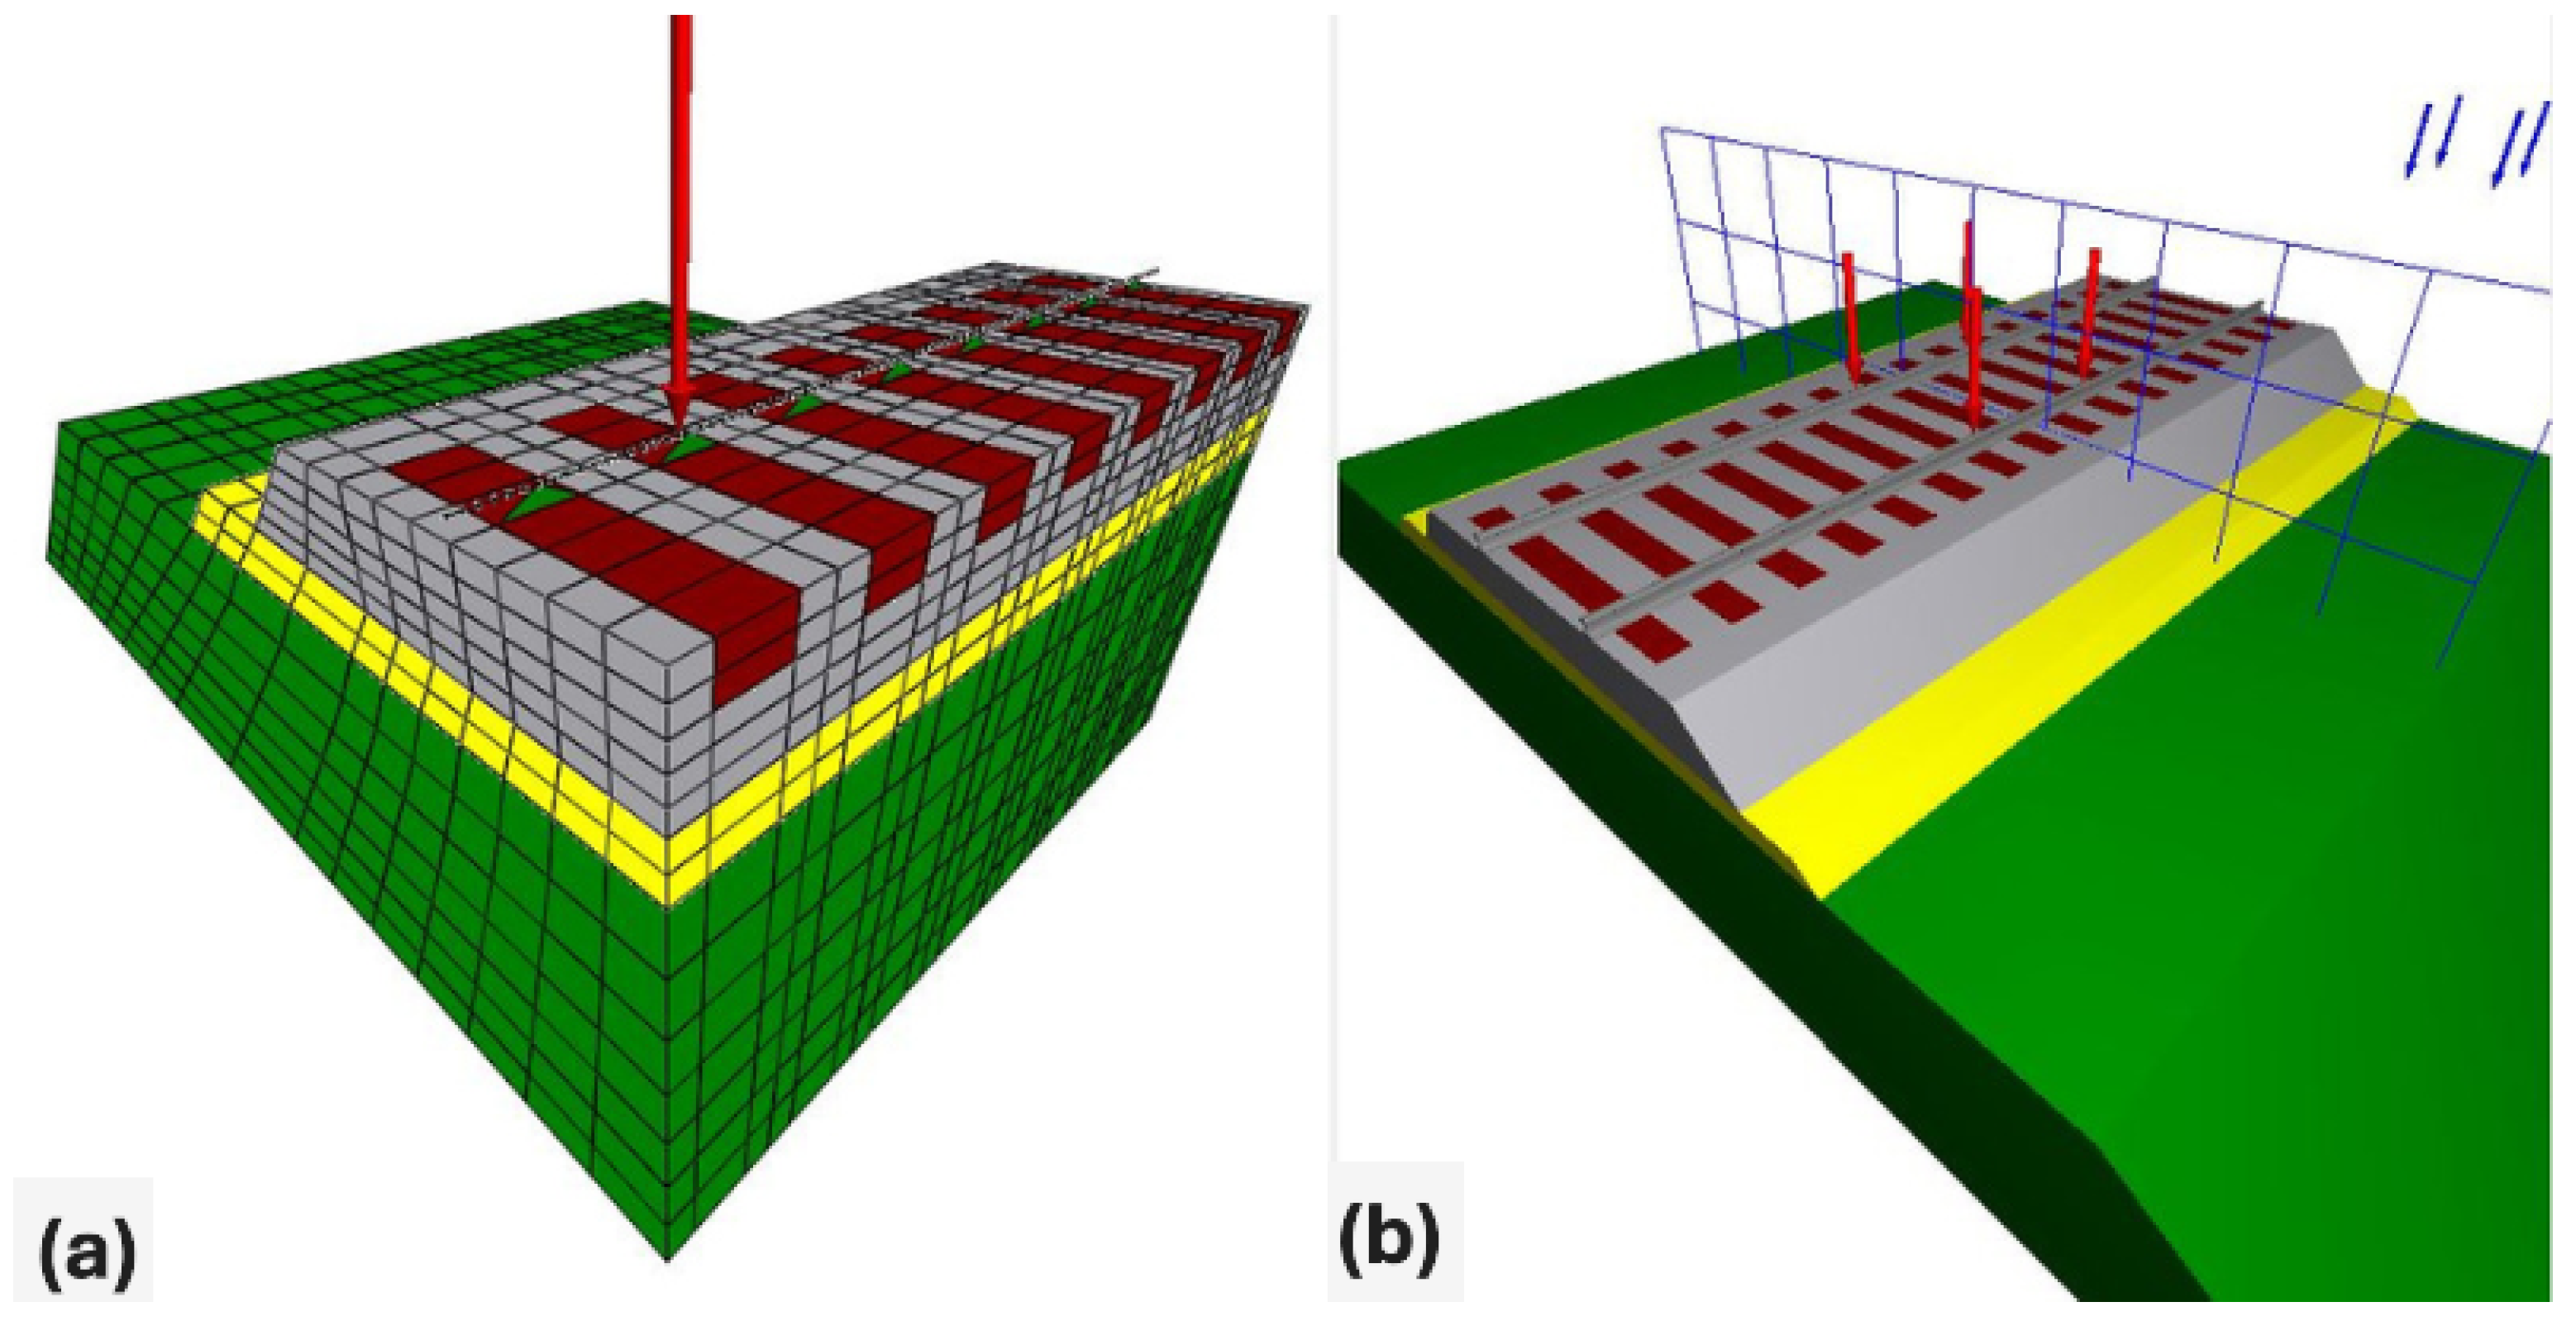
2.3. Simulations Conducted
- Scenario 1: Simulation with AM03 as subballast at optimum moisture content, under the application of a 32.5 t/axle load.
- Scenario 2: Simulation with AM03 at 1% above optimum moisture content, under the application of a 32.5 t/axle load.
- Scenario 3: Simulation with AM09 as subballast at optimum moisture content, under the application of a 32.5 t/axle load.
- Scenario 4: Simulation with AM09 at 1% above optimum moisture content, under the application of a 32.5 t/axle load.
3. Results and Discussions
3.1. Physical Characterization
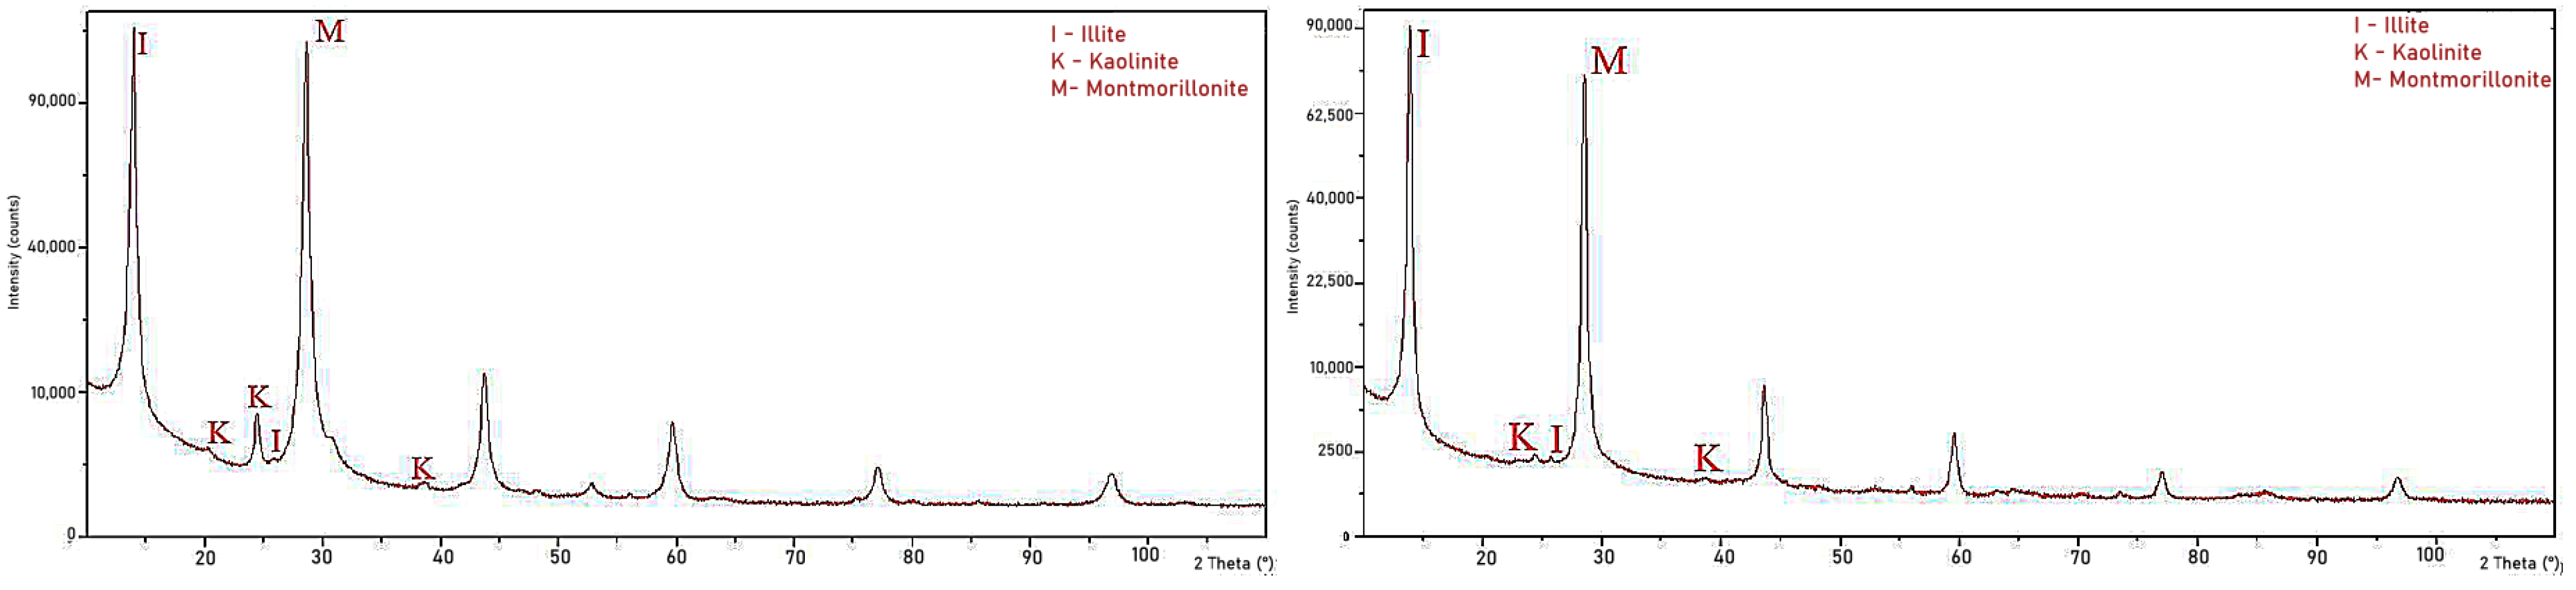
3.2. Chemical Characterization
3.3. Data Analysis of Triaxial Tests
3.3.1. Resilient Modulus
3.3.2. PD and Shakedown
3.3.3. Influence of Moisture Content
3.4. Simulation Results
4. Conclusions
Author Contributions
Funding
Data Availability Statement
Conflicts of Interest
References
- Indraratna, B.; Salim, W.; Rujikiatkamjorn, C. Advanced Rail Geotechnology—Ballasted Track; CRC Press: Boca Raton, FL, USA, 2011. [Google Scholar]
- Indraratna, B.; Salim, W. Mechanics of Ballasted Rail Tracks: A Geotechnical Perspective; Taylor & Francis: Abingdon, UK, 2005. [Google Scholar]
- Spada, J.L.G. A Pavement Mechanics Approach Applied to the Understanding of the Stress-Strain Behavior Mechanism of Railway Tracks. Ph.D. Thesis, Civil Engineering, Federal University of Rio de Janeiro, Rio de Janeiro, Brazil, 2003. [Google Scholar]
- Guimarães, A.C.R.; Filho, J.C.S.; Castro, C.D. Contribution to the use of alternative material in heavy haul railway sub-ballast layer. Transp. Geotech. 2021, 30, 100524. [Google Scholar] [CrossRef]
- Osten, F.; Guimarães, A.; Delgado, B.; Motta, L. Studies on Lateritic Soils from Maranhão for Low-Cost Pavement Application. In Proceedings of the 18th Urban Pavement Meeting (RPU), São Luís, Brazil, 18 June 2012. [Google Scholar]
- Soliman, H.; Shalaby, A. Permanent deformation behavior of unbound granular base materials with varying moisture and fines content. Transp. Geotech. 2015, 4, 1–12. [Google Scholar] [CrossRef]
- Medina, J.; Motta, L.G. Pavement Mechanics, 3rd ed.; Interciência Ltda: Rio de Janeiro, Brazil, 2015. [Google Scholar]
- dos Santos, W.W.; Guimarães, A.C.R.; Marques, M.E.S. Comprehensive Analysis of Railway Pavement with Box Test: Characterization and Evaluation of Resilient Modulus of Steel Slag Ballast for Sustainable Railway Pavement Viability. In Proceedings of the 5th International Conference on Transportation Geotechnics (ICTG) 2024; Rujikiatkamjorn, C., Xue, J., Indraratna, B., Eds.; Springer: Singapore, 2025; Volume 5, pp. 171–181. [Google Scholar]
- Delgado, B.; da Fonseca, A.V.; Fortunato, E.; Maia, P. Mechanical behavior of inert steel slag ballast for heavy haul rail track: Laboratory evaluation. Transp. Geotech. 2019, 20, 100243. [Google Scholar] [CrossRef]
- Campos, P.C.O.; Silva, B.A.; Marques, M.E.S. Geotechnical characterization of railway subgrade soils: Field and laboratory investigations. Ibero-Am. J. Environ. Sci. 2019, 10, 178–193. [Google Scholar] [CrossRef]
- Cavalcante, A.C.; Ribeiro, M.R.B.M.; Nunes, C.Y.; Souza, J.G.M.; Delgado, B.G. Mechanistic Analysis of the Applicability of Sub-ballast Constituent Soils in Railway Pavements through Parameters Obtained by Correlations with the MCT Classification for Soils from Northern Brazil. In Proceedings of the XVIII Brazilian Conference on Soil Mechanics and Geotechnical Engineering (COBRAMSEG), Belo Horizonte, Brazil, 19–22 October 2016. [Google Scholar]
- da Silva Sousa, M.A.; Coutinho, R.Q.; da Motta and, L.M.G. Analysis of the unsaturated behaviour of compacted lateritic fine-grained tropical soils for use in transport infrastructure. Road Mater. Pavement Des. 2023, 24, 31–58. [Google Scholar] [CrossRef]
- Arema—American Railway Engineering and Maintenance-of-Way Association. Manual for Railway Engineering; AREMA: Lanham, MD, USA, 2013. [Google Scholar]
- Menezes, L.C.d.A.; Guimarães, A.C.R.; Marques, M.E.S.; Ribeiro, T.S.; do Nascimento, F.A.C. Analysis of the Influence of Moisture Variation on the Behavior of Tropical Soils of Carajás Railway. Appl. Sci. 2023, 13, 7909. [Google Scholar] [CrossRef]
- Schulz-Poblete, M.; Grabe, P.; Jacobsz, S. The influence of soil suctions on the deformation characteristics of railway formation materials. Transp. Geotech. 2019, 18, 111–123. [Google Scholar] [CrossRef]
- Selig, E.T.; Waters, J.M. Track Geotechnology and Substructure Management, 14th ed.; Thomas Telford: London, UK, 1994. [Google Scholar]
- Wang, H.; Silvast, M.; Markine, V.; Wiljanen, B. Analysis of Bridge Transition Zones in Railways Considering the Moisture Condition of the Ballast and Subballast. Appl. Sci. 2017, 7, 1208. [Google Scholar] [CrossRef]
- Guimarães, A.; Motta, L.d. A Study on Permanent Deformation of Lateritic Soils Including the Shakedown Concept, 1st ed.; CRC Press: Boca Raton, FL, USA, 2008; p. 8. [Google Scholar]
- Thuler, R.B. Study of Soils from the State of Rio de Janeiro for Application in Low-Traffic Volume Roads. Master’s Thesis, Civil Engineering, Federal University of Rio de Janeiro, COPPE, Rio de Janeiro, Brazil, 2005. [Google Scholar]
- Ribeiro, M.M.P. Contribution to the Study of Permanent Deformation of Subgrade Soils. Master’s Thesis, Civil Engineering, School of Engineering of São Carlos, University of São Paulo, São Carlos, Brazil, 2013. [Google Scholar]
- Zhang, J.; Peng, J.; Li, J.; Zheng, J. Variation of Resilient Modulus with Soil Suction for Cohesive Soils in South China. Int. J. Civ. Eng. 2018, 16, 1655–1667. [Google Scholar] [CrossRef]
- Thom, N.H.; Brown, S.F. Effect of Moisture on the Structural Performance of a Crushed-Limestone Road Base. Transp. Res. Rec. 1987, 1121, 50–56. [Google Scholar]
- Hashem, E.B.; Zapata, C.E. Enhancement of Permanent Deformation Model for Unbound Materials Used by DARwin-ME. In Proceedings of the Transportation Research Board, Washington, DC, USA, 13–17 January 2013. [Google Scholar]
- Li, W.; Wilson, D.J.; Larkin, T.J.; Black, P.M. Permanent Strain Behavior of Marginal Granular Material. Transp. Res. Rec. 2017, 2655, 54–63. [Google Scholar] [CrossRef]
- Nazzal, M.D.; Mohammad, L.N.; Austin, A.; Hosainat, A.A. Effect of Moisture Content on the Shakedown Limits of Base Course Materials. Transp. Res. Rec. 2020, 2675, 192–202. [Google Scholar] [CrossRef]
- Ribeiro, F.; Nascimento, F.; Silva, M. Environmental performance analysis of railway infrastructure using life cycle assessment: Selecting pavement projects based on global warming potential impacts. J. Clean. Prod. 2022, 365, 132558. [Google Scholar] [CrossRef]
- Cruz, L.O.S.R. Procedure for Evaluating the Structural Integrity of the Railway Platform. Master’s Thesis, Transportation Engineering, Military Institute of Engineering, Rio de Janeiro, RJ, Brazil, 2019. [Google Scholar]
- Delgado, B.; Fonseca, A.; Fortunato, E.; Paixão, A.; Alves, R. Geomechanical assessment of an inert steel slag aggregate as an alternative ballast material for heavy haul rail tracks. Constr. Build. Mater. 2021, 279, 122438. [Google Scholar] [CrossRef]
- dos Santos, W.W.; Coelho, L.M.; Monteiro, S.N.; Marques, M.E.S.; Guimarães, A.C.R. Evaluation of Steel Slag as a Sustainable Alternative Aggregate for Railway Ballast: A Shakedown Theory-Based Approach. Buildings 2024, 14, 3546. [Google Scholar] [CrossRef]
- Fonte, M.S.; Donato, M.; Gouveia, B.G.; Santana, C.S.A.; Silva, M.A.V.d. Analysis of the influence of tropical soil classification methods on railway subgrades according to repeated load triaxial (RLT) and light weight deflectometer (LWD) tests. Case Stud. Constr. Mater. 2022, 17, e01301. [Google Scholar] [CrossRef]
- Silva Filho, J.; Skwarok, A.; Witiuk, R. Study of the track dynamics for optimizing the railway superstructure. In Advances in Transportation Geotechnics IV; Lecture Notes in Civil Engineering; Tutumluer, E., Nazarian, S., Al-Qadi, I., Qamhia, I., Eds.; Springer: Cham, Switzerland, 2022; Volume 165. [Google Scholar] [CrossRef]
- Teixeira, M.A.d.O.; Santos, W.W.d.; Coelho, L.M.; Santana, L.H.d.S.; Ávila, F.G.d.; Monteiro, S.N.; Guimarães, A.C.R. Influence of Ballast and Sub-Ballast Thickness on Structural Behavior of Heavy-Haul Railway Platform Determined by Using Finite Element Modeling. Constr. Mater. 2025, 5, 13. [Google Scholar] [CrossRef]
- ABNT—Brazilian Association of Technical Standards. NBR 9604: Abertura de Poço e Trincheira de Inspeção em Solo com Retirada de Amostras Deformadas e Indeformadas; ABNT: Rio de Janeiro, Brazil, 1996. [Google Scholar]
- ABNT—Brazilian Association of Technical Standards. NBR 6558: Grãos de Solos que Passam na Peneira de 4,8 mm—Determinação da Massa Específica; ABNT: Rio de Janeiro, Brazil, 2016. [Google Scholar]
- ABNT—Brazilian Association of Technical Standards. NBR 7181: Soil—Granulometric Analysis; ABNT: Rio de Janeiro, Brazil, 1984. [Google Scholar]
- ABNT—Brazilian Association of Technical Standards. NBR 6459: Solo—Determinação do Limite de Liquidez; ABNT: Rio de Janeiro, Brazil, 2016. [Google Scholar]
- ABNT—Brazilian Association of Technical Standards. NBR 7180: Soil—Determination of Plasticity Limit; ABNT: Rio de Janeiro, Brazil, 1984. [Google Scholar]
- ABNT—Brazilian Association of Technical Standards. NBR 7182: Solo—Ensaio de Compactação; ABNT: Rio de Janeiro, Brazil, 2016. [Google Scholar]
- DNIT—National Department of Transport Infrastructure. DNIT 259—CLA: Soil—Classification of Fine Tropical Soils for Road Purposes Using Compact Samples in Miniature Equipment—Classification; DNIT: Brasília, Brazil, 2023. [Google Scholar]
- DNER—National Department of Transport Infrastructure. DNER-ME 256: Compacted Soils with Miniature Equipment—Determination of Mass Loss by Immersion; DNER: Rio de Janeiro, Brazil, 1984. [Google Scholar]
- Nogami, J.S.; Villibor, D.F. Low-Cost Paving with Lateritic Soils; Editora Villibor: São Paulo, Brazil, 1995. [Google Scholar]
- DNIT—National Department of Transport Infrastructure. DNIT—134-ME. Pavement—Soils—Determination of Resilient modulus—Testing Instruction; DNIT: Brasília, Brazil, 2018.
- DNIT—National Department of Transport Infrastructure. DNIT—179-IE. Pavement—Soils—Determination of Permanent Deformation—Testing Instruction; DNIT: Brasília, Brazil, 2018.
- Pezo, R.F. A general method of reporting resilient modulus tests of soils, a pavement engineer’s point of view. In Proceedings of the 72nd Annual Meeting of the TRB, Transportation Research Board, Washington, DC, USA, 10–14 January 1993. [Google Scholar]
- Systrain. Software for Railway Simulation and Analysis. 2024. Available online: https://systrain.com.br/ (accessed on 15 March 2025).
- Garmabaki, A.H.S.; Thaduri, A.; Famurewa, S.; Kumar, U. Adapting Railway Maintenance to Climate Change. Sustainability 2021, 13, 13856. [Google Scholar] [CrossRef]
- Gomes, M.S.; Guimarães, A.C.R.; Marques, M.E.S. Study on the Influence of Fines Type on the Resilient Behavior of Tropical Soils for Pavement Use. Ibero-Am. J. Environ. Sci. 2018, 9, 78–87. [Google Scholar]
- Delgado, B.G. Deformability Analysis of a Tropical Soil from Western Maranhão as a Sub-Ballast Material for the Carajás Railway. Master’s Thesis, Geotechnical Engineering, Federal University of Ouro Preto, Minas Gerais, Brazil, 2012. [Google Scholar]
- CEN. EN 13286-7:2004 Unbound and Hydraulically Bound Mixtures. Part 7: Cyclic Load Triaxial Tests for Unbound Mixtures; Technical Report; Comité Européen de Normalisation: Londres, UK, 2004. [Google Scholar]
- Werkmeister, S.; Numrich, R.; Dawson, A.R.; Wellner, F. Design of Granular Pavement Layers Considering Climatic Conditions. Transp. Res. Rec. 2003, 1837, 61–70. [Google Scholar] [CrossRef]
- Latvala, J.; Kolisoja, P.; Luomala, H. The cyclic loading resistance of old railway track sub-ballast materials at different water contents. Transp. Geotech. 2022, 35, 100772. [Google Scholar] [CrossRef]
- Vandoorne, R.; Gräbe, P.; Heymann, G. Soil suction and temperature measurements in a heavy haul railway formation. Transp. Geotech. 2021, 31, 100675. [Google Scholar] [CrossRef]


| Test | Standard |
|---|---|
| Real grain specific mass | NBR 6558 [34] |
| Grain size analysis | NBR 7181 [35] |
| Liquid limit | NBR 6459 [36] |
| Plastic limit | NBR 7180 [37] |
| Compaction test | NBR 7182 [38] |
| Mini-MCV | DNIT 259 [39] |
| Mass loss by immersion | DNER ME 256 [40] |
| Confining Stress (MPa) | Deviatoric Stress (MPa) | Stress Ratio |
|---|---|---|
| 0.020 | 0.020 | 2 |
| 0.020 | 0.040 | 3 |
| 0.020 | 0.060 | 4 |
| 0.035 | 0.035 | 2 |
| 0.035 | 0.070 | 3 |
| 0.035 | 0.105 | 4 |
| 0.050 | 0.050 | 2 |
| 0.050 | 0.105 | 3 |
| 0.050 | 0.150 | 4 |
| 0.070 | 0.070 | 2 |
| 0.070 | 0.140 | 3 |
| 0.070 | 0.210 | 4 |
| 0.105 | 0.105 | 2 |
| 0.105 | 0.210 | 3 |
| 0.105 | 0.315 | 4 |
| 0.140 | 0.140 | 2 |
| 0.140 | 0.280 | 3 |
| 0.140 | 0.420 | 4 |
| Sample | (kPa) | (kPa) | Stress Ratio () |
|---|---|---|---|
| AM03 | 270 | 90 | 3 |
| 240 | 80 | 3 | |
| 280 | 70 | 4 | |
| 240 | 60 | 4 | |
| 300 | 60 | 5 | |
| 250 | 50 | 5 | |
| 180 | 30 | 6 | |
| 120 | 20 | 6 | |
| AM09 | 330 | 110 | 3 |
| 300 | 100 | 3 | |
| 320 | 80 | 4 | |
| 280 | 70 | 4 | |
| 300 | 60 | 5 | |
| 250 | 50 | 5 | |
| 300 | 50 | 6 | |
| 240 | 40 | 6 |
| Element | Description | |
|---|---|---|
| Rails | • Gauge: 1.6 m | • Elastic modulus: 210 GPa |
| • Section: TR-68 | • Poisson’s ratio: 0.3 | |
| • Specific weight: 7867.01 kg/m3 | ||
| Sleepers | • Prestressed concrete monoblock | • Trapezoidal section |
| • Length: 2.8 m | • Height: 20 cm | |
| • Bottom width: 30 cm | • Top width: 28 cm | |
| • Specific weight: 2400 kg/m3 | • Elastic modulus: 33 GPa | |
| • Poisson’s ratio: 0.2 | • Spacing: 60 cm | |
| Fastenings | • Spring element | |
| • Stiffness coefficient: 17,000 kN/m (x/y axes) | ||
| • Stiffness coefficient: 170,000 kN/m (z axis) | ||
| Ballast | • Crushed stone | • Thickness: 30 cm |
| • Shoulder: 40 cm width | • Slope (H:V) 1:1 | |
| • Cross slope: 3% on both sides | • Specific weight: 1730 kg/m3 | |
| subballast | • Thickness: 25 cm | • Resilient clayey material |
| • Nonlinear elastic behavior | • Shoulder: 50 cm width | |
| • Slope: 1:1.2 at the edges | • Cross slope: 1% | |
| Subgrade | • Thickness: 300 cm | • Behavior: linear elastic |
| • Resilient modulus: 100 MPa | • Shoulder: 2 m width | |
| • Slope: 1:1.5 at the edges | • Cross slope: 1% | |
| Loading | • Hopper wagons | • Coupling-to-axle distance: 1.21 m |
| • 2 bogies | • Axle spacing: 1.7 m | |
| • Bogie spacing: 13.945 m | • Axle load: 32.5 t/axle | |
| • Reference position: midpoint between sleepers | • Number of axles: 4 | |
| • 1st selected axle: 3 | • Symmetry: yes |
| Sample | Proctor Compaction | Grain Size Distribution | Dr | Atterberg Limits | MCT | TRB | USCS | ||||||||
|---|---|---|---|---|---|---|---|---|---|---|---|---|---|---|---|
| Method |
MDD
(g/cm3) |
OMC
(%) |
Coarse
Sand (%) |
Medium
Sand (%) |
Fine
Sand (%) |
Silt
(%) |
Clay
(%) |
LL
(%) |
PL
(%) |
PI
(%) | |||||
| AM O3 | Modified | 2.048 | 10.33 | 15 | 14 | 49 | 19 | 2 | 2.61 | 20.46 | 13.26 | 7.20 | NA’ | A-4 | SM |
| AM O9 | Modified | 2.043 | 10.45 | 2 | 24 | 41 | 7 | 26 | 2.61 | 20.28 | 15.26 | 5.02 | LG’ | A-4 | ML-CL |
| Sample | Stress Ratio () | Principal Stress (kPa) | Confining Stress (kPa) | Behavior | |
|---|---|---|---|---|---|
| AMO3 | 3 | 270 | 90 | 0.045 | Plastic Creep |
| 3 | 240 | 80 | 0.021 | Shakedown | |
| 4 | 280 | 70 | 0.080 | Plastic Creep | |
| 4 | 240 | 60 | 0.012 | Shakedown | |
| 5 | 300 | 60 | 0.076 | Plastic Creep | |
| 5 | 250 | 50 | 0.019 | Shakedown | |
| 6 | 180 | 30 | 0.057 | Plastic Creep | |
| 6 | 120 | 20 | 0.019 | Shakedown | |
| AMO9 | 3 | 330 | 110 | 0.061 | Plastic Creep |
| 3 | 300 | 100 | 0.040 | Shakedown | |
| 4 | 320 | 80 | 0.045 | Plastic Creep | |
| 4 | 280 | 70 | 0.029 | Shakedown | |
| 5 | 300 | 60 | 0.051 | Plastic Creep | |
| 5 | 250 | 50 | 0.028 | Shakedown | |
| 6 | 300 | 50 | 0.056 | Plastic Creep | |
| 6 | 240 | 40 | 0.033 | Shakedown |
| Sample | Stress Ratio {} | Principal Stress (kPa) | Confining Stress (kPa) | Behavior | |
|---|---|---|---|---|---|
| AMO3 | 3 | 180 | 60 | 0.330 | Plastic Creep |
| 3 | 150 | 50 | 0.080 | Shakedown | |
| 4 | 200 | 50 | 0.068 | Plastic Creep | |
| 4 | 160 | 40 | 0.020 | Shakedown | |
| 5 | 200 | 40 | 0.050 | Plastic Creep | |
| 5 | 150 | 30 | 0.027 | Shakedown | |
| 6 | 240 | 40 | 0.022 | Plastic Creep | |
| 6 | 180 | 30 | 0.013 | Shakedown | |
| AMO9 | 3 | 270 | 90 | 0.090 | Plastic Creep |
| 3 | 240 | 80 | 0.031 | Shakedown | |
| 4 | 240 | 60 | 0.075 | Plastic Creep | |
| 4 | 200 | 50 | 0.034 | Shakedown | |
| 5 | 250 | 50 | 0.050 | Plastic Creep | |
| 5 | 200 | 40 | 0.041 | Shakedown | |
| 6 | 300 | 50 | 0.045 | Plastic Creep | |
| 6 | 240 | 40 | 0.020 | Shakedown |
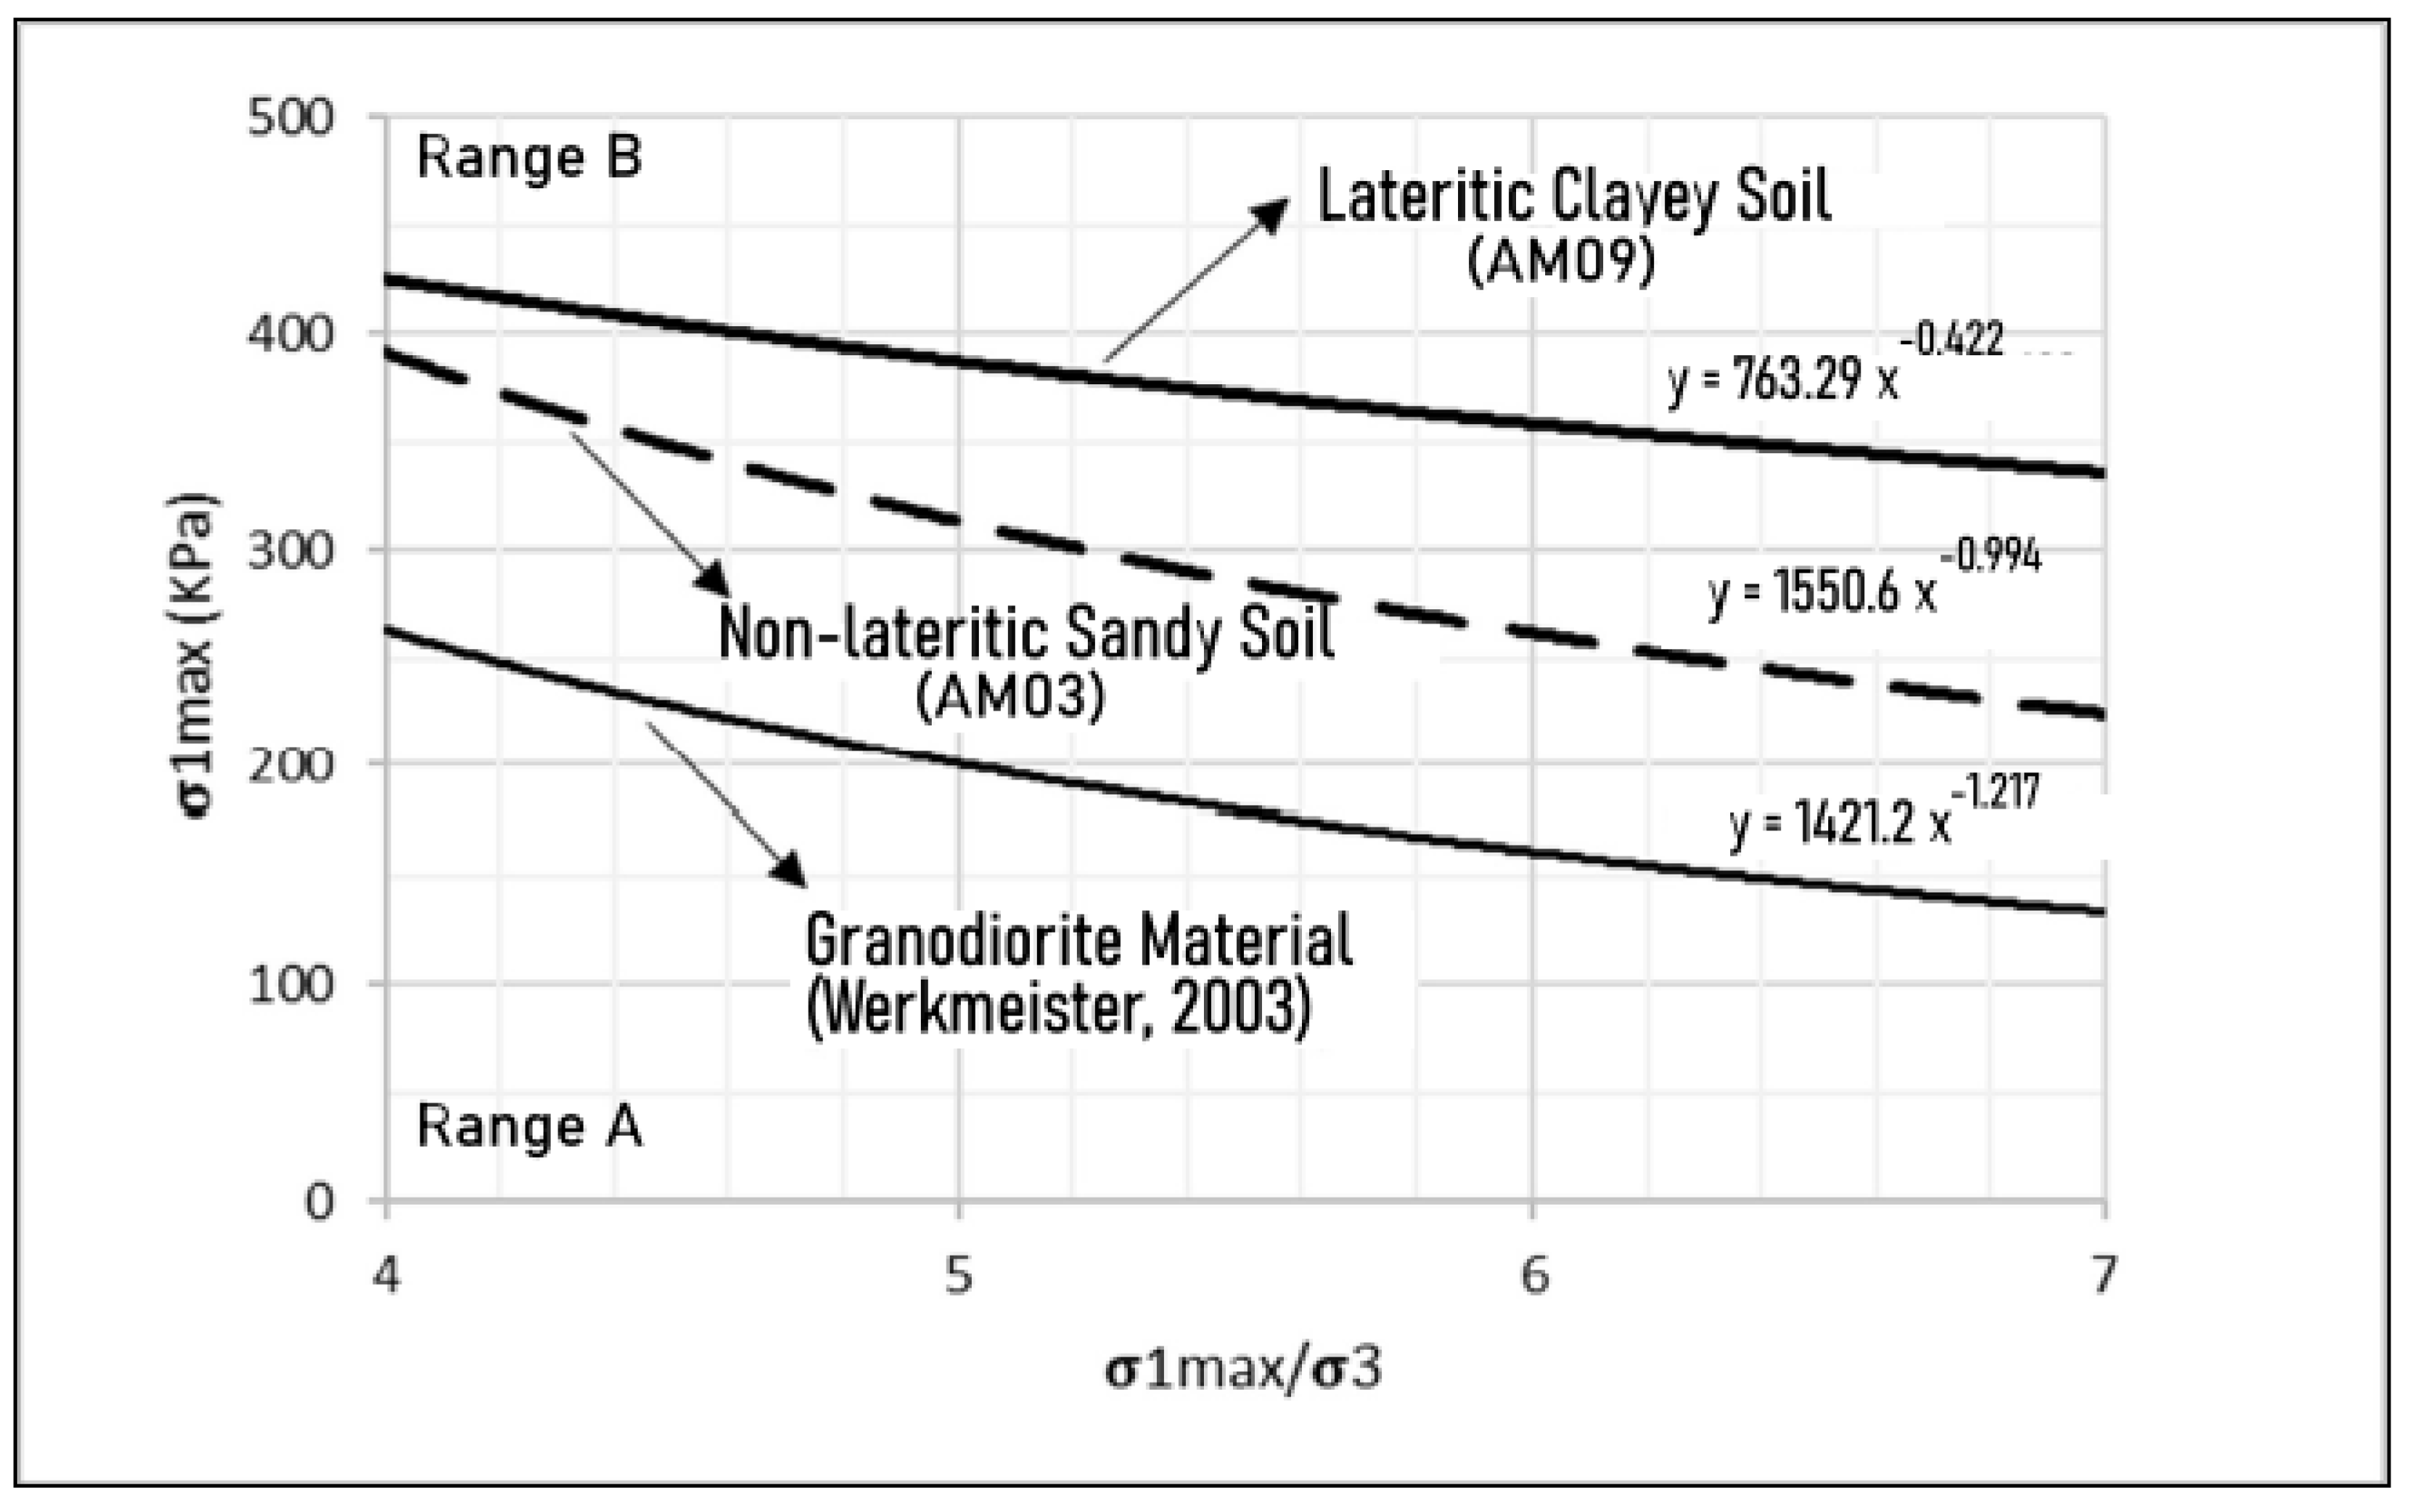
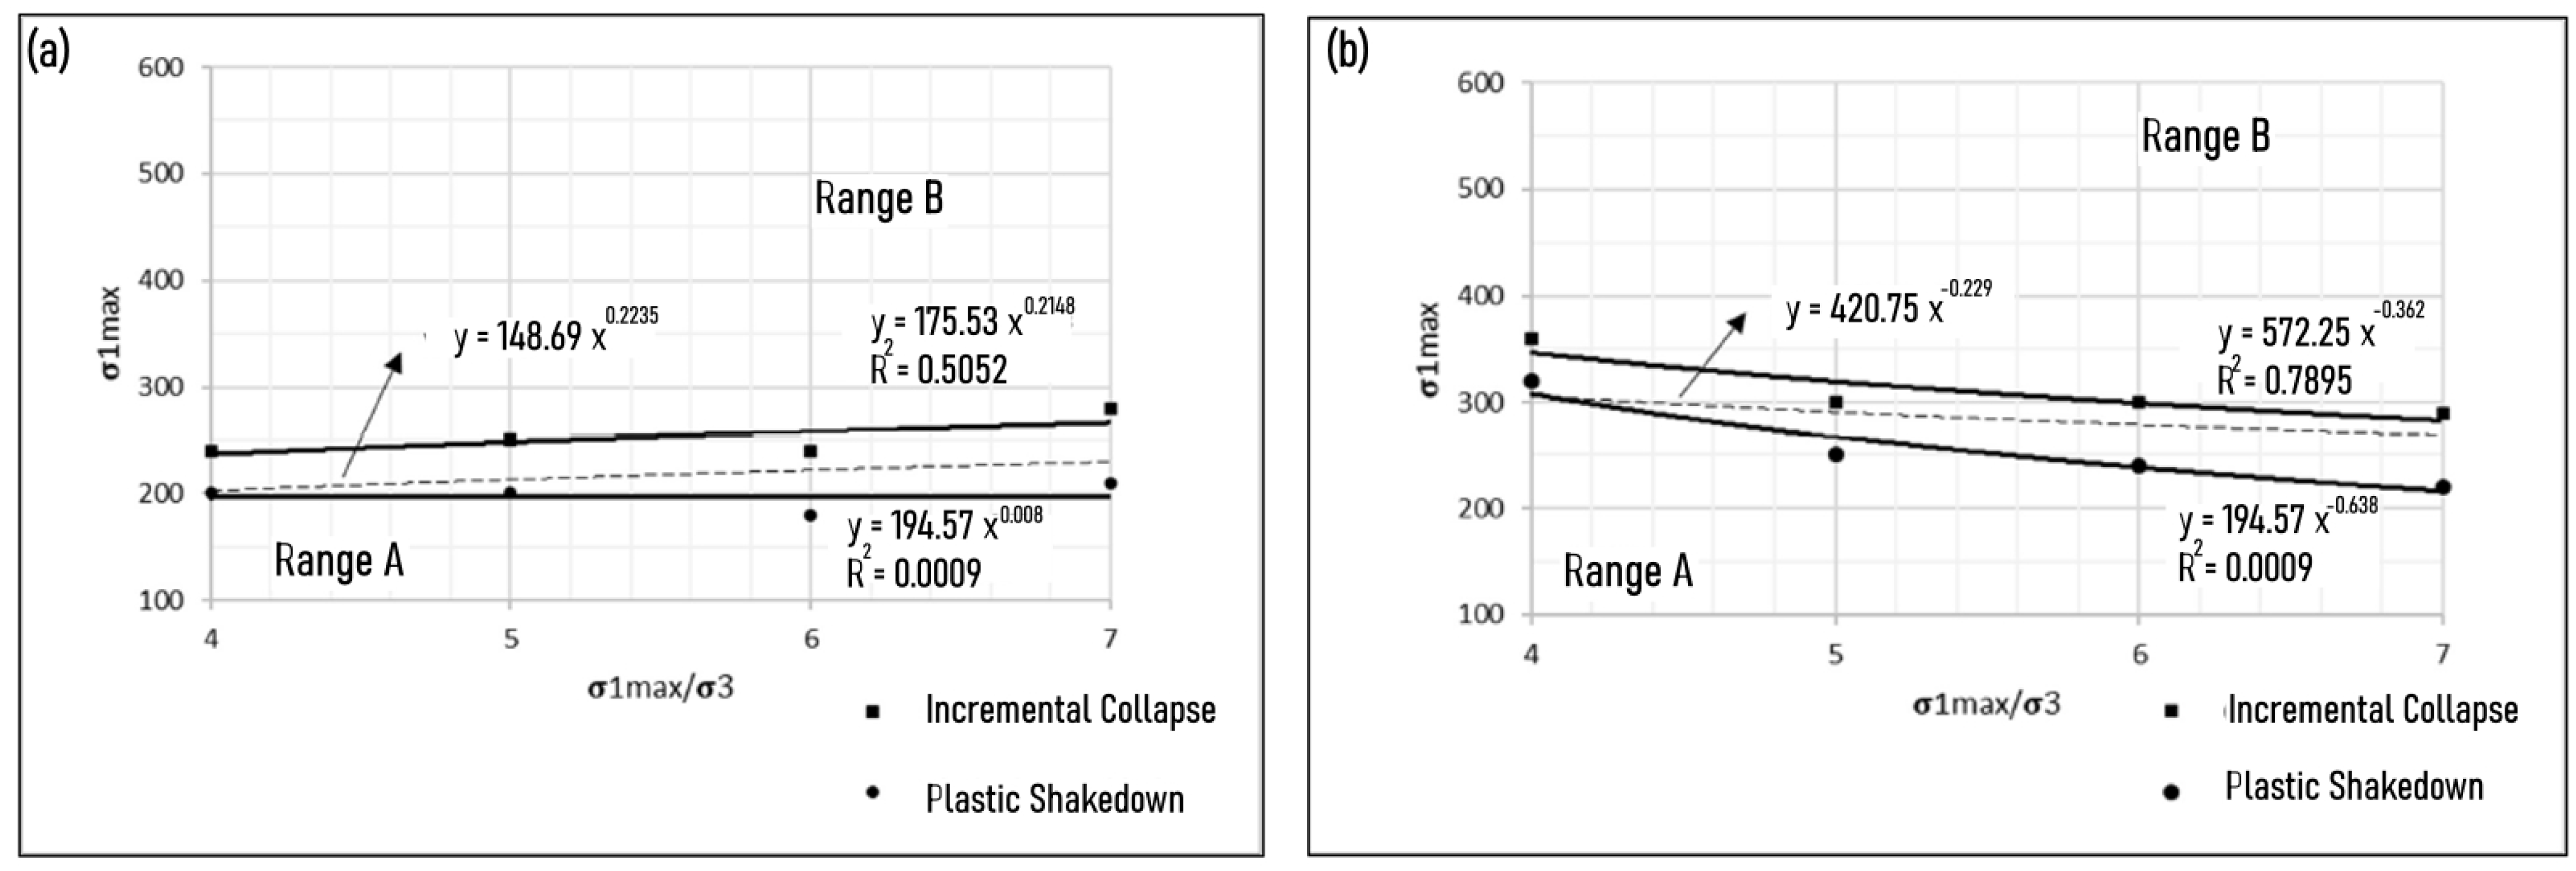
| Moisture Content | Non-lateritic Sandy Soil (AM03) | Lateritic Clayey Soil (AM09) | ||
|---|---|---|---|---|
| Optimum moisture | 1550.6 | −0.994 | 763.29 | −0.422 |
| Above optimum moisture | 148.69 | 0.224 | 420.75 | −0.229 |
Disclaimer/Publisher’s Note: The statements, opinions and data contained in all publications are solely those of the individual author(s) and contributor(s) and not of MDPI and/or the editor(s). MDPI and/or the editor(s) disclaim responsibility for any injury to people or property resulting from any ideas, methods, instructions or products referred to in the content. |
© 2025 by the authors. Licensee MDPI, Basel, Switzerland. This article is an open access article distributed under the terms and conditions of the Creative Commons Attribution (CC BY) license (https://creativecommons.org/licenses/by/4.0/).
Share and Cite
Santos, W.W.d.; Serra, G.A.; Coelho, L.M.; Monteiro, S.N.; Nascimento, G.d.C.; Guimarães, A.C.R. Influence of Moisture on the Shakedown Behavior of Fine Soils for Sustainable Railway Subballast Layers. Infrastructures 2025, 10, 149. https://doi.org/10.3390/infrastructures10060149
Santos WWd, Serra GA, Coelho LM, Monteiro SN, Nascimento GdC, Guimarães ACR. Influence of Moisture on the Shakedown Behavior of Fine Soils for Sustainable Railway Subballast Layers. Infrastructures. 2025; 10(6):149. https://doi.org/10.3390/infrastructures10060149
Chicago/Turabian StyleSantos, William Wilson dos, Gleyciane Almeida Serra, Lisley Madeira Coelho, Sergio Neves Monteiro, Gabriel de Carvalho Nascimento, and Antônio Carlos Rodrigues Guimarães. 2025. "Influence of Moisture on the Shakedown Behavior of Fine Soils for Sustainable Railway Subballast Layers" Infrastructures 10, no. 6: 149. https://doi.org/10.3390/infrastructures10060149
APA StyleSantos, W. W. d., Serra, G. A., Coelho, L. M., Monteiro, S. N., Nascimento, G. d. C., & Guimarães, A. C. R. (2025). Influence of Moisture on the Shakedown Behavior of Fine Soils for Sustainable Railway Subballast Layers. Infrastructures, 10(6), 149. https://doi.org/10.3390/infrastructures10060149