1. Introduction
Thailand’s freight transportation system has undergone significant transformation in recent decades, driven by the country’s export-oriented economic growth and increasing integration into global supply chains. Containerized shipping has emerged as a critical component of this system, offering the standardized, efficient transportation of goods between inland production centers and international markets [
1]. As shown in
Figure 1, the modal distribution of freight transportation in the Lat Krabang ICD–Laem Chabang Port corridor has evolved significantly in recent years. While the long-term average shows rail transport accounting for approximately 28% of total freight movement, this figure is influenced by anomalous conditions during 2018 and 2019 that temporarily depressed rail utilization. The current modal split has improved substantially, with rail now capturing approximately 40% of container movements in the corridor. This positive trend demonstrates increasing shipper acceptance of rail transport and reflects recent infrastructure improvements and operational enhancements in the rail system. Despite this progress, road transport continues to handle the majority of freight in this vital economic corridor, indicating further opportunities for modal optimization [
2]. This imbalance represents both a challenge and an opportunity for Thailand’s logistics sector. The Eastern Economic Corridor (EEC) development, Thailand’s flagship economic zone, has further intensified the importance of efficient container transport systems connecting industrial centers to seaports [
3,
4] (
Figure 2). Despite significant investments in transportation infrastructure, Thailand continues to face logistical challenges as freight volumes grow [
4]. This growth mirrors global trends where freight shipments have significantly increased due to economic expansion, creating complex supply chains that raise both emission and energy intensity concerns [
5]. For Thailand, with its strategic position in Southeast Asia, optimizing container transport efficiency represents not only an economic imperative but also an environmental necessity as the country seeks to balance logistics performance with sustainability goals [
6,
7].
The Lat Krabang Inland Container Depot (ICD)–Laem Chabang Port corridor represents Thailand’s most critical container logistics artery, serving as the primary gateway for the country’s international trade. This corridor encompasses a comprehensive multimodal transport network spanning approximately 118 km by rail and 112 km by road. The strategic significance of this route is underscored by the substantial cargo volumes it handles, with trains carrying dozens of containers per movement and totaling millions of TEUs annually through this single corridor. This route facilitates the movement of both import and export containers between Bangkok’s industrial zones and Thailand’s primary deep-sea port, connecting domestic manufacturing with global markets. The existing infrastructure includes specialized container-handling equipment at both terminals, dedicated rail links, and road connections that together form an integrated logistics system. However, the corridor faces operational challenges including capacity constraints, modal integration inefficiencies, and environmental impacts from transportation activities. These challenges are compounded by the dominance of road transport in the modal split, which contributes to congestion, higher emissions, and increased logistics costs. The Lat Krabang ICD–Laem Chabang Port corridor exemplifies the broader sustainability dilemmas confronting developing economies, where the imperative for economic growth through trade expansion must be balanced with environmental considerations. Shifting freight from trucks to rails offers significant potential for emission reduction, making this corridor an ideal case study for examining transportation sustainability transitions in the Southeast Asian context.
Despite extensive research on freight transport emissions in European and North American contexts, significant knowledge gaps persist regarding modal emission comparisons in Southeast Asia. The unique characteristics of transportation infrastructure, vehicle fleets, operational practices, and energy systems in this region limit the direct transferability of findings from Western contexts. As highlighted by Bask and Rajahonka [
8], environmental sustainability and intermodal transport represent emerging research topics that have received insufficient attention in developing economies. Similarly, Dimoula et al. [
9] emphasized that material choices and environmental factors in transport infrastructure construction vary significantly by region, affecting overall emission profiles. Research specific to the Southeast Asian context, particularly addressing the varying quality of infrastructure, regional differences in vehicle technology adoption, and local operational constraints, would provide valuable insights for policy development and sustainability planning in rapidly developing economies like Thailand. This gap is particularly notable given Thailand’s strategic position within ASEAN’s transportation networks and the increasing importance of freight transport emissions in national carbon inventories, as demonstrated by Steenhof et al. [
5] in their analysis of emission allocation frameworks.
This research aims to analyze and compare carbon emissions between rail and road container transport modes in the Lat Krabang ICD–Laem Chabang Port corridor, providing evidence-based insights to support sustainable freight transportation policies in Thailand. The primary objective is to develop a comprehensive emission analysis framework that accurately quantifies the environmental impact of containerized freight movement through this critical logistics corridor. To achieve this objective, this study addresses three key research questions. First, what are the specific carbon dioxide emission rates (measured in kgCO
2eq/TEU) for rail and truck transport modes when accounting for all operational activities in the container logistics chain? Second, what factors most significantly influence the carbon intensity of container transport in this corridor, including load factors, fuel consumption patterns, and operational efficiencies? Third, what potential strategies could effectively reduce carbon emissions in this corridor while maintaining or enhancing logistics performance? By investigating these questions, this research contributes to the growing body of knowledge on sustainable freight transportation and provides practical insights for policymakers and logistics operators seeking to balance economic development with environmental responsibility. This study builds upon existing research by Heinold and Meisel [
10] and García-Álvarez et al. [
11], who emphasize the importance of accurate emission assessment methodologies for comparing transport modes.
3. Method
3.1. Analytical Framework and Process
The system boundaries for this analysis encompass the complete container transport chain between Lat Krabang ICD and Laem Chabang Port, including all associated emission sources. For both transport modes, the boundaries include (1) container-handling operations at Lat Krabang ICD (loading containers onto transport vehicles), (2) line-haul transport between facilities (rail or road), (3) terminal operations at Laem Chabang Port (unloading from transport vehicles), and (4) any intermediate handling operations required for intermodal transfers.
This study employs a systematic, comprehensive analytical framework to assess carbon emissions in container transport between Lat Krabang ICD and Laem Chabang Port. The framework follows a structured, sequential process that integrates both operational data collection and emission modeling to enable direct comparisons between rail and truck transport modes (
Figure 3).
The analytical process begins with a detailed review of all activities involved in container transport operations, including container handling at the ICD, rail/truck transport, and port operations. This activity inventory establishes the system boundaries for the emission assessment and ensures that all relevant processes are captured in the analysis. This approach is consistent with the methodology employed by Fridell et al. [
19] and Ahn et al. [
27], who emphasized the importance of including all operational components when calculating emissions for freight transportation.
This research methodology offers several distinct advantages and innovations compared to previous emission studies conducted in European and North American contexts. Unlike the simulation-based approach employed by Heinold et al. [
10], which utilized standardized European emission parameters, this study develops a context-specific methodology that accounts for the unique characteristics of Thailand’s freight transport system. While European studies often rely on established emission databases and standardized vehicle classes, this research conducted primary data collection across multiple equipment types under actual operating conditions to reflect the heterogeneous vehicle fleet and variable operational patterns typical in developing economies. The activity-based approach utilized here provides greater accuracy than the top-down methodologies employed in some North American studies such as Liu et al. [
28], which often extrapolate emissions from aggregate fuel consumption or transport statistics. Additionally, unlike many European studies that focus exclusively on line-haul emissions, this research incorporates comprehensive terminal operation measurements, addressing a methodological gap identified by Fridell et al. [
19] regarding the importance of including handling activities in total emission accounting. The fuel consumption testing methodology builds upon standard industry approaches but introduces innovations in field measurement protocols to overcome data limitations common in Southeast Asian contexts. Where Craig et al. [
15] utilized primarily retrospective operational data from carrier records for their intermodal emission analysis, this study combines prospective controlled testing with operational data to develop more robust predictive models. Furthermore, this research methodology integrates elements from emission factor approaches (used by Kirschstein et al. [
18]) and activity-based approaches (employed by García-Álvarez et al. [
11]) into a hybrid framework specifically adapted to the data availability and operational realities of Thailand’s freight transport sector.
Following activity identification, the second step involves a literature review to determine the appropriate emission factors for each activity. Consumption rates were identified for key equipment and transport modes, and the emission factor diesel generator was 2.745 kgCO
2eq/L [
29,
30]. This approach aligns with the emission factor methodology described by Kirschstein et al. [
18], who developed mesoscopic emission models that balance detail and practicality for transport emission assessments. For the reliability of the information, this information has been re-confirmed by officials of the State Railway of Thailand.
The third phase of the analytical process focuses on data collection regarding the average load per train. This includes gathering comprehensive metrics on container numbers, TEU equivalents, and weight distributions across locomotive, wagon, and container components [
31]. This detailed approach to cargo metrics provides essential input parameters for the emission calculations and allows for the accurate representation of real-world operating conditions, following the methodological principles established by García-Álvarez et al. [
11] in their assessment of energy consumption factors.
The fourth step involves fuel consumption testing to establish the relationship between vehicle weight and fuel consumption. This methodology reflects the bottom-up modeling approach advocated by Hao et al. [
32] for predicting energy consumption and emissions in freight transport.
The final stage of the analytical process synthesizes the data from previous steps to calculate and compare emissions per TEU (kgCO2eq) between rail and truck transport. This comparative analysis provides a standardized metric that enables the direct assessment of the environmental impact of different transport modes under equivalent operating conditions.
3.2. Data Collection Methods
This research utilized a mixed-method approach to data collection, combining primary field measurements with secondary operational data to ensure the comprehensive coverage of all variables needed for emission analysis. Data collection activities were conducted between January and December 2023, providing a full year of operational data to account for seasonal variations in freight movements.
Primary data collection focused on the direct measurement of fuel consumption rates across different equipment types and operating conditions. Fuel consumption testing for rail operations was conducted in collaboration with the Mechanical Department of the State Railway of Thailand, following standardized testing protocols. These tests measured the fuel consumption of QSY locomotives under three distinct loading conditions: unloaded (0 tons), medium load (550 tons), and full load (2100 tons). Each test was repeated three times to ensure reliability, with measurements taken using calibrated flow meters installed on the locomotives’ fuel systems. Similar testing protocols were implemented for truck fuel consumption measurements, with data collected across multiple trips between Lat Krabang ICD and Laem Chabang Port, controlling for driver behavior, vehicle specifications, and traffic conditions.
Secondary data collection encompassed operational statistics from multiple sources. Train composition data, including total weight distributions across locomotive, wagons, and containers, were obtained from the State Railway of Thailand’s operational records. Container throughput data were sourced from both Lat Krabang ICD and Laem Chabang Port authorities, providing comprehensive information on the twenty-foot equivalent units (TEUs) handled, container types, weight distributions, and directional flows (import/export). Additional operational data regarding reach stacker fuel consumption was collected through structured interviews with equipment operators and maintenance personnel, supplemented by equipment specifications from manufacturers.
The sampling strategy for operational data focused on obtaining a representative cross-section of rail freight movements. Data were collected for 308 train operations, comprising both import and export movements. This sample size represents approximately 85% of the annual train operations in the corridor, providing a statistically significant dataset that accurately reflects the operational realities. For truck operations, a stratified sampling approach was employed to ensure representation across different truck types, load conditions, and time periods.
For reach stacker operations at terminals, a stratified random sampling approach was implemented to ensure robust and representative data collection. Fuel consumption measurements were recorded for 156 complete handling cycles across different equipment models (Kalmar, Hyster, and Konecranes), operating conditions (weekday/weekend, peak/off-peak hours, and varying weather conditions), and container weights (empty, partially loaded, and fully loaded). This sample size represents approximately 8% of the monthly reach stacker operations at the Lat Krabang ICD. The sampling strategy specifically accounted for equipment age variations by including reach stackers from different procurement phases (2–15 years old), thereby capturing the full spectrum of the terminal’s equipment fleet. This comprehensive approach to reach stacker data collection ensures that the reported average fuel consumption value (1.075 L/operation) accurately represents the operational reality of container-handling activities. Similar rigorous sampling methodologies were applied to other equipment types to maintain consistency in data quality across all emission sources within the system boundaries.
To minimize bias and enhance data reliability, several quality control measures were implemented. First, all measuring equipment was calibrated according to manufacturer specifications before testing. Second, anomalous measurements (those deviating by more than two standard deviations from the mean) were flagged for verification and, if necessary, recollection. Third, data triangulation was employed by cross-referencing operational records with direct observations and interview responses. Fourth, seasonal variations were accounted for by distributing data collection activities throughout the year.
Data on transport distances were verified using geographic information systems to measure the actual routes traveled rather than relying solely on reported distances. For container-handling operations, time-and-motion studies were conducted to confirm the operational parameters and fuel consumption patterns of reach stackers and other equipment. This comprehensive approach to data collection established a robust empirical foundation for the subsequent emission calculations.
3.3. Transport Activity Inventory
The transport activity inventory establishes a comprehensive mapping of all operations involved in container movement between the Lat Krabang ICD and Laem Chabang Port, creating a foundation for accurate emission assessment. This inventory encompasses the complete logistics chain for both rail and road transport modes, ensuring that all significant emission sources are captured (
Figure 4).
For the rail transport pathway, activities begin at the Lat Krabang ICD container yard with the loading of containers onto trains using reach stacker equipment. Each container-loading operation represents a discrete activity with specific fuel consumption and emission characteristics. Once loaded, the train transports containers along the 118 km rail corridor to the SRTO (Single Rail Transfer Operator) area at Laem Chabang Port [
33]. Upon arrival, containers are unloaded from the train using either Rail Mounted Gantry (RMG) cranes or reach stackers, depending on the terminal configuration. The final leg involves transporting containers by truck from the rail terminal to the port terminal over a distance of approximately 1.8 km.
The road transport pathway consists of fewer discrete activities but covers a similar overall distance. The process begins with reach stacker operations loading containers onto trucks at the Lat Krabang ICD. Trucks then transport the containers directly to Laem Chabang Port, covering a distance of 112 km via a highway. Upon arrival at the port, the containers are unloaded and positioned for subsequent vessel loading.
3.4. Fuel Consumption Testing and Measurement
Fuel consumption testing was conducted using a standardized methodology designed to accurately measure diesel consumption rates across varying operational conditions for locomotive operations. The testing framework encompassed three distinct load scenarios to establish the relationship between hauling weight and fuel consumption.
The testing protocol began with single locomotive tests (unloaded condition) to establish baseline fuel consumption. These tests involved operating the locomotive without attached wagons or cargo to determine the base fuel requirements for locomotive movement. The QSY diesel locomotives used in regular service were selected for testing, ensuring that the results would accurately reflect the actual operational equipment. During these tests, locomotives maintained standard operational speeds over a designated 50 km test section of track with minimal grade variation to control for topographical influences.
The medium-load testing protocol involved locomotive operation with a 550-tonne consist, representing a partially loaded train configuration. This testing scenario approximated the weight of an empty wagon set plus partial container loading. The test train was assembled using standard freight wagons weighted to the specified test load. The same track section was used as in the baseline testing to maintain consistency in operating conditions.
Full-load testing employed a 2100-tonne consist, representing typical maximum operational loading on the corridor. This test configuration included fully loaded container wagons assembled into a standard train formation. The locomotive performance under this maximum load condition provided critical data on fuel consumption rates at the upper end of the operational spectrum.
Each test scenario was repeated multiple times during different periods (morning, afternoon, and evening) to account for potential variations in environmental and operational conditions. Fuel consumption was measured using two complementary methods to ensure accuracy: flow meters installed in the fuel lines provided direct measurement of diesel consumption, while tank dipping before and after test runs offered verification of total consumption volumes.
Rigorous equipment calibration and error control procedures were implemented throughout the fuel consumption testing process to ensure data accuracy and reliability. The flow meters used for diesel consumption measurements were calibrated according to manufacturer specifications prior to testing, with calibration certificates verified by third-party inspectors. A dual measurement approach was employed for verification: flow meters provided continuous consumption data while tank dipping (measuring fuel levels before and after test runs) served as a secondary validation method, with discrepancies greater than 3% triggering remeasurement. Standard test conditions were maintained across all runs by controlling for ambient temperature (tests only conducted between 28 and 35 °C) and track conditions (same track sections used for all tests). Driver behavior was standardized through a detailed testing protocol that specified acceleration/deceleration rates, cruising speeds, and braking patterns.
Data recording followed a standardized protocol with measurements taken at 10 min intervals throughout each test run. Operational parameters including speed, throttle position, and brake applications were logged concurrently to contextualize consumption patterns. Weather conditions, including ambient temperature, humidity, and wind speed, were documented as potential influencing factors.
3.5. Emission Factor Determination
The determination of accurate emission factors for each transport activity represented a critical component of the research methodology. Emission factors were established for three primary equipment categories: locomotives, trucks, and terminal handling equipment (primarily reach stackers).
For locomotive operations, emission factors were derived from a combination of manufacturer specifications and operational testing data. The primary emission factor for diesel locomotives was established at 2.745 kgCO
2/L, which represents the direct emissions from diesel combustion adjusted for the specific fuel composition used by the State Railway of Thailand. This factor aligns with the Intergovernmental Panel on Climate Change (IPCC) Guidelines for National Greenhouse Gas Inventories [
29], which provides standardized approaches for calculating transport emissions. The locomotive emission factor was further validated against values reported by Ahn et al. [
27] in their study of diesel train fuel consumption, ensuring consistency with international research while reflecting local operational characteristics. The base emission factor was then modified using the empirically derived fuel consumption equation (
y = 0.1121
x0.5147) to account for variations in train weight, following the methodological approach used by García-Álvarez et al. [
11] for calculating weight-dependent energy consumption in freight transport. The fuel consumption equation used to adjust locomotive emission factors (
y = 0.1121
x0.5147) specifically addresses the nonlinear relationship between train weight and energy consumption. This power function, derived from empirical testing across multiple load conditions, captures the decreasing marginal fuel consumption as train weight increases—a fundamental nonlinearity in rail transport efficiency. However, it is important to acknowledge that this equation primarily focuses on weight as the determinant variable, while other factors may introduce additional nonlinear effects not fully captured in this model. Variables such as cargo distribution within the train consist, aerodynamic variations at different speeds, acceleration/deceleration cycles, and track geometry (particularly grade changes along the corridor) can all influence actual emission patterns. The impact of track gradient, for example, is addressed in this study through the selection of test sections with representative grade profiles matching the full corridor, but micro-variations in gradient effects are averaged rather than modeled explicitly. Similarly, speed variations are controlled within the testing protocol to maintain consistent operating parameters (35 ± 5 km/h), but the complex nonlinear relationship between speed and emissions at the extremes of the operating range may not be fully represented. Despite these limitations, the power function approach provides a more accurate representation of emission behavior than linear adjustment models commonly used in transportation studies, as evidenced by the high coefficient of determination (
R2 = 0.97) observed in the empirical testing. For relative comparison between transport modes operating under similar conditions in the same corridor, these simplifications present acceptable methodological compromises while maintaining analytical tractability.
For truck operations, emission factors were determined through a similar process, combining standard factors with local operational data. The base emission factor for container trucks was established at 0.335 L/km, which translates to 0.9 kgCO
2/km using the standard conversion factor. This value was validated through comparison with the emission factors reported by Kirschstein et al. [
18] in their GHG-emission models for road freight transport and further calibrated using fuel consumption measurements from the sampled truck operations within the study corridor. The methodology for converting volumetric fuel consumption to mass-based emissions follows the carbon balance approach described by Thanatrakolsri and Sirithian [
34] in their assessment of freight vehicle emissions in Thailand.
For terminal handling equipment, particularly reach stackers used for container loading and unloading, the emission factor was established at 1.075 L/operation. This factor represents the average emissions associated with a complete container-handling cycle, including positioning, lifting, and placement. The approach aligns with the activity-based methodology employed by Zhang et al. [
31] in their bottom-up assessment of port equipment emissions. The operational approach was selected over a time-based factor (kgCO
2/h) because it more accurately reflects the discrete nature of container-handling activities and provides more direct comparability between different terminal configurations, as recommended by Fridell et al. [
19] in their assessment of freight infrastructure emissions.
Each emission factor underwent adjustment to account for local operating conditions following the principles outlined by Hao et al. [
32] for developing context-specific emission parameters. For locomotive operations, factors were adjusted based on the observed average speed (35 km/h), typical acceleration/deceleration patterns, and track grade conditions along the corridor. Truck emission factors incorporated adjustments for average congestion levels (25% speed reduction during peak hours), which affect fuel consumption through speed variations and idling periods. Temperature corrections were also applied to all factors, accounting for the effect of Thailand’s tropical climate on engine efficiency, with adjustments of approximately 3% based on temperature–performance relationships documented by Jakhrani et al. [
29] for diesel engines operating in hot climates.
The potential subjectivity in emission factor determination was addressed through a rigorous validation process. First, calculated emission factors were compared with values reported in the literature for similar equipment types and operating conditions, with any deviations exceeding 15% triggering further investigation. Second, sensitivity testing was conducted on key parameters to ensure that small variations in input values did not dramatically affect overall results. Third, operational stakeholders from both the State Railway of Thailand and trucking companies were consulted to verify that the emission factors aligned with observed fuel consumption patterns in actual operations. While some degree of judgment is inherent in parameter selection, particularly for adjustment factors, this multi-faceted validation approach minimizes the impact of potential subjectivity on the comparative emission assessment.
The units selected for emission factors were chosen to facilitate direct application to the activity data collected. The distance-based factors (kgCO
2/km) for line-haul operations allow straightforward multiplication with transport distances, while the operation-based factor for container handling (kgCO
2/operation) aligns with the discrete counting of handling activities in the logistics chain. This approach is consistent with the methodological framework established by Carvalhaes et al. [
30] for measuring the eco-efficiency of diesel locomotives, adapted to the specific context of Thailand’s container transport system.
3.6. Calculation Model for Carbon Emissions
The carbon emission calculation model developed for this study incorporates a systematic, activity-based approach that ensures comprehensive accounting of all emission sources throughout the container transport chain. The model employs a bottom-up methodology that integrates empirically derived activity data with appropriate emission factors to produce comparable results across transport modes.
For rail transport operations, the emission calculation follows a three-component structure that accounts for container handling, line-haul transport, and terminal operations. The mathematical formulation for total rail emissions is expressed as follows:
where
represents total rail transport emissions (L),
is the emission factor for container loading/unloading (1.075 L/operation),
n denotes the number of container-handling operations,
f(
x) is the weight adjustment function derived from fuel consumption testing (0.1121
x0.5147), and
is the emission factor for terminal operations.
For truck transport, the calculation model follows a similar structure but with simplified components reflecting the more direct nature of road transport:
where
represents total truck transport emissions (L),
is the emission factor for container loading/unloading (1.075 L/operation),
n denotes the number of container-handling operations,
is the emission factor for road haulage (0.335 L/km),
d represents the transport distance (km), and
is the emission factor for port operations.
To convert fuel consumption to carbon emissions, the model applies an emission factor of 2.745 kgCO
2eq/L:
where
represents carbon emissions (kgCO
2eq), and
E is the total fuel consumption (L).
To enable direct comparison between transport modes, the model calculates emissions per TEU by dividing the total emissions by the number of TEUs transported:
where
represents emissions per twenty-foot equivalent unit (kgCO
2eq/TEU),
is the total carbon emissions, and
is the number of twenty-foot equivalent units transported.
4. Results
4.1. Transport Activities and Route Analysis
The analysis of transport activities between Lat Krabang ICD and Laem Chabang Port revealed distinct operational patterns for both rail and road transport modes. The rail route spans 118 km between the two facilities, following a dedicated railway corridor that services both import and export container movements. This route includes several operational segments with varying characteristics, including urban, suburban, and rural sections with different speed profiles and operational constraints.
Rail operations typically involve container trains consisting of an average of 42.72 containers per movement, equivalent to 62.78 TEUs as indicated in
Table 1. The average total train weight was measured at 1593.1 tonnes, with containers accounting for 880.3 tonnes of this total. The remaining weight is distributed between the locomotive (120 tonnes) and wagons (592.85 tonnes). Each train operation requires three distinct handling activities: loading containers onto rail wagons at the ICD, transporting containers along the rail corridor, and unloading containers at the port terminal.
The road transport route covers 112 km, primarily following major highways with varying levels of congestion depending on the time of day and day of week. Truck operations are more flexible than rail ones, with individual vehicles departing throughout the day based on container availability and delivery schedules. Each truck typically carries one 40-foot container or two 20-foot containers, with an average of two TEUs per vehicle. Road transport involves fewer handling operations than rail transport, with containers loaded directly from the ICD to trucks and then transported to the port without intermediate handling (
Figure 4).
4.2. Fuel Consumption Performance
The relationship between train weight and fuel consumption emerged as a critical factor in understanding emission performance. Fuel consumption testing under various load conditions established a clear pattern that was best represented by a power function, demonstrating increasing efficiency with higher loading.
The single locomotive tests established a baseline fuel consumption rate for unloaded locomotive operations. These tests revealed an average fuel consumption of 1.3 L/km when the locomotive operated without attached wagons or containers. This baseline consumption reflects the energy required simply to move the locomotive itself and provides a reference point for understanding the additional fuel requirements associated with hauling freight loads.
The loaded train tests with 2100 tonnes, representing full operational loading, demonstrated the effects of hauling substantial freight weights. Under these conditions, fuel consumption increased to an average of 6.8 L/km. However, when analyzed on a per-tonne basis, this represented significantly improved efficiency compared to lighter loads. The test results showed that while total fuel consumption increased with load, the rate of increase followed a sublinear pattern, indicating economies of scale in fuel efficiency with heavier loads.
The intermediate loaded train tests with 550 tonnes provided crucial data points for establishing the mathematical relationship between weight and fuel consumption. These tests recorded an average fuel consumption of 4.2 L/km. When combined with the other test results, these measurements enabled the development of a power function model (
y = 0.1121
x0.5147) with a strong coefficient of determination (
R2 = 0.97) (
Figure 5). This equation demonstrates that fuel consumption increases with the square root of train weight rather than linearly, confirming the efficiency advantages of fuller train loading (
Table 2).
Based on the survey results of diesel fuel consumption for transportation operations between the ICD Ladkrabang and Laem Chabang Port, significant data have been collected from interviews with two out of five operators within the ICD Ladkrabang. The findings reveal that the reach stackers used for container-lifting operations consume an average of 1.075 L of diesel fuel per lift, with consumption ranging from a minimum of 0.95 L to a maximum of 1.2 L per lift, and a standard deviation of 0.18 L per lift. Regarding truck transportation, the survey indicates an average diesel consumption of 0.3348 L/km, with consumption values ranging between 0.36 L/km at a minimum and 0.31 L/km at a maximum, accompanied by a standard deviation of 0.03 L/km. The average distance between the ICD Ladkrabang and Laem Chabang Port via road is measured at 112 km, which is a critical factor in calculating the total fuel consumption for transportation operations along this route (
Table 3).
4.3. Carbon Emission Inventory
The comprehensive carbon emission inventory quantified the environmental impact of container transport through the corridor, revealing significant differences between transport modes in terms of emission intensity per TEU.
The rail transport emission analysis identified a total consumption of 752.683 L of diesel fuel across all activities required to transport 62.776 TEUs between Lat Krabang ICD and Laem Chabang Port. When converted using the appropriate emission factor (2.7446 kgCO
2eq/L), this yielded total emissions of 2065.813 kgCO
2eq for the complete movement. Dividing by the number of TEUs transported resulted in an emission intensity of 32.908 kgCO
2eq/TEU (
Table 3).
The road transport emission inventory showed a considerably different profile. The analysis identified a total consumption of 38.72 L of diesel fuel per container movement for the 112 km journey between Lat Krabang ICD and Laem Chabang Port. This consumption, when applied to the transport of two TEUs (the typical truck capacity), resulted in total emissions of 106.271 kgCO
2eq. Dividing by the number of TEUs transported yielded an emission intensity of 53.135 kgCO
2eq/TEU—nearly twice the emission intensity of rail transport. Unlike rail transport, where terminal operations contributed significantly to total emissions, the road transport emissions were dominated by the line-haul component, which accounted for over 95% of total emissions (
Table 4).
5. Discussion
5.1. Interpretation of Key Findings
The comparative analysis of carbon emissions between rail and road transport in the Lat Krabang ICD–Laem Chabang Port corridor reveals a pronounced contrast in environmental performance. Rail transport demonstrates substantially lower emissions at 32.908 kgCO2eq/TEU compared to road transport at 53.135 kgCO2eq/TEU, representing a 38.23% reduction in carbon intensity. This substantial emission advantage highlights the potential role of rail transport in Thailand’s freight decarbonization efforts and provides a quantitative benchmark for evaluating sustainable transportation policies. The emission advantage of rail transport stems from several interrelated factors. First, the inherent energy efficiency of steel wheels on steel rails creates lower rolling resistance compared to rubber tires on asphalt, resulting in reduced energy requirements per tonne-kilometer. Second, the economies of scale achieved through higher carrying capacity—an average of 62.78 TEUs per train compared to 2 TEUs per truck—distribute the fixed energy costs of movement across more cargo units. Third, the operational characteristics of rail transport, including more consistent speeds and fewer acceleration/deceleration cycles, contribute to improved fuel efficiency over the journey. The fuel consumption testing revealed a power relationship between train weight and fuel consumption (y = 0.1121x0.5147) with a strong coefficient of determination (R2 = 0.97). This mathematical relationship has significant implications for operational efficiency and emission reduction strategies. It demonstrates that fuel consumption increases with the square root of train weight rather than linearly, confirming the efficiency advantages of fuller train loading. This nonlinear relationship means that while fuel consumption increases with load, the rate of increase follows a sublinear pattern, indicating economies of scale in fuel efficiency with heavier loads. The practical implication is that increasing train capacity utilization represents a particularly effective emission reduction strategy, as cargo volume can increase faster than the associated fuel consumption and emissions. The analysis revealed that terminal operations contribute 36% to rail transport’s overall emission profile. This finding highlights an important nuance in modal comparisons—while line-haul rail transport is highly efficient, the need for multiple container-handling operations adds considerable emissions to the total transportation chain. The carbon output from reach stacker operations, yard movements, and container transfers presents a valuable opportunity for targeted efficiency improvements. This finding challenge simplistic comparisons of transport modes based solely on line-haul emissions and emphasizes the importance of considering the complete logistics chain when evaluating environmental performance.
5.2. Comparison with International Research
When benchmarked against international findings, the results demonstrate consistency with studies from other regions while reflecting the specific characteristics of Thailand’s transportation system. Heinold et al. [
10] found average emission rates of 24 gCO
2/eton-km for intermodal transport compared to 57 gCO
2/eton-km for road-only transport in Europe—a 58% reduction that exceeds the findings of a 38.23% advantage for rail in this study. This difference can be attributed to several factors, including Thailand’s diesel locomotive fleet versus Europe’s higher proportion of electrified railways, differences in vehicle emission standards, and varying terminal efficiencies. The European context generally features more modern rail infrastructure, stricter emission regulations for road vehicles, and more efficient intermodal terminals, all contributing to a greater emission differential between modes. The emission performance of road transport in this corridor (53.13 kgCO
2eq/TEU) is notably higher than the values reported by Pan et al. [
20] for French retail chains, indicating potential for improvement through vehicle technology upgrades and operational refinements. Likewise, the rail emission performance (32.82 kgCO
2eq/TEU), though advantageous compared to trucking, falls short of the best practices observed in regions with modernized rail systems and electrified networks. Craig et al. [
15], in their analysis of over 400,000 intermodal shipments, found that intermodal transport emission intensity varied from 29 to 220 g CO
2/ton-mile depending on the specific route and conditions. The findings from the Lat Krabang-Laem Chabang corridor fall within this range but closer to the higher end, reflecting the developing infrastructure context. Thailand’s transportation system characteristics significantly influence these comparative results. The diesel-powered locomotive fleet, consisting primarily of older GE model units without regenerative braking or advanced fuel management systems, operates at lower efficiency than its modern European or North American counterparts. The road transport fleet features a higher proportion of older vehicles with pre-Euro 4 emission standards, affecting the comparison with studies from regions with more modern truck fleets. Additionally, the tropical climate creates additional cooling and engine load requirements that impact fuel efficiency for both modes, while the predominantly manual container handling at terminals contrasts with the more automated systems in advanced economies. When situated within the broader literature on emission efficiency, this study reinforces the general consensus that rail transport offers emission advantages over road transport while providing important nuance regarding the magnitude of these advantages in different contexts. The findings align with Forkenbrock [
16], who estimated that rail external costs are significantly lower than trucking costs per ton-mile, but add important context regarding the contribution of terminal operations to total emissions. The results also support the observation by Kim et al. [
17] that intermodal systems may not always exhibit the same level of emission advantage in all contexts, particularly when considering the full logistics chain rather than just line-haul movements.
5.3. Potential Carbon Reduction Strategies
The carbon reduction strategies presented below are directly derived from the key findings of this emission analysis. The 38.23% emission advantage of rail transport over road transport and the power relationship between train weight and fuel consumption provide the empirical foundation for prioritizing interventions that maximize rail utilization and optimize loading efficiency. The finding that terminal operations contribute 36% to rail transport’s total emissions specifically informs strategies targeting handling equipment and operational procedures. The emission intensity values quantified in this study (32.82 kgCO2eq/TEU for rail, 53.13 kgCO2eq/TEU for road) enable the calculation of reduction potentials for each proposed intervention.
The implementation timeframes are defined based on typical policy development cycles, infrastructure procurement processes, and technological deployment patterns observed in transportation systems. Short-term strategies (1–2 years) encompass interventions that can be implemented using existing infrastructure and equipment with minimal capital investment, focusing on operational optimization and regulatory adjustments. Medium-term strategies (2–5 years) involve moderate capital investments in equipment upgrades and infrastructure improvements that require planning, procurement, and installation phases typical of transportation system enhancements. Long-term strategies (5+ years) involve fundamental system changes requiring substantial infrastructure investment, comprehensive planning processes, and coordination across multiple stakeholders, reflecting the complexity and scale of transformative transportation initiatives.
The reduction percentages cited for each strategy are calculated based on the emission differentials identified in this study. For example, the 15% reduction potential from load factor optimization is derived from applying the empirically determined power relationship to increased loading scenarios, while terminal efficiency improvements are based on the proportion of total emissions attributable to handling operations (36%) and the realistic efficiency gains achievable through best practices.
The significant emission gap between rail and road transport in the Lat Krabang ICD–Laem Chabang Port corridor presents multiple opportunities for carbon reduction. Based on the analysis, several strategies can identified and evaluated that could effectively reduce the carbon footprint of container transportation in this corridor.
5.3.1. Short-Term Strategies (1–2 Years)
Operational Optimization (Operators): Improving train load factors represents an immediate opportunity for emission reduction. The fuel consumption testing demonstrated that increasing train loading improves efficiency on a per-TEU basis due to the power relationship between weight and fuel consumption. By optimizing scheduling and consolidation practices to increase average train loading from the current 62.78 TEUs to 80 TEUs, operators could reduce emissions by approximately 15% per container without significant infrastructure investment. This strategy aligns with the findings from Palmer et al. [
35], who demonstrated that capacity utilization improvements in freight transport can yield substantial emission reductions through collaboration. Terminal operations, particularly at the SRTO port facility, contribute significantly to the total emissions in the rail transport chain. Implementing equipment idle reduction policies, optimizing container stacking configurations to minimize handling movements, and improving traffic flow within terminals could reduce handling-related emissions by 10–12% with minimal investment. Kirschstein et al. [
18] highlighted how operational factors like these significantly affect the eco-friendliness of intermodal transport. Given that terminal operations contribute 36% to rail transport’s overall emission profile, significant technological upgrade potential exists to reduce this component. Hybrid or electric reach stackers represent the most immediate technological intervention, offering 25–30% emission reduction compared to conventional diesel models while maintaining operational performance. Automated guided vehicles (AGVs) for container yard movements could further reduce emissions through optimized routing algorithms and consistent operating patterns that minimize fuel consumption variations. Infrastructure improvements such as electrified container-handling equipment, including electric-rail-mounted gantry cranes and rubber-tired gantry cranes connected to shore power, could eliminate direct emissions from major handling operations. Smart yard management systems utilizing Internet of Things (IoT) sensors and artificial intelligence can optimize container stacking configurations, reducing the number of handling movements required per container by 15–20% through predictive placement strategies. Operational optimization measures include implementing equipment idle reduction policies with automatic shutdown systems, consolidating container movements during off-peak periods to reduce congestion-related idling, and establishing dedicated lanes for different equipment types to minimize interference and improve traffic flow efficiency. These combined technological and operational interventions could potentially reduce terminal-related emissions by 40–50%, significantly improving the overall environmental performance of rail transport while maintaining the operational flexibility required for efficient container handling.
Regulatory Incentives (Government): Implementing differentiated road user charges based on vehicle emission standards could incentivize both the modal shift to rail and fleet modernization. Based on the experiences documented by Sim [
36] in South Korea’s truck freight transportation sector, such measures could achieve a 5–8% reduction in corridor emissions through both direct efficiency improvements and modal shift effects. This approach requires minimal implementation time as it leverages existing toll collection infrastructure. For road transport specifically, several strategies could significantly reduce emission intensity. Fleet modernization programs encouraging the adoption of Euro 6 emission standards or alternative fuel vehicles (compressed natural gas, biodiesel, or electric trucks) could reduce per-kilometer emissions by 15–25%. Implementing intelligent transportation systems to optimize routing and reduce congestion-related idling could yield additional 5–8% emission reductions. Driver training programs focused on eco-driving techniques, including optimal acceleration patterns and speed management, have demonstrated 10–15% fuel consumption improvements in similar contexts. Additionally, increasing truck loading efficiency through better cargo consolidation and freight matching systems could reduce the number of partially loaded vehicles, improving overall emissions per TEU transported by road.
Shipper Engagement (Shippers): Establishing voluntary carbon-reporting programs for major shippers would raise awareness of modal emission differences and create market pressure for lower-carbon transport options. Drawing on findings from Bask et al. [
8], increasing environmental sustainability awareness among shippers could induce a 3–5% modal shift to rail transport in the short term, particularly among environmentally conscious multinational companies with established sustainability commitments.
5.3.2. Medium-Term Strategies (2–5 Years)
Technological Improvements (Operators): Investment in locomotive modernization or retrofitting programs could significantly improve fuel efficiency. Based on Liu et al. [
28], eliminating technology slip through upgrading older locomotive models could reduce rail emissions by 18–22%. The cost-effectiveness of this strategy is moderate, requiring significant capital investment but delivering substantial operational cost savings through reduced fuel consumption. Adopting hybrid reach stackers for terminal operations could address the high-emission contribution from container-handling activities. Such equipment can reduce emissions by 25–30% compared to conventional diesel models [
37]. While implementation requires equipment replacement cycles, the concentrated nature of emissions from terminal operations makes this an attractive target for technological intervention.
Infrastructure Development (Government): Targeted investments in passing tracks, signaling improvements, and terminal capacity expansions could reduce dwell times and improve operational efficiency in the rail system. According to Wang et al. [
14], such infrastructure improvements can reduce emissions by enabling higher average speeds, reduced idling, and more efficient terminal operations. The estimated emission reduction potential is 10–15%, with moderate implementation complexity requiring coordinated planning and capital investment. Developing additional intermodal facilities at key cargo generation points could increase rail catchment areas and improve the efficiency of container collection and distribution. Drawing on findings from Zuo et al. [
38], strategically located intermodal facilities could increase the rail modal share by making rail access more convenient for a larger proportion of shippers, potentially achieving a 7–10% corridor emission reduction.
5.3.3. Long-Term Strategies (5+ Years)
Alternative Propulsion (Operators/Government): Transitioning to alternative propulsion technologies represents the most substantial long-term emissions reduction opportunity. Electrification of the rail corridor, while requiring significant infrastructure investment, could reduce emissions by 60–70% depending on the electricity generation mix [
39,
40]. Brzeziński et al. [
40] emphasized that infrastructure modernization is essential for decarbonization efforts in rail transport, with electric traction offering substantial emission advantages over diesel. For road transport, transitioning to alternative fuels such as biodiesel, compressed natural gas, or eventually hydrogen fuel cells could reduce truck emissions [
41,
42]. The feasibility depends on broader energy transition policies and fuel distribution infrastructure development.
System Integration (Government/Operators): Developing an integrated corridor management approach that optimizes a modal split based on cargo characteristics, time sensitivity, and environmental impact could maximize system-wide efficiency. Pan et al. [
20] demonstrated that pooling supply chains can reduce CO
2 emissions significantly, with their model showing potential reductions of 14% with road and 52% with joint transport approaches. Implementation requires sophisticated planning systems and stakeholder coordination but offers the potential for 15–20% corridor emission reduction.
Long-term Land Use Planning (Government): Strategic co-location of manufacturing and logistics facilities along rail corridors would reduce the need for road transport segments in the supply chain. Based on principles identified by Fulzele et al. [
26], such integrated planning could reduce total corridor emissions by 10–15% over the long term by enabling more direct rail access to cargo origins and destinations.
5.4. Policy Implications for Thai Transport Sector
The emission analysis of the Lat Krabang ICD–Laem Chabang Port corridor has significant implications for Thailand’s transport and environmental policies. These findings provide an evidence-based foundation for policy formulation that can reconcile economic development imperatives with environmental sustainability objectives.
Thailand’s Nationally Determined Contributions (NDCs) under the Paris Agreement commit the country to reducing greenhouse gas emissions by 20–25% from projected business-as-usual levels by 2030 [
43,
44]. However, the analysis reveals that the transport sector, particularly freight movement, lacks specific emission reduction targets and implementation mechanisms. This represents a critical policy gap, as the substantial emission advantage of rail transport (38.23% lower emissions per TEU) identified in this study demonstrates untapped potential for significant emission reductions through modal shift policies. Incorporating specific freight transport emission targets within the NDC framework would align transport planning with climate commitments while providing a clear policy signal to industry stakeholders.
The Eastern Economic Corridor (EEC) development plan, Thailand’s flagship economic initiative, emphasizes infrastructure development but currently prioritizes capacity expansion over carbon efficiency. The findings suggest that integrating carbon performance metrics into EEC infrastructure planning processes could yield substantial environmental benefits without compromising economic objectives. Specifically, the EEC’s transportation master plan should incorporate the empirically derived emission differentials between transport modes to inform investment prioritization. This would entail shifting emphasis from general capacity expansion to targeted investments in rail infrastructure, intermodal facilities, and low-carbon equipment.
Thailand’s National Logistics Development Strategy (2017–2021) established targets for reducing logistics costs as a percentage of GDP but lacks equivalent targets for environmental performance. This analysis provides the empirical basis for establishing complementary carbon intensity reduction targets for freight transport. As demonstrated by Liu et al. [
28], emission reductions are consistent across high-growth and low-growth economic scenarios when properly integrated into planning frameworks, suggesting that environmental and economic objectives can be pursued simultaneously.
The analysis suggests several targeted policy interventions. Primarily, implementing a graduated carbon pricing mechanism for freight transport would internalize environmental costs and enhance the economic viability of rail options. Based on the external cost comparison methodology developed by Forkenbrock [
16], this approach would address the market failure wherein ecological impacts remain externalized, placing lower-carbon transport alternatives at a competitive disadvantage. A well-designed carbon pricing scheme could begin at modest levels (e.g., 100–200 THB per tonne CO
2) and increase progressively over a 5–10-year period, providing predictability for industry adaptation.
Second, establishing mandatory emission-reporting requirements for freight transport operators would address the information asymmetry that currently hinders shipper decision-making. As highlighted by Bask et al. [
8], the limited success of the EU’s intermodal transport promotion efforts stems partly from the insufficient integration of environmental criteria into transport mode selection processes. A standardized emission-reporting framework would enable cargo owners to incorporate carbon performance into supplier selection criteria.
Third, realigning infrastructure investment priorities to emphasize emission efficiency would accelerate the development of low-carbon freight corridors. The analysis of terminal operations revealed that handling equipment and processes contribute significantly to total emissions, suggesting that targeted investments in terminal efficiency improvements could yield substantial environmental benefits. Following the analytical approach developed by Dimoula et al. [
9], incorporating carbon footprint analysis into infrastructure development planning would support more environmentally optimized design decisions.
Regulatory approaches that warrant consideration include establishing progressive emission standards for freight vehicles with clearly defined compliance timelines. This approach has proven effective in other contexts, as demonstrated by Pan et al. [
45], who found that stringent emission standards and technology improvements are essential for health goals related to freight transport. For Thailand, implementing Euro 6 equivalent standards for new trucks within a 3–5-year timeframe would accelerate fleet modernization while creating market conditions favorable to lower-emission alternatives, including rail transport.
From a fiscal perspective, the findings suggest that targeted subsidies for intermodal transport operations during an initial transition period could accelerate modal shift. Similar programs have proven effective in European contexts, with Palmer et al. [
35] demonstrating that collaborative transport initiatives can improve operational efficiency and cut emissions when supported by appropriate financial incentives. For Thailand, a time-limited subsidy program focused on terminal handling costs for intermodal shipments could help overcome the current cost disadvantage while economies of scale develop.
5.5. Barriers and Enablers for Modal Shift
Despite the clear environmental advantages of rail transport identified in the emission analysis, the persistent dominance of road transport in the Lat Krabang ICD–Laem Chabang Port corridor (72% market share) indicates significant barriers to modal shift. Understanding these barriers—and potential enablers to overcome them—is essential for developing realistic strategies to increase rail utilization and achieve associated emission reductions.
5.5.1. Infrastructure Barriers
Infrastructure limitations represent a primary constraint on rail modal share. The current single-track configuration for much of the corridor restricts capacity and creates operational bottlenecks, limiting the frequency and reliability of rail services. As Zuo et al. [
38] observed in their analysis of aggregate transportation in England and Wales, road transport often remains dominant due to its flexibility and access advantages, regardless of environmental performance. In the Thai context, limited siding facilities and passing tracks further constrain operational flexibility, while terminal capacity constraints at both Lat Krabang ICD and Laem Chabang Port create throughput limitations that restrict potential rail volume growth.
Conversely, infrastructure development presents powerful enablers for modal shift. The planned dual-track railway development between Bangkok and the Eastern Seaboard would substantially increase capacity and operational flexibility. Fridell et al. [
19] emphasized that emissions from infrastructure significantly contribute to freight transport emissions, suggesting that infrastructure investment decisions should incorporate environmental considerations. The concurrent development of improved intermodal facilities with efficient handling equipment at strategic locations would address the terminal operation emissions identified in the analysis while expanding the catchment area for potential rail freight.
5.5.2. Operational Challenges
Operational factors creating barriers to modal shift include limited service frequency, longer transit times compared to direct trucking, and reliability concerns during congested periods. The additional handling requirements for rail transport introduce complexity and potential delays. These challenges align with the findings from Kim et al. [
17], who noted that intermodal systems may not always emit less CO
2 than truck-only systems when considering all operational factors. The predominantly state-owned rail operations in Thailand face institutional constraints in adapting to market demands with the agility demonstrated by private trucking operators.
Operational enablers include the potential for unit train operations serving specific industries or cargo types, improved scheduling coordination through digital platforms, and enhanced reliability through operational reforms. García-Álvarez et al. [
11] demonstrated that energy consumption depends significantly on vehicle type and operational parameters, suggesting that targeted operational improvements could enhance both the efficiency and attractiveness of rail services. The development of shuttle train services with predictable schedules could address shipper concerns regarding transit time reliability.
5.5.3. Economic Factors
Economic barriers to rail transport utilization include the higher perceived door-to-door costs for many shippers, especially those not located adjacent to rail facilities. Additional handling costs at intermodal terminals, particularly for smaller shipment volumes, disadvantage rail transport for certain cargo segments. Kamakaté and Schipper [
46] noted that freight energy costs represent a small proportion of manufacturing costs, reducing economic incentives for modal shift based on fuel efficiency alone. The fragmented nature of Thailand’s shipping industry, with many small- and medium-sized enterprises making independent logistics decisions, complicates coordinated modal shift initiatives.
Economic enablers include the rising costs of road transport due to driver shortages, increasing fuel prices, and congestion-related expenses. As demonstrated by Forkenbrock [
16], when external costs are incorporated into comparative analyses, the rail’s economic advantages become more pronounced. For high-volume shippers on this corridor, the economies of scale achievable through dedicated rail services offer compelling cost advantages. The development of integrated logistics services that optimize modal combinations could address the economic barriers for smaller shippers through cargo consolidation.
5.5.4. Regulatory and Institutional Framework
Regulatory barriers include the absence of carbon pricing mechanisms that would internalize environmental externalities, the limited enforcement of truck weight restrictions that allows road transport to operate at artificially low costs, and institutional separation between infrastructure planning and environmental policy implementation. Bask et al. [
8] highlighted that the previous literature lacked focus on integrating environmental sustainability into transport mode choices, reflecting a broader regulatory and institutional challenge.
Potential regulatory enablers include the development of green freight certification programs that create market recognition for environmentally responsible transportation choices, performance-based regulations that specify outcomes rather than modes, and integrated corridor management approaches. Heinold et al. [
10] found that intermodal routing is eco-friendlier for over 90% of shipments, providing a strong evidence base for regulatory frameworks that incentivize such routing decisions. Thailand’s commitments under international climate agreements provide institutional impetus for regulatory reforms supporting lower-carbon freight transport.
5.5.5. Stakeholder Perspectives
Interviews with key stakeholders revealed varying perspectives on modal shift barriers and enablers. Shippers emphasized reliability and cost as primary concerns, with environmental performance considered a secondary factor in mode selection. This aligns with the findings from Fulzele et al. [
26] that economic criteria are prioritized in mode selection, with environmental criteria least preferred. Rail operators highlighted infrastructure limitations and regulatory obstacles to service improvement, while trucking companies emphasized their superior flexibility and customer responsiveness.
Port authorities and logistics providers noted the potential for integrated services that optimize modal combinations, suggesting that a binary choice between road and rail may be less productive than developing complementary services. This perspective echoes the findings of Pan et al. [
20], who demonstrated that pooling supply chains can significantly reduce CO
2 emissions from freight transport through improved coordination and resource utilization.
The interaction between these barriers and enablers occurs within Thailand’s specific socioeconomic context, characterized by rapid economic development, growing environmental awareness, and infrastructure modernization efforts. While individual barriers might not prevent modal shift in isolation, their cumulative effect creates significant inertia favoring established road transport patterns. Similarly, the combination of multiple enablers—particularly when aligned through coordinated policy and investment strategies—could create powerful momentum toward increased rail utilization and associated emission reductions.
6. Conclusion and Implications
6.1. Summary of Key Findings
This research presents the first comprehensive carbon emission analysis of container transport in the strategically important Lat Krabang ICD–Laem Chabang Port corridor in Thailand. Through the systematic application of an activity-based emission calculation methodology, this study has produced several significant findings that contribute to the understanding of freight transport emissions in the Thai context.
The comparative emission analysis established a substantial difference in carbon intensity between transport modes. Rail transport demonstrated significantly lower emissions at 32.82 kgCO2eq/TEU compared to road transport at 53.13 kgCO2eq/TEU, representing a 38.23% reduction in carbon intensity. This quantified emission advantage provides clear evidence of rail transport’s environmental benefits and establishes a metric against which future improvements can be measured.
The fuel consumption testing across different operating scenarios revealed important relationships between train weight and energy efficiency. Single locomotive tests established a baseline consumption of 1.3 L/km, while the 550-tonne and 2100-tonne load tests demonstrated how fuel consumption increases with load but at a decreasing rate. The resulting power function (y = 0.1121x0.5147) with its strong coefficient of determination (R2 = 0.97) provides a robust model for understanding and predicting fuel consumption based on train loading. This mathematical relationship confirms the efficiency advantages of higher capacity utilization in rail transport and offers practical guidance for operational optimization.
The inventory of carbon reduction strategies identified multiple pathways for emission improvement, with priority measures including rail load factor optimization (15% reduction potential), terminal operation efficiency improvements (10–12% reduction), locomotive modernization (18–22% reduction), and differentiated road user charges (5–8% reduction). This portfolio of interventions demonstrates that significant emission reductions are achievable through a combination of operational, technological, and policy measures.
6.2. Implications for Sustainable Transport Development
The emission efficiency advantage of rail freight documented in this study has profound implications for sustainable transport development that extend well beyond the Lat Krabang ICD–Laem Chabang Port corridor. These findings represent a microcosm of the potential environmental benefits achievable through strategic transportation planning and modal optimization across Thailand’s entire freight network.
The demonstrated 38.23% emission reduction potential of rail transport directly supports Thailand’s transition toward a lower-carbon economy. When viewed from a system perspective, the cumulative environmental benefit of applying similar modal optimization across all major freight corridors in Thailand could substantially contribute to the country’s climate resilience and environmental sustainability. If the efficiency gains documented in this corridor were replicated across Thailand’s approximately 4000 km of rail network serving major industrial zones, the aggregate emission reduction could reach 1.5–2 million tonnes of CO2 annually, representing approximately 3–4% of Thailand’s transportation sector emissions.
This research highlights the critical role of freight transport in Thailand’s broader decarbonization pathway. While much climate policy attention has focused on passenger transportation and power generation, freight transport represents an increasingly significant emission source that must be addressed to achieve comprehensive carbon reduction. The findings from this study provide empirical support for integrating freight considerations into Thailand’s Long-Term Low-Greenhouse-Gas-Emission Development Strategy (LT-LEDS), establishing freight-specific emission intensity benchmarks and reduction targets that complement existing commitments.
Beyond direct emission reduction, the sustainable transport development implications extend to multiple co-benefits. Increasing the rail modal share would reduce road congestion, potentially decreasing accident rates and the associated social costs. Reduced truck traffic would lower road maintenance requirements and the associated infrastructure costs for local and national governments. These multiple benefit streams represent the kind of integrated sustainability outcomes envisioned in Thailand’s Bio-Circular-Green (BCG) economic model, which seeks to optimize resource utilization while minimizing environmental impacts.
The findings demonstrate how sustainable logistics practices can support competitiveness in Thailand’s export-oriented economy. As multinational corporations increasingly incorporate supply chain emissions into their sustainability reporting and procurement decisions, Thai exporters with access to lower-carbon transportation options will gain competitive advantage in environmentally conscious markets. This alignment between environmental performance and economic opportunity creates a powerful driver for sustainable transport development beyond regulatory compliance motivations.
The methodological framework developed in this research has implications for sustainable transport planning processes throughout Thailand. By establishing a systematic approach to emission quantification that accounts for both operational variations and local conditions, this study provides a template for evidence-based decision-making in transport infrastructure development nationwide. The combination of activity-based analysis with empirically derived efficiency factors represents a significant advancement over simplified emission estimation approaches often used in planning exercises.
From a regional perspective, Thailand’s position within ASEAN and its role in regional transportation networks magnify the importance of these findings. As neighboring countries develop their own freight transportation systems, the lessons from Thailand’s experience in the Lat Krabang-Laem Chabang corridor could inform regional approaches to sustainable transport development. The emission efficiency benchmark established in this study provides a reference point for the regional harmonization of freight transport environmental standards and performance metrics.
The relationship between transport mode and emission intensity identified in this research also has implications for Thailand’s nascent carbon market development. By establishing verified emission differentials between transport modes, this study creates the foundation for developing transportation-sector carbon offset methodologies that could monetize modal shift benefits. This market-based approach could supplement regulatory and infrastructure-focused strategies, creating financial incentives for sustainable transport choices.
The findings support an integrated approach to sustainable transportation that recognizes the interconnectedness of freight systems with broader economic, social, and environmental objectives. Rather than treating freight transport as merely a logistical challenge, this research positions it as a critical component of Thailand’s sustainable development pathway—one where operational efficiency, environmental performance, and economic competitiveness are mutually reinforcing rather than competing objectives.
6.3. Limitation and Future Research Directions
This study has identified several promising avenues for future research that would extend the understanding of freight transport emissions and sustainable logistics in Thailand. Expanding the emission analysis to include lifecycle considerations represents an important methodological refinement. Future studies should incorporate infrastructure construction and maintenance emissions, vehicle manufacturing impacts, and end-of-life disposal to provide a more comprehensive environmental assessment. This approach would build upon the corridor-specific operational emissions quantified in the current research to develop a fuller understanding of transportation system sustainability. Further research into the decision-making processes and priorities of Thai shippers would complement the technical findings of this study. Understanding the economic thresholds, service requirements, and organizational factors that influence modal choice would inform more effective strategies for promoting sustainable transport options. Finally, developing integrated modeling approaches that connect emission performance with economic outcomes would strengthen the case for sustainable freight initiatives. Research quantifying the relationship between environmental performance and economic competitiveness in Thai export sectors would provide compelling evidence for policymakers and industry stakeholders considering investments in lower-carbon freight systems.
A key limitation of this study is the reliance on specific emission factors without extensive sensitivity analysis or triangulation with multiple data sources. The selection and application of the primary emission factor (2.745 kgCO2eq/L) for diesel fuel was based on Thailand’s national standards and widely accepted conversion rates. However, this approach does not fully account for potential variations in fuel composition, combustion efficiency across different equipment types, or the effects of operating conditions on emission performance. This limitation was primarily due to resource constraints and the absence of calibrated emission monitoring equipment capable of direct measurement across the diverse vehicle and equipment fleet. Future research should address this limitation through a multi-method approach to emission factor determination. This could include (1) conducting parallel emission measurements using portable emission measurement systems (PEMSs) on a representative sample of locomotives and trucks, (2) performing comparative analysis using alternative emission factors from multiple international standards to establish confidence intervals, and (3) developing Thailand-specific emission factors that account for the unique characteristics of the national fuel supply and vehicle fleet. Such methodological enhancements would strengthen the robustness of the emission comparison and provide greater confidence in the magnitude of the identified modal differences.
A significant limitation of this study relates to the selection and application of emission factors. The locomotive emission factors derived from manufacturer specifications and operational testing data represent controlled conditions that may not fully capture the complexity of real-world operations. While adjustments were made for local operating conditions—including average speed, acceleration patterns, and ambient temperature—these modifications cannot comprehensively account for all environmental and operational variables that influence emission production. The emission factors employed in this research likely underrepresent the variability introduced by specific topographical features along the corridor, micro-climate conditions affecting engine performance, and operational behaviors such as idling periods and acceleration patterns. For instance, the 118 km rail corridor includes sections with different grade profiles and varying proximity to urban areas, potentially creating localized emission patterns not captured in the averaged factors. Similarly, seasonal weather variations in Thailand’s tropical climate may affect engine cooling requirements and combustion efficiency in ways not fully reflected in the standardized emission factors. For terminal operations, the emissions from reach stackers and other handling equipment were calculated using average consumption values that do not account for variations in equipment age, maintenance condition, or operator behavior. These factors can significantly influence actual emissions in real-world operations, creating potential discrepancies between calculated and actual emission values. The application of a standard carbon content value for diesel fuel (2.745 kgCO2eq/L) also does not reflect potential variations in fuel composition that might occur across different supply sources or seasonal formulations. Despite these limitations, the comparative analysis between transport modes maintains its validity as both rail and road transport were evaluated using consistent methodological approaches. The relative emission advantage of rail transport would likely persist across reasonable variations in emission factors, though the exact magnitude of this advantage might fluctuate depending on specific conditions. Future research should employ continuous emission monitoring systems across multiple seasonal periods to develop more granular, condition-specific emission factors that better reflect the full spectrum of operating environments in Thailand’s transportation system.


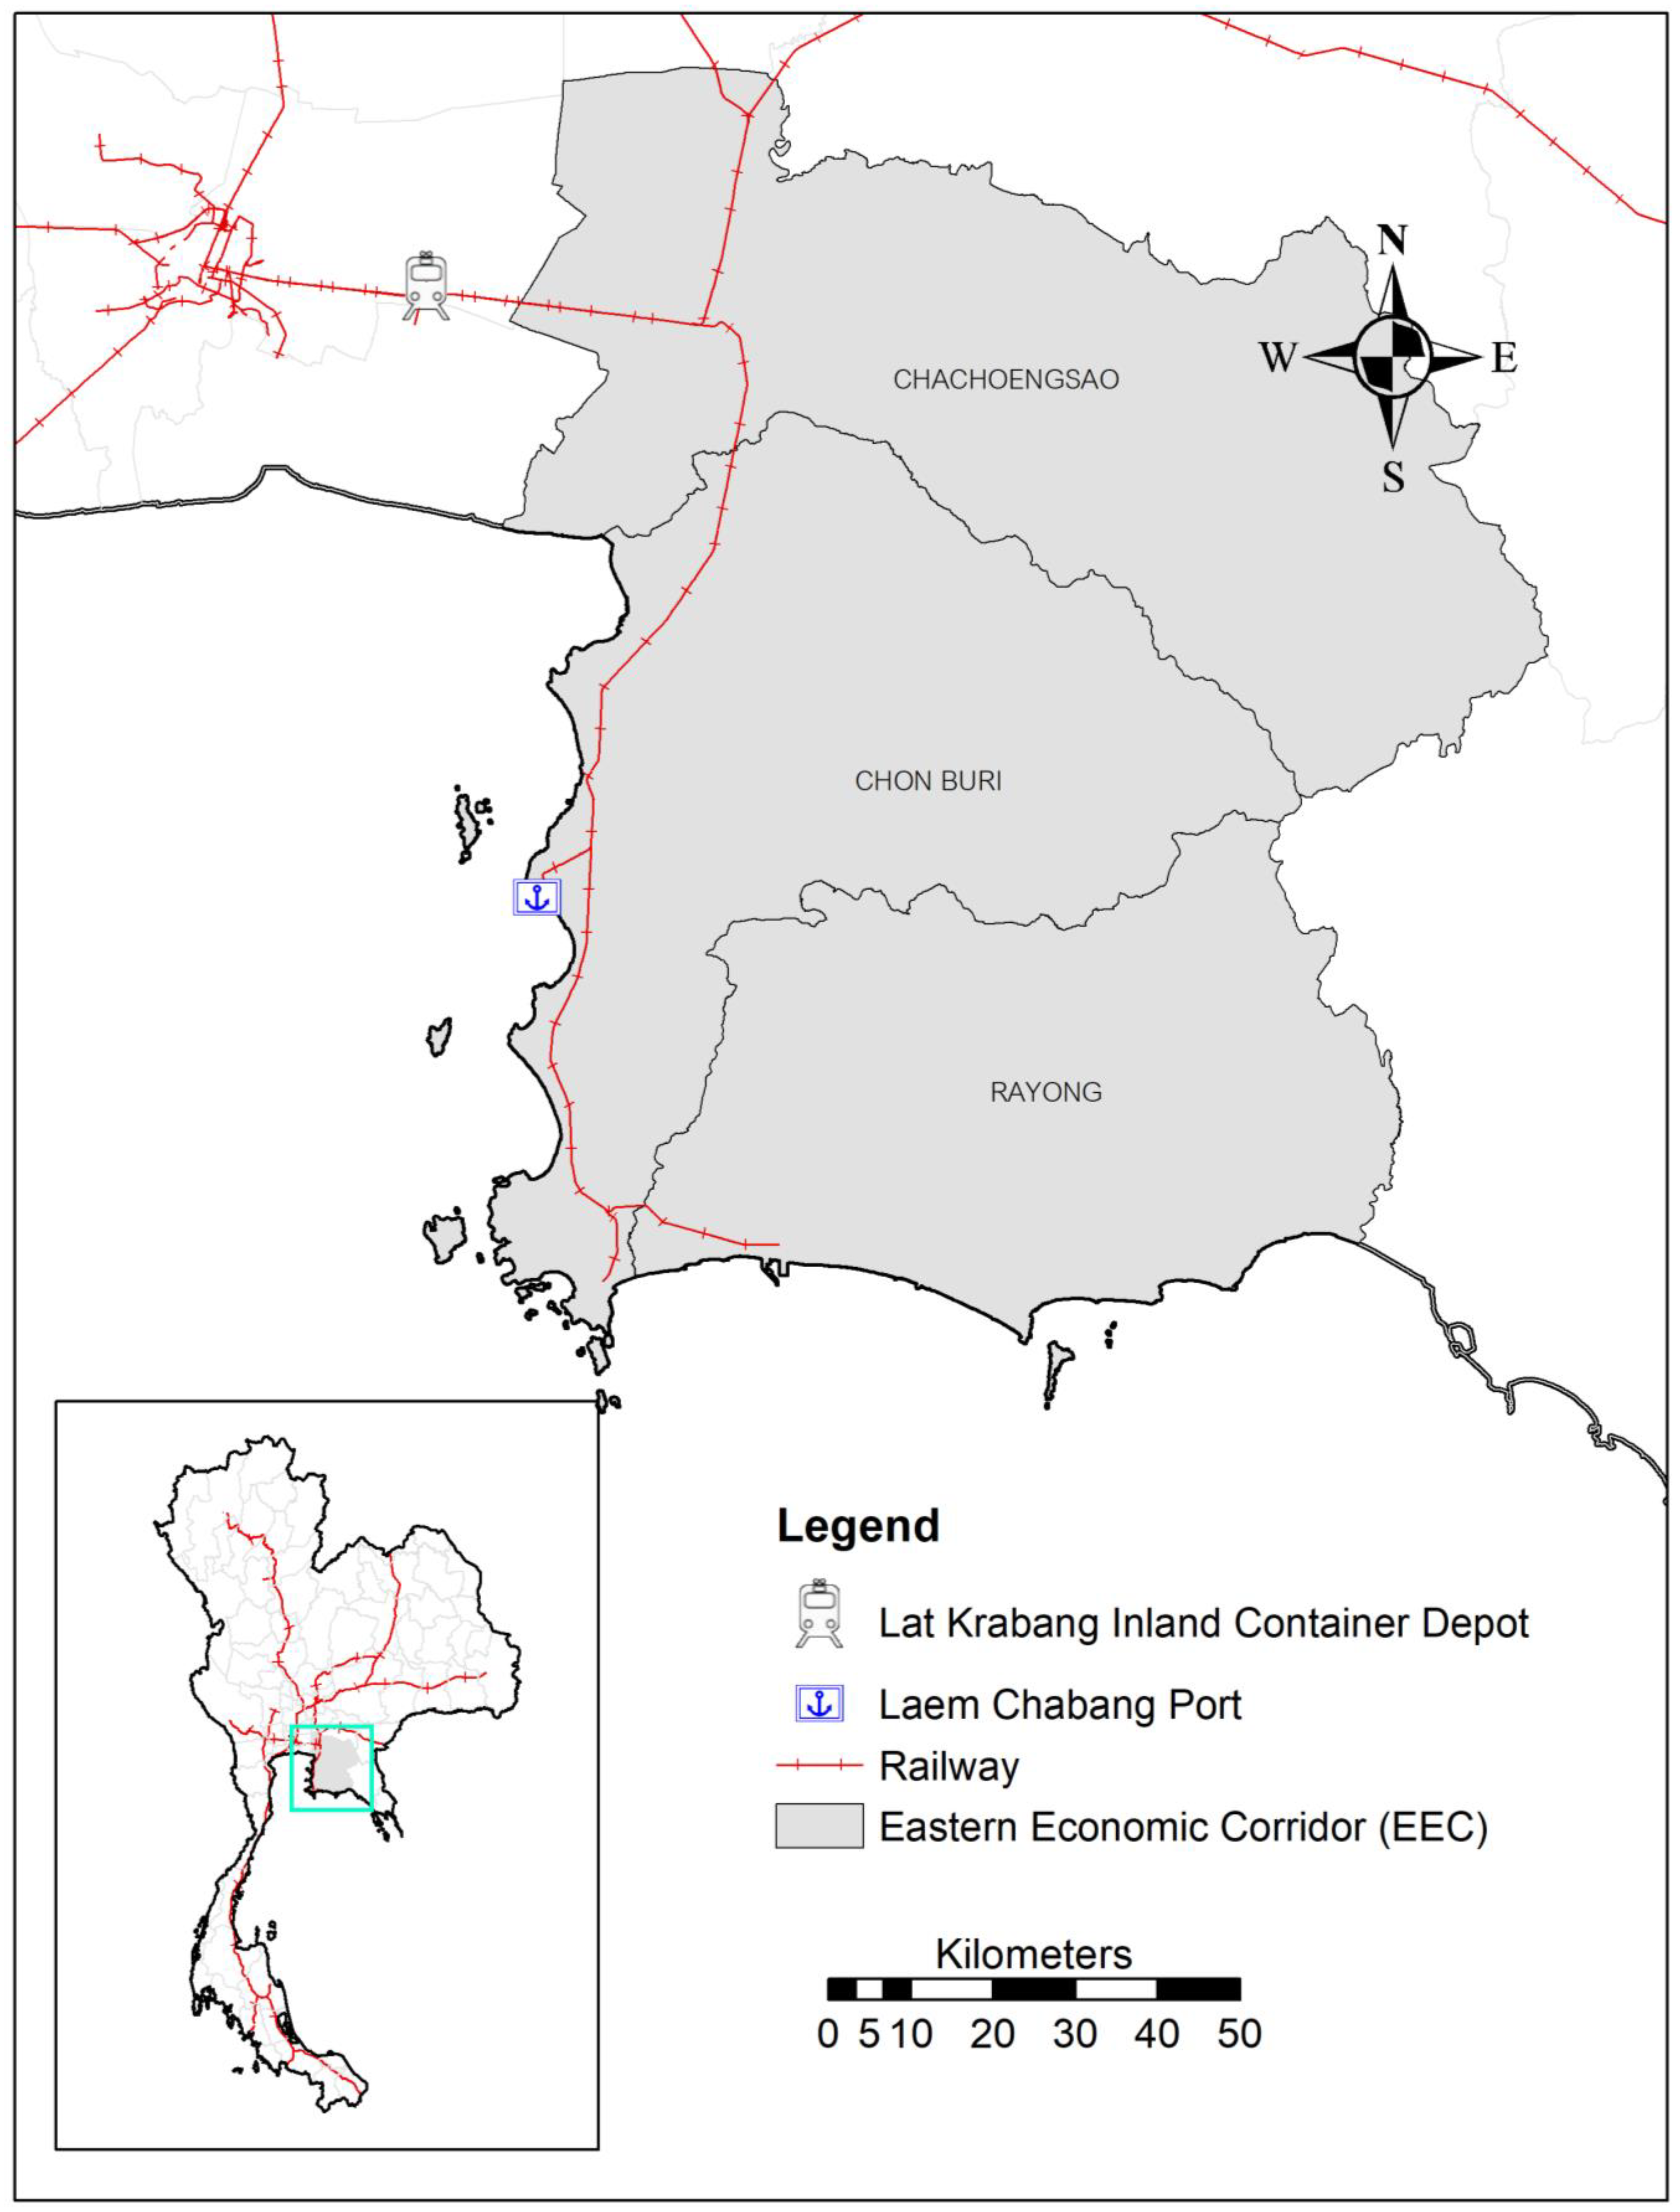
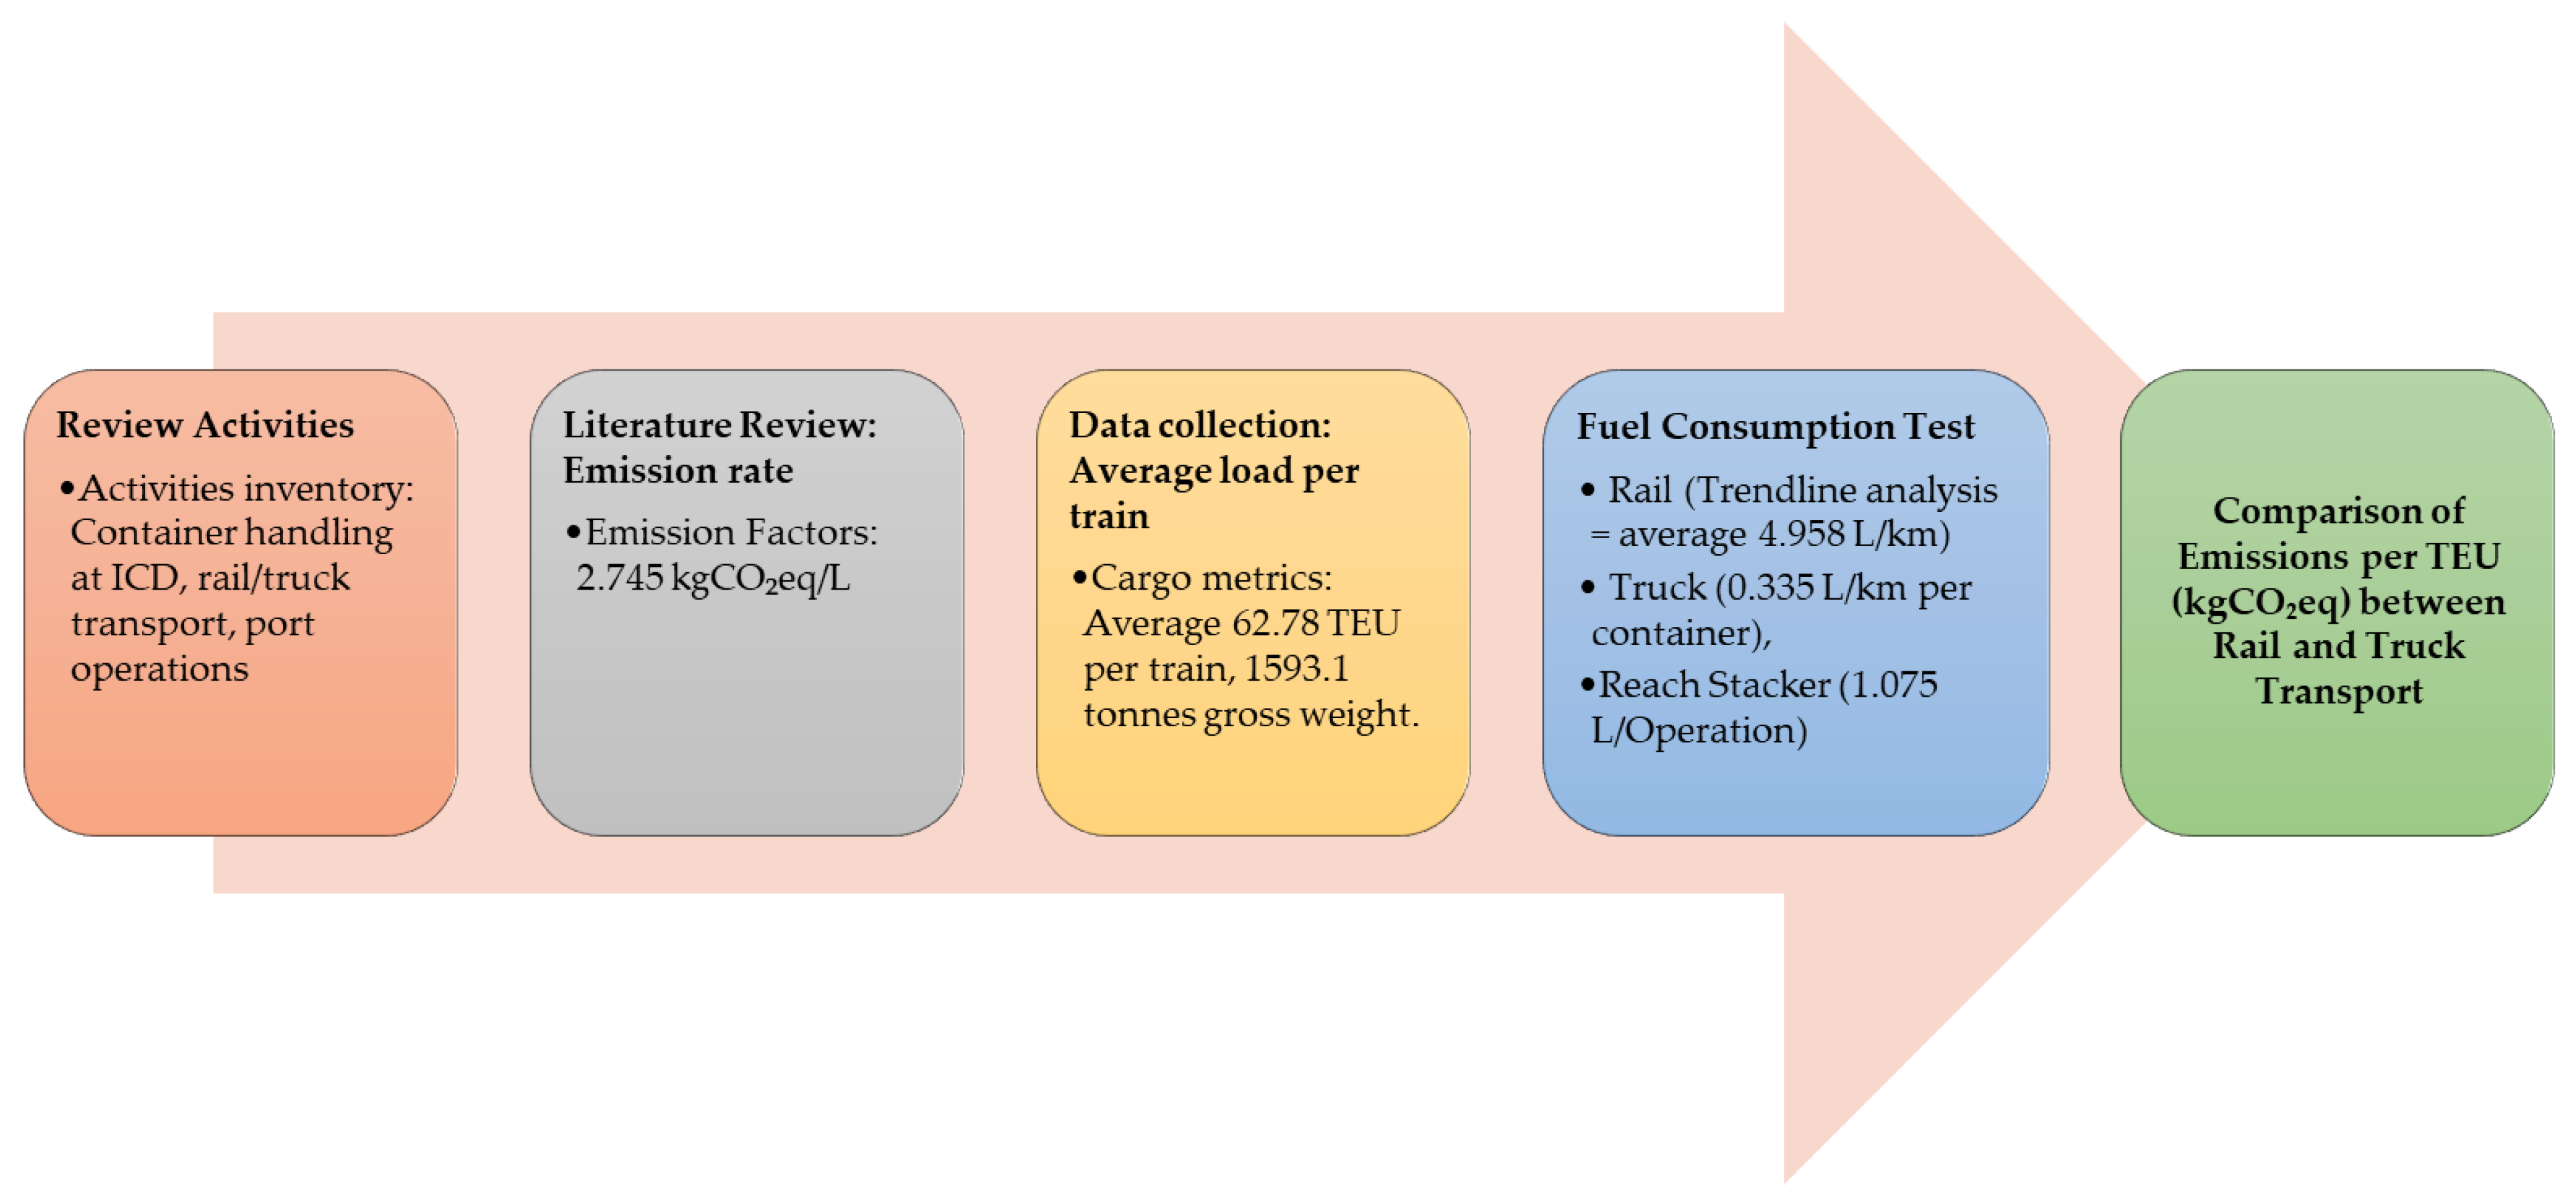
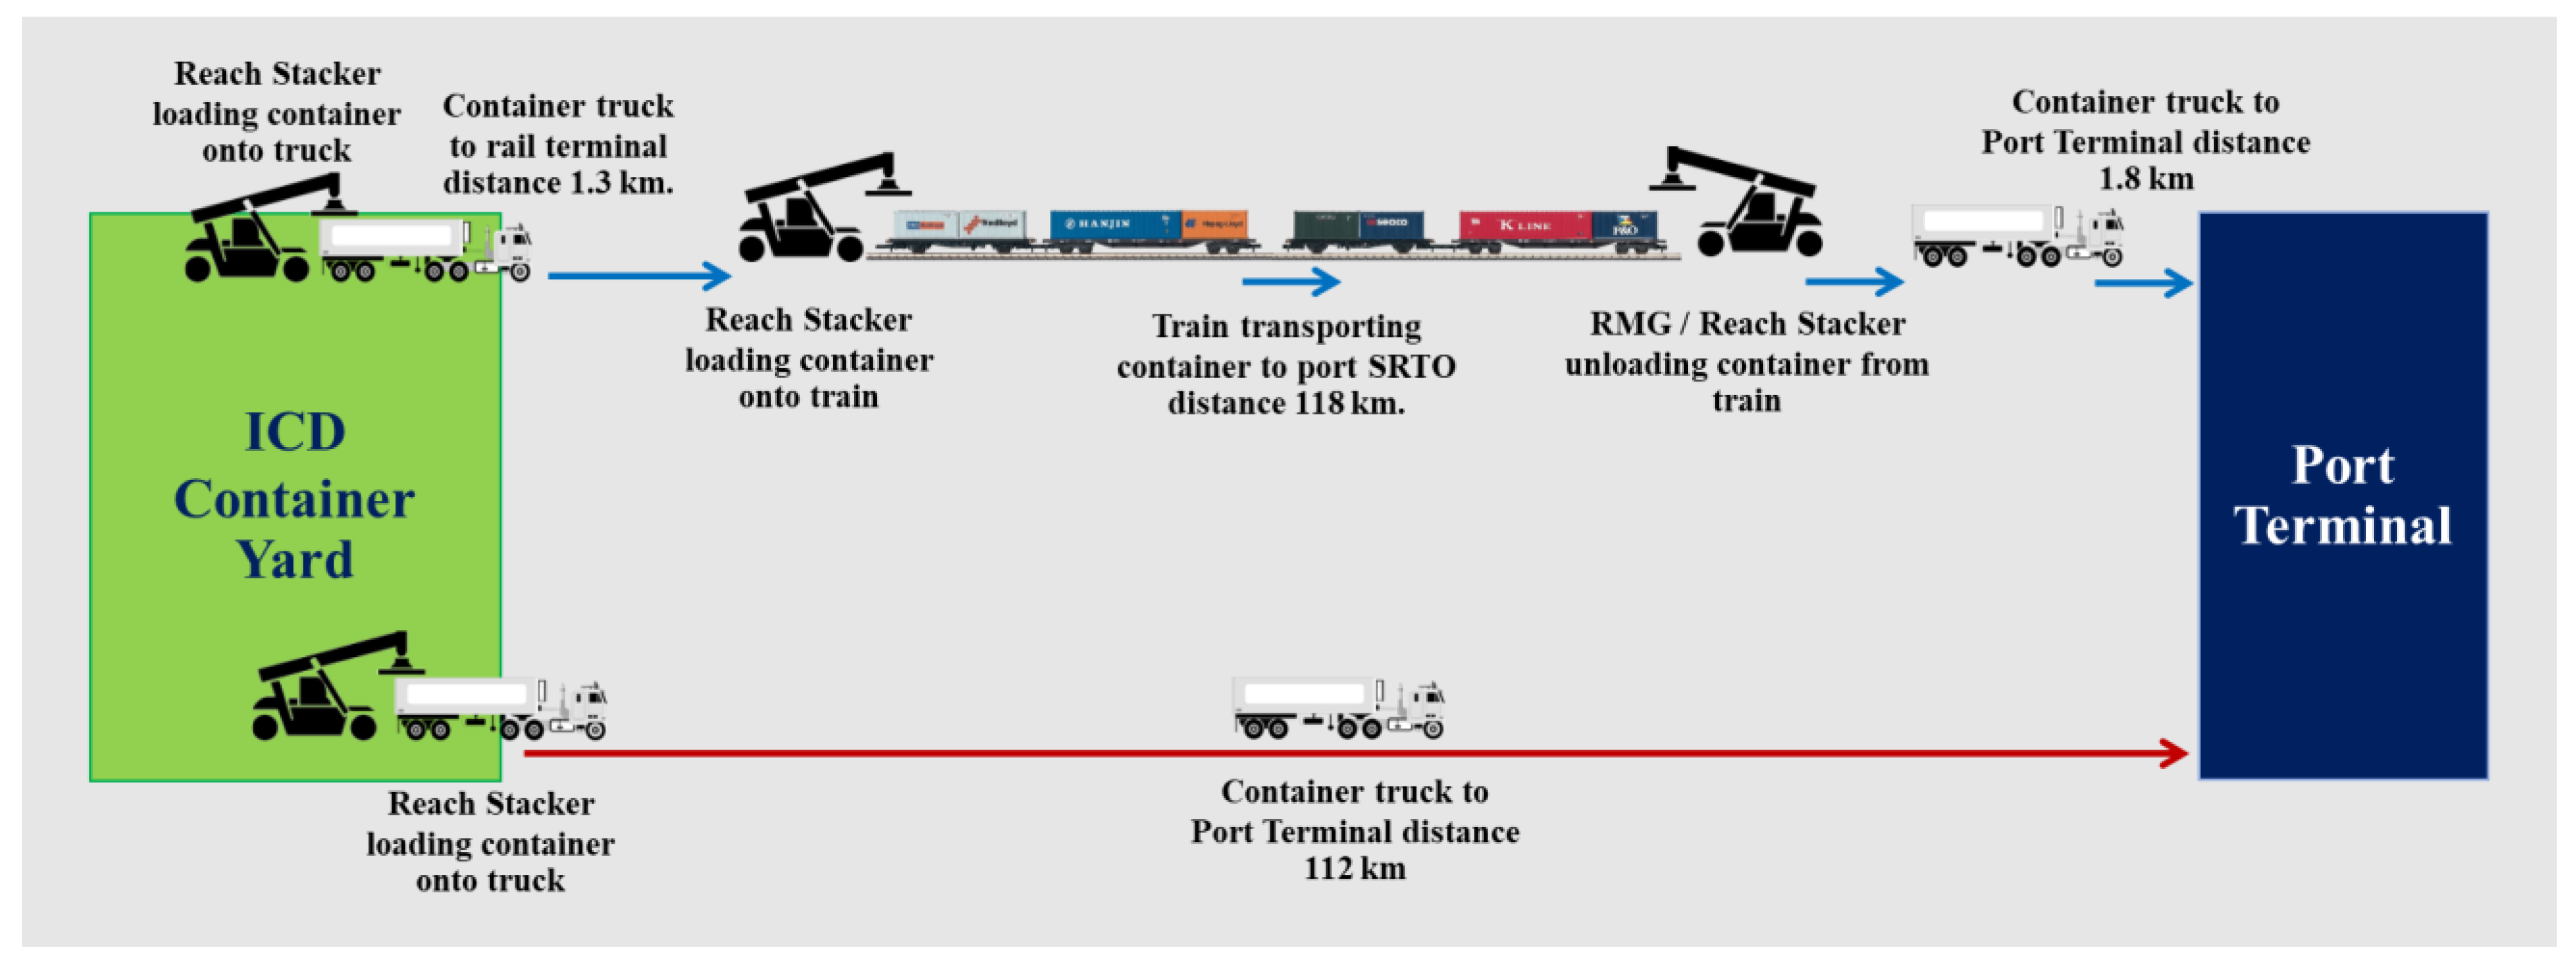

