2. Site Description and Preliminary Considerations
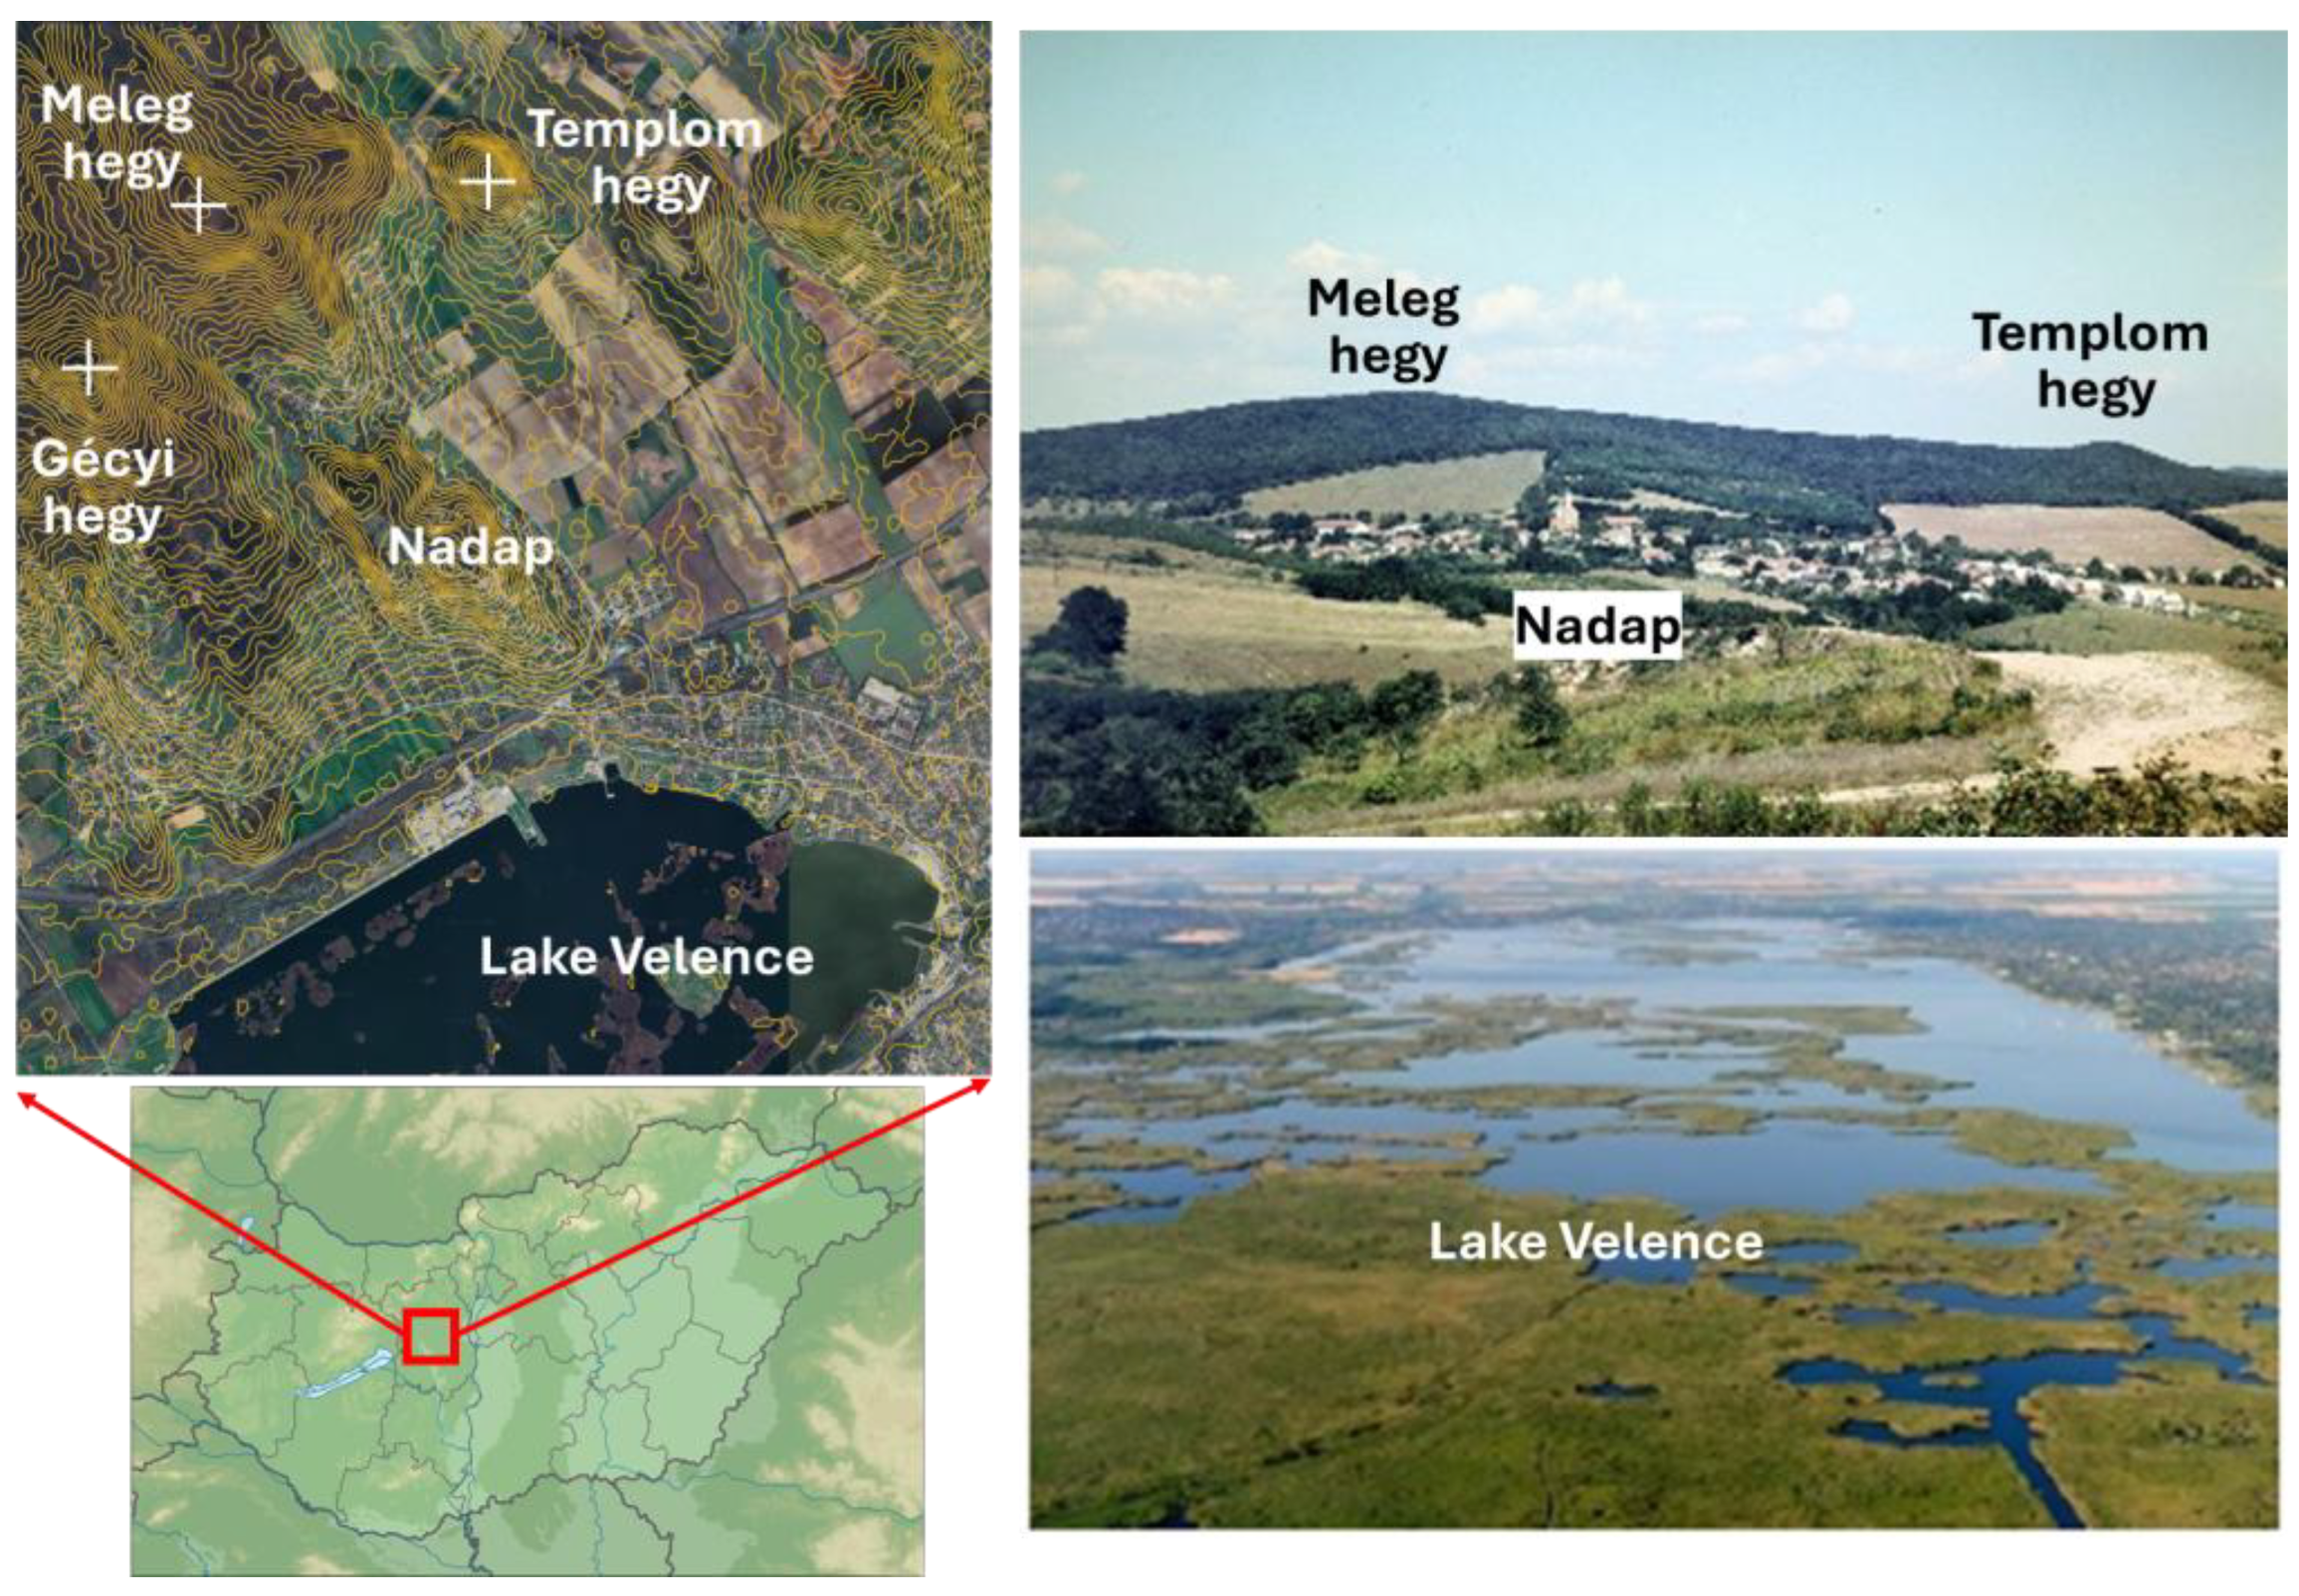
Lake Velence and its watershed are a remarkable and diverse region in Central Transdanubia, near Székesfehérvár, just 30 km southwest of Budapest (
Figure 1). Although the watershed covers a relatively small area of 602.3 km
2, it boasts a rich and varied water ecosystem [
48]. The landscape features both hilly and flat terrains, starting from the karst slopes of the Vértes Mountains and the Zámolyi Basin in the north, extending to the southern plains of Mezőföld and the Velencei Basin. Lake Velence is the central element of the area, located in the southern, low-lying part of the watershed, and covers 24.2 km
2 with a relatively shallow average water depth [
49]. It represents a distinctive category of saline water bodies characterized by the prevalence of Na+ ions alongside HCO
3− and CO
32− ions that foster specialized biogeochemical processes and support unique species [
50].
In the northern parts of the watershed, the presence of karst rock and porous soil allows for partial infiltration, thereby reducing surface runoff. The Velence Hills, among Hungary’s oldest and most stable mountain ranges, predominantly consist of Upper Carboniferous granite, with andesite volcanoes from the Upper Eocene found in the north-northeastern areas. Lake Velence is a shallow, ecologically unique saline lake that experiences significant evaporation losses—even exceeding 40% of its water resources—during the summer months, making it a challenging part of the watershed with high economic importance. About 60% of the evaporation loss is recovered from direct rain over the lake and about 35% is recovered by inflow from the catchment over the year. The remaining amount is partially derived from groundwater or is missing from the water budget. Climate change is likely to exacerbate summer droughts in the coming decades, leading to increased evaporation rates and further depletion of the lake’s water level and resources, which will impact the surrounding lakeshore communities [
51].
The National Elevation Base Point is located in Nadap and represents the primary reference point for elevation measurements in this stable geological area. Nadap lies approximately 2 km north of the lake, at the foot of Meleg hegy, El 352 m, located between Templom hegy (El 320 m) and Géczi hegy (El 242 m) [
52]. The center of the settlement is between 189 and 200 m above sea level, about 90 to 95 m above the water level of Lake Velence.
Despite its small size (inland and outlying areas: 6.9 km2), Nadap features a significant elevation change of over 80 m, ranging from 149 m to 232 m. In contrast, the elevation difference in the outlying areas reaches approximately 200 m, with heights ranging from 125 m to 320 m. A large portion of Nadap consists of sloping terrain, with gradients of 5% or more, and many areas exhibit slopes greater than 10%, with some exceeding 15%.
In addition to these steep slopes, several smaller, plateau-like areas within the settlement’s administrative boundaries are relatively flat and suitable for implementing water retention measures and reservoirs.
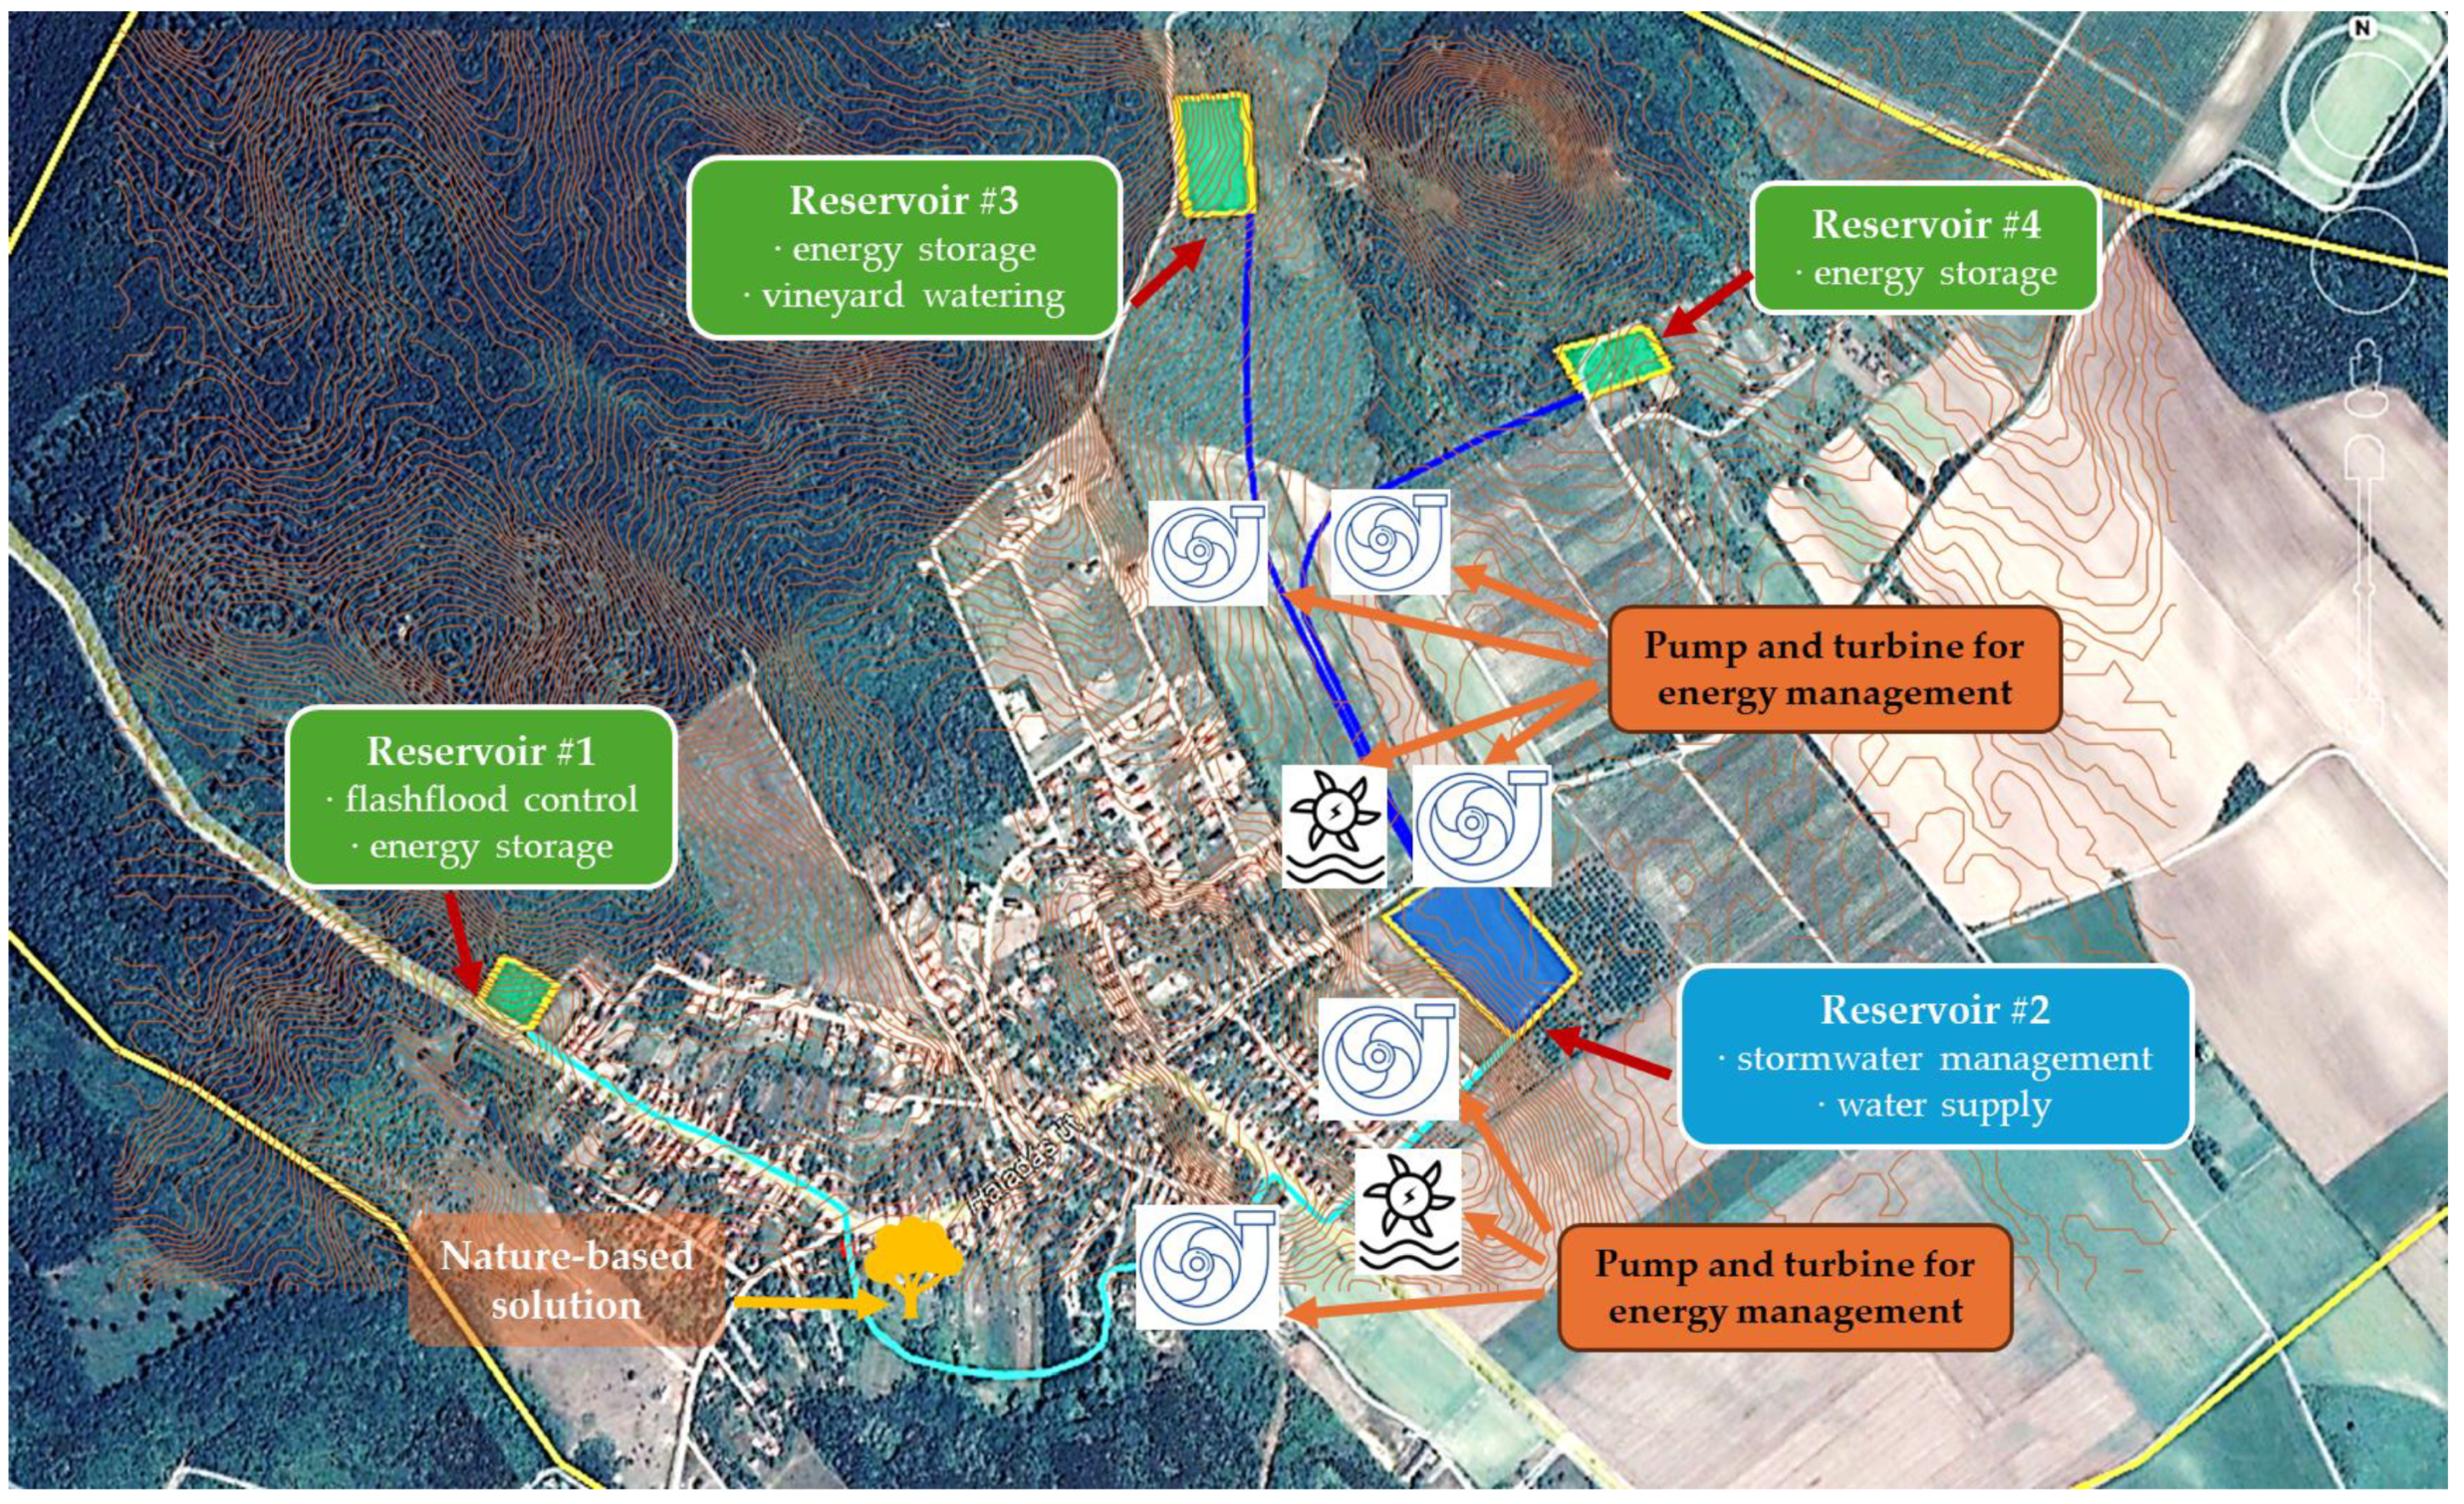
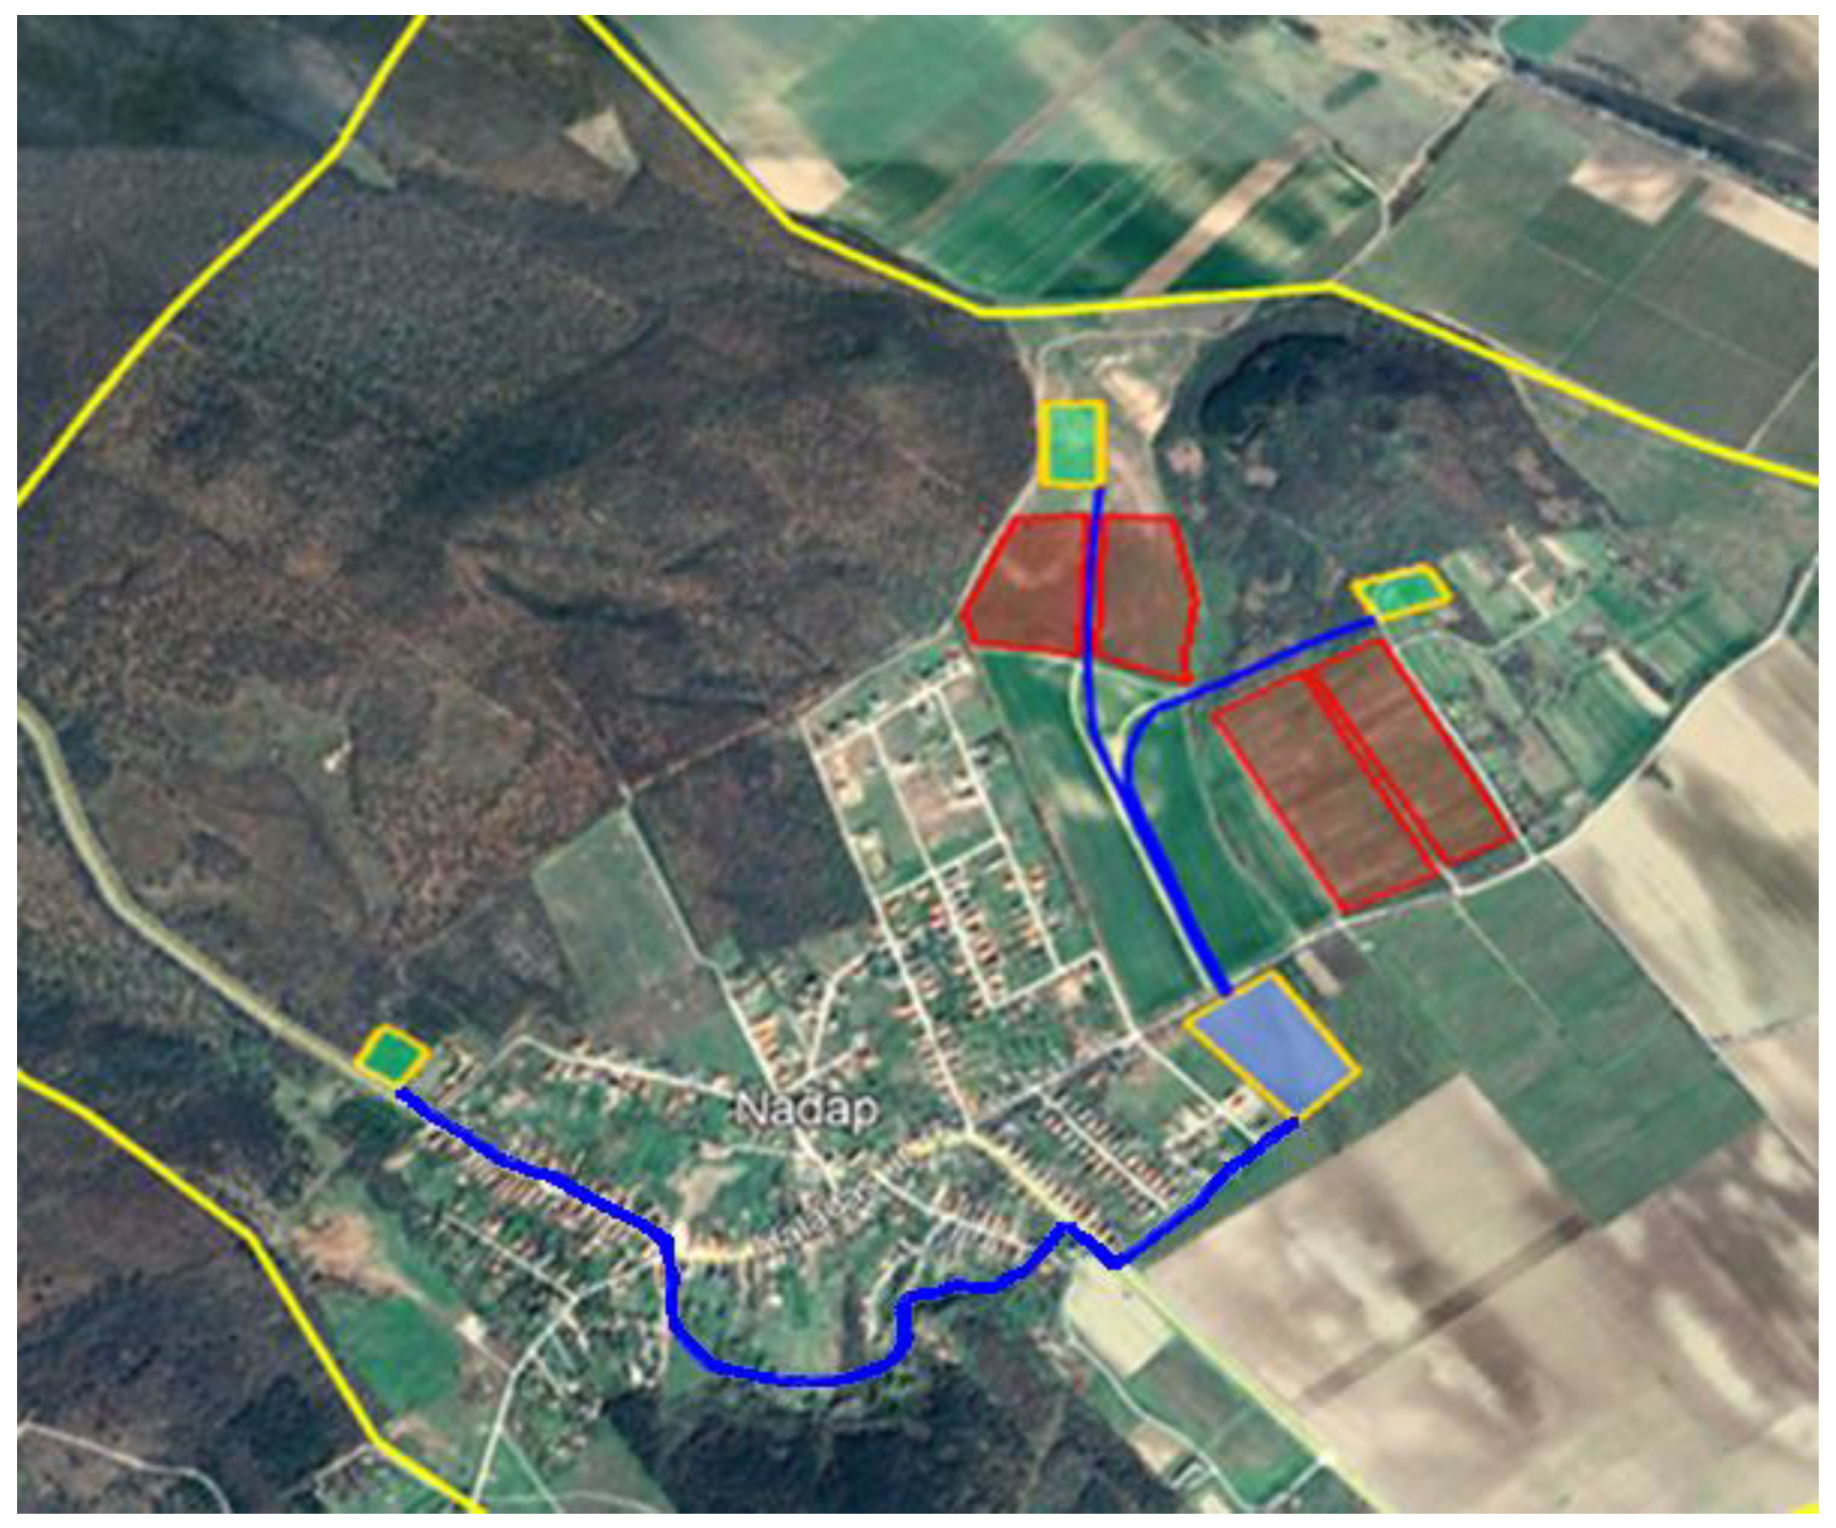
Figure 2 illustrates some of these geographically, ecologically, and economically viable locations for water retention.
2.1. Reservoir Locations
The planned reservoirs share a star topology and form a comprehensive network that meets the needs of various water users, encompassing water, energy, and ecological aspects. There are four reservoirs of significant size and two smaller supplementary ponds with water volumes of up to a few hundred cubic meters, used for environmental, recreational, and hydrodynamic purposes. These two ponds support the increase in biodiversity and establish expansive blue-green corridors within the settlement.
Reservoir 2, as marked in
Figure 2, is the lowest, while Reservoirs 1, 3, and 4 occupy higher elevations. The upper reservoirs represent the potential energy storage of the pumped hydro-energy storage system, and their combined water-retaining capacity is roughly identical to that of the lower reservoir (Reservoir 2).
Table 1 summarizes the geographical data and planned functions of the reservoirs.
Since the storage volume of Lower Reservoir 2 is nearly identical to the combined volume of the three upper reservoirs (Reservoirs 1, 3, and 4), a pumped storage system can operate in a closed-loop configuration [
53]. Water replenishment from stormwater helps compensate for evaporation losses while serving irrigation and other water-related needs. The upper Reservoir 1 protects the settlement from sudden flash floods during storms. Reservoir 2 collects and utilizes water that drains by gravity through the stormwater network, primarily from runoff within the settlement. These functions are integral to the reservoirs’ design.
The two-way flow connection between the reservoirs enables both pumping and turbine modes, allowing for energy storage through buried pipes. A crucial initial step is to map social and economic water needs to determine the locations and functions of the reservoirs [
54]. The design incorporates adaptation and mitigation measures in response to climate change, which can provide co-benefits [
55]. One of the design considerations is the placement of the buried pipe network to maintain a constant temperature, reducing hydrodynamic losses and improving flow efficiency, especially during the critical winter period [
56]. In addition, the lower pipe temperature can reduce the risk of waterhammer, which is notable in PHES at switching points, as well as the risk of cavitation, thereby mitigating damage risk [
57].
The reservoirs’ locations and the needs of stakeholders defined their different secondary functions. Reservoir 1 borders a landscape protection area and a newly established hunting and wildlife park, where water from the reservoir can mitigate the negative impacts of summer droughts on wildlife [
58]. This area can also serve as a unique educational and recreational attraction, allowing visitors to observe large animals from a lookout point, even at night. In contrast, the surroundings of Reservoirs 3 and 4—primarily at lower altitudes—are home to plant cultivations and vineyards, providing essential irrigation and wine-related functions. The higher elevations of the reservoirs’ bottom levels enable sustainable water extraction for irrigation, allowing water to flow by gravity to critical areas.
2.2. Settlement Growth and Solar Additions
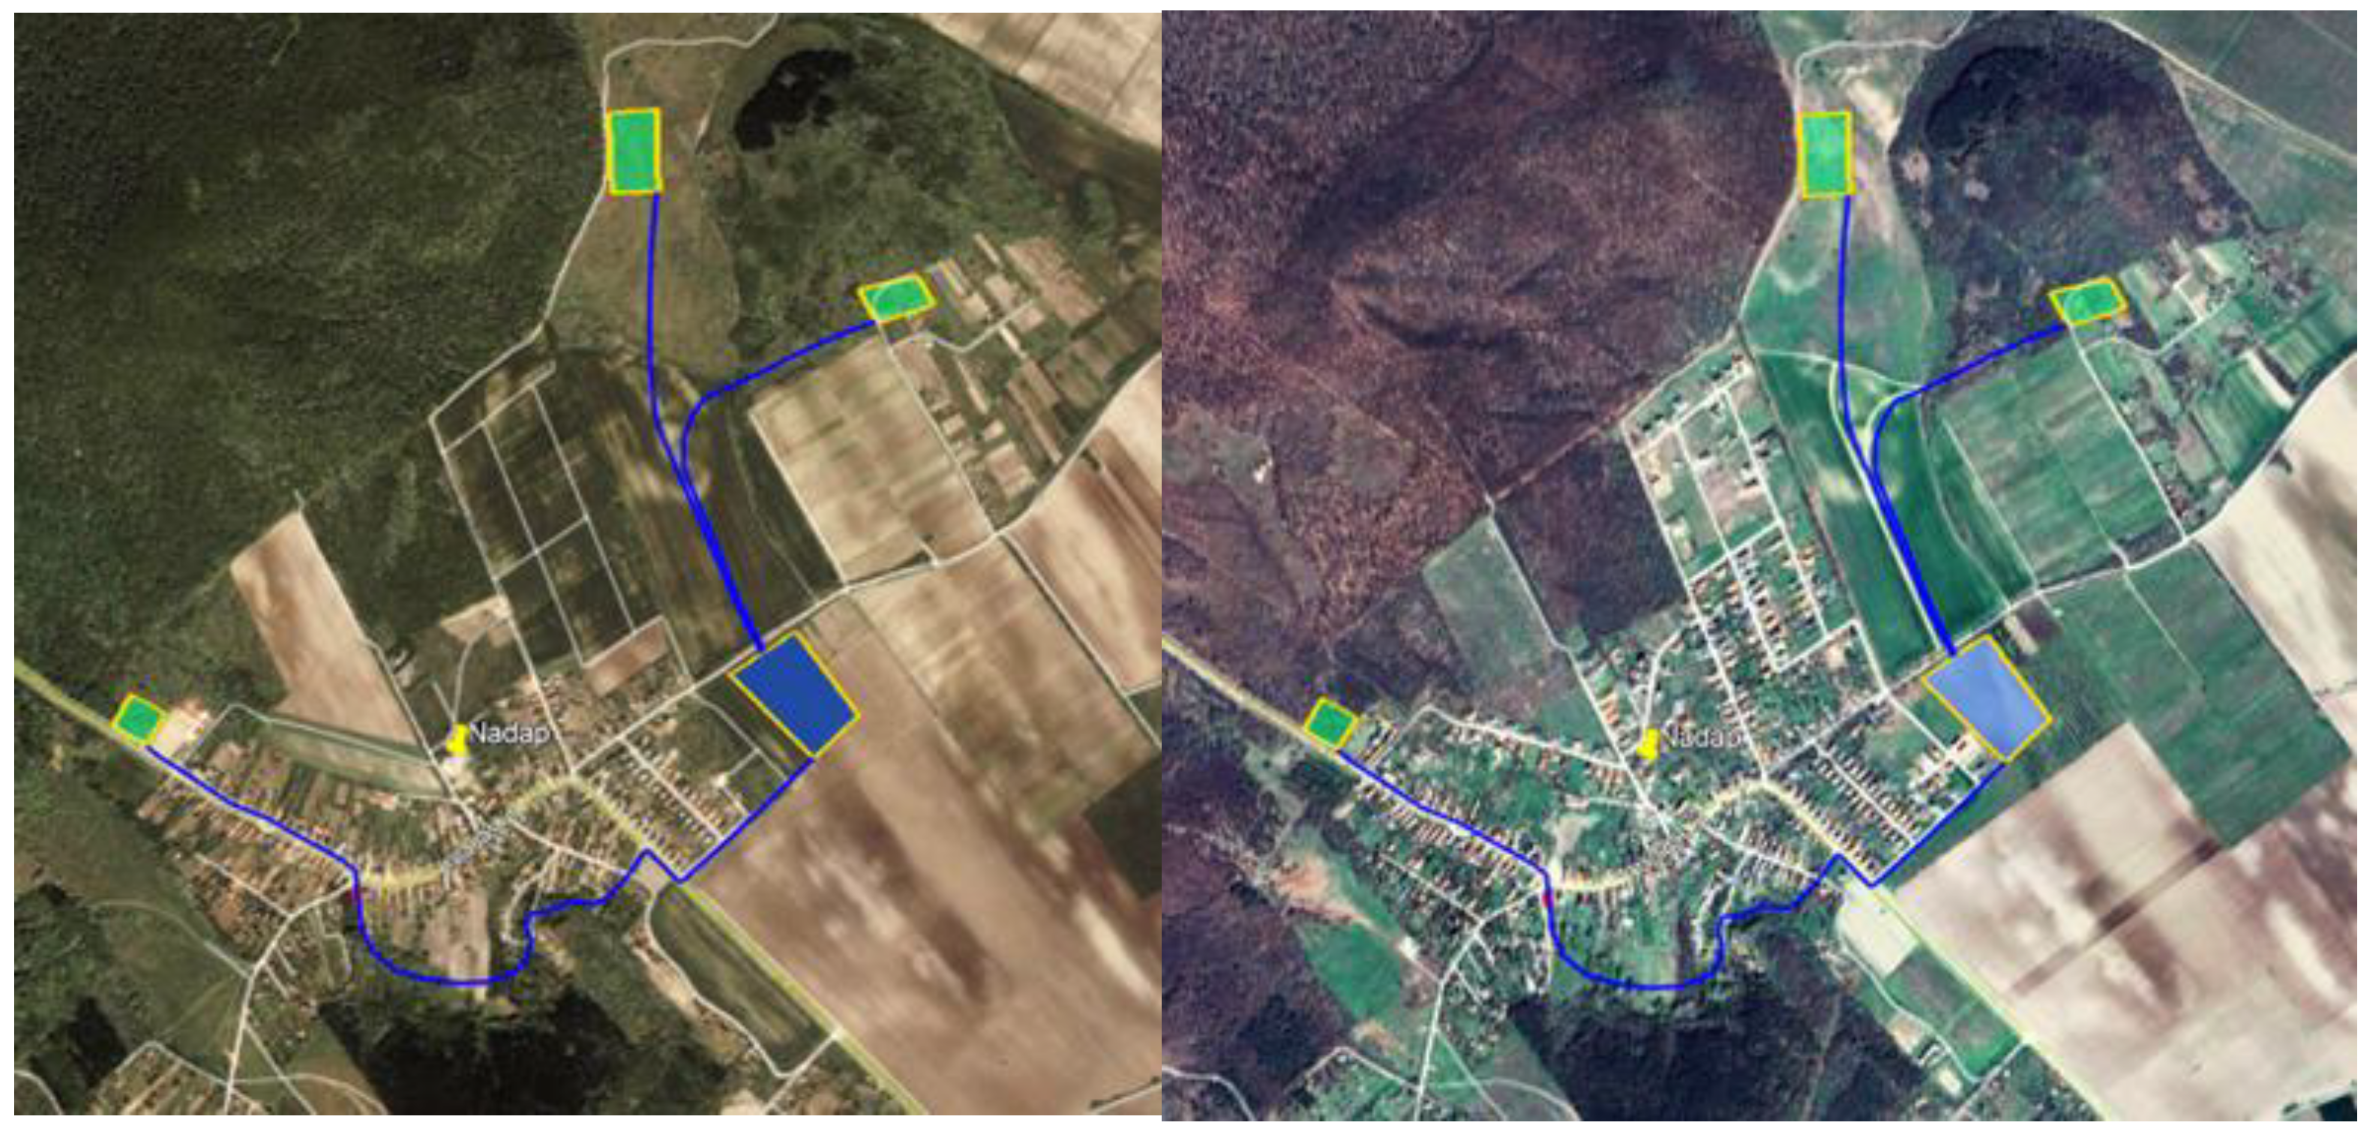
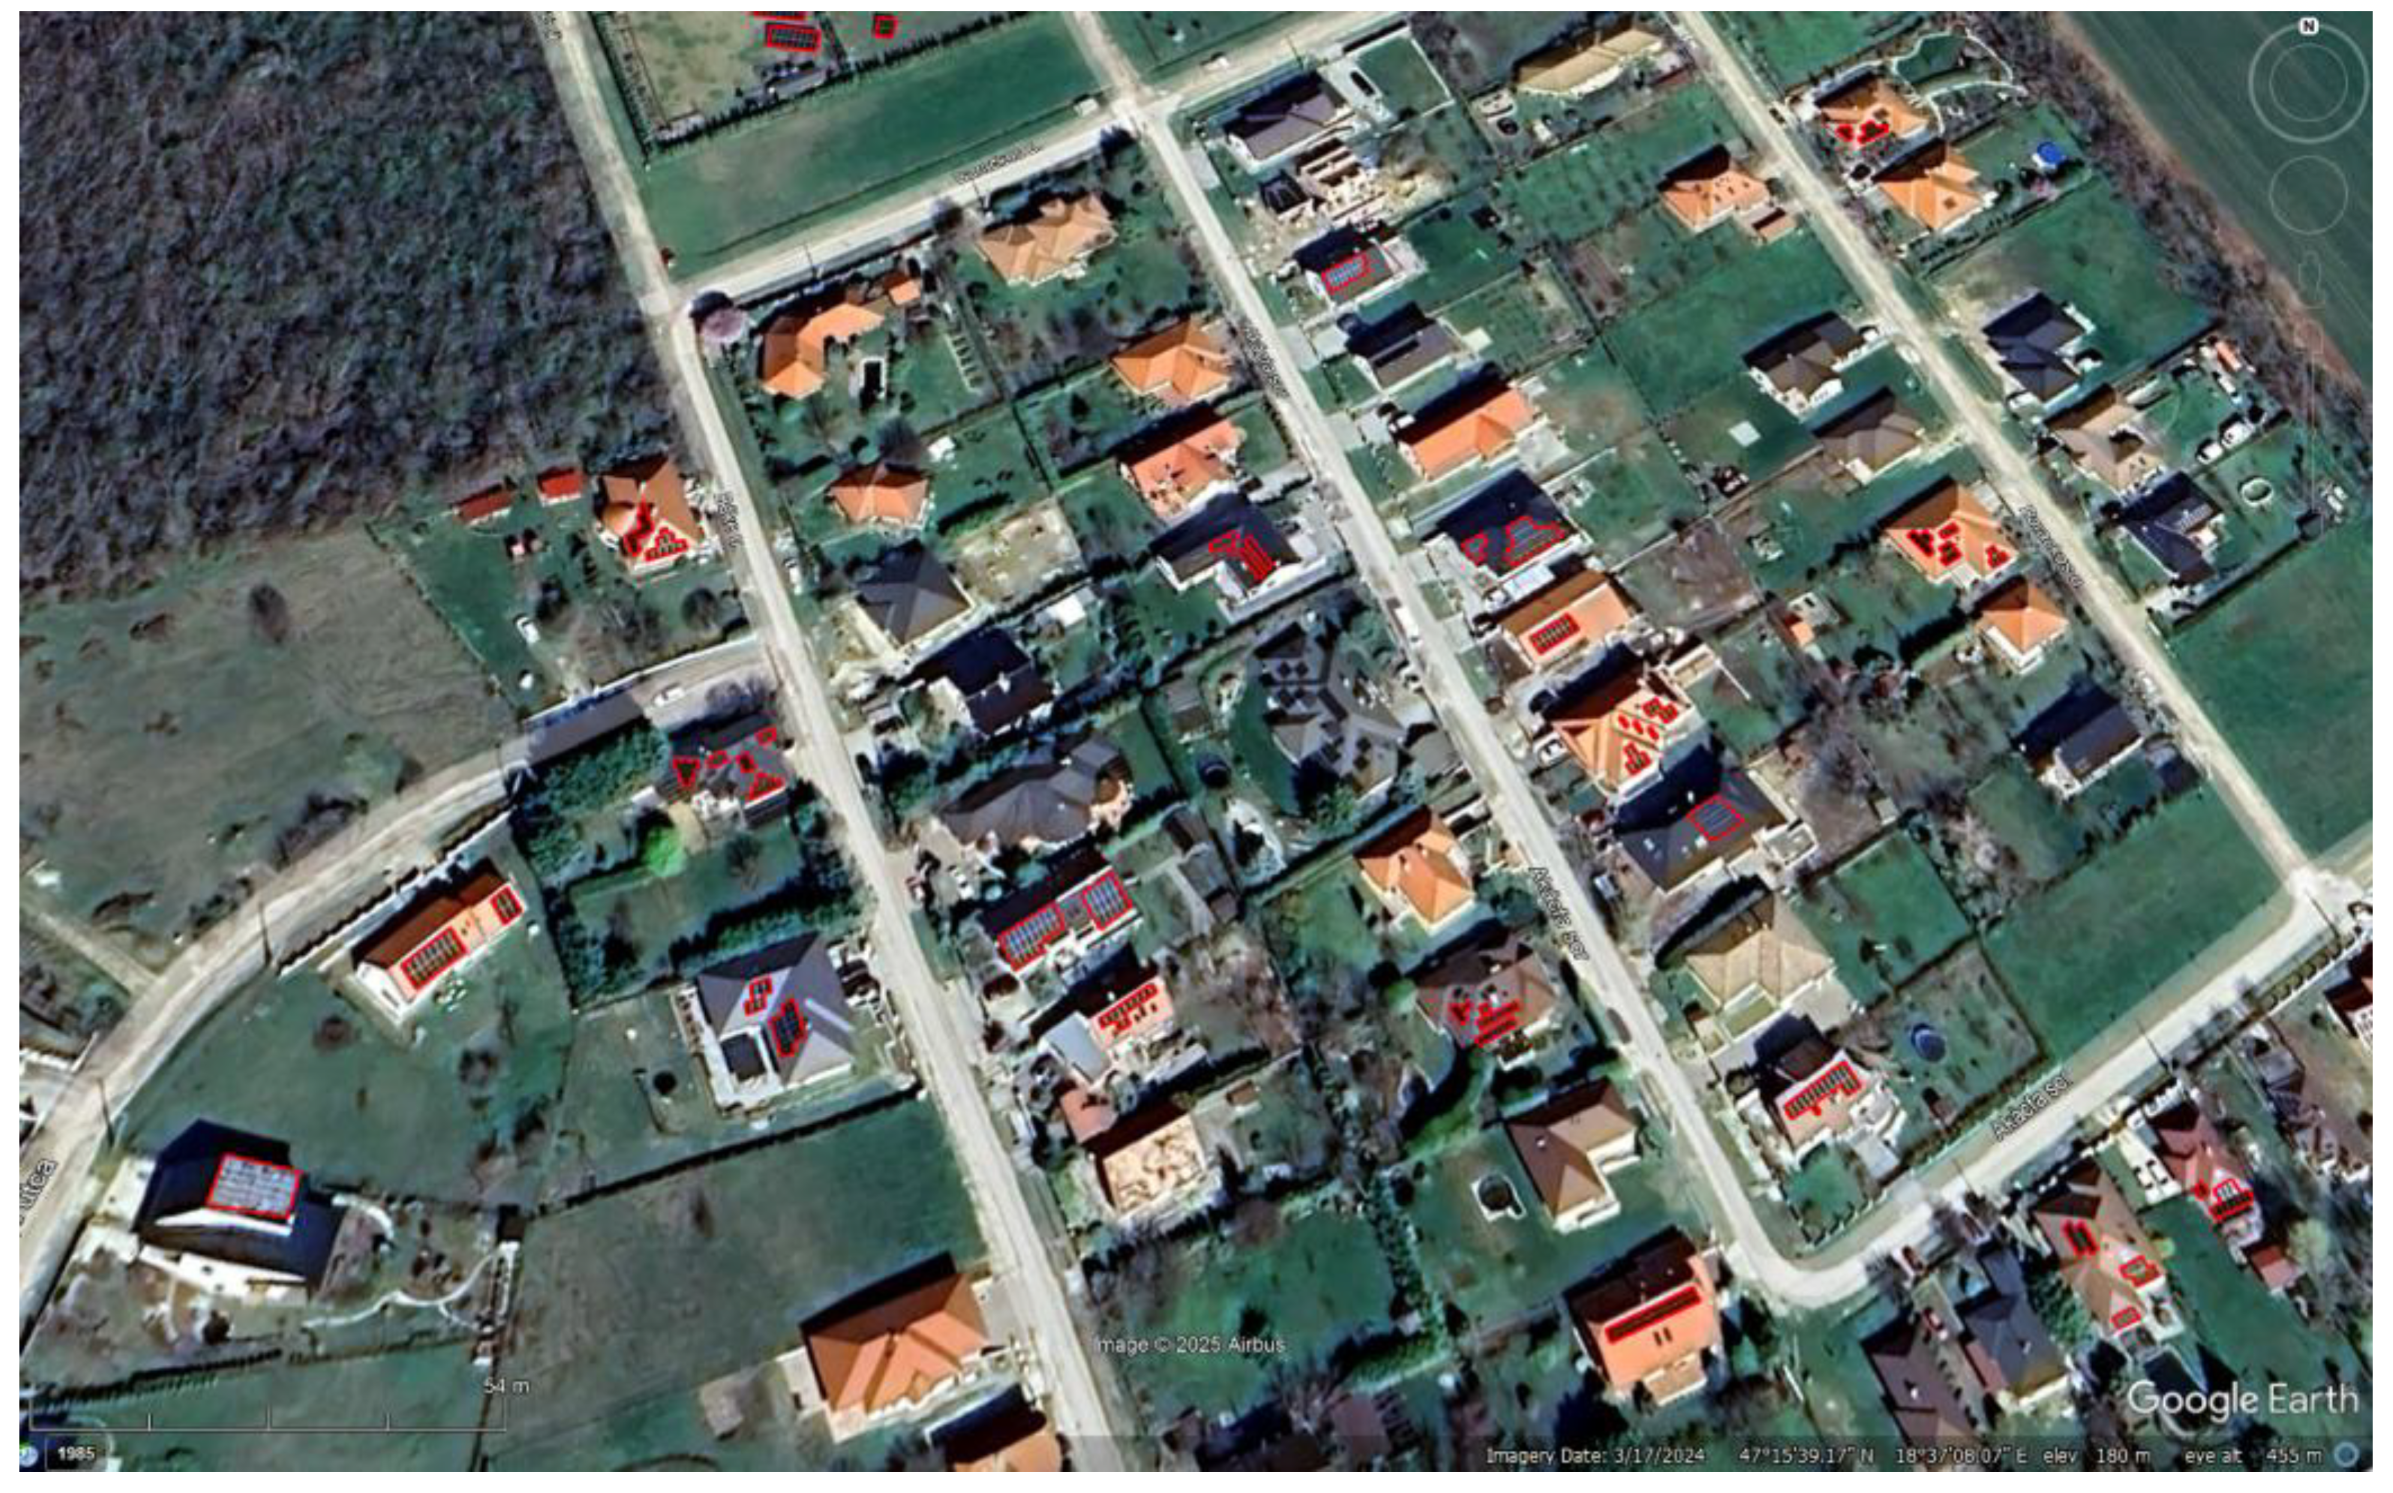
The settlement’s proximity to major cities and the picturesque lakeshore and hilly landscape have contributed to its popularity among residents and visitors around Lake Velence. Transportation infrastructure development, including highways and railways, has led to a significant wave of settlement in recent decades, resulting in extensive transformations in Nadap (as shown in
Figure 3).
As a result, the population has more than doubled since 1997 [
59]. The average residential income in the area is in the top quintile of the national average. These factors have contributed to significant positive changes, leading Nadap to become the highest-ranked settlement in Hungary for solar panel installations by 2022, with 60 out of 285 houses (21%) equipped with solar panels. Solar panel installations are expected to rise sharply in the coming years, as new real estate developments incorporate them by default, further boosting Nadap’s renewable energy production capacity.
The annual solar energy production matches the settlement’s electricity demand, excluding heating energy [
60]. However, solar energy production fluctuates throughout the day and over seasons due to variations in solar irradiation, which often does not align with consumption patterns, especially over seasons. Summers result in a significant surplus of solar production, while winters result in higher electricity consumption due to heating needs and longer periods of darkness. An energy storage system can address these discrepancies between production and consumption.
Given the high number of solar panels per capita in Nadap and its hilly terrain, implementing a hydropower storage system could provide a self-sustaining off-grid operation. This sustainable approach not only ensures a safe and reliable electricity supply but also reduces carbon emissions by minimizing reliance on fossil fuels and may provide various water-related co-benefits.
Several factors make Nadap particularly well suited for successfully implementing hydro-energy storage: a high ratio of roof-mounted solar panels, considerable elevation differences, available reservoir space, cooperative stakeholders, and supportive local leadership.
3. Materials and Methods
In this study, we developed a straightforward methodology for implementing small-scale pumped hydro energy storage (PHES) systems in hilly settlements. Local solar panels provide electricity for pumping, while stormwater retention and management methods supply the necessary water. Municipalities with favorable geographical conditions can utilize this approach to pre-plan and design PHES, factoring in the economic value of co-benefits, secondary opportunities, social needs, welfare considerations, and environmental protection, all of which align with climate adaptation goals.
A PHES system consists of upper and lower reservoirs, pump–turbine units, pipe networks, an energy supply, and a control system. Linear models simulate hydrology, irrigation, reservoir allocation, solar energy production, water demand, and electricity consumption. Modeling pipe flow and pump operation requires nonlinear approaches, as these processes follow mass and energy conservation equations and head-loss relationships that exhibit nonlinear behavior [
61]. Our method combines optimized linear equations with a MATLAB-based fsolve and iterative solver for nonlinear hydraulics using Darcy-Weisbach friction factor solver in the Colebrook-White equation for varying connecting pipe diameters [
62], enabling multi-objective optimization to balance water distribution and cost–benefit trade-offs among PHES water users [
63]. Water balance optimization is a water resource allocation driven by the needs of water users, including irrigation, watering, and technology, in line with surplus energy from solar energy production and forward-looking considerations of future hydropower usage and electricity needs.
3.1. Pumping and Pipeline System
In pressurized pipeline systems, pump-driven water movement is the largest operating cost. The MATLAB solver minimizes head loss and energy consumption while also reducing maintenance costs by minimizing pump switching [
64]. Frequent switching accelerates wear, increases the risk of water hammer, and prolongs low-efficiency start-up periods [
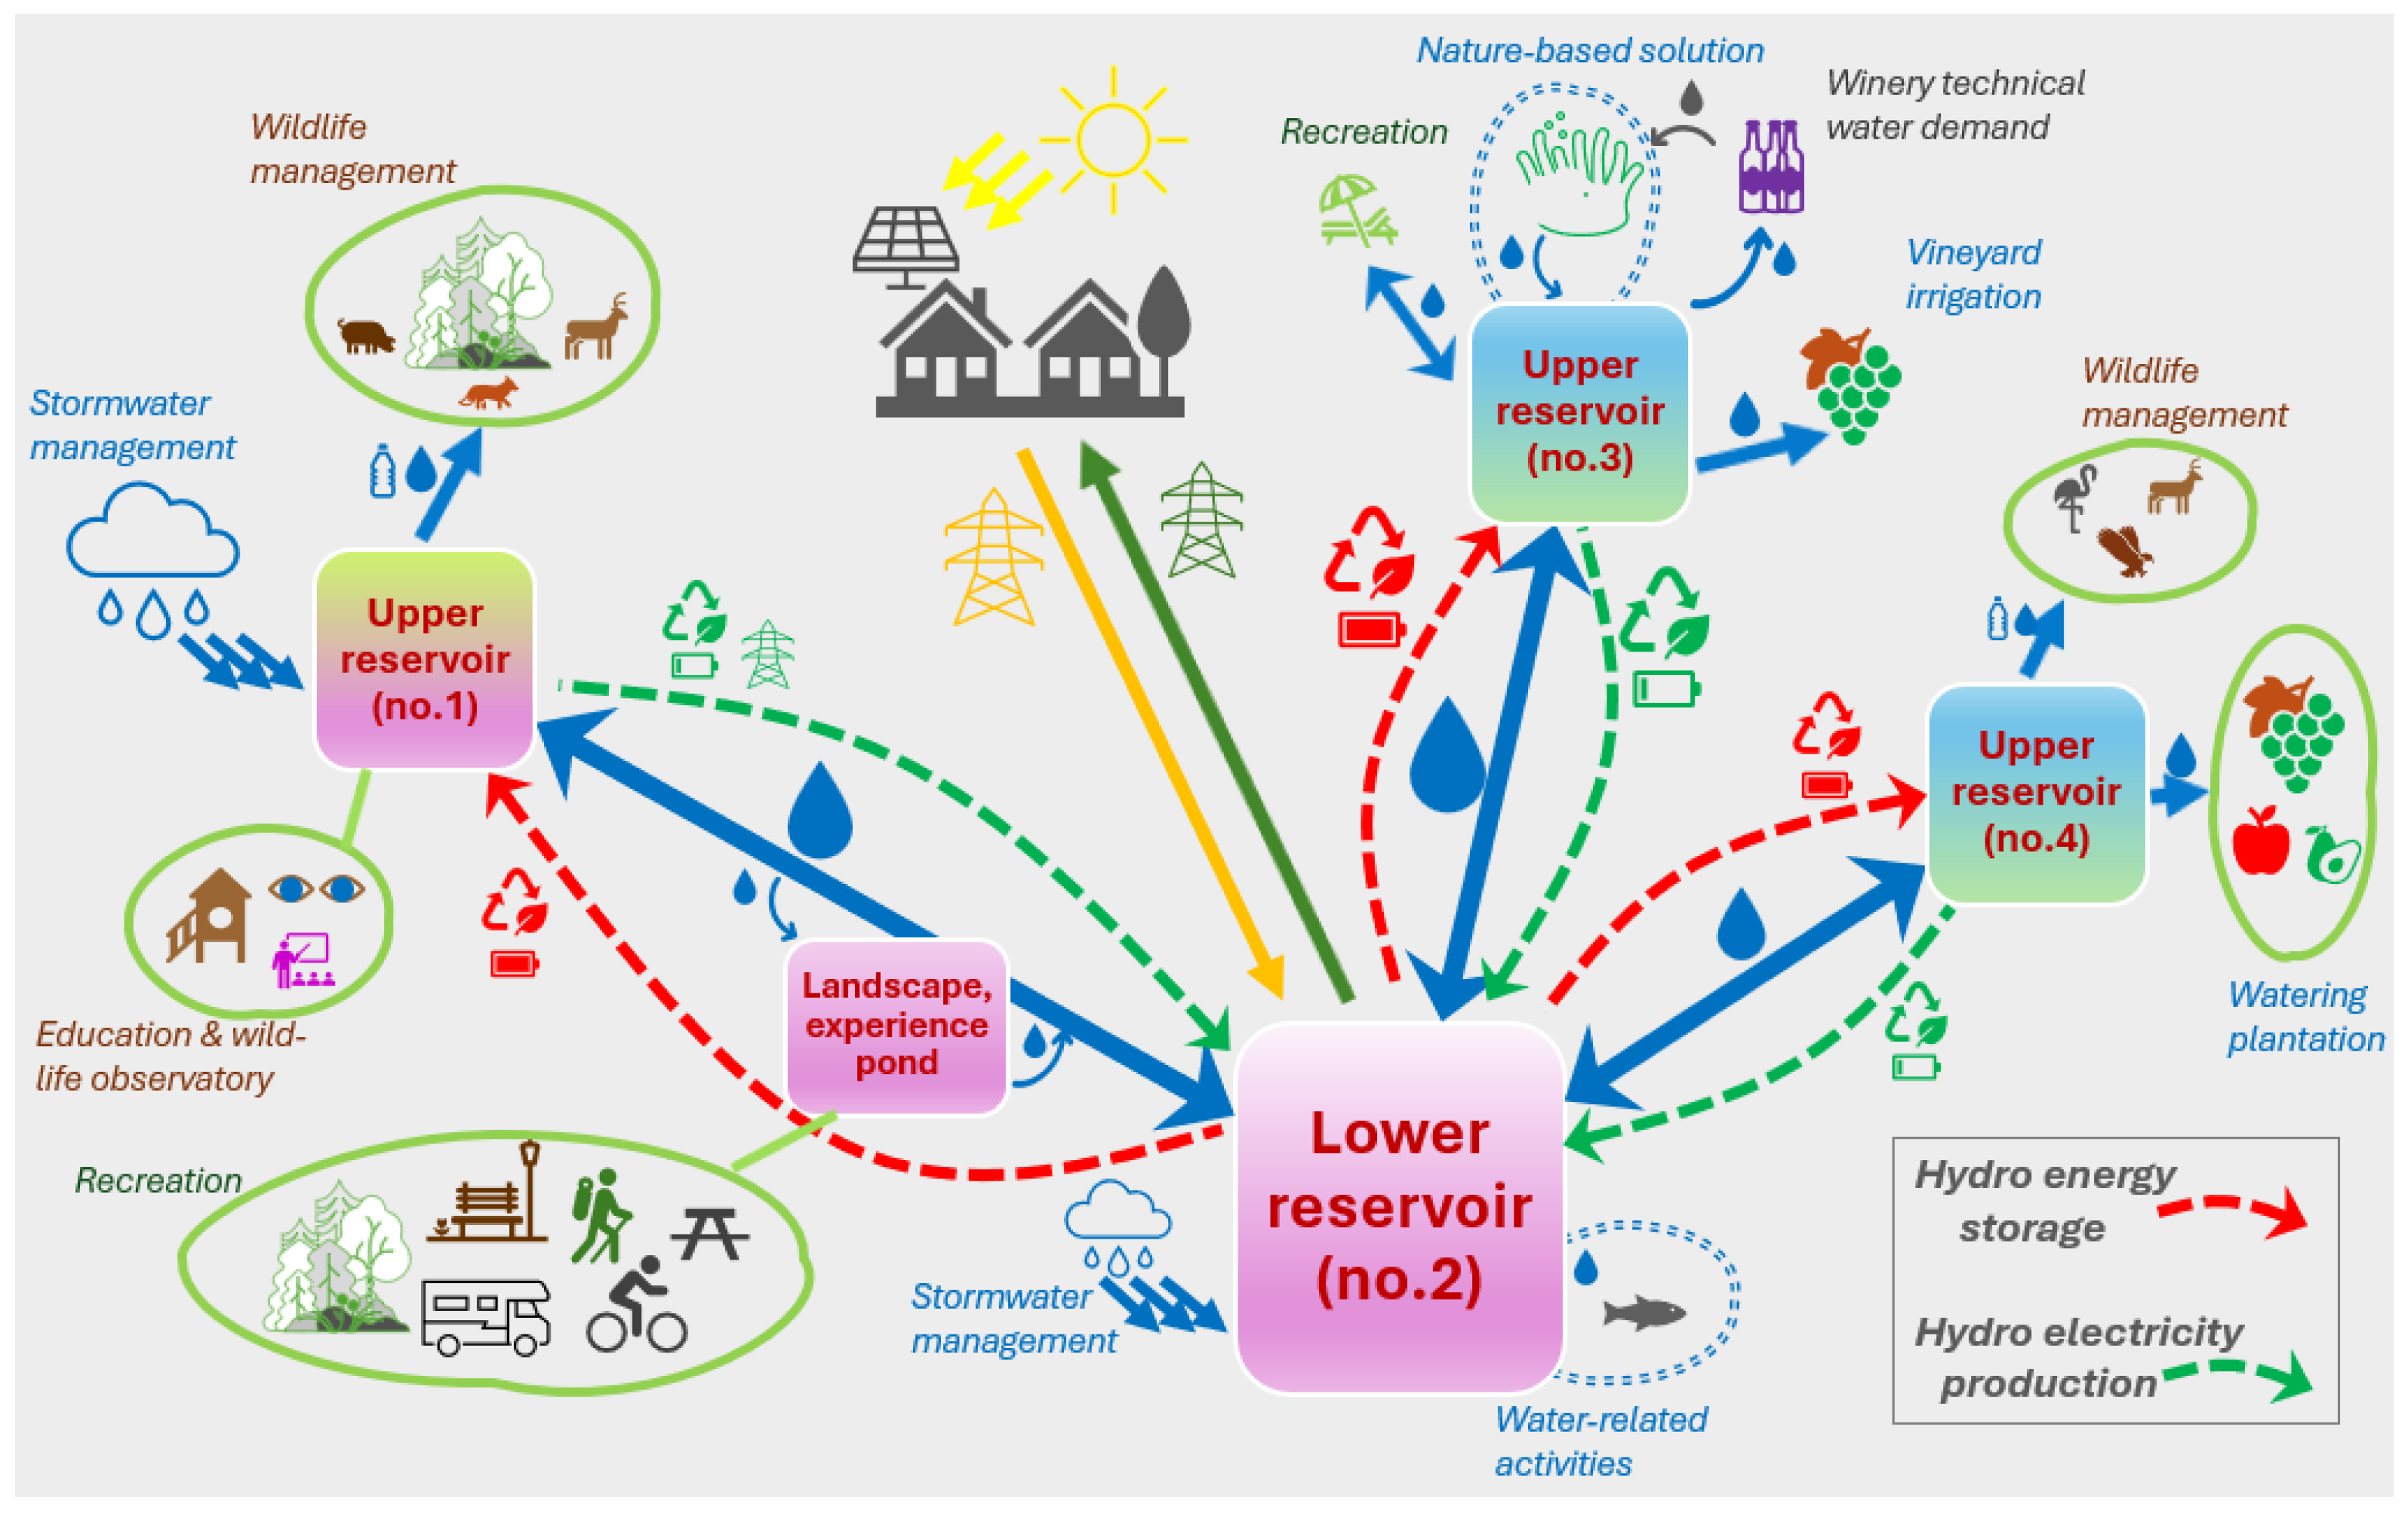
65]. Minimizing daily pump switches was an additional optimization goal, since a well-defined pump schedule lowers operating costs and improves the return on investment. The proposed methodology, illustrated in
Figure 4, facilitates the preliminary design of PHES systems with multiple co-benefits through multi-objective optimization; however, it does not encompass detailed operational control strategies.
Figure 4 shows the multifunctional uses of the reservoirs and their interconnections. Three main energy fluxes drive the system: changes in hydroenergy potential, incident solar energy, and consumer demand. These factors are interdependent; higher solar radiation increases solar generation, which in turn raises the potential energy stored in reservoirs. Surplus solar power—beyond consumer demand—drives the pumps (orange arrows) to lift water from lower Reservoir 2 to upper Reservoirs 1, 3, and 4 for short- or long-term storage. Red arrows in the figure indicate storage functions, blue arrows represent water transfer, green arrows show potential-to-kinetic energy conversion, and dark green arrows indicate electricity supplied to consumers.
In addition to energy storage, the system provides a stormwater management method. Reducing or controlling upstream flow at the settlement boundary can significantly lower the risk of flash floods in the lower part of the settlement. The first step in harnessing hydropower is therefore to analyze precipitation patterns and determine peak flows and volumes. Retaining stormwater in elevated areas at the settlement’s outskirts serves a dual purpose: runoff management and hydro energy storage. This dual function can reduce reservoir design costs while delivering multiple benefits. In this concept, Reservoir 1 fulfills both roles effectively. Reservoir 2, by contrast, collects stormwater within the settlement to offset evaporation losses and ensure a steady supply for irrigation and other local needs (blue clouds with raindrops in
Figure 4).
Figure 4 also highlights secondary water resource functions across the settlement, including ecological enhancement, socio-economic value creation, and the establishment of community focal points in public spaces (see also
Table 1).
3.2. Stormwater Management
The area’s surface cover and land use have undergone notable changes in recent decades, driven in part by infrastructure development and population migration. However, mapping of new infrastructure is not always up to date, resulting in inaccuracies in previously available datasets. Consequently, the stormwater models in this study classified surface areas into four broad categories rather than modeling each runoff-contributing surface in detail. While this approach may underestimate actual runoff volumes, it simplifies the methodology, making it more accessible to small municipalities and suitable for preliminary feasibility assessments.
At present, PHES calculations do not account for additional surfaces that contribute to runoff. Including these surfaces could enhance PHES performance, expand secondary benefits, and reduce the system’s payback period. This study, therefore, applies a conservative approach to energy storage estimation by potentially underestimating available runoff.
Reservoirs 1 and 2 are designed specifically to collect runoff, retaining water from sub-catchments during rainfall events and thereby reducing peak flows. Equation (1) represents annual runoff volumes
where
Q = annual surface runoff volume (m
3/year),
Ai = surface area of land type i (m
2),
Ci = runoff coefficient for surface type
i (-),
pa = annual average precipitation [m/year]. The
C runoff coefficient for roads and sidewalks = 0.9 (
Cpav), for roofs and parking lots = 0.9 (
Croof); for forested surfaces = 0.2 (
Cfor), for grassland and meadow = 0.2 (
Cgrass) and for arable and cultivated areas = 0.2 (
Cland). For in-town detached housing surfaces, it was 0.2 (
Cintown). The study area was classified into six hydrological surface categories for runoff estimation: (1) public roads, main roads, and sidewalks, (2) roofs and parking lots, (3) outlying forested areas, (4) grassland and meadow, (5) arable and cultivated land outside the settlement, and (6) residential garden zones.
Surface dimensions and slope data were obtained from QGIS 3.28.2-Firenze [
66], Google Earth 9.177.0 [
67], and e-Közmű [
68], and verified by field surveys. Precipitation data were sourced from freely available databases [
69], with daily rainfall records spanning from 1 January 2002, to 31 December 2022. These records provided both average annual precipitation and extreme rainfall event statistics and were also used to estimate irrigation demand during summer droughts.
The planned reservoir capacities were designed to exceed the maximum runoff volume generated during the most extreme recorded rainfall events. Reservoir water balance was simulated dynamically using Equation (2):
with bounds
Vmin ≤
V(
t) ≤
Vmax. where
V(
t) = stored water volume at time
t (m
3),
Qr(
t) = inflow from runoff (m
3/s),
Qpump(
t) = pumped inflow (m
3/s),
Qtur(
t) = turbine outflow for hydropower generation (m
3/s),
Qother(
t) = other outflows, e.g., irrigation withdrawals (m
3/s),
Vmin,
Vmax = operational storage limits (m
3).
3.3. Calculating Water Demand
Reservoirs in the PHES system serve two primary purposes: (1) energy storage and production, and (2) provision of additional water-related services. Some vineyards in Nadap currently receive supplementary irrigation during the growing season (
Figure 5). The type of plants and specific irrigation period helped determine the required water volume. In the example below, grapevines are irrigated from 1 May to 30 September, with peak summer months experiencing high evapotranspiration of 20–25 cm per month. The adopted irrigation regime is as follows: every second day in May, June, and September (≈15 days/month), and daily in July and August (30–31 days/month), excluding rainy days.
During the hot season, fruiting grapevines require approximately 17–23 l/m
2 weekly, equivalent to 3 l/m
2 per day or every two days. Non-fruiting stems require 1.5 l/m
2 per irrigation cycle. Irrigation demand (
ID) was calculated using Equations (3) and (4):
where
IDdaily = daily irrigation demand (m
3/day);
IRgrape = irrigation rate for grape-bearing vines (l/m
2);
Ai = surface of grape covered areas (m
2);
IRstem = irrigation rate for stems (l/m
2);
Aj—surface of stem covered areas (m
2);
D = the number of days between May 1 and September 30 (
D = 153);
IDtotal = total irrigation demand from May 1 to September 30 (m
3);
W = daily irrigation demand coefficient (-).
Table 2 summarizes the size and main characteristics of the irrigated areas, while
Figure 5 illustrates their locations in the settlement’s outlying area (areas marked in red show vegetation requiring irrigation). Water demand and reservoir loads are calculated over the growing season using Equations (3) and (4) in Excel.
In the northern part of the settlement, a wooded area has been designated for a new game reserve and hunting zone. The fenced perimeter ensures the safety of wildlife and prevents animals from leaving the reserve. In recent summers, high average temperatures have prevented animals from reaching nearby Lake Velence, leading to dehydration, reduced health, and lower reproductive success.
Constructing a wildlife watering zone will address this need along the shore of Reservoir 1 [
70]. Deer typically require 3–5 l/day, while wild boars consume 15–20 l/day. Based on 2018 data, the hunting area supports approximately 3400 deer and 800 wild boars, with the game reserve holding ~10% of these populations [
71]. Drinking water demand (
DWD) is calculated using Equation (5):
where
DWDdaily = daily drinking water demand (m
3/day);
DWi = drinking water for the i
th animal group (l/day);
Npop = population size of ith animal group (-). The demand is integrated into the overall performance evaluation and optimization.
Table 3 summarizes water demands for wild animals.
Maintaining the blue–green corridor, two small lakes, and continuous flow in creeks and streams requires approximately 1–2 l/s, equivalent to 150 m3/day. Most of this water originates from Reservoir 1 and flows into Reservoir 2. Water losses, mainly due to infiltration, are estimated at 20–25%, or ~30 m3/day.
3.4. Calculating Energy Storage
For the PHES to operate with zero carbon emissions, the energy required for pumping must be sourced entirely from renewable generation. While wind power would be ideal for directly driving radial pumps through a rotary mechanism, national regulations currently limit its deployment. As a result, solar photovoltaic (PV) generation is the primary focus for supplying PHES operations. Nadap has the highest solar system penetration rate per property in Hungary, which likely corresponds to above-average installed capacity per property. Sun position data for potential PV generation were obtained from Google Earth, while the Hungarian Central Statistical Office (KSH) provided official 2022 statistics on solar panel coverage. The 2022 map database was also used for consistency. To assess the performance of both roof-mounted and ground-mounted panels, high-resolution satellite imagery (top-down and 3D views,
Figure 6) provided information to delineate panel areas. Each installed panel in the settlement has an average surface area of approximately 1.5 m
2 and a rated output of 400 W.
Instead of counting individual panels, the total PV surface area was measured and then divided by 1.5 m
2 (the area of a single panel) to estimate the quantity of panels. The result was rounded to the nearest whole number to minimize incidental measurement error, as given in Equation (6).
where
SOLtotal = total solar production capacity in the settlement (kWp);
Ai = surface area of the ith installed solar system (m
2).
This approach accurately assesses the solar energy capacity available for PHES operations.
From the total installed PV capacity, the actual annual solar energy production for the settlement was estimated using performance data from a reference PV system rated at 10.2 kWp, equipped with a 9 kW three-phase SolarEdge inverter. Two years of measured production data provided the data to derive the specific yield
Yref (kWh/kWp/year), which was then scaled to match the estimated installed capacity in Nadap, as expressed in Equation (7):
where
Eannual = estimated annual PV energy production (kWh/year),
SOLtotal = estimated installed PV capacity in Nadap (kWp),
Yref = specific annual yield of the reference system (kWh/kWp/year),
OF = orientation factor (–), and
IF = inverter factor (–). An “orientation factor” (
OF) accounts for the varying orientations of the installed solar panels. This factor represents the reduction in solar irradiation and lower production potential due to deviations from the ideal south-facing orientation. The
OF value ranges from 0 to 1, with an average of 0.9 in the calculations. An inverter factor (
IF) accounts for the efficiency of inverters.
IF also ranges from 0 to 1, with a value of 0.95 used in this study.
The settlement’s electricity demand was estimated based on the number of residents and residential buildings. Average energy consumption varies with household size, characterized by the Household Demand Factor (HDF)—the ratio of population to the number of households. According to statistical data, the typical monthly electricity use is approximately 120 kWh for a single-person household, 180 kWh for a two-person household, and 200 kWh for a four-person household. A family home with four residents typically consumes around 230 kWh per month. These figures represent average consumption without electric heating systems. The number of households in the settlement is 285 out of which 247 have gas connection; therefore 38 houses have potential electrical heating. The average household energy demand for heating was estimated of 4700 kWh in 2022/23 and 3500 kWh in 2023/24 heating season from October till April. The energy balance (PV output minus demand curve) is calculated using 30-day moving averages of both quantities.
Electricity demand was estimated using the Household Demand Factor (HDF), derived from population-to-household ratios, with adjustments for electric heating in properties without gas connections (identified via the national utility map e-kozmu) [
69]:
where
Edemand = energy demand (MWh),
Nhouseholds = number of households,
Nhouseholds no gas = number of households without gas heat that require an additional 4.5 MWh for electrical heating.
3.5. PHES Design
The primary function of the pumped hydro reservoirs in the proposed system is to improve the settlement’s electrical stability by ensuring that the system meets electricity demand year-round. Achieving this objective requires seasonal energy storage to collect surplus solar power generated in the summer and distribute it in the winter months. Hydropower reservoirs are particularly well suited to this application due to their large storage capacity and long operational lifetimes. Pumped Hydro Energy Storage (PHES) systems typically exhibit a round-trip efficiency of 70–85%, which serves as a critical design parameter for sizing and optimization to maximize energy recovery and reduce carbon dioxide emissions [
22].
The hydrodynamic design accounts for nonlinear pump system losses, primarily due to frictional head losses and the specific pumping schedule. To limit wear caused by water hammer effects and transient cavity formation during pump start-up, the system employs a single daily pumping cycle. This operational strategy ensures reduced mechanical stress while still meeting energy storage requirements. Two key parameters influence PHES performance and durability: (1) Pipe diameter (D)—Larger diameters reduce friction losses but increase capital cost, and flow rate (Q)—Higher flow rates enable rapid filling but may increase transient loads.
The whole energy conversion pathway is as follows:
Stormwater inflow and solar energy input → Reservoir storage.
Potential energy storage in the reservoir (Eres = ρgHV).
Turbine generation → Electrical energy output.
Hydraulic transport with head loss from pipe friction.
Pumping surplus solar energy to the upper reservoir
System optimization to balance energy output, head loss, and filling time.
3.5.1. Stormwater Inflow and Reservoir Storage Potential
Three upper reservoirs capture rainfall runoff. The storage capacity of the pumped hydro reservoirs, EP
res results from adding the potential energy of water stored at various reservoir elevations:
where
EPres [kWh] = the storage capacity of upper reservoirs;
ρwater [kg/m
3] = the density of water, set to 998.2 kg/m
3;
g [m/s
2] = acceleration due to gravity = 9.81 m/s
2;
Hi [m] = the elevation difference between lower and i
th upper reservoirs (i = {1;3;4}) = the effective head;
Vi [m
3] is the useful volume of water that can flow through the penstock and the turbine from ith reservoir. This equation translates the hydraulic potential energy into electrical storage capacity, providing a key performance metric for system design.
3.5.2. Turbine Power Output
The net head available to the turbine is:
where
Hf = head loss in the pipes (m). The instantaneous mechanical power from the i
th turbine is:
where
Qi = the discharge rate through the turbine (m
3/s) and
ηt = the turbine efficiency (0.85–0.93) for small hydro [
72]. This formulation directly links stored water potential to electrical output, with
Hf reducing available head.
3.5.3. Pipe Hydraulics and Head Loss
The Darcy-Weisbach equation estimates the head loss due to pipe friction as:
where
f = friction factor (-);
D = pipe diameter (m);
L = the pipe length (m);
v (
t) = flow velocity (m/s). The friction factor in turbulent flow conditions requires an iterative solution using the Colebrook-White equation for laminar flow f = 64/Re, with the Reynolds number:
where ρ
water = density of water (998.2 kg/m
3, at 20 °C); D = hydraulic diameter (m); ν = kinematic viscosity of water (1.00 × 10
−6 (m
2/s), at 20 °C). The iterative solution for the hydrodynamic optimization: for turbulent flow, Newton–Raphson iteration allows for solving the Colebrook–White equation. The initial guess is
f = 0.02 and subsequent estimates are updated until the convergence criterion ∣
fi−
fi−1∣ < 10
−6 is met. To ensure numerical stability and avoid divergence in low-Reynolds transitional zones, practical engineering considerations limit ranges of 10
3 ≤ Re ≤ 10
7. Initial estimates of pipe wall roughness ranged about
ε = 0.02 m with pipe diameters evaluated from 0.10 m to 1.00 m with increments of 0.05 m up to 0.50 m, then 0.10 m up to 1.00 m. Preference was given to commercially standard diameters to minimize procurement costs.
3.5.4. Pumping Energy Requirements
Water is transferred from the lower reservoir to the upper reservoirs using surplus solar PV generation, with pumping scheduled during periods of peak PV output to avoid curtailment. The total dynamic head the pump must overcome at time t is given by:
where
Hi [m] = the static elevation difference between the lower reservoir and the i
th upper reservoir, and
Hf,i(
t) (m) = the head loss due to pipe friction, calculated using the Darcy–Weisbach formulation in Equation (12). The instantaneous pumping power requirement is then:
where
Qpump,i(
t) (m
3/s) = the pump discharge rate to reservoir
i, and
ηpump,i (-) is the pump efficiency, typically between 0.75 and 0.85. The pump discharge rate is selected to satisfy the single daily pumping cycle constraint, mitigating water hammer and transient stresses. The total daily pumping energy requirement result from integrating over all operational time steps:
The available PV surplus will constrain this energy demand by:
where
ηsolar-pump is the combined electrical and mechanical efficiency from PV to pump shaft,
P solar,day [kWh/day] is total PV generation,
C local,day [kWh/day] is local electricity consumption.
Fseason is a seasonal factor (0.7 for summer, 0.5 for spring/autumn, 0.3 for winter). The pumping schedule is optimized to operate during periods of maximum PV output and minimum demand to avoid curtailment.
3.5.5. Multi-Objective Reservoir Energy Balance
Pipe diameter optimization is critical since larger diameters reduce friction losses and increase turbine power output, while smaller diameters increase losses and reduce system efficiency [
22]. The hydraulic network was optimized using Matlab’s iterative solvers, balancing pipe diameter, flow velocity, and head loss to achieve maximal efficiency and system reliability.
Three objectives guide the pipe diameter Di selection for inter-reservoir connections:
- (1)
Maximize the power output of turbines.
where
Epeak,demand is peak settlement demand (104 kW without heating, 160 kW with heating).
- (2)
Minimize total head loss;
- (3)
Minimize system filling time,
ti,fill, based on
Di and
Qpump,iwhere
tfill is the time needed to fill up the empty ith pipe with
ith pump discharge rate (
Qpump,i [l/s]).
Pipe diameters vary according to standard SI outer diameters for PN20 and PN25 (20 bar and 25 bar): Di ∈ {63, 75, 90, 110, 125, 140, 160, 180, 200, 225, 250, 280, 315, 355, 400, 450, 500}. This is a financial constraint to keep implementation costs low.
3.5.6. Design Considerations
The penstock, the main conduit of the PHES system, was modeled as a one-dimensional rigid-wall flow system, with minor losses from bends and entry/exit transitions neglected. Flow velocities were considered in the range of 1 m
3/s to 10 m
3/s, with an optimal operational range of 3–5 m
3/s identified from prior hydropower design studies. Compressibility effects had little effect, and water density remained constant throughout [
72]. To mitigate water hammer effects caused by sudden flow changes, a slow-opening control valve (sluice gate) was incorporated, consistent with recommendations by Adamkovski et al. [
73]. This approach significantly reduces transient pressure spikes during pump start-up, particularly given the planned single daily pumping cycle. Despite the slow valve actuation, the system maintains rapid attainment of maximum output power.
3.6. Economic & Social Assessment
The energy demand of the settlement is met in different ways in the altered scenarios, as their energy sources and energy mix vary as their carbon dioxide emissions. The energy mix is assessed by a combined direct energy-audit (DEA) and life-cycle assessment (LCA) and compared in the present and planned future scenarios, using calculated data and literature findings. Presently, the settlement’s energy demand is partially met from local solar production and mostly from the transmission network. Using the calculated ratio, this is converted to total energy in kWh and to monetary value in EUR for financial assessment (DEA method) as well as to kg of CO
2 emission for environmental impact assessment (LCA method). The carbon-footprint is different for the different energy sources, for local solar panels, the CO
2 emission of energy production is 0.03–0.04 kg
CO2/kWh [
74], for the planned pumped hydropower operation, it is 0.05–0.09 kg
CO2/kWh [
75]. Based on the energy mix of Hungary in 2024 [
76], the estimated CO
2 emission factor—the weighted average of the carbon-footprints of the different energy sources—is between 0.2–0.25 kg
CO2/kWh. The carbon-footprint measured by Electricity Maps ApS [
77] was 0.258 kg
CO2/kWh in 2023 and 0.243 kg
CO2/kWh in 2024. The carbon footprint (
FPCO2) can be calculated using Equation (17) for the evaluated scenarios.
where
Ei is the annual electricity from different sources (in kWh) and the emission factor (
EFi) is 0.04 kg
CO2/kWh for solar energy, 0.08 kg
CO2/kWh for hydropower and 0.25 kg
CO2/kWh for electricity coming from the transmission network. The neutralization cost of carbon-emission is €0.07 per kg
CO2.
For financial assessment, a combined economic-environmental method (
NPVlcca,cba) was used (Equation (18)) to include (i) the capital investment, the maintenance and operation costs of hydropower storage system in a discounted life-cycle-cost analysis (LCCA) over a 50-year horizon and (ii) the operation cost savings from different energy prices (€/kWh) and the reduction in CO
2-emisson neutralization costs in a cost–benefit analysis (CBA).
where
I is the initial implementation cost;
OP is the starting annual operation cost,
MT is the annual maintenance cost;
Penergy is the unit price of energy mix used;
i is the interest rate for refinancing (3.0% p.a.);
p is the price increase, the inflation rate (2.0% p.a.);
t is the lifespan (50 years);
ACIk is the annual additional charge or incentive by the state or other water used (+ if grant/income;—if tax/penalty);
NCO2t is the annual CO
2 neutralization and/or absorption cost (+ if neutralization;—if absorption).
4. Results
Stormwater retention upstream of the settlement reduces vulnerability to hydrological extremes and supports renewable energy generation through pumped hydro energy storage (PHES). In this case study, Reservoir 1 serves as the primary multi-objective reservoir, supplied by both direct runoff and pumped transfers from Reservoir 2. The design period spans from 1 January 2022 to 31 December 2024.
4.1. Stormwater
The planned PHES operates as a closed-loop system, moving water in a controlled cycle between reservoirs. However, external water input remains necessary to offset secondary water demands, such as agricultural irrigation and livestock watering, as well as physical losses from evaporation. Local runoff retention provides the principal external water source, underscoring the importance of understanding precipitation regimes and interannual variability.
Meteorological records indicate that annual precipitation is unevenly distributed, with extended summer droughts—exacerbated by climate change—posing a growing challenge to water availability. Data from the last two decades (MetStation #35315 [
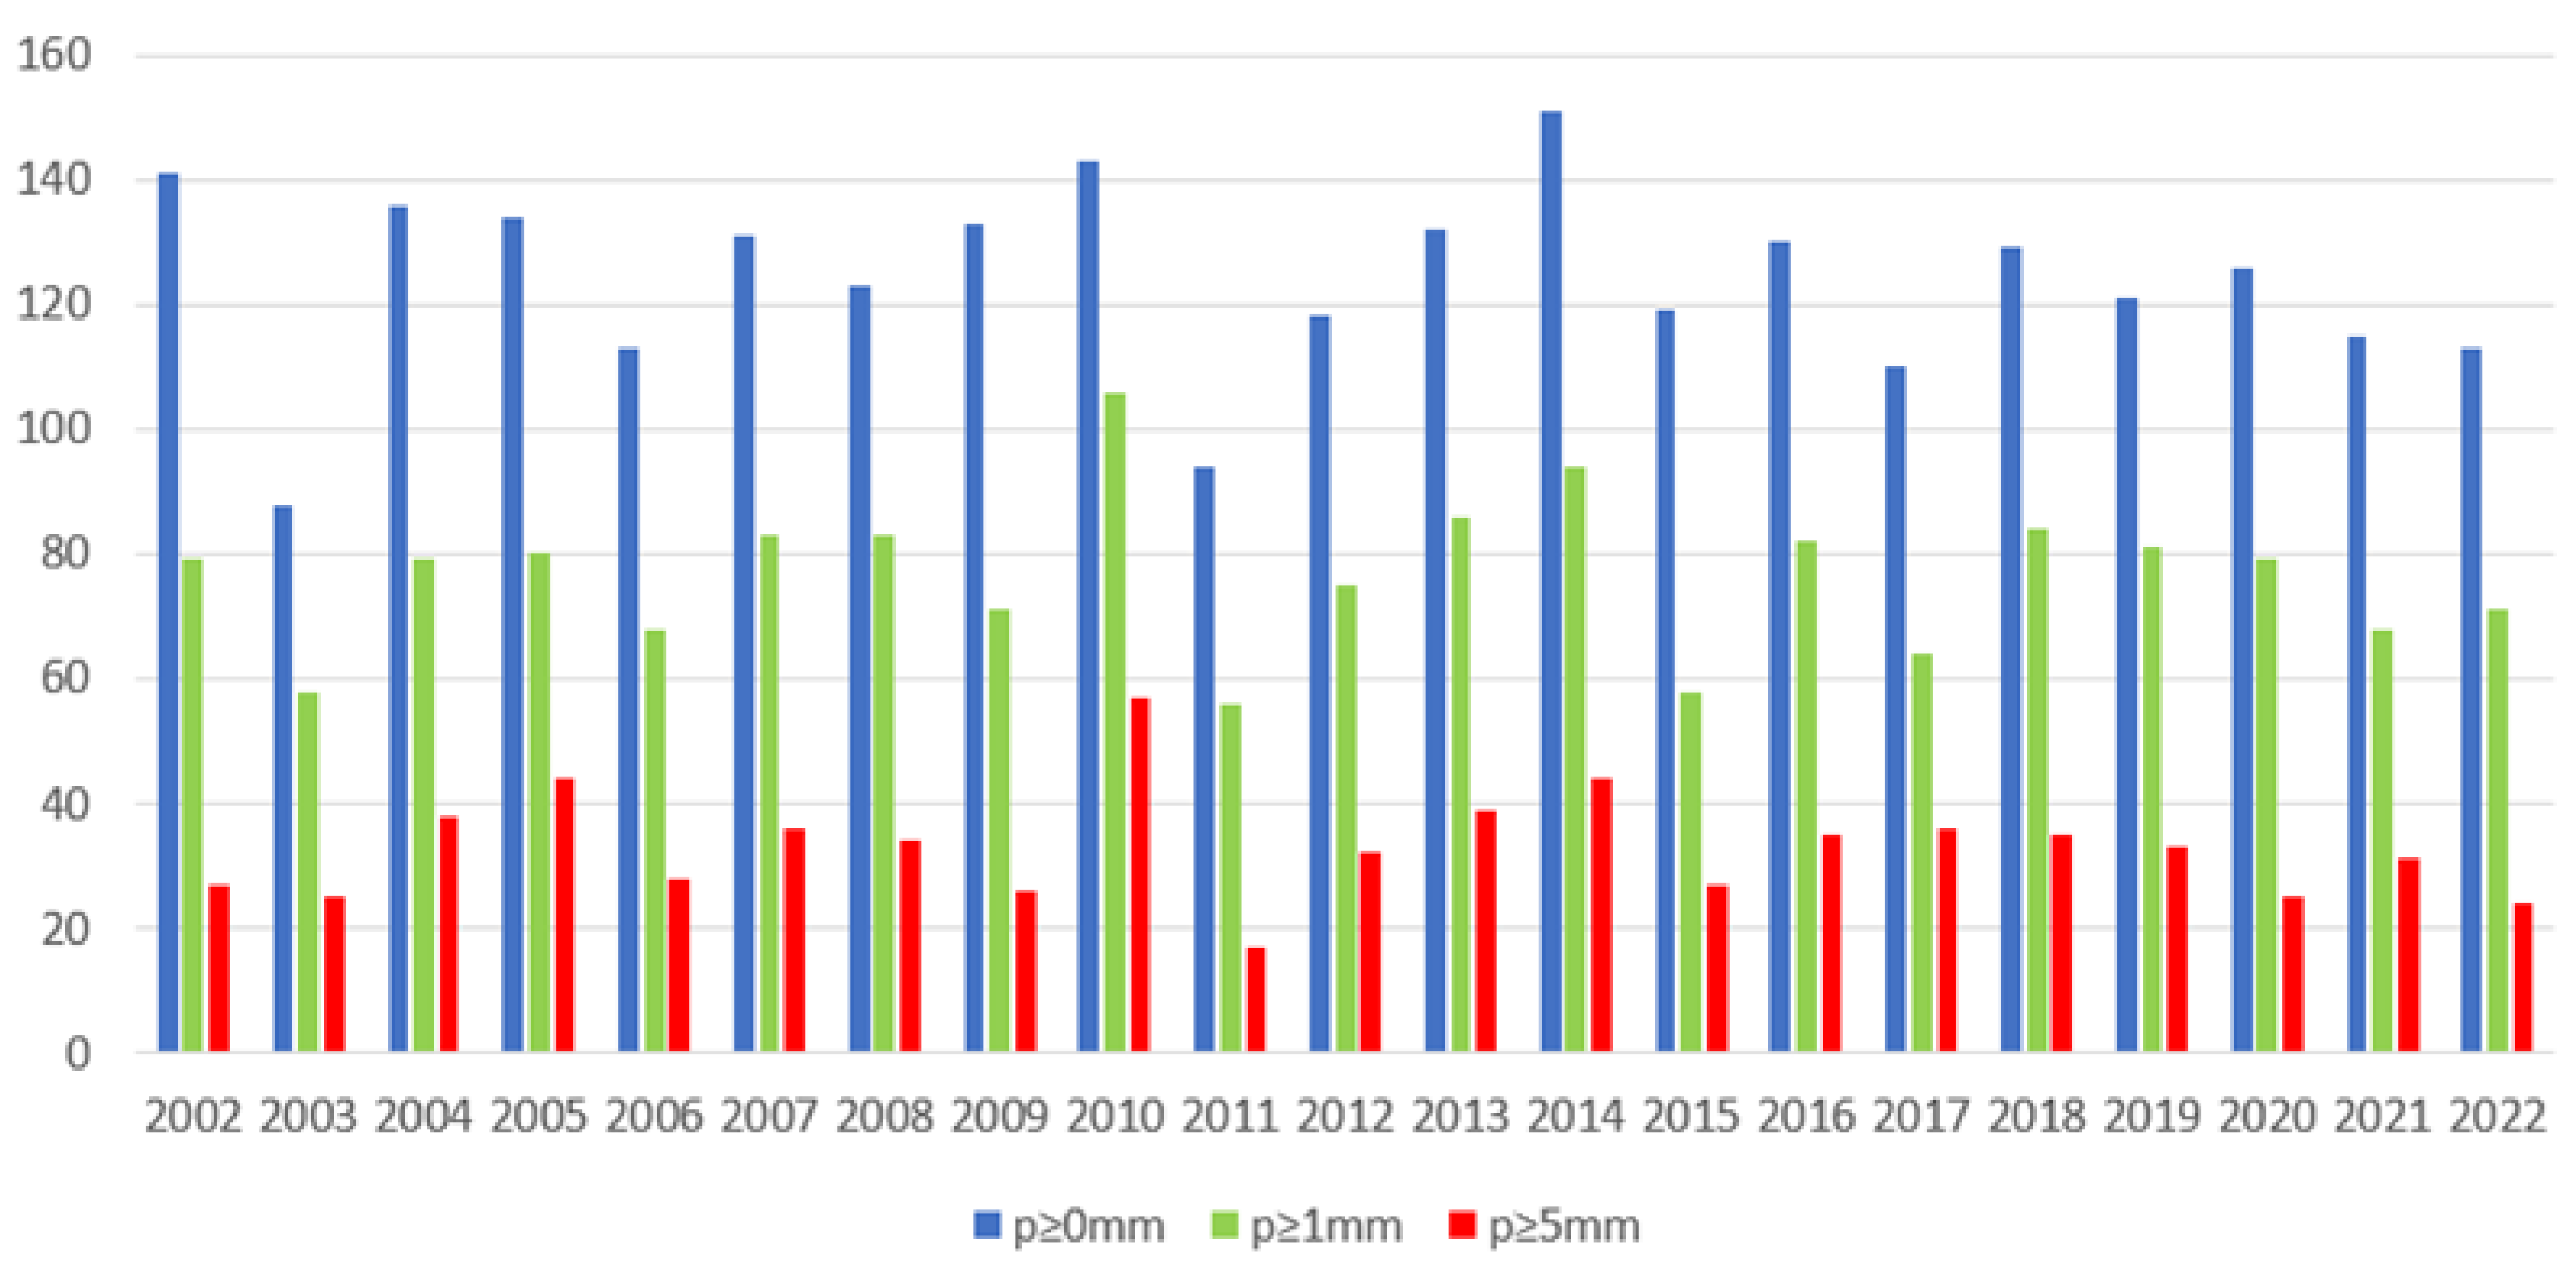
70]) show a mean annual precipitation of only 532 mm, which is below the regional average. Moreover, the temporal distribution of rainfall events is highly variable, as illustrated in
Figure 7, which presents the number of rainy days with precipitation exceeding 0 mm, 1 mm, and 5 mm. For watershed management and reservoir design purposes, precipitation events greater than 5 mm are considered significant for runoff generation. Over the past decade, the number of such events has ranged between 20 and 40 days annually, without an important long-term trend in total precipitation.
This pattern highlights two key implications for PHES and stormwater management: (1) Seasonal storage is essential; Surplus solar energy produced during high-generation summer periods can be stored as gravitational potential energy in upper reservoirs (Reservoirs 1, 3, and 4) for later use, including seasonal transfer from summer production to winter demand, (2) Runoff capture is critical; Stormwater harvested during autumn, winter, and spring must be stored in Reservoirs 1 and 2 to ensure sufficient water availability during increasingly arid summers.
These findings emphasize that the efficiency of runoff collection and the capacity of upper storage reservoirs are critical to both the water balance and energy management objectives of the system. By integrating hydrological and energy considerations, the PHES design enhances settlement resilience, providing a robust response to the combined challenges of energy demand fluctuation and climate-driven hydrological change.
During the design period in the summer (122 days), there are only 12–15 days when the daily precipitation exceeds 5 mm. Therefore, irrigation became necessary to protect crop production and ensure a safe yield. To examine the runoffs and flows of precipitation events, the settlement and its surroundings were divided into sub-catchments to determine the amount of retained rainwater using Equation (1). Accordingly, the retainable stormwater runoff in the settlement is 62,815 m3 annually. Of which 10,812 m3 can be routed towards the upper Reservoir 1. Reservoir 2 (lower) can manage most of the remaining (52,003 m3). This is a significant amount of water due to the hilly character of the settlement and the large wooded, agricultural, and vineyard areas. The slope of the sub-catchments varies between 5.0–18.3%, and runoff from approximately 60% of the settlement’s area (6.89 km2) flows gravitationally toward Reservoir 2.
This study was extended to include land use and landscape changes related to climate change by modifying the runoff coefficient and the amount of annual precipitation. Accordingly, the collectable rainwater is as shown in
Table 4 and
Table 5 below, with the parameters changed.
Climate change is not expected to affect the annual precipitation in the area, so no long-term change in the average annual precipitation is forecasted. However, extremely dry periods and years may occur, for which the precipitation column (
Table 4, column 2, p = 350 mm p.a.) provides information with approx. 1/3 less annual rain than currently.
With land use and land cover changes, there is more uncertainty in the amount of rainwater runoff than with climate change. However, the amount of stormwater available will most likely be adequate if there is no extreme intervention in the settlement area and its immediate vicinity.
4.2. Water Demand Quantities
The irrigation schedule described in
Section 3.3 established the water required for the 122 days between June and September. According to the theoretical maximum, 92 days with irrigation demand would represent a completely precipitation-free 4-month summer period. Based on the rainfall time series of the last decade, the number of irrigation days varied between 52 and 63 days, including the extreme drought summers of the 2020s.
Table 6 summarizes the water requirements for irrigation of the four designated vineyards with the lowest and highest watering days.
The annual average irrigation demand is approximately 20,000 m
3, met by a gravity-fed distribution system from Reservoir 3, as an energy- and carbon-free method. The planned capacity of this reservoir exceeds annual irrigation requirements, ensuring a sufficient water supply for agricultural needs. In addition to crop irrigation, a smaller volume of water is allocated for wildlife, primarily sourced from Reservoir 1 and secondarily from Reservoir 4. Reservoir 1 is strategically placed within a game reserve, while Reservoir 4 is a freely accessible area, surrounded by a forest and a protected landscape area. At the same time, another portion remains outside the fenced area, allowing both enclosed and free-ranging wildlife access to drinking water.
Table 7 summarizes the annual drinking water requirements of various wildlife species, calculated using Equations (4) and (5).
The annual amount of water dedicated to wildlife management is approximately 1000 cubic meters. Therefore, the planned capacity of Reservoir 1 is sufficient to store this amount, meeting the needs of secondary water users and potentially creating co-benefits for this purpose. Additionally, the reservoir is designed to withstand extreme events; when the reservoir reaches its maximum capacity, the spillway will reroute runoff to a nearby channel leading to reservoir No. 2, thereby enhancing water retention within the system.
The reservoirs have positive sub-catchment inflows that compensate for the evaporation losses. If the water balance ratios of Lake Velence are applied for the reservoirs, the annual evaporation loss is the total surface of the reservoirs (55,500 m2) multiplied by 0.913 m as average evaporation loss of the lake. This results in 50,671.5 m3 evaporation loss annually. The volume of rain over the reservoirs can be calculated by the surface of the reservoirs and the annual precipitation, that is 55,500 m2 multiplied by 0.532 m, resulting in 29,526 m3. The difference is 21,145.5 m3. The inflow from the catchment is about 2.5-fold larger than the missing evaporation loss, therefore the reservoirs have water balance. Water demands and evaporation loss together make 44,045.5 m3 which is usually far lower than inflow from catchment, the water balance is only challenged in extreme drought years or if the landscape and land use changes very unfavorably into an unsustainable direction.
4.3. Energy Storage Quantities
Satellite images captured the location and extent of rooftop solar panels within the settlement. Summing the individual solar collector systems produced the area’s total solar energy production capacity. The measured solar surface area and an estimated average of 1.5 m2 per panel determined that Nadap has approximately 1086 solar panels installed. Each panel rated at 400 W has a temporary capacity of 434.4 kW. While the settlement enjoys over 2000 h of sunshine annually, which could theoretically yield an annual capacity of nearly 900 MWh, the actual output varies because solar production in winter is reduced by lower sun angles and shorter days, leading to lower-than-peak performance.
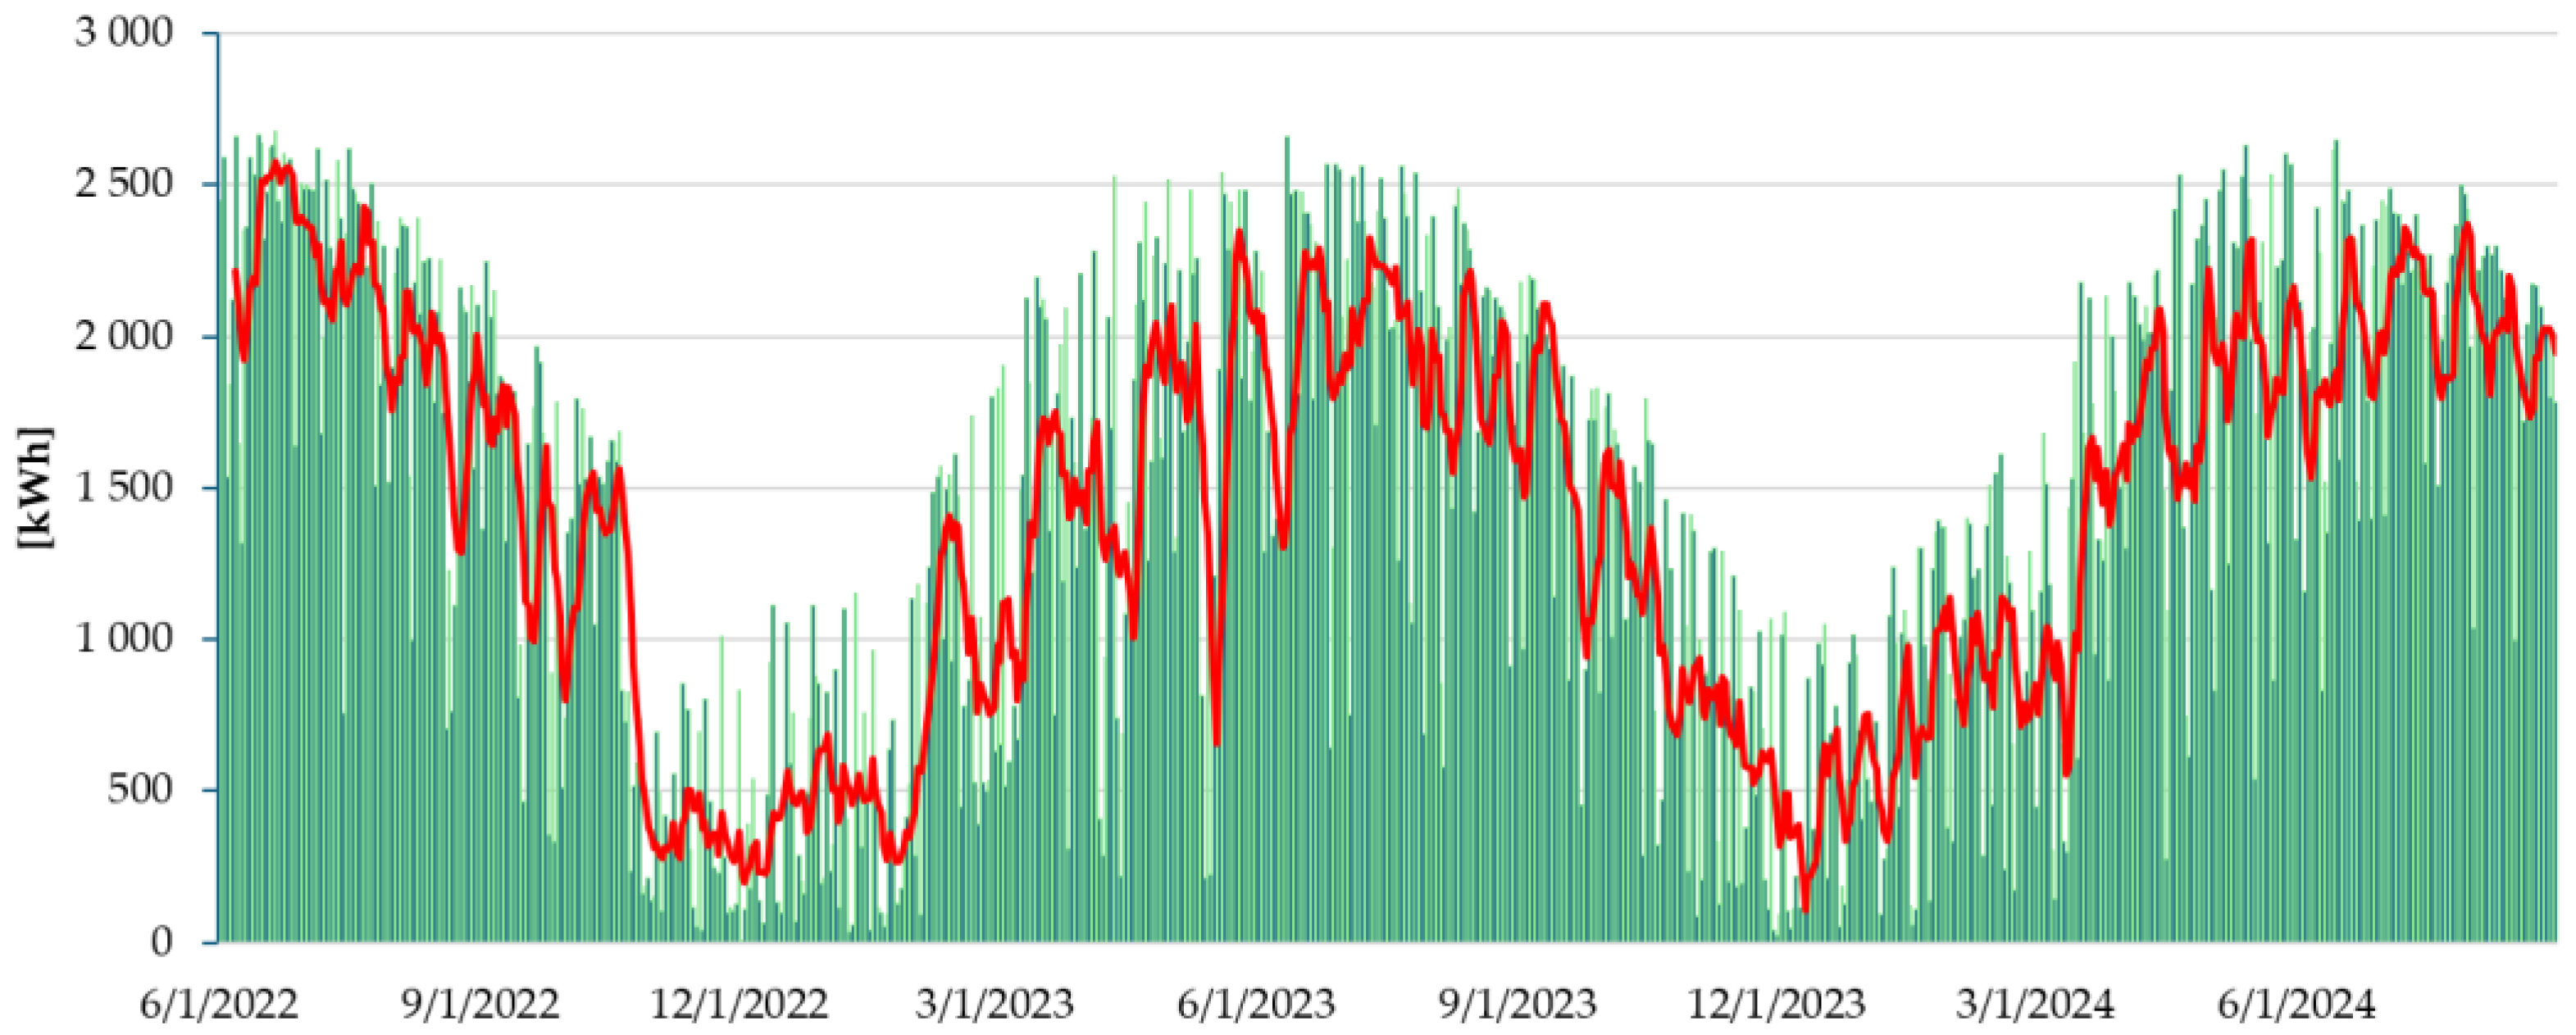
To better understand actual production patterns, a functioning 10.2 kW solar panel system with recorded performance data was selected as a reference. The settlement produced an estimated solar output by scaling this reference data and applying relevant loss factors. In an ideal scenario where every hour of sunlight provided consistent irradiation, solar production would be relatively stable each day, with daily variations reflecting only the number of daylight hours. However,
Figure 8 illustrates that production is highly variable. The green bars in the figure represent daily production volumes. At the same time, the red line represents the 7-day moving average, which smooths out these fluctuations and highlights the intermittent nature of solar energy output.
In winter, daily solar production is roughly one-fifth to one-sixth of the summer levels, despite a daylight hour difference of less than 50% between the seasons. On the longest day of the year (22 June), there are 15 h and 56 min of sunlight, compared to only 8 h and 29 min on the shortest day (22 December). Consequently, instead of the theoretical annual output of 900 MWh, actual production—calculated using Equation (7)—is only 487.6 MWh across the two years analyzed. The results not only reflect the intense daily fluctuations but also the significant seasonal variation in solar output. However, the 7-day moving average already shows a much clearer and smoother energy production trend, to which a large-scale electric storage, such as a hydropower reservoir, can be more easily fit. Furthermore, the monthly demand averages and standard deviations (
Table 8) for the same period of the year present even less variability, which promotes the implementation of larger reservoirs to provide more reliable and balanced operation and energy supply.
The annual difference in energy production between the two years was just over 3%, indicating stable operation and a reliable annual supply of green energy. Household energy demand was estimated using Equation (8).
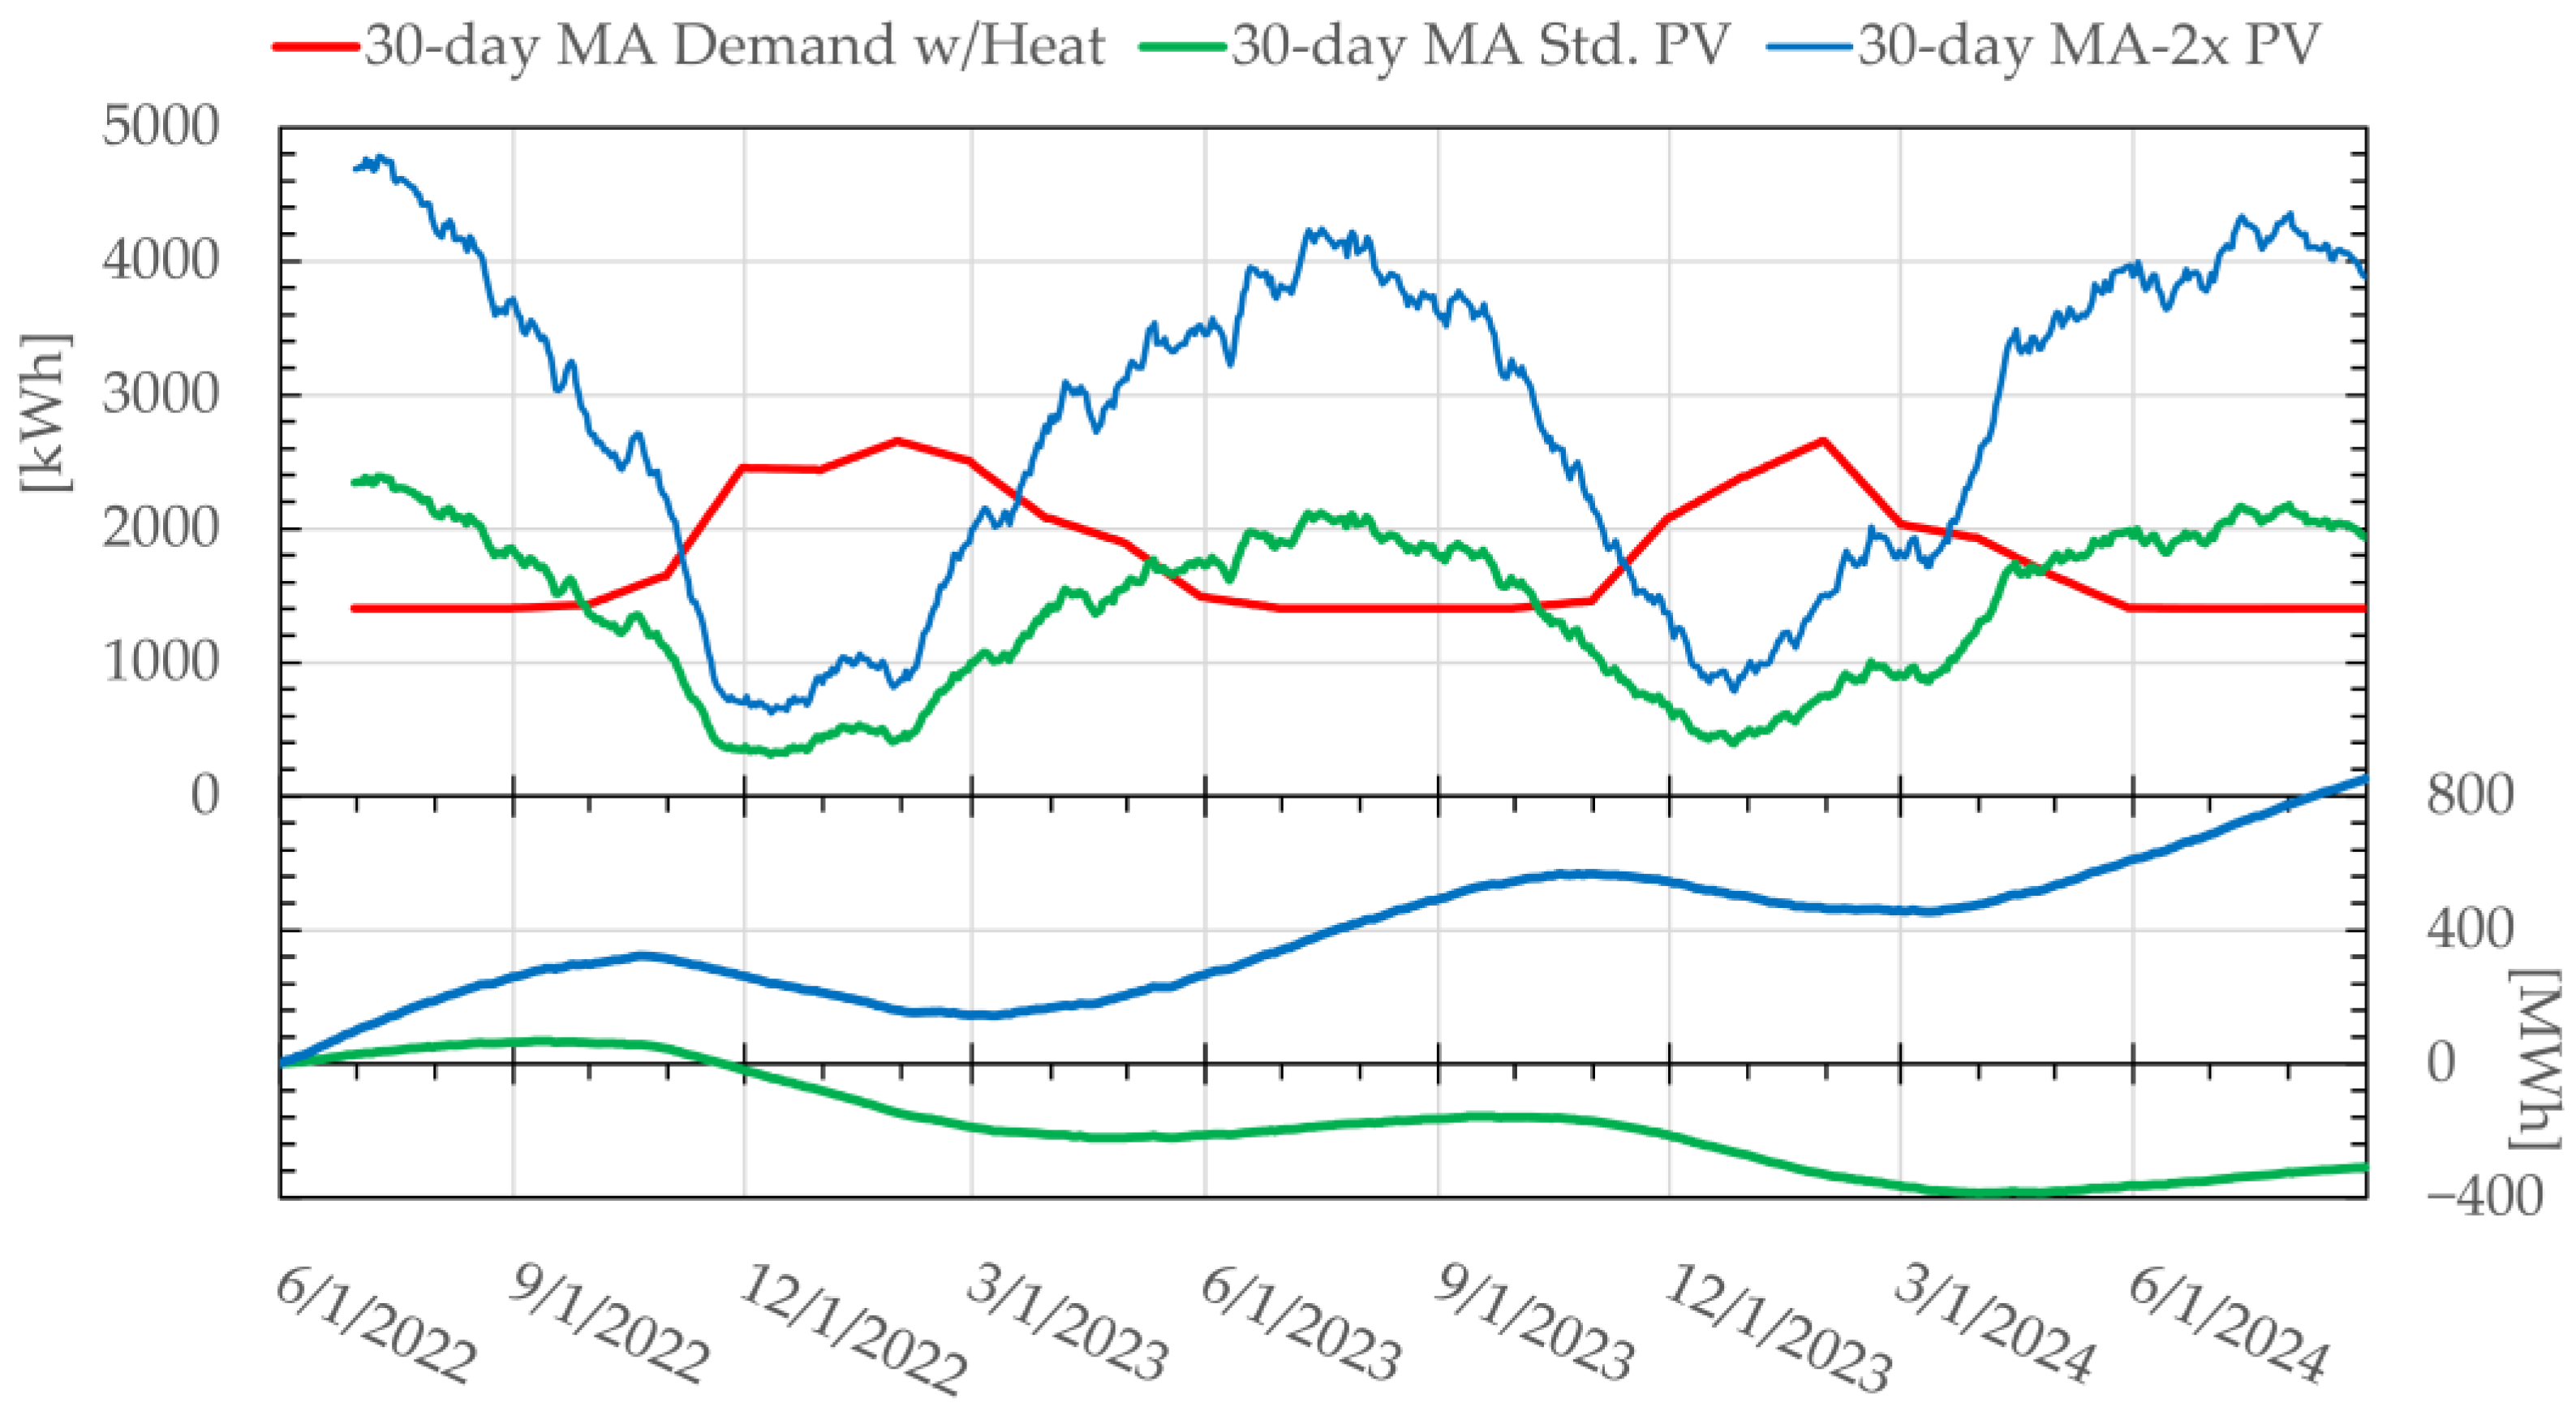
Figure 9 compares the 30-day moving averages of total solar energy production (green line) and household energy demand, including electric heating needs (red line). This comparison highlights the seasonal alignment of production and demand, providing insights into the consistency and sufficiency of solar power for residential use throughout the year.
In the summer, solar energy production exceeds local demand, while consumption surpasses the available renewable energy in winter. Ideally, effective energy solutions could store surplus solar energy from summer for use in winter. Cumulative annual solar output and demand result from integrating the areas under the production and demand curves in
Figure 9. The net difference appears in the lower section of the figure. While the assumption of a zero-start point is arbitrary, the trends that follow are more significant. Specifically, the standard (present) configuration does not quite achieve a zero balance. In the scenario where solar collectors are doubled (with no additional population/demand), the net benefit is substantial.
This expansion would involve increasing solar coverage from 21% to around 30–40% of properties or raising the number of solar-equipped properties from 60 to 85 in the earlier scenario (excluding heating) and to 116 in the later scenario (including heating). This estimate assumes ideal, lossless conditions, though, in reality, storage inefficiencies would require an even more significant increase in capacity to achieve complete energy independence through seasonal storage.
With additional solar panels, the system could, in an ideal case, meet energy needs based on reservoir size and water balance calculations, assuming no frictional or operational losses. In practice, however, pumps consume substantial energy. They are responsible for significant losses, mainly due to pipe wall friction, which accounts for up to 90% of total operational energy use in hydrodynamic networks. Minimizing these losses is, therefore, critical in optimizing the performance and efficiency of the PHES system.
Homeowners often add solar panels to their homes. However, the implementation could take the form of a larger solar park on agricultural land for shading purposes, or as floating panels on a reservoir, which could result in partial coverage to reduce evaporation losses and improve water quality [
78]. In addition, the energy production efficiency of solar panels increases with the installation of a floating array [
79].
4.4. Pumping System Design
The planned PHES system includes one lower Reservoir 2 and three multifunctional upper Reservoirs 1, 3, and 4.
Table 9 summarizes the reservoirs’ relative locations and the pipe network’s geometry.
The pipe diameter, velocity, flow discharge, and boundary conditions were determined, partly based on local conditions and partly on the energy production expected from the PHES. Research literature recommends a range of 1–4 m/s for the pipe flow velocity (V) and 0.03–0.3 m
3/s for the flow discharge (Q) based on the energy consumption function of the settlement. The planned methodology ensures the differentiated optimization of various energy production sources for variable electricity usage in different periods by local users. Optimizations summarized the following results by reservoir (
Table 10). The fields marked in green indicate the flow velocities that meet the previously set criteria, and the orange fields represent marginally acceptable values. The bold italic velocity values indicate the flow velocities with the lowest hydrodynamic loss for the four pre-set discharges for the reservoirs. Depending on the energy demand of the settlement, the system can flexibly adapt to municipal electricity needs by generating energy from one or even two reservoirs, with the lowest possible hydraulic loss.
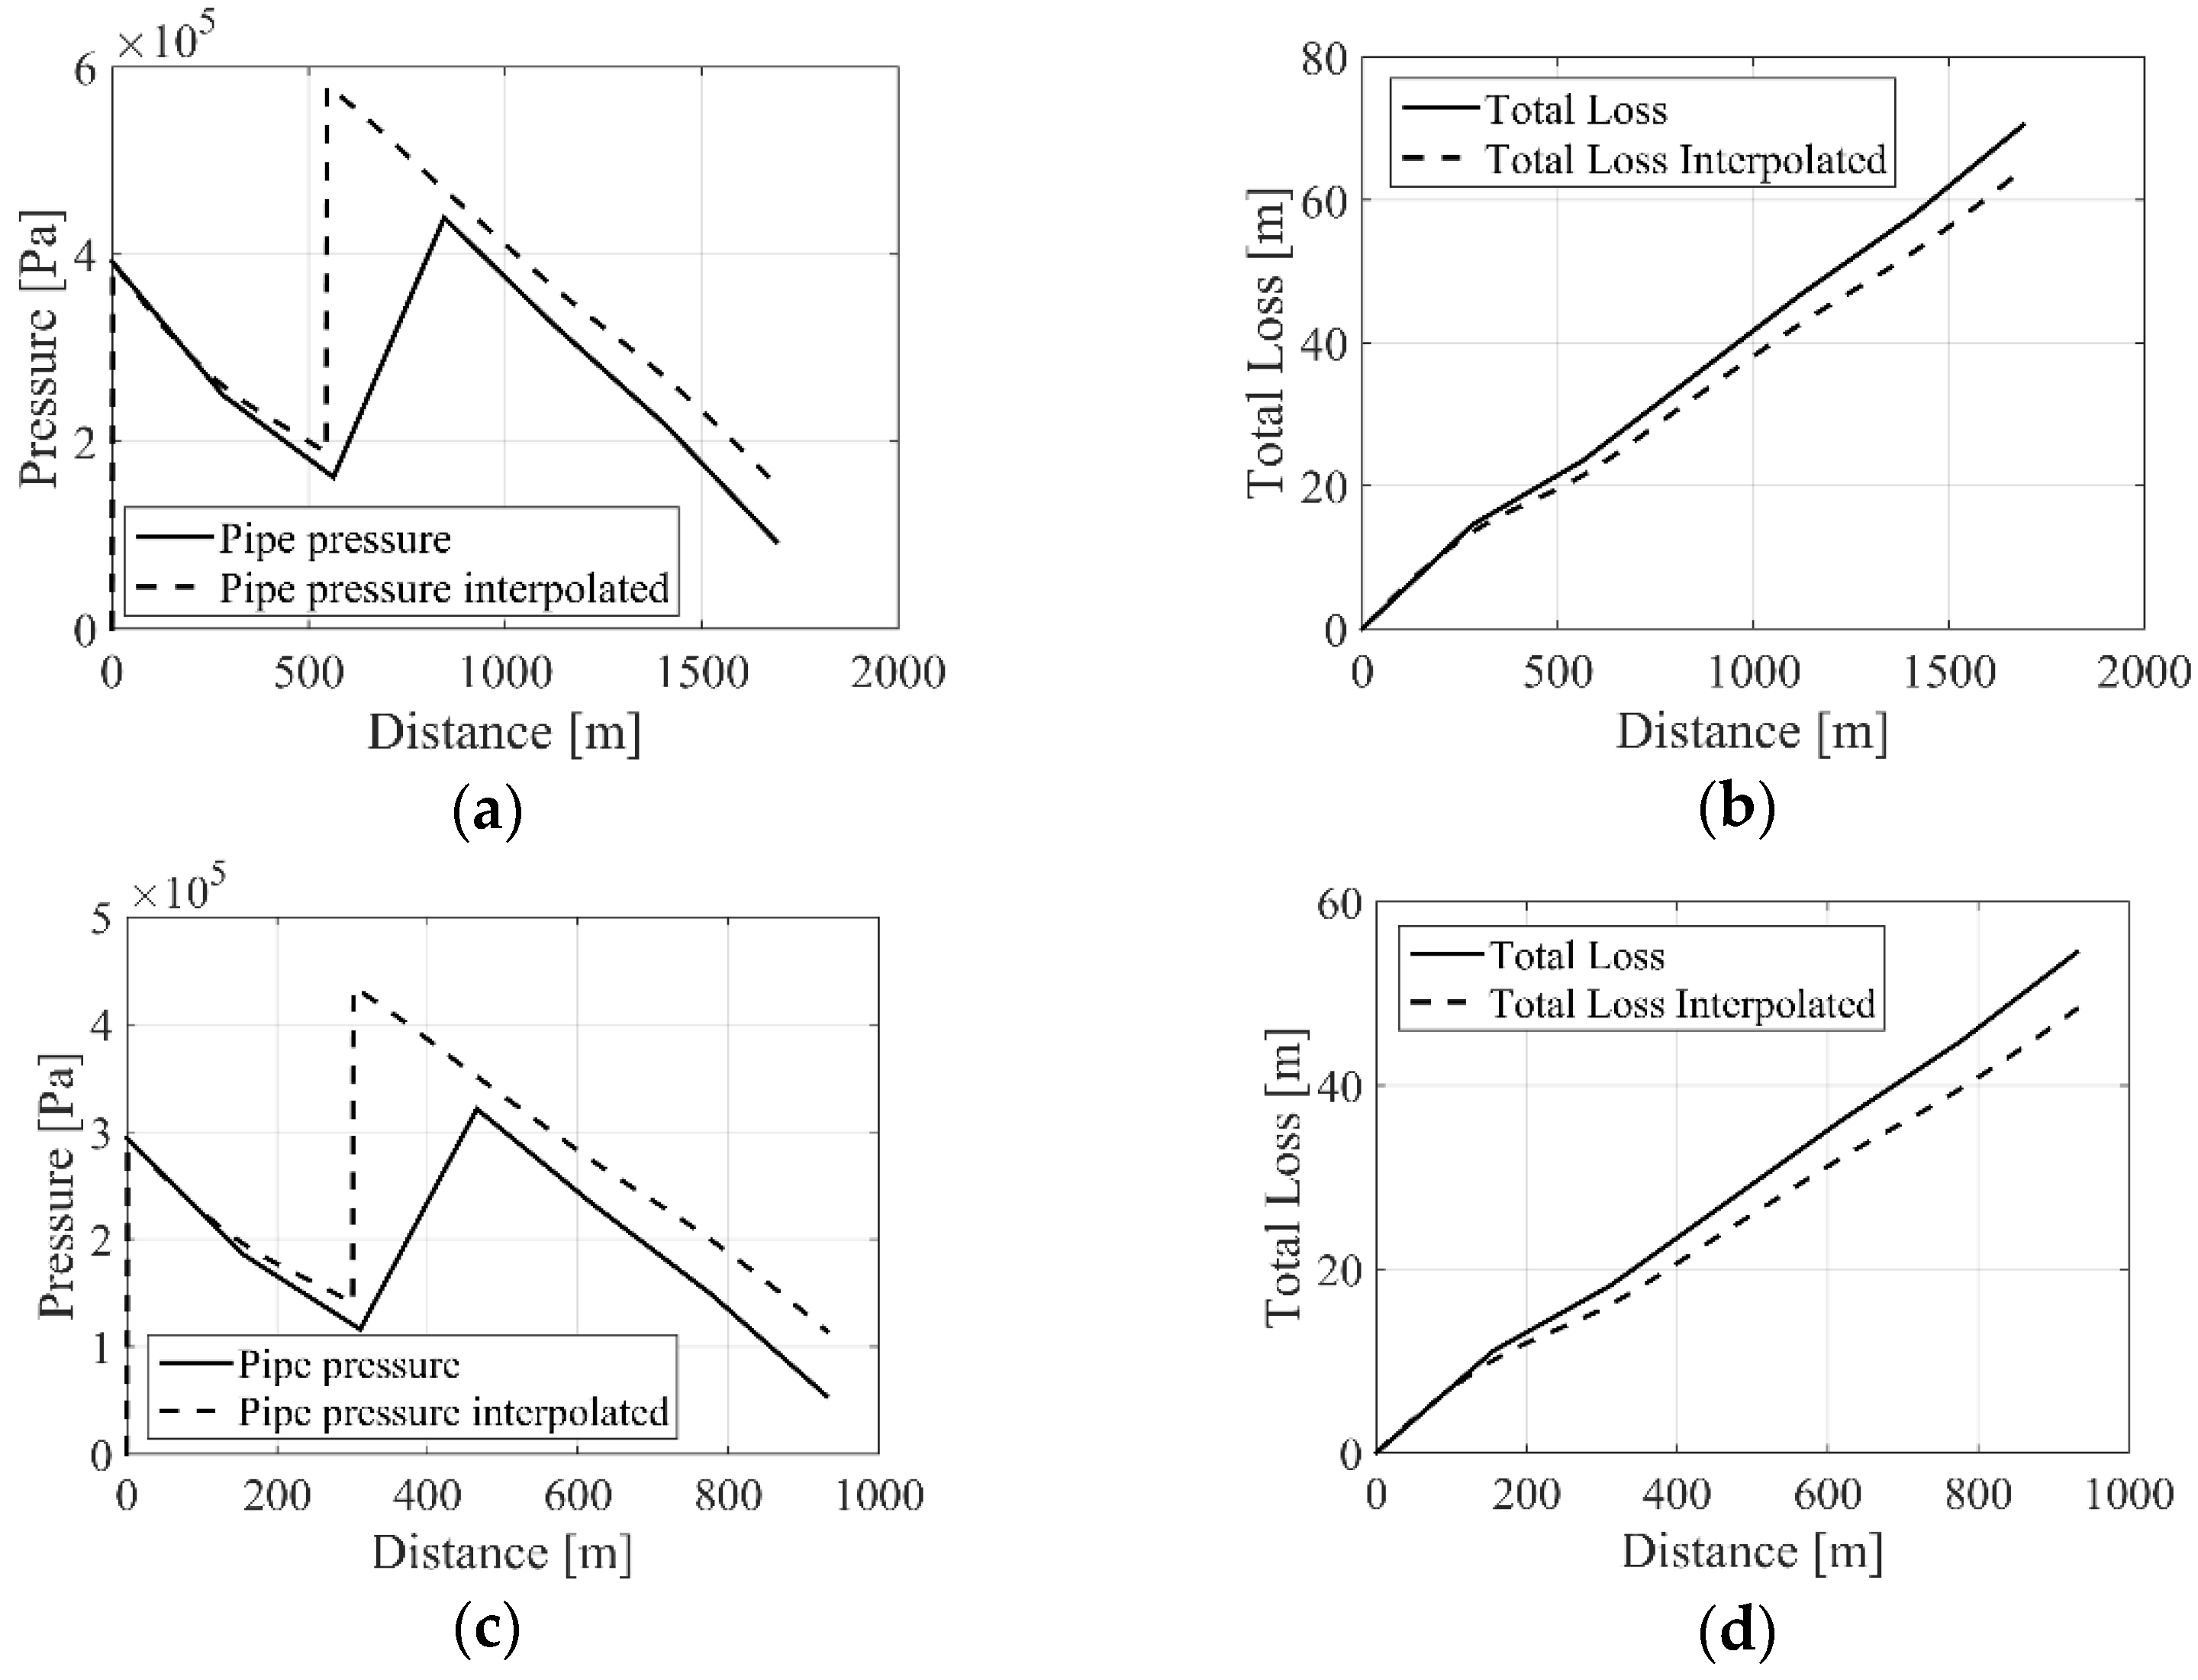
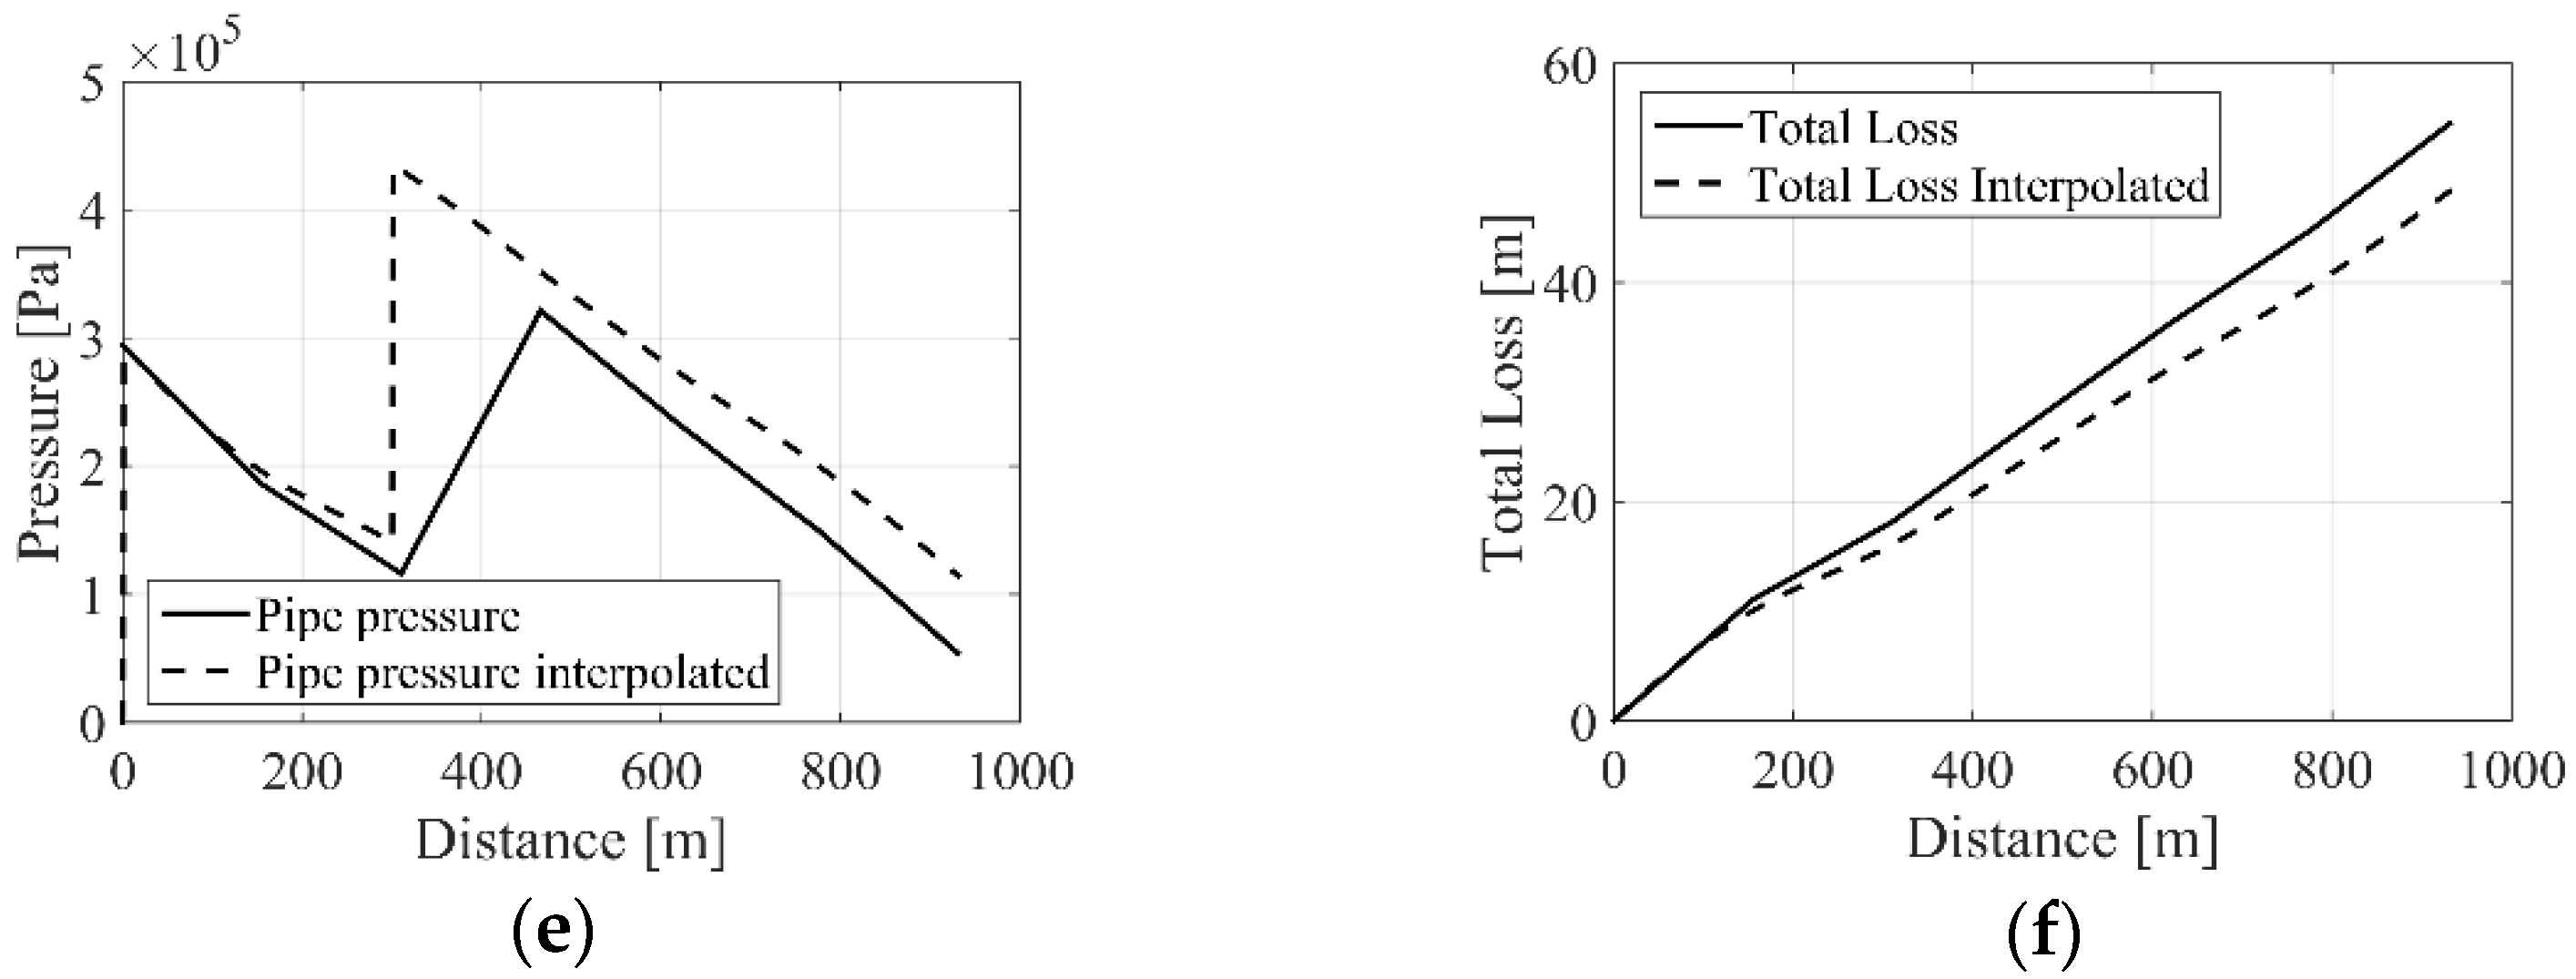
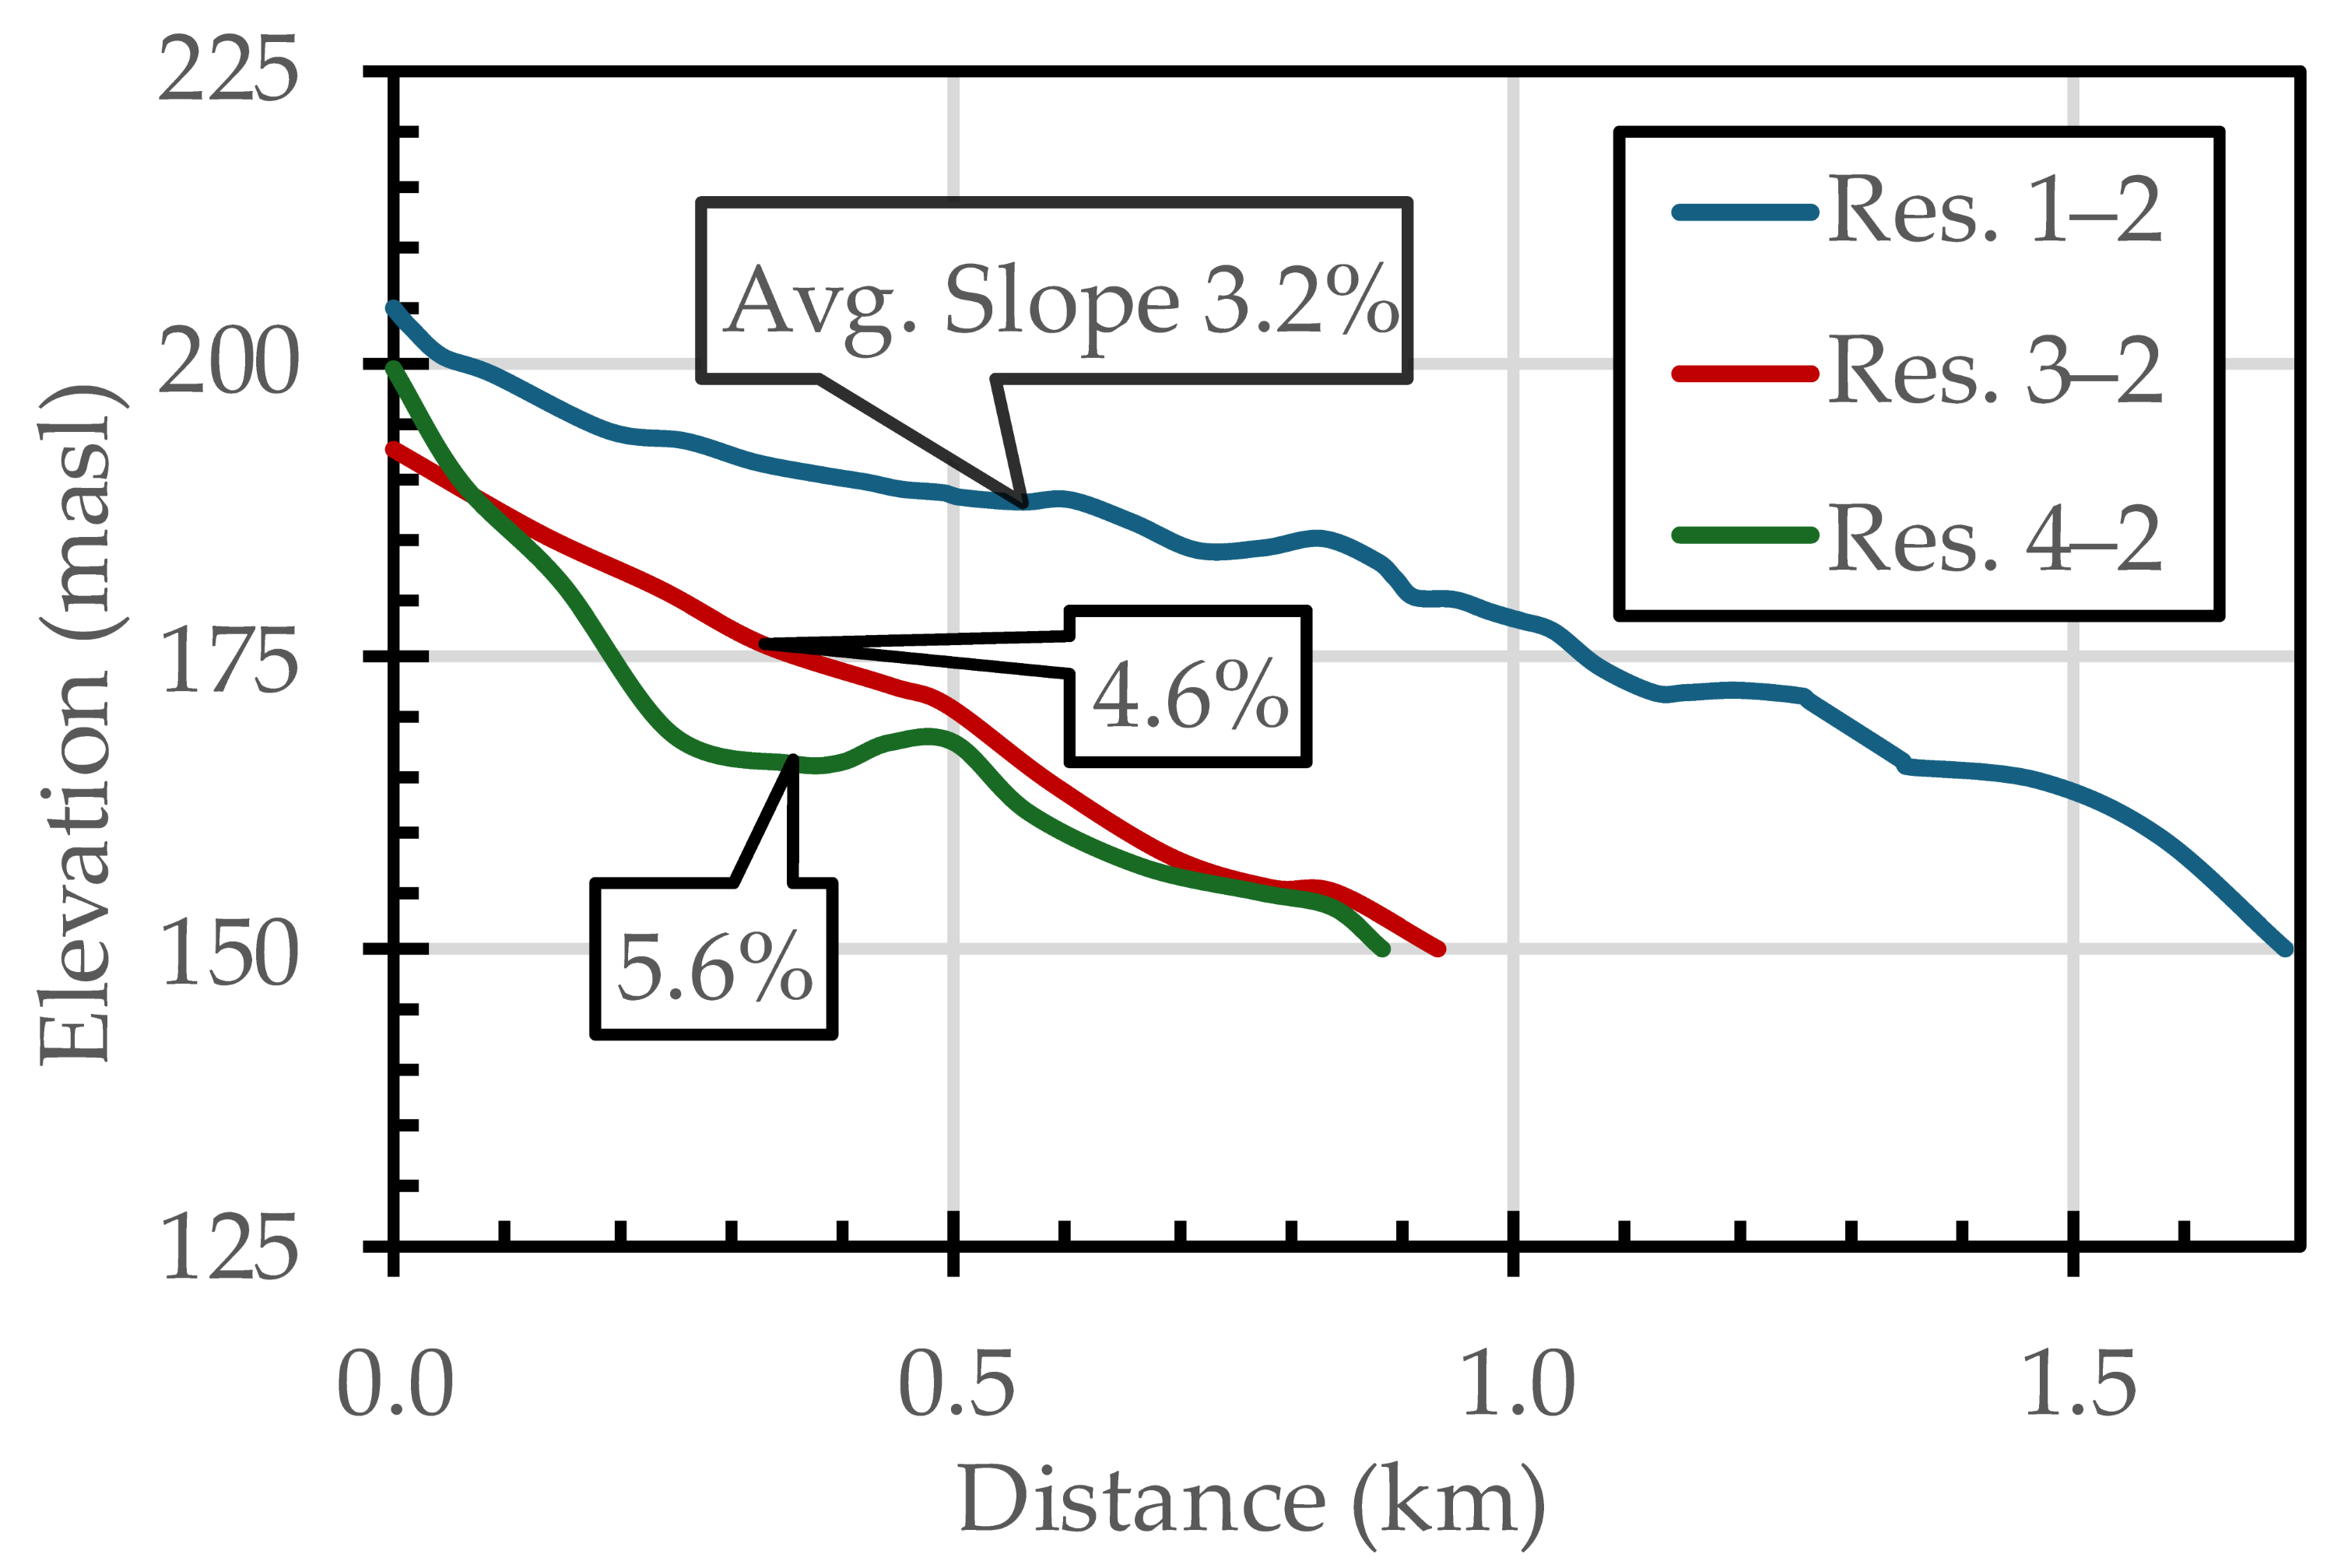
The pressure and loss in the pipes vary with distance.
Figure 10 summarizes the change in the pressure head, the change in hydrostatic pressure caused by the dynamic energy input of the pumps, and the head loss caused by pipe friction between the lower and upper reservoirs. The optimization considered pipe volume charging time, increased pump efficiency, and reduced investment costs. To this end, a dual pump system, comprising of an initial lift pump at Reservoir 2 and a booster pump near mid-length, worked to provide an optimum balance of efficiency and economy. The precise location of the booster depended on other minor losses. Two pumps reduced the lifting height per pump, which benefits the investment costs and the pump’s operating point, i.e., its efficiency.
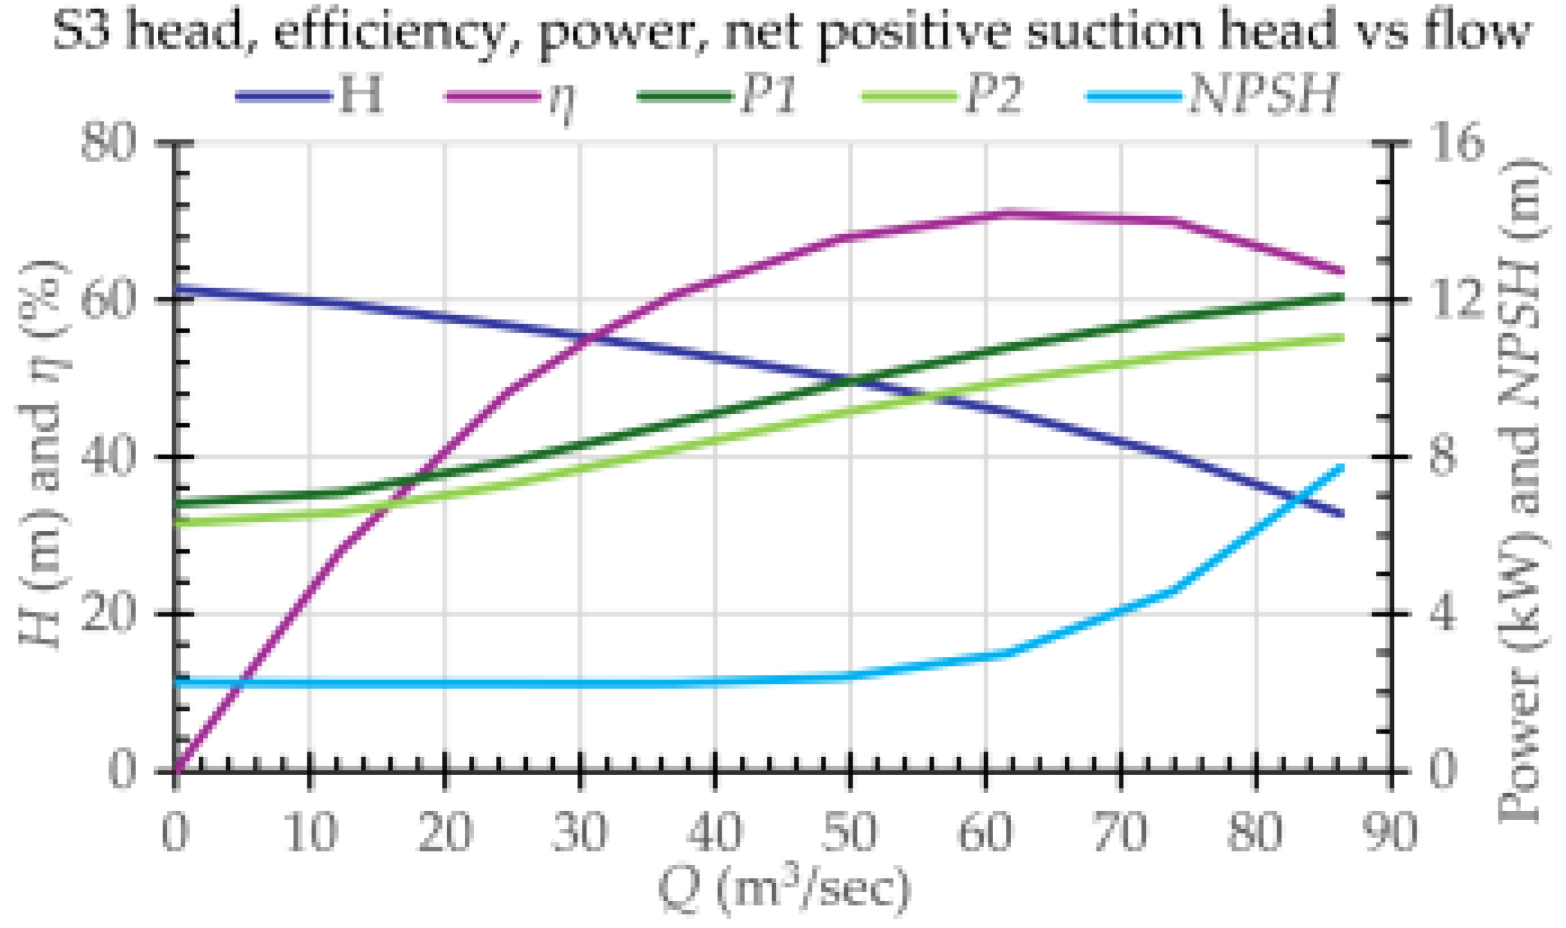
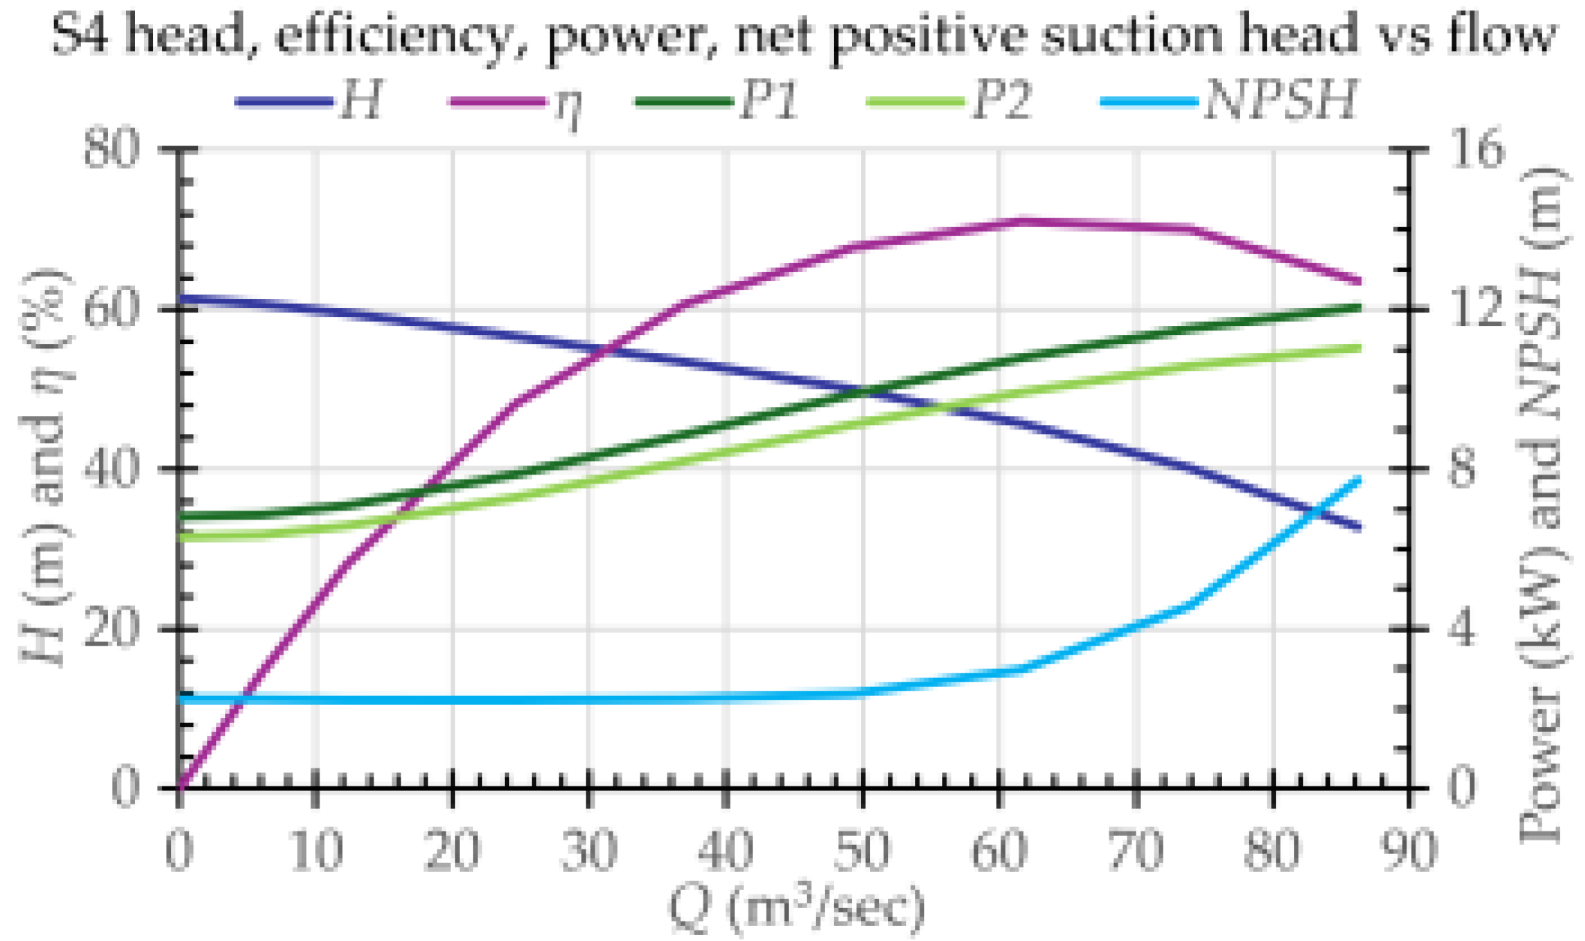
Based on the established parameters, Grundfos’ online database [
80] provided reasonable pump options for the PHES system (
Table 11). The calculated loss of energy due to pump operation is 217.7 MWh. Most of the hydro-storing process takes place in late spring or early summer when there is an enormous surplus of solar production—220.2 MWh in May-June-July—and enough retained or retainable rainwater to move from the lower to upper reservoirs, which cover hydraulic losses. The selected pumps are cost-effective at the time of investment. However, special, more efficient solutions could save money in the long-term operation of the system. This research does not aim at such economic optimization.
The current solar panel capacities with the planned hydro storage reservoirs can balance production and consumption from early April till late September based on the daily time series, based on daily solar production data between 1 June 2022 and 31 October 2024. From late September, the planned PHES system will switch to an energy-generating function as the moving average of the 7-day energy balance turns negative and remains negative until mid-spring. The present solar panel penetration (21%) on properties would require 228.7 MWh of hydro storage capacity. The planned PHES’s maximum energy-storing capacity—the total capacity of the 3 upper reservoirs using Equation (9)—is 18.5 MWh, as shown in
Table 12. which is far less than the year-round operation requires.
The 10-fold increase in the planned storage capacity—up to approximately 25 ha of surface area and 1.5 million m3 of water volume- to sustain year-round operation with existing solar panels is unrealistic. In contrast, doubling the number of solar panels—up to 42% of properties—radically changes the energy balance of production, consumption, and storage. The energy equalizing effect of the planned hydro storage capacity dramatically increases with the doubled solar production capacity. The required storage capacity drops to 25.2 MWh compared to 228.7 MWh of existing solar capacities, meaning that the planned reservoirs could almost fulfill the year-round energy demand. It is a sustainable operation that does not require the addition of external energy. The difference of 25.2 MWh (required storage capacity with doubled solar panels) and 18.5 MWh (planned storage capacity) can be partially supplemented by natural runoff retention in Reservoir 1 and by improving pump efficiency. Further increasing solar capacities, small-scale enlargement of reservoirs, or adding a fourth upper reservoir can fully serve the annual energy balance.
Equation (9) was used to calculate the storage capacity of the pumped hydro storage reservoirs: η was based on
Table 11, set to 70.6% or 62.8%; Q [m
3/s] was 0.06074 or 0.06131 m
3/s from
Table 9; H [m] is the height difference between upper and lower reservoirs., set to 54.5 m; 42.5 m and 49.5 m as shown in
Table 12. The t [s] represents the time to pump maximum hydropower capacity—the total working water volume—from Reservoir 2 to the upper Reservoirs 1, 3, and 4. Using pre-computed flow rates and flow velocities from
Table 9, the load times of each reservoir can be calculated (
Table 13).
The 7-day average of the existing solar production increases significantly in early March, as shown in
Figure 8 (
Section 4.3), and remains permanently above local consumption levels from April, as shown in
Figure 9 (
Section 4.3). As a result, the 4-week interval for the full recharge of hydro storage capacities (shown in
Table 13) is accomplished by mid-May at the latest. Therefore, the storage capacity will be fully recharged on 1 June. For the planned pumped hydropower development, the calculated daily amount of energy available in the upper reservoirs and its annual change are shown in
Figure 11 (blue), starting on 1 June, based on the actual solar energy production and electricity consumption of the last 2 years.
The orange line represents the expected amount of energy stored in the upper reservoirs and changes over the year when the solar capacity doubles. In the fall and especially the spring months, the number of days when solar-driven electricity can meet demand, such as pumped hydropower, significantly increases. At the same time, the necessary energy supply from external electricity power sources also decreases by almost an order of magnitude. The total annual electricity consumption of the settlement is 513.7 MWh. The green series illustrates the required daily external energy supplement with existing solar capacities, as well as with the implementation of the four reservoirs described in
Table 1, resulting in an annual average of 98.0 MWh (19.1% of total) electricity demand. The grey curve represents the scenario with doubled solar capacity, and with the implementation of the four reservoirs described in
Table 1, resulting in an annual average demand of 27.7 MWh (5.4% of total).
Currently, there is no green energy storage available in the settlement. A significant part of the solar energy produced is used outside the settlement or is lost, meaning that the total production only slightly supports local climate goals and the green transition. Even though the current total annual solar panel production is almost identical to the total annual electricity consumption, only a small portion is utilized locally.
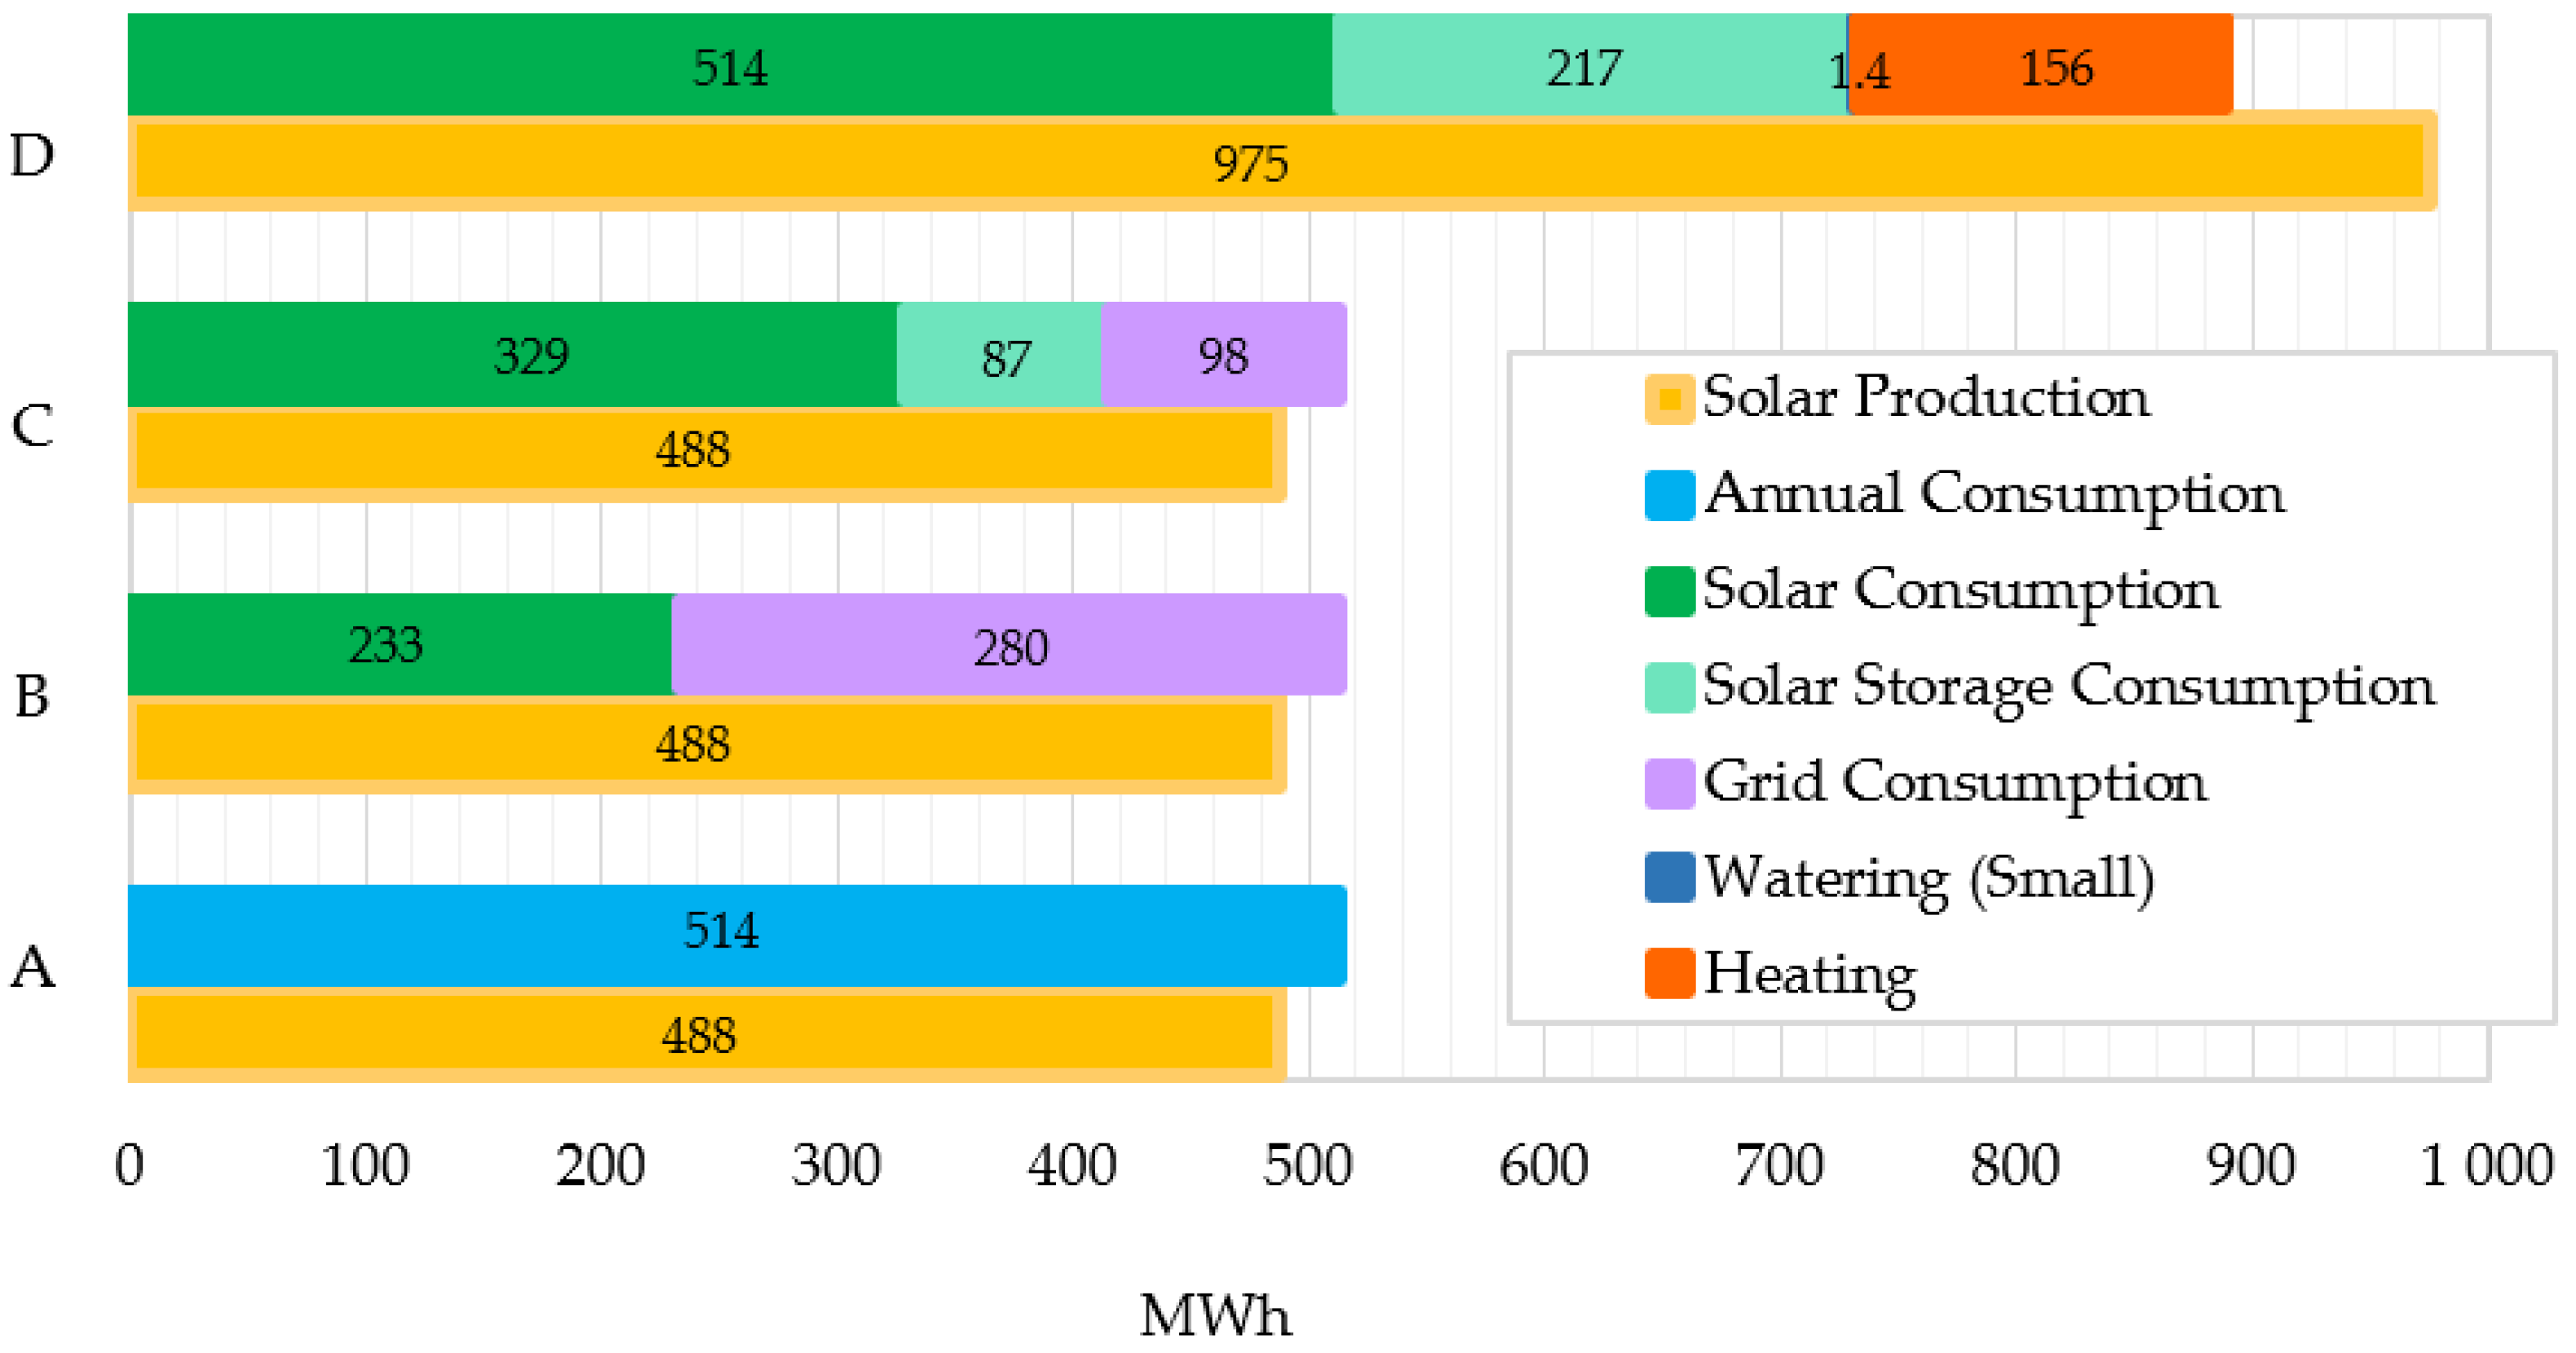
Figure 12 shows the scenarios of existing solar production with the supplement of hydropower reservoirs and with solar capacity doubling.
Figure 12 shows solar and planned hydropower energy production and consumption in four different scenarios. Presently, the existing annual solar production is about 488 MWh (
Figure 12-A, yellow), and the total annual electricity consumption without heating of the settlement is about 514 MWh (
Figure 12-A, light blue). These figures are approximately the same order of magnitude, allowing the settlement to be energetically self-sufficient based on these estimates. However, due to the variable nature of solar panel production, output is highly volatile and often differs from consumption needs. For this reason, only a part of the solar energy produced (233 MWh,
Figure 12-B, green) will transfer directly; the excess part (280 MWh,
Figure 12-B, magenta) feeds back into the distribution electricity grid or is lost if the grid is overloaded in peak hours and the solar inverters automatically switch off. Scenario B presents the current situation, characterized by a lack of energy storage. Implementing the planned multifunctional reservoirs (Scenario C,
Table 1, reservoirs) means the energy balance will change, and a higher proportion of locally generated solar energy (329 MWh,
Figure 12-C, green) will remain and be consumed locally with less electricity purchased (98 MWh,
Figure 12-C, magenta) from the grid. Although the operation of pumped hydropower reservoirs improves the local utilization rate of green energy and decreases the carbon footprint, the system’s operation requires energy. This system uses an average of 87 MWh per year, indicated in aqua in
Figure 12-C.
With the planned multi-purpose utilization of the reservoirs, the annual energy consumption increases and exceeds existing production. In order to fully utilize the storage facilities, it is necessary to expand the solar production capacities by approximately two-fold. The primary energy consumers are: 1. total annual electricity consumption of settlement; 2. energy loss due to pumping, hydro energy storage function; 3. total annual heating energy of households and pumping energy arising from irrigation/watering demand. Doubling the solar panel production capacity (975 MWh,
Figure 12-D, yellow) to operate with the planned PHES development already exceeds the total annual energy consumed by the different users; therefore, such an increase in solar production may bring a year-round self-sustaining, sustainable energy production-consumption balance. In addition, the reservoirs generate several co-benefits for the environment, for the economy, and for locals and tourists. In this scenario, the energy demand (217 MWh,
Figure 12-D, aqua) of the operator of the hydroelectric power plant itself appears among the consumers, which results from the friction of movement of water between upper and lower reservoirs and the working conditions of radial pumps, since the cycle is only about 70%. The remaining energy, which is a loss in the energy balance, can be replaced by solar panels, so green energy also covers this part of the process.
4.5. Financial and Environmental Impacts
The annual electricity mixtures and demands of the different scenarios are summarized in
Section 4.4,
Figure 11. The electricity unit price from the transmission network is €0.21/kWh, while the estimated unit price from local solar production is €0.03/kWh, and from local hydropower €0.05/kWh. The current conventional approach—partial local solar supply (233,222 kWh p.a.), partially purchase from transmission operator (280,481 kWh p.a.)—emits almost 80 tCO
2 every year. Compared to the old type of sourcing when electricity was taken only from the grid (over 128 tCO
2 p.a.), the carbon-emission has significantly decrease. Nevertheless, there is still room for decent improvement with the hydropower implementation and solar panel expansion as summarized in
Table 14.
Thought the implementation of the hydro storage reservoirs decrease the annual electricity bill and the carbon-footprint of the settlement, the solar capacity doubling results in further noticeable improvement. Annual CO
2 emission decreases to 41 tCO
2 p.a. Compared to the grid electricity operation (Scenario A), annual electricity expenditure drops by almost 70% and CO
2 emission by 75% in Scenario D. When comparing the latter with currently existing status (Scenario B), environmentally, the carbon footprint can be halved—with 39 tCO
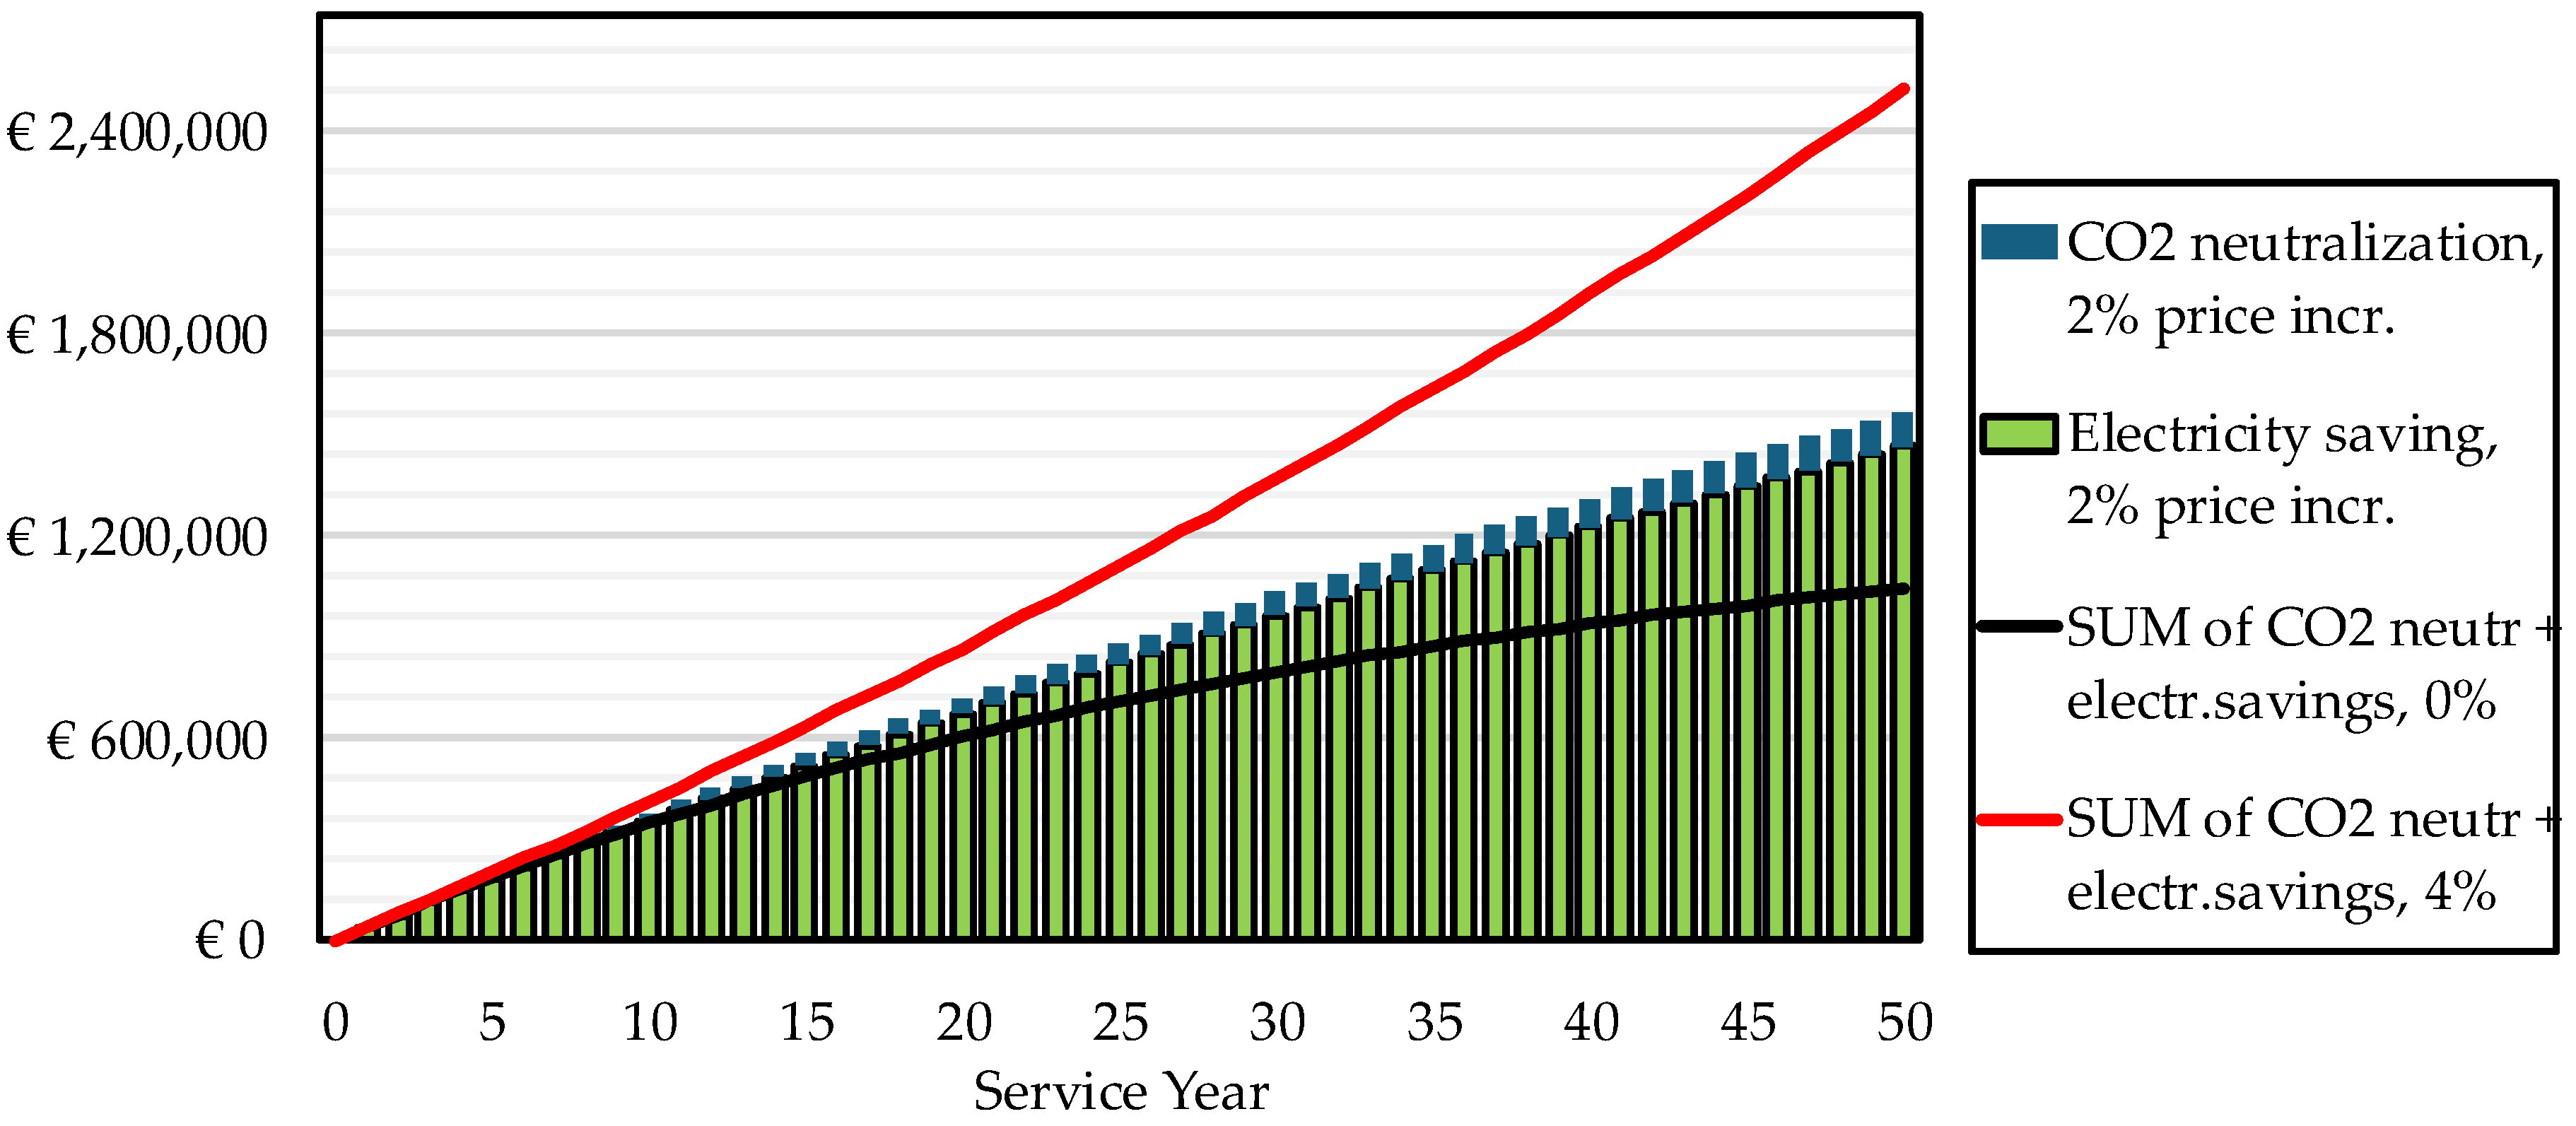
2 less emitted every year -, and financially, the annual electricity bill may be reduced by nearly 60%—with €38k savings annually. Discounting the savings on the electricity utility bill and the monetarized carbon-neutralization over the 50-year life cycle, it sums up to €1,045,507 without considering any price increases. When an average of 2.0% p.a. price increase is added to the calculation throughout the total period, the discounted value increases up to €1,568,599, and with a 4.0% p.a. average price increase—which is a moderate forecast—it goes up to €2,523,725 (
Figure 13, red). This calculated value could be spent on sustainable developments and still the investment pays off, it would be profitable.
The detailed evaluation of the different scenarios show that hydropower developments have decade long payback periods. On the other hand, when considering the relatively lower CO
2 neutralization cost of solar energy and hydropower compared to grid electricity the time of return on investment decreases. Furthermore, when the secondary benefits of multi-purpose reservoirs are added to the calculation, these social-environmental advantages somewhat balance the implementation and operation costs and shorten the time when combined green energies—as a solar-hydro energy system—outperform traditional solutions.
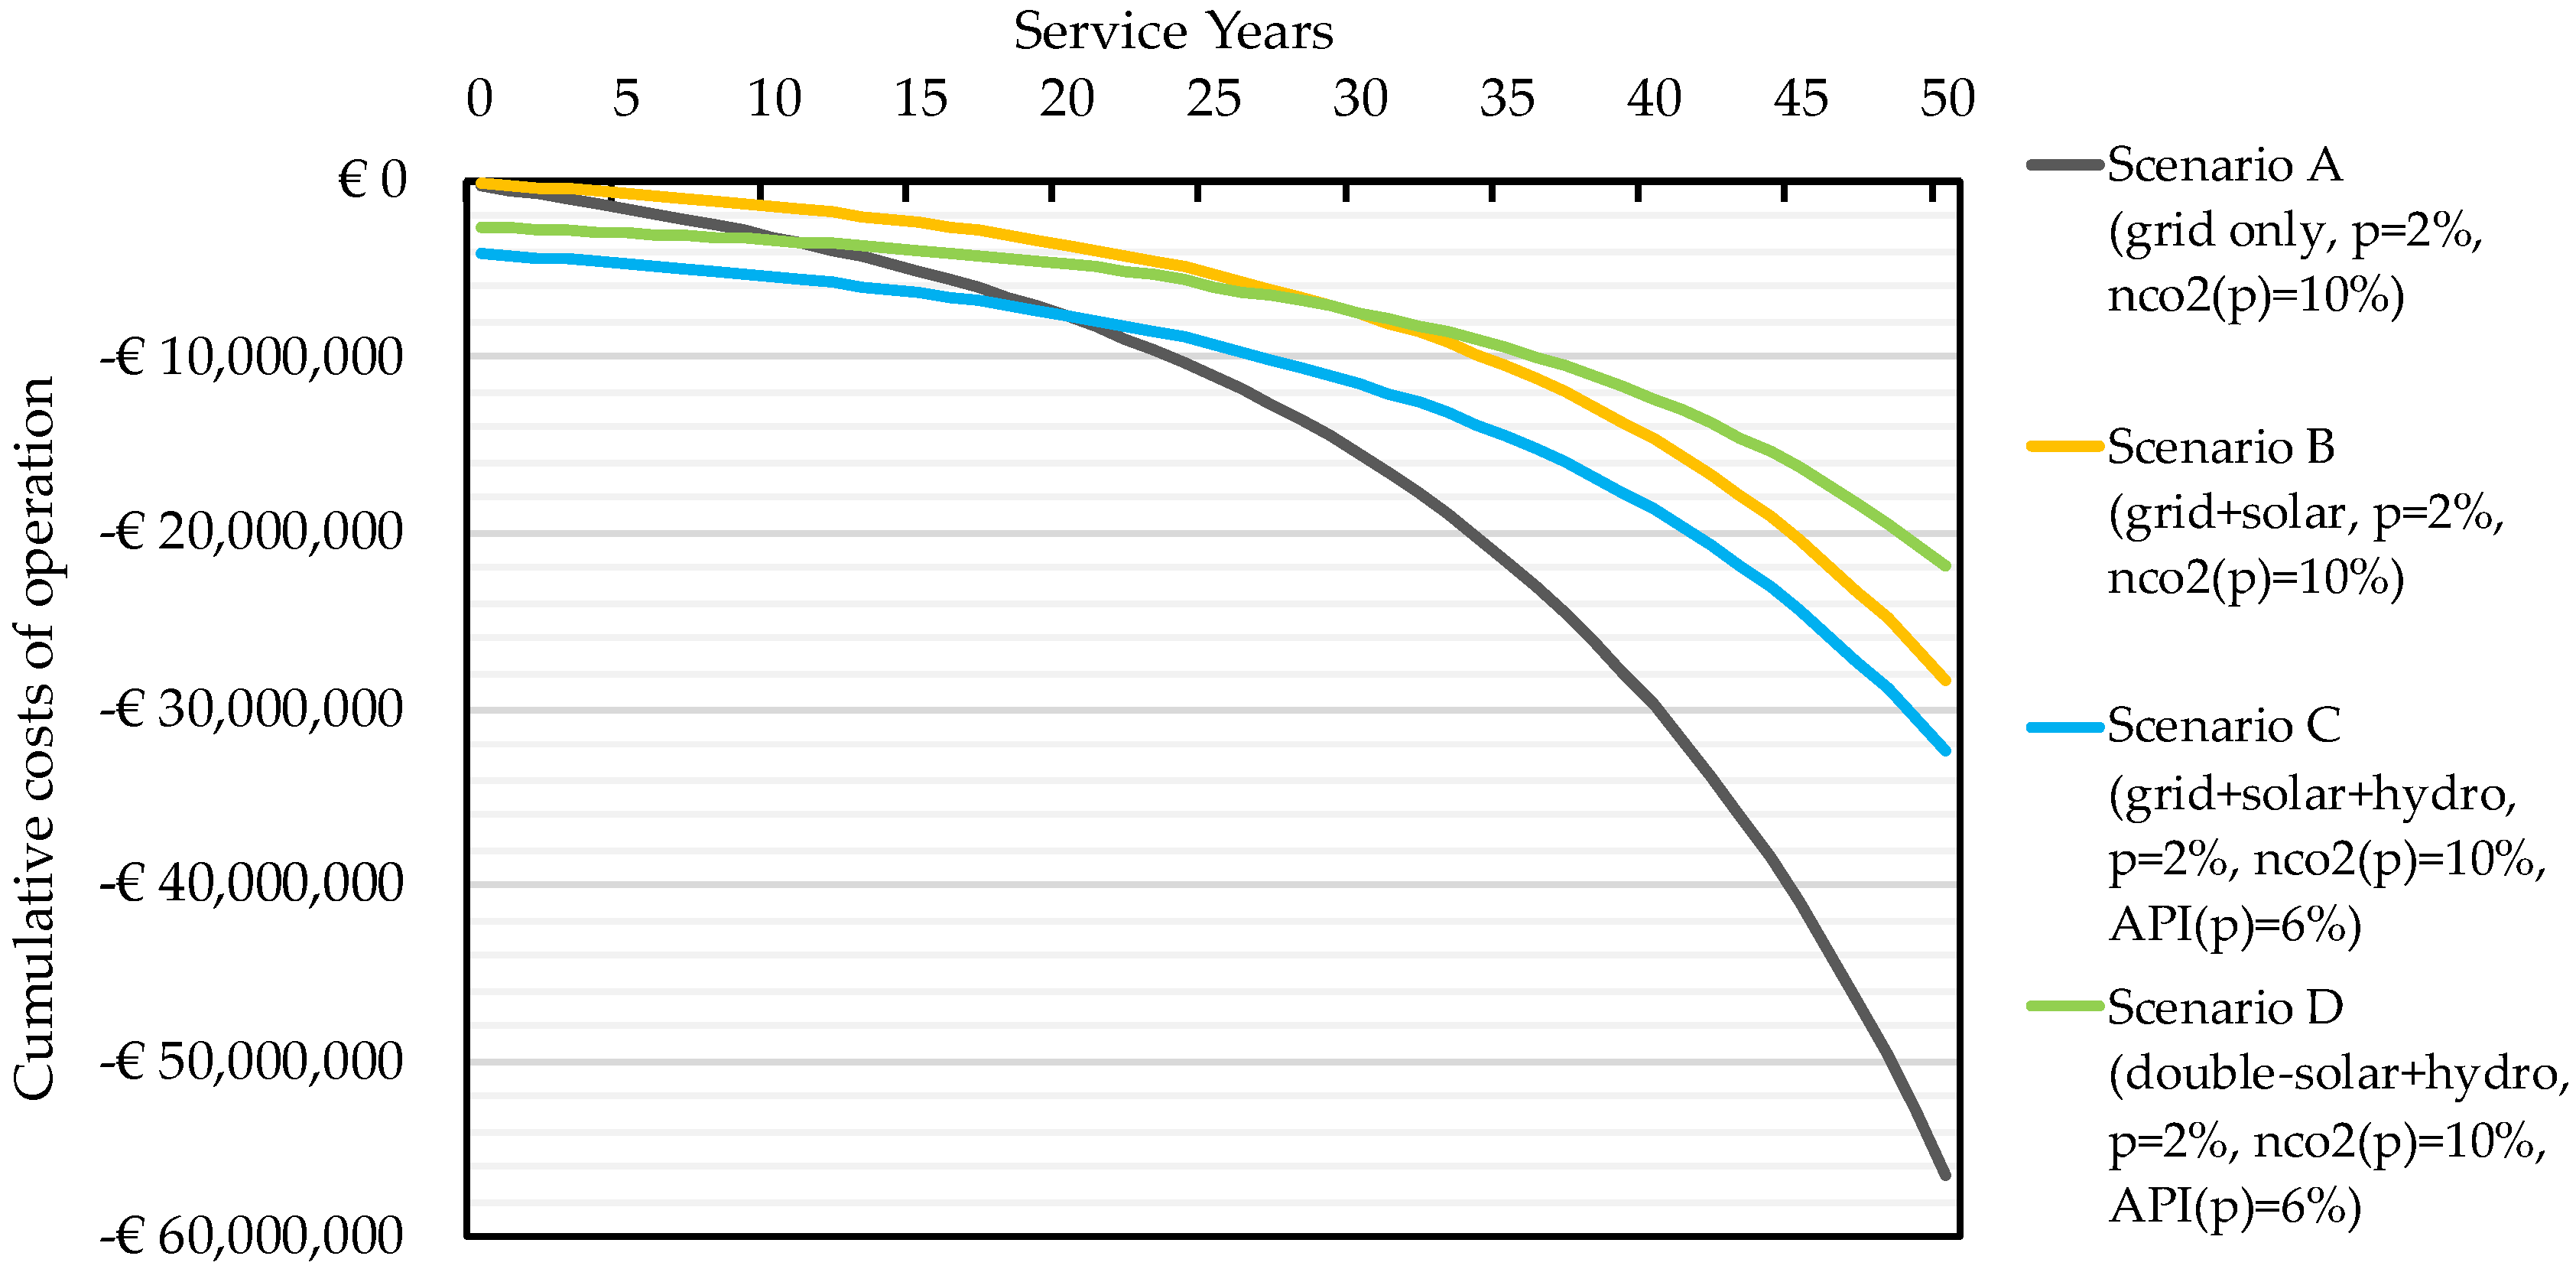
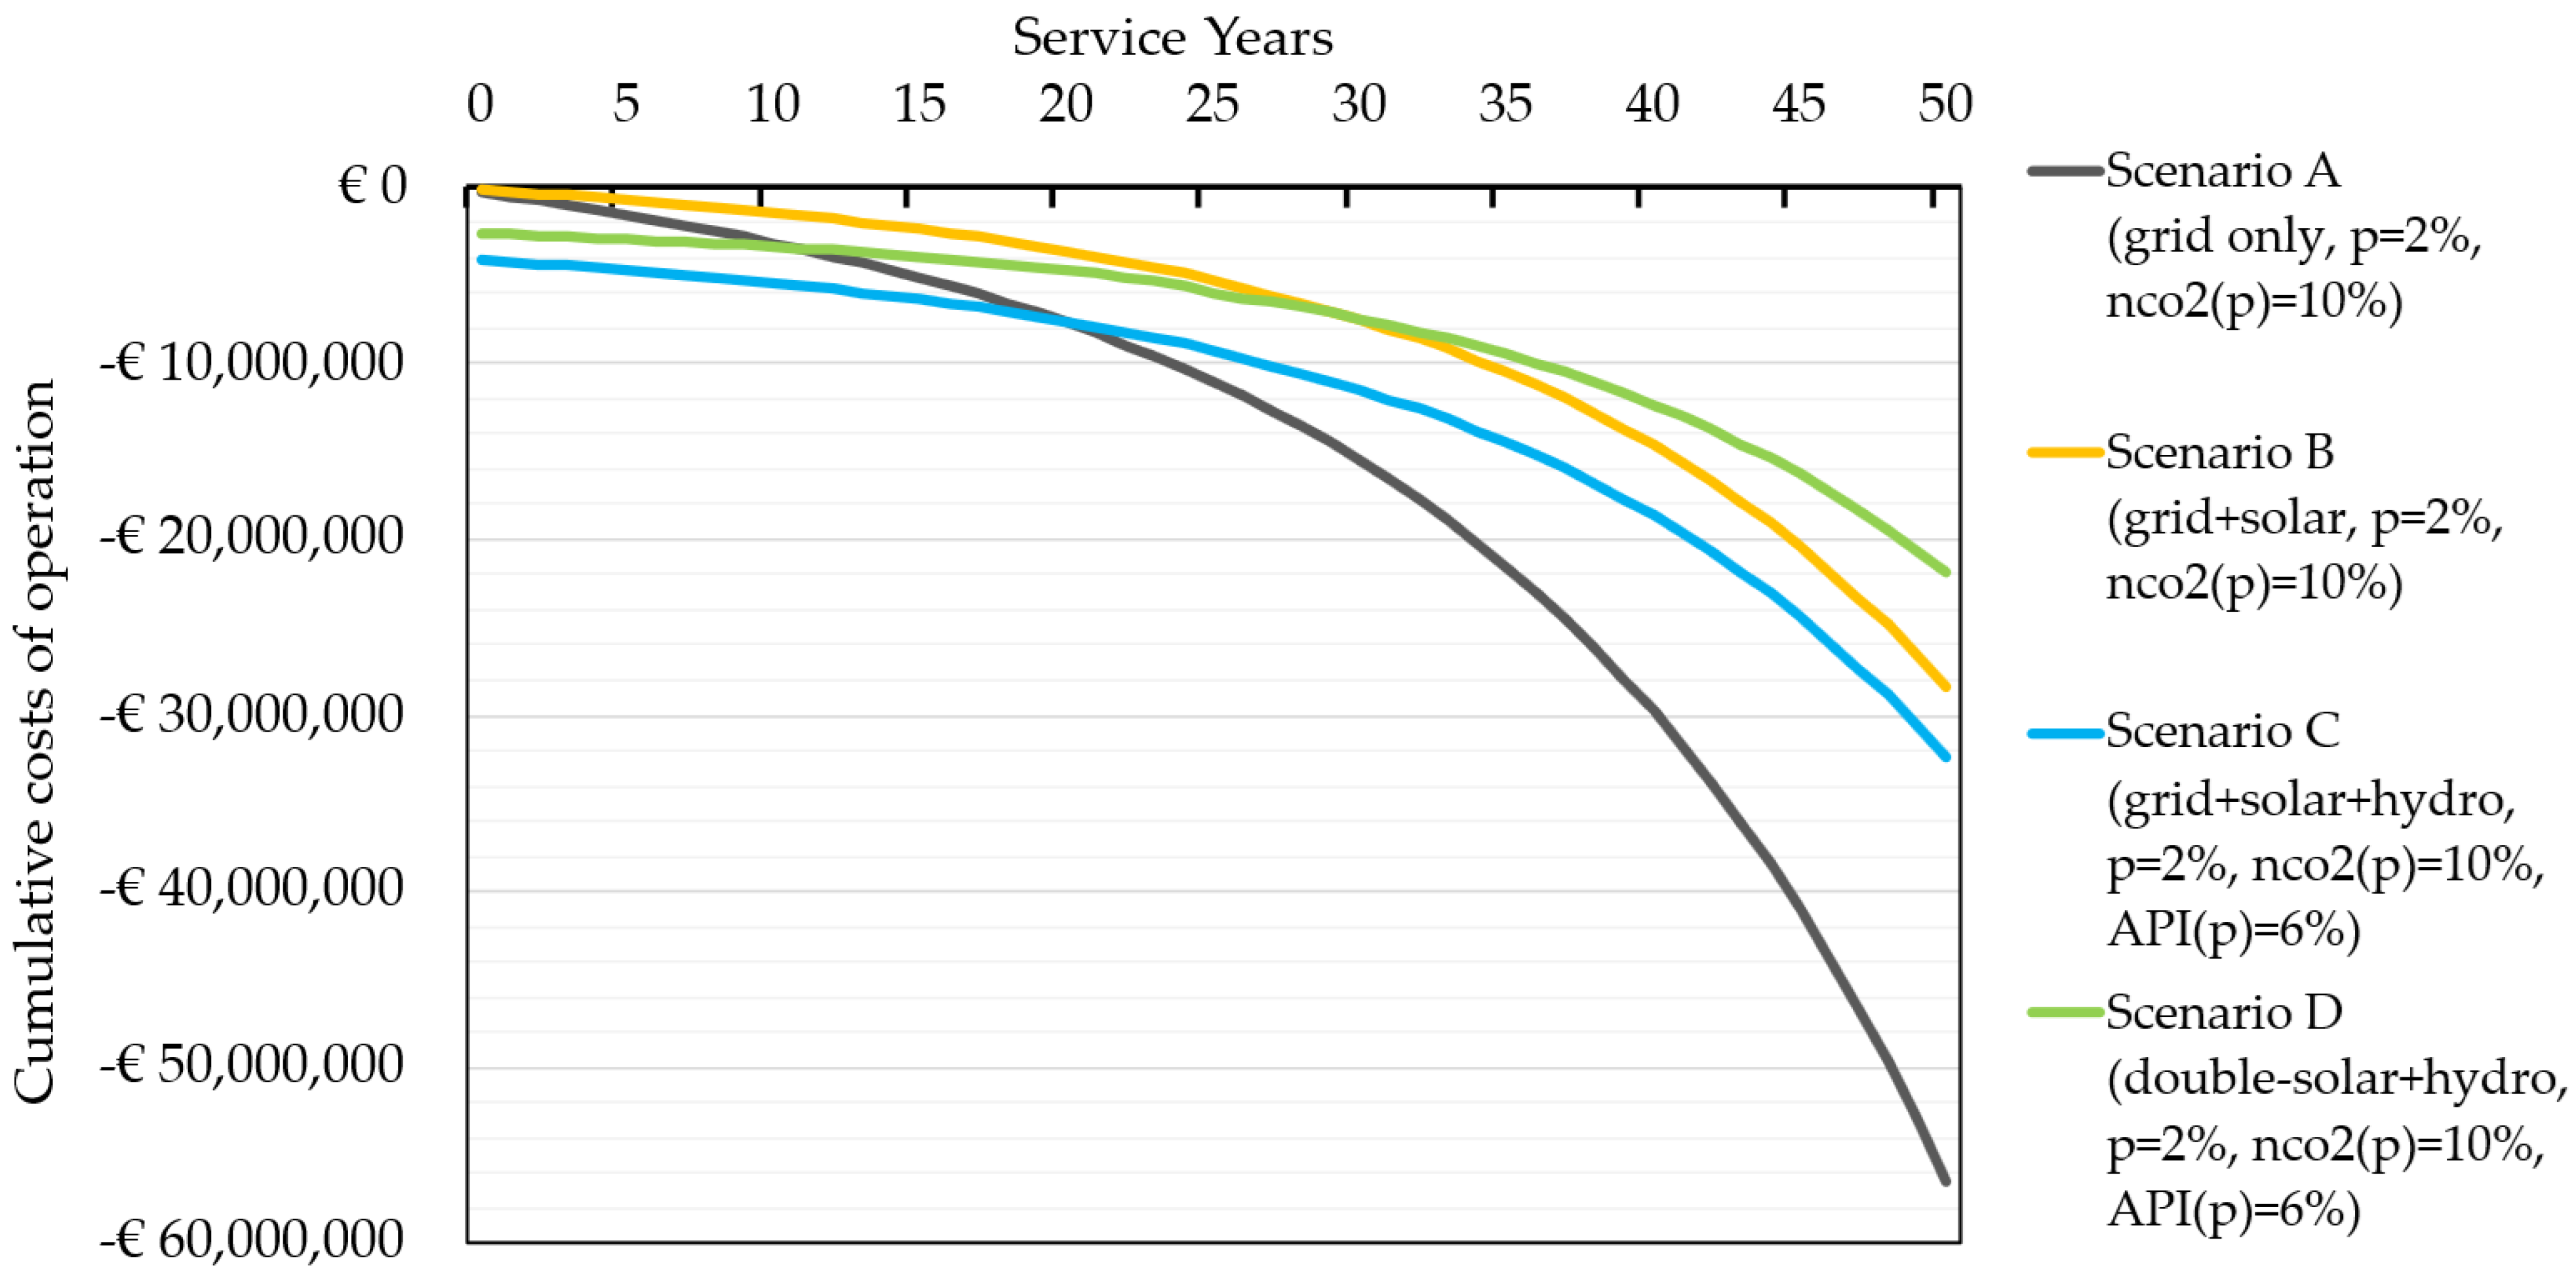
Figure 14 highlights that over the 50-year lifetime, the solar-hydro system has lower costs in a financial-social-economic assessment model than the other three scenarios. Additionally, the use of traditional grid energy is the least sustainable because even without any investment and implementation costs, the scenario shortly becomes the most expensive.
5. Discussion
The proposed integration of stormwater collection, energy storage, and solar panel expansion offers a multi-faceted solution for sustainable resource management, reducing a settlement’s vulnerability to climate-related and energy supply disruptions. By designing a closed-loop PHES system that reuses runoff and optimizes solar energy usage, the settlement can meet its energy needs year-round while supporting agricultural irrigation, wildlife hydration, and recreational opportunities.
Retaining surface runoff upstream of the settlement serves dual roles: stormwater management and hydropower storage. Stormwater collected in the upper reservoir mitigates storm impacts. It reduces flood risks while providing a steady water source for energy storage and secondary uses, such as irrigation and wildlife management. By retaining stormwater, Reservoirs 1 and 2 capture runoffs during wet months and ensure an adequate supply for drier periods, enabling more resilient water management.
The seasonal variability in rainfall volume and solar power production underlines the importance of storage systems for meeting energy needs and water demands throughout the year. Although solar output is high in summer, it decreases sharply in winter due to reduced daylight hours, lower sun angles, and fewer sunny days. Consequently, winter energy needs must rely on stored energy from PHES, designed to balance the seasonal differences by storing surplus summer solar energy for winter use.
The settlement’s irrigation and wildlife water demands are substantial, particularly during the dry summer when rainfall is scarce. Historical precipitation data indicate that summer irrigation needs vary between 52 and 63 days, depending on rainfall. With an annual irrigation demand of around 20,000 m3, Reservoirs 3 and 4’s planned capacity comfortably accommodates this requirement, ensuring reliable water availability without additional energy consumption, as water distribution is gravity-fed. Meanwhile, wildlife water needs are met by Reservoirs 1 and 4, which store around 1000 m3 of water specifically for this purpose, providing consistent support for wildlife throughout the year.
The settlement’s solar energy capacity is significant but insufficient to meet year-round demands. The settlement has installed around 1086 solar panels, amounting to a potential energy output of approximately 487.6 MWh annually. This output falls short of the settlement’s energy consumption, especially in winter. Doubling solar panel coverage to 42% of properties—or the missing part as a form of solar park on agricultural land, or as floating panels on the reservoir(s)—would drastically reduce seasonal energy shortages and help achieve a near-equilibrium, self-sustaining energy balance. However, PHES reservoir capacity must expand or integrate additional energy inputs to fully match production with demand.
During the last days of September, the period starts when the reservoirs fall short of their full capacity. At this turning point, daily production becomes noticeably shorter than the electricity demand—partly due to the rapidly decreasing daylight hours, partly due to the increased energy consumption, e.g., the increase in heating needs. As a result, the upper reservoirs’ resources—and thus the energy content—begin to decline. If the solar capacity doubles, the upper reservoirs’ decline begins only in early November, and the near-empty state is only a few weeks, compared to the present solar capacity case, when it is 4 to 5 months. With the doubled solar capacity, the average annual shortfall is only 5.7% (27.7 MWh) of the total demand, including operational losses and other energy requirements of the multifunctional operation of the reservoirs. Instead of further increasing solar capacity or reservoir sizes, several alternatives can fine-tune the system and nearly balance the energy state, meeting the total annual energy needs from extremely low CO2 emission green energy. One of these solutions exploits precipitation events and integrates natural hydrological processes into the system, such as retaining runoff.
From November 1, natural water replenishment has a new role, from replacing evaporation losses to stored potential energy. This natural water replenishment occurs in two forms: runoff (Reservoir 1) and precipitation falling directly on Reservoirs 1, 3, and 4. The role reversal works until the end of March, when solar panel output produces surplus energy exceeding consumption, and upper reservoirs no longer need replenishment. Therefore, the natural water replenishment from precipitation events as an energy source was only examined for 5 months, daily, between 1 November and 31 March.
Table 15 summarizes the monthly results.
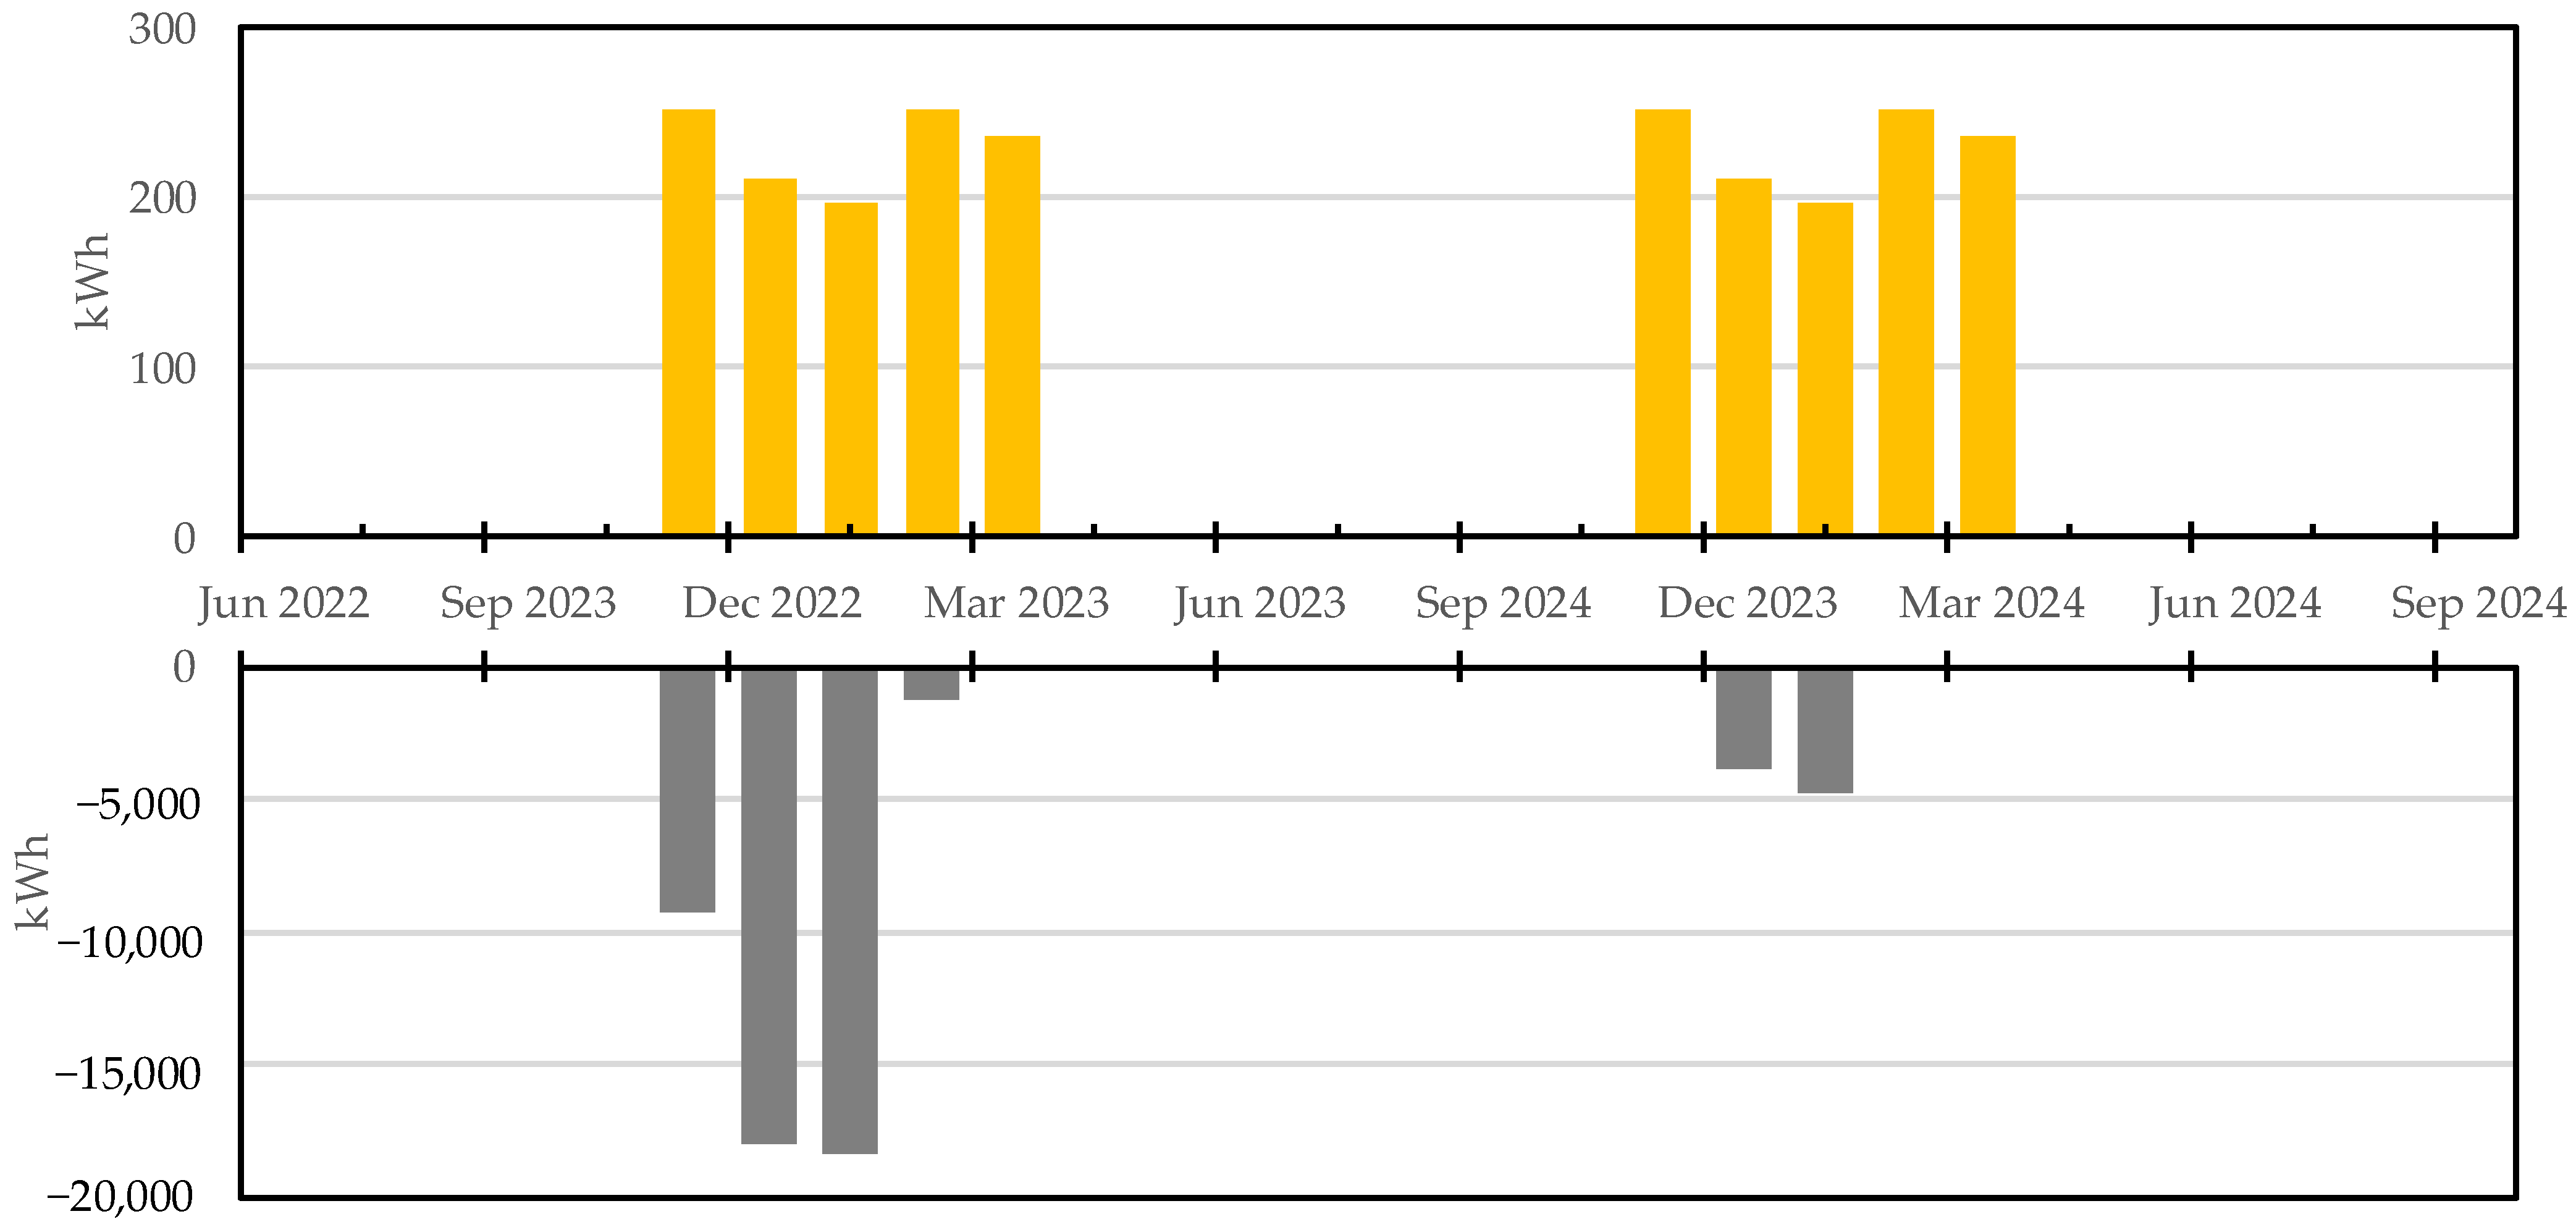
The average monthly rainfall volume originated from 20 years of data between 2002 and 2021. Direct rainfall on the reservoir is measured in actual volumes, while excess rainfall calculations subtract 1 mm per day. The surface area of the upper reservoirs and the monthly precipitation generate the direct volume of water stored. At the same time, Reservoir 1 also collects water resulting from runoff calculations via the rational method. Although the 1.1 MWh is only about 0.2% of the annual energy demand of the settlement, the planned pumped hydro storage system can reduce the annual energy shortfall by almost 4% (
Figure 15). A similar small step is to increase the working depth of reservoirs by 0.5 m (1.9 MWh reservoir capacity increase), which can reduce the deficit by a further 6.7%.
Winter 2022/23 began with a highly foggy and cloudy period. The irradiation was almost an order of magnitude lower than usual from the end of October until mid-December, resulting in low solar energy production. The beneficial effect of precipitation events could not have substantially compensated for this deficit. In contrast, the following winter (2023/24) started with a sunny period at the end of October and throughout November. As a result, with the planned hydro storage system, the energy deficit would have only emerged during January. In this case, stormwater management in the November-January period could have compensated a large part of the January deficit, and a partial green energy deficit would have occurred for only a few weeks throughout the winter. The orange columns indicate the energy gain achievable with properly designed stormwater management, while the gray columns indicate the extent of the monthly energy deficit.
Efficient pump operations are critical in managing the PHES system’s energy use. Significant energy is lost to pipe wall friction, which can account for up to 90% of operational energy losses in hydrodynamic systems. Selecting high-efficiency pumps and designing optimized pipe layouts can minimize these losses, resulting in a more sustainable and cost-effective system. The design calculations took into account flow rates, pipe dimensions, and pump head requirements, ensuring a balance between energy use and storage efficiency. In pump-system characteristic design, using off-the-shelf items simplified sizing calculations and ensured cost-effective implementation. Modifying these elements may significantly increase the efficiency of the hydrodynamic system, resulting in decreased pumping and friction losses, which amounts to 217.8 MWh annually in the present setup. However, in most cases, each intervention results in a multiplier effect, which thus promotes—or worsens, if not implemented—the achievement of the year-round energy balance in several stages. With an underground pipe network, the total annual loss can be reduced by 3% (6.5 MWh), as shown in
Table 16. Underground piping is especially important during the winter months, a period of low energy production, when user energy demands are at their highest.
Kinematic viscosity is calculated from the official reference values of ν(0 °C) = 1.79 mm2/s, ν(5 °C) = 1.52 mm2/s, ν(10 °C) = 1.31 mm2/s by the linear interpolation. The kinematic viscosity for underground placement: ν(20 °C) = 1.00 mm2/s. The increased head losses due to lower temperatures, resulting in higher kinematic viscosity, are calculated using Equations (12)–(15) for the winter period. With above-ground pipes, the temperature of the flowing water is lower in the winter months compared to the planned underground installation. In cold conditions, kinematic viscosity increases, resulting in higher friction losses for surface pipe placement; consequently, underground piping can achieve energy savings. The thermal energy from pump/turbine operation, supplemented by a heat exchanger, can be used to preheat the flowing water, reducing the friction loss of the system and improving its overall efficiency.
Redesigning pump operation between Reservoirs 2–3 and Reservoirs 2–4 could decrease annual losses by ~10% (22 MWh), thereby balancing the energy production, storage, and demand system. Pump operation between Reservoirs 1 and 2 has an efficiency of over 70% (see
Table 11). The other two systems, at 63%, can be improved with a few unique hydrodynamic system components. These systems have lifespans exceeding 50 years and promise sustainable, low-carbon solutions with significant returns over time. The high initial expenses, even with non-standard building components, may deter widespread implementation. Concerns about potential changes in future operational needs or unforeseen external factors can further inhibit rapid adoption [
81]. To address these challenges, creating adaptable pathways for decision-making and designing infrastructure for multifunctional use can expand the range of viable investment options. For instance, stormwater reservoirs can mitigate flash floods and support secondary uses such as irrigation, animal watering, and recreational activities, enhancing their overall value.
The PHES system’s multifunctional reservoirs facilitate many benefits beyond energy storage. These reservoirs provide secondary benefits, such as irrigation, recreational activities, and wildlife habitat support, thereby reducing overall costs and contributing to biodiversity and local resilience. This approach increases the return on investment by leveraging co-benefits, thereby reducing payback times and enhancing the project’s sustainability. The cost of solar energy systems has decreased significantly over the past decade, making solar power a competitive and accessible option for energy generation. With an oversupply in the global solar panel market, prices are expected to remain low, facilitating further expansion. This economic feasibility supports the development of new solar installations and the expansion of existing setups, as seen in Nadap’s proposed PHES project. However, capacity limitations in national transmission networks present a challenge; current infrastructure struggles to manage peak daytime loads from solar production, resulting in restrictions on new installations to prevent network overload. PHES can alleviate this issue by storing excess solar energy locally and releasing it during peak demand times, thus stabilizing the grid and maximizing the efficiency of solar energy. This capability to store energy during negative electricity prices (when the grid operator essentially pays for energy intake) and releases it during high-demand hours offers an additional revenue stream that could shorten the payback period.
With the worsening effects of climate change, environmental sustainability is becoming increasingly important. The environmental costs—whether direct or indirect—of maintaining fossil fuel production are significant—even with the most modern, unconventional extractions—as are the costs of neutralizing their high CO
2 emission released into the atmosphere. Consequently, the transition to green energy systems has received increasing attention, and their spread is accelerating globally. Although in sort term hydrocarbon energy seems to be a more advantageous investment, when investigated in the long term, and all their negative effects are monitored and quantified, they far underperform green energy sources, as shown in
Figure 13. The exploitation of hydrocarbons also carries social and ecological risks, while green energy sources (solar energy, wind energy, hydropower) produce energy without natural hazards or water conflicts [
82]. Water will be a highly valued resource in the coming decades, making its conservation essential. Collecting and optimizing water use are key strategies. PHES operations should minimize water loss by using shading with solar panels to reduce evaporation (e.g., Reservoirs 3 and 4), siting reservoirs in forested areas (as Reservoir 1), or in artificial or natural underground reservoirs, or even employing heat exchangers to recover thermal energy while conserving water resources.
Multi-purpose reservoirs also offer cross-disciplinary benefits by simultaneously supporting diverse needs. While a single-purpose reservoir may not deliver immediate returns, incorporating multiple functions can enhance the financial viability of these projects by reducing the payback period. PHES, for instance, uses water’s potential energy to stabilize electricity transmission. However, multifunctional use can also support agricultural needs during droughts, increase food security, bolster wildlife management, and attract recreational tourism. Additionally, by leveraging variable electricity tariffs throughout the day, these reservoirs can generate significant revenue to fund further renewable energy projects.
Figure 16. shows how payback period changes by modifying model input parameters over the 50-year lifecycle.
The gray trend lines refer to the conventional energy supply, meaning that all necessary electricity is taken from the grid, all electricity users fully rely on the transmission network operator. The different scenarios represent different levels of hydrocarbon energy price increases, with varying unit carbon-dioxide neutralization costs. The different green lines illustrate how hydropower green energy life-time costs may reduce by worsening climatic conditions, increasing fossil energy prices, expansion of cooperative water users at reservoirs, increasing government intervention and increasing costs of CO
2 neutralization. The solid grey line represents the baseline scenario—2% average energy price increase and 8% average annual CO
2 neutralization cost increase. The grey dashed line represents a more favorable case (p = 1%; NCO
2 = 5%), while the grey dotted line represents energy Scenario A in a less favorable case, with higher price and cost increase dynamics (p = 2.5%; NCO
2 = 12%). Due to the unfavorable climate change dynamics experienced in recent years, the higher increase dynamic case is more likely in the short and medium timeframe. As a result, the long-term costs of traditional electricity supply turn significantly negative and the cost gap widens significantly compared to scenario D—sustainable solar driven hydropower system with multifunctional reservoirs. In
Figure 14, the green line and the red dashed curve show the discounted value of Scenario D with low price-cost dynamics, while the green and red dotted lines show the high price dynamics scenario. The long-term exponential dynamics of the present value is mainly influenced by price trends, while the expansion of water users and the multifunctionality of reservoirs have a noticeable impact on the slope of the curves. In the case of the modeled scenarios, with lower price change dynamics, the contribution is smaller of multifunctional use—approx. 7%–, but with higher price changes and CO
2 neutralization costs, multifunctional use can reduce the discounted present value of the costs in the 50-year operation time by almost one-third (32.7%).To successfully implement PHES and its integrated blue-green infrastructure, involving local communities and stakeholders in planning and decision-making is critical. Stakeholder engagement ensures that the functions and benefits of each component align with community needs, thereby enhancing support and reducing operational risks. Despite thorough planning, unforeseen challenges may still arise, and preemptive strategies are necessary to manage potential constraints, such as prolonged sunlight shortages, extreme drought, or other limiting factors. Developing an exclusion and disconnection protocol and prioritizing supply needs under such conditions will be essential to maintaining system resilience.
6. Conclusions
Integrating stormwater collection, energy storage, and solar panel expansion provides a comprehensive approach to sustainable resource management, enhancing resilience to climate and energy-related disruptions. This closed-loop PHES (Pumped Hydro Energy Storage) system efficiently harnesses solar energy and stormwater runoff to meet energy demands year-round while supporting essential needs such as agricultural irrigation, wildlife hydration, and recreational use. Managing stormwater in an upper reservoir reduces flood risks and provides a steady water source for energy storage and secondary uses, enabling more resilient water management. The PHES system can offset seasonal variations in rainfall and solar production, storing excess summer solar energy to fulfill winter needs when the solar output is lower. With the settlement’s irrigation needs high during the dry summer, the dedicated reservoirs supply water without additional energy input, relying on gravity-fed distribution. This approach conserves resources and reduces operational costs. Doubling the solar panel capacity to cover 42% of properties would address seasonal energy shortages; however, increased PHES capacity is also essential to balance supply and demand.
Efficiency in pump and pipe design minimizes energy losses in the PHES system, making it more cost-effective and sustainable. Additionally, multifunctional reservoirs provide diverse benefits—such as irrigation, recreational activities, and wildlife support—that increase the system’s economic and ecological value, thereby enhancing its return on investment and sustainability. Scaling up solar infrastructure and reservoir capacity could further bolster long-term resilience. However, this requires significant community involvement to ensure the system meets local needs and gains social acceptance.
Investing in large-scale infrastructure, such as PHES, can be costly and requires decades to return, yet multifunctional designs can accelerate the return by serving multiple purposes. Expanding solar infrastructure becomes more feasible with decreasing solar panel costs; however, connecting to national transmission networks will require effective management. PHES addresses this by storing excess solar energy locally, reducing grid strain, and stabilizing electricity supply during peak demands, potentially generating revenue to fund further renewable projects. Nationwide scaling of solar and PHES systems, as well as existing and planned nuclear power plants, could lead to a self-sustaining energy infrastructure, minimizing reliance on fossil-based technologies and imported energy. A phased approach, prioritizing areas with favorable conditions, is crucial for minimizing environmental impacts while addressing social and geographical needs.
Multi-purpose PHES reservoirs deliver broader economic returns by stabilizing energy supply and supporting agriculture, wildlife, and tourism, while variable electricity tariffs present further revenue opportunities. Community involvement and stakeholder engagement in planning and decision-making are crucial for aligning system benefits with local needs, thereby enhancing support and mitigating risks. Addressing unforeseen challenges through preemptive strategies, such as prioritizing supply needs during shortages, will be crucial for maintaining the system’s resilience in an evolving climate and energy landscape.
