

Multi-Criteria Assessment of Flood Risk on Railroads Using a Machine Learning Approach: A Case Study of Railroads in Minas Gerais

 , , ,
, , ,
Abstract
1. Introduction
- 1.
- What are the railroad’s main points of vulnerability in relation to extreme weather events, such as heavy rainfall?
- 2.
- How might the estimated service life of the railroad be affected by climate change and an increase in the frequency of heavy rainfall?
- 3.
- How can new approaches such as machine learning help evaluate the performance of existing drainage systems?
2. Literature Review
3. Materials and Methods
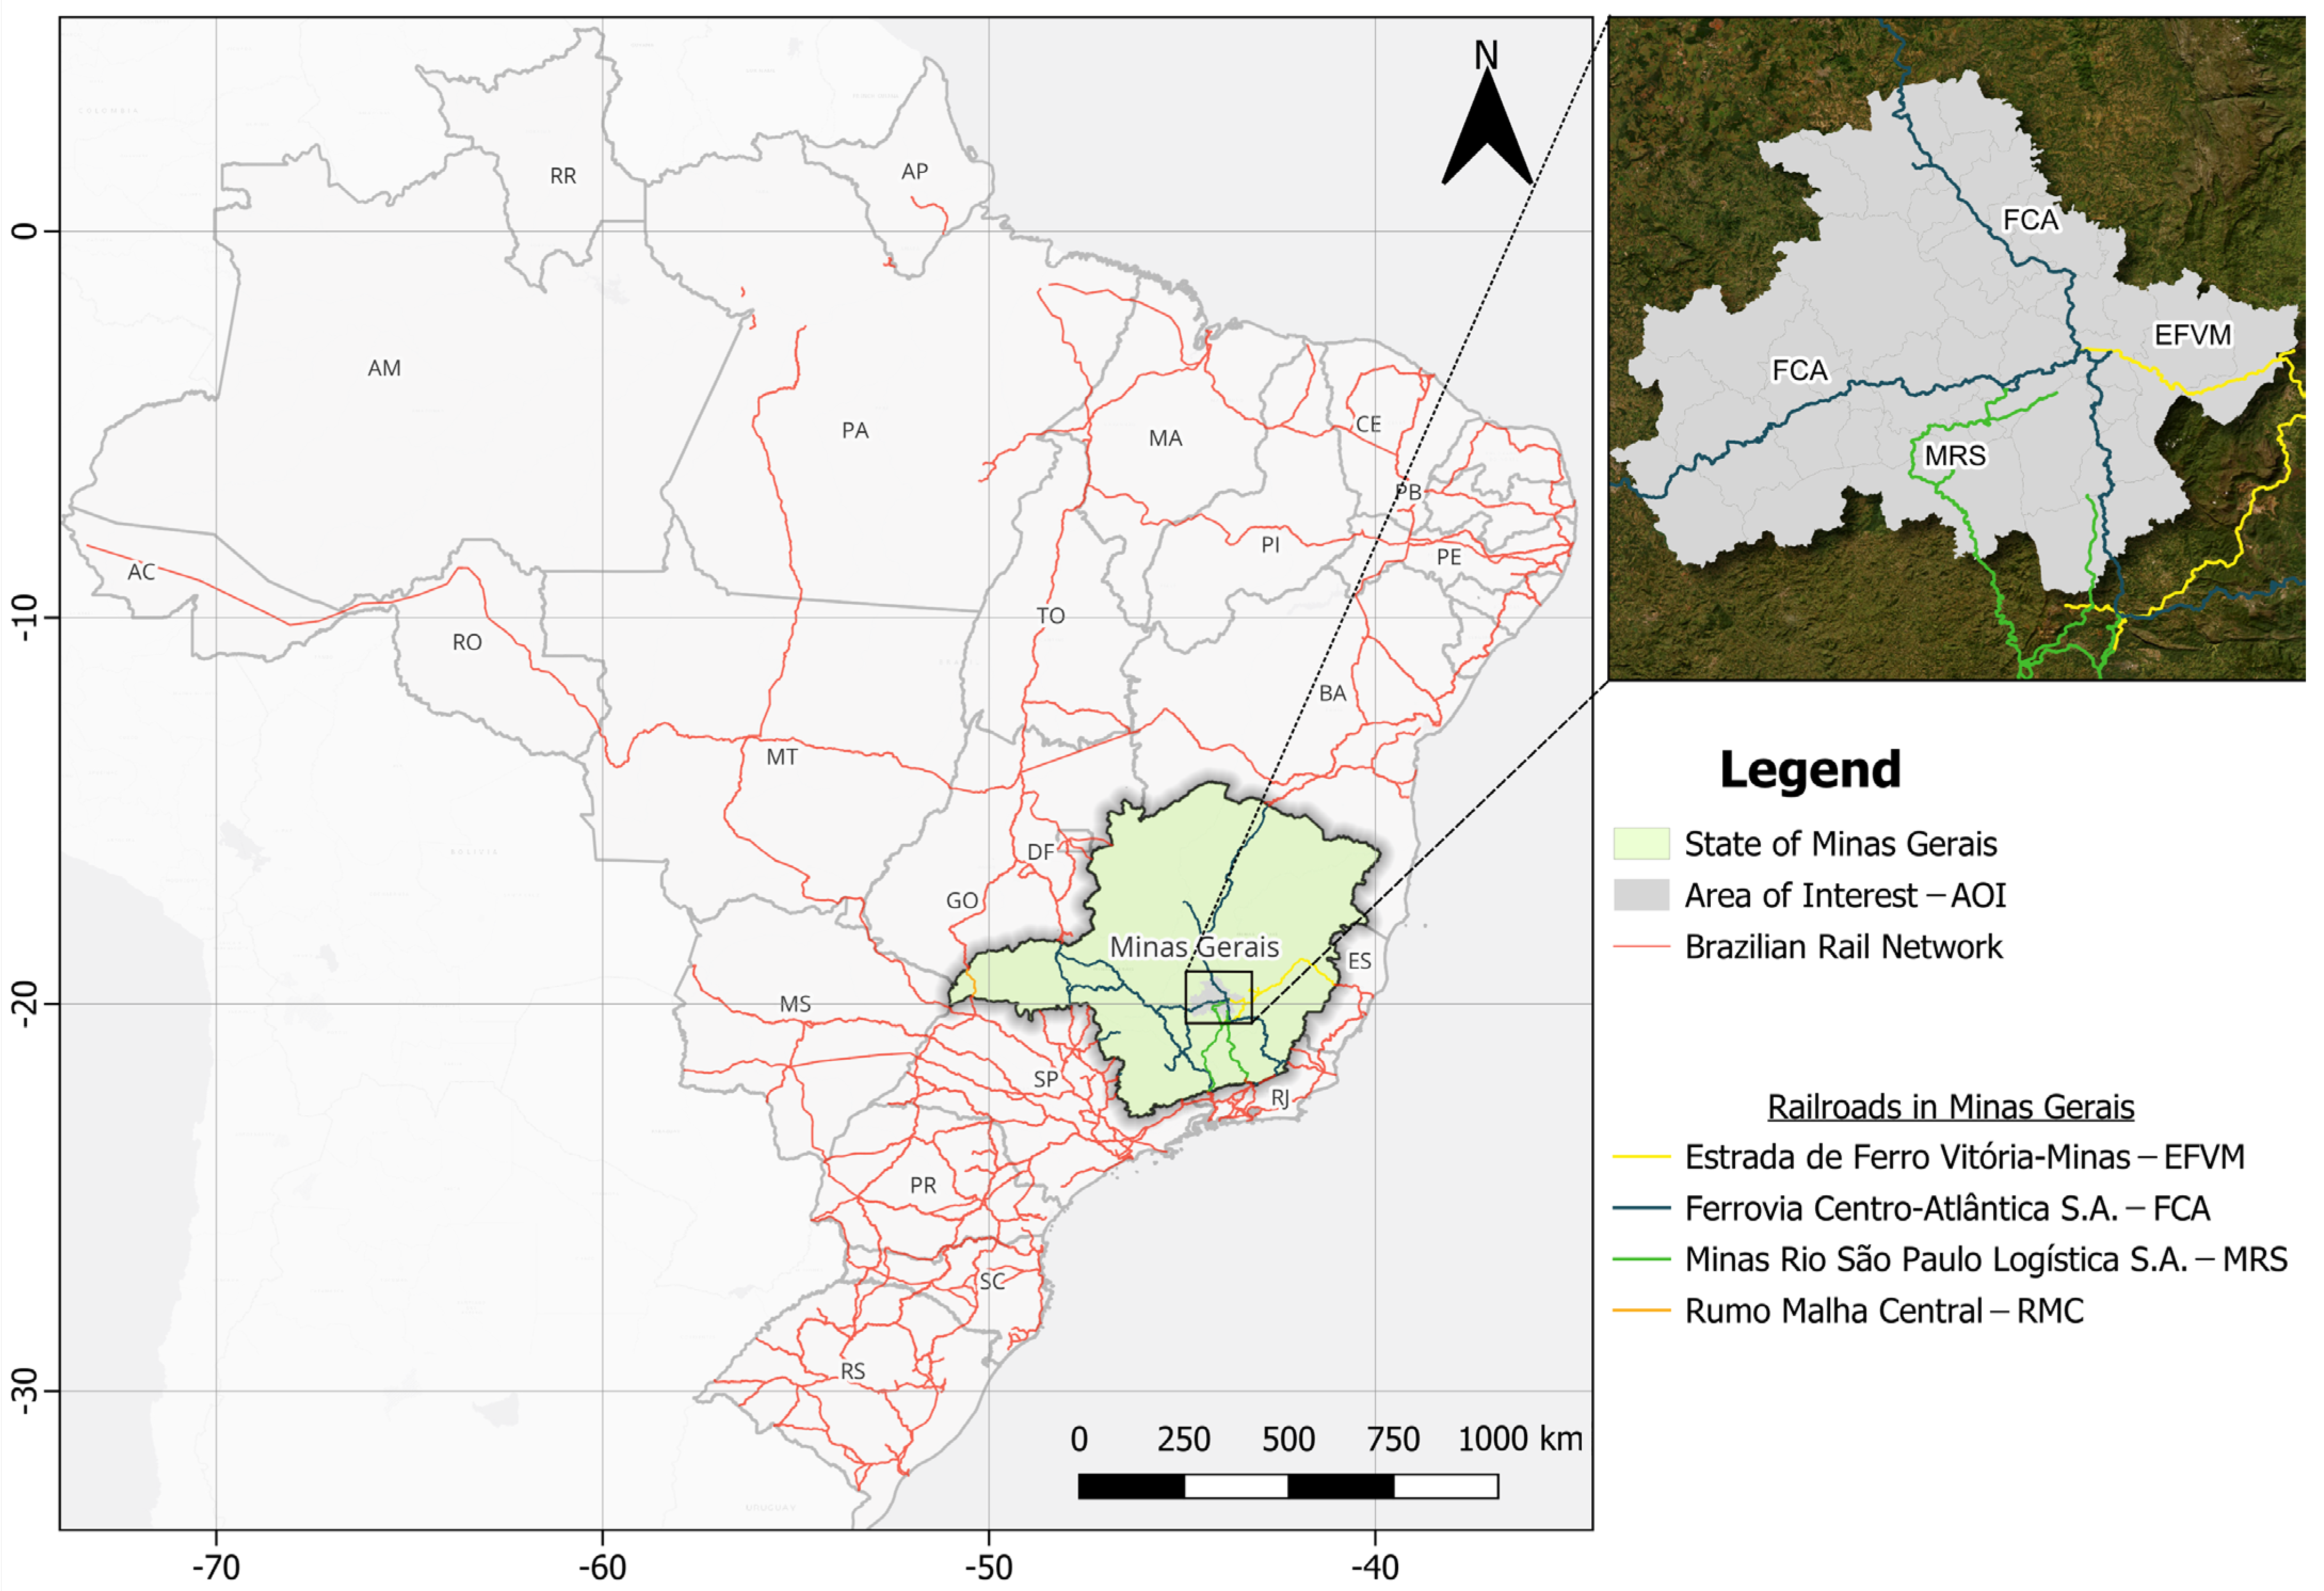
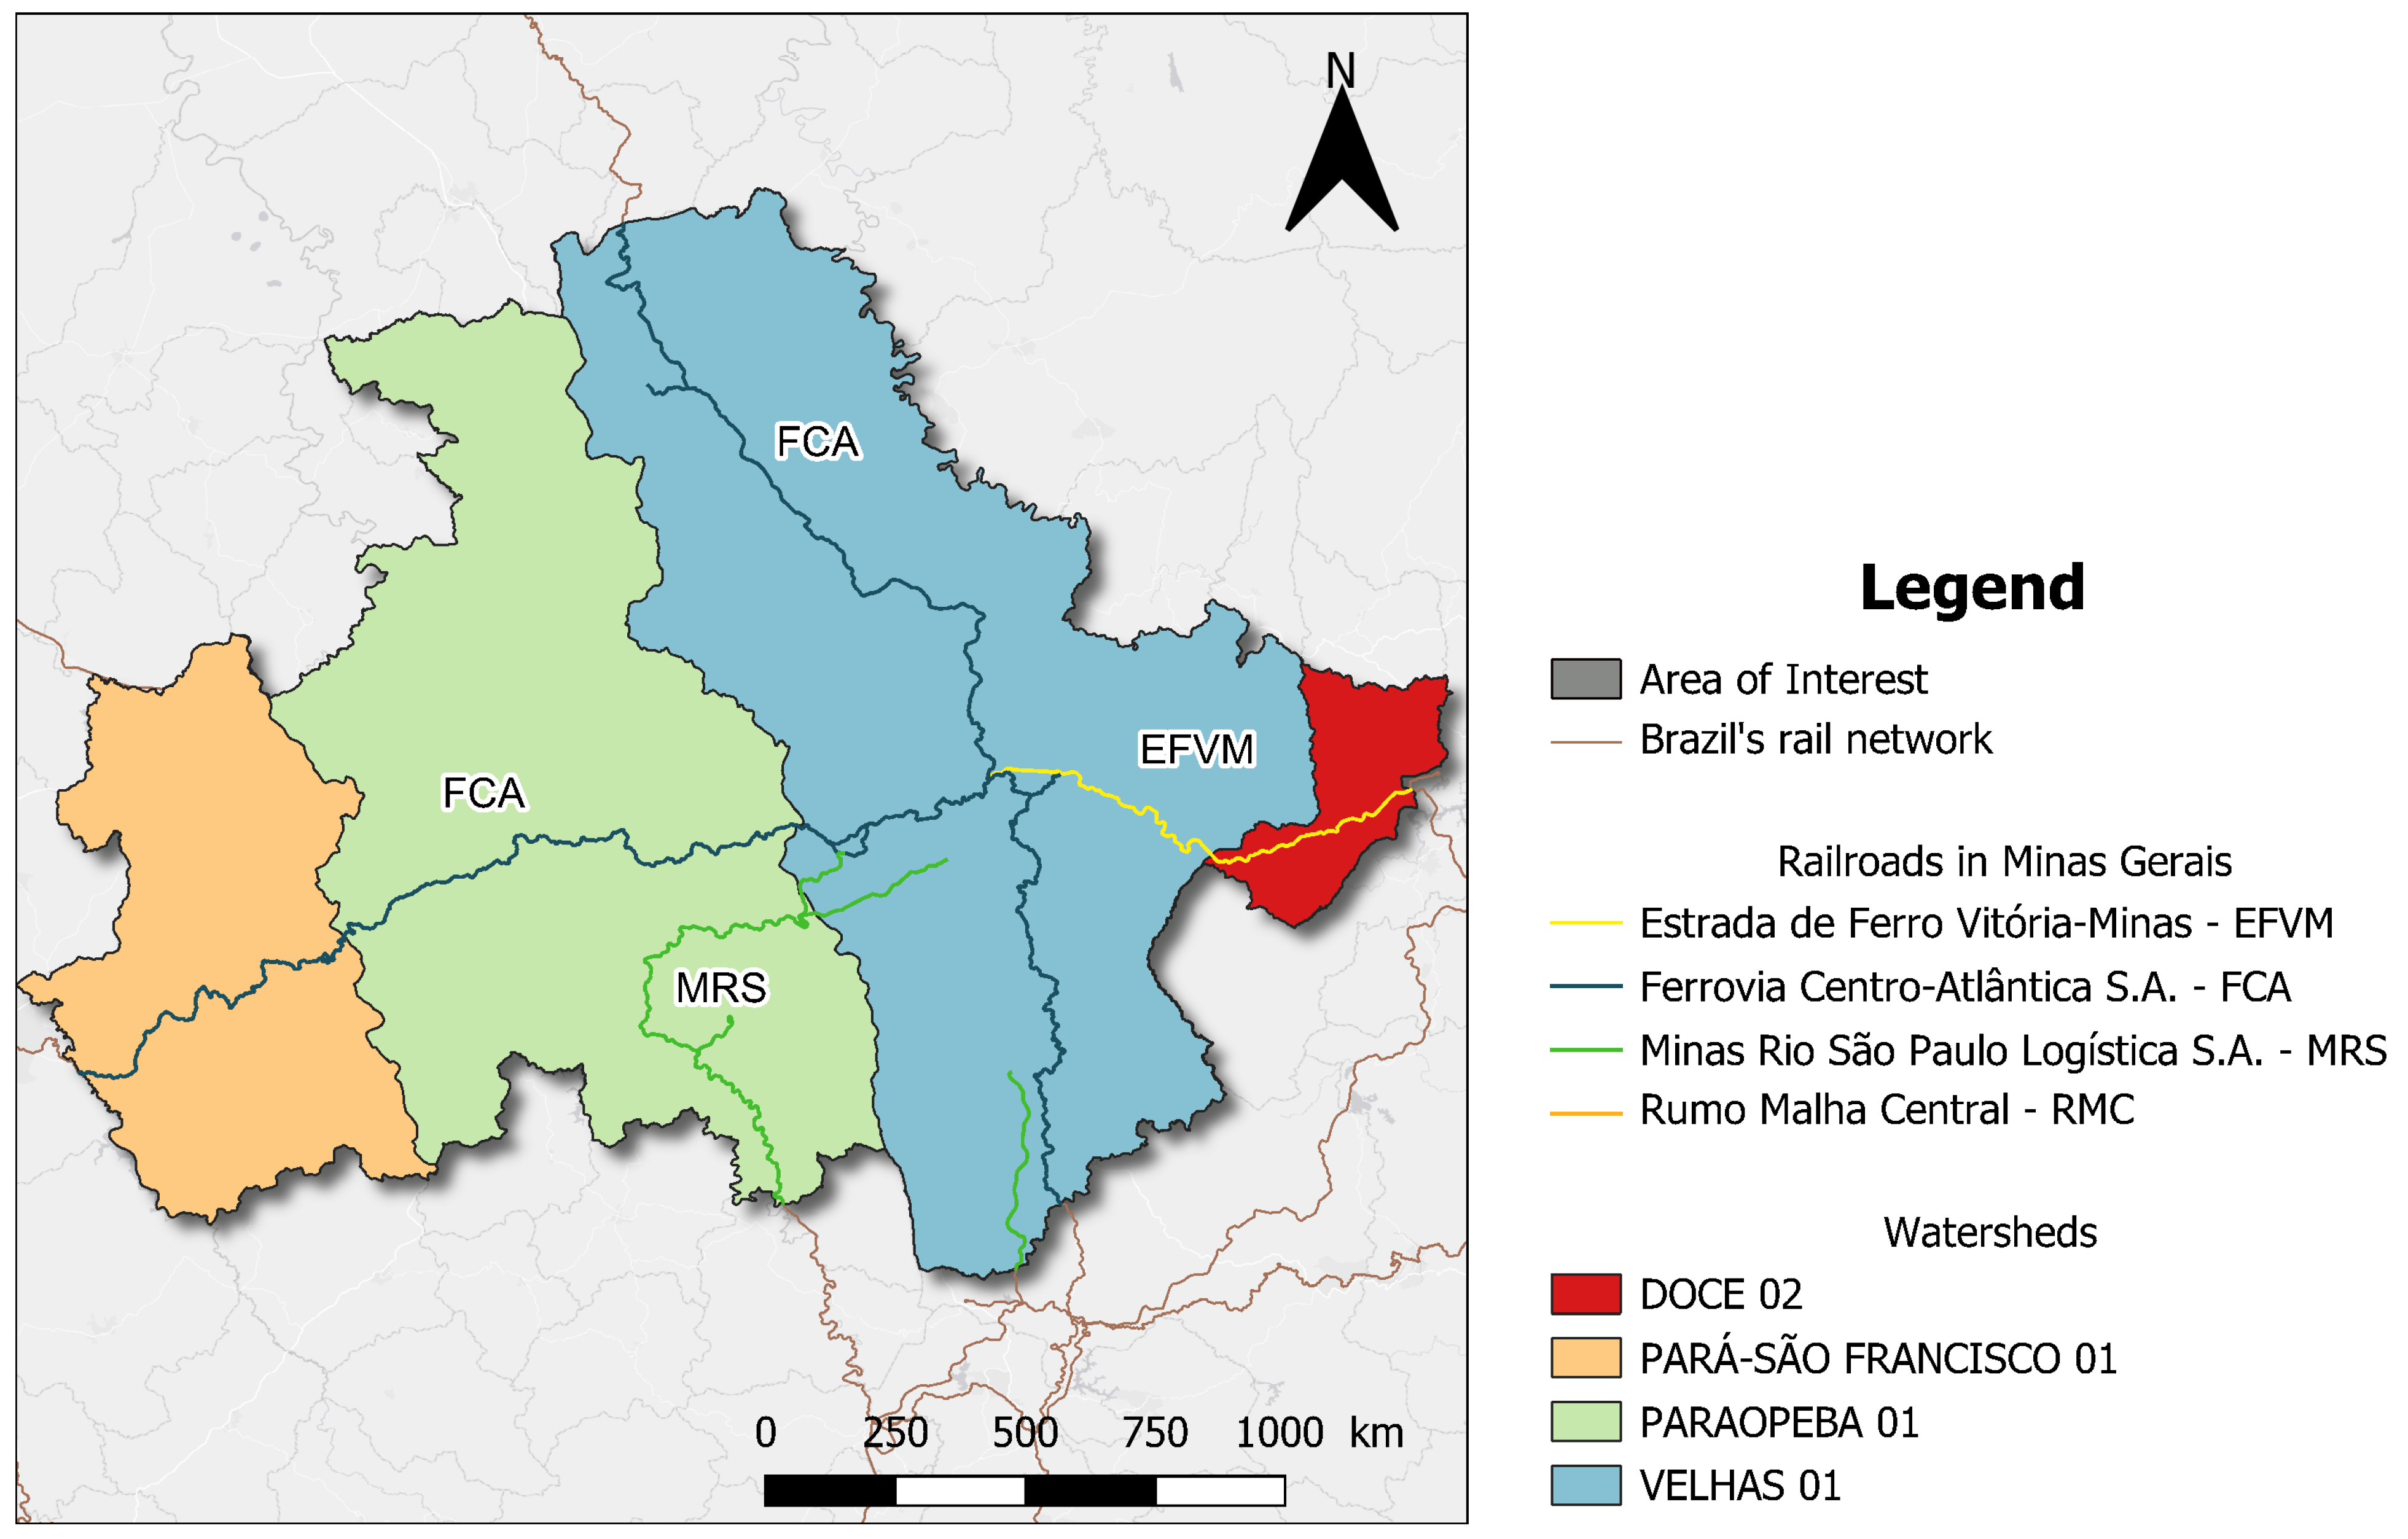
3.1. Study Area
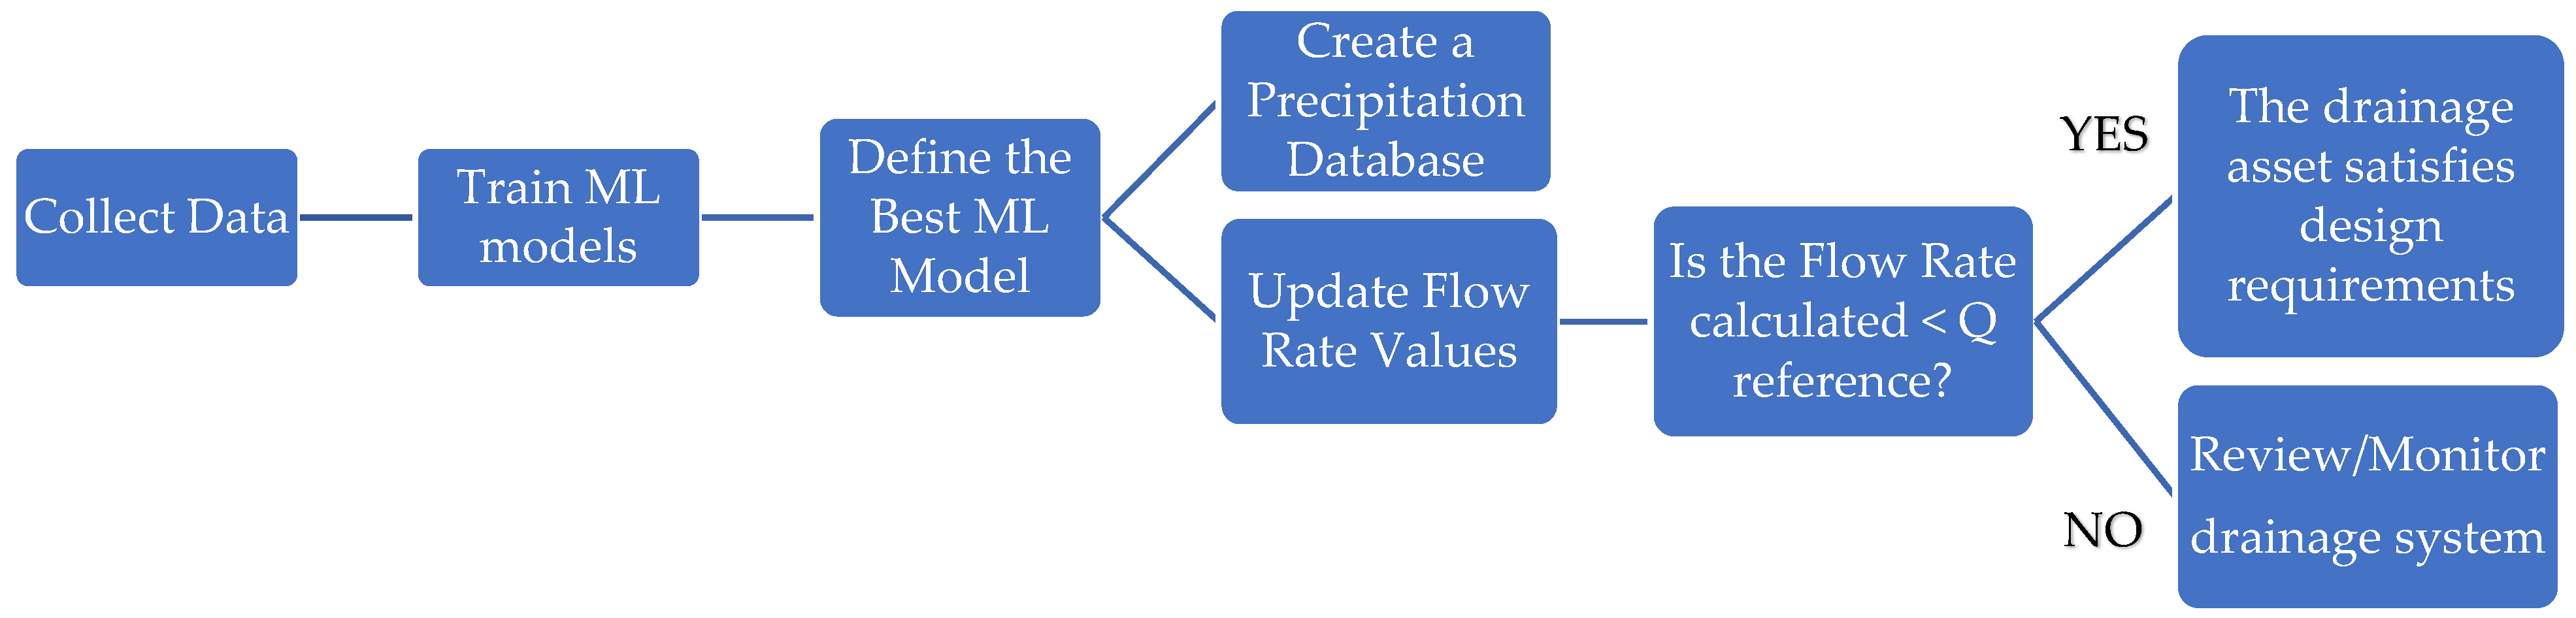
3.2. Research Methodology
3.3. Data Collection
3.4. Geographic Information System (GIS)
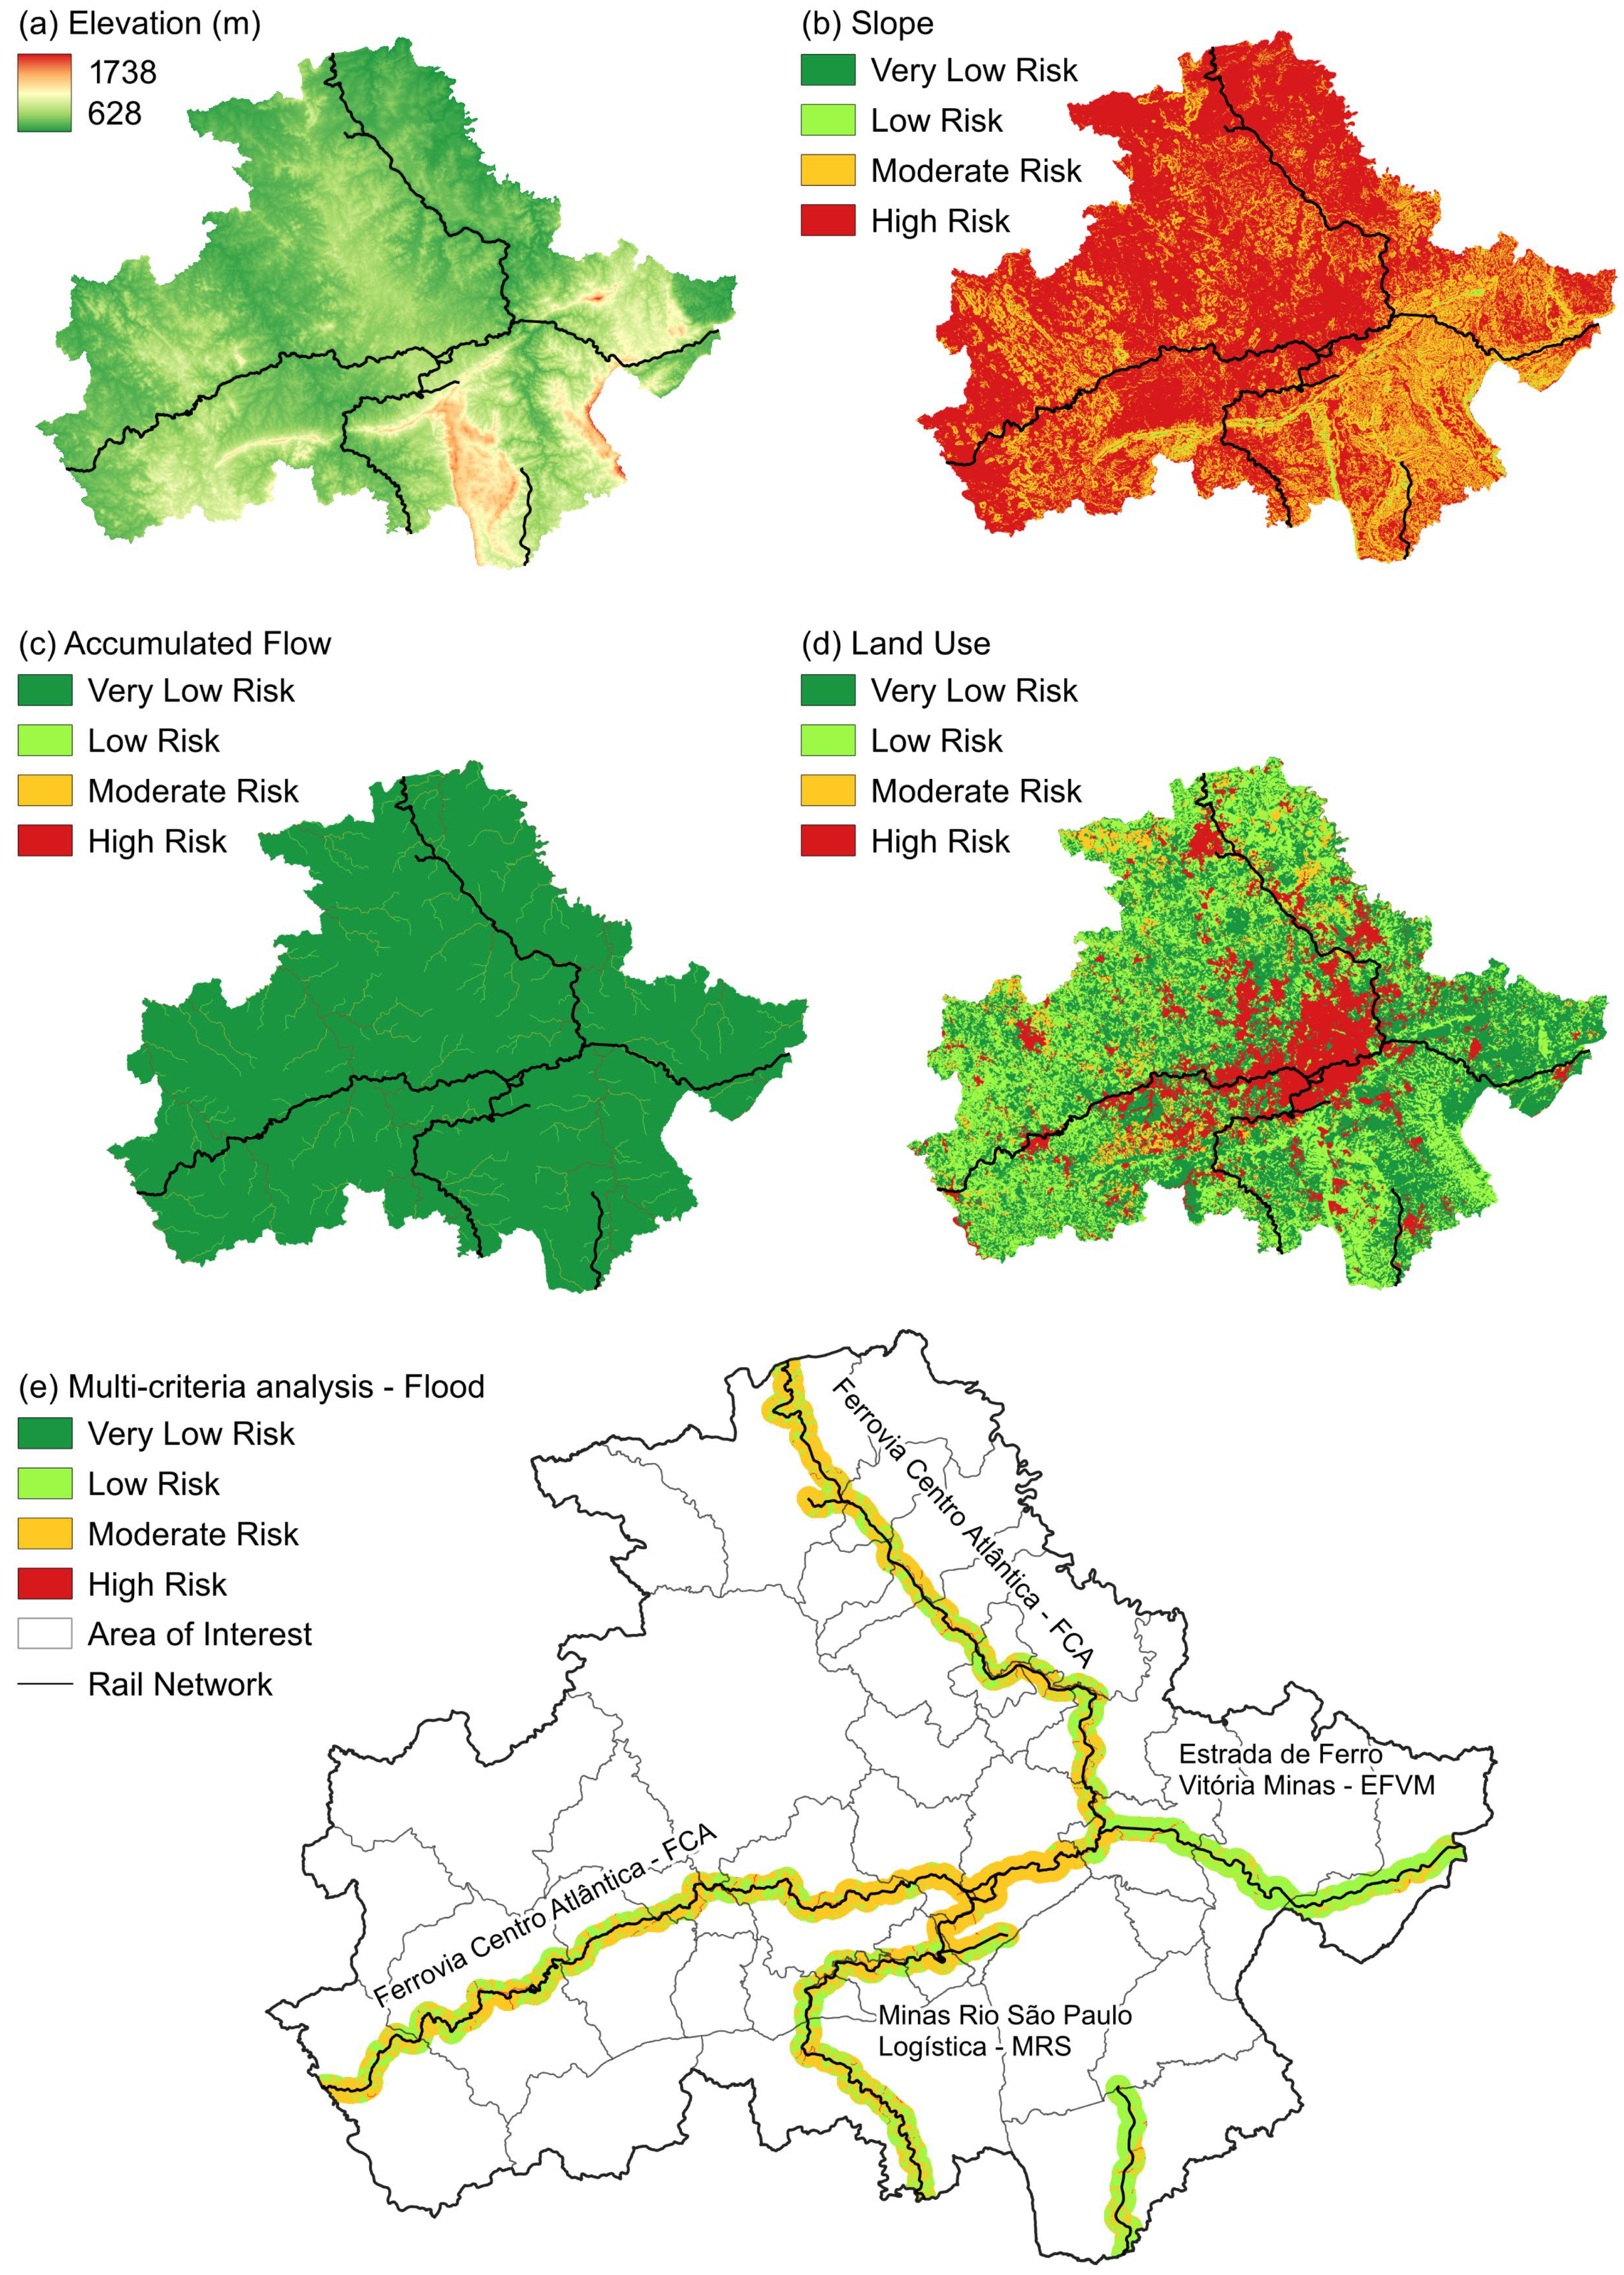
- Slope tool (spatial analyst): The slope is the maximum rate of change in the z-value (“elevation”) of each pixel in the raster image. For degrees, the values range from 0–90. This tool was used to determine the degrees of slopes in the digital elevation model. It is worth noting that the greater the degree of slopes, the greater the runoff, and the lower the degree of slopes of the surface, the greater the propensity for water to accumulate.
- Fill tool (spatial analyst): This tool was used to fill in all the depressions in the digital elevation model (DEM) in order to carry out the hydrological analysis. This ensures uniformity in the data to avoid areas of false depression. This enabled the appropriate flow direction to be generated within the basin, as well as determining the accumulation of water flow in the region studied.
- Flow direction tool (spatial analyst): The corrected DEM derived from the fill was used to produce a flow direction raster. The flow direction indicates the possible direction of water flow in the elevation model.
- Flow accumulation tool (spatial analyst): This tool was applied to assess flow accumulation from the flow direction raster as input. Output pixels with high flow accumulation are areas of concentrated flow and were used to create stream channels/networks.
- Reclassification tool (spatial analyst): this tool was used to reclassify all the factors that influence flooding, such as slope, flow direction, and land cover, on a common scale ranging from 1 to 4, where 1 represents very low risk and 4 high risk (see Table 2).
- Weighted overlay analysis: this technique was used to overlay the raster datasets of slope, flow direction, and land cover that were reclassified on a common measurement scale and weighted according to Equation (1) [39]:
- Buffer tool (vector/geoprocessing): This tool was used to create buffer zones around the railroad line. A buffer distance of 2 km was adopted to define the area of influence of the railroad.
3.5. Analytic Hierarchy Process (AHP) and Multi-Criteria Analysis (MCA)

| Land Use and Land Cover | Class | Susceptibility |
|---|---|---|
| Native vegetation | 1 | Very Low |
| Areas in regeneration and planted forests | 2 | Low |
| Agricultural areas and pastures | 3 | Moderate |
| Exposed soil and urban area | 4 | High |
| Slope (Degrees) | Class | Susceptibility |
| >51 | 1 | Very Low |
| 23 to 51 | 2 | Low |
| 9 to 23 | 3 | Moderate |
| 0 to 9 | 4 | High |
| Accumulated Flow | Class | Susceptibility |
| 0 to 1600 | 1 | Very Low |
| 1601 to 5500 | 2 | Low |
| 5501 to 18,000 | 3 | Moderate |
| >18,000 | 4 | High |
3.6. Drainage System Design and Hydrological Models
- V = flow velocity, in m/s;
- R = hydraulic radius, in m;
- I = longitudinal slope of the asset, in m/m
- η = Manning’s roughness coefficient, dimensionless, depending on the type of lining used.
- A = flow area, in m2;
- Pw = wetted perimeter, in m
- V = flow velocity, in m/s;
- Ac = contributing area, in m2;
- Qadm = admissible flow or drainage capacity of the asset, in m3/s
- i is the maximum average intensity (mm/min);
- t is the rainfall duration (minutes);
- T is the return period (year);
- K, a, b, and c are specific constants for each rainfall station.
- Q = contributing flow in m /s;
- C = runoff coefficient/deflection coefficient, dimensionless, set according to the soil–vegetation cover complex and slope of the land, depending on the type of table to be used;
- i = rainfall intensity, in mm/h for the design rainfall, fixed in the hydrological study;
- Ac = area of contribution, in ha
- Extensive cuts with a small slope, where the critical length of the ditch is reached, and increasing flow capacity requires larger sections;
- The presence of a well-defined secondary valley, causing water to concentrate in a single location;
- A sinuous longitudinal profile of the ditch with several low points, requiring great depths to ensure continuous flow. In these cases, a water outlet device, known as a downspout, is used to protect the rail track;
- The gutters should be located at all cuts, being constructed along the shoulder, terminating at convenient discharge points (cut-to-embankment transition points or catch basins).
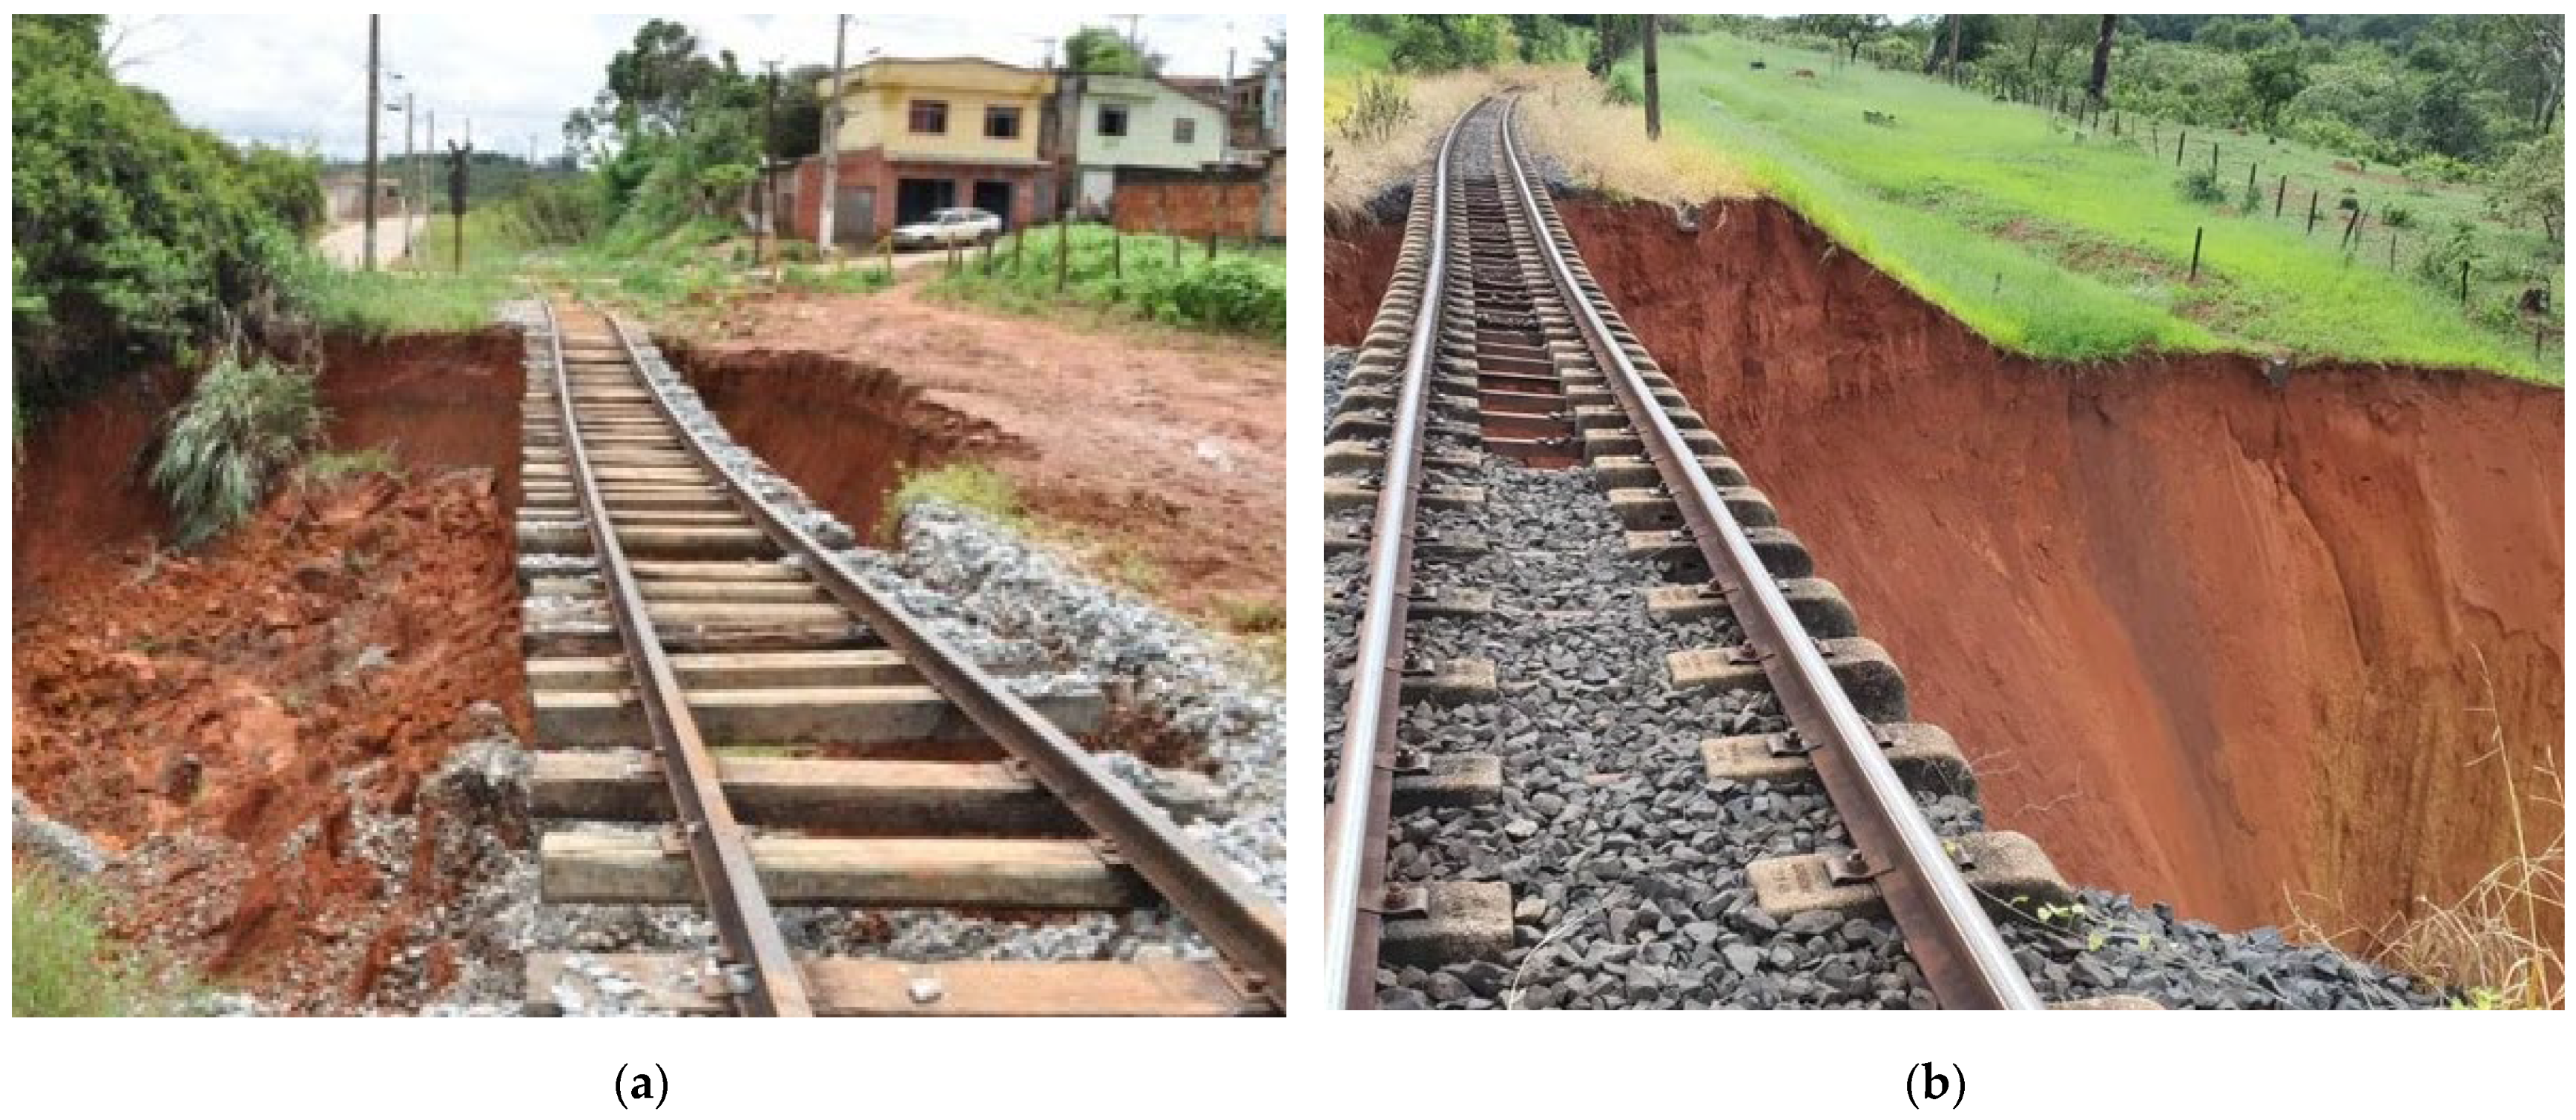
3.7. Disasters Triggered by Intense Rainfall on Minas Gerais Railroads
3.8. Machine Learning Algorithms
- Linear regression (LR): It is described as a first-degree equation. A linear regression model finds a linear relationship between an independent variable (X) and a dependent variable (Y). It predicts the target variable (Y) through the weighted sum of the characteristic variables (X), also known as features. The values calculated by the model are approximating a straight line. The linearity between its variables makes it an accessible model to interpret [52].
- Support vector machine (SVM): This algorithm was developed by [53]. This algorithm produces a series of hyperplanes to transform non-linear features into linear ones. Its goal is to identify a hyperplane with a small norm at the same time as minimizing the sum of the distances between the data points and the hyperplane. In regression problems, the aim is to find a hyperplane that is “near“ as many data points as possible [54,55].
- Decision tree (DT): It is one of the supervised machine learning methods known as tree-based methods. These are based on segmentation and stratification of the predictor space into simple regions, to categorize or predict the target answer. The method detects the potential structure to describe the model adopting recursive segmentation to continuously split the data space into diverse subsets. Thus, it can determine important relationships between the variables and patterns of behavior from them [56].
- Random forest (RF): According to [57], it is an algorithm that creates a combination of predictors called trees, such that each depends on the value of an independent vector sampled randomly. These vectors follow the same distribution for all trees in the forest. The generalization error obtained from a forest of tree classifiers depends on the correlation between them. The algorithm is commonly used because it is simple to understand and presents good results in different types of machine learning analysis.
4. Results
4.1. Multi-Criteria Analysis
4.2. Hydrological Analysis
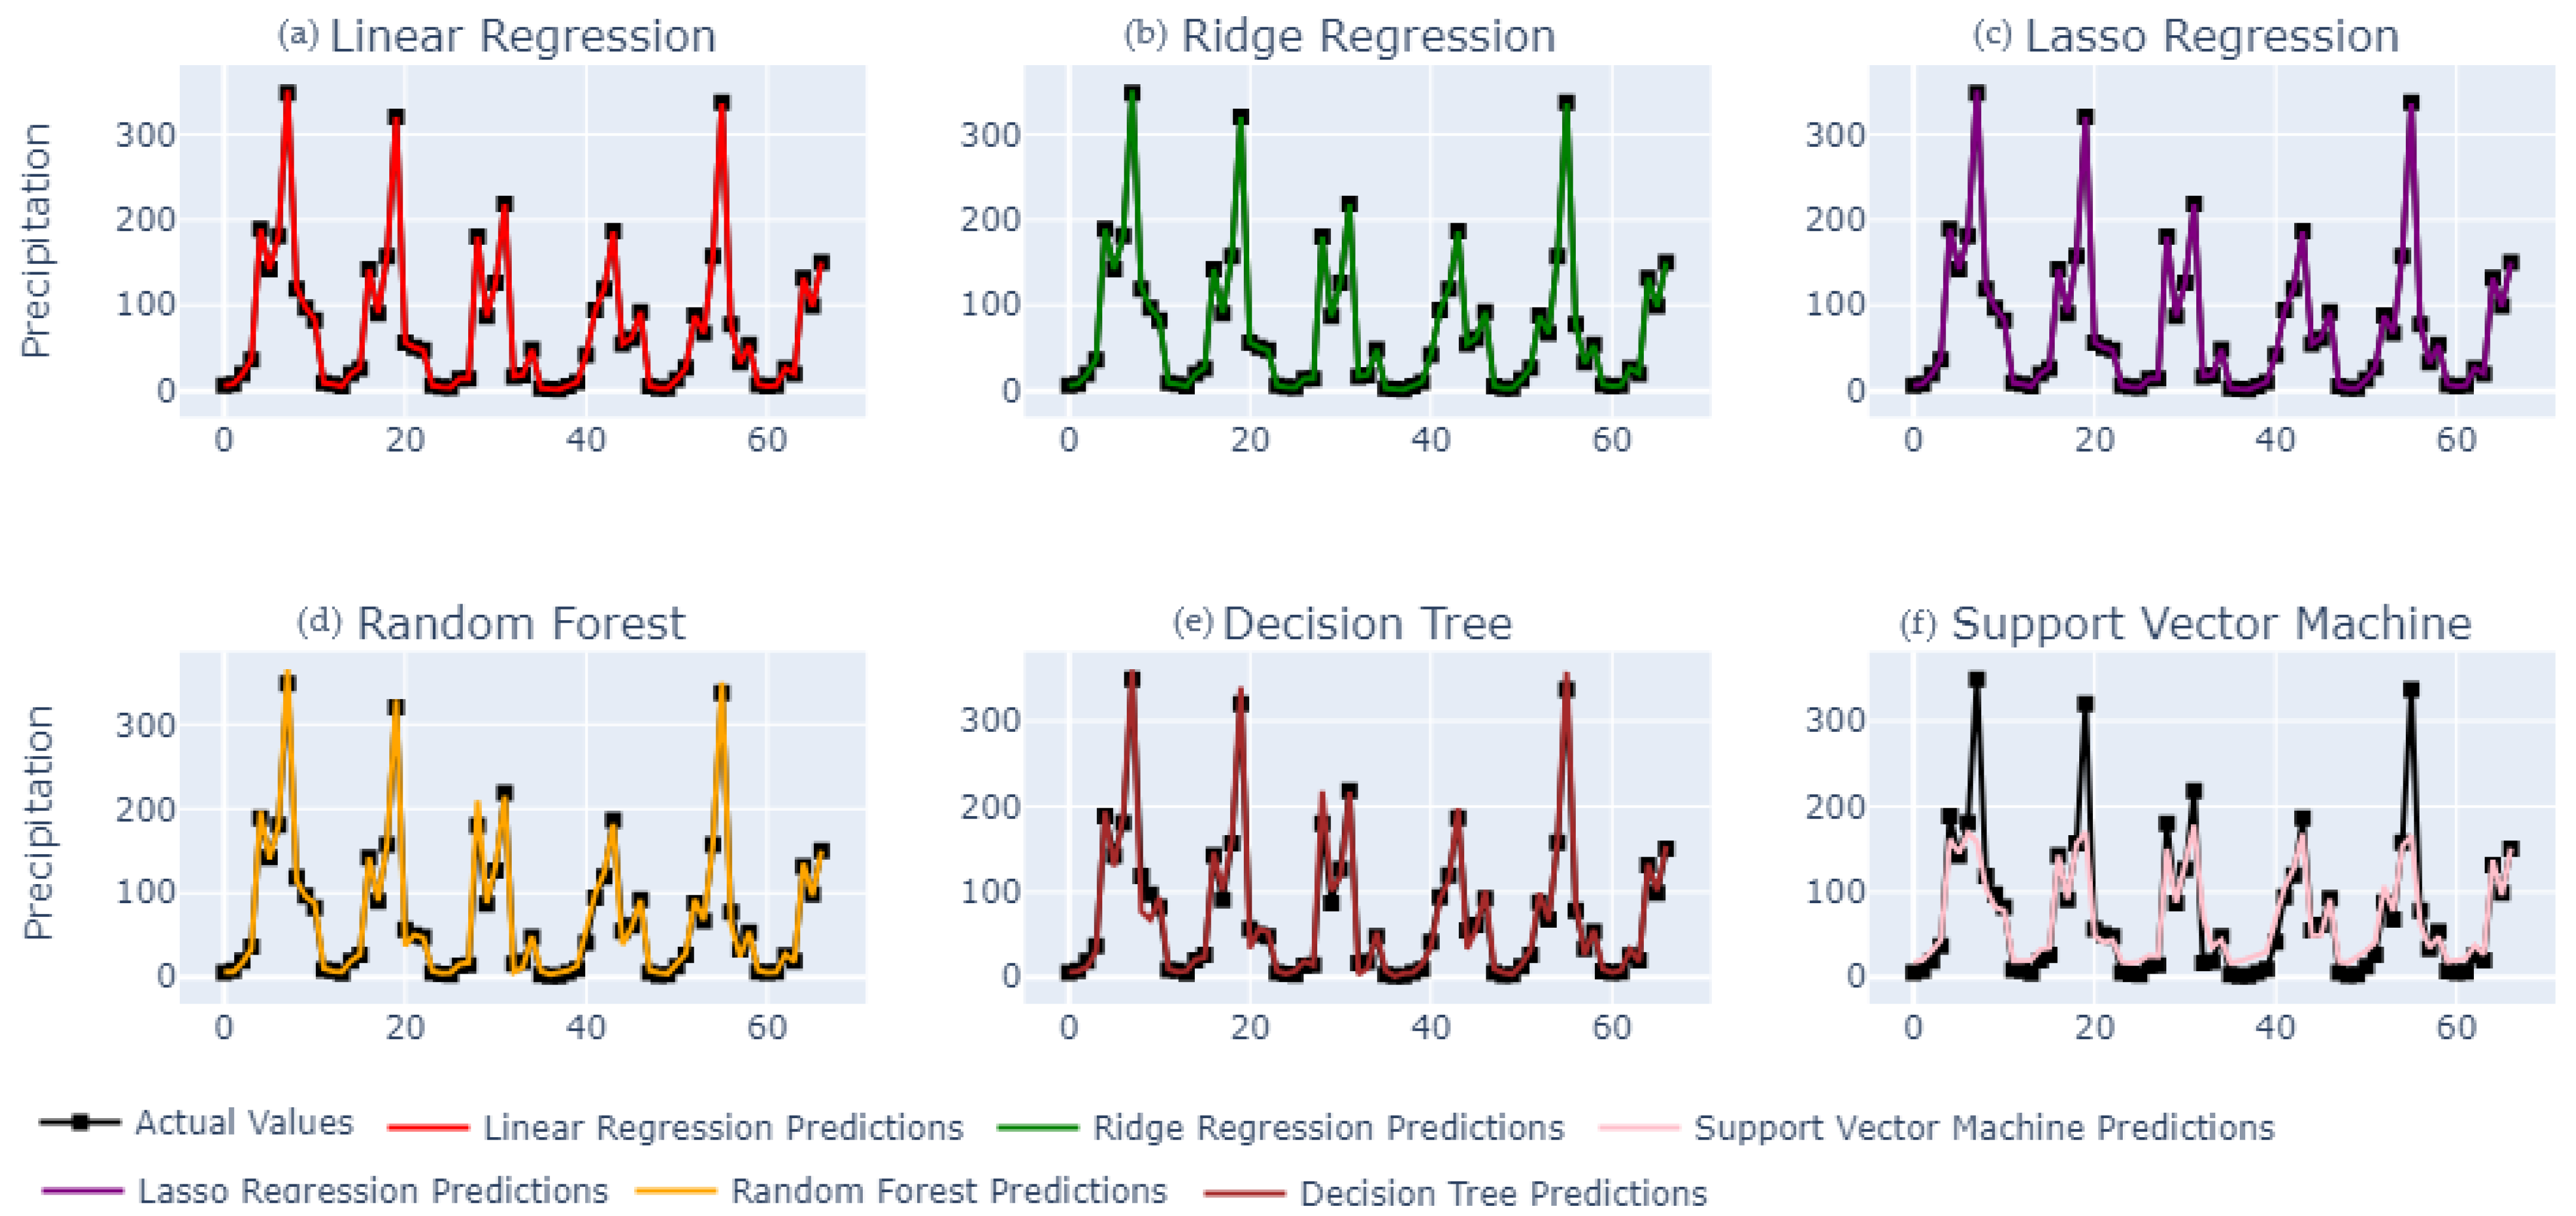
4.3. Machine Learning Metrics
5. Discussion
Author Contributions
Funding
Data Availability Statement
Conflicts of Interest
Appendix A
| City | K | A | b | c | i-5 | i-25 | i-50 | i-75 | Q-5 | Q-25 | Q-50 | Q-75 |
| Barão de Cocais | 802.92 | 0.17 | 6.42 | 0.71 | 188.22 | 246.26 | 276.48 | 295.85 | 0.84 | 1.09 | 1.23 | 1.31 |
| Belo Horizonte | 682.93 | 0.17 | 3.99 | 0.67 | 205.31 | 269.48 | 302.97 | 324.46 | 0.91 | 1.20 | 1.35 | 1.44 |
| Betim | 3744.08 | 0.18 | 31.87 | 0.97 | 150.58 | 201.83 | 228.97 | 246.50 | 0.67 | 0.90 | 1.02 | 1.10 |
| Brumadinho | 3576.92 | 0.20 | 28.97 | 0.97 | 160.78 | 220.05 | 251.90 | 272.62 | 0.71 | 0.98 | 1.12 | 1.21 |
| Caeté | 902.14 | 0.19 | 15.77 | 0.72 | 139.33 | 188.86 | 215.29 | 232.44 | 0.62 | 0.84 | 0.96 | 1.03 |
| Capim Branco | 1101.24 | 0.20 | 12.68 | 0.77 | 163.46 | 224.08 | 256.69 | 277.92 | 0.73 | 1.00 | 1.14 | 1.24 |
| Carmo do Cajuru | 3331.98 | 0.22 | 29.36 | 0.93 | 176.36 | 251.29 | 292.68 | 319.99 | 0.78 | 1.12 | 1.30 | 1.42 |
| Confins | 1099.00 | 0.20 | 13.08 | 0.78 | 155.92 | 213.40 | 244.28 | 264.38 | 0.69 | 0.95 | 1.09 | 1.18 |
| Contagem | 833.45 | 0.17 | 7.15 | 0.70 | 191.24 | 252.64 | 284.83 | 305.53 | 0.85 | 1.12 | 1.27 | 1.36 |
| Esmeraldas | 1580.15 | 0.15 | 15.62 | 0.81 | 170.20 | 215.29 | 238.21 | 252.74 | 0.76 | 0.96 | 1.06 | 1.12 |
| Florestal | 1127.45 | 0.14 | 12.66 | 0.79 | 147.22 | 184.13 | 202.75 | 214.51 | 0.65 | 0.82 | 0.90 | 0.95 |
| Funilândia | 4687.21 | 0.22 | 42.25 | 1.03 | 124.42 | 175.86 | 204.12 | 222.72 | 0.55 | 0.78 | 0.91 | 0.99 |
| Ibirité | 1017.33 | 0.18 | 11.17 | 0.74 | 175.75 | 234.80 | 266.01 | 286.15 | 0.78 | 1.04 | 1.18 | 1.27 |
| Igarapé | 4647.65 | 0.21 | 34.29 | 1.05 | 137.03 | 192.13 | 222.24 | 241.99 | 0.61 | 0.85 | 0.99 | 1.08 |
| Igaratinga | 1668.29 | 0.20 | 15.65 | 0.81 | 196.38 | 270.95 | 311.25 | 337.54 | 0.87 | 1.20 | 1.38 | 1.50 |
| Inhaúma | 4229.11 | 0.18 | 36.11 | 1.02 | 129.15 | 171.43 | 193.68 | 208.00 | 0.57 | 0.76 | 0.86 | 0.92 |
| Itabirito | 1210.83 | 0.22 | 23.13 | 0.77 | 132.82 | 187.73 | 217.90 | 237.75 | 0.59 | 0.83 | 0.97 | 1.06 |
| Itatiaiuçu | 3503.87 | 0.20 | 27.03 | 0.95 | 181.35 | 251.02 | 288.74 | 313.39 | 0.81 | 1.12 | 1.28 | 1.39 |
| Itaúna | 3481.56 | 0.24 | 31.70 | 0.96 | 158.94 | 233.87 | 276.20 | 304.43 | 0.71 | 1.04 | 1.23 | 1.35 |
| Juatuba | 6985.57 | 0.23 | 46.47 | 1.09 | 135.88 | 195.49 | 228.64 | 250.58 | 0.60 | 0.87 | 1.02 | 1.11 |
| Lagoa Santa | 2131.97 | 0.20 | 22.94 | 0.90 | 146.39 | 202.63 | 233.09 | 252.98 | 0.65 | 0.90 | 1.04 | 1.12 |
| Mário Campos | 4334.91 | 0.20 | 33.70 | 1.02 | 146.07 | 201.21 | 230.97 | 250.37 | 0.65 | 0.89 | 1.03 | 1.11 |
| Mateus Leme | 1593.06 | 0.18 | 28.50 | 0.82 | 120.30 | 161.77 | 183.77 | 198.01 | 0.53 | 0.72 | 0.82 | 0.88 |
| Matozinhos | 929.18 | 0.20 | 11.30 | 0.76 | 152.29 | 208.77 | 239.15 | 258.93 | 0.68 | 0.93 | 1.06 | 1.15 |
| Nova Lima | 1533.37 | 0.19 | 22.02 | 0.84 | 129.71 | 177.24 | 202.76 | 219.35 | 0.58 | 0.79 | 0.90 | 0.97 |
| Pará de Minas | 1267.01 | 0.19 | 12.47 | 0.79 | 179.97 | 242.78 | 276.19 | 297.82 | 0.80 | 1.08 | 1.23 | 1.32 |
| Pedro Leopoldo | 925.11 | 0.20 | 11.26 | 0.76 | 151.86 | 208.18 | 238.48 | 258.20 | 0.67 | 0.93 | 1.06 | 1.15 |
| Prudente de Morais | 5011.36 | 0.22 | 44.96 | 1.05 | 119.29 | 169.15 | 196.61 | 214.69 | 0.53 | 0.75 | 0.87 | 0.95 |
| Raposos | 1451.56 | 0.19 | 20.53 | 0.83 | 135.21 | 184.17 | 210.38 | 227.42 | 0.60 | 0.82 | 0.94 | 1.01 |
| Ribeirão das Neves | 957.75 | 0.20 | 11.61 | 0.77 | 152.72 | 209.03 | 239.28 | 258.97 | 0.68 | 0.93 | 1.06 | 1.15 |
| Rio Acima | 1233.21 | 0.20 | 20.17 | 0.78 | 138.56 | 191.49 | 220.11 | 238.80 | 0.62 | 0.85 | 0.98 | 1.06 |
| Sabará | 1295.83 | 0.19 | 18.04 | 0.80 | 144.57 | 195.97 | 223.39 | 241.19 | 0.64 | 0.87 | 0.99 | 1.07 |
| Santa Luzia | 1460.89 | 0.18 | 17.76 | 0.84 | 141.44 | 190.19 | 216.06 | 232.79 | 0.63 | 0.85 | 0.96 | 1.03 |
| São Joaquim de Bicas | 4738.22 | 0.21 | 34.17 | 1.06 | 135.60 | 190.13 | 219.92 | 239.47 | 0.60 | 0.85 | 0.98 | 1.06 |
| São José da Lapa | 923.77 | 0.19 | 15.84 | 0.72 | 140.63 | 190.63 | 217.31 | 234.62 | 0.63 | 0.85 | 0.97 | 1.04 |
| Sarzedo | 4008.44 | 0.19 | 32.26 | 0.98 | 155.76 | 212.84 | 243.48 | 263.40 | 0.69 | 0.95 | 1.08 | 1.17 |
| Sete Lagoas | 3938.76 | 0.16 | 32.83 | 1.00 | 132.98 | 172.31 | 192.66 | 205.65 | 0.59 | 0.77 | 0.86 | 0.91 |
| Vespasiano | 1463.17 | 0.18 | 17.79 | 0.84 | 141.03 | 189.64 | 215.43 | 232.12 | 0.63 | 0.84 | 0.96 | 1.03 |
References
- Bezdan, J.; Bezdan, A.; Blagojević, B.; Antić, S.; Greksa, A.; Milić, D.; Lipovac, A. Impact of Climate Change on Extreme Rainfall Events and Pluvial Flooding Risk in the Vojvodina Region (North Serbia). Atmosphere 2024, 15, 488. [Google Scholar] [CrossRef]
- Khoi, D.N.; Quan, N.T.; Nhi, P.T.T.; Nguyen, V.T. Impact of Climate Change on Precipitation Extremes over Ho Chi Minh City, Vietnam. Water 2021, 13, 120. [Google Scholar] [CrossRef]
- Malikah, S.; Avila, S.; Garcia, G.; Lakhankar, T. Historical Climate Trends and Extreme Weather Events in the Tri-State Area: A Detailed Analysis of Urban and Suburban Differences. Climate 2024, 12, 32. [Google Scholar] [CrossRef]
- An, H.; Zhai, J.; Song, X.; Wang, G.; Zhong, Y.; Zhang, K.; Sun, W. Impacts of Extreme Precipitation and Diurnal Temperature Events on Grassland Productivity at Different Elevations on the Plateau. Remote Sens. 2024, 16, 317. [Google Scholar] [CrossRef]
- Watson, G.; Ahn, J.E. A Systematic Review: To Increase Transportation Infrastructure Resilience to Flooding Events. Appl. Sci. 2022, 12, 12331. [Google Scholar] [CrossRef]
- Sultana, Z.; Sieg, T.; Kellermann, P.; Müller, M.; Kreibich, H. Assessment of Business Interruption of Flood-Affected Companies Using Random Forests. Water 2018, 10, 1049. [Google Scholar] [CrossRef]
- Akola, J.; Chakwizira, J.; Ingwani, E.; Bikam, P. An AHP-TOWS Analysis of Options for Promoting Disaster Risk Reduction Infrastructure in Informal Settlements of Greater Giyani Local Municipality, South Africa. Sustainability 2022, 15, 267. [Google Scholar] [CrossRef]
- Maniatis, Y.; Doganis, A.; Chatzigeorgiadis, M. Fire Risk Probability Mapping Using Machine Learning Tools and Multi-Criteria Decision Analysis in the GIS Environment: A Case Study in the National Park Forest Dadia-Lefkimi-Soufli, Greece. Appl. Sci. 2022, 12, 2938. [Google Scholar] [CrossRef]
- Ponnanna, L.; Bhakthavathsalam, R.; Vishruth, K. Urban Flood Forecast using Machine Learning on Real-Time Sensor Data. Trans. Mach. Learn. Artif. Intell. 2017, 5, 69–75. [Google Scholar]
- Nyomane, J.; Theeramunkong, T. Flood Forecasting with Machine Learning Technique on Hydrological Modeling. Procedia Comput. Sci. 2019, 156, 377–386. [Google Scholar] [CrossRef]
- Tehrany, M.S.; Kumar, L.; Jebur, M.N.; Shabani, F. Evaluating the application of the statistical index method in flood susceptibility mapping and its comparison with frequency ratio and logistic regression methods. Environ. Earth Sci. 2018, 10, 79–101. [Google Scholar]
- Mullapudi, A.; Lewis, M.J.; Gruden, C.L.; Kerkez, B. Deep reinforcement learning for the real-time control of stormwater systems. Adv. Water Resour. 2020, 140, 103600. [Google Scholar] [CrossRef]
- Palmitessa, R.; Grum, M.; Engsig-Karup, A.P.; Löwe, R. Accelerating hydrodynamic simulations of urban drainage systems with physics-guided machine learning. Water Res. 2022, 223, 118972. [Google Scholar] [CrossRef] [PubMed]
- Saranya, A.; Al Mazroa, A.; Maashi, M.; Nithya, T.M.; Priya, V. Remote sensing and machine learning approach for zoning of wastewater drainage system. Desalination Water Treat. 2024, 319, 100549. [Google Scholar] [CrossRef]
- Yang, Y.; Chui, T.F.M. Modeling and interpreting hydrological responses of sustainable urban drainage systems with explainable machine learning methods. Hydrol. Earth Syst. Sci. 2021, 25, 5839–5858. [Google Scholar] [CrossRef]
- Rozos, E.; Dimitriadis, P.; Bellos, V. Machine Learning in Assessing the Performance of Hydrological Models. Hydrology 2021, 9, 5. [Google Scholar] [CrossRef]
- Kumar, V.; Kedam, N.; Sharma, K.V.; Mehta, D.J.; Caloiero, T. Advanced Machine Learning Techniques to Improve Hydrological Prediction: A Comparative Analysis of Streamflow Prediction Models. Water 2023, 15, 2572. [Google Scholar] [CrossRef]
- Karim, F.; Armin, M.A.; Ahmedt-Aristizabal, D.; Tychsen-Smith, L.; Petersson, L. A Review of Hydrodynamic and Machine Learning Approaches for Flood Inundation Modeling. Water 2023, 15, 566. [Google Scholar] [CrossRef]
- Liu, Z.; Zhou, J.; Yang, X.; Zhao, Z.; Lv, Y. Research on Water Resource Modeling Based on Machine Learning Technologies. Water 2024, 16, 472. [Google Scholar] [CrossRef]
- Antzoulatos, G.; Kouloglou, I.-O.; Bakratsas, M.; Moumtzidou, A.; Gialampoukidis, I.; Karakostas, A.; Lombardo, F.; Fiorin, R.; Norbiato, D.; Ferri, M.; et al. Flood Hazard and Risk Mapping by Applying an Explainable Machine Learning Framework Using Satellite Imagery and GIS Data. Sustainability 2022, 14, 3251. [Google Scholar] [CrossRef]
- Rincón, D.; Khan, U.; Armenakis, C. Flood Risk Mapping Using GIS and Multi-Criteria Analysis: A Greater Toronto Area Case Study. Geosciences 2018, 8, 275. [Google Scholar] [CrossRef]
- Cabrera, J.S.; Lee, H.S. Flood-Prone Area Assessment Using GIS-Based Multi-Criteria Analysis: A Case Study in Davao Oriental, Philippines. Water 2019, 11, 2203. [Google Scholar] [CrossRef]
- Yao, K.; Yang, S.; Wang, Z.; Liu, W.; Han, J.; Liu, Y.; Zhou, Z.; Gariano, S.L.; Shi, Y.; Jaeger, C. A Novel Flood Risk Analysis Framework Based on Earth Observation Data to Retrieve Historical Inundations and Future Scenarios. Remote Sens. 2024, 16, 1413. [Google Scholar] [CrossRef]
- Swain, K.C.; Singha, C.; Nayak, L. Flood Susceptibility Mapping through the GIS-AHP Technique Using the Cloud. ISPRS Int. J. Geoinf. 2020, 9, 720. [Google Scholar] [CrossRef]
- Batista, F.A. O Mito da Modernização Pelos Trilhos: A “Era Ferroviária Mineira”, 1869–1940. Graduado em Economia e Pesquisador do Núcleo de Pesquisa em História Econômica e Demográfica do Cedeplar/UFMG. Available online: https://www.abphe.org.br/arquivos/felipe-de-alvarenga-batista-marcelo-magalhaes-godoy.pdf (accessed on 5 June 2024).
- Sgrott, P.R.; Zagheni, E.S.d.S. Uma análise do cenário do transporte ferroviário de cargas/An analysis of the rail freight scenario. Braz. Appl. Sci. Rev. 2020, 4, 3931–3948. [Google Scholar] [CrossRef]
- Associação Nacional dos Transportadores Ferroviários (ANTF). Available online: https://www.antf.org.br/boletim-antf/painel-antf/ (accessed on 5 June 2024).
- Confederação Nacional do Transporte (CNT). Available online: https://www.cnt.org.br/painel-cnt-transporte-ferroviario (accessed on 27 June 2024).
- VGEO. Available online: https://servicos.dnit.gov.br/vgeo/ (accessed on 5 July 2024).
- Instituto Brasileiro de Geografia e Estatística (IBGE). Geociências: Informações Ambientais, Geomorfologia. Available online: https://www.ibge.gov.br/geociencias/informacoes-ambientais/geomorfologia.html (accessed on 3 July 2024).
- TOPODATA. Available online: http://www.dsr.inpe.br/topodata/acesso.php (accessed on 9 May 2024).
- Agência Nacional de Águas (ANA). Available online: https://dadosabertos.ana.gov.br/datasets/5b97dc790ebc4307938d8a5b089c1aab_0/about (accessed on 18 July 2024).
- Instituto Brasileiro de Geografia e Estatística (IBGE). Cobertura e Uso da Terra do Brasil. Available online: https://www.ibge.gov.br/geociencias/informacoes-ambientais/cobertura-e-uso-da-terra/15831-cobertura-e-uso-da-terra-do-brasil.html (accessed on 13 July 2024).
- Valeriano, M.M.; Modelo Digital de Elevação com Dados SRTM Disponíveis Para a América do Sul. São José dos Campos, SP: INPE: Coordenação de Ensino, Documentação e Programas Especiais (INPE-10550-RPQ/756). 72p. 2004. Available online: http://www.dsr.inpe.br/topodata/ (accessed on 5 April 2024).
- Karra, P.; Kontgis, C.; Statman-Weil, Z.; Mazzariello, J.C.; Mathis, M.; Brumby, S.P. Global land use/land cover with Sentinel-2 and deep learning. In Proceedings of the IGARSS 2021—2021 IEEE International Geoscience and Remote Sensing Symposium, Brussels, Belgium, NJ, USA, 11–16 July 2021; IEEE: Piscataway, NJ, USA, 2021. [Google Scholar]
- Funk, C.; Peterson, P.; Landsfeld, M.; Pedreros, D.; Verdin, J.; Shukla, S.; Husak, G.; Rowland, J.; Harrison, L.; Hoell, A.; et al. The climate hazards infrared precipitation with stations-a new environmental record for monitoring extremes. Sci. Data 2015, 2, 150066. [Google Scholar] [CrossRef]
- Brust, C.; Kimball, J.; Maneta, M.; Jencso, K.; He, M.; Reichle, R. Using SMAP Level-4 Soil Moisture to Constrain MOD16 Evapotranspiration Over the Contiguous USA. Remote Sens. Environ. 2020, in press. [Google Scholar] [CrossRef]
- QGIS.org. QGIS Geographic Information System. Open Source Geospatial Foundation Project. Available online: http://qgis.org (accessed on 5 May 2024).
- Korah, P.I.; López, F.M.J. Mapping Flood Vulnerable Areas in Quetzaltenango, Guatemala using GIS. J. Environ. Earth Sci. 2015, 5, 132. Available online: https://iiste.org/Journals/index.php/JEES/article/view/21000 (accessed on 3 May 2024).
- Jabôr, M.A.; Drenagem de Rodovias. Estudos Hidrológicos e Projeto de Drenagem. Apostila do Curso de Drenagem em Rodovias; 2023. Available online: https://www.marcosjabor.com.br/apostila/2023b.pdf (accessed on 4 May 2024).
- Departamento Nacional de Infraestrutura de Transportes (DNIT). ISF-210: Projeto de Drenagem; Ministério dos Transportes, Diretoria Geral, Diretoria de Infraestrutura Ferroviária, Coordenação-Geral de Obras Ferroviárias, Brasília, Brazil, January 2015. Available online: https://www.gov.br/dnit/pt-br/ferrovias/instrucoes-e-procedimentos/instrucoes-de-servicos-ferroviarios/isf-210-projeto-de-drenagem.pdf (accessed on 5 May 2024).
- Pfafstetter, O. Chuvas intensas no Brasil: Relação entre precipitação, duração e frequência de chuvas em 98 postos com pluviógrafos; Departamento Nacional de Obras de Saneamento: Rio de Janeiro, RJ, Brasil, 1957; 419p. [Google Scholar]
- GPRH—Grupo de Pesquisa em Recursos Hídricos. Modelo Físico-Matemático para o Controle da Erosão Hídrica nas Condições Edafoclimáticas Brasileiras; Viçosa UFV: Viçosa, Brazil, 2008; p. 78. Available online: http://www.gprh.ufv.br/?area=modelo_fisico_matematico (accessed on 3 March 2024).
- Ministério da Infraestrutura. PROADAPTA—Adaptação à Mudança do Clima. Levantamento de Impactos e Riscos Climáticos Sobre a Infraestrutura Federal de Transporte Terrestres (Rodoviário e Ferroviário) Existente e Projetada. PRODUTO 5—Análise de Risco Climático. Dezembro de 2022. Available online: https://www.gov.br/transportes/pt-br/assuntos/sustentabilidade/produto5.pdf (accessed on 2 July 2024).
- Ministério da Infraestrutura. PROADAPTA—Adaptação à Mudança do Clima. Produto 2—Estudo Sobre os Impactos Relacionados ao Clima na Infraestrutura Federal de Transportes Terrestres, Rodoviário e Ferroviário, com Base na Análise de Dados e de Séries Históricas. Agosto de 2021 (pág 2). Available online: https://www.gov.br/transportes/pt-br/assuntos/sustentabilidade/produto2.pdf (accessed on 15 July 2024).
- Circuito Ferroviário Vale Verde. Available online: https://cfvv.blogspot.com/2011/01/chuva-provoca-erosao-em-um-trecho-da.html (accessed on 27 June 2024).
- G1 Globo. Available online: https://g1.globo.com/mg/triangulo-mineiro/noticia/2022/01/12/fluxo-de-trens-e-suspenso-em-araguari-por-causa-de-cratera-em-linha-ferrea.ghtml (accessed on 27 June 2024).
- Gazeta do Triângulo Mineiro. Available online: https://gazetadotriangulo.com.br/chuvas-causam-erosao-em-local-de-trilhos-ferroviarios-em-araguari/ (accessed on 27 June 2024).
- Alpaydin, E. Introduction to Machine Learning, 4th ed.; MIT Press: Cambridge, MA, USA, 2020. [Google Scholar]
- Géron, A. Hands-On Machine Learning with Scikit-Learn, Keras, and TensorFlow, 2nd ed.; O’Reilly Media, Inc.: Sebastopol, CA, USA, 2019; ISBN 9781492032649. [Google Scholar]
- Shiebler, D.; Gavranović, B.; Wilson, P. Category theory in machine learning. arXiv 2021, arXiv:2106.07032. [Google Scholar]
- James, G.; Witten, D.; Hastie, T.; Tibshirani, R. An Introduction to Statistical Learning: With Applications in R; Springer: New York, NY, USA, 2013. [Google Scholar]
- Cortes, C.; Vapnik, V. Support Vector Networks. Mach. Learn. 1995, 20, 273–297. [Google Scholar] [CrossRef]
- Joachims, T. Making Large-Scale SVM Learning Practical; Technical Report, LS-8-24; Computer Science Department, University of Dortmund: Dortmund, Germany, 1998. [Google Scholar]
- Smola, A.J.; Scholkopf, B. A Tutorial on Support Vector Regression; NEUROCOLT2 Technical Report Series, NC2-TR-1998-030. Kluwer Academic Publishers: Dordrecht, The Netherlands, 1998. [Google Scholar]
- Huang, R.F.; Zhou, G.C. Meteorology and Big Data; Science Press: Beijing, China, 2017. [Google Scholar]
- Breiman, L. Random Forests. Mach. Learn. 2001, 45, 5–32. [Google Scholar] [CrossRef]
- Pedregosa, F.; Varoquaux, G.; Gramfort, A.; Michel, V.; Thirion, B. Scikit-learn: Machine Learning in Python. J. Mach. Learn. Res. (JMLR) 2011, 12, 2825–2830. Available online: https://jmlr.csail.mit.edu/papers/v12/pedregosa11a.html (accessed on 2 July 2024).
- BRASIL, Departamento Nacional de Infraestrutura de Transportes. Diretoria de Planejamento e Pesquisa; Coordenação Geral de Estudos e Pesquisa; Instituto de Pesquisas Rodoviárias. In Manual de Drenagem de Rodovias, 2nd ed.; IPR: Rio de Janeiro, Brazil, 2006; p. 333. [Google Scholar]
- Wilken, P.S. Engenharia de drenagem superficial; Companhia de Tecnologia de Saneamento Ambiental: São Paulo, SP, Brasil, 1978; 477p. [Google Scholar]
- VALEC Engenharia, Construções e Ferrovias S.A. Norma Geral Ambiental - Qualidade Ambiental da Construção; NGL. Norma Geral Ambiental—Drenagem Superficial e Proteção Contra Erosão (NGL-5.03.01-16.019). 2018. Available online: https://portal.valec.gov.br/documentos/normativos_tecnicos/normas_ambientais/NORMA%20GERAL%20AMBIENTAL%2001%20-%20QUALIDADE%20AMBIENTAL%20DA%20CONSTRU%C3%87%C3%83O.pdf. (accessed on 5 June 2024).
- Climate-Data.org (n.d.). October in Itaúna, Minas Gerais, Brazil. Available online: https://pt.climate-data.org/america-do-sul/brasil/minas-gerais/itauna-24959/t/outubro-10/ (accessed on 20 July 2024).
- G1 (2023, October 31). Temporal Alaga Avenida e Causa Queda de Árvore de Grande Porte em Itaúna. Available online: https://g1.globo.com/mg/centro-oeste/noticia/2023/10/31/temporal-alaga-avenida-e-causa-queda-de-arvore-de-grande-porte-em-itauna.ghtml (accessed on 20 July 2024).
- Ariza Flores, V.A.; de Sousa, F.O.; Oda, S. Enhancing Risk Management in Road Infrastructure Facing Flash Floods through Epistemological Approaches. Buildings 2024, 14, 1931. [Google Scholar] [CrossRef]
- Li, L.; Uyttenhove, P.; Van Eetvelde, V. Planning Green Infrastructure to Mitigate Urban Surface Water Flooding Risk—A Methodology to Identify Priority Areas Applied in the City of Ghent. Landsc. Urban Plan. 2020, 194, 103703. [Google Scholar] [CrossRef]
- Schmidt, L.; Heße, F.; Attinger, S.; Kumar, R. Challenges in Applying Machine Learning Models for Hydrological Inference: A Case Study for Flooding Events Across Germany. Water Resour. Res. 2020, 56, e2019WR025924. [Google Scholar] [CrossRef]
- Marçais, J.; de Dreuzy, J.-R. Prospective Interest of Deep Learning for Hydrological Inference. Groundwater 2017, 55, 688–692. [Google Scholar] [CrossRef]


| Concessionaire | Products |
|---|---|
| RMC | Fertilizers, corn, wheat, soybeans, bran, vegetable oil, and sugar |
| EFVM | Iron ore, coal, and steel products—coil—bf |
| FCA | Soybeans, grains—corn, sugar, soybean meal, and iron ore |
| MRS | Iron ore, sugar, bulk cement, and steel products—others |
| Model | R2 | MSE | RMSE | MAE | Overfitting |
|---|---|---|---|---|---|
| Linear Regression | 0.999998 | 0.018672 | 0.136645 | 0.065880 | 0.000011 |
| Ridge Regression | 0.999998 | 0.018672 | 0.136647 | 0.065892 | 0.000011 |
| Lasso Regression | 0.999998 | 0.018571 | 0.136275 | 0.064732 | 0.000012 |
| Random Forest | 0.991793 | 63.041223 | 7.939850 | 4.988735 | 0.007527 |
| Decision Tree | 0.986610 | 102.851934 | 10.141594 | 6.778889 | 0.013390 |
| Support Vector Machine | 0.646779 | 2713.268202 | 52.089041 | 25.934691 | 0.013329 |
Disclaimer/Publisher’s Note: The statements, opinions and data contained in all publications are solely those of the individual author(s) and contributor(s) and not of MDPI and/or the editor(s). MDPI and/or the editor(s) disclaim responsibility for any injury to people or property resulting from any ideas, methods, instructions or products referred to in the content. |
© 2025 by the authors. Licensee MDPI, Basel, Switzerland. This article is an open access article distributed under the terms and conditions of the Creative Commons Attribution (CC BY) license (https://creativecommons.org/licenses/by/4.0/).
Share and Cite
Oliveira de Sousa, F.; Ariza Flores, V.A.; Cunha, C.S.; Oda, S.; Xavier Ratton Neto, H. Multi-Criteria Assessment of Flood Risk on Railroads Using a Machine Learning Approach: A Case Study of Railroads in Minas Gerais. Infrastructures 2025, 10, 12. https://doi.org/10.3390/infrastructures10010012
Oliveira de Sousa F, Ariza Flores VA, Cunha CS, Oda S, Xavier Ratton Neto H. Multi-Criteria Assessment of Flood Risk on Railroads Using a Machine Learning Approach: A Case Study of Railroads in Minas Gerais. Infrastructures. 2025; 10(1):12. https://doi.org/10.3390/infrastructures10010012
Chicago/Turabian StyleOliveira de Sousa, Fernanda, Victor Andre Ariza Flores, Christhian Santana Cunha, Sandra Oda, and Hostilio Xavier Ratton Neto. 2025. "Multi-Criteria Assessment of Flood Risk on Railroads Using a Machine Learning Approach: A Case Study of Railroads in Minas Gerais" Infrastructures 10, no. 1: 12. https://doi.org/10.3390/infrastructures10010012
APA StyleOliveira de Sousa, F., Ariza Flores, V. A., Cunha, C. S., Oda, S., & Xavier Ratton Neto, H. (2025). Multi-Criteria Assessment of Flood Risk on Railroads Using a Machine Learning Approach: A Case Study of Railroads in Minas Gerais. Infrastructures, 10(1), 12. https://doi.org/10.3390/infrastructures10010012