Abstract
This study presents the development and validation of a high-efficiency optical interface designed for ultra-high-concentration photovoltaic (UHCPV) systems, with a focus on enabling clean and sustainable solar energy conversion. A Fresnel lens serves as the primary optical concentrator in a novel system architecture that integrates advanced optical design with system-level thermal management. The proposed modeling framework combines detailed 3D ray tracing with coupled thermal simulations to accurately predict key performance metrics, including optical concentration ratios, thermal loads, and component temperature distributions. Validation against theoretical and experimental benchmarks demonstrates high predictive accuracies within 1% for optical efficiency and 2.18% for thermal performance. The results identify critical thermal thresholds for long-term operational stability, such as limiting mirror temperatures to below 52 °C and photovoltaic cell temperatures to below 130 °C. The model achieves up to 89.08% optical efficiency, with concentration ratios ranging from 240 to 600 suns and corresponding focal spot temperatures between 37.2 °C and 61.7 °C. Experimental benchmarking confirmed reliable performance, with the measured results closely matching the simulations. These findings highlight the originality of the coupled optical–thermal approach and its applicability to concentrated photovoltaic design and deployment. This integrated design and analysis approach supports the development of scalable, clean photovoltaic technologies and provides actionable insights for real-world deployment of UHCPV systems with minimal environmental impact.
1. Introduction
Concentrating photovoltaic (CPV) systems offer a promising pathway for clean and efficient solar power generation by focusing sunlight onto high-efficiency multi-junction solar cells using optical elements such as Fresnel lenses. These systems can significantly increase solar-to-electric conversion efficiency while reducing the required photovoltaic material footprint, contributing to both economic and environmental sustainability. However, a high optical concentration also introduces substantial thermal loads, which can reduce electrical performance and shorten a system’s lifespan. Therefore, the design of clean and efficient CPV systems must holistically integrate both optical concentration and thermal management strategies from the earliest development stages [1].
Recent advances, such as the use of achromatic silicon-on-glass (SOG) Fresnel lenses with 95% transmissivity and four-junction solar cells, have achieved conversion efficiencies of up to 43% [2]. Fresnel lenses are particularly attractive for their optical efficiency and cost-effectiveness [3], yet higher concentration ratios often result in elevated cell temperatures, which compromise the electrical output and system reliability. Studies have shown that under ultra-high concentrations, resistive losses and thermal degradation become critical issues. For instance, Fernández et al. [4] reported a 28.4% efficiency drop in Vertical-Tunnel-Junction (VTJ) solar cells operating at 15,000 suns, while El-Gahouchi et al. [5] demonstrated that the efficiency decreased from 33% at 3500 suns to 28% at 10,000 suns using duplicated junction architectures.
Effective thermal management, whether passive or active, is essential for ensuring long-term system performance and safety, especially under ultra-high solar flux. Various studies have explored thermal behaviors of CPV receivers and cooling strategies [6,7,8,9]. For example, thermal modeling of a 3 × 3 mm2 triple-junction solar cell without a heat sink revealed critical temperature limits [10], and further investigations examined passive cooling across diverse cell sizes and concentration levels [10,11]. Recent efforts have shown that well-designed passive systems can maintain safe cell temperatures even at ≥10,000 suns [12,13], while active cooling continues to be viable under extreme thermal loads.
Traditional CPV thermal models often the simplify solar input as a uniform or boundary heat source [14,15,16,17,18,19], which fails to represent the real spatial irradiance distribution on the cell surface. Only in recent years have coupled optical–thermal simulation approaches emerged to address this limitation. For example, bidirectionally coupled ray tracing models have been used to analyze Fresnel optics paired with multi-junction cells and homogenizing stages [20]. Similar multi-domain approaches have been applied in clean energy technologies such as micro-scale Organic Rankine Cycles (ORCs) [21] and hybrid adsorption–ORC systems [22].
The utility of Fresnel lenses has also been confirmed in broader solar–thermal applications, such as solar-driven metal welding and Stirling engines, using multiphysics simulation environments like COMSOL [23,24]. These simulations not only reinforce the importance of accurate optical–thermal modeling but also highlight the relevance of scalable clean technologies that are driven by solar concentration.
To support the sustainable development and deployment of ultra-high-concentration photovoltaic (UHCPV) systems, comprehensive system-level modeling must consider all major components optically, thermally, and mechanically. Such integrated analysis helps minimize material waste, optimize cooling solutions, and improve long-term reliability under extreme solar concentrations. Despite notable progress, there remains a gap in early-stage design tools that accurately link optical and thermal subsystems for UHCPV applications, particularly at concentration levels beyond 2000 suns, where design tolerances are tight and solar tracking precision is critical.
In response to these challenges, this study introduces a high-fidelity, bidirectionally coupled optical–thermal model developed in COMSOL Multiphysics. The model simulates a CPV system featuring a Fresnel lens as its primary optical interface and targets multi-stage concentrations to achieve ultra-high flux ratios. In contrast to traditional thermal models, which assume a uniform heat input, this approach integrates spatial irradiance maps obtained through ray tracing directly into the thermal solver. Direct normal irradiance (DNI) conditions from 400 W/m2 to 1000 W/m2 were explored to assess optical–thermal interactions across realistic operating scenarios. Validation was performed using both theoretical benchmarks and experimental thermal testing under a controlled solar simulator.
By isolating and analyzing the primary optical interface before full system integration, this work provides a scalable and sustainable design framework for next-generation UHCPV technologies. The model enables accurate prediction of key performance parameters such as concentration ratios, receiver temperatures, and thermal load distributions, informing material choices, cooling strategies, and system reliability. This contributes to the broader goal of advancing clean, high-efficiency solar energy systems that are capable of meeting future energy demands with minimal environmental impacts.
The State of the Art vs. This Work
Previously coupled optical–thermal models for CPV systems have often assumed uniform irradiance distributions or treated optical and thermal domains sequentially, limiting their predictive accuracy under ultra-high flux. In contrast, the present work introduces a bidirectional coupling strategy where ray-traced irradiance maps are directly integrated into the thermal solver. This approach improves fidelity in focal regions with steep irradiance gradients and enables accurate prediction of hotspot distributions. Furthermore, unlike prior studies that were validated only against theoretical benchmarks, our framework is validated through both theoretical and experimental testing, achieving <1% optical and <2.2% thermal deviation. This integration and validation advance the current state of the art by providing a scalable, experimentally verified tool for UHCPV system design.
2. CPV Design Aspects
Before experimentation, a numerical understanding of a CPV system must inform the appropriate solar cell type and dimensions based on focal area characteristics. The ray tracing analysis is meant to examine the optical path based on the succession of optics within a CPV system and determine the focal area and its irradiance distribution. In addition, ray tracing helps to determine both the optical efficiency and optical concentration ratio. The heat transfer analysis determines the temperature operating range on the solar cell surface area and the optics. The temperature level helps to design and plan for the deployed cooling mechanism for the safe operating temperature of the solar cell below [25]. In the numerical study, the temperature operating range is influenced by the geographical location in terms of the DNI and climate conditions.
3. Numerical Model
3.1. Optical Model
The optical path was computed using Hamiltonian optics principles under isotropic conditions, incorporating Snell’s law for ray tracing across interfaces [26], which is a set of differential equations describing the trajectories of rays in terms of ray position and wave vector . The angular frequency substitutes a place that is usually taken by the Hamiltonian (H) in the right-hand side of Equations (1) and (2), which is the gradient of the angular frequency with respect to vectors and .
In the isotropic medium, when the refractive index is homogeneous, the Hamiltonian formulation as shown in Equations (1) and (2) is rewritten to only account for the constant speed and ray direction of light, as in Equations (3) and (4).
where c is the speed of light (), and (dimensionless) is the refractive index. When the inhomogeneous refractive index at the optical interface is accounted for, the direction of the refracted ray is calculated relying on Snell’s law, as in Equation (5).
where and denote the angle of incidence and refraction, respectively. The optical model applied Snell’s law and the law of reflection between different optical interfaces based on the deterministic ray splitting approach. The deposited ray power sub-node calculates the energy of concentrated rays that arrive on a surface, relying on the incident ray’s power based on Equation (6).
where is the boundary heat flux , is the receiver surface area , and is the sum of rays depositing power into the receiver .
3.2. Thermal Model
In the thermal model, the heat transfer rate on the receiver area is governed by the energy conservation equation for the steady-state condition, as in Equation (7). The heat source term () is based on Equation (6), calculated in the optical model.
where , , and are the conduction heat transfer, the convection heat transfer, and the radiation heat transfer, respectively. The amount of through a domain is based on Fourier’s law, where the conduction is proportional to the temperature gradient (, relying on the thermal conductivity and the geometry thickness , as in Equation (8).
The operator ( identifies the conduction heat transfer in three dimensions . The material thermal resistance affects the heat transfer rate with an inverse correlation with the thermal conductivity. The convective heat transfer is influenced by both the wind speeds and the ambient temperature. Newton’s law of cooling computes the considering both the ambient temperature () and convective heat transfer coefficient (), as in Equation (9).
where the is between the receiver surface temperature and . Concentrated flux on the receiver initiates radiative heat transfer, modeled via the Stefan–Boltzmann law, as shown in Equation (10).
where is the Stefan–Boltzmann constant , is the receiver emissivity, is the receiver surface temperature, and is the ambient temperature.
3.3. Boundary Conditions
The numerical model was established using the “Geometrical Optic” and the “Heat Transfer in Solid” models to compute the system optically and, hence, thermally based on the “bidirectional coupled ray tracing”. Optically, the Fresnel lens was applied as an illuminated surface with a transmittance of 90%, and the copper plate was set up as a freezing surface with a “Ray-Deposited Power” sub-node. The surrounding medium was modeled at a constant ambient temperature of 20 °C. The Fresnel lens design was built using SOLIDWORKS to produce a focal length of 42 cm, as in [27]. Thermally, all domains are subjected to a convective heat transfer coefficient of and ambient temperature of 20 °C. The thermal emissivity is considered to be 0.9 for the copper plate. The copper plate was also assigned as a boundary heat source relying on the “Ray-Deposited Power” sub-node, which is calculated in the “Geometrical Optic” model. In the optical model, the optical dispersion for the SOG Fresnel lens and the achromatic aberration were assumed to be negligible. The defined position for the Fresnel and the copper sheet with its geometry is shown in Figure 1a, while the optical and thermal boundary conditions are illustrated in Figure 1b.
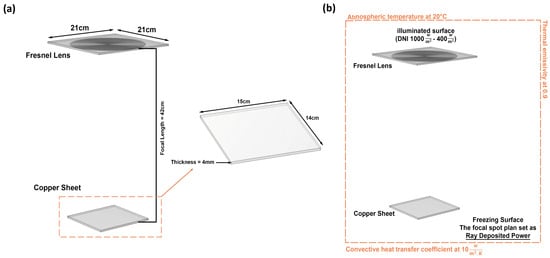
Figure 1.
The asymmetric view of only the primary optic, with the copper plate as a receiver, where (a) is the detailed geometry and (b) is the optical and thermal boundary conditions.
3.4. Numerical Results
The results of the ray tracing can be exhibited as ray trajectories, which show the ray in 3d initiated from the illuminated surface and absorbed at the freezing surface within . The modeled Fresnel lens resulted in an optical path (focal length of 42 cm), as shown in Figure 2.
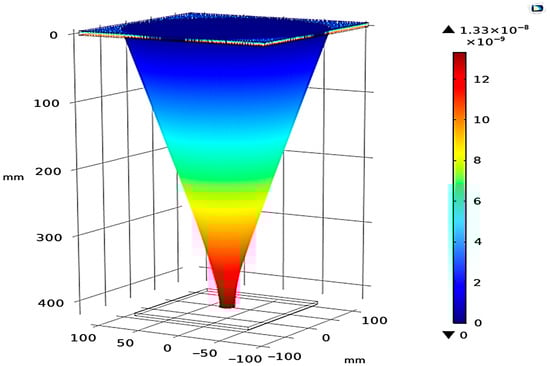
Figure 2.
The ray trajectory plot for a focal length of 42 cm.
The established model predicted the maximum boundary heat source (simulative optical concentration ratio ()) on the copper plate, with the DNI ranging from 1000 to 400 in an interval of 100 . At 1000 , the result showed that the boundary heat source was , which is equivalent to 600 suns, assuming that 1 sun is 1000 . At 400 , the result showed that the boundary heat source was (equivalent to 240 suns). The change in the DNI from to led to a drop in the simulative optical concentration ratio by 60% (359 suns). The optical model resulted in a focal spot that is relatively uniform, with a diameter of 10 mm. The rest of the predicted results are shown for the produced focal spot on the copper surface for the simulative optical concentration ratio, as shown in Figure 3.
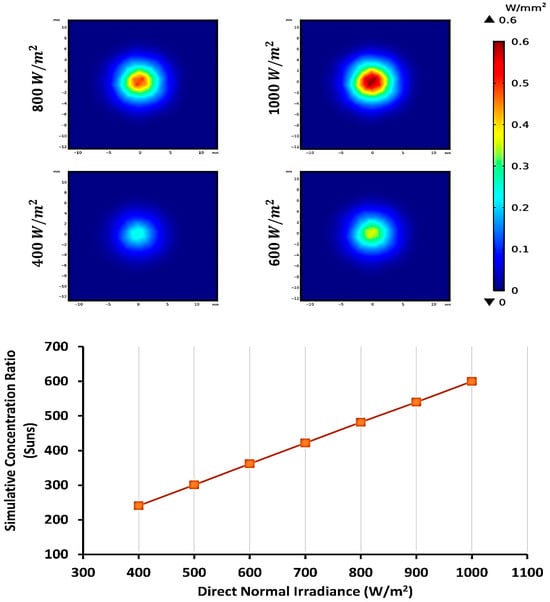
Figure 3.
Simulative optical concentrations across the focal spot area at different DNI values ranging from 400 to 1000 .
Based on the bidirectionally coupled ray tracing study approach, the thermal model is useful for predicting the maximum temperature in the focal spot for DNI values ranging from 400 –1000 in an interval of 100 . The heat transfer in the solid model predicted the temperature to be 61.7 °C and 37.2 °C at DNI values of 1000 and 400 , respectively. The temperature decreased by 40% (24.5 °C) with DNI from 1000 to 400 . The screenshot for the temperature shows a homogeneous distribution across the focal spot, as shown in Figure 4.
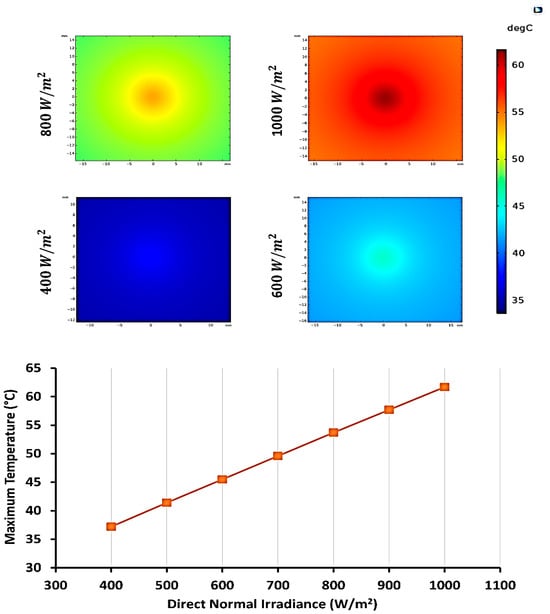
Figure 4.
Maximum temperature in the focal spot area generated at different DNI values ranging from 400 to 1000 .
4. Validation of the Optical and Thermal Model
To verify the reliability of the computational model estimating the optical and thermal performance of the Fresnel lens, two approaches were used for validation: one is a combined theoretical/experimental validation of the optical model results, and the other is experimental validation of the thermal model results. An experimental thermal setup was established based on a refractive optic [SOG–Fresnel lens] of 441 aperture area, which was exposed to a constant solar irradiance of 1000 . A WACOM AAA rating and spatial non-uniformity solar simulator combining both the Xenon short-arc lamp and an optical filter to reproduce a continuous solar irradiance at AM 1.5G were utilized. The solar simulator fabricated by WACOM (Model no. WXS-210S-20 AM1.5 G, made by Wacom Electric Co., Ltd., Fukaya-shi, Japan) to emulate a solar irradiance intensity approximating AM 1.5G through an angular optical filter of ° was used [28], as shown in Figure 5.
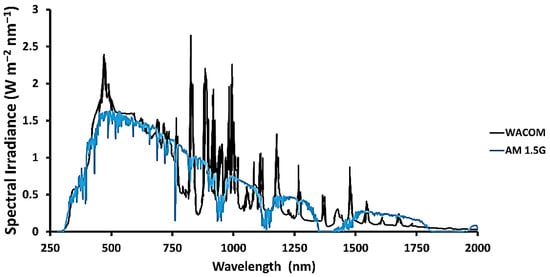
Figure 5.
The solar simulator spectrum profile for WACOM and AM 1.5G.
The refractive optic was vertically adjusted normally to the collimator lens of the solar simulator to achieve the optimum focal length of 42 cm. At this focal length, the optimum focal spot of in diameter is generated on a copper surface area, on which the maximum concentration ratio is achieved. The copper plate was adjusted to center the focal spot on its plain. The temperature was measured and acquired utilizing a Datalogger SDL200-EXTECH INSTRUMENTS, manufactured by Extech Instruments (Nashua, NH, USA). The test bench was configured to ensure high reproducibility. The Fresnel lens was mounted on a stable optical frame aligned with the simulator beam axis, and the copper receiver plate was positioned on a three-axis stage to allow for fine adjustments in both the lateral and longitudinal directions. Alignment was performed iteratively until the focal spot diameter matched the predicted ~10 mm distribution, ensuring consistent concentration conditions. The simulator provided a certified AM 1.5G spectrum with <2% non-uniformity, thereby minimizing external sources of optical variation. Three thermocouples were placed in the focal spot domain to gather the maximum measured temperatures and then average them for the measurement certainties, as illustrated in Figure 6.
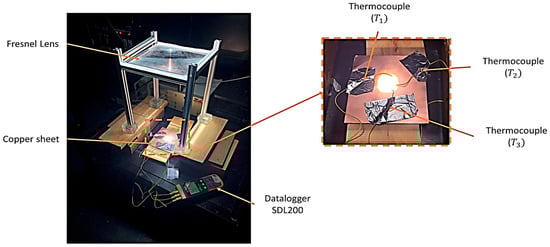
Figure 6.
The experimental setup with a magnified copper plate to illustrate the thermocouple positions.
4.1. Optical Validation
To theoretically characterize the performance of a CPV system based on a Fresnel Lens design, we need to solve for the theoretical optical efficiency at different DNI values ranging from 400 –1000 in an interval of 100 To do so, the focal spot diameter obtained from the simulation was used to calculate the geometrical concentration ratio to find the geometrical concentration ratio (. represents the area of the Fresnel lens ( to the area of the focal spot (. The optical efficiency of the Fresnel lens (transmissivity) ( of (transmittance spectra measured via spectrophotometry) needs to be accounted for in the calculation [27]. Therefore, the theoretical optical efficiency () is calculated as in Equation (11).
Afterwards, the theoretical optical concentration ratio ( is found using Equation (12).
As a result, is found to be 89.64% where is found to be 89.08% with a discrepancy of 1%. The showed results of 604 suns, 543 suns, 483 suns, 423 suns, 362 suns, 301 suns, and 242 suns for DNI values ranging from to 400 in an interval of 100 . The results of and in relation to the input power to the Fresnel lens is shown in Figure 7 for comparison. The discrepancy of the optical concentration between and is only 0.3% on average, reflecting a strong agreement in the results.
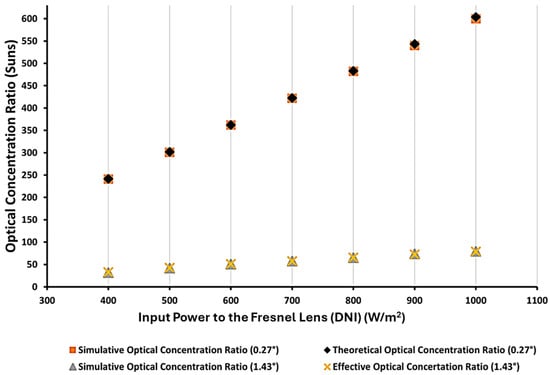
Figure 7.
The discrepancy between the simulated and theoretical optical concentration ratio with DNI values ranging from 400 to 1000 in accordance with the input power to the Fresnel lens.
As an example, a multi-junction solar cell with base material of GaInP/GaInAs/Ge on Ge substrates manufactured by Azurspace was unitized to understand the electrical performance optically [29]. The multi-junction solar cell was placed in the focal spot zone and maintained at a temperature of 25 °C using a cooling mount, similarly to the experimental approach in [30]. To determine the effective concentration ratio () (suns), the impact of the solar intensity on the multi-junction solar cell in terms of the short circuit current () to the short circuit current () value at the reference intensity of 1 sun equivalent to of solar irradiance was used, as in Equation (13).
To validate the to the , the simulation results must consider the collimating angle of irradiance for the WACOM solar simulator, which is 1.43°, and then account for the measured cell efficiency under the concentrated sun rays, which is found to be 33.5% on average. The divergence of optical concentration between and is found to be 1.1% on average at a 1.43° convergence angle, indicating a stable matching between the simulation and the experimental measurements. However, we can observe a drop in the optical concentration ratio at a convergence angle of 1.43° in comparison to the one at 0.27°, because the large collimating angle results in a wider focal spot than the solar cell area, where longer sun rays are lost.
4.2. Thermal Validation
To measure the maximum temperature, the solar simulator illuminates the Fresnel lens, which concentrates solar irradiance to produce a focal spot on a copper plate. The focal spot temperature reaches a steady-state plateau within 20 s. The temperature on the copper plate starts fluctuating within a minimized range around its saturation level. After the temperature reaches its saturation level, the temperature measurement is logged for a time interval of 5 min. Then, the logged data is averaged among the thermocouples ( and over the time (t) of 5 min, as in Equation (14):
The simulated maximum temperature using COMSOL and the measured maximum temperature are in good agreement, with an average discrepancy of 2.18%, as shown in Figure 8.
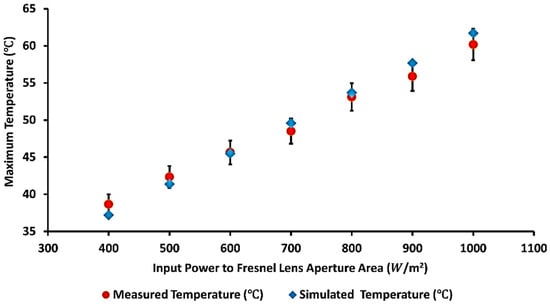
Figure 8.
Validation of the predicted maximum temperature in relation to the measured maximum temperature.
To ensure the reliability of the thermal validation, three Type K thermocouples were employed, factory-calibrated, and cross-checked against a reference probe, with an accuracy of ±0.5 °C. The sampling rate was set at 1 Hz, and steady-state data were logged over a 5 min interval. Placement tolerance within the focal spot was maintained within ±0.5 mm of the peak flux zone to minimize positional bias. In addition, the WACOM solar simulator used in this study has a certified spatial non-uniformity of <2%. Together, these factors define the measurement uncertainty. Considering both thermocouple positioning and simulator non-uniformity, the overall contribution to the reported ±2% discrepancy is minor, thereby reinforcing the robustness of the agreement between the experimental and simulated results.
5. The Potential Temperature for ¼ of the UHCPV System
To prepare for the UHCPV system design, the temperature needs to be predicted to plan for the selected optical materials and size/configure the associated cooling mechanism. The accumulation of temperature in the ultra-high-concentration range is harmful and could not only damage the receiver solar cells and their materials, but also any secondary or tertiary optics in between. Thus, the investigated model was extended to include secondary and tertiary reflective optics for a quarter of the UHCPV configuration, which is the receiver, to predict the temperature on the optical stages and then on the final central receiver [1]. All the consecutive optics to the Fresnel lens have been selected to be aluminum materials, keeping the same boundary condition as before. The geometry description and an illustration of the optics size and position in a 3D domain for ¼ of the UHCPV system are shown in Figure 9.
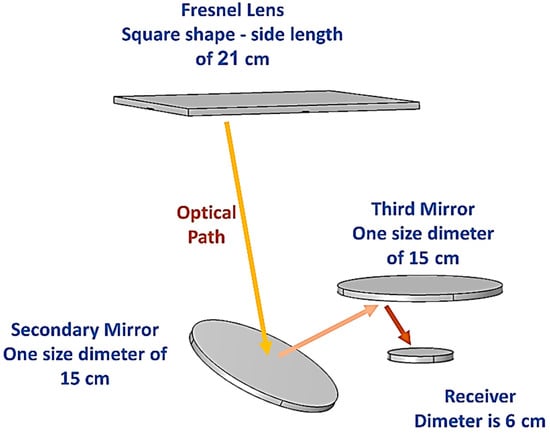
Figure 9.
Geometry description and illustration of 1/4 of the UHCPV system.
This section shows only the preliminary temperature level at ambient temperatures of 50 °C and 20 °C, while keeping the convective heat transfer coefficient at 10 , whereas a detailed numerical investigation of the full UHCPV system will be presented in separate papers. Figure 10 shows the temperature stratification on the consecutive optical surfaces for a ¼ of the system at ambient temperatures of 50 °C (Figure 10a) and 20 °C (Figure 10b). Also, the temperature distribution is influenced by the angular orientation of the secondary optical stage, which can be observed through the focal spot image reflective optics and the final receiver stages.
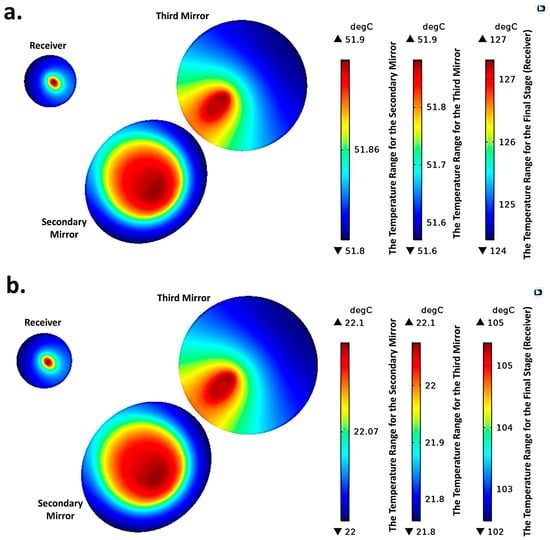
Figure 10.
The temperature distribution on the reflective optics and the receiver at (a) 50 °C and (b) 20 °C and with a convective heat transfer coefficient of 10 .
Figure 10 shows that the maximum estimated temperature conditions for the secondary mirror, third mirror, and receiver are ~52, 52, and 130 °C. Hence, for the experimental setup of the full ultra-high system, the materials chosen for these components should be stable within these temperature ranges. If they are below these temperatures but above those presented in Figure 10b, ambient temperature control may allow for safe experimental testing if needed. Beyond the passive convective pathways considered here, the presented Fresnel-based UHCPV framework is adaptable to advanced cooling methods. For example, phase change materials (PCMs) could buffer transient thermal spikes, while microchannel heat sinks or pin-fin structures may significantly enhance convective heat removal at the receiver stage. Such techniques can be integrated without altering the primary optical interface and will be addressed in future work.
6. Performance Analogs and Discussion
The common approach to predicting the thermal performance of a solar system numerically, either in a flat PV panel or a CPV system, is through “Heat Transfer in Solids” physics in COMSOL software, version 6.2. In this approach, the heat source term in the heat transfer balance equation is defined as a physical node called “Boundary Heat Source” for a surface area or “heat source” for a volume. The heat source terms need to be interlinked into a domain within the solar assembly, where photogeneration is induced (semiconductor layer). Briefly, all the photon energy within the bandgap energy of the semiconductor materials will be absorbed, and the rest generates thermal energy losses (thermalization intrinsic loss). Researchers rely on the heat source method to model the resultant heat on single cells, as well as dense array models. This approach is widely implemented, in which the temperature variance on the cell () translates, both for uniform and non-uniform distributions in the cell, while the distribution is originally Gaussian. However, in this approach, the uniformity distributions reflect a Gaussian distribution with much flattening in the peak (lower between the center of the solar cell and the solar cell edge), and the non-uniformity distributions still reflect a Gaussian distribution with a sharp peak (larger between the center of the solar cell and the solar cell edge) [31,32,33,34]. The boundary heat source is generally calculated in units ( based on Equation (15) [35].
where stands for the optical efficiency, and stands for the electrical efficiency of the solar cell. While this work is tailored for UHCPVs, similar stability challenges are faced by emerging perovskite solar cells under high optical and thermal flux. A recent study [36] reported degradation pathways in perovskite devices that parallel those in UHCPV receivers. Highlighting this cross-disciplinary relevance strengthens the broader applicability of the proposed framework. Performing a thermal numerical study based on this approach is less complicated and requires less computational time to predict performance. However, this approach assumes a completely uniform irradiance distribution over the cell surface area, which is not the case, especially for the fixed flat PV panel or CPV system for either a point or focal line concentration. To overcome this issue, the ray tracing model is computed in optical-based software (such as Zmax, ASPA, and APEX) and then imported into COMSOL as an interpolation function to be incorporated with Equation (14). In terms of computational resources, each coupled optical–thermal case required approximately 20–25 min on a workstation (Intel Xeon, 64 GB RAM-manufactured by Intel Corporation, California-US) for full 3D focal spot resolution. A mesh refinement study was conducted in the focal region to account for steep irradiance gradients, and further densification of the mesh (40% smaller elements) changed the peak temperature predictions by less than 1.5%. This confirms that the results are numerically stable and not sensitive to further mesh refinement.
This limitation can be overcome by employing COMSOL’s integrated ray optics and heat transfer modules to predict thermal performance. Through the ray optics model, the optical concentration ratio is computed by relying on geometrical optics (system design). The instantaneous ray trajectory computation exhibits a close-to-reality solar irradiance distribution on a receiver surface area, which helps to define the size that is needed of a solar cell. In contrast, the numerical study based only on the heat transfer on the solid model assumed that the area of the focal spot is like the area of the solar cell and that the heat distribution is homogenous (Gaussian) across only the solar cell area. The fidelity of coupled optical–thermal simulations remain sensitive to mesh resolution, especially in focal regions, where the optical result is significantly influenced. Computational time is another challenge, but only when the optical model is coupled with the thermal model to predict performance optically and thermally. Compared to earlier Gaussian-based thermal models, which often assume uniform irradiance distributions, the present framework directly integrates spatially resolved irradiance maps into the thermal solver. This leads to more accurate hotspot prediction and improves thermal estimation, as reflected in the <2.2% validation error. Such fidelity, combined with experimental benchmarking, represents the main original contribution of this work relative to prior studies.
7. Conclusions
This study introduces a validated, high-resolution simulation framework that integrates bidirectional optical modeling with steady-state thermal analysis to support the sustainable design of Fresnel-based concentrating photovoltaic (CPV) systems. Developed in COMSOL Multiphysics, the model captures system-level interactions between optical concentration and thermal distribution across a range of real-world direct normal irradiance (DNI) conditions. It achieves up to 89.08% optical efficiency and concentration ratios from 240 to 600 suns, with corresponding focal spot temperatures between 37.2 °C and 61.7 °C. Experimental comparisons showed excellent agreement, with less than 1% deviation in optical efficiency and under 2.2% in thermal accuracy.
These results offer critical design insights for ensuring reliable operation of CPV systems, such as maintaining mirror and receiver temperatures below 52 °C and 130 °C, respectively. By providing early-stage system validation and guiding material selection and thermal management strategies, the model supports the development of high-performance, environmentally conscious solar energy technologies.
Through its tightly integrated optical–thermal approach, this work contributes a scalable, simulation-driven toolset that is tailored for clean energy innovation. It bridges the gap between component-level characterization and full system implementation, enabling more efficient, cost-effective, and sustainable deployment of ultra-high-concentration photovoltaic (UHCPV) technologies. To extend this framework to practical deployment, large-scale validation on pilot UHCPV modules (e.g., 1 kW installations) would be required. Such validation would not only confirm the thermal predictions but also establish a direct correlation with electrical performance metrics, including I–V characteristics and conversion efficiencies under real DNI fluctuations. In addition to UHCPV systems, the presented framework is adaptable to hybrid architectures, such as CPV/thermal co-generation, where waste heat can be harvested, or to modules incorporating spectral management layers to optimize the usable photon flux. Considering these pathways will further emphasize the scalability and interdisciplinary impact of the proposed model.
Future Avenues: Future work will extend the model to incorporate solar tracking, spectral management, and dynamic thermal behaviors, further aligning with the goals of clean, next-generation energy systems.
Funding
This research received no external funding.
Data Availability Statement
The data supporting this study’s findings are available from the corresponding author upon reasonable request.
Conflicts of Interest
The author declares no conflicts of interest.
Nomenclature
| Abbreviation | Full Term |
| DNI | Direct Normal Irradiance (W/m2) |
| SOG | Silicon-on-Glass |
| UHCPV | Ultra-High-Concentration Photovoltaic |
| Optical Efficiency (%) | |
| Thermal Efficiency (%) | |
| Optical Concentration Ratio (suns) | |
| Solar Cell Temperature (°C) | |
| Convective Heat Transfer Coefficient (W/m2·K) | |
| ε | Emissivity |
| σ | Stefan–Boltzmann Constant (W/m2·K4) |
References
- Shanks, K.; Ferrer-rodriguez, J.P.; Fernández, E.F.; Almonacid, F. A > 3000 Suns High Concentrator Photovoltaic Design Based on Multiple Fresnel Lens Primaries Focusing to One Central Solar Cell. Sol. Energy 2018, 169, 457–467. [Google Scholar] [CrossRef]
- Steiner, M.; Siefer, G.; Schmidt, T.; Wiesenfarth, M.; Dimroth, F.; Bett, A.W. 43% Sunlight to Electricity Conversion Efficiency Using CPV. IEEE J. Photovolt. 2016, 6, 1020–1024. [Google Scholar] [CrossRef]
- Wiesenfarth, M.; Steiner, M.; Wolf, J.; Schmidt, T.; Bett, A.W. Investigation of Different Fresnel Lens Designs and Methods to Determine the Optical Efficiency. AIP Conf. Proc. 2014, 1616, 97–101. [Google Scholar] [CrossRef]
- Fernández, E.F.; Seoane, N.; Almonacid, F.; García-Loureiro, A.J. Vertical-Tunnel-Junction (VTJ) Solar Cell for Ultra-High Light Concentrations (>2000 Suns). IEEE Electron Device Lett. 2019, 40, 44–47. [Google Scholar]
- El-Gahouchi, M.; Aziziyan, M.R.; Arès, R.; Boucherif, A. Optimized Duplicated-Junction Solar Cells: An Innovative Approach for Energy Harvesting at Ultra-High Concentrations. In Proceedings of the 16th International Conference on Concentrator Photovoltaic Systems (CPV-16), Denver, CO, USA, 4–6 May 2020; p. 020003. [Google Scholar]
- Abo-Zahhad, E.M.; Ookawara, S.; Radwan, A.; El-Shazly, A.H.; El-Kady, M.F.; Esmail, M.F.C. Performance, Limits, and Thermal Stress Analysis of High Concentrator Multijunction Solar Cell under Passive Cooling Conditions. Appl. Therm. Eng. 2020, 164, 114497. [Google Scholar] [CrossRef]
- Hu, H.; Yuan, D.; Wang, T.; Jiang, Y. Dynamic Performance of High Concentration Photovoltaic/Thermal System with Air Temperature and Humidity Regulation System (HCPVTH). Appl. Therm. Eng. 2019, 146, 577–587. [Google Scholar] [CrossRef]
- Dwivedi, P.; Sudhakar, K.; Soni, A.; Solomin, E.; Kirpichnikova, I. Advanced Cooling Techniques of P.V. Modules: A State of Art. Case Stud. Therm. Eng. 2020, 21, 100674. [Google Scholar] [CrossRef]
- Ali, H.M. Recent Advancements in PV Cooling and Efficiency Enhancement Integrating Phase Change Materials Based Systems—A Comprehensive Review. Sol. Energy 2020, 197, 163–198. [Google Scholar] [CrossRef]
- Min, C.; Nuofu, C.; Xiaoli, Y.; Yu, W.; Yiming, B.; Xingwang, Z. Thermal Analysis and Test for Single Concentrator Solar Cells. J. Semicond. 2009, 30, 044011. [Google Scholar] [CrossRef]
- Alzahrani, M.; Baig, H.; Shanks, K.; Mallick, T. Estimation of the Performance Limits of a Concentrator Solar Cell Coupled with a Micro Heat Sink Based on a Finite Element Simulation. Appl. Therm. Eng. 2020, 176, 115315. [Google Scholar] [CrossRef]
- AlFalah, G.; Maatallah, T.S.; Alzahrani, M.; Al-Amri, F.G. Optimization and Feasibility Analysis of a Microscale Pin-fins Heat Sink of an ultrahigh Concentrating Photovoltaic System. Int. J. Energy Res. 2020, 44, 11852–11871. [Google Scholar] [CrossRef]
- Valera, A.; Fernández, E.F.; Rodrigo, P.M.; Almonacid, F. Feasibility of Flat-Plate Heat-Sinks Using Microscale Solar Cells up to 10,000 Suns Concentrations. Sol. Energy 2019, 181, 361–371. [Google Scholar] [CrossRef]
- Micheli, L.; Sarmah, N.; Luo, X.; Reddy, K.S.; Mallick, T.K. Design of a 16-Cell Densely-Packed Receiver for High Concentrating Photovoltaic Applications. Energy Procedia 2014, 54, 185–198. [Google Scholar] [CrossRef][Green Version]
- Micheli, L.; Reddy, K.S.; Mallick, T.K. Plate Micro-Fins in Natural Convection: An Opportunity for Passive Concentrating Photovoltaic Cooling. Energy Procedia 2015, 82, 301–308. [Google Scholar] [CrossRef]
- Micheli, L.; Sarmah, N.; Fernandez, E.F.; Reddy, K.S.; Mallick, T.K. Technical Issues and Challenges in the Fabrication of a 144-Cell 500× Concentrating Photovoltaic Receiver. In Proceedings of the 2014 IEEE 40th Photovoltaic Specialist Conference, PVSC 2014, Denver, CO, USA, 8–13 June 2014; pp. 2921–2925. [Google Scholar] [CrossRef]
- Micheli, L.; Senthilarasu, S.; Reddy, K.S.; Mallick, T.K. Applicability of Silicon Micro-Finned Heat Sinks for 500× Concentrating Photovoltaics Systems. J. Mater. Sci. 2015, 50, 5378–5388. [Google Scholar] [CrossRef]
- Micheli, L.; Fernandez, E.F.; Almonacid, F.; Reddy, K.S.; Mallick, T.K. Enhancing Ultra-High CPV Passive Cooling Using Least-Material Finned Heat Sinks. AIP Conf. Proc. 2015, 1679, 130003. [Google Scholar] [CrossRef]
- Ahmed, A.; Zhang, G.; Shanks, K.; Sundaram, S.; Ding, Y.; Mallick, T. Performance Evaluation of Single Multi-Junction Solar Cell for High Concentrator Photovoltaics Using Minichannel Heat Sink with Nanofluids. Appl. Therm. Eng. 2021, 182, 115868. [Google Scholar] [CrossRef]
- Alamri, Y.A.; Mahmoud, S.; Al-Dadah, R.; Sharma, S.; Roy, J.N.; Ding, Y. Optical Performance of Single Point-Focus Fresnel Lens Concentrator System for Multiple Multi-Junction Solar Cells—A Numerical Study. Energy 2021, 14, 4301. [Google Scholar] [CrossRef]
- Alamri, Y.A.; Albaik, I.; Mahmoud, S.; Al-Dadah, R.; Ismail, M.A. Integration of Concentrated Multi-Junction Solar Cells with Small-Scale Organic Rankine Cycle. Energy Convers. Manag. 2021, 239, 114235. [Google Scholar] [CrossRef]
- Albaik, I.; Alamri, Y.A.; Elsheniti, M.B.; Al-Dadah, R.; Mahmoud, S.; Ismail, M.A. Assessment of a Novel Multi-Generation Solar CPV/T System Combining Adsorption and Organic Rankine Cycle Subsystems. Sol. Energy 2022, 236, 455–472. [Google Scholar] [CrossRef]
- Qandil, H.; Wang, S.; Zhao, W. Application-Based Design of the Fresnel Lens Solar Concentrator. Renew. Wind Water Sol. 2019, 6, 3. [Google Scholar] [CrossRef]
- Qandil, H.; Zhao, W. Design and Evaluation of the Fresnel-Lens Based Solar Concentrator System Through a Statistical-Algorithmic Approach. In Proceedings of the Volume 8B: Heat Transfer and Thermal Engineering, American Society of Mechanical Engineers, Pittsburgh, PA, USA, 9 November 2018. [Google Scholar]
- Alzahrani, M.; Roy, A.; Shanks, K.; Sundaram, S.; Mallick, T.K. Graphene as a Pre-Illumination Cooling Approach for a Concentrator Photovoltaic (CPV) System. Sol. Energy Mater. Sol. Cells 2021, 222, 110922. [Google Scholar] [CrossRef]
- Tawalbeh, M.; Al-Othman, A.; Kafiah, F.; Abdelsalam, E.; Almomani, F.; Alkasrawi, M. Environmental Impacts of Solar Photovoltaic Systems: A Critical Review of Recent Progress and Future Outlook. Sci. Total Environ. 2021, 759, 143528. [Google Scholar] [CrossRef]
- Alzahrani, M.; Ahmed, A.; Shanks, K.; Sundaram, S.; Mallick, T. Optical Losses and Durability of Flawed Fresnel Lenses for Concentrated Photovoltaic Application. Mater. Lett. 2020, 275, 128145. [Google Scholar] [CrossRef]
- Wacom Electric Ltd. Available online: https://www.worldwide-china.com/en/productDetails.php?serial=157 (accessed on 18 September 2025).
- Azur Space Solar Power GMBH. Enhanced Fresnel Assembly-EFA Type: 3C42A–with 10 × 10 mm2 CPV TJ Solar Cell Application: Concentrating Photovoltaic (CPV) Modules. 2014. Available online: https://www.mikrocontroller.net/attachment/360379/CPV-Modoul_3C44_AzurDesign_EFA_10x10.pdf (accessed on 18 September 2025).
- Alzahrani, M.; Ahmed, A.; Shanks, K.; Sundaram, S.; Mallick, T. Optical Component Analysis for Ultrahigh Concentrated Photovoltaic System (UHCPV). Sol. Energy 2021, 227, 321–333. [Google Scholar] [CrossRef]
- Siyabi, I.A.; Shanks, K.; Mallick, T.; Sundaram, S. Thermal Analysis of a Multi-Layer Microchannel Heat Sink for Cooling Concentrator Photovoltaic (CPV) Cells. In Proceedings of the 13th International Conference on Concentrator Photovoltaic Systems (CPV-13), Ottawa, ON, Canada, 1–3 May 2017; p. 070001. [Google Scholar]
- Ahmed, A.; Shanks, K.; Sundaram, S.; Mallick, T. Energy and Exergy Analyses of New Cooling Schemes Based on a Serpentine Configuration for a High Concentrator Photovoltaic System. Appl. Therm. Eng. 2021, 199, 117528. [Google Scholar] [CrossRef]
- Dong, J.; Zhuang, X.; Xu, X.; Miao, Z.; Xu, B. Numerical Analysis of a Multi-Channel Active Cooling System for Densely Packed Concentrating Photovoltaic Cells. Energy Convers. Manag. 2018, 161, 172–181. [Google Scholar] [CrossRef]
- Almara, L.M. Ray Optics and Heat Transfer Analysis of a Curved Fresnel Lens Heater for a Desalination System. In Proceedings of the COMSOL Conference 2020 North America, Virtual, 7–8 October 2020. [Google Scholar]
- Ali, A.Y.; Abo-Zahhad, E.M.; Elqady, H.I.; Rabie, M.; Elkady, M.F.; Ookawara, S.; El-Shazly, A.H.; Radwan, A. Thermal Analysis of High Concentrator Photovoltaic Module Using Convergent-Divergent Microchannel Heat Sink Design. Appl. Therm. Eng. 2021, 183, 116201. [Google Scholar] [CrossRef]
- Waqas, M.; Khadka, D.B.; Khan, A.H.H.; Wang, Y.-C. Fullerene-Driven Photocarrier Processes in Perovskite Solar Cells: Recent Advances. Nanoscale 2025, 17, 15648–15675. [Google Scholar] [CrossRef]
Disclaimer/Publisher’s Note: The statements, opinions and data contained in all publications are solely those of the individual author(s) and contributor(s) and not of MDPI and/or the editor(s). MDPI and/or the editor(s) disclaim responsibility for any injury to people or property resulting from any ideas, methods, instructions or products referred to in the content. |
© 2025 by the author. Licensee MDPI, Basel, Switzerland. This article is an open access article distributed under the terms and conditions of the Creative Commons Attribution (CC BY) license (https://creativecommons.org/licenses/by/4.0/).