Article

Calibration and Validation of a PEM Fuel Cell Hybrid Powertrain Model for Energy Management System Design

Department of Mechanical and Aerospace Engineering, Politecnico di Torino, 10129 Torino, Italy
*
Author to whom correspondence should be addressed.
Designs 2025, 9(4), 94; https://doi.org/10.3390/designs9040094
Submission received: 10 July 2025 / Revised: 30 July 2025 / Accepted: 7 August 2025 / Published: 12 August 2025
(This article belongs to the Section Mechanical Engineering Design)

Abstract

This paper presents a calibrated and dynamically responsive simulation framework for hybrid energy systems that integrate Proton Exchange Membrane Fuel Cells (PEMFCs) and batteries, targeting applications in light commercial vehicles (LCVs). The aim is to support the design and assessment of energy management strategies (EMS) under realistic operating conditions. A publicly available PEMFC model is used as the starting point. To improve its representativeness, calibration is performed using experimental polarization curve data, enhancing the accuracy of the stack voltage model, and the air compressor model—critical for maintaining stable fuel cell operation—is adjusted to reflect measured transient responses, ensuring realistic system behavior under varying load demands. Quantitatively, the calibration results are strong: the R2 values of both the fuel cell polarization curve and the overall system efficiency are around 0.99, indicating excellent agreement with experimental data. The calibrated model is embedded within a complete hybrid vehicle powertrain simulation, incorporating longitudinal dynamics and control strategies for power distribution between the battery and fuel cells. Simulations conducted under WLTP driving cycles confirm the model’s ability to replicate key behaviors of PEMFC-battery hybrid systems, particularly with respect to dynamic energy flow and system response. In conclusion, this work provides a reliable and high-fidelity simulation environment based on empirical calibration of key subsystems, which is well suited for the development and evaluation of advanced EMS algorithms.

1. Introduction

As global energy shortages and environmental concerns become increasingly pressing, fuel cell technology is gaining significant attention as a potential solution. A fuel cell is an electrochemical device that directly converts the chemical energy of hydrogen and oxygen into electrical energy through electrode reactions [1]. The main byproduct of this reaction is water, resulting in zero local emissions, which makes fuel cells a truly pollution-free energy source at the point of use [2]. Additionally, fuel cells are not constrained by the Carnot cycle, allowing for high energy conversion efficiencies that can reach between 60% and 80% [3].
To fully realize the potential of PEMFCs in automotive applications, accurate modeling and simulation are essential [4]. In practical scenarios, especially during the design and testing of vehicle powertrains, it is neither efficient nor feasible to rely solely on experimental trials [5]. Such testing not only consumes considerable time and resources but also poses a risk of degradation to the fuel cell system [6]. A reliable simulation model enables efficient exploration of system behavior under various operating conditions, supporting the development of control strategies [7], energy management systems [8], and component integration [9].
Despite the growing body of literature on PEMFC modeling, two major limitations persist. First, many existing models are highly detailed [10], focusing extensively on the electrochemical processes [11,12] and auxiliary systems [13]. While informative, these models often require numerous physical parameters that are not always available in vehicle-level research. In such cases, engineers may have access only to basic datasets, such as polarization curves or rated performance points. Moreover, from a powertrain design perspective, the focus is generally on macroscopic input–output relationships—voltage, current, and power—rather than internal cell-level dynamics. Second, other models in the literature are oversimplified [14], with empirical or control-oriented formulations [15] that lack transparency and generalizability [16]. These approaches are often difficult to calibrate or adapt, even when basic reference data are available, thus limiting their practical utility in system-level applications [17].
In this study, a dynamic model of a complete proton exchange membrane fuel cell (PEMFC) system is developed to support energy management simulations. The model by Pukrushpan et al. [18], which includes a detailed cathode air supply loop from the compressor to the outlet manifold, is adopted as the baseline due to its comprehensive dynamic behavior. Building upon this foundation, the proposed model retains key transient characteristics while enhancing computational efficiency and facilitating integration into larger vehicle simulation frameworks, which includes a complete cathode air control loop, from the air compressor to the outlet manifold. The new model preserves dynamic features while maintaining computational efficiency and ease of integration.
To meet the performance requirements of vehicle propulsion and portable fuel cell applications, a fuel cell stack is commonly coupled with a battery via a DC/DC converter to form a hybrid power system. This configuration allows the system to leverage the strengths of both power sources, with the battery providing supplementary power during peak demands and enabling energy recovery through regenerative braking. Defining the performance parameters of the fuel cell and identifying potential limitations are critical steps in designing effective fuel cell hybrid power applications [19]. When data for battery and vehicle dynamics models are limited, a comprehensive methodology for modeling and simulating BEVs can be utilized to guide engineers and researchers in the early stages of EVs design [20,21,22]. This approach provides a robust and efficient framework for developing hybrid power systems and ensuring optimal performance [23]. A well-calibrated model enhances the accuracy of dynamic energy flow simulation, providing a more reliable representation of energy distribution over time [24]. Thus, this research lays crucial groundwork for advancing the understanding and optimization of hybrid energy management in fuel cell electric vehicles.

2. Fuel Cell and Battery Hybrid Vehicle Modeling

This chapter presents the modeling approach adopted for a hybrid electric vehicle powered by a fuel cell and a battery system. The primary objective is to build a simulation platform capable of supporting the development and evaluation of energy management strategies, with a particular focus on system efficiency and vehicle range. To this end, this chapter begins with a brief description of the fuel cell model, including essential calibration to ensure realistic performance representation. Following this, a simplified modeling method is introduced for the battery pack and electric drive, suitable for early-stage simulations where rapid evaluation is prioritized over detailed physical fidelity. Finally, the vehicle’s longitudinal dynamics are described along with the implementation of a basic longitudinal controller. This structure ensures that all powertrain components are integrated within a consistent framework, enabling the effective assessment of energy flows and system behavior under various operating conditions.

2.1. Fuel Cell System

There are various approaches to modeling fuel cells. One common method is to represent the fuel flow as a function of power and efficiency, where efficiency is treated as a variable dependent on power output [14]. Alternatively, methods like response surface modeling can capture input–output relations but are impractical without sufficient experimental data [16]. Although this approach is simple, it lacks dynamic behavior, as it assumes fixed voltage and current values for each power level, while the model proposed in this paper is capable of simulating smooth transitions in voltage and current in response to changes in power demand, effectively avoiding abrupt discontinuities. Moreover, detailed models focusing on mass transfer or gas channel behavior in each layer of the fuel cell stack are computationally intensive and therefore unsuitable for powertrain energy management analysis, as such models require lots of physical parameters of FC stack and long simulation times to estimate total driving range [11,12].
A fuel cell system typically comprises four subsystems: hydrogen circuit, air circuit, coolant circuit, and humidifier circuit. Since most fuel cells use deionized water as the coolant, the coolant and humidifier subsystems are often integrated into a single water circuit. This chapter outlines the modeling principles of the key components involved in the hybrid fuel cell system, drawing upon the detailed framework proposed by Pukrushpan et al. [18]. While their model provides a well-established foundation, certain subsystems—particularly those affecting energy flow and control dynamics—require refinement to better support the objectives of this study.
Emphasis is placed on the stack voltage model and the air compressor model, which significantly influence system performance and energy management strategies. These components have been modified to improve numerical stability, capture transient behaviors more accurately, and better align with the hybrid architecture used in this study. For a comprehensive description of the complete PEMFC system, readers are referred to the original work by Pukrushpan et al. [18].

2.1.1. Stack Voltage Model

Stack voltage is calculated as the product of the number of cells by their individual voltage. The combined effect of thermodynamics, kinetics and ohmic resistance determines the output voltage of the cell v f c   as defined by [1]:
v f c = E v a c t v o h m v c o n c
where E is the open circuit voltage, v a c t is the activation loss, v o h m is the ohmic loss, and v c o n c is the concentration loss. The Nernst equation describes the theoretical open-circuit voltage of a fuel cell [7]:
E = Δ G r e a c t 2 F + R g a s · T 2 F · ln p H 2 · p O 2 0.5 p H 2 O
where Δ G r e a c t is the Gibbs free energy, F is Faraday’s Constant, R g a s is the gas constant, T is expressed in Kelvin and p H 2 , p O 2 and p H 2 O are expressed in atm. In real applications, the OCV is lower than the theoretical Nernst voltage due to additional losses such as hydrogen crossover and internal short circuits [25]. However, these effects will not be considered in this work.
As indicated by Equation (2), the operating temperature of the fuel cell stack has a significant impact on its performance. But due to the absence of a thermal management loop in the model and the lack of sufficient temperature-related experimental data for validation, the fuel cell temperature is assumed to remain constant at 80 °C throughout this study.
Activation loss arises from the energy required to drive electrochemical reactions at the electrodes, involving electron transfer and bond breaking/forming. While both electrodes contribute, the loss is primarily dominated by the slower oxygen reduction reaction at the cathode, as the hydrogen oxidation at the anode proceeds relatively quickly. The relation between the activation voltage drops and the current density is described by the Tafel equation [17]:
v a c t = b ln i i 0
where i is the current density, i 0 is the exchange current density, and b is the Tafel slope. Though the Tafel equation was originally concluded from experimental data, it also has a theoretical foundation, that for a hydrogen fuel cell with two electrons, the constant b is given by:
b = R T 2 α F
where the constant α is called the charge transfer coefficient and is the proportion of the electrical energy applied that is harnessed in changing the rate of an electrochemical reaction. For the hydrogen electrode, its value is about 0.5 for a great variety of electrode materials. At the oxygen electrode, its value is between about 0.1 to 0.5 in most cases [1].
Meanwhile, the exchange current density i 0 is crucial in controlling the performance of the fuel cell electrode. The i 0 at cathode is much smaller than that at anode. Since the smaller the i 0 , the greater the voltage drop, the voltage drop at the anode is negligible compared to that of the cathode [1,2].
Ohmic loss is due to the resistance of the polymer membrane to the transfer of protons and the resistance of the electrodes and the collector plate to the transfer of electrons. The voltage drop that corresponds to the ohmic loss is proportional to the current density:
v o h m = i · t m σ m
where t m is the thickness of the membrane and the membrane conductivity, σ m is a function of membrane water content, λ m and fuel cell temperature [26]:
σ m = b 1 · exp b 2 1 303 1 T f c b 1 = 0.005139 λ m 0.00326 b 2 = 350
Since membrane conductivity depends on water content and temperature—both fixed by the model—the only adjustable parameter to tune ohmic voltage loss is membrane thickness, t m . Industry-optimized Nafion membranes typically range from 20 to 50 μm in thickness.
Concentration losses, also known as mass transport losses, arise from limitations in the diffusion of reactants to the catalyst sites as the electrochemical reaction proceeds. These losses become increasingly significant at high current densities, where the depletion of reactant concentration near the electrode surface leads to a steep voltage drop. While classical models describe this phenomenon using logarithmic relations derived from the Nernst equation, the empirical expression presented in Equation (7) offers a better fit for the nonlinear voltage behavior observed at high current densities [27]:
v c o n c = i c 2 i i l i m c 3
where c 2 , c 3 and i l i m are constants that depend on the temperature and the reactant partial pressure and can be determined empirically. The parameter i l i m is the current density that causes precipitous voltage drop. This formulation is particularly useful in dynamic system simulations, where accurately capturing performance degradation underload is critical.

2.1.2. Calibration of Stack Voltage Model

The tunable parameters in the stack voltage model are b , i 0 , t m and i l i m , which are calibrated in the MATLAB/Simulink R2024b environment using the Parameter Estimator toolbox and Levenberg–Marquardt algorithm to minimize the cost function of sum square error between simulated and reference data [28,29].
Initial values are taken from the literature or based on information from datasheets; for example, platinum is considered the most common material as a catalyst. Table 1 illustrates the impact of each parameter, offering a general sense of their relative scales.

2.1.3. Compressor Model

The only dynamic state in the model is the compressor speed, ω c p . The inputs to the model include inlet air pressure, p c p , i n , its temperature, T c p , i n , voltage command to compressor motor, v c m , and downstream pressure, which is the supply manifold pressure, p c p , o u t   =   p s m . The inlet air is typically atmospheric, and its pressure and temperature are assumed to be fixed at p a t m = 1   a t m and T a t m = 25   ° C , respectively. The motor command is one of the inputs to the fuel cell system. The downstream pressure is determined by the supply manifold model.
The compressor model was well designed [7,18] with a lumped rotational model to represent the dynamic behavior of the compressor:
J c p d ω c p d t = τ c m τ c p
where J c p is the combined inertia of the compressor and the motor, ω c p is the compressor speed, τ c m is the compressor motor torque input, τ c p is the torque required to drive the compressor. The compressor motor torque is calculated using a static motor equation:
τ c m = η c m k t R c m v c m k v ω c p
where k t , R c m and k v are motor constants and η c m is the motor mechanical efficiency.
A lookup table of the compressor efficiency, η c p , is used to find the efficiency of the compressor from the mass flow rate and pressure ratio across the compressor. The maximum efficiency of the compressor is 80%. The torque required to drive the compressor is calculated using the thermodynamic equation [32]:
τ c p = C p ω c p T a t m η c p p s m p a t m γ 1 γ 1 W c p
where τ c p is the torque needed to drive the compressor,   C p is the specific heat capacity of air = 1004 J/(kg·K), and γ is the ratio of the specific heats of air = 1.4.
A static compressor map is used to determine the air flow rate through the compressor, W c p by the Jensen and Kristensen nonlinear curve fitting method [32]. The compressor model used here is for an Allied Signal compressor [33].

2.1.4. Calibration of Compressor Model

Compressor power can be calculated by Equation (10). Notably, the pressure ratio in the model increases along with the air mass flow rate, making it infeasible to calibrate both the compressor power and the mass flow rate simultaneously.
To reflect variations in the inlet condition of the compressor, which are the inlet flow pressure and temperature, the “corrected” values of mass flow rate, W c r and compressor speed, N c r are used in the compressor map. Using the Jensen and Kristensen method, the mass flow rate is considered as a function of pressure ratio, p s m p a t m and motor speed, N c m , with a group of parameters, a i , b i , and c i , which are regression coefficients obtained by curve fitting of the compressor data [7], while the compressor data is calculated by the limited experimental data based on the following order:
  • Use the reference load I s t to obtain the nominal mass flow rate of the compressor W c p ;
  • Input W c p in the FC model to collect the corresponding pressure ratio;
  • Calculate compressor power P c p with W c p and pressure ratio, assuming P c p = P c m ;
  • Obtain the compressor motor parameters from a map incorporating P c m vs. N c m ;
  • Create a new compressor map with pressure ratio, N c m and W c p .
After having the new compressor data, a i , b i , and c i is obtained from the ‘Parameter Estimator’ in Simulink and listed in Table 2.
After updating the compressor model, the responses in terms of air flow rate and pressure were successfully corrected. However, a persistent deviation remained in the power consumption output, which could not be resolved due to the lack of more detailed system information. To address this issue, a correction function was applied between the actual power consumption and the reference power. This adjustment allowed the final output of the net fuel cell power to align with the expected values, ensuring consistency in system-level simulation results.
In the implemented fuel cell (FC) model, the control input is the current, whereas the energy management system (EMS) determines the power request as its output. To bridge this interface, the current input to the fuel cell at a given time step t , denoted as i F C t , is computed based on the power demand P r e q t and the fuel cell voltage v F C t 1 from the previous time step [34].
i F C t = P r e q t v F C t 1
This formulation is based on the assumption that the voltage variation of the fuel cell is relatively slow compared to the simulation time step, thereby justifying the use of the previous voltage value in the calculation.

2.2. Battery Pack

Various modeling approaches exist for battery packs, including electrochemical models [35,36], thermal–electrochemical-coupled models [37], and equivalent circuit models [38]. Electrochemical models, while offering high accuracy and detailed insight into internal reactions, typically require extensive parameter identification and computational resources, making them less practical in early-stage studies with limited data availability. In this work, an equivalent circuit model is adopted due to its balance between simplicity and effectiveness, which also enables rapid development and integration into the vehicle powertrain simulation, making it well suited for preliminary analysis and energy management strategy evaluation.
The battery pack consists of battery cells in parallel and in series, and the power of the battery pack is:
P b a t t , p a c k = P b a t t , c e l l · N p · N s
where the P b a t t , p a c k is the power of the battery pack and the P b a t t , c e l l is the power of a single battery cell. N p is the number of cells in parallel and N s is the number of cells in series. The battery current of a single cell is determined by an internal resistance model:
v b a t t , c e l l = v n o m i b a t t , c e l l · R i n t
P b a t t , c e l l = v b a t t , c e l l · i b a t t , c e l l
where the battery open circuit voltage v n o m and the internal resistance R i n t are static functions of the battery state of charge and temperature. The voltage and current of the battery pack is:
v b a t t , p a c k = v b a t t , c e l l · N s i b a t t , p a c k = i b a t t , c e l l · N p
where the v b a t t , p a c k and i b a t t , p a c k is the voltage and current of the battery pack, respectively. The SOC is based on Coulomb counting [39] and calculated from the battery current and the capacity of the battery, k b a t t and the battery charging efficiency, η b a t t :
S o C ˙ = k b a t t · i b a t t , p a c k   ,   i b a t t , p a c k 0 η b a t t · k b a t t · i b a t t , p a c k   ,   i b a t t , p a c k < 0  
The pack dis- and charging current limit are also from a lookup table, which is a function of SoC and Temperature. In this model, the temperature is constant, which equals to the ambient temperature of 25 °C. The calculation of the battery’s State of Charge (SoC) is determined by taking the initial SoC value S o C 0 and subtracting the cumulative energy consumption over time.
S o C t = S o C t 0 t 0 t S o C ˙ · d τ

2.3. Electric Drive

Electric motor modeling methods can generally be categorized into dynamic and static approaches. Dynamic modeling is based on electromagnetic principles, typically employing mathematical representations such as the d-q axis model to capture the motor’s transient behavior under various operating conditions [40,41]. In contrast, static modeling simplifies internal dynamics and commonly uses an efficiency map to describe the motor’s performance as a function of speed and torque [42,43]. This approach is well suited for system-level energy flow analysis and vehicle-level simulations. Each method involves a trade-off between computational complexity and modeling accuracy, and the choice depends on the specific application context.
From the efficiency map implemented in the model, η e m is a function of torque input and rotational speed. The overall efficiency is the product of the motor efficiency, η m o t o r , and the inverter efficiency, η i n v . The rotational speed of electric drive is calculated by:
ω e d = V R e · τ t r m
where V is vehicle longitudinal speed, R e is the wheel radius and τ t r m is the transmission ratio. And the torque input is calculated by:
T r q e q = P e q · ω e d
P e q = P D C P a u x
where ω e d is the rotational speed of electric, P e q is the equivalent power input, which equals the DC power input, P D C minus the power consumed by the auxiliary components, P a u x . Depending on the specific driving conditions, the electric drive performs as the generator or motor [43], and the torque output is:
T r q a c t = T r q e q · η e m   ,       T r q e q 0 T r q a c t = T r q e q / η e m   ,       T r q e q < 0
where T r q a c t is the actual torque output of the electric drive block to VDS for the calculation. η e m is the total efficiency, considering both the efficiency of motor and inverter.

2.4. Vehicle Dynamic System

Vehicle dynamic systems form the foundation for understanding and optimizing automotive performance, safety, and control. These systems describe how a vehicle responds to driver inputs and external forces in the longitudinal, lateral, and vertical directions. Accurate dynamic modeling enables the development of advanced control strategies for stability, ride comfort, and energy efficiency, especially important in modern applications such as electric vehicles and autonomous driving. From the classical single-track model to more complex multi-body simulations, vehicle dynamics encompasses suspension behavior, tire–road interaction, and drivetrain response.
Vehicle motion is opposed by several resistive forces that the powertrain must overcome, including aerodynamic drag, rolling resistance, grade force, and transmission losses. Considering a combination of aerodynamic drag and rolling resistance, the longitudinal resistive force is a quadratic function of velocity [27]:
F x r = A + B · V +   C · V 2
where the coefficients A , B , and C are determined experimentally by fitting the data to reflect real-world conditions. This quadratic relationship highlights how resistance components scale with speed, significantly impacting vehicle dynamics and energy consumption. The grade force is the component of the resistance to motion of a vehicle that depends directly on the slope of the road, where α is the road slope:
R g r a d = m g sin   α
To correctly calculate the acceleration of the vehicle, the inertial contribution of the rotating mass also needs to be considered. Using the energy method, an expression for the “equivalent mass” can be written based on the relationship between rotational speed and vehicle speed [21]:
m e = m + J w R e 2 + J t R e 2 τ f 2 + J m R e 2 τ f 2 τ g 2
where J w , J t and J m are the moments of inertia of wheel, transmission and motor, respectively. R e is the effective wheel radius and τ f and τ g are the final and gearbox transmission ratios.
The net torque passes through the drivetrain and is converted into linear force by dividing it by the wheel radius. This force governs the vehicle’s acceleration, calculated by dividing the force by the vehicle’s equivalent mass. This relationship is expressed as:
a v = F r e m m e = T r q r e m m e · r w
where F r e m and T r q r e m , are the remaining force and torque applied on the wheel, the r w is the radius of wheels, m e is the equivalent mass of the vehicle.
The input torque to the tire system is determined by a torque saturator, combining motor torque (scaled by the transmission ratio) and friction braking torque [44,45]. A torque limit ensures safe operation within physical and tire–road interaction constraints. Considering a rear-wheel-drive configuration, the torque limit under specific acceleration and slope conditions is [46]:
T r q l i m = ( a v · h C G · M / b + M g · a / l · cos   α ) · μ x · r w
where h C G is the height of the center of gravity, M is the vehicle mass, a , b and l represent wheelbase parameters, g is gravitational acceleration, α is the road slope angle, μ x is the road-tire friction coefficient, and r w is the wheel radius.

2.5. Longitudinal Vehicle Controller

Various types of longitudinal controllers have been proposed to regulate vehicle speed and ensure safe following distances, which include Model Predictive Control [47,48], fuzzy logic-based controllers [49], and adaptive cruise control systems using PID or hybrid approaches [50]. Since this study does not focus on the development of longitudinal control strategies, a simple and effective Proportional–Integral (PI) controller is employed to manage vehicle speed.
In powertrain simulations, the longitudinal vehicle controller acts as a virtual driver, controlling speed and acceleration to match a target cycle like WLTP. It compares the reference and actual speeds to compute the required acceleration or deceleration, which is then converted into a torque demand by the motor torque reference generator. An anti-saturation PI controller ensures stable control, with the output acceleration signal defined as [51]:
c m d t =   V r e f t · K f f v n o m + e v t · K p v n o m + 0 t e v τ · K i v n o m + e c m d τ · K a w · d τ + α t · K g
where V r e f is the reference vehicle speed, c m d is the controller command, of which the subscripts accel, decel stand for acceleration and deceleration. α is the road grade. e v is the error of vehicle speed and e c m d is the error of controller command. K f f is the coefficient of forward velocity, K p is the coefficient of proportional gain, K i is the coefficient of integral gain, K a w is the coefficient of anti-windup and K g is the coefficient of feedforward grade angle.
During light braking, the motor handles deceleration to recover energy. For rapid deceleration, mechanical brakes assist by adding torque. To enhance efficiency and reduce brake wear, the control strategy favors motor braking whenever possible.
The motor torque reference value T r q r e f is obtained by the saturator. It is calculated by the acceleration or deceleration command,
T r q r e f = c m d a c c e l · T r q p e a k + c m d d e c e l · T r q c o n s t · R l i m
where T r q p e a k is the maximum output torque for acceleration and T r q c o n s t is the continuous output torque for deceleration. The regeneration coefficient limit factor R l i m used in the case studied in the next chapter is 0.5.

2.6. Energy Management Strategy

EMS strategies can be classified into rule-based, optimization-based, and learning-based methods. Rule-based approaches rely on heuristic if-then rules derived from engineering intuition and are easy to implement but often suboptimal [52]. Optimization-based methods [53] aim to minimize a cost function over a prediction horizon. More recently, learning-based strategies, such as reinforcement learning [54], have emerged, enabling real-time adaptive control under uncertain conditions. Each method involves trade-offs among computational complexity, adaptability, and optimality. In this study, to focus on model validation, a rule-based approach, Baseline A, is adopted for its simplicity and practicality.
Baseline A is designed around two critical metrics: the State of Charge (SoC) and the H2 Inventory (SoH2). This framework categorizes the vehicle’s power demands into three distinct operational modes, each tailored to optimize the use of energy sources while ensuring efficient performance under varying conditions:
  • Battery Depleting Mode: To prevent overcharging in a battery system, when the SoC level is higher than 85%, the system relies primarily on the battery to meet power demands. This strategy aims to prevent overcharging the battery:
When P r e q < P b a t t , m a x
P b a t t = P r e q P f c = 0
When P r e q   >   P b a t t , m a x
P b a t t = P b a t t , m a x P f c = P r e q P b a t t , m a x
where P b a t t is the power split of battery system and P f c is the power split of fuel cell system. P b a t t , m a x is the maximum power possibly delivered by the battery system.
  • Battery Sustaining Mode: When the SoC falls below 80%, without risking overcharge, Baseline A enters battery sustaining mode. The 80–85% window is implemented to avoid oscillations during mode transitions. In this phase, the fuel cell output is adjusted in real time to meet power demands, while additional energy is used to recharge the battery, maintaining SoC and improving overall efficiency.
E D C t 1 = 0 t 1 P D C τ · d τ E f c t 1 = 0 t 1 P f c τ · d τ
P f c t = K p · E D C t 1 E f c t 1 + K i · 0 t E D C τ 1 E f c τ 1 · d τ P b a t t t = P r e q t P f c t
where E D C is the energy consumed by the DC power system, and E f c is the energy generated by the fuel cell block.
  • Pure Electric Mode: As hydrogen depletes, the fuel cell shuts down and the vehicle enters pure electric mode, relying solely on the battery for propulsion.
P b a t t = P r e q P f c = 0
This transition is key to maintaining vehicle operation as hydrogen depletes, enhancing flexibility and reliability. Baseline A structures the energy management process to optimize efficiency and performance, enabling intelligent adaptation to varying conditions and improving sustainability in fuel cell electric vehicles.

3. Simulation Results

This chapter presents the results of two simulation stages. First, the performance of the calibrated fuel cell model is shown, demonstrating a high level of agreement with the reference experimental data. Second, the behavior of the complete powertrain model, equipped with a simple energy management algorithm, is illustrated over a WLTC driving cycle. The purpose here is not to evaluate the effectiveness of the energy management strategy, but rather to show that the model can reasonably represent the behavior of each subsystem.

3.1. Calibration Results

In the simulation, the reference data comes from an 80-kW FC that comprises 440 individual cells, each with an active area of 270 cm2. This reference data has been obtained through empirical testing of a fuel cell
There are two polarization curves in Figure 1, the blue curve represents the data obtained from the reference values and the red curve corresponds to the results from the calibrated model, between which it demonstrates a strong agreement. Quantitatively, the model demonstrates a high level of accuracy with an R2 value of 0.99. Additionally, the Relative Root Squared Mean Error (RRSME), which is normalized by the actual data values to ensure it is dimensionless and scale-independent, is calculated to be 0.013.
R R S M E = 1 n i = 1 n y i y i ^ 2 / 1 n i = 1 n y i 2
where y i is actual value, y i ^ is predicted value and n is the number of data points. The closer the RRSME value is to zero, the better the prediction is.
Slight overestimation at low current densities is likely due to the limited accuracy of the Tafel model in this region. At high current densities, the model exhibits a notable decline, primarily resulting from the sharp increase in concentration losses beyond 1 A/cm2. The concentration loss model is difficult to calibrate due to its dependence on product-specific empirical formulas and parameters, which are often unknown.
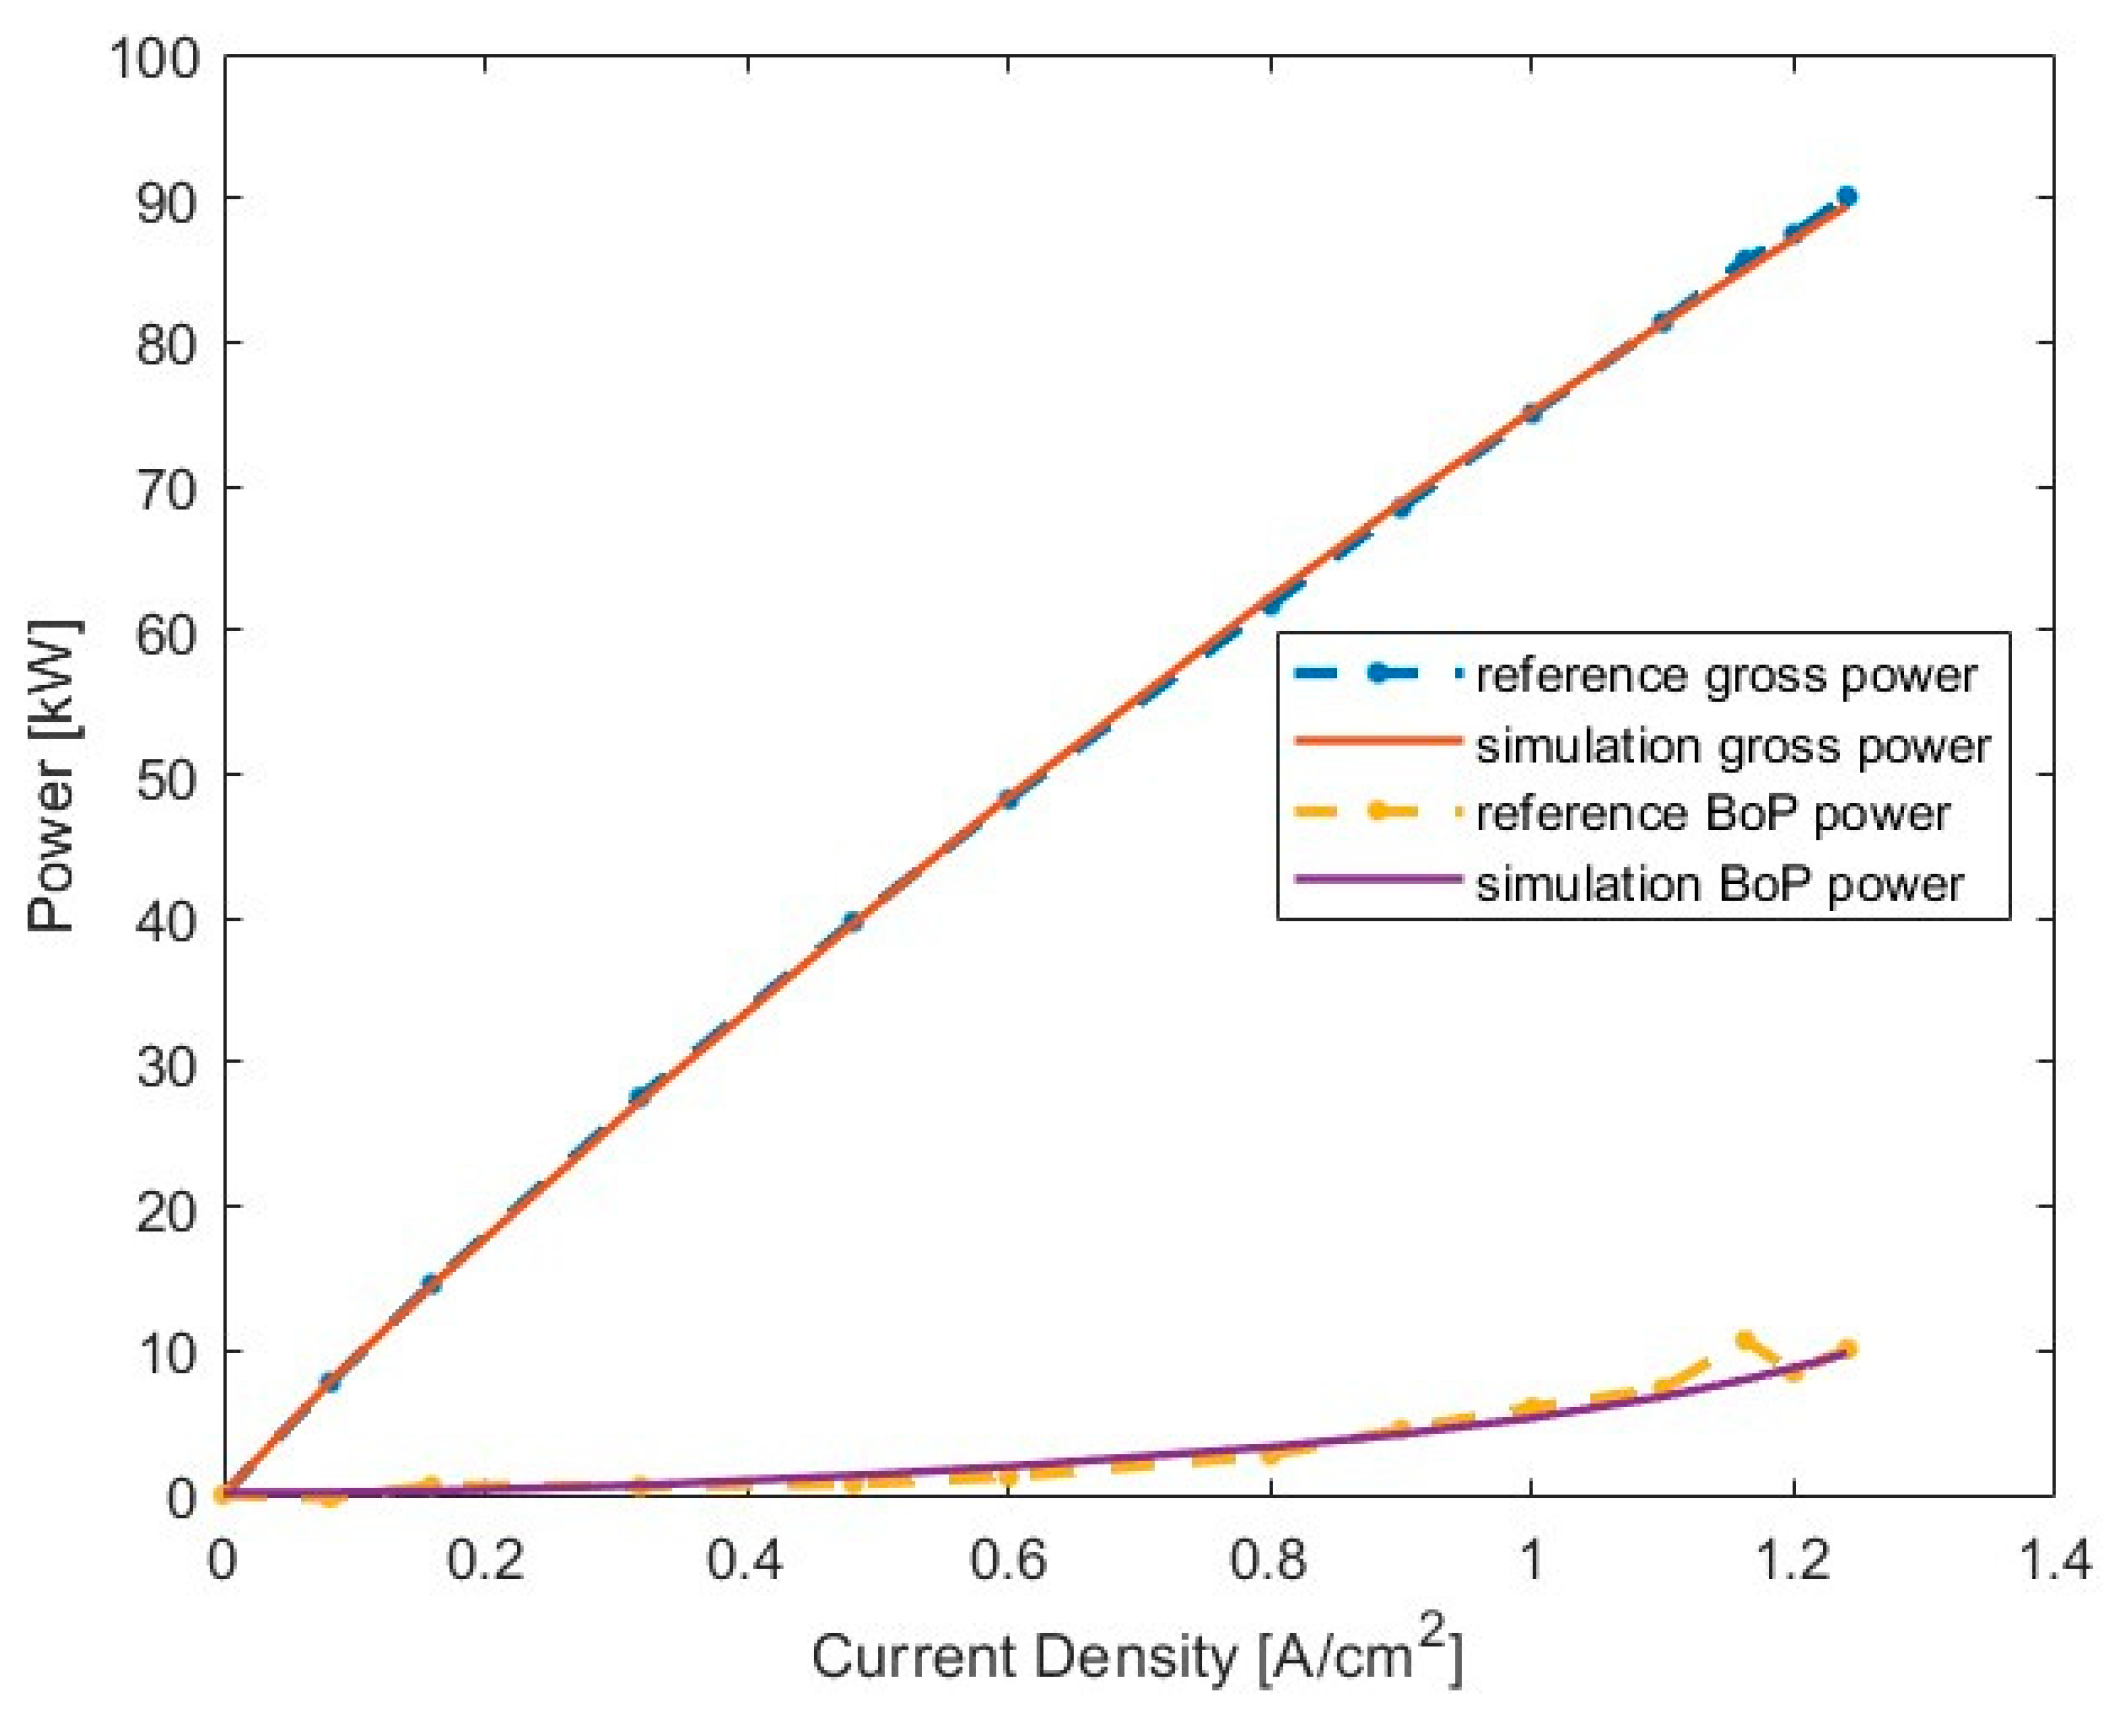
Minor differences are present in the polarization curves but are barely visible in Figure 2, and the power–current calibration remains accurate at all current densities, which is critical for power-based drive cycle simulations.
However, Figure 2 also compares the auxiliary power output, showing that the reference data exhibits instabilities above 1 A/cm2, likely due to real-world factors such as temperature variations and flow rate changes, highlighting the challenges of simulating high current density behavior.
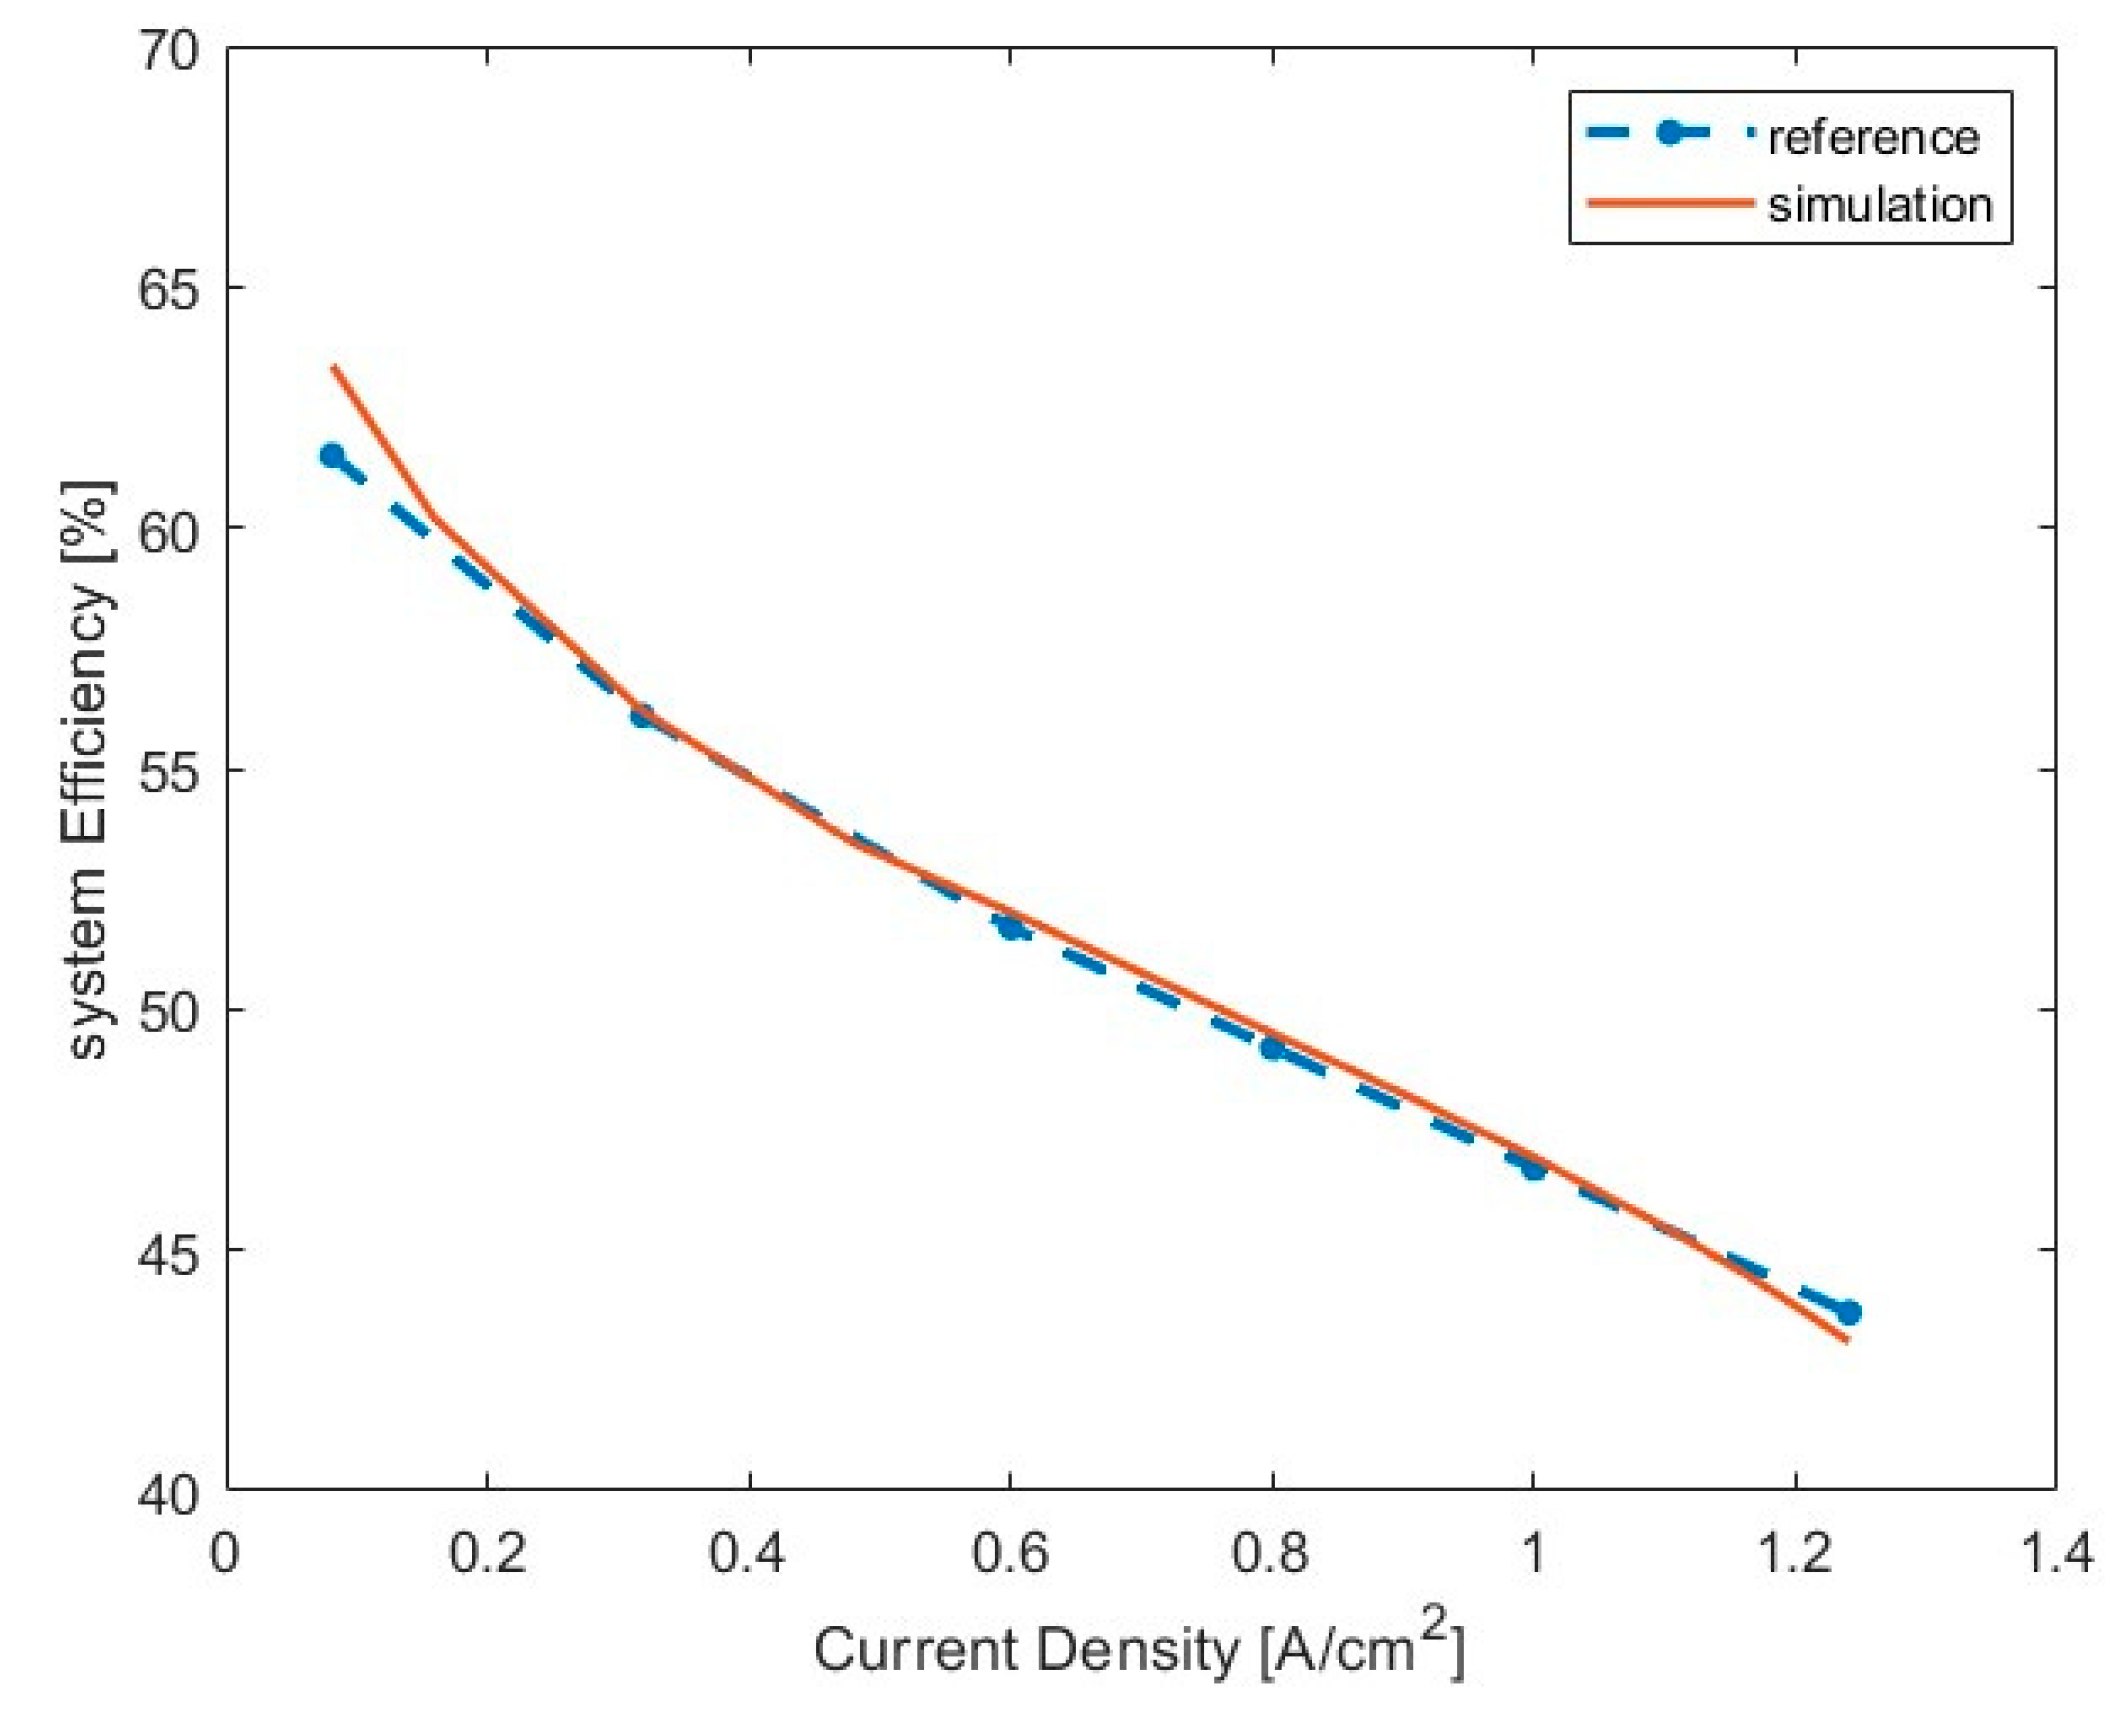
The comparison between the reference data and the actual model efficiency shown in Figure 3 is primarily used to evaluate the correlation and trends between the two sets of data. Quantitatively, the RRSME is 0.012 and the R2 is 0.989. Due to the inherent instability in fuel cell operation, if only the main operating range between 10 kW and 70 kW is considered, it brings a better consistency. This analysis is critical to verifying the performance of the model and ensuring that it accurately reflects the operating characteristics of the fuel cell system.

3.2. Drive Cycle Simulation

In the simulation, the WLTC was chosen due to its widespread acceptance across the automotive industry and its alignment with regulatory standards. Among the drive cycle tests, different initial SoC are chosen, while the initial SoH2 remains the same, as it does not affect the fuel cell performance.

3.2.1. Battery Depleting Mode

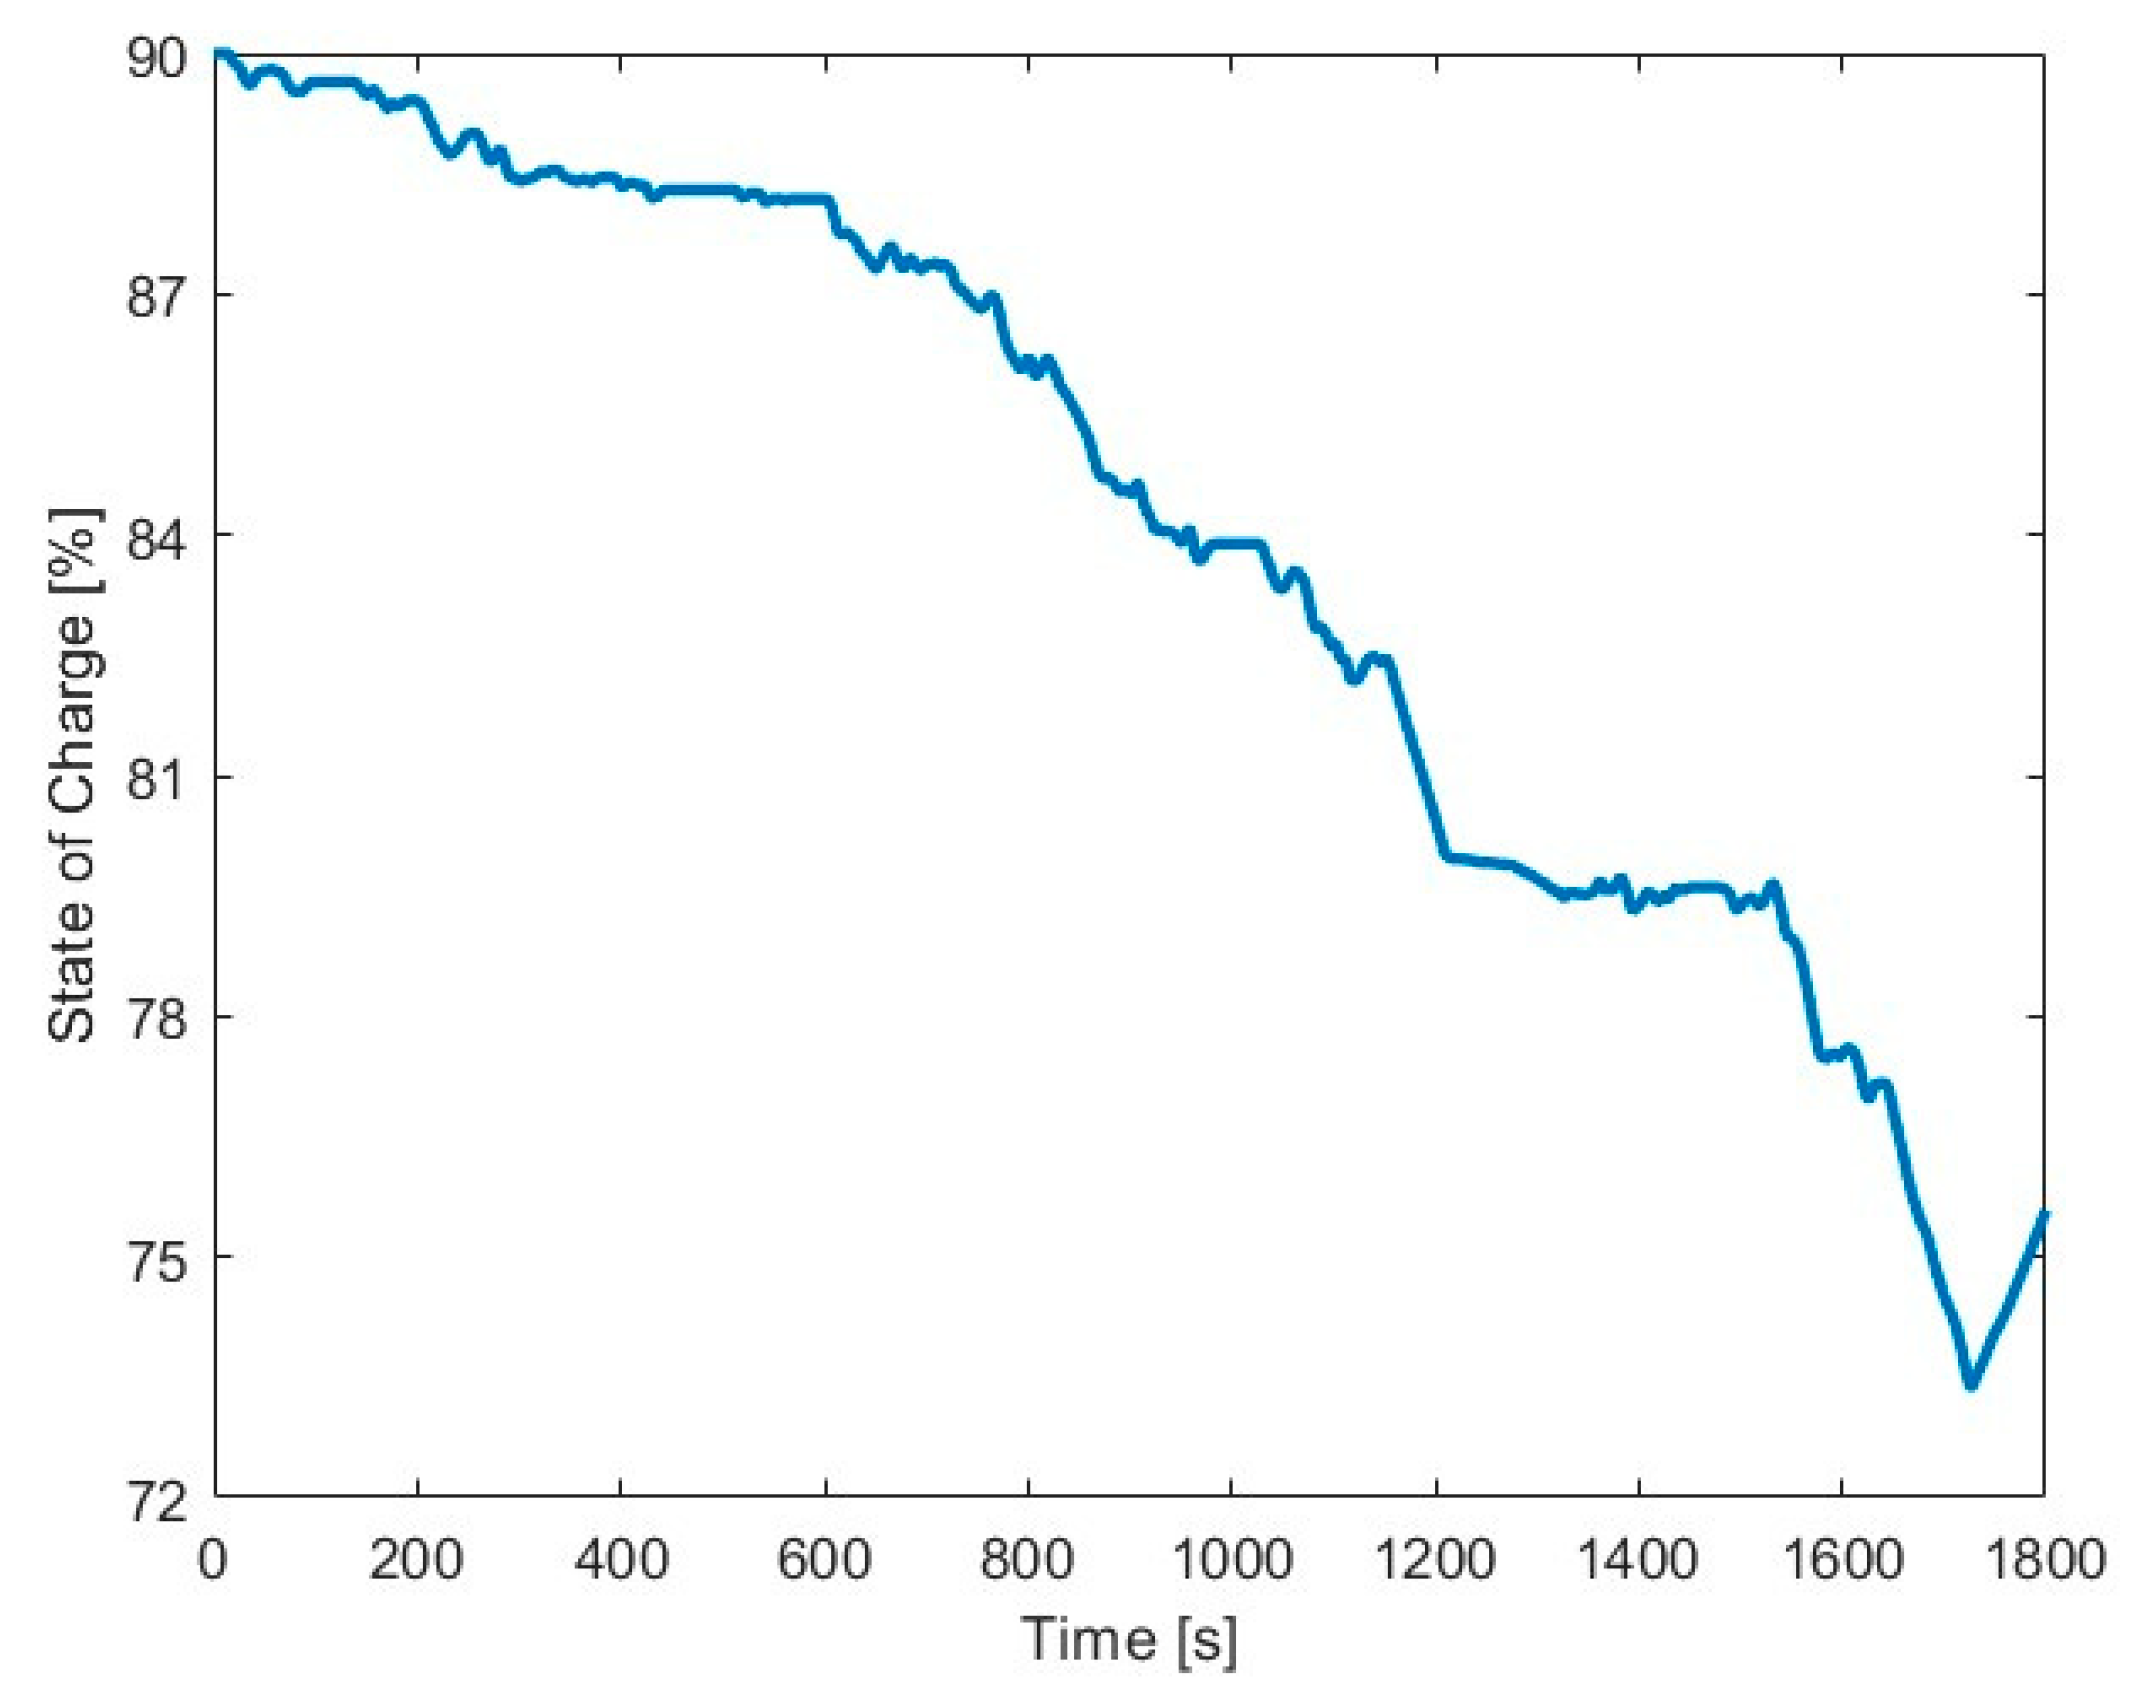
As it is possible to see in Figure 4, the SoC decreases from 0.9 to approximately 0.75 over the test cycle, indicating the main operation in battery-depleting mode. During the initial phase, mild driving conditions allow the battery to meet power demand alone, keeping the fuel cell inactive and the H2 tank level constant. However, when the SoC is less than 0.8, EMS switches from depleting mode to sustaining mode, which will be discussed in the next chapter.
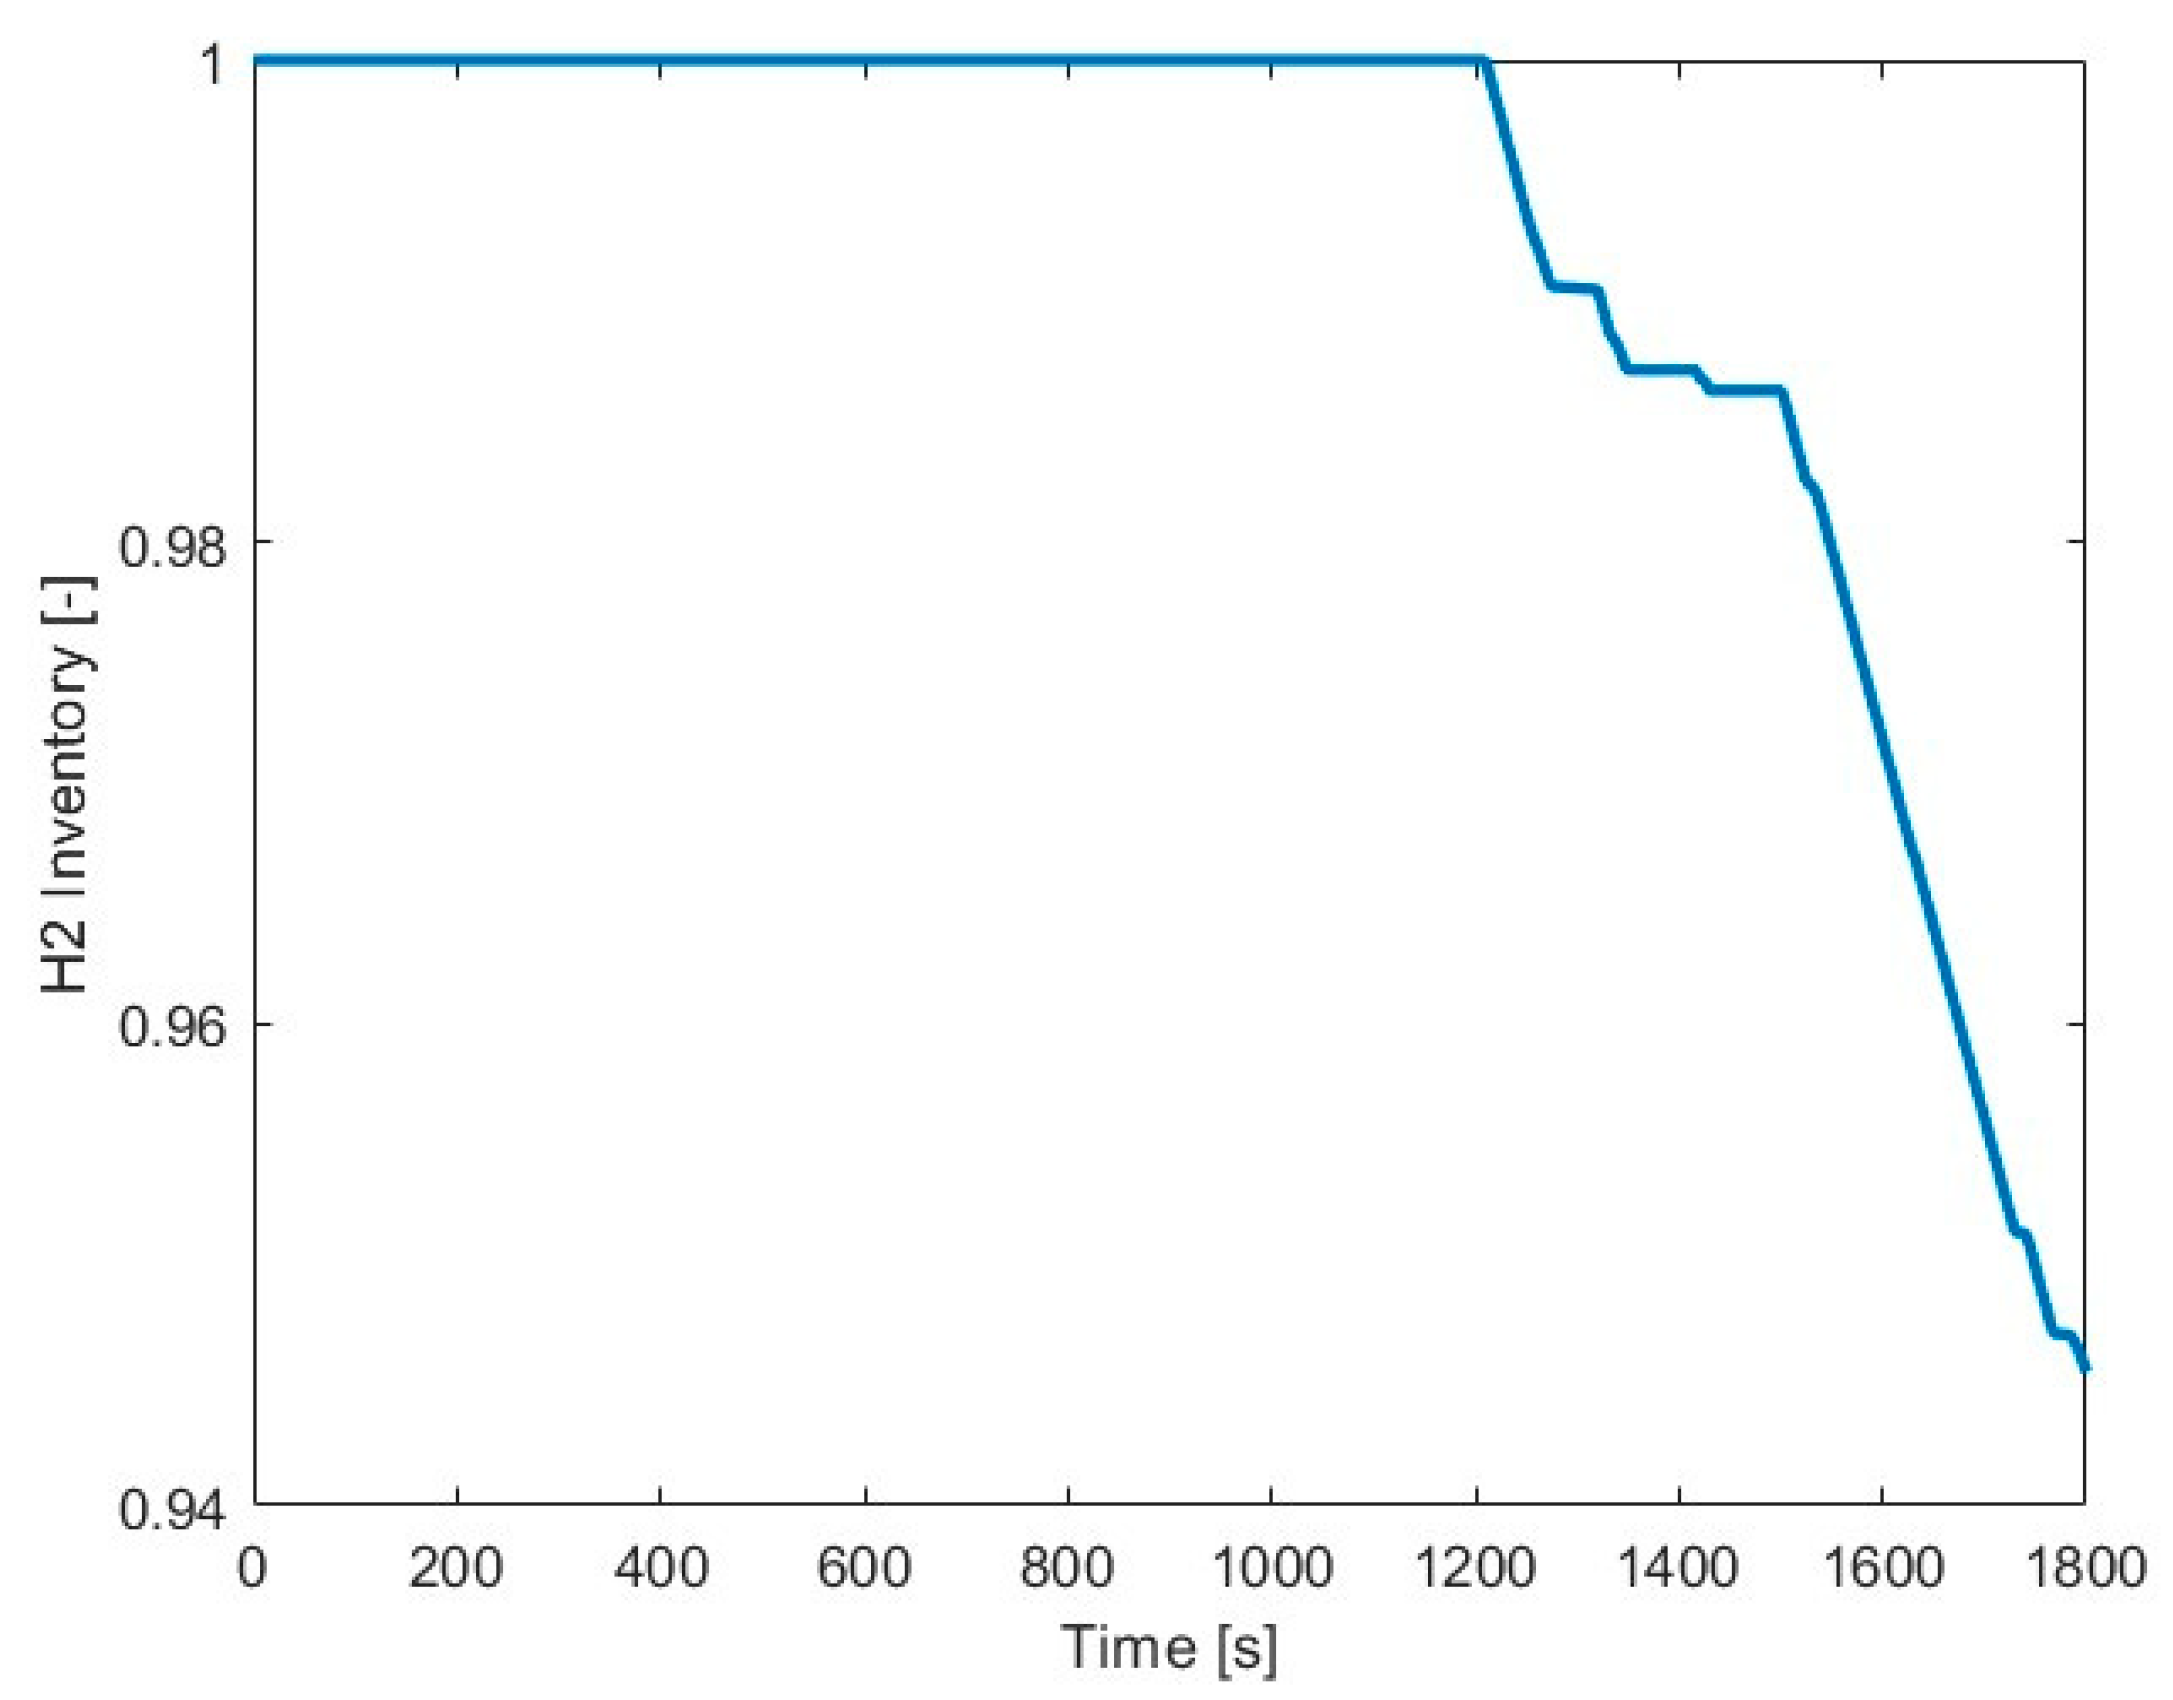
Figure 5 demonstrates that the battery pack is sufficiently capable of meeting the power demand throughout the entire driving cycle, and the fuel cell system remains deactivated when the EMS operates in battery-depleting mode. The H2 inventory is a number from 0 to 1 indicating the fraction of remaining hydrogen in the tank.
The diagram in Figure 6 compares the reference speed with the actual vehicle speed to evaluate its ability to respond to varying driving conditions. It is observed that during the battery depleting mode, the actual vehicle speed closely aligns with reference speed. This behavior highlights the battery’s capability to effectively meet dynamic power demands. The high responsiveness of the battery ensures that the vehicle maintains the desired performance without significant deviations from reference speed.

3.2.2. Battery Sustaining Model

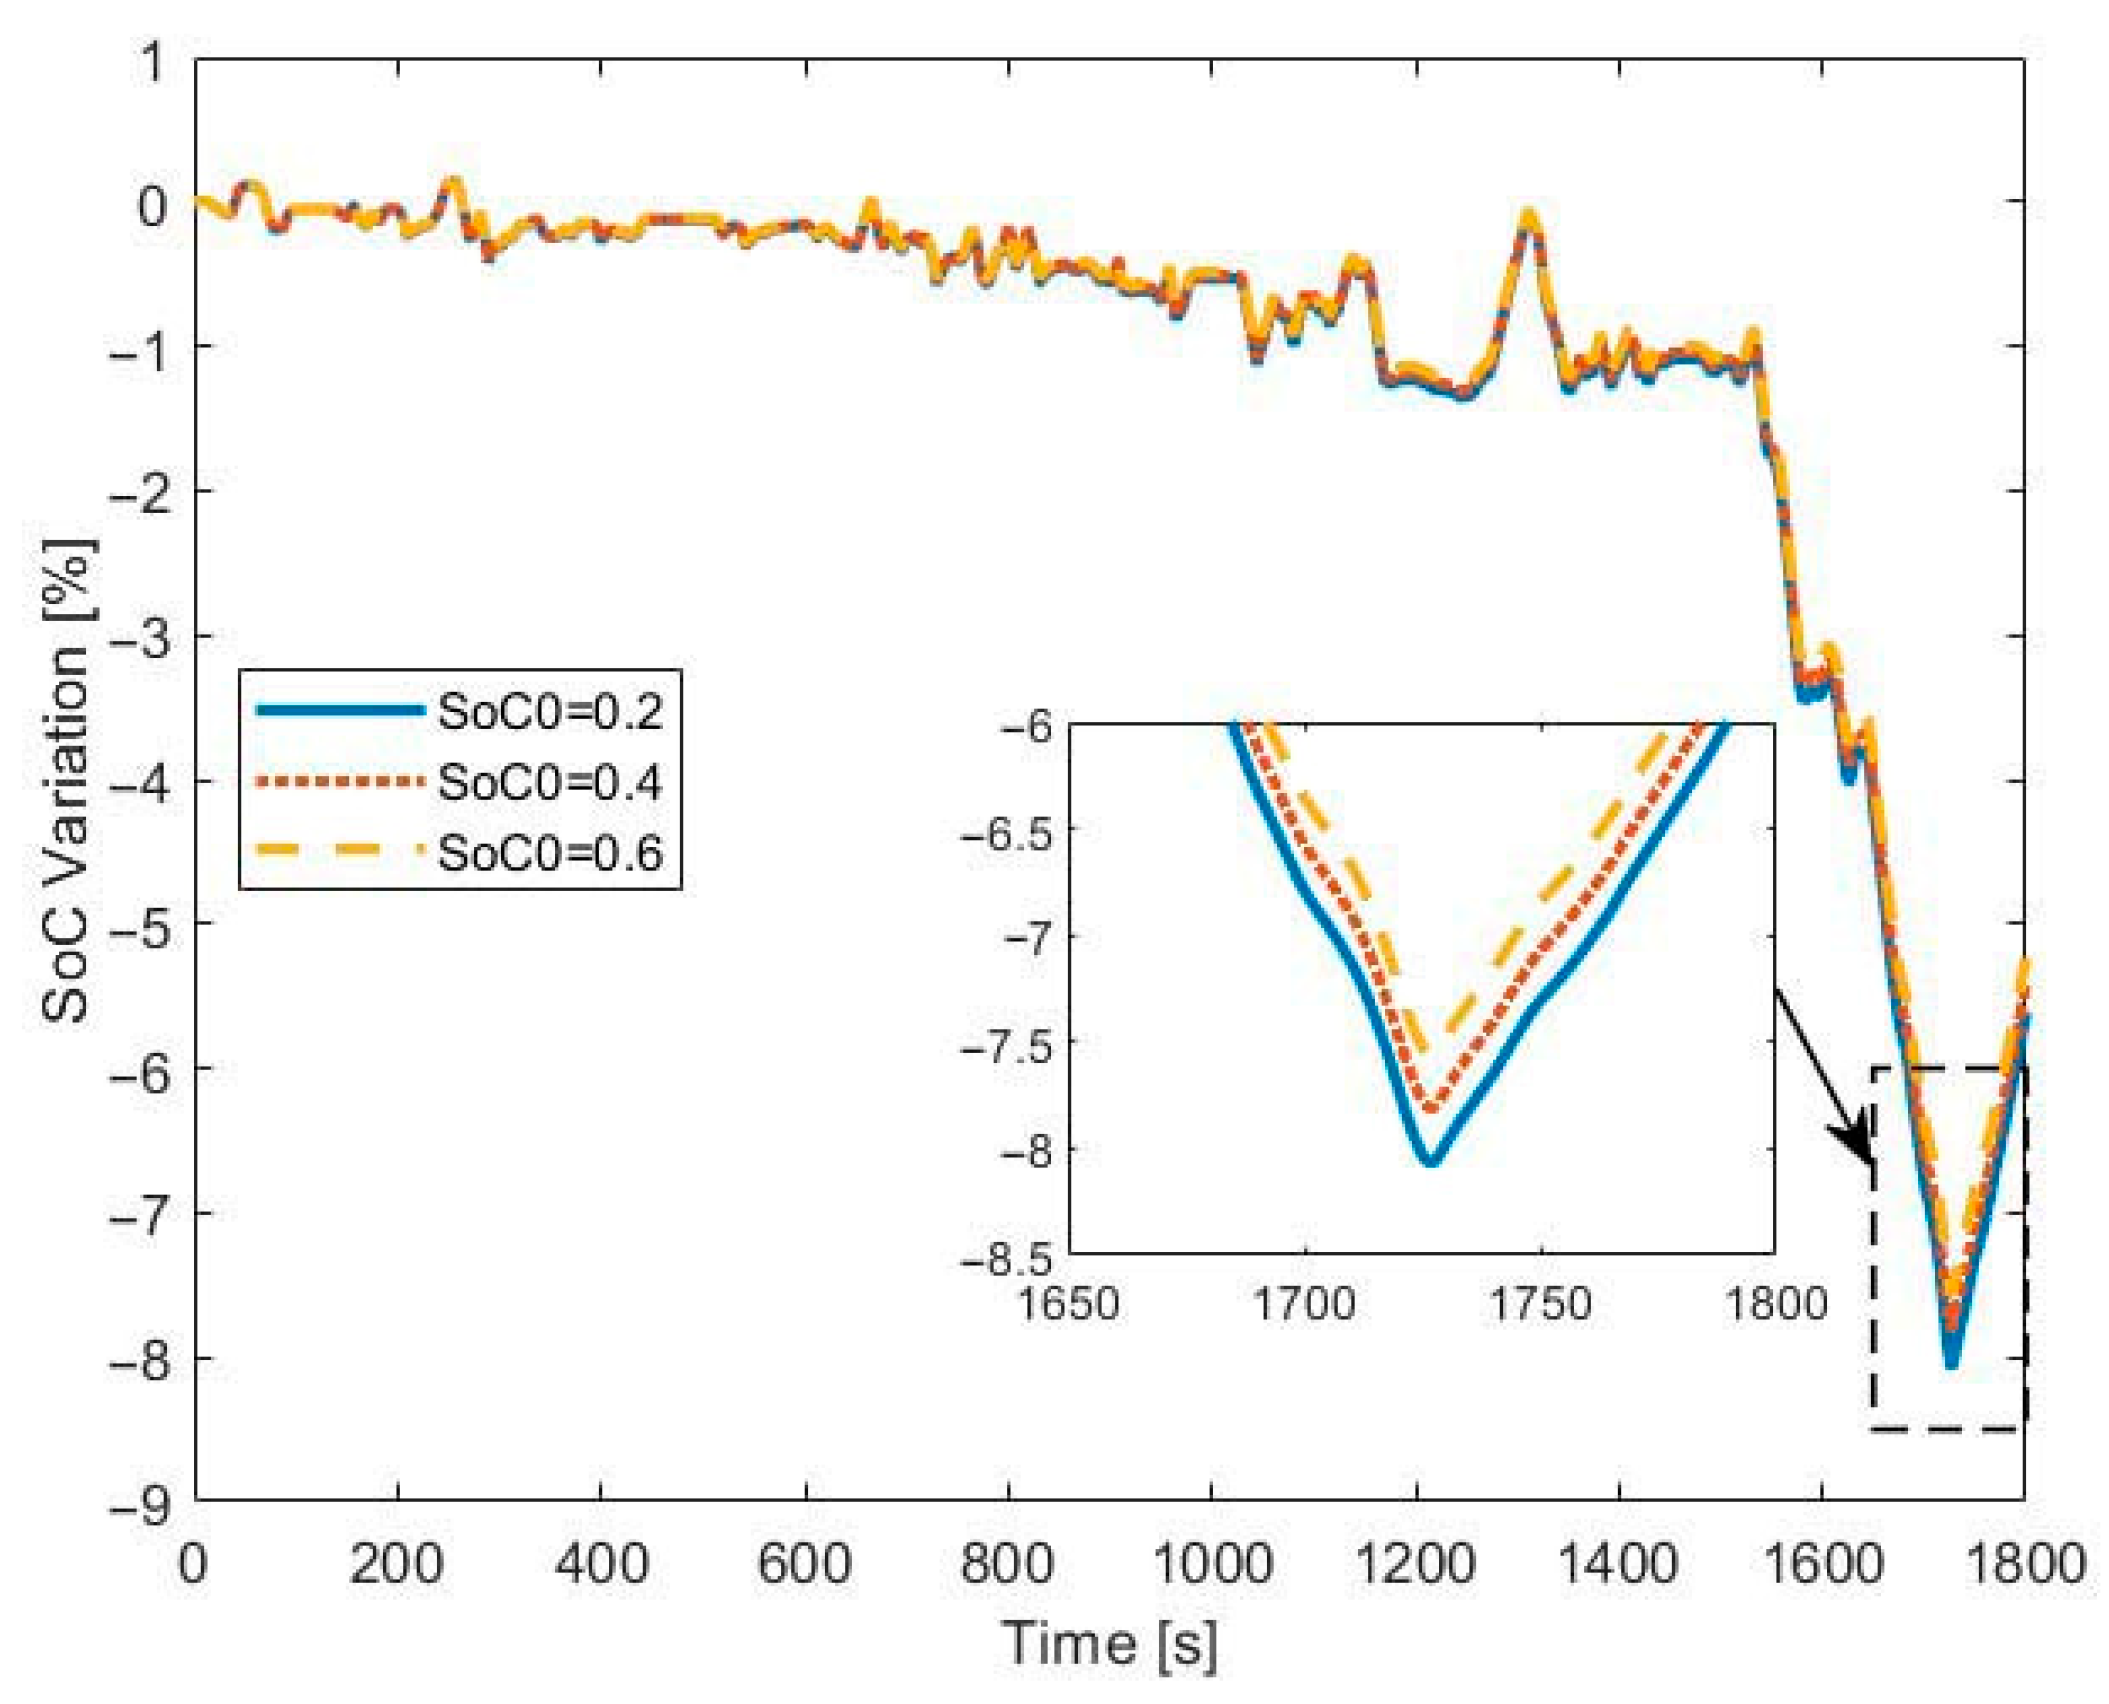
Figure 7 illustrates the variation in SoC during a WLTP cycle for three different initial SoC values: 0.6, 0.4, and 0.2. To facilitate a direct comparison, Figure 7 presents the change in SoC rather than the absolute SoC values, allowing for a clearer evaluation of how battery depletion evolves from different starting points. The results indicate that the EMS, when operating in battery-sustaining mode, aims to keep the SoC relatively stable over the course of the driving cycle.
Although this stabilizing behavior is less obvious when the battery operates at low power outputs, a more evident trend emerges during high power demands, which confirms that the simulation model effectively captures the relationship between battery energy levels and performance. As the initial SoC decreases, the battery experiences a drop in nominal voltage, leading to reduced efficiency and increased depletion rates [55].
As the power demand increases, particularly during periods of high-power requirements, the SoC begins to exhibit a noticeable decline. This drop indicates a greater reliance on the battery to meet the immediate surge in power needs. The temporary reduction in SoC during these moments underscores the battery’s role as the primary energy source when rapid power delivery is required, while the increase in the SoC at the end shows the ability of FC to recharge the battery pack.
Meanwhile, Figure 8 suggests a continuous consumption of hydrogen throughout the cycle, indicating that the fuel cell remains consistently engaged. The strong overlapping in the curves shows that hydrogen consumption remains the same value under different initial SoCs with this EMS. In this mode, the fuel cell serves as the primary power source, while the SoC is maintained at a relatively high level. As the SoC decreases, the battery’s nominal voltage slightly drops, though this effect is not obvious; keeping the battery at a higher SoC helps optimize its performance and contributes to the overall efficiency of the powertrain.
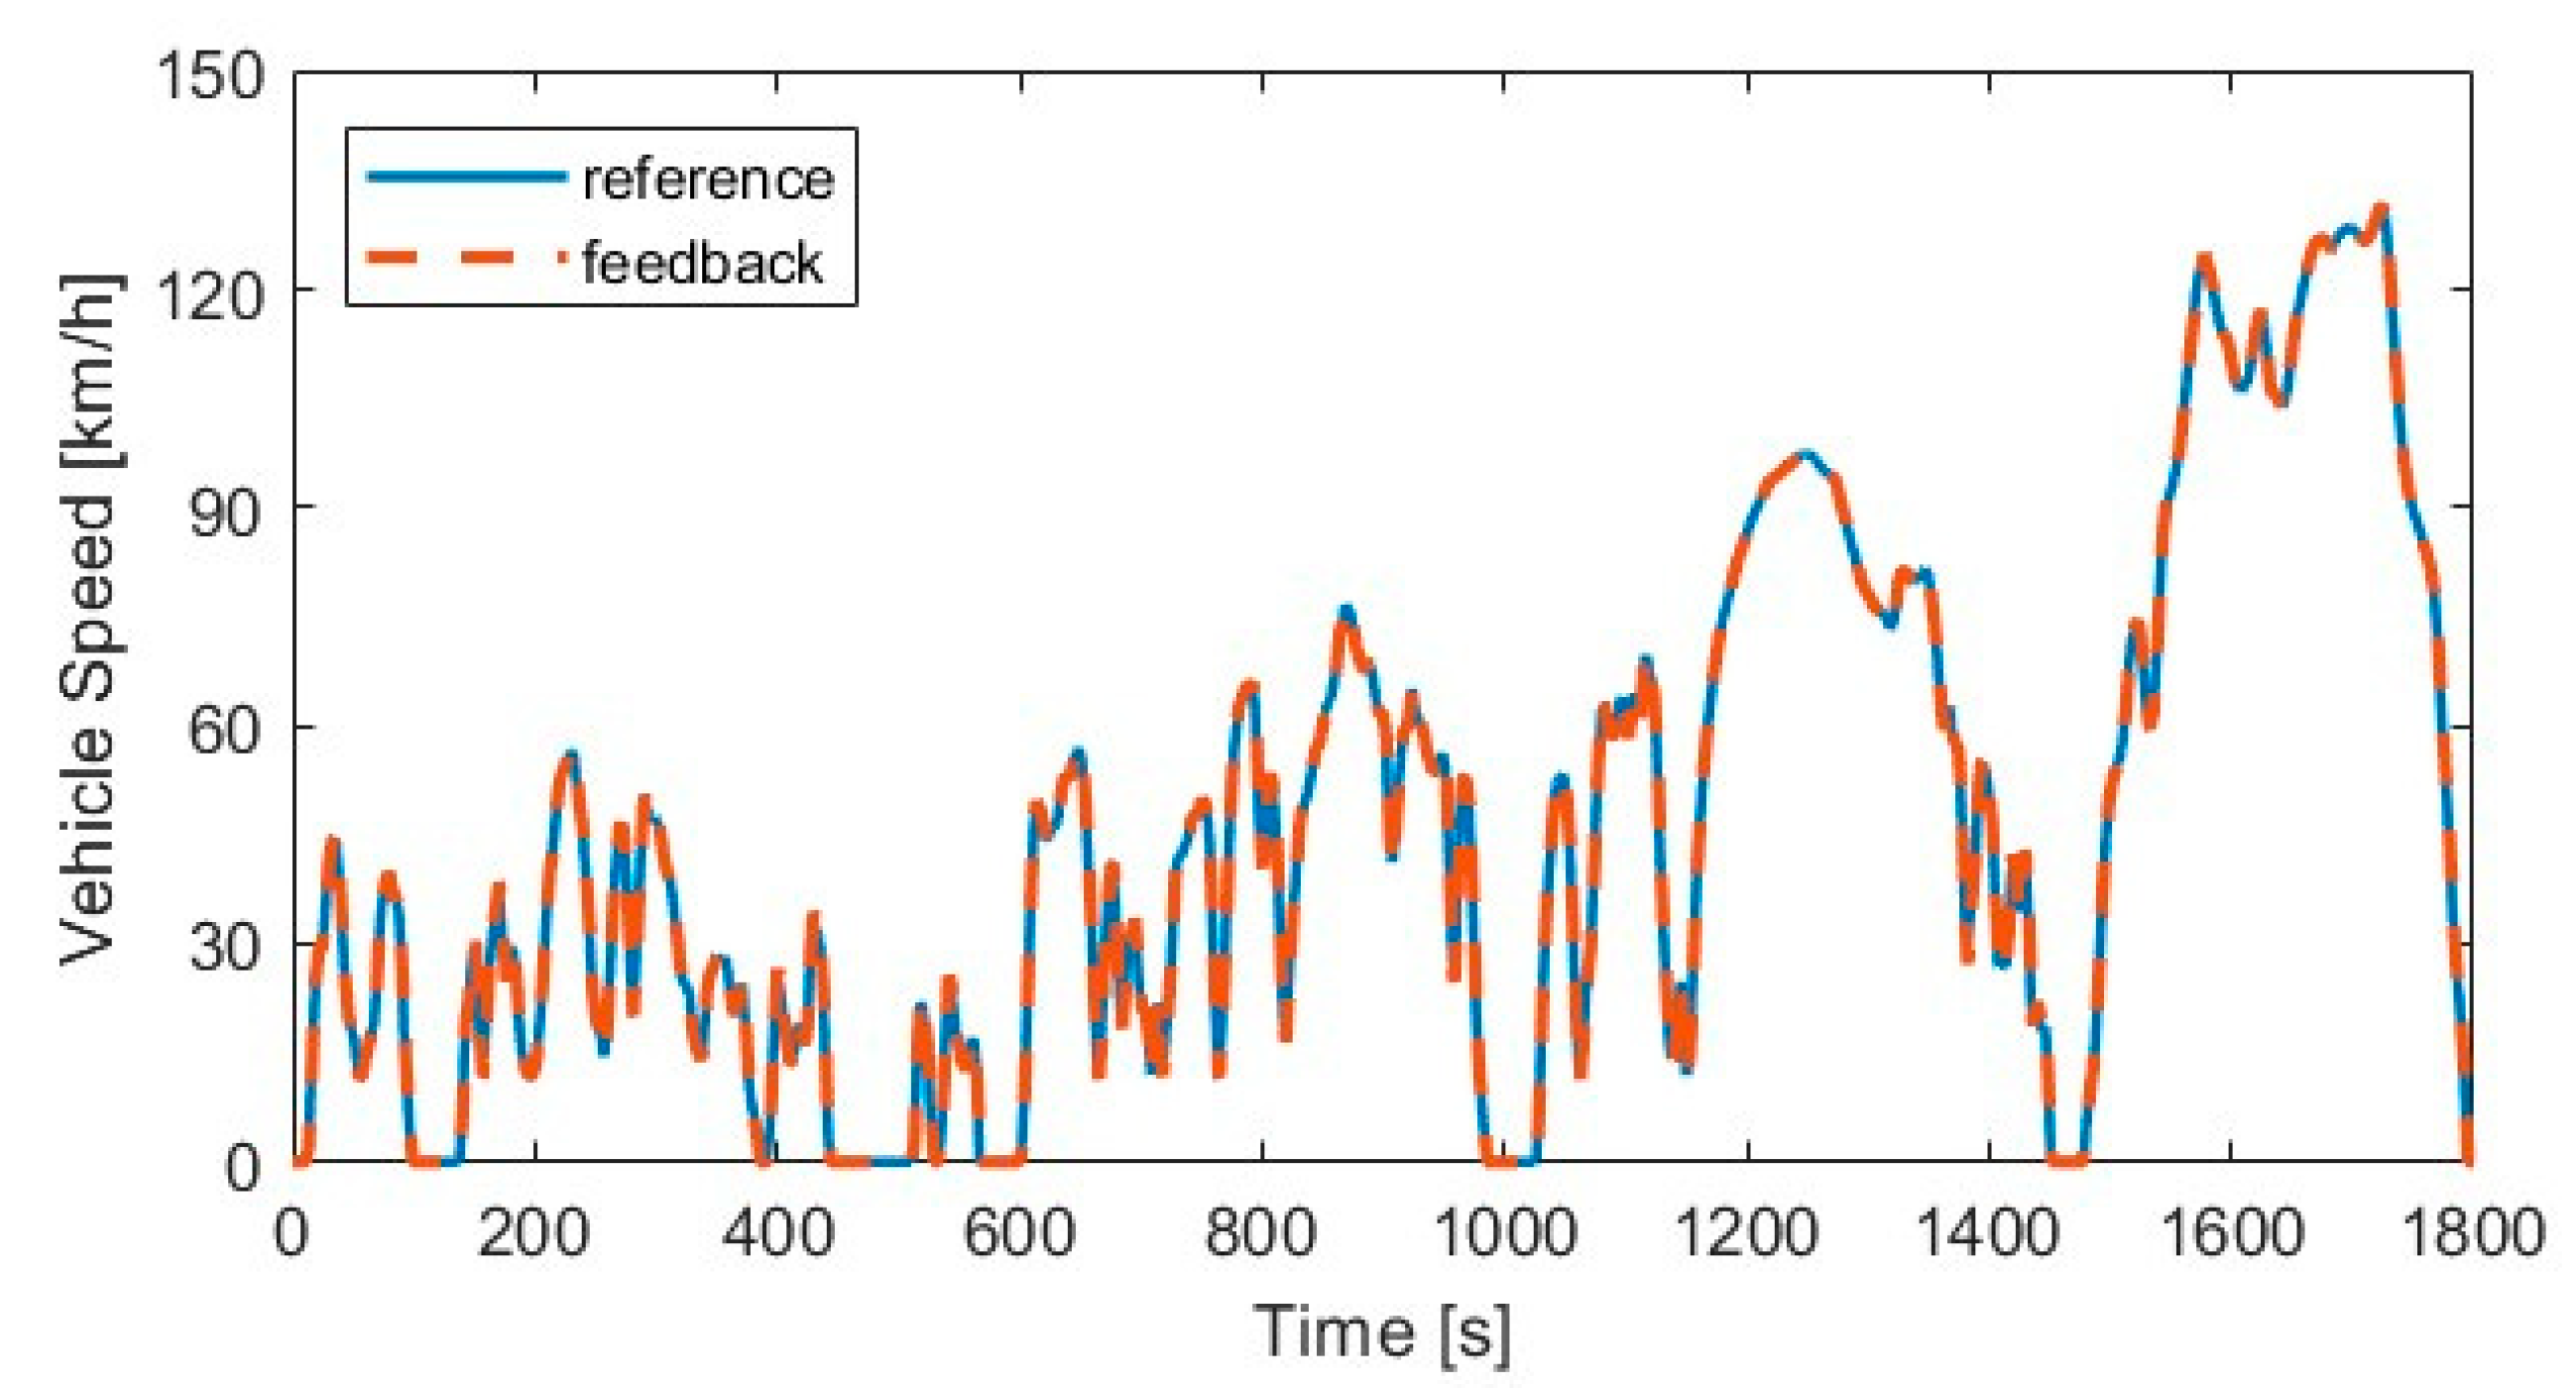
Figure 9 shows a perfect consistency between reference speed and the feedback speed. According to the reference data, the battery pack has a large capacity and wide power output range, making it a highly responsive energy source capable of meeting a wide range of power demands. This characteristic provides significant flexibility for the energy management algorithm, allowing future strategies to focus more on optimizing the fuel cell’s operating range, thereby enhancing the overall system efficiency.

3.2.3. Repetitive Drive Cycles

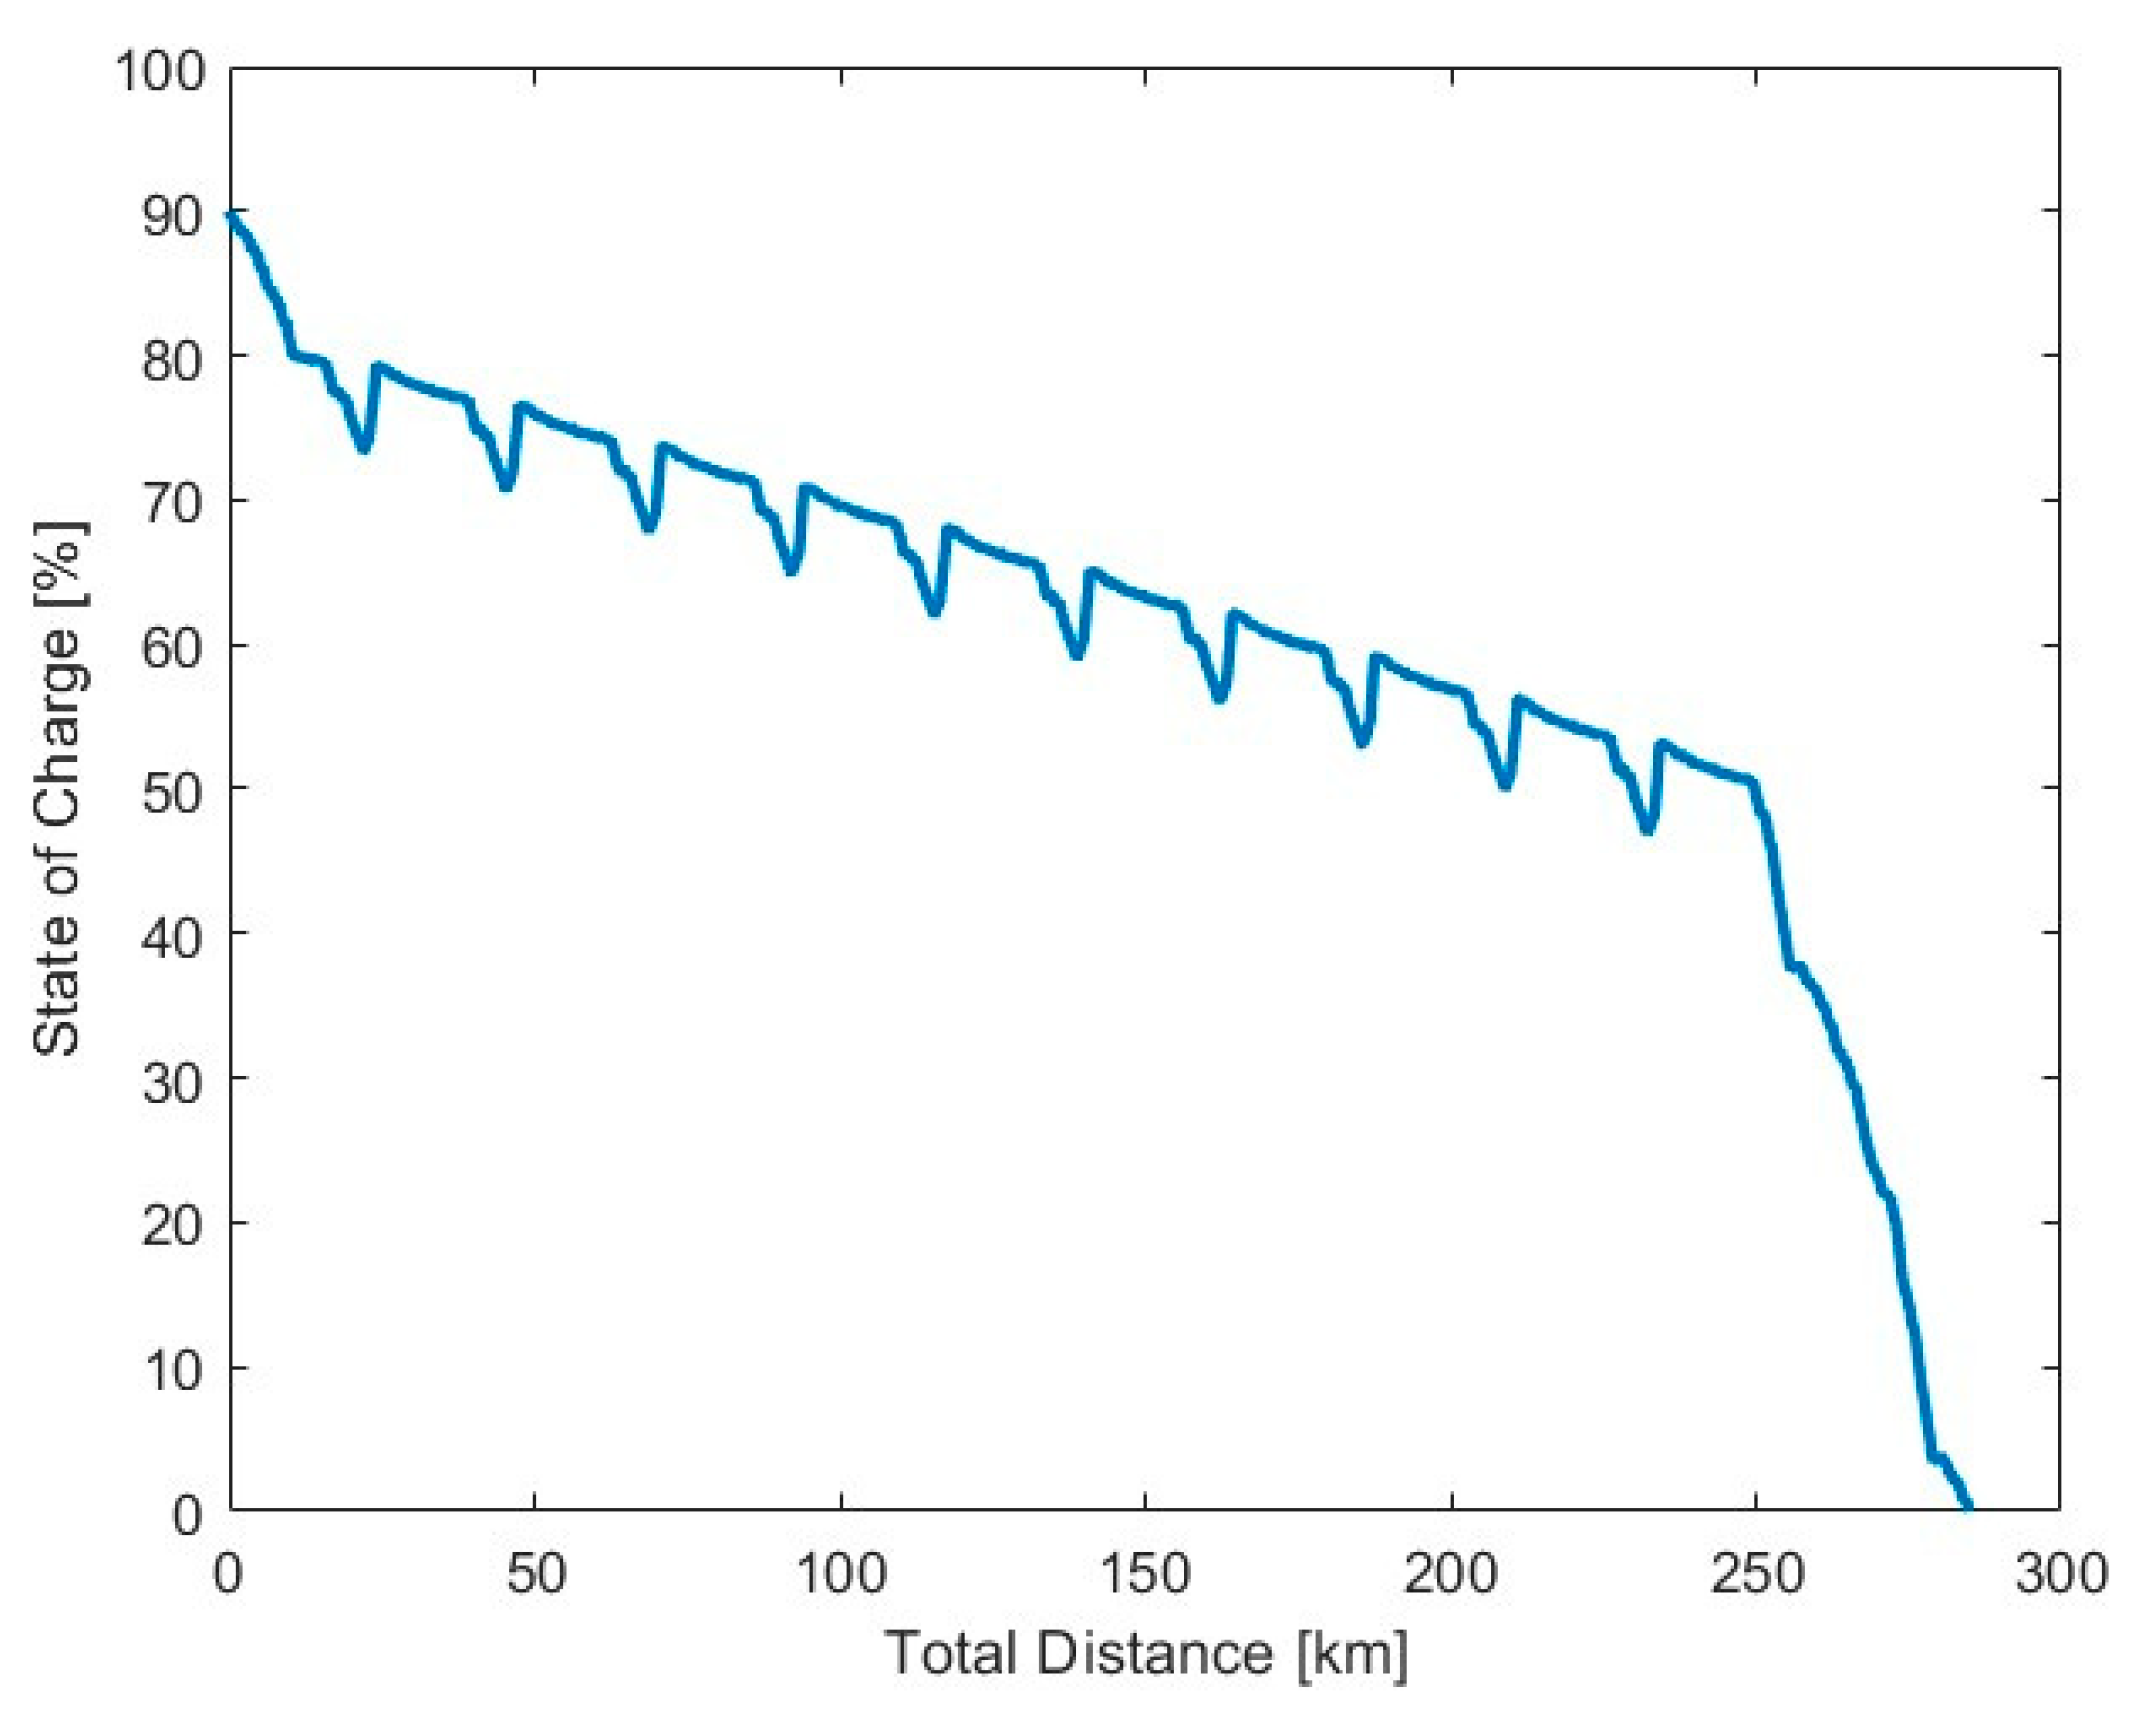
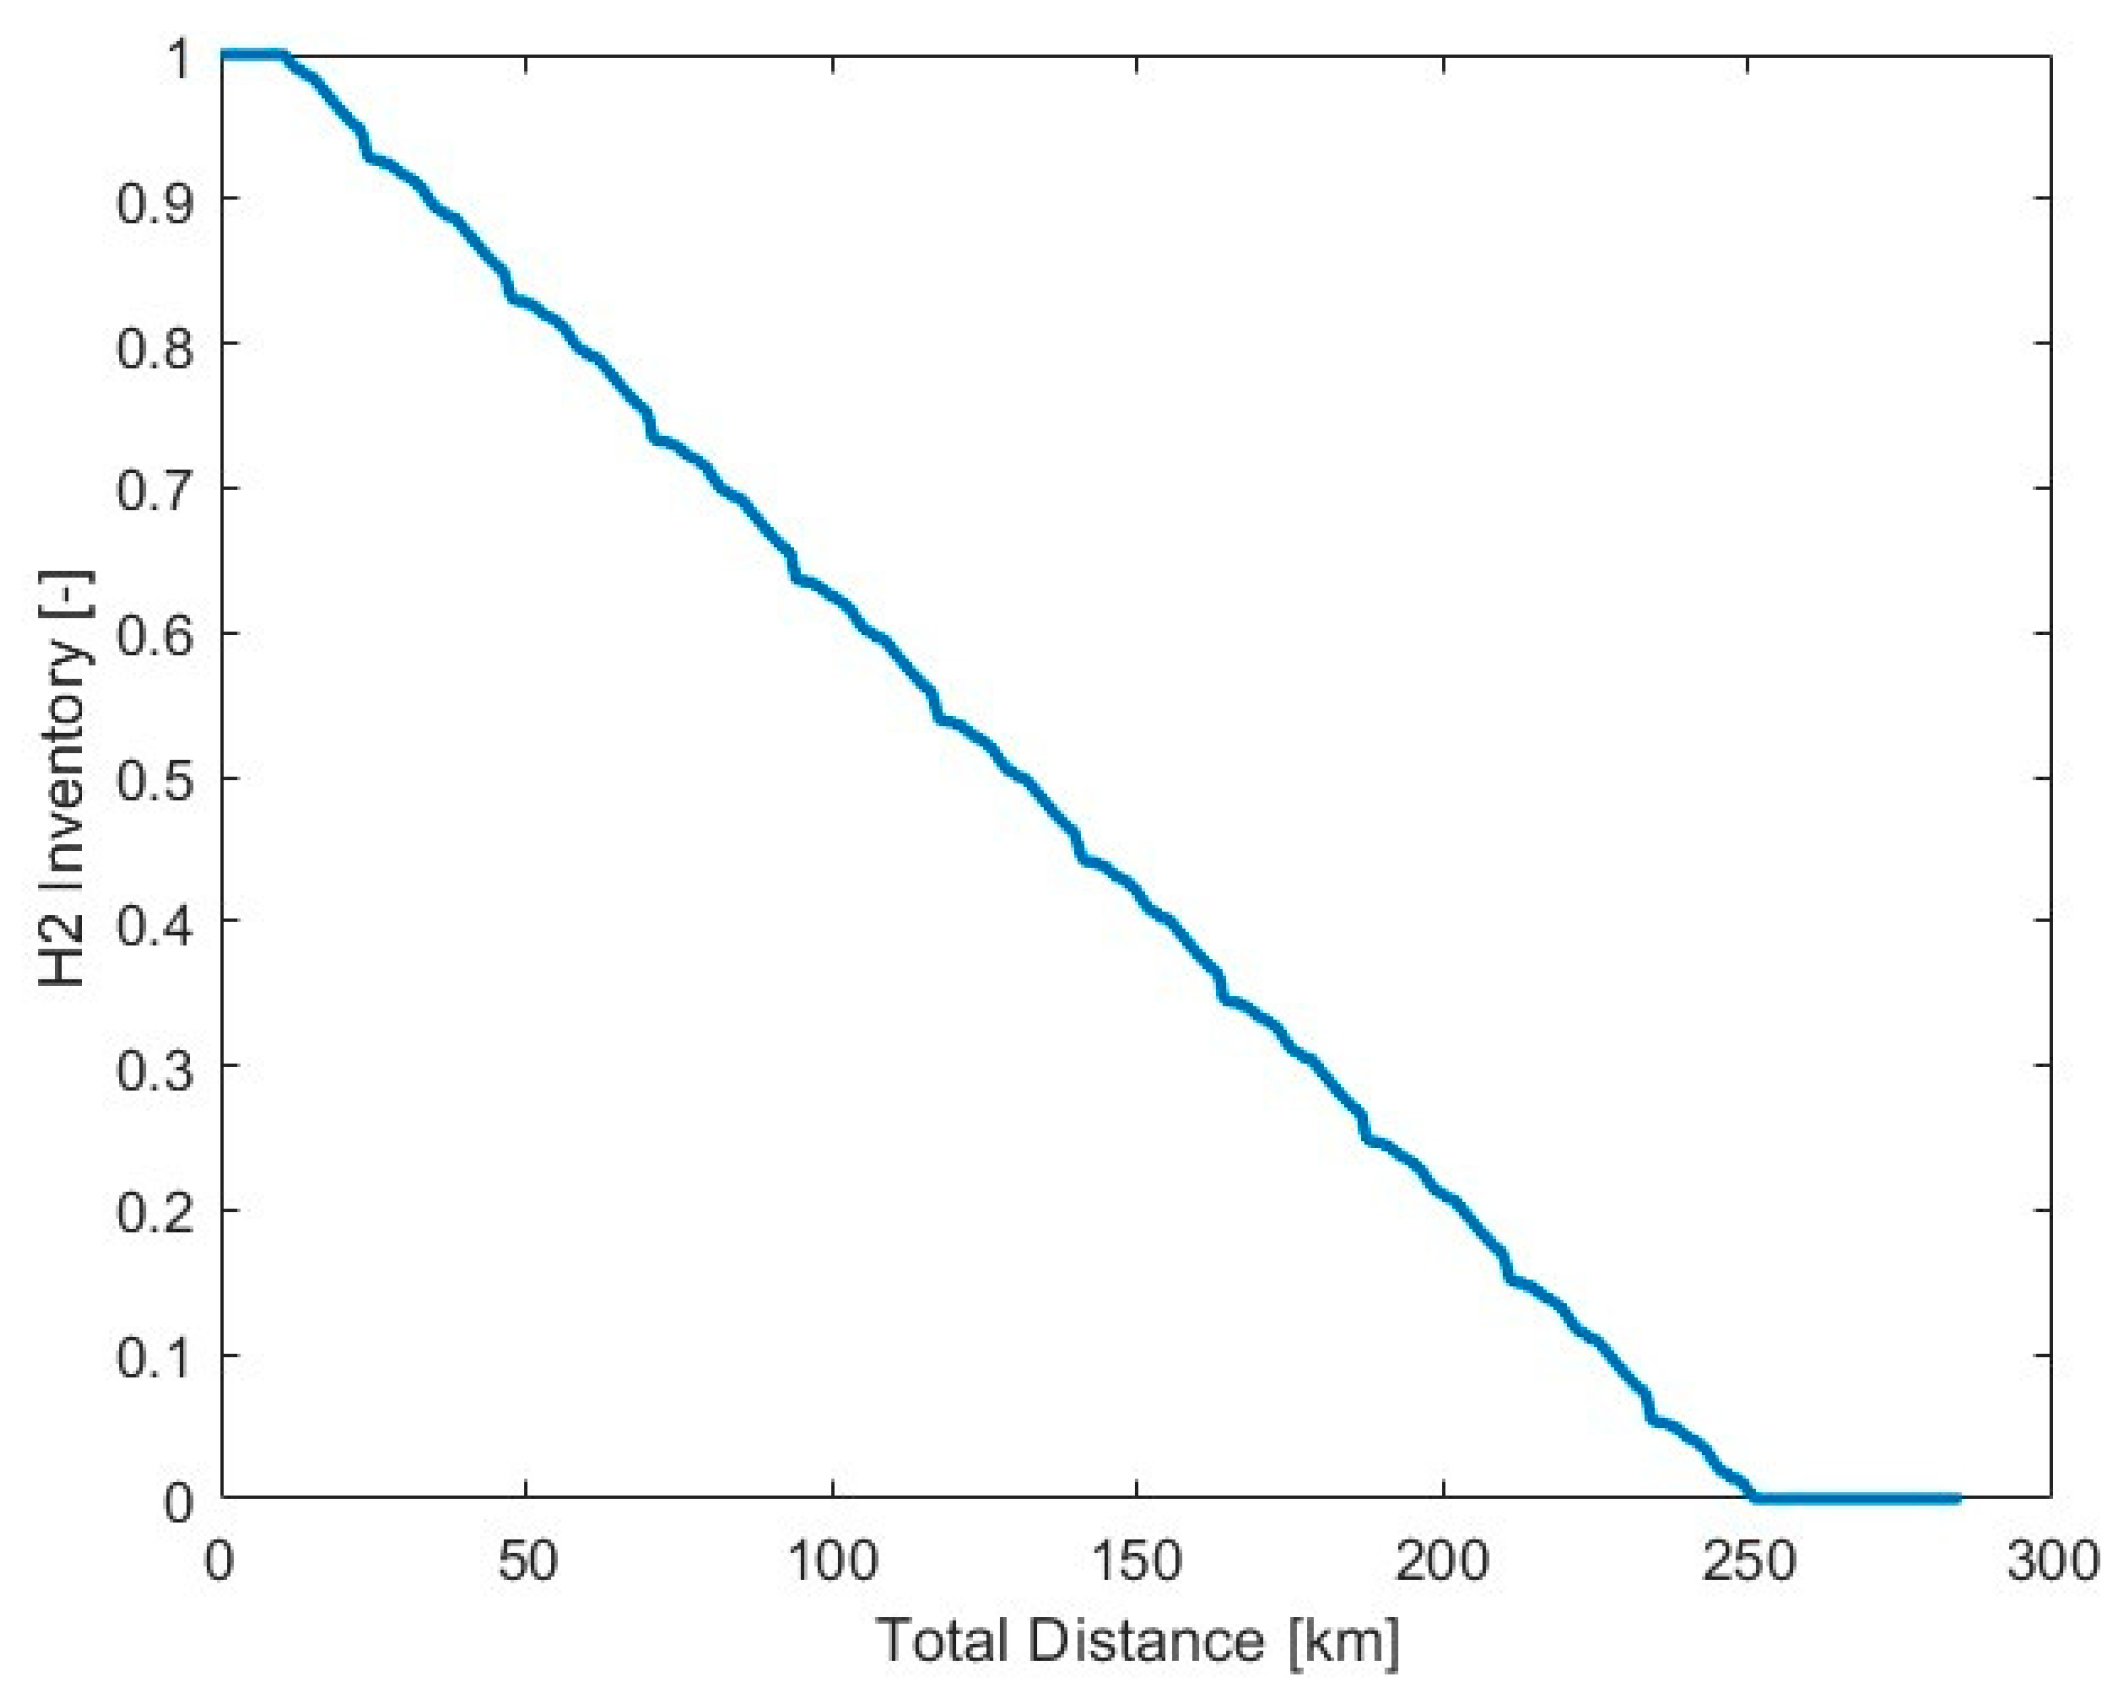
A repetitive WLTC simulation, starting from a 90% SoC and a full hydrogen tank to a 0% SoC and an empty hydrogen tank, offers a comprehensive overview of the powertrain system and serves as a key method for evaluating EMS performance, particularly in terms of total driving distance.
Figure 10 and Figure 11 provide a general idea of the entire behavior of the battery pack and the hydrogen tank. Following battery-sustaining mode, fuel cells become the primary energy source. As a result, battery discharge occurs more gradually, allowing the SoC to be maintained at a relatively high level. This operating condition enhances the efficiency of the battery system, as higher SoC levels are generally associated with improved energy conversion performance [38,55].
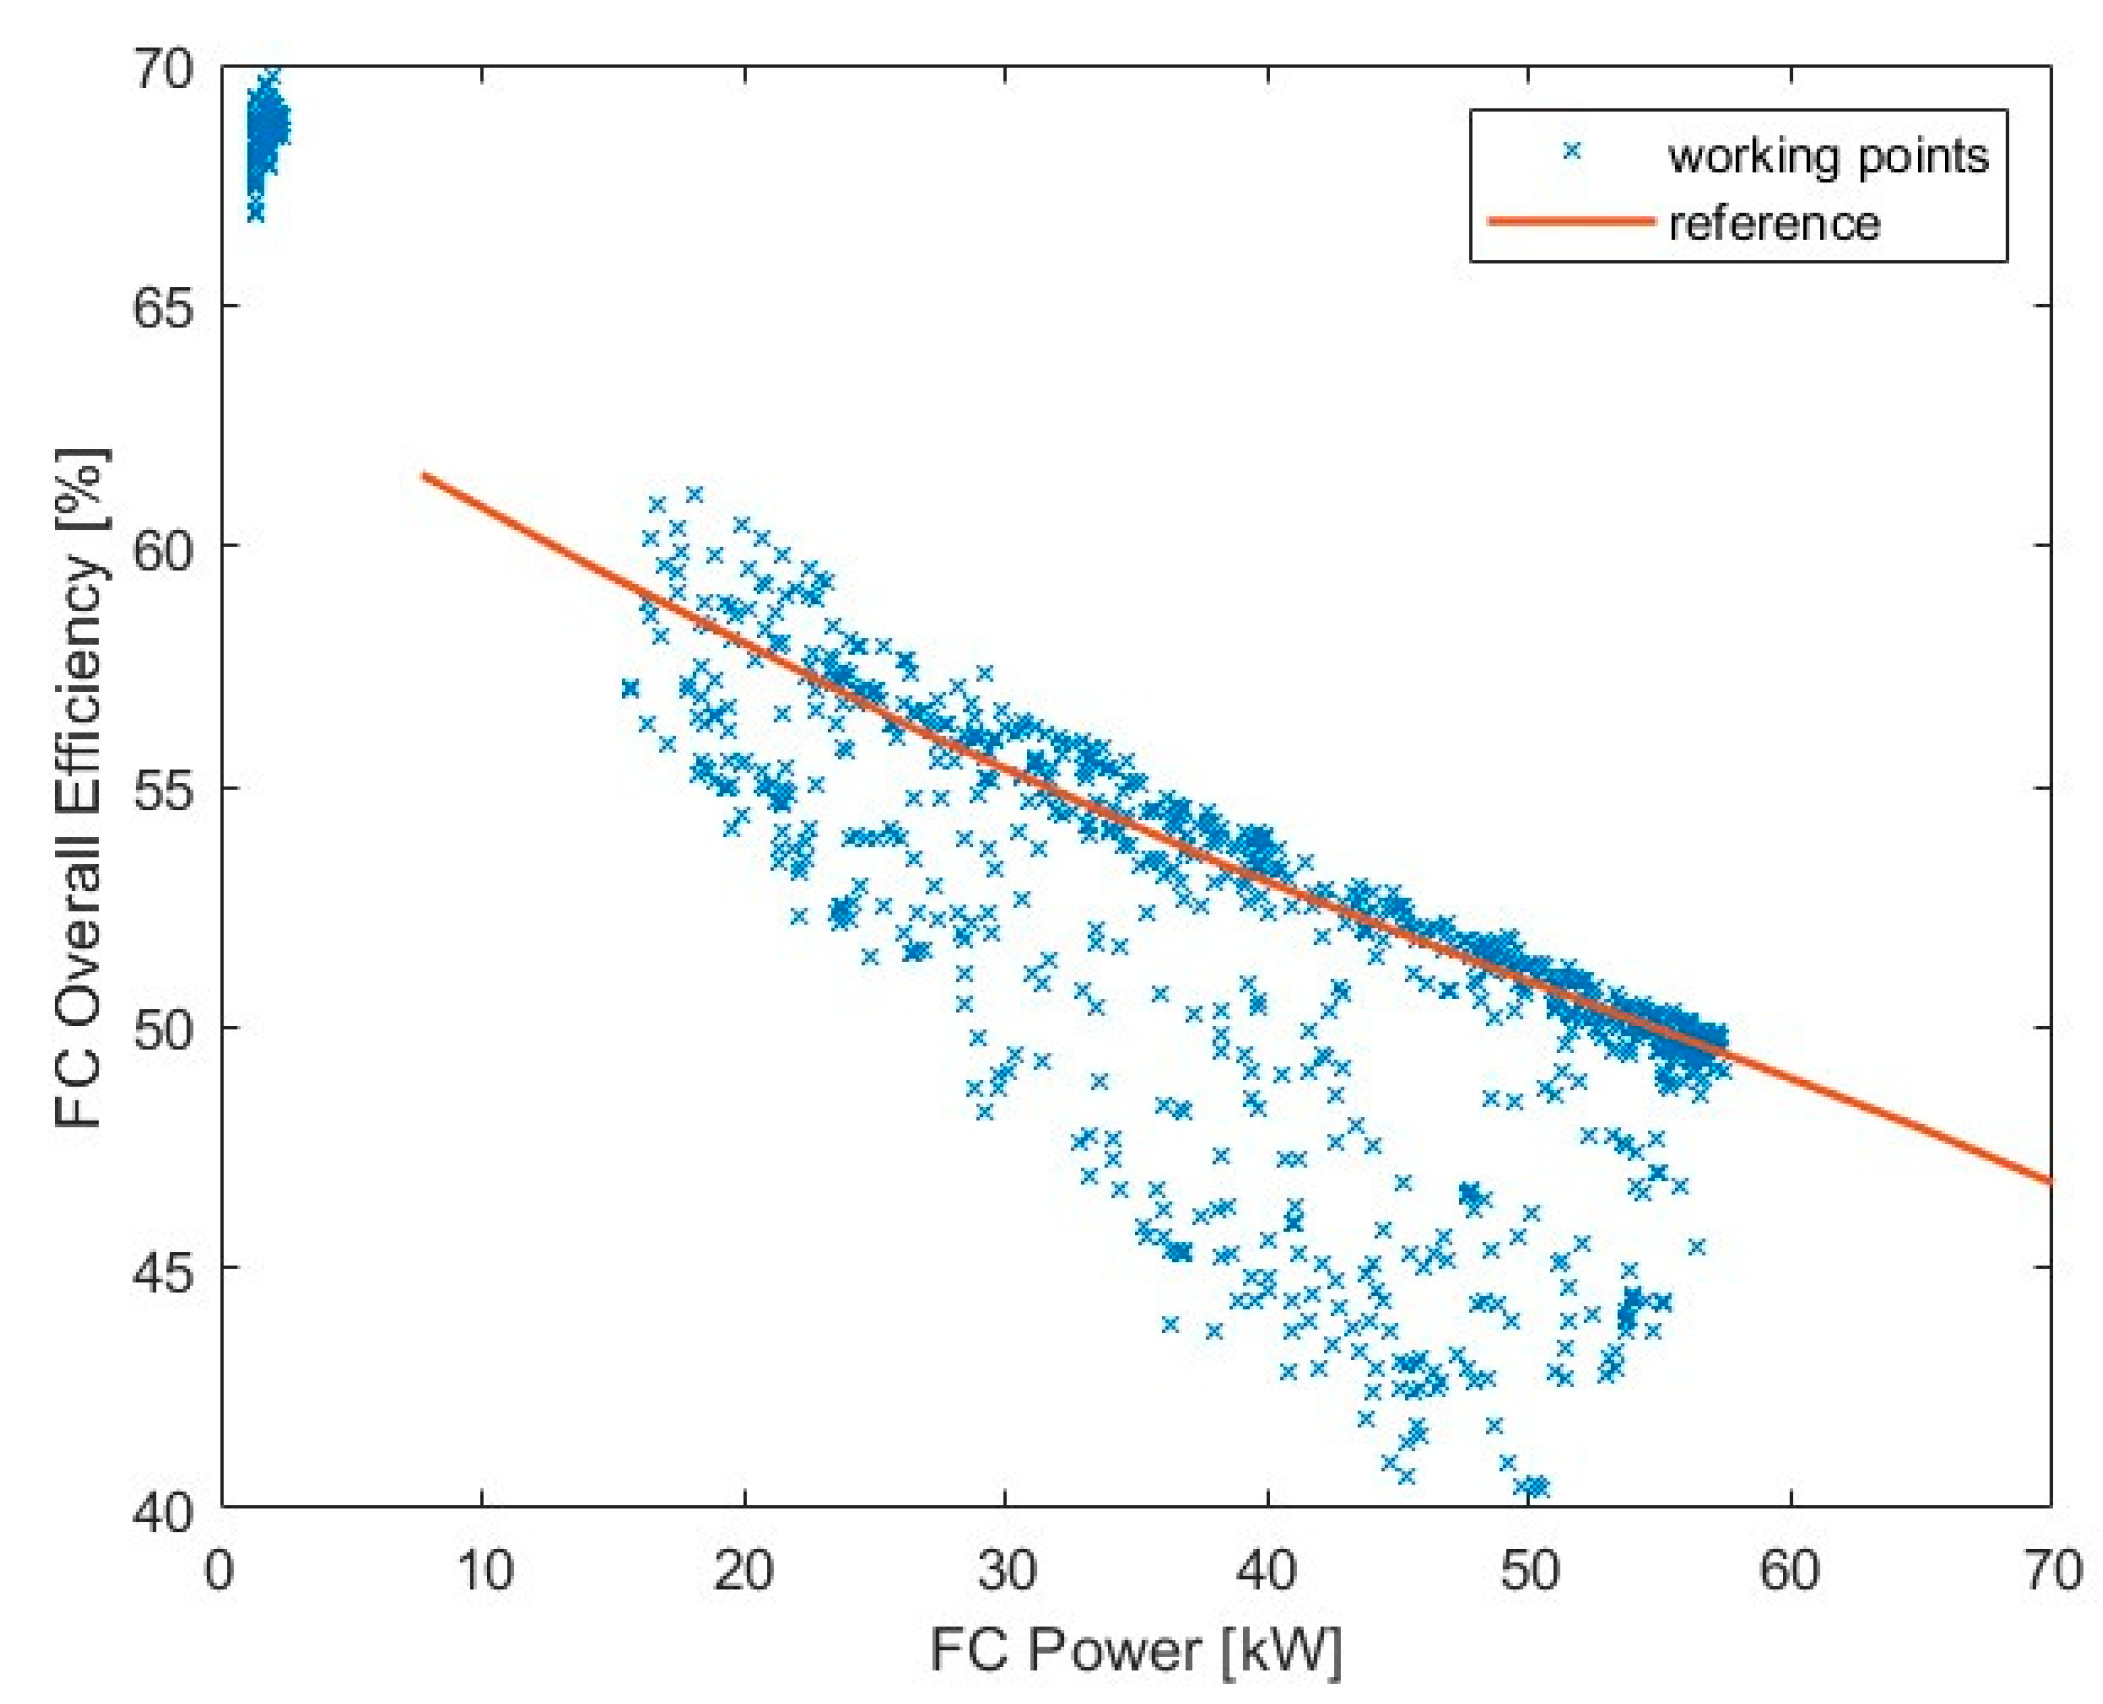
Figure 12 illustrates the efficiency of the FC system. The simulation results demonstrate that the FC efficiency largely aligns with the reference curve. However, the presence of working points below the reference indicates transient operating phases that should be minimized.
While a degradation model has not yet been implemented in the current study, a qualitative analysis of the fuel cell power output profile has been conducted [56]. The results suggest that energy management strategies inducing less frequent power fluctuations are likely to be more beneficial for fuel cell longevity. Since the present model is primarily intended for the preliminary evaluation and comparison of energy management algorithms, degradation effects were not quantitatively modeled. However, given that the electrochemical model of the fuel cell is already well established, integrating a degradation model is both feasible and planned for future development.
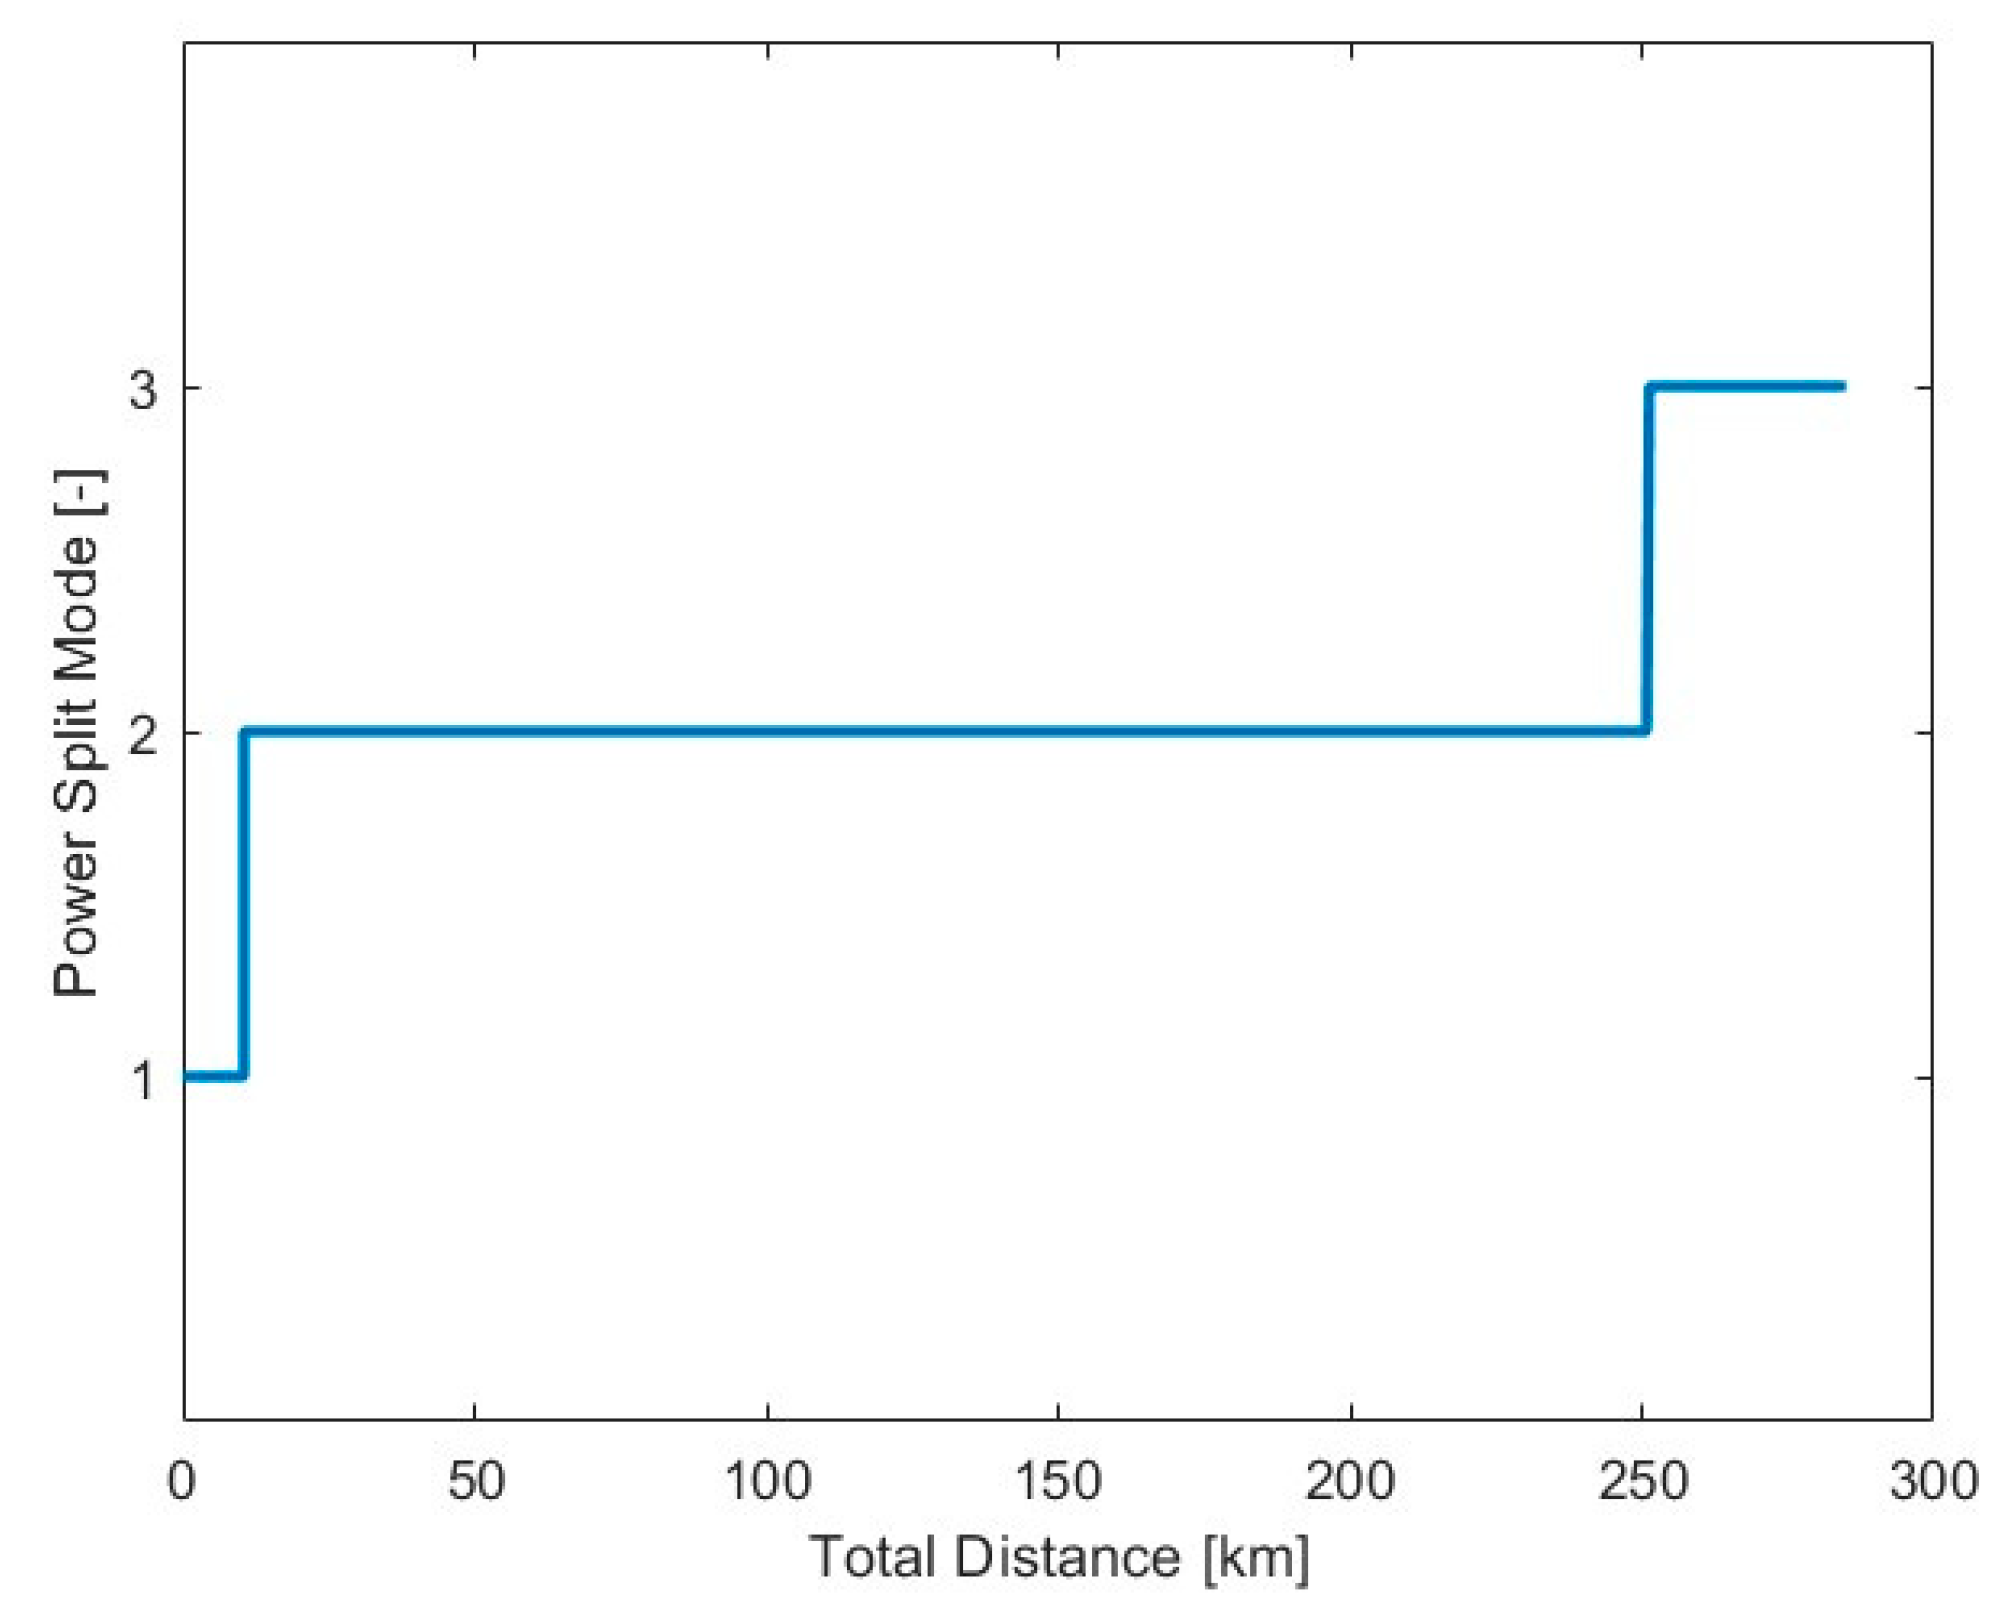
Figure 13 presents the variation in driving modes throughout the entire simulation, during which a total distance of 284.9 km is covered. The powertrain operates in power split mode for over 80% of the time, highlighting the critical role of a well-designed EMS.
The simulation results confirm that the developed model is both reasonable and reliable. This model can serve as a solid foundation for the design and validation of energy management strategies [48,53,54]. It enables the application of optimization-based algorithms to operate the fuel cell at higher-efficiency points, thereby extending the total driving range. Furthermore, the model’s robustness also makes it suitable for integration with reinforcement learning approaches, providing a trustworthy environment for training and testing advanced EMS algorithms.

4. Conclusions

The calibration of the PEM fuel cell model presented in this paper has been demonstrated to be both effective and precise, despite limited available reference data. This calibration effectively reproduced the experimental polarization curve and the transient response characteristics, underscoring the robustness and accuracy of the developed model. Quantitatively, the calibration results are strong: the RRSME of both the fuel cell polarization curve and the overall system efficiency are approximately 0.01, while the R2 values are around 0.99, indicating excellent agreement with experimental data.
The comprehensive powertrain simulation platform, integrating detailed models of the fuel cell stack, battery pack, electric motor, and vehicle longitudinal dynamics, was validated under realistic WLTP driving cycles. The energy management system presented in this study is intended as a representative example to demonstrate the feasibility and reliability of the proposed modeling approach. Its primary purpose is to support the simulation framework rather than to optimize control strategies. While the implemented algorithm is relatively simple, it provides a solid basis for future work involving the development and evaluation of more advanced energy management strategies. The simulation accurately captured critical dynamic behaviors, energy flows, and power distribution patterns inherent to hybrid PEMFC–battery systems. Simulation runtime is an important factor for real-time applications. For example, a full WLTC cycle—from 90% to 10% SoC and full to empty hydrogen tank—takes around 20 min. However, this duration can vary depending on the complexity of the energy management algorithm.
The energy management system (EMS) implemented in this study primarily serves as an illustrative example to demonstrate the model’s capability for reliable analysis and to introduce the proposed modeling framework. While the EMS remains basic and fundamental, it provides a solid foundation for future development. The modeling approach enables systematic testing and benchmarking of various, potentially more advanced, EMS algorithms. This platform therefore establishes valuable groundwork for future research aimed at improving and optimizing hybrid energy management in fuel cell electric vehicles.

Author Contributions

Conceptualization, F.M., E.G., H.d.C.P. and M.C.; methodology, F.M., E.G. and H.d.C.P.; software, Z.G. and E.G.; validation, Z.G. and E.G.; formal analysis, Z.G., F.M. and E.G.; investigation, Z.G. and E.G.; resources, H.d.C.P. and M.C.; data curation, Z.G. and E.G.; writing—original draft preparation, Z.G.; writing—review and editing, F.M., E.G. and H.d.C.P.; visualization, Z.G. and E.G.; supervision, H.d.C.P. and M.C.; project administration, M.C.; funding acquisition, M.C. All authors have read and agreed to the published version of the manuscript.

Funding

The activity has been funded by the European Union—Next Generation EU—PNRR M4C2, Investimento 1.4—Avviso n. 3138 del 16/12/2021—CN00000023 Sustainable Mobility Center (Centro Nazionale per la Mobilità Sostenibile)—CNMS—CUP E13C22000980001.

Data Availability Statement

Data is contained within the article.

Conflicts of Interest

The authors declare no conflicts of interest.

Abbreviations

The following abbreviations are used in this manuscript:
BEVBattery Electric Vehicle
BoPBalance of Plant
EMSEnergy Management Strategies
FCFuel Cell
FCEVFuel Cell Electric Vehicle
FCSFuel Cell Stack
ICEInternal Combustion Engine
LCVLight Commercial Vehicle
LHVLower Heating Value
PCUPowertrain Control Unit
PEMProton Exchange Membrane
RRSMERelative Root Square Mean Error
SoCState of Charge
SoH2State of Hydrogen
VDSVehicle Dynamic System
WLTPWorldwide Harmonized Light vehicles Test Procedure

References

  1. Larminie, J.; Dicks, A.; McDonald, M.S. Fuel Cell Systems Explained; John Wiley and Sons: Hoboken, NJ, USA, 2003. [Google Scholar]
  2. Mench, M.M. Fuel Cell Engines; John Wiley and Sons: Hoboken, NJ, USA, 2008. [Google Scholar]
  3. Darvishi, Y.; Hassan-Beygi, S.R.; Zarafshan, P.; Hooshyari, K.; Malaga-Toboła, U.; Gancarz, M. Numerical modeling and evaluation of pem used for fuel cell vehicles. Materials 2021, 14, 7907. [Google Scholar] [CrossRef]
  4. Omran, A.; Lucchesi, A.; Smith, D.; Alaswad, A.; Amiri, A.; Wilberforce, T.; Sodré, J.R.; Olabi, A. Mathematical model of a proton-exchange membrane (PEM) fuel cell. Int. J. Thermofluids 2021, 11, 100110. [Google Scholar] [CrossRef]
  5. Chugh, S.; Chaudhari, C.; Sonkar, K.; Sharma, A.; Kapur, G.S.; Ramakumar, S.S.V. Experimental and modelling studies of low temperature PEMFC performance. Int. J. Hydrogen Energy 2020, 45, 8866–8874. [Google Scholar] [CrossRef]
  6. Hou, Y.; Yin, C.; Sheng, X.; Xu, D.; Chen, J.; Tang, H. Automotive fuel cell performance degradation prediction using Multi-Agent Cooperative Advantage Actor-Critic model. Energy 2025, 318, 134899. [Google Scholar] [CrossRef]
  7. Pukrushpan, J.T.; Peng, H.; Stefanopoulou, A.G. Control-oriented modeling and analysis for automotive fuel cell systems. J. Dyn. Syst. Meas. Control. Trans. 2024, 126, 14–25. [Google Scholar] [CrossRef]
  8. Chen, J.; He, H.; Wang, Y.-X.; Quan, S.; Zhang, Z.; Wei, Z.; Han, R. Research on energy management strategy for fuel cell hybrid electric vehicles based on improved dynamic programming and air supply optimization. Energy 2024, 300, 131567. [Google Scholar] [CrossRef]
  9. Fandi, G.; Novák, J.; Chyský, J.; Šrom, J. Review and modeling on hydrogen fuel cells electric vehicle (HFCEV), in comparison with battery electrical vehicle (BEV) using MATLAB environment. Case study: Postal car. Energy Convers. Manag. X 2024, 24, 100684. [Google Scholar] [CrossRef]
  10. Knöri, T.; Schulze, M. Spatially resolved current density measurements and real-time modelling as a tool for the determination of local operating conditions in polymer electrolyte fuel cells. J. Power Sources 2009, 193, 308–314. [Google Scholar] [CrossRef]
  11. Verducci, F.; Grimaldi, A.; Colombo, E.; Casalegno, A.; Baricci, A. Dynamic modeling of polymer electrolyte membrane fuel cells under real-world automotive driving cycle with experimental validation on segmented single cell. Renew Energy 2024, 234, 121194. [Google Scholar] [CrossRef]
  12. Sarmiento-Carnevali, M.; Serra, M.; Batlle, C. Distributed parameter model simulation tool for PEM fuel cells. Int. J. Hydrogen Energy 2014, 39, 4044–4052. [Google Scholar] [CrossRef]
  13. Han, J.; Woo, J.; Kim, Y.; Yu, S. Fuel cell/battery power supply system operational strategy to secure the durability of commercial hydrogen vehicles. Energy Convers. Manag. 2023, 288, 117163. [Google Scholar] [CrossRef]
  14. Sun, W.; Liu, H.; Han, M.; Sun, K.; Bai, S.; Li, G. A Novel Method for the Application of the ECMS (Equivalent Consumption Minimization Strategy) to Reduce Hydrogen Consumption in Fuel Cell Hybrid Electric Vehicles. Fluid Dyn. Mater. Process. 2022, 18, 867–882. [Google Scholar] [CrossRef]
  15. Silva-Vera, E.; Valdez-Resendiz, J.E.; Alejo-Reyes, A.; Rumbo-Morales, J.Y.; Rosas-Caro, J.C.; Sanchez, V.M. Data-driven modeling of proton-exchange membrane fuel cell stacks. Int. J. Hydrogen Energy 2025, 141, 1050–1060. [Google Scholar] [CrossRef]
  16. Kahveci, E.E.; Taymaz, I. Hydrogen PEMFC stack performance analysis through experimental study of operating parameters by using response surface methodology (RSM). Int. J. Hydrogen Energy 2022, 47, 12293–12303. [Google Scholar] [CrossRef]
  17. Sahu, I.P.; Krishna, G.; Biswas, M.; Das, M.K. Performance study of PEM fuel cell under different loading conditions. Energy Procedia 2014, 54, 468–478. [Google Scholar] [CrossRef]
  18. Pukrushpan, J.T. Modeling and Control of Fuel Cell Systems and Fuel Processors; University of Michigan: Ann Arbor, MI, USA, 2003. [Google Scholar]
  19. Grano, E.; Lazek, T.; Carello, M. A numerical Methodology for Induction Motor Control: Lookup Tables Generation and Steady-State Performance Analysis. In SAE Technical Papers; SAE International: Warrendale, PA, USA, 2024. [Google Scholar] [CrossRef]
  20. Grano, E.; Bianco, E.; De Carvalho Pinheiro, H.; Carello, M. MTPA and flux weakening control of electric motors: A numerical approach. In Proceedings of the 2023 IEEE International Conference on Environment and Electrical Engineering and 2023 IEEE Industrial and Commercial Power Systems Europe, EEEIC/I and CPS Europe, Madrid, Spain, 6–9 June 2023; Institute of Electrical and Electronics Engineers Inc.: New York, NY, USA, 2023. [Google Scholar] [CrossRef]
  21. de Carvalho Pinheiro, H. PerfECT Design Tool: Electric Vehicle Modelling and Experimental Validation. World Electr. Veh. J. 2023, 14, 337. [Google Scholar] [CrossRef]
  22. Grano, E.; de Carvalho Pinheiro, H.; Carello, M. A novel electric drive description to bridge the gap between energetic and equivalent-circuit models. Proc. Inst. Mech. Eng. Part D J. Automob. Eng. 2025, 09544070251330340. [Google Scholar] [CrossRef]
  23. Eisner, M.K.; Zhou, Z.; Formanski, V.; Kennel, R.M. Improving the air supply and hydrogen dilution control of a fuel cell electric vehicle with explicit model predictive control. Int. J. Hydrogen Energy 2024, 52, 1236–1247. [Google Scholar] [CrossRef]
  24. Xu, C.; Yang, J.; Chen, K.; Ma, G.; Wang, Y.; Li, Z.; Zhou, Z.; Wu, Z.; Che, S.; Ding, C.; et al. CoSe2-Modified multidimensional porous carbon frameworks as high-Performance anode for fast-Charging sodium-Ion batteries. Chem. Eng. J. 2024, 497, 154875. [Google Scholar] [CrossRef]
  25. Mazzeo, F.; Di Napoli, L.; Carello, M. Assessing Open Circuit Voltage Losses in PEMFCs: A New Methodological Approach. Energies 2024, 17, 2785. [Google Scholar] [CrossRef]
  26. Nguyen, T.V.; White, R.E. A Water and Heat Management Model for Proton-Exchange-Membrane Fuel Cells. J. Electrochem. Soc. 1993, 140, 2178–2186. [Google Scholar] [CrossRef]
  27. Guzzella, L. Vehicle Propulsion Systems: Introduction to Modeling and Optimization, 2nd ed.; Springer: Berlin/Heidelberg, Germany, 2005. [Google Scholar]
  28. Singla, M.K.; Gupta, J.; Singh, B.; Nijhawan, P.; Abdelaziz, A.Y.; El-Shahat, A. Parameter Estimation of Fuel Cells Using a Hybrid Optimization Algorithm. Sustainability 2023, 15, 6676. [Google Scholar] [CrossRef]
  29. Mei, J.; Meng, X.; Tang, X.; Li, H.; Hasanien, H.; Alharbi, M.; Dong, Z.; Shen, J.; Sun, C.; Fan, F.; et al. An Accurate Parameter Estimation Method of the Voltage Model for Proton Exchange Membrane Fuel Cells. Energies 2024, 17, 2917. [Google Scholar] [CrossRef]
  30. Nafion Membrane, Chemours Nafion, Proton Exchange Membrane. Available online: https://www.nafion.com/en/products/sulfonic-membranes (accessed on 30 July 2025).
  31. Guzzella, L.; Sciarretta, A. Vehicle Propulsion Systems: Introduction to Modeling and Optimization; Springer: Berlin/Heidelberg, Germany, 2013; Volume 9783642359132, pp. 1–409. [Google Scholar] [CrossRef]
  32. Moraal, P.; Kolmanovsky, I. Turbocharger modeling for automotive control applications. In SAE Technical Papers; SAE International: Warrendale, PA, USA, 1999. [Google Scholar] [CrossRef]
  33. Cunningham, J.M.; Hoffman, M.A.; Moore, R.M.; Friedman, D.J. Requirements for a Flexible and Realistic Air Supply Model for Incorporation into a Fuel Cell Vehicle (FCV) System Simulation. In SAE Transactions; SAE International: Warrendale, PA, USA, 1999. [Google Scholar] [CrossRef]
  34. Wang, C.; Nehrir, M.H.; Shaw, S.R. Dynamic models and model validation for PEM fuel cells using electrical circuits. IEEE Trans. Energy Convers. 2005, 20, 442–451. [Google Scholar] [CrossRef]
  35. Mazzeo, F.; Graziano, E.; Bodoardo, S.; Papurello, D. Calibration methodology of static, dynamic and ageing parameters of an electrochemical model for a Li-ion cell based on an experimental approach. Renew Energy 2025, 246, 122793. [Google Scholar] [CrossRef]
  36. Natarajan, N.; Panday, A.; Duddu, S.; Singh, T.T.; Kesavan, D.; Annabathula, S. Electrochemical & Equivalent Circuit Modelling and Validation of Lithium-Ion Cell in GT-AutoLion. In SAE Technical Papers; SAE International: Warrendale, PA, USA, 2022. [Google Scholar] [CrossRef]
  37. Zhang, L.; Hu, X.; Wang, Z.; Sun, F.; Dorrell, D.G. A review of supercapacitor modeling, estimation, and applications: A control/management perspective. Renew. Sustain. Energy Rev. 2018, 81, 1868–1878. [Google Scholar] [CrossRef]
  38. He, H.; Xiong, R.; Fan, J. Evaluation of Lithium-Ion Battery Equivalent Circuit Models for State of Charge Estimation by an Experimental Approach. Energies 2011, 4, 582–598. [Google Scholar] [CrossRef]
  39. Plett, G.L. Extended Kalman filtering for battery management systems of LiPB-based HEV battery packs: Part 2. Modeling and identification. J. Power Sources 2004, 134, 262–276. [Google Scholar] [CrossRef]
  40. Zhang, Y.; Zhao, C.; Dai, B.; Li, Z. Dynamic Simulation of Permanent Magnet Synchronous Motor (PMSM) Electric Vehicle Based on Simulink. Energies 2022, 15, 1134. [Google Scholar] [CrossRef]
  41. Hasoun, M. (PDF) A Comparative Study of Direct Torque Control and Field Oriented Control for Permanent Magnet Synchronous Motor Drives. Available online: https://www.researchgate.net/publication/319043511_A_Comparative_Study_of_Direct_Torque_Control_and_Field_Oriented_Control_for_Permanent_Magnet_Synchronous_Motor_drives (accessed on 26 May 2025).
  42. Han, S.; Zhang, F.; Xi, J. A real-time energy management strategy based on energy prediction for parallel hybrid electric vehicles. IEEE Access 2018, 6, 70313–70323. [Google Scholar] [CrossRef]
  43. Gu, J.; Ouyang, M.; Li, J. Vehicle Dynamic Simulation for Efficiency Optimization of Four-wheel Independent Driven Electric Vehicle. World Electr. Veh. J. 2010, 4, 319–324. [Google Scholar] [CrossRef]
  44. Yu, G. New Rotational Dynamics- Inertia-Torque Principle and the Force Moment the Character of Statics. J. Appl. Comput. Math. 2015, 4, 319–324. [Google Scholar] [CrossRef]
  45. Zhao, J. Integrated Longitudinal Vehicle Dynamics Control with Tire/Road Friction Estimation. Available online: https://fid-move.de/en/search/id/BLCP:CN600050884?cHash=cf7443cde723534b4ce3f10fb530d445 (accessed on 27 May 2025).
  46. Olson, B.J.; Shaw, S.W.; Stépán, G. Stability and bifurcation of longitudinal vehicle braking. Nonlinear Dyn 2005, 40, 339–365. [Google Scholar] [CrossRef]
  47. Wang, Y.; Deng, Y.; Wang, H.; Zuo, Z. Model predictive control-based longitudinal control for autonomous electric vehicle with changing mass. Asian J. Control. 2023, 25, 1297–1309. [Google Scholar] [CrossRef]
  48. Musa, A.; Miretti, F.; Misul, D. MPC-Based Cooperative Longitudinal Control for Vehicle Strings in a Realistic Driving Environment. In SAE Technical Papers; SAE International: Warrendale, PA, USA, 2023. [Google Scholar] [CrossRef]
  49. Jiang, X.; Xing, H.; Chen, S. Longitudinal motion control of autonomous vehicle based on feedforward-fuzzy PI. In Proceedings of the 4th International Conference on Information Science, Electrical, and Automation Engineering (ISEAE 2022), online, 25–27 March 2022; Volume 2257, pp. 1129–1135. [Google Scholar] [CrossRef]
  50. Xiong, L.; Yang, X.; Zhuo, G.; Leng, B.; Zhang, R. Review on Motion Control of Autonomous Vehicles. Jixie Gongcheng Xuebao/J. Mech. Eng. 2020, 56, 127–143. [Google Scholar] [CrossRef]
  51. Singh, S. Longitudinal Velocity Control of Autonomous Ground Vehicle using PID and PI Controller. Int. J. Res. Appl. Sci. Eng. Technol. 2021, 9, 504–510. [Google Scholar] [CrossRef]
  52. Serrao, L.; Onori, S.; Rizzoni, G. ECMS as a realization of pontryagin’s minimum principle for HEV control. In Proceedings of the American Control Conference, Denver, CO, USA, 8–10 July 2009; pp. 3964–3969. [Google Scholar] [CrossRef]
  53. Madkaikar, S.; Kini, C.R.; Nayak, S.Y. Energy Management Approach for Charge Sustaining Hybrid Electric Vehicle. J. Eng. Sci. Technol. 2021, 16, 4121–4137. [Google Scholar]
  54. Shi, D.; Xu, H.; Wang, S.; Hu, J.; Chen, L.; Yin, C. Deep reinforcement learning based adaptive energy management for plug-in hybrid electric vehicle with double deep Q-network. Energy 2024, 305, 132402. [Google Scholar] [CrossRef]
  55. Demirci, O.; Taskin, S.; Schaltz, E.; Demirci, B.A. Review of battery state estimation methods for electric vehicles-Part I: SOC estimation. J. Energy Storage 2024, 87, 111435. [Google Scholar] [CrossRef]
  56. Di Napoli, L.; Mazzeo, F. Health and Condition Monitoring Tool for Real-Time and on-Board Diagnosis of PEM Fuel Cell in Heavy Duty Vehicles. In SAE Technical Paper; SAE International: Warrendale, PA, USA, 2025. [Google Scholar] [CrossRef]
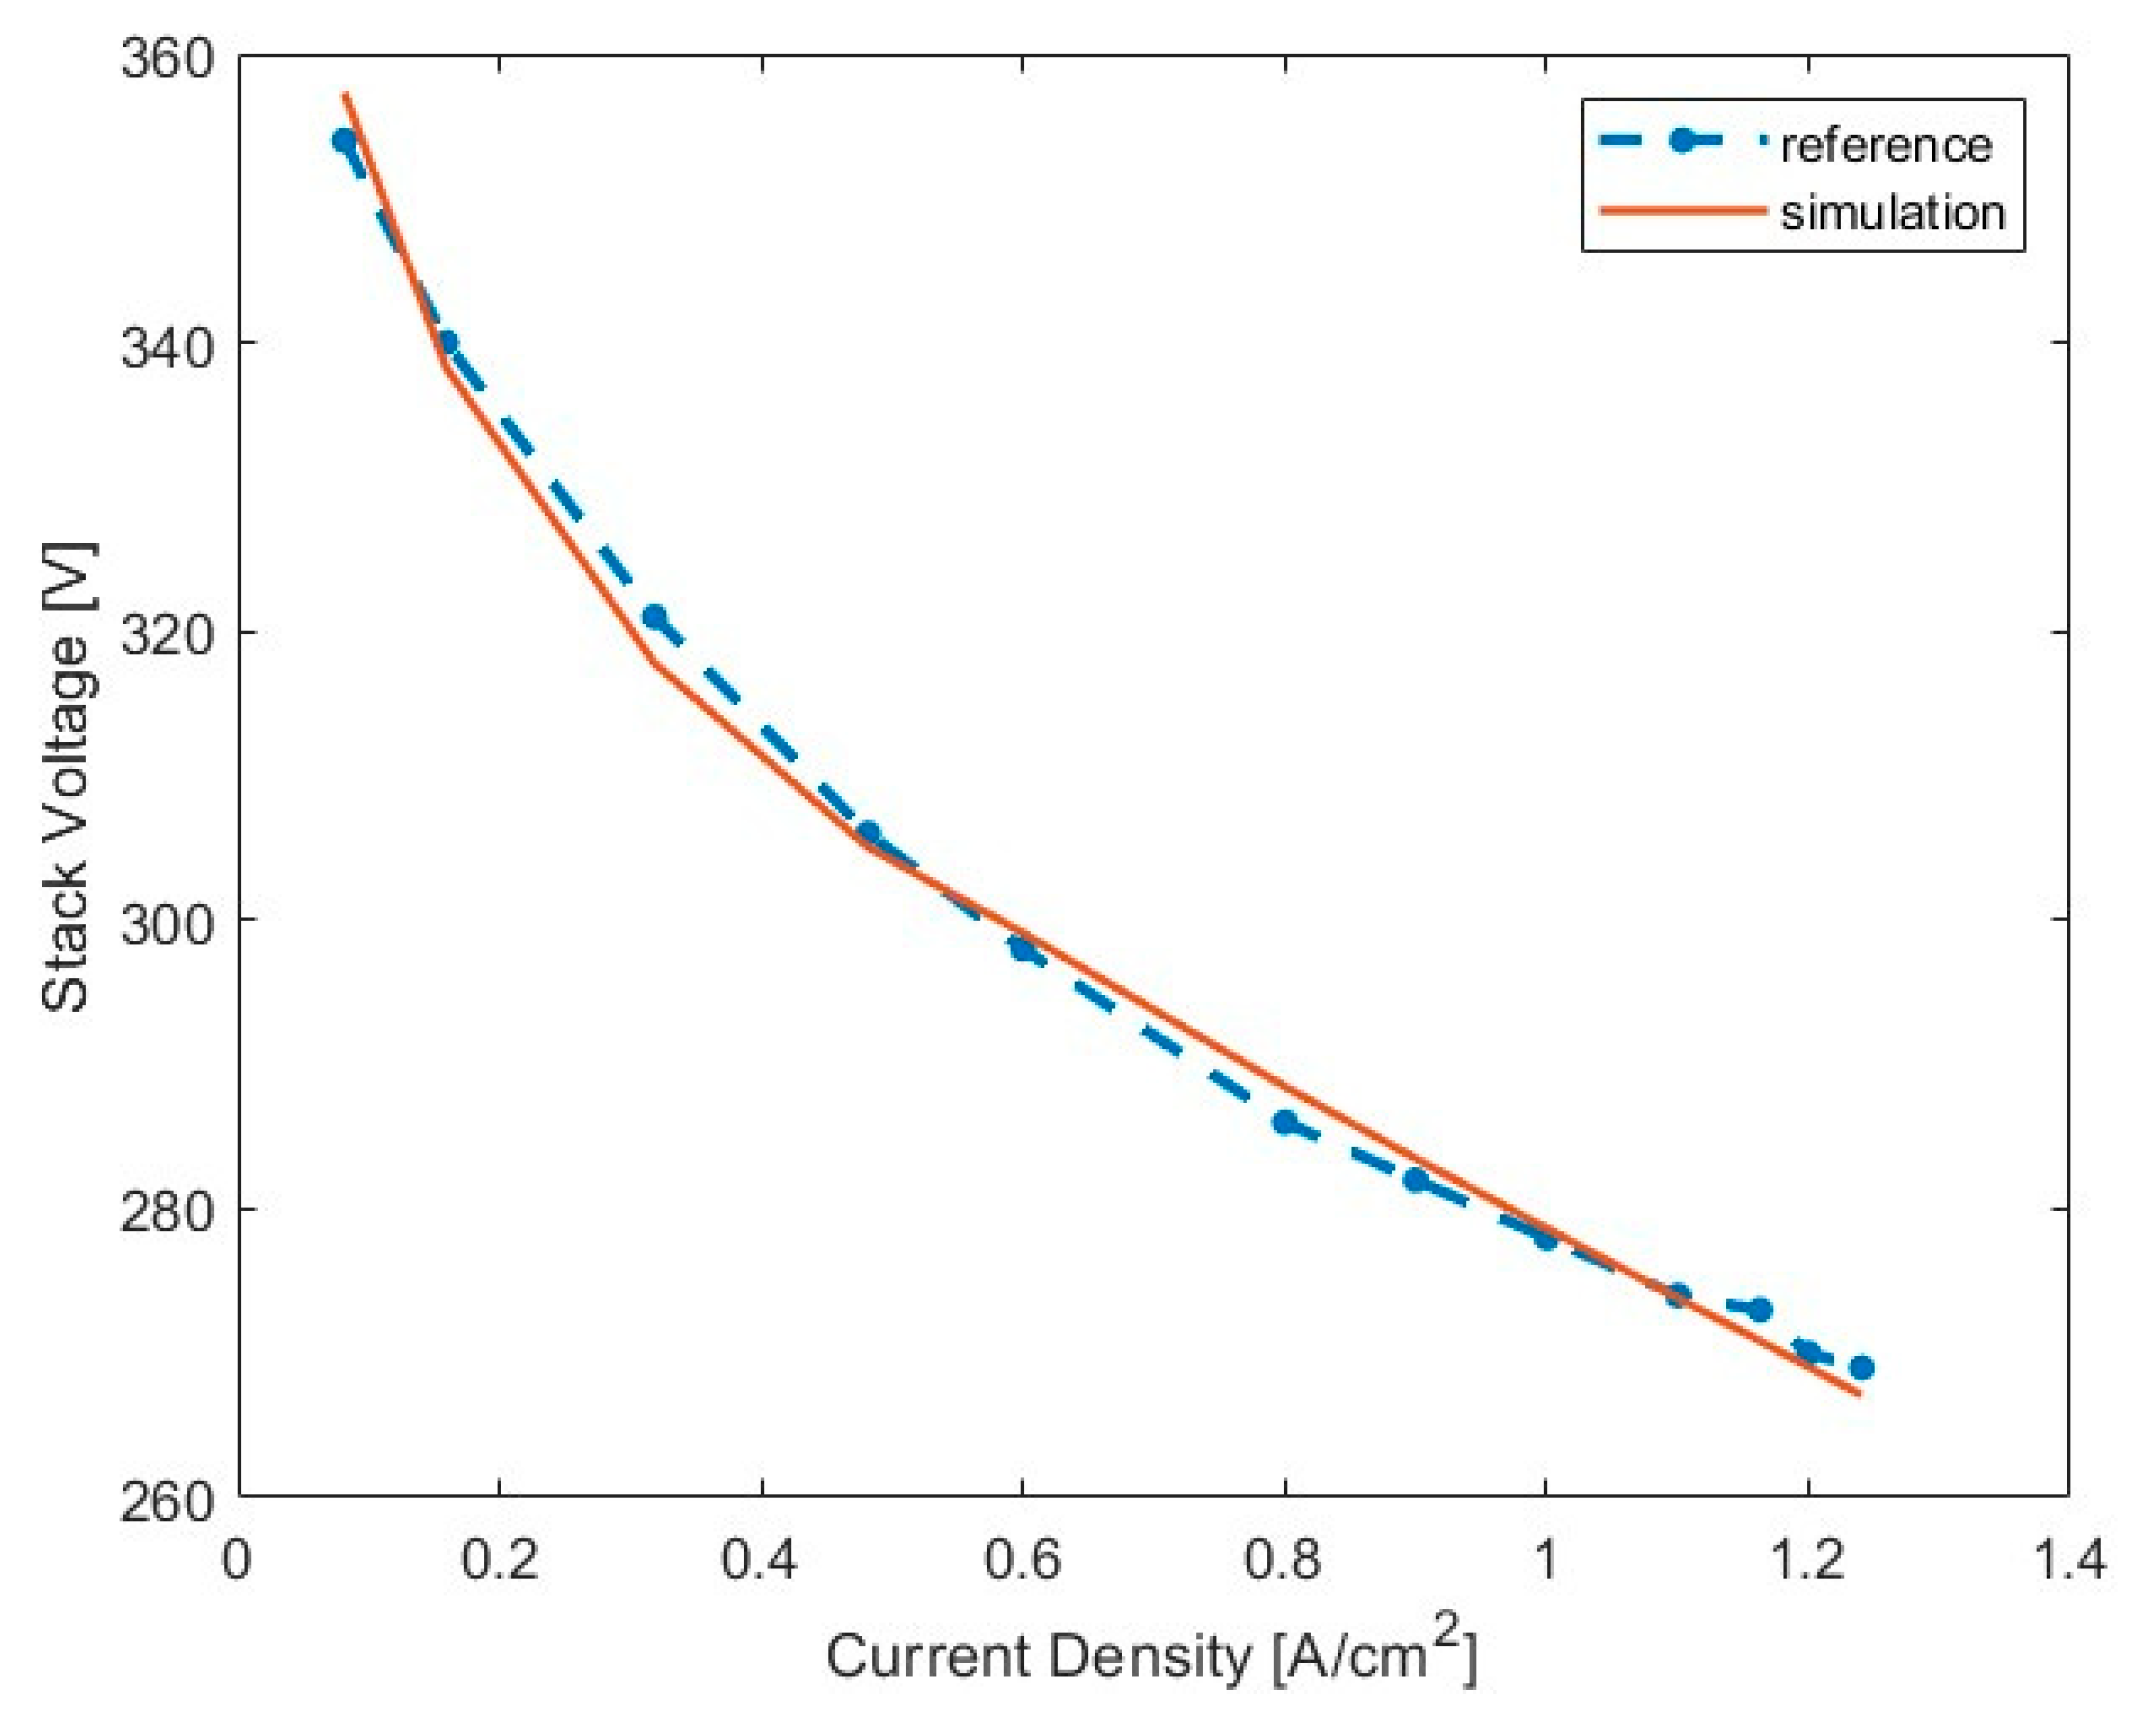
Figure 1. Comparison of polarization curves.
Designs 09 00094 g001
Figure 2. Comparison of power outputs.
Designs 09 00094 g002
Figure 3. Fuel cell total efficiency comparison.
Designs 09 00094 g003
Figure 4. SoC variation in battery depleting mode.
Designs 09 00094 g004
Figure 5. H2 inventory variation in battery depleting mode.
Designs 09 00094 g005
Figure 6. Vehicle speed comparison in battery depleting mode.
Designs 09 00094 g006
Figure 7. SoC variation with different initial values.
Designs 09 00094 g007
Figure 8. SoH2 variation in a single drive cycle.
Designs 09 00094 g008
Figure 9. Vehicle speed comparison in battery-sustaining mode.
Designs 09 00094 g009
Figure 10. Full discharging profile.
Designs 09 00094 g010
Figure 11. Hydrogen consumption profile.
Designs 09 00094 g011
Figure 12. Real system efficiency vs. reference data.
Designs 09 00094 g012
Figure 13. Power split mode variation.
Designs 09 00094 g013
Table 1. Tunable parameters and tuning strategies.
ParameterRangeInfluence *
b [V]0.03–0.15 [2]Positive to Activation loss
i 0   [ m A / cm 2 ] around 0.5 [1]Negative to Activation loss
t m  [μm]20–50 [30]Positive to Ohmic loss
i l i m   [ A / cm 2 ] 2.0–3.0 [31]Negative to Concentration loss
* Positive influence refers that increasing the parameter will increase the voltage drop correspondingly, vice versa.
Table 2. Compressor map regression coefficients.
ParameterValueParameterValue
a 4 −8.110 × 10⁻⁷ b 0 2.556
a 3 5.588 × 10⁻⁶ c 5 −1.298 × 10⁻⁸
a 2 3.508 × 10⁻⁶ c 4 −1.298 × 10⁻⁸
a 1 2.676 × 10⁻⁷ c 3 0.215
a 0 4.821 × 10⁻⁴ c 2 0.799
b 2 8.889 × 10⁻⁴ c 1 81.190
b 1 0.111 c 0 −1.449
Disclaimer/Publisher’s Note: The statements, opinions and data contained in all publications are solely those of the individual author(s) and contributor(s) and not of MDPI and/or the editor(s). MDPI and/or the editor(s) disclaim responsibility for any injury to people or property resulting from any ideas, methods, instructions or products referred to in the content.