
Design and Development of a Low-Power IoT System for Continuous Temperature Monitoring

 , , ,
, , ,
Abstract
1. Introduction
2. Background and Relevant Research
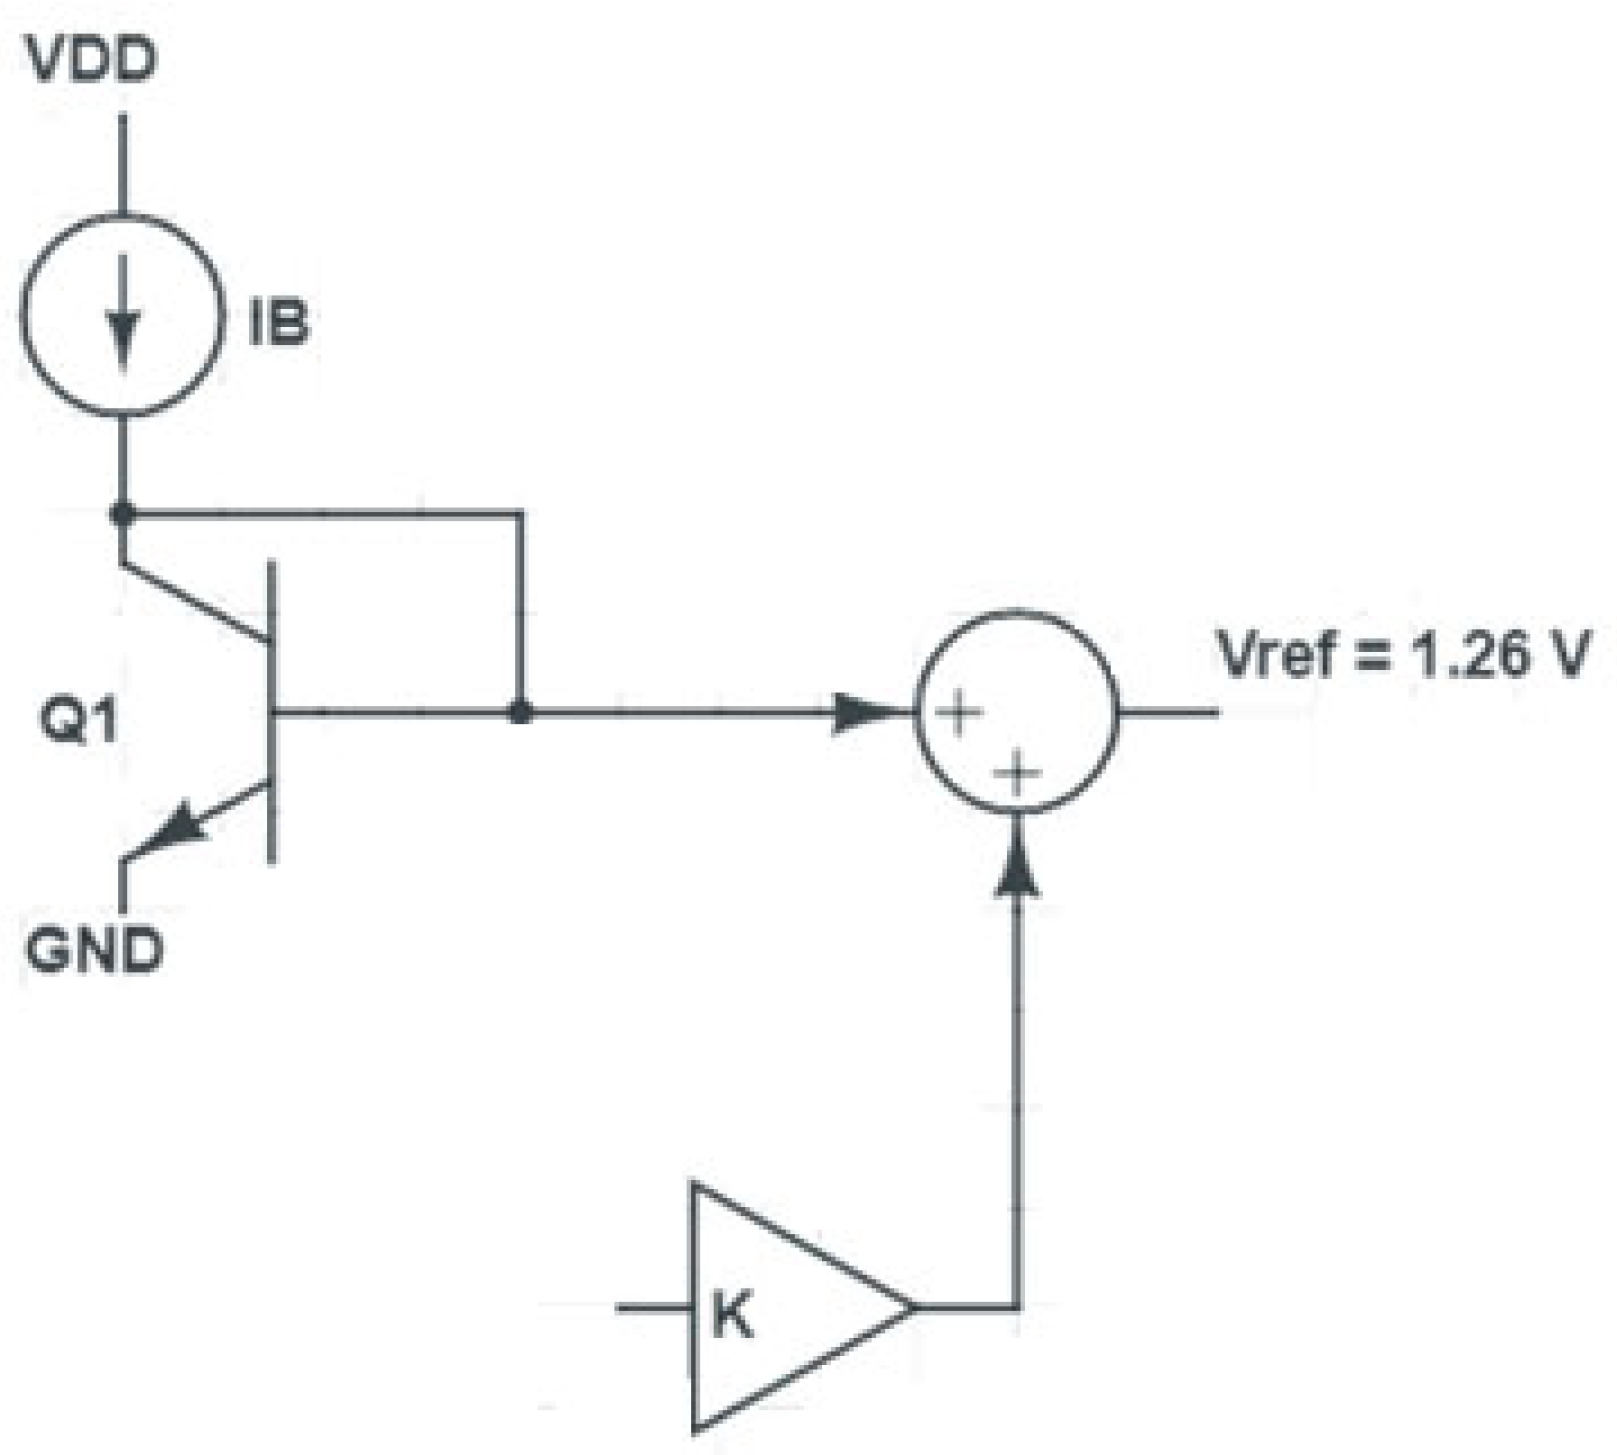
2.1. Background
- VBE is the transistor/diode base-emitter voltage.
- VG0 is the bandgap voltage extrapolated to 0 °K (typically around 1.2 V).
- T is the absolute temperature in kelvins.
- T0 is a reference temperature (usually 300 °K or 25 °C).
- K is the Boltzmann constant (1.38 × 10⁻²³ J/K).
- m is an experimental adjustment factor (typically close to 2).
- R is the resistance of the thermistor in ohms (Ω).
- A, B, and C are Steinhart–Hart coefficients [22], which are characteristics specific to the bulk semiconductor material over a given temperature range of interest or sensor-specific empirical coefficients obtained by calibration.
- T0 is a reference temperature (usually 25 °C or 298.15 °K).
- R0 is the resistance of the thermistor at T0.
- β is the Beta coefficient of the thermistor (typical between 3000 K and 5000 K).
- Active Mode:
- Full working condition;
- BLE transmission of nominal current around 5.3 mA.
- Sleep Mode:
- Fast wake-up;
- Reduced current consumption in a small μA range.
- System OFF Mode:
- Completely off;
- Nearly zero current, consuming only 0.3 μA.
- Measurement range: About −40 °C to +85 °C, which is sufficient for extreme environments.
- Resolution: Typically 0.25 °C for a configuration of the 12-bit Analog Digital Converter (ADC).
- Accuracy: Typically ±1 °C under normal operating conditions.
- Low power: Designed to be highly efficient, it allows for the occasional measurement without a significant impact on the overall consumption of the device.
2.2. Relevant Research
3. Materials and Methods
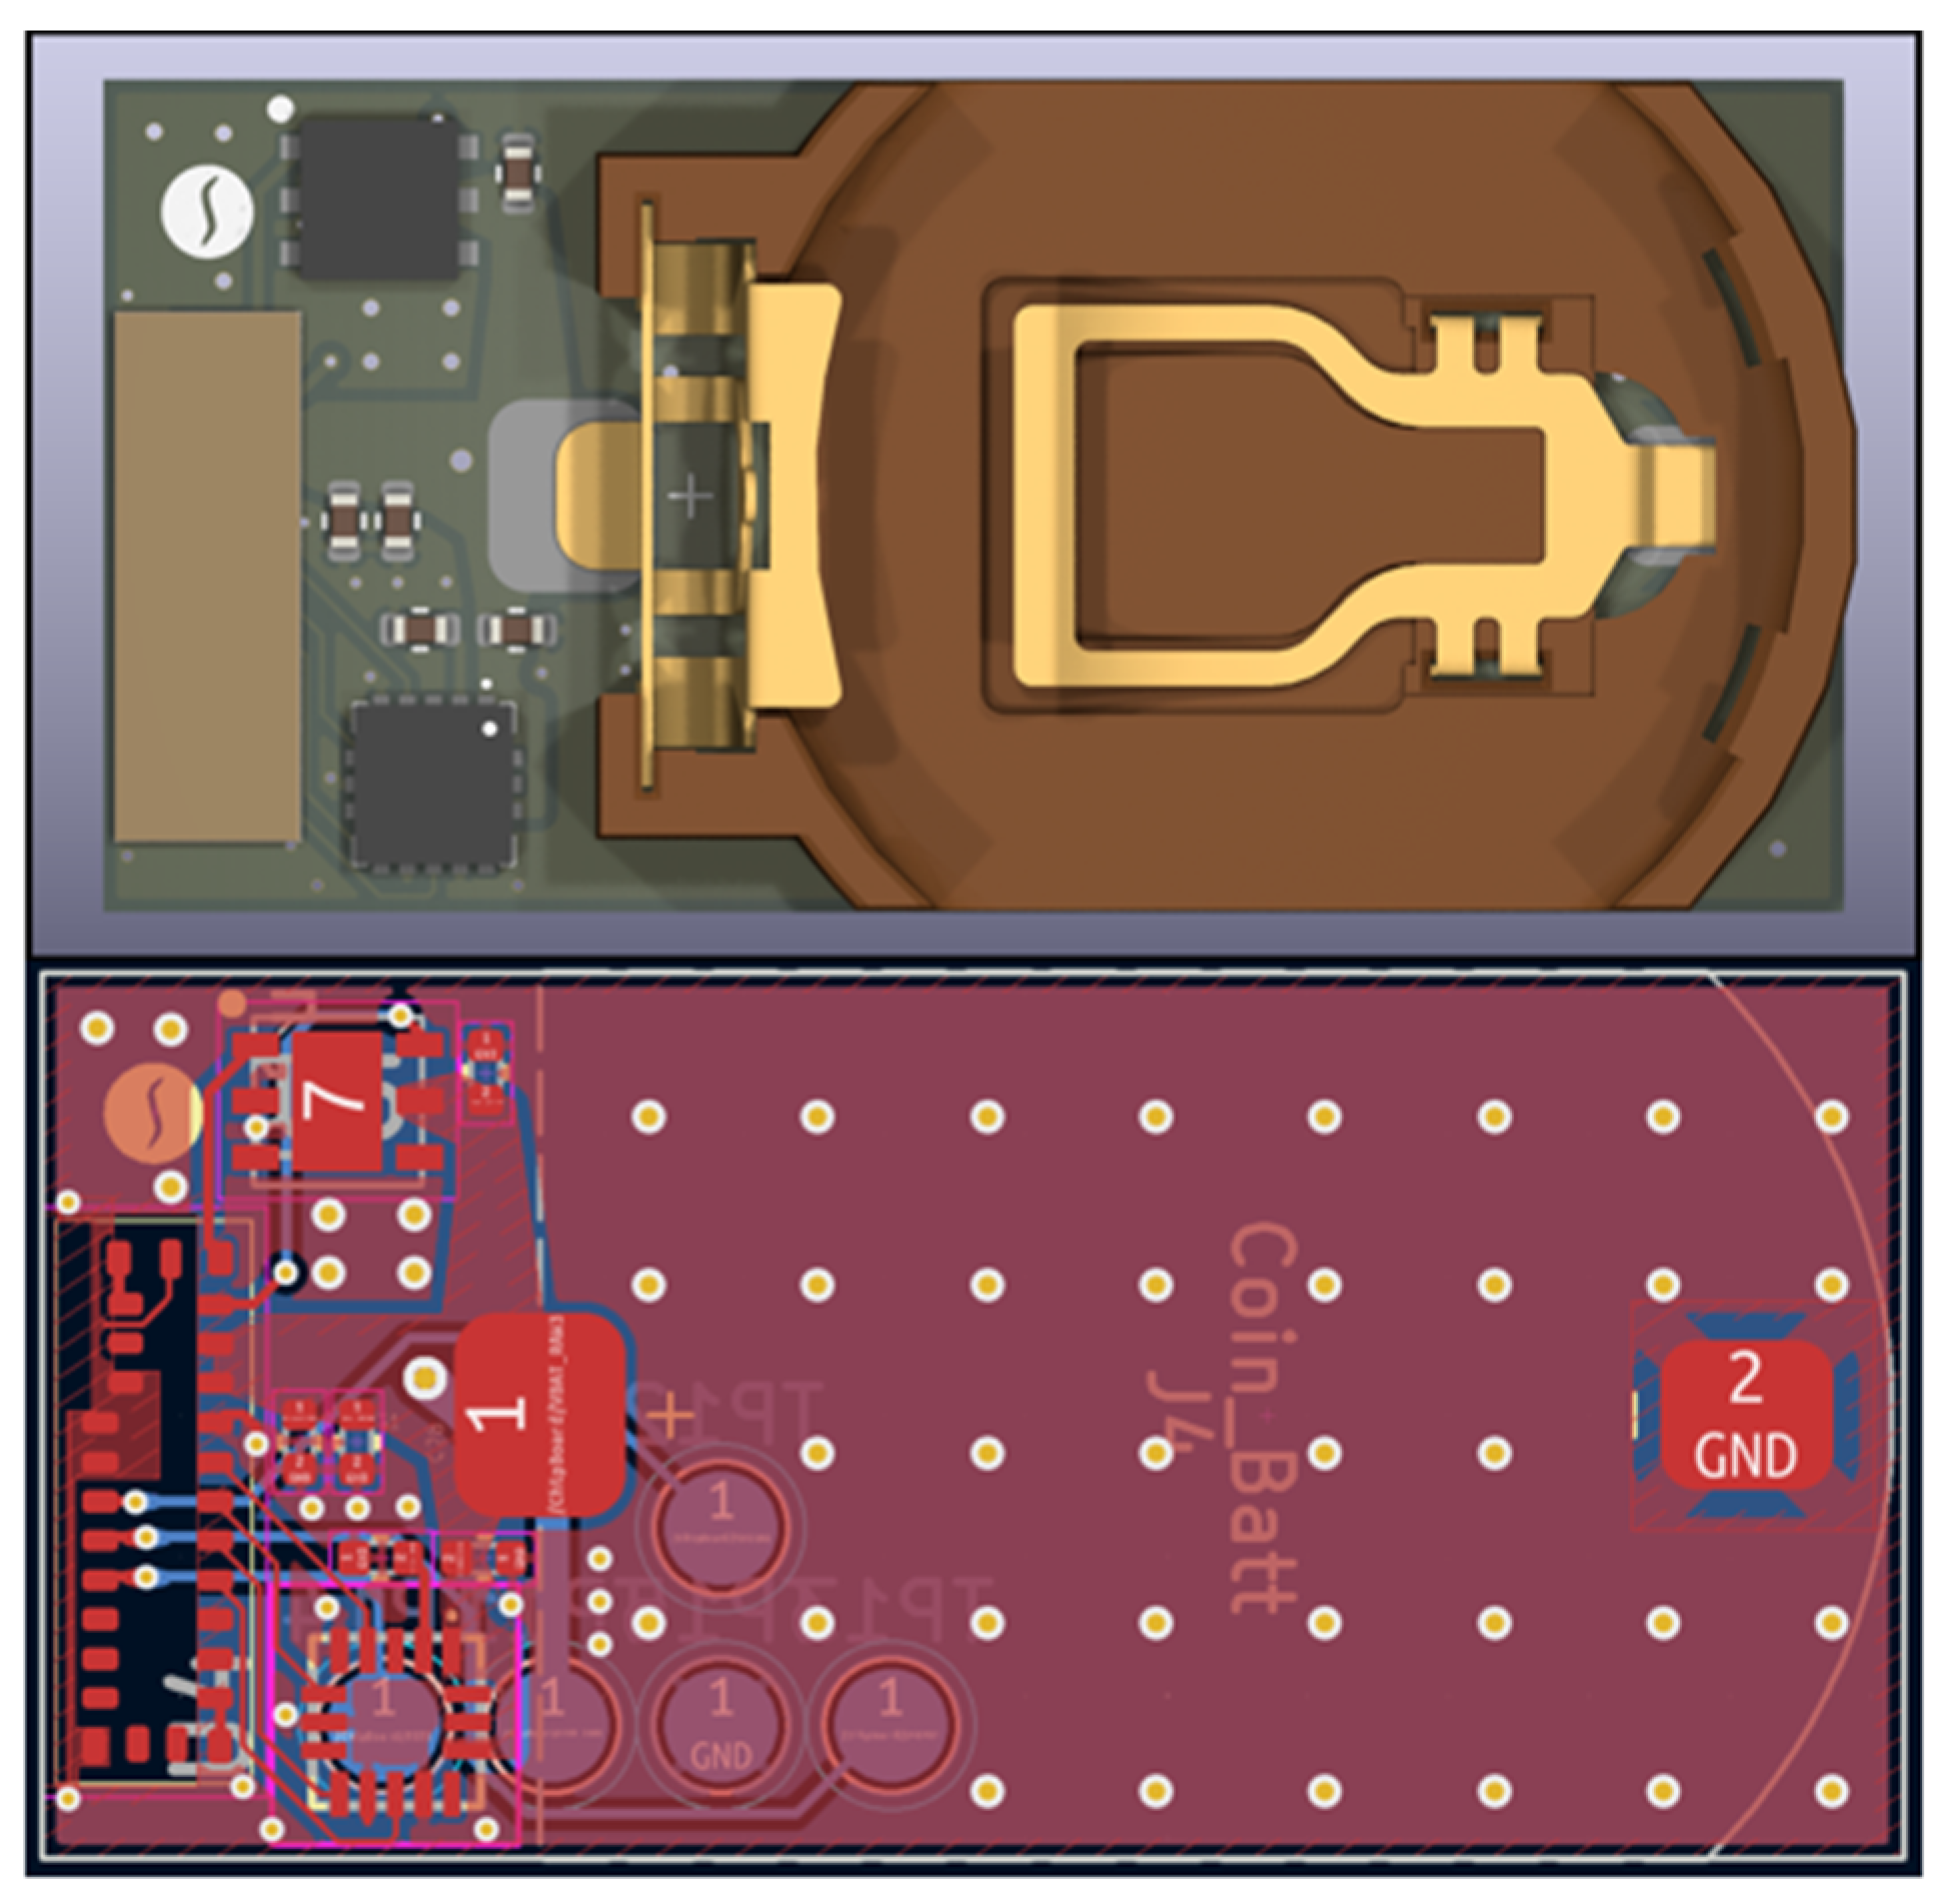
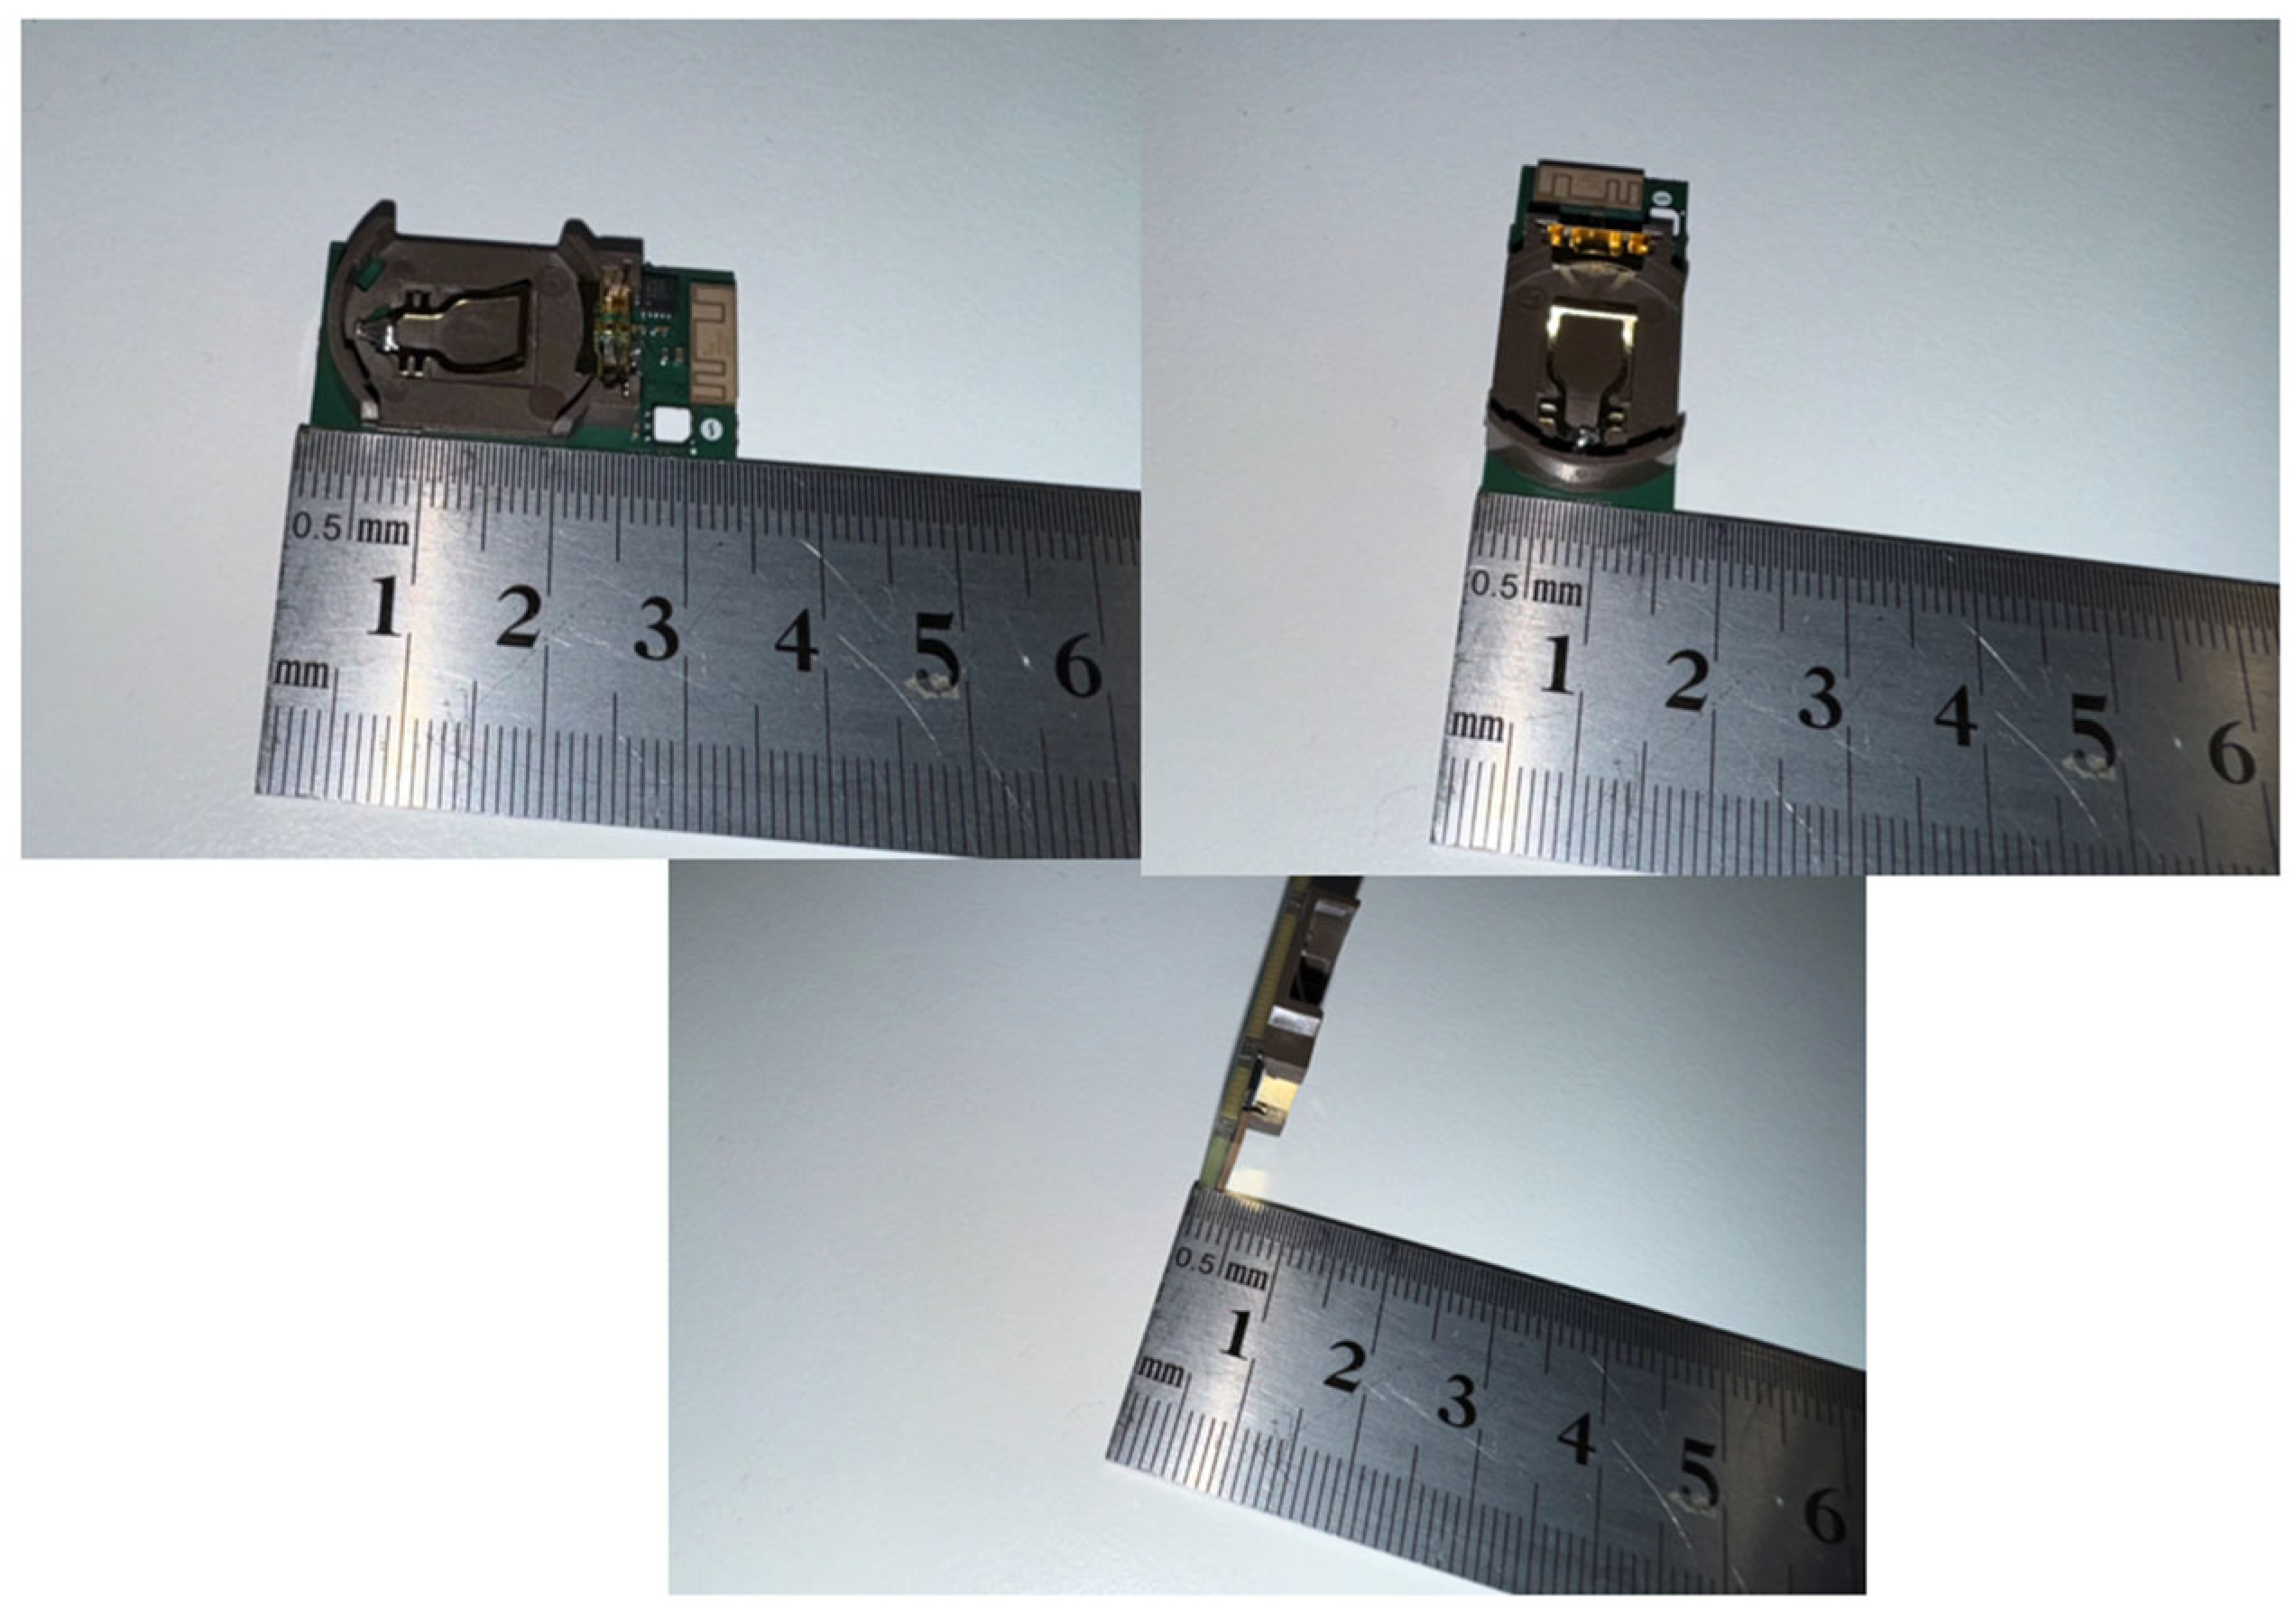
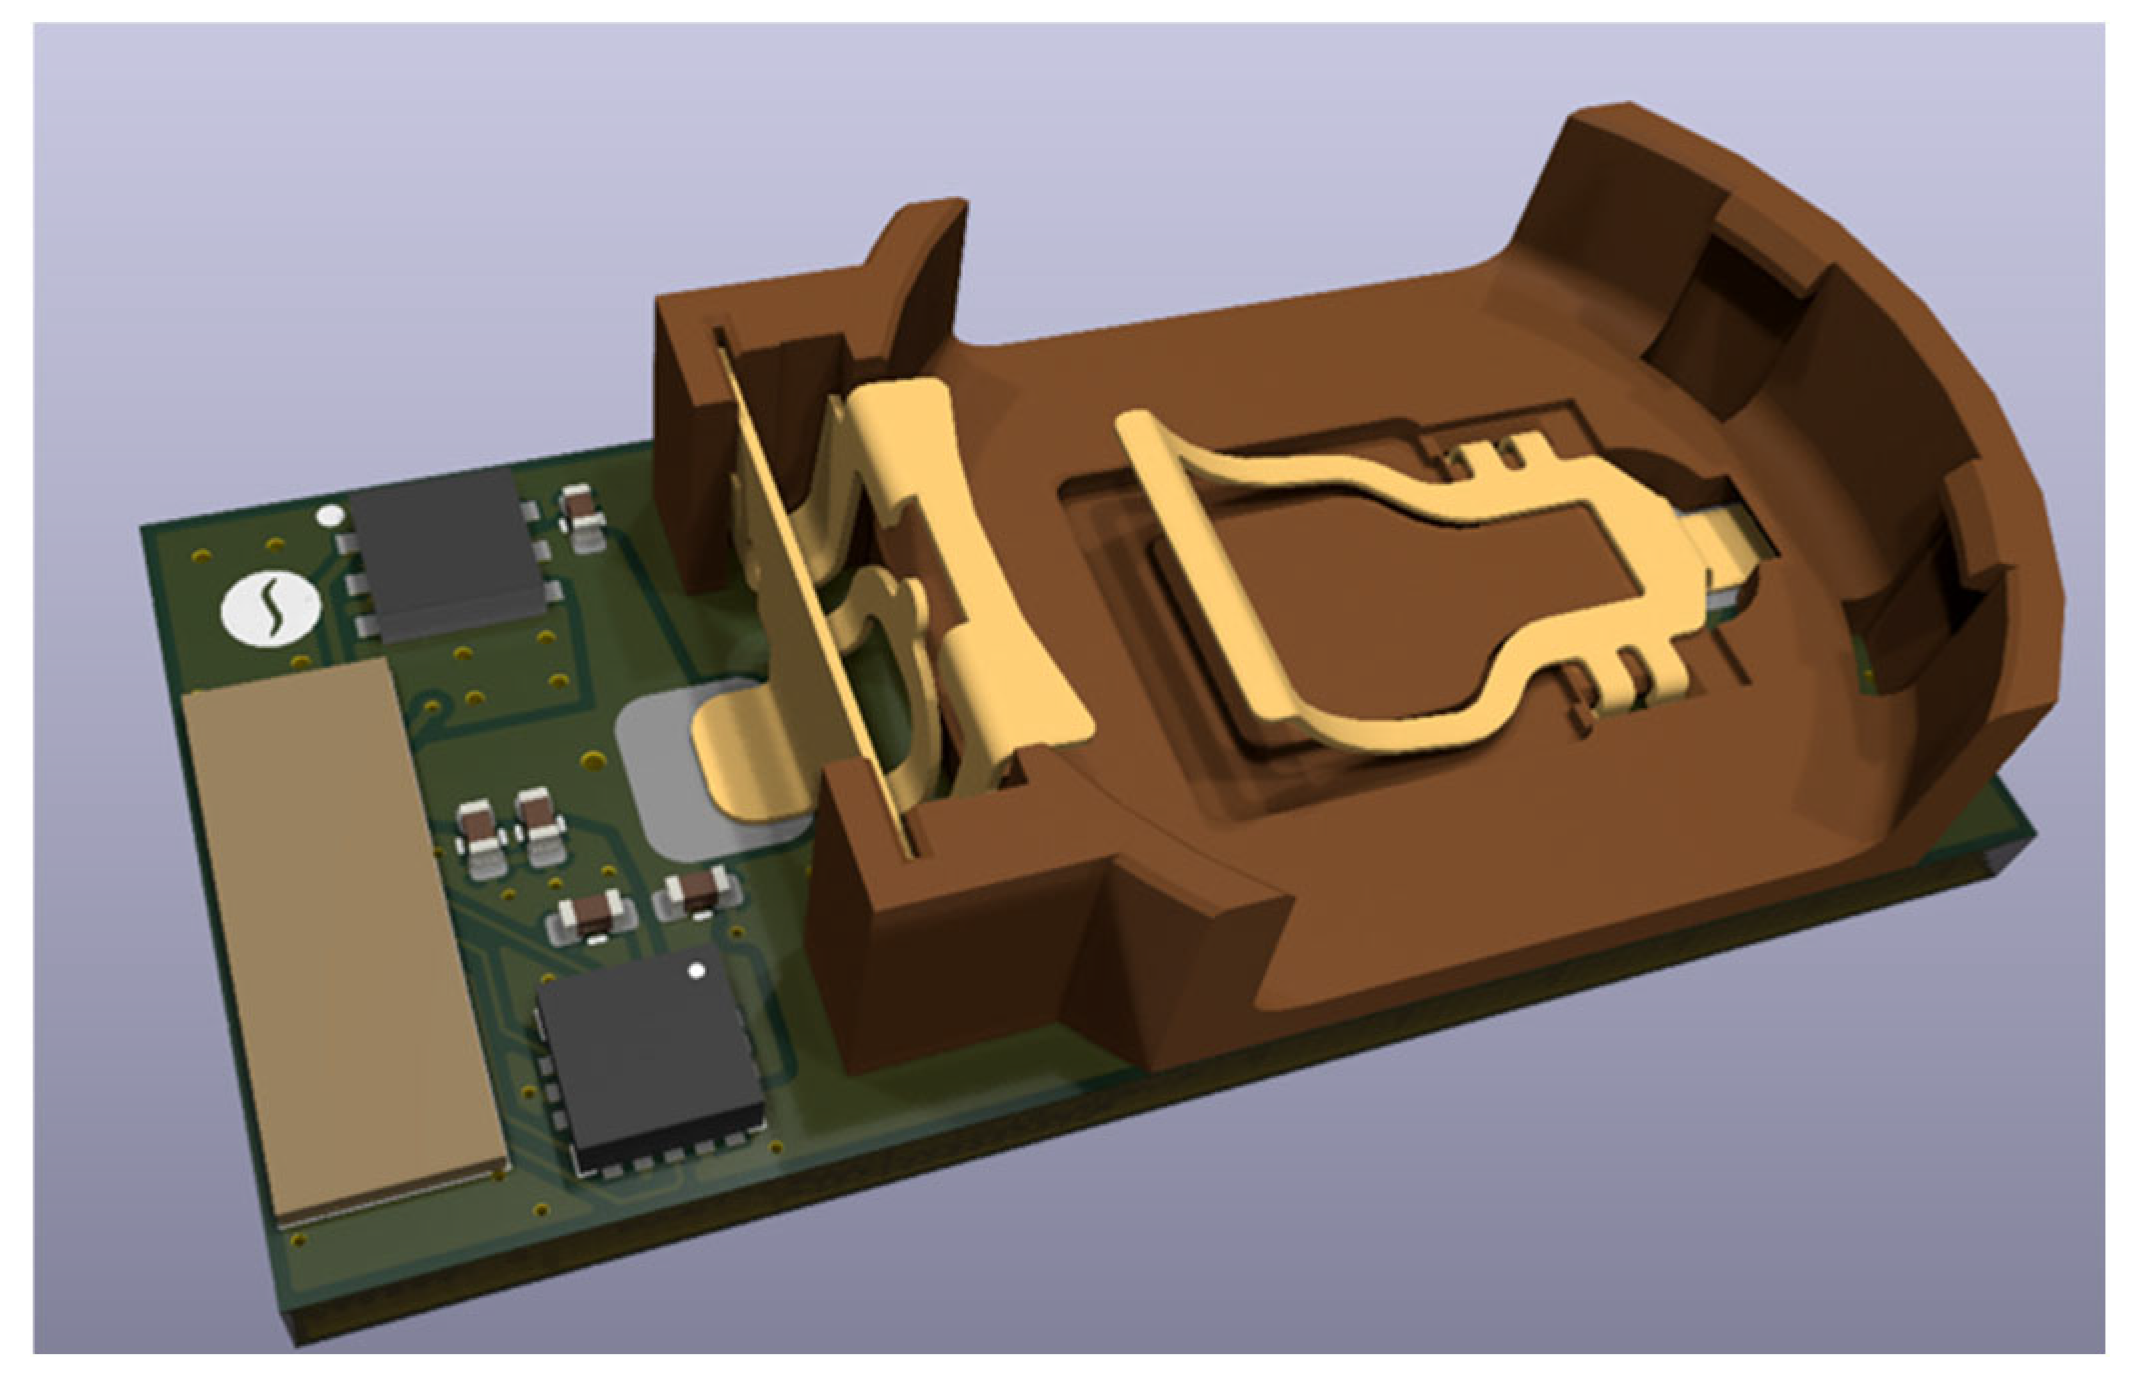
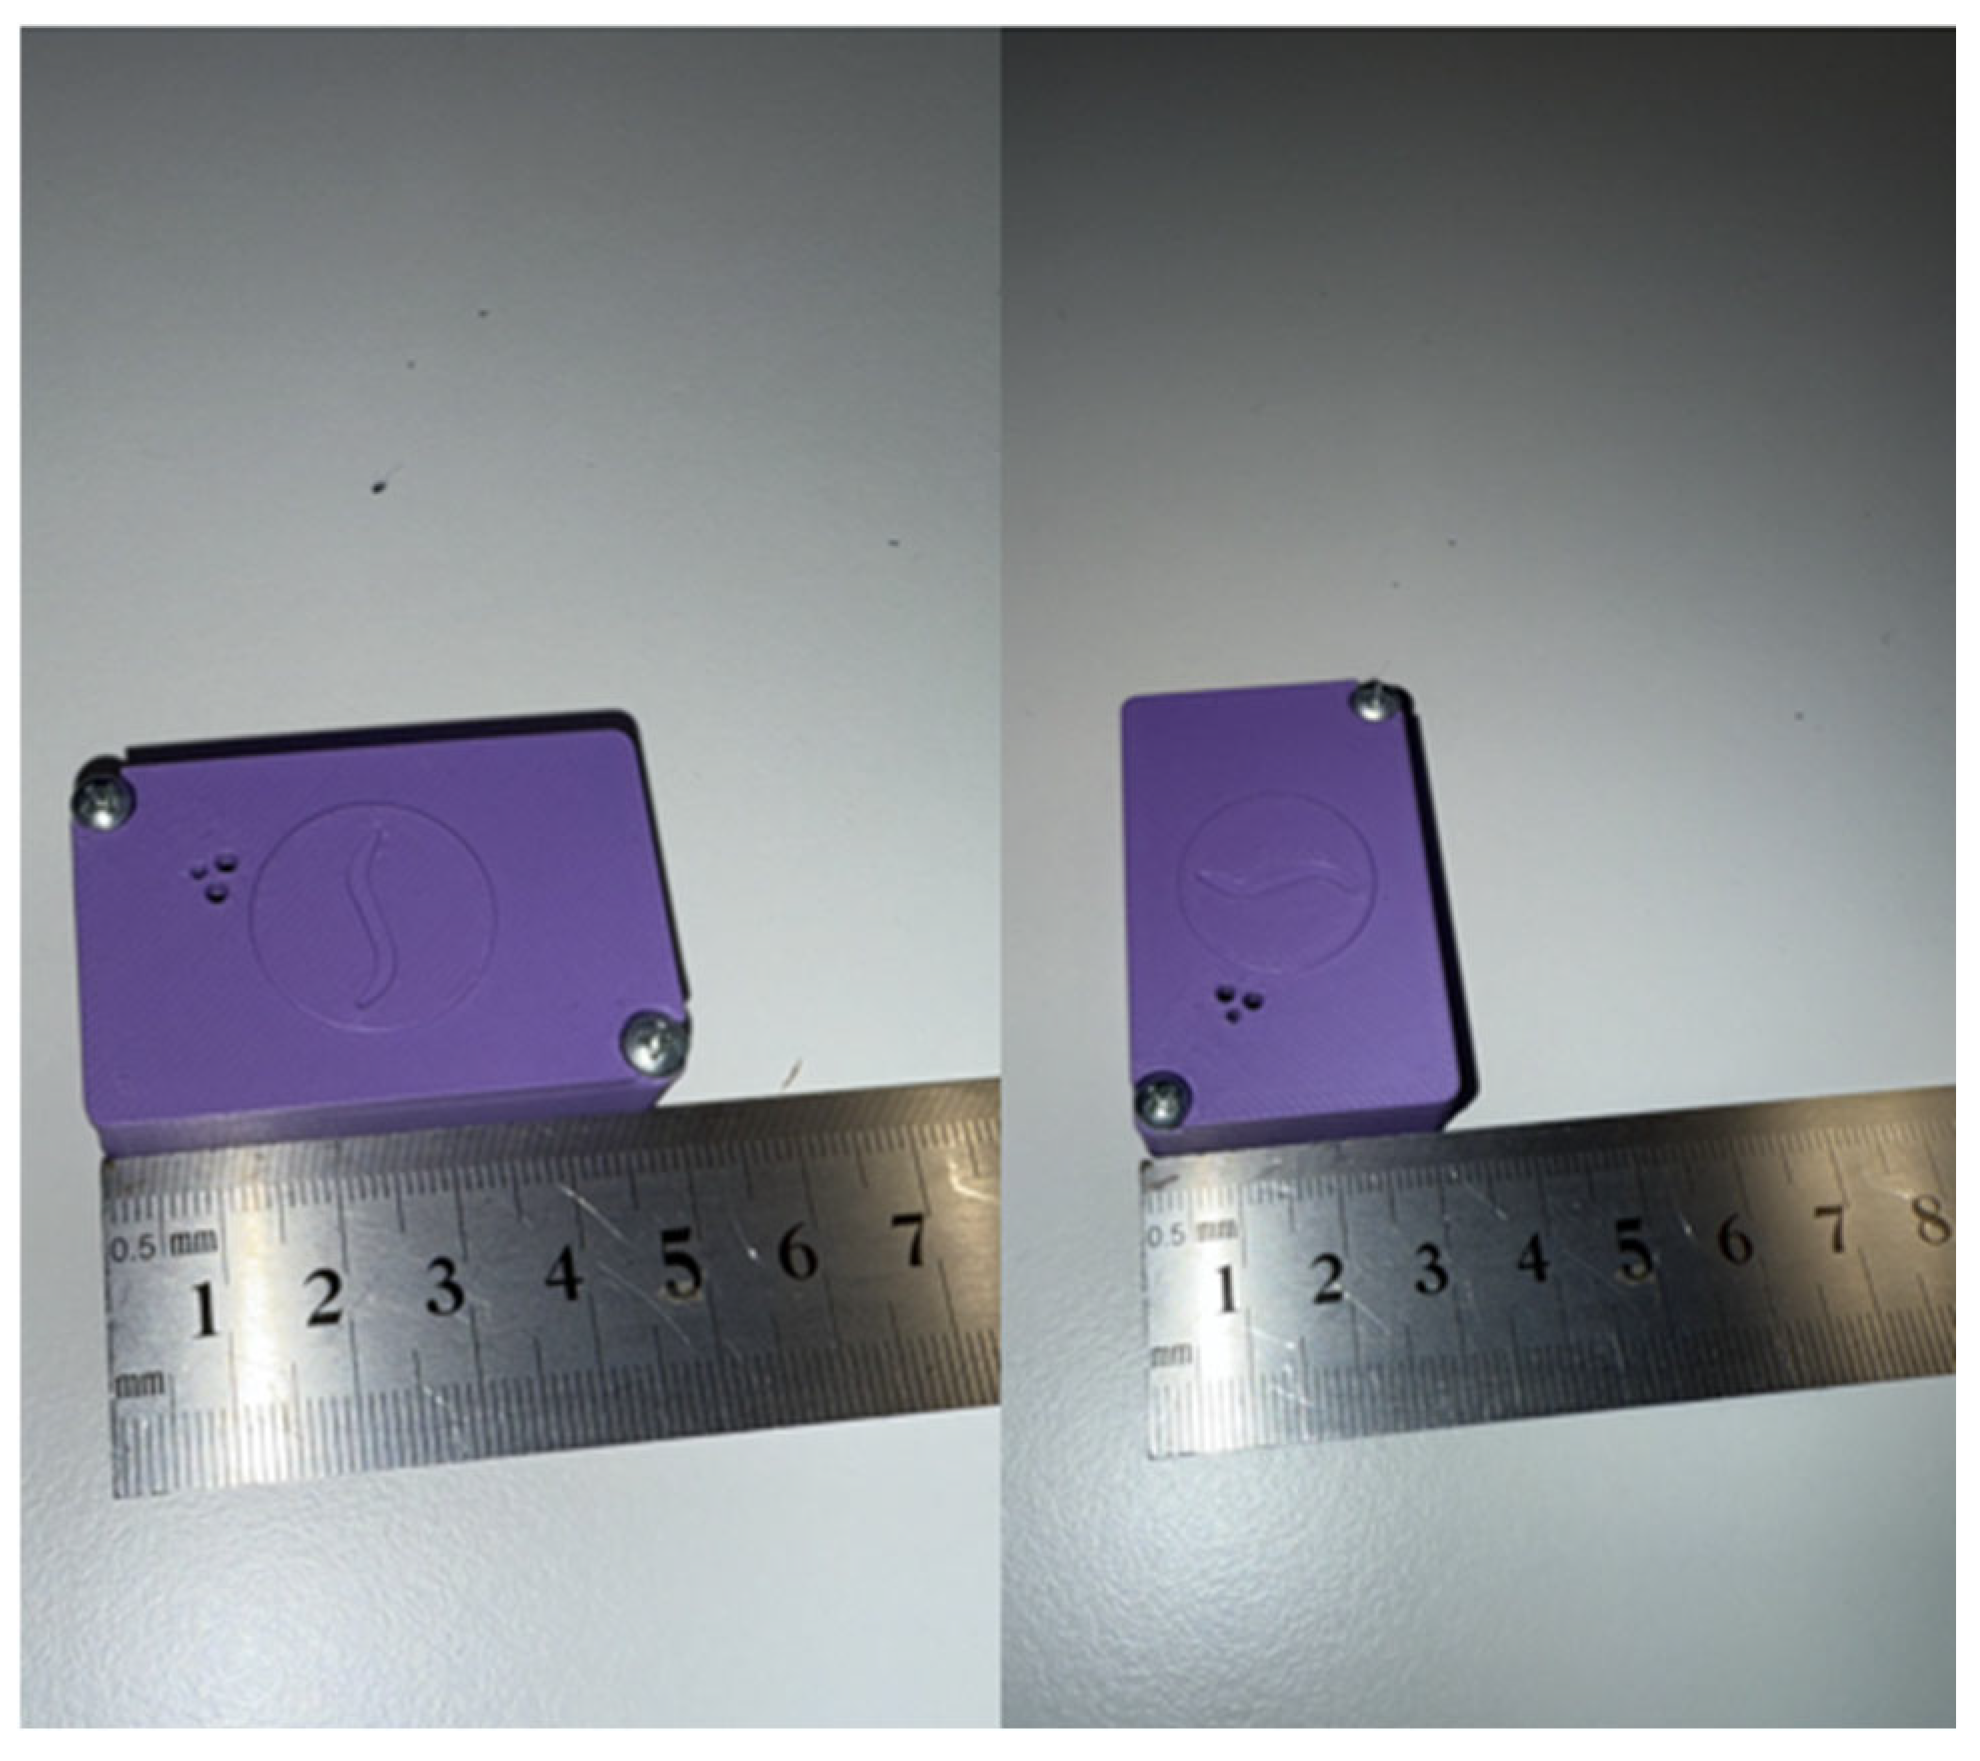
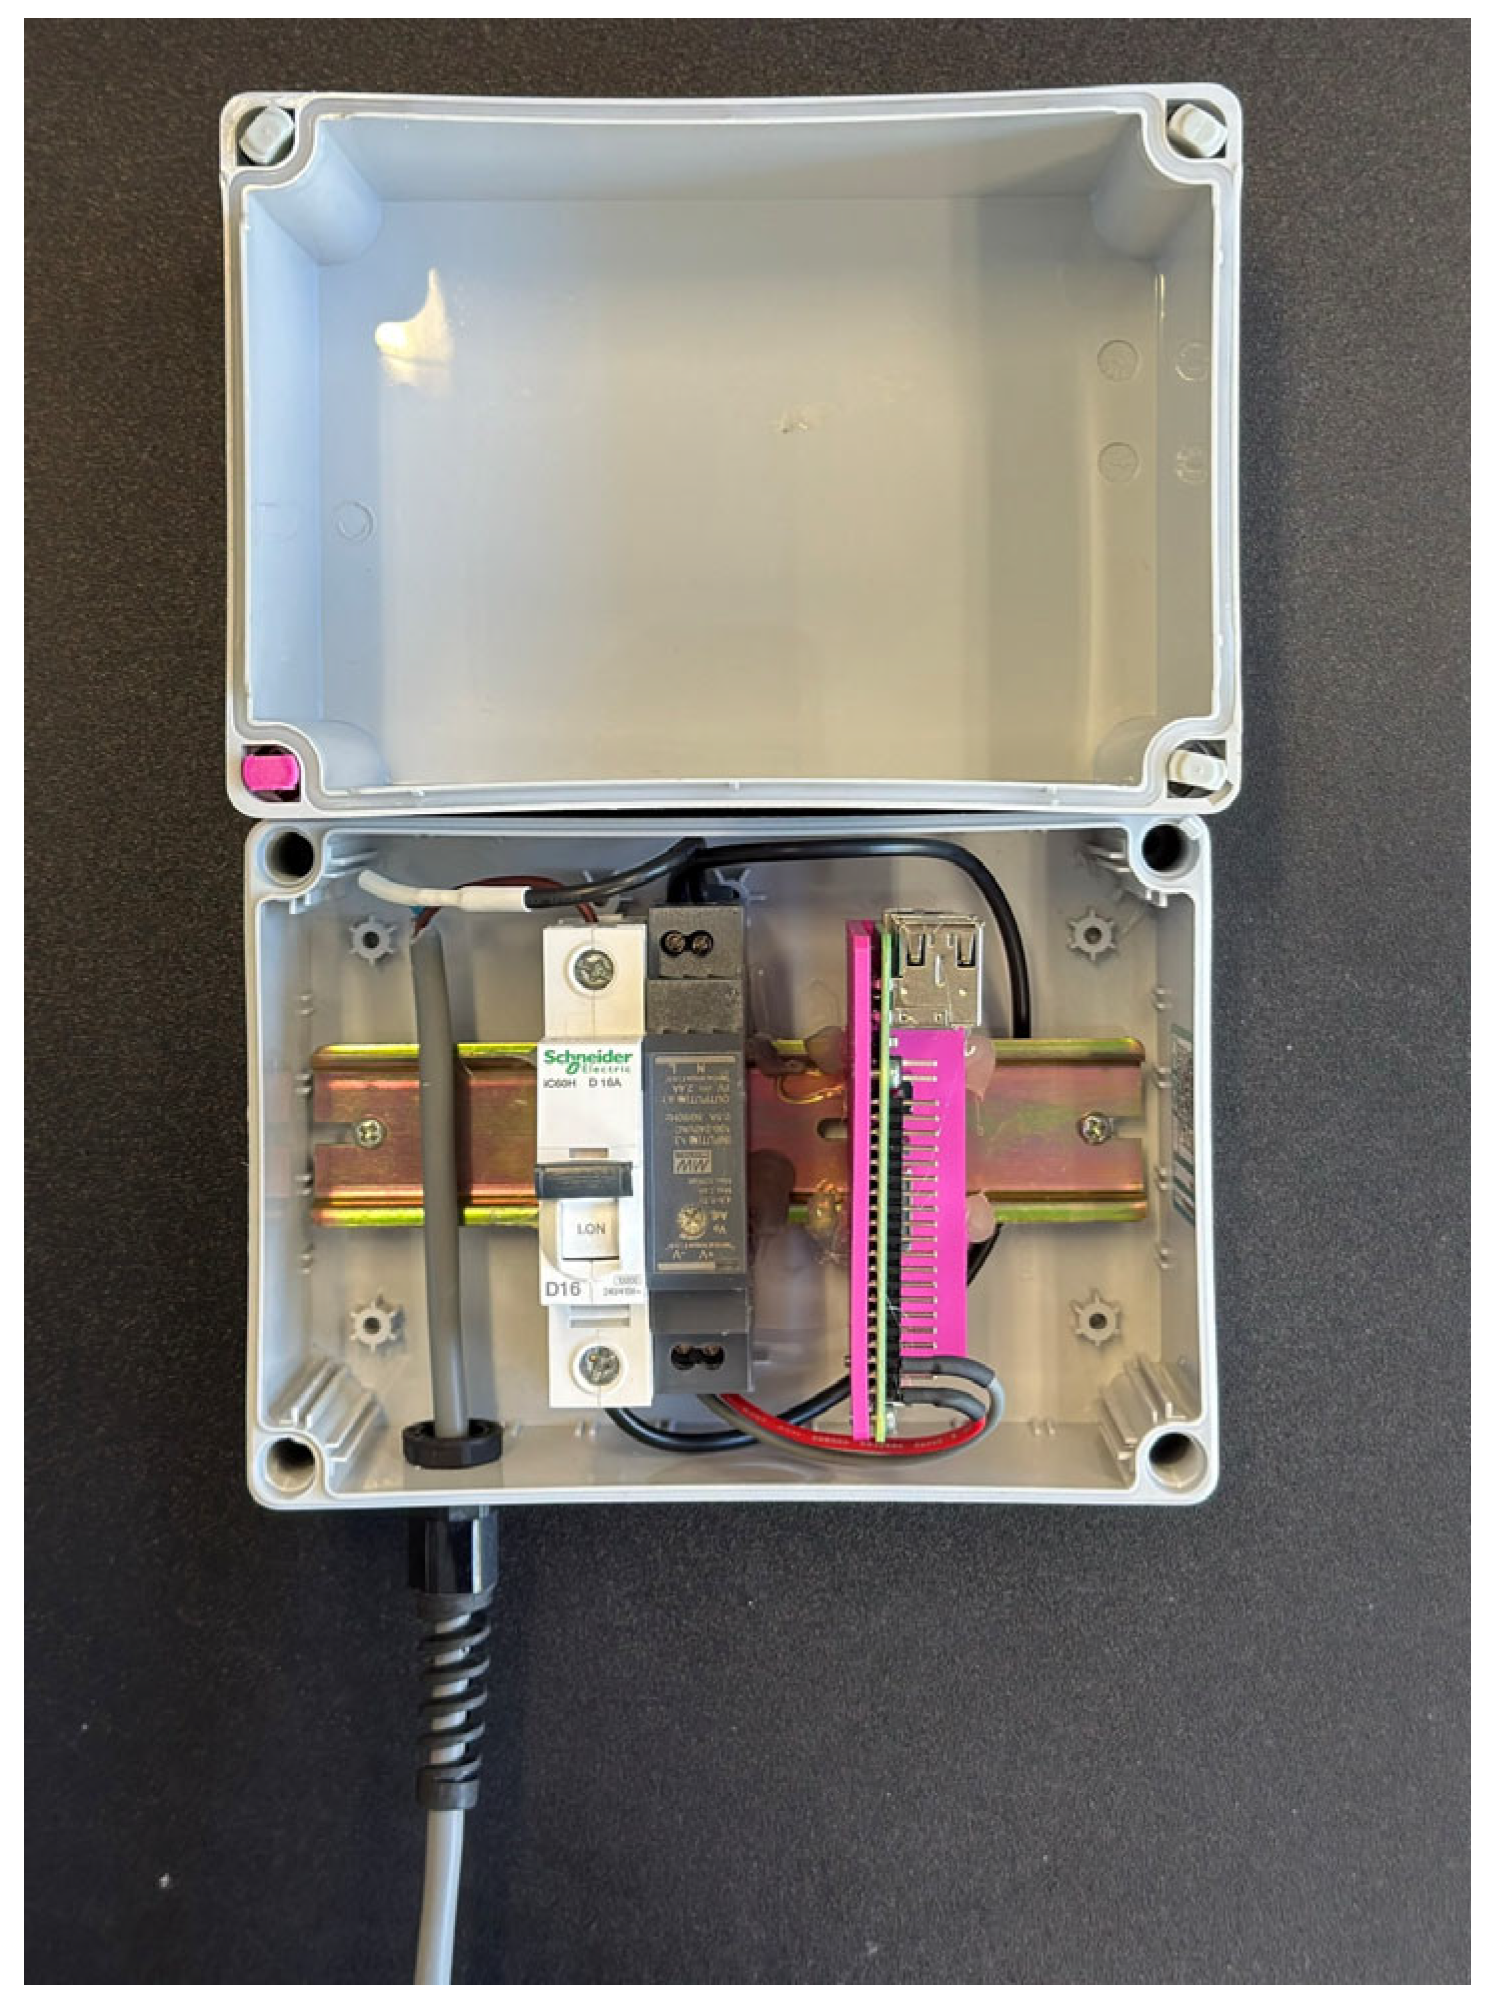
3.1. System Implementation and Hardware Setup
3.2. Hardware Integration
3.3. Algorithms Developed
| Algorithm 1: IoT-Temp Node. |
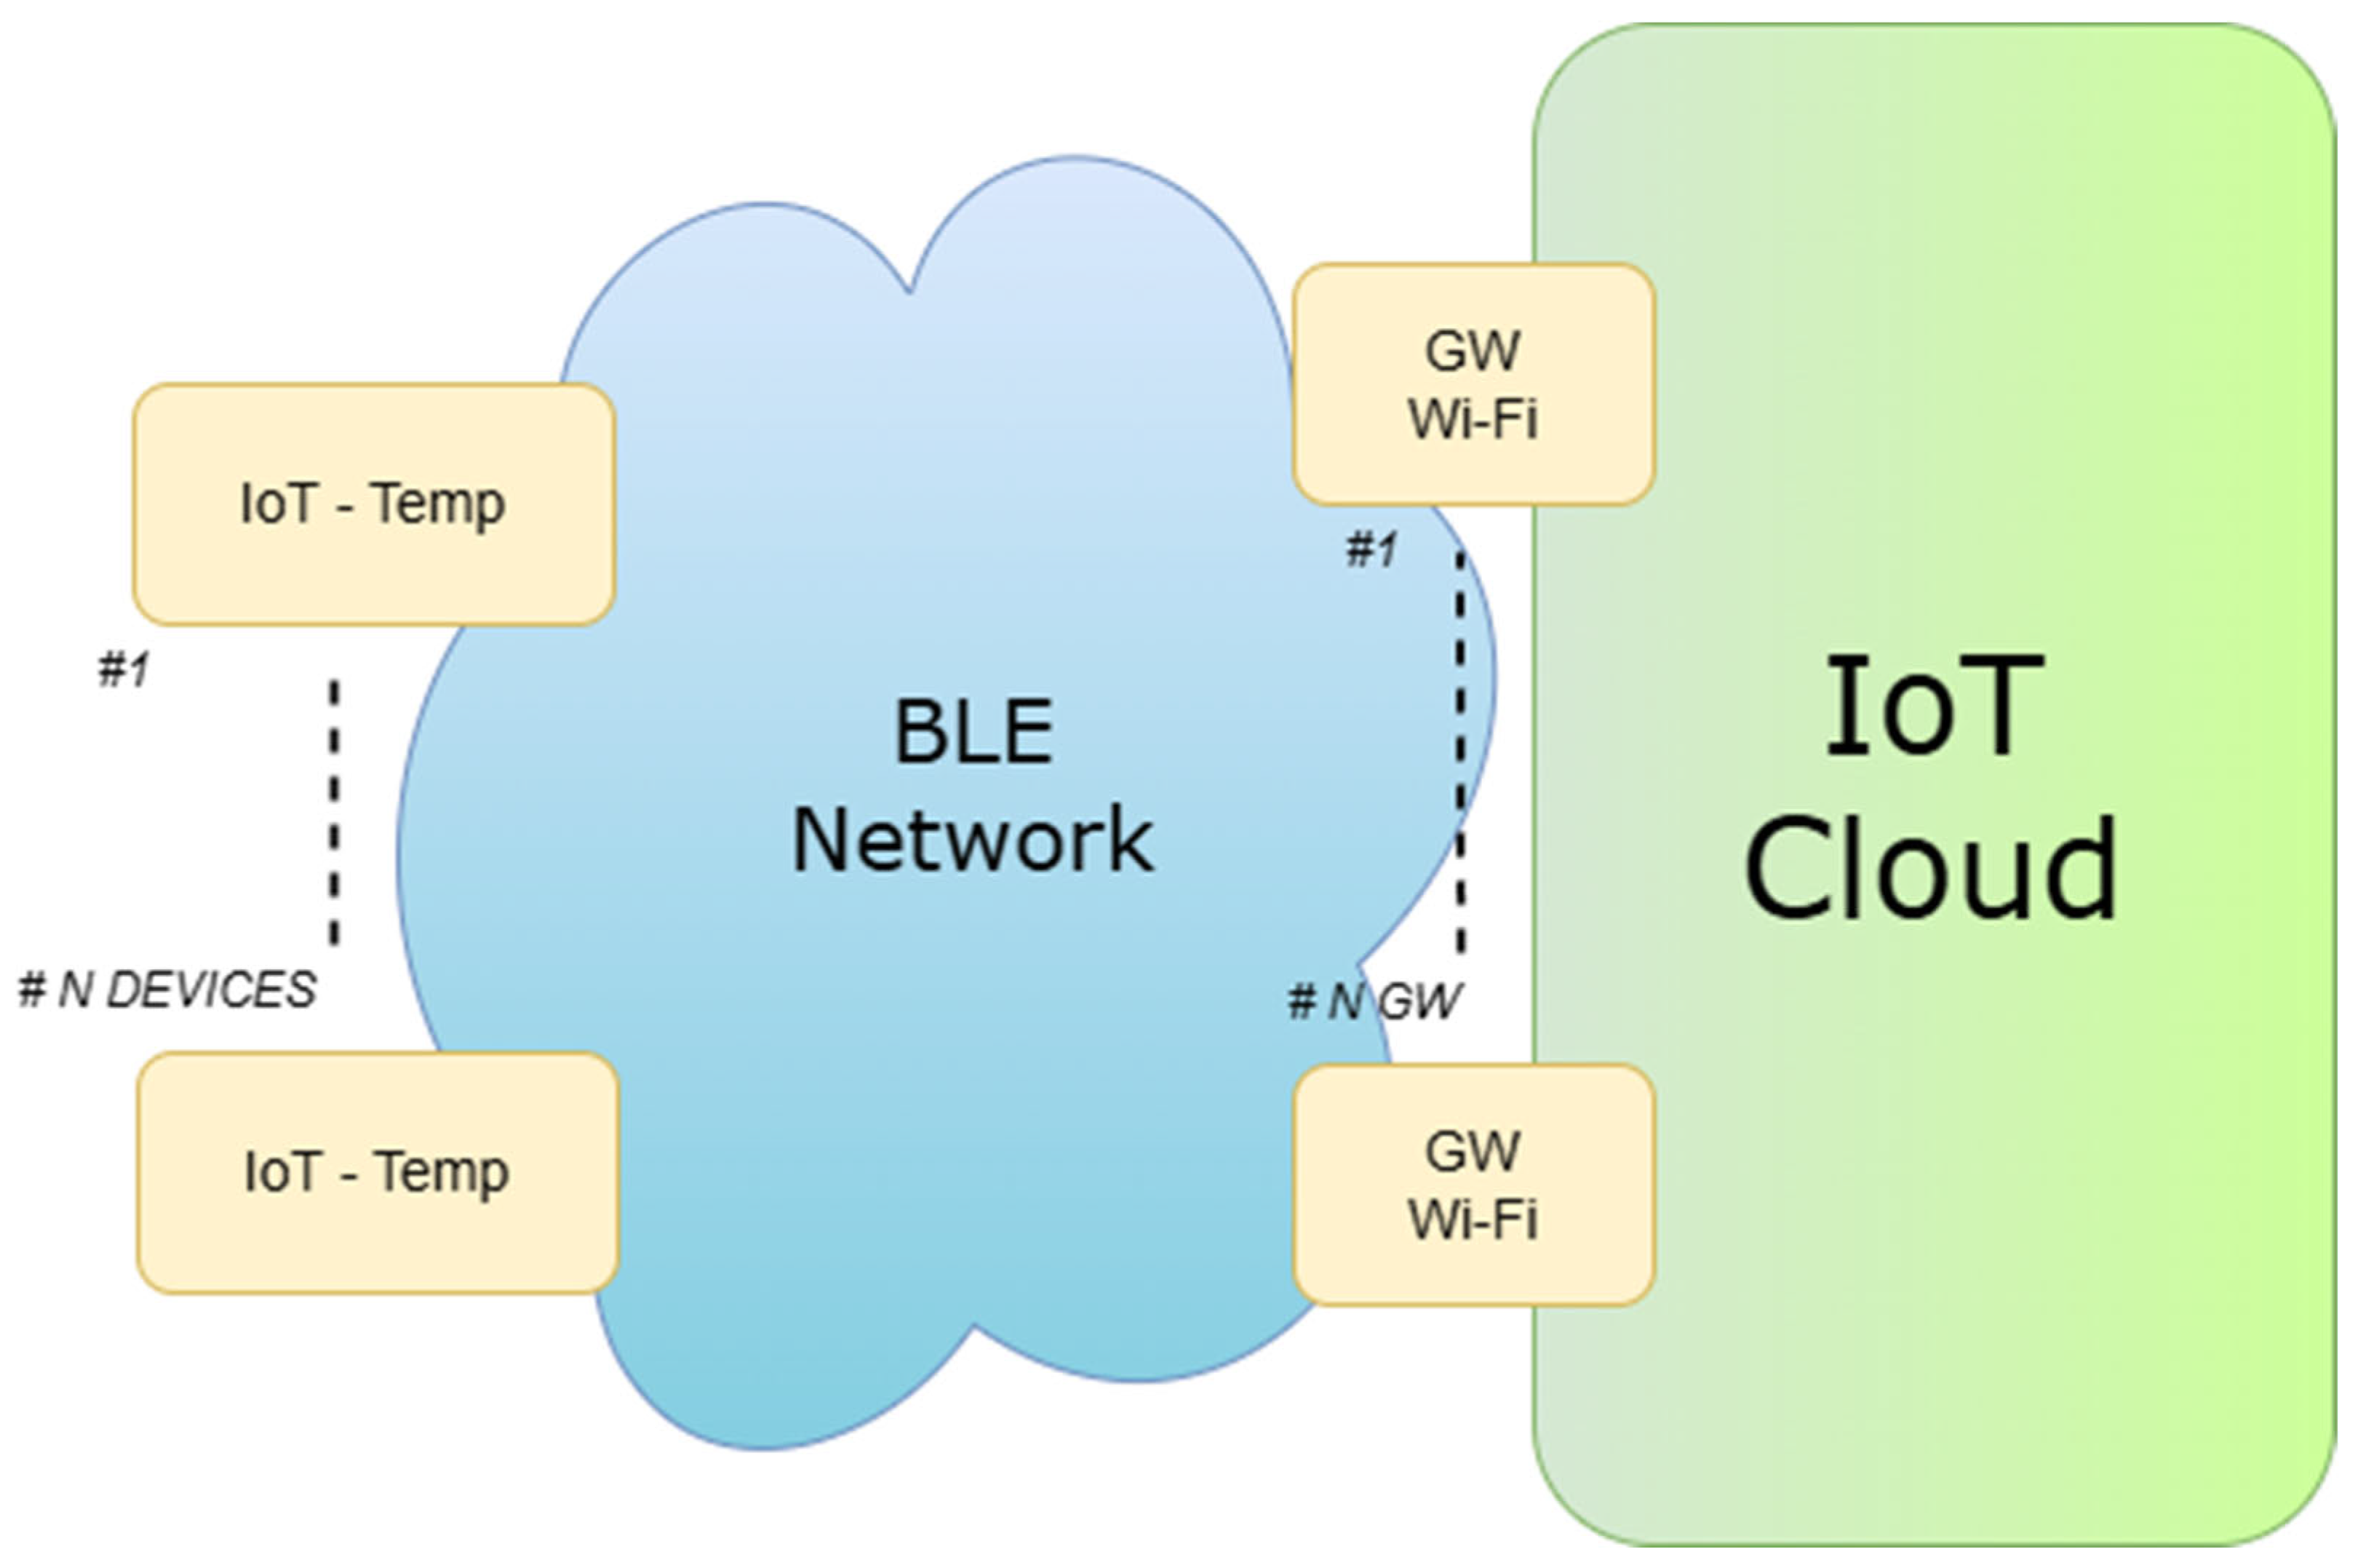
| 1. Initialize HY0020 SoC. 2. Initialize BLE. 3. Create Thread for Composing Data Message. 4. Initialize Temp. and Humidity Internal Sensor. 5. Initialize Temp. and Humidity External Sensor. 6. Attempt to Read Value from Internal Sensor. 7. Attempt to Read Value from External Sensor. 7.1 If fail: 7.1.1 Repeat Read for 3 times 7.1.2 If still fails, ignore the external sensor values and continue with the data available 7.2 If reading is successful: add internal and external data to message 8. Search Valid Gateway to Send to 8.1 If no gateway is found, sleep for 15 min, then restart from 4. 8.2 If there is gateway: Send the message to the cloud via BLE. 9. Interrupt BLE connection. 10. Go to sleep for 5 min. 11. Go back to step 4. |
3.4. Test Scenarios
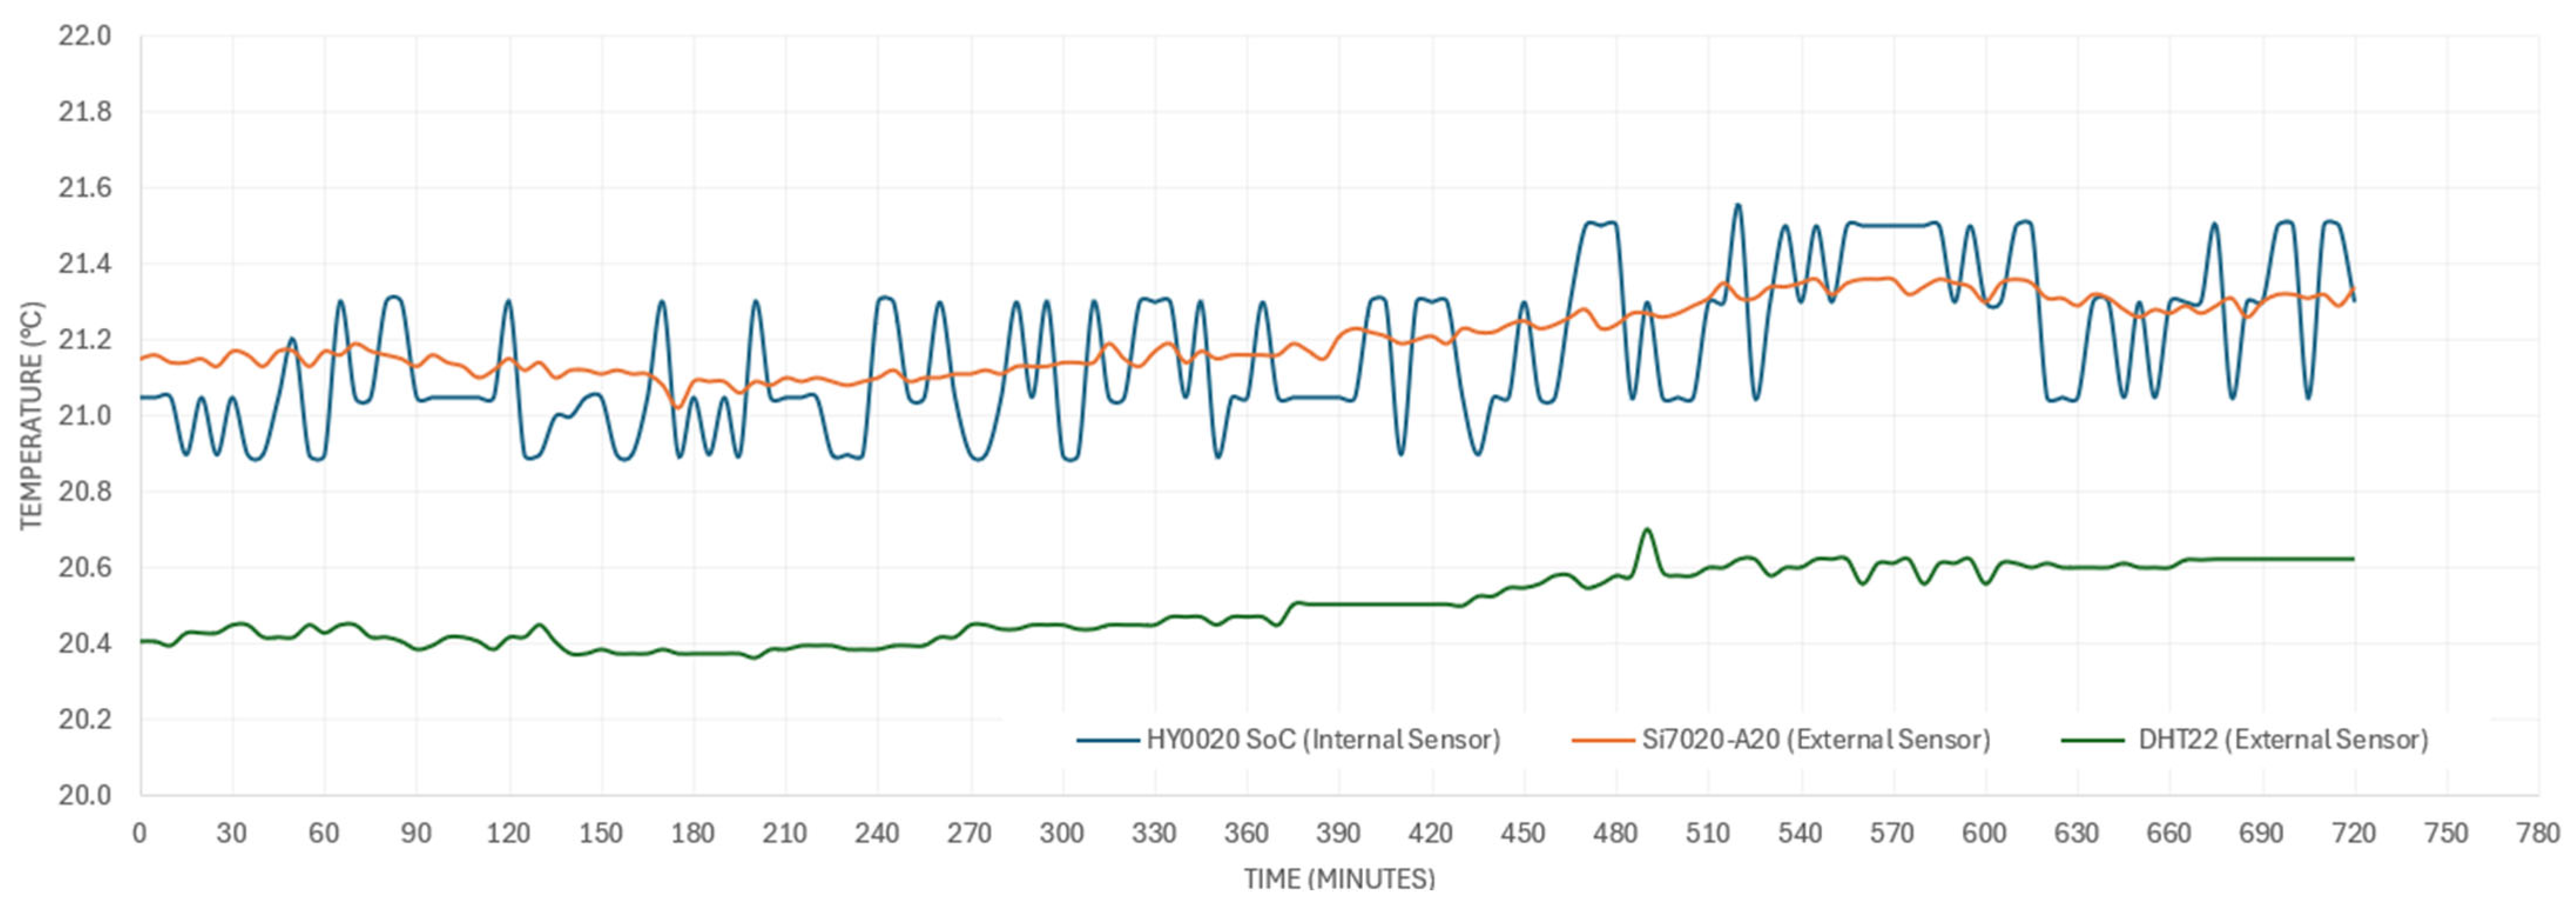
4. Results
4.1. Experiment Scenarios
4.2. Energy Consumption
5. Conclusions
Author Contributions
Funding
Data Availability Statement
Acknowledgments
Conflicts of Interest
References
- FAO. Food Loss and Waste Reduction; FAO: Rome, Italy, 2021. [Google Scholar]
- WHO. Temperature Monitoring in the Vaccine Supply Chain; WHO: Geneva, Switzerland, 2022. [Google Scholar]
- UNDP. Sustainable Cold Chain for Food and Medicine; UNDP: New York, NY, USA, 2023. [Google Scholar]
- UNEP. Sustainable Production and Consumption Patterns; UNEP: Nairobi, Kenya, 2020. [Google Scholar]
- WEF. The Future of Smart Logistics and Industry 4.0; WEF: Geneva, Switzerland, 2021. [Google Scholar]
- IPCC. Climate Change and Food Systems; IPCC: Geneva, Switzerland, 2019. [Google Scholar]
- UNFCCC. Reducing Carbon Footprint in Global Supply Chains; UNFCCC: Bonn, Germany, 2022. [Google Scholar]
- DPP Portal. About Digital Product Passport. Available online: https://psqr.eu/publications-resources/all-about-dpp/ (accessed on 2 April 2025).
- European Comission. Available online: https://cirpassproject.eu/wp-content/uploads/2024/03/A2-EC-Michele-Galatola.pdf (accessed on 20 March 2025).
- HY0020. Available online: https://www.fdk.com/cyber-e/electronic_components/module/hy0020.html (accessed on 22 January 2025).
- Nordic. Available online: https://www.nordicsemi.com/ (accessed on 10 February 2025).
- Silicon Labs. Available online: https://www.silabs.com/sensors/humidity/si7006-13-20-21-34/device.si7020-a20-im?tab=specs (accessed on 2 February 2025).
- Adafruit. Available online: https://www.adafruit.com/product/385 (accessed on 5 March 2025).
- Raspberry Pi. Available online: https://www.raspberrypi.com/products/raspberry-pi-4-model-b/specifications/ (accessed on 1 March 2025).
- Understanding and Interpreting Standard-Logic Data Sheets; Application Report SNOAA25; Texas Instruments: Dallas, TX, USA, 2004; Available online: https://www.ti.com/lit/ab/snoaa25/snoaa25.pdf (accessed on 9 June 2025).
- Analog Devices. Chapter 7: Temperature Sensors in Industrial Applications. In Temperature Sensors—A Tutorial for Engineers; Analog Devices: Norwood, MA, USA; Available online: https://www.analog.com/media/en/training-seminars/design-handbooks/temperature_sensors_chapter7.pdf (accessed on 5 June 2025).
- Tsividis, Y. Operation and Modeling of the MOS Transistor, 2nd ed.; The Oxford Series in Electrical and Computer Engineering; Oxford University Press: New York, NY, USA, 1999; ISBN 978-0-19-517014-6. [Google Scholar]
- Carusone, T.C.; Johns, D.A.; Martin, K.W. Analog Integrated Circuit Design, 2nd ed.; Wiley: Hoboken, NJ, USA, 2011; ISBN 978-0-470-77010-4. [Google Scholar]
- Jingwen, M.; Tingqian, C.; Cheng, C.; Junyan, R.; Li, Y. CMOS 1.5V bandgap voltage reference. In Proceedings of the 2005 6th International Conference on ASIC, Shanghai, China, 24–27 October 2005; pp. 469–472. [Google Scholar] [CrossRef]
- Nordic Semiconductor. nRF52 Series Reference Manual; Nordic Semiconductor: Oslo, Norway, 2021; Available online: https://www.nordicsemi.com/ (accessed on 1 June 2025).
- Maxim Integrated. Temperature Sensors in Microelectronics; Maxim Integrated: San Jose, CA, USA, 2019; Available online: https://www.maximintegrated.com (accessed on 2 June 2025).
- Steinhart, J.S.; Hart, S.R. Calibration Curves for Thermistors. Deep Sea Res. Oceanogr. Abstr. 1968, 15, 497–503. [Google Scholar] [CrossRef]
- Chen, C. Evaluation of Resistance–Temperature Calibration Equations for NTC Thermistors. Measurement 2009, 42, 1103–1111. [Google Scholar] [CrossRef]
- Murata Manufacturing. NTC Thermistors: Applications and Design Considerations; Murata Manufacturing: Kyoto, Japan, 2020; Available online: https://www.murata.com/en-global/products/thermistor/index/documents/applicationmanual (accessed on 2 June 2025).
- Vishay. NTC Thermistors: Theory and Application; Vishay Intertechnology: Malvern, PA, USA, 2018; Available online: https://www.vishay.com/en/thermistors/ntc/ (accessed on 2 June 2025).
- FDK Corporation. Available online: https://www.fdk.com/ (accessed on 10 March 2025).
- Prosper, J. Smart Thermal Monitoring Systems: IoT-Enabled Temperature Sensing for Rotating Equipment. 2025. Available online: https://www.researchgate.net/publication/390233231_Smart_Thermal_Monitoring_Systems_IoT-Enabled_Temperature_Sensing_for_Rotating_Equipment_1 (accessed on 19 May 2025).
- Ettahri, O.; Oukaira, A.; Ali, M.; Hassan, A.; Nabavi, M.; Savaria, Y.; Lakhssassi, A. A Real-Time Thermal Monitoring System Intended for Embedded Sensors Interfaces. Sensors 2020, 20, 5657. [Google Scholar] [CrossRef] [PubMed]
- Gabel, E. Optimizing Urban Climate with Real-Time Temperature Control Systems in Smart Cities. IoT For All. Last Updated: 2 December 2024. Available online: https://www.iotforall.com/optimizing-urban-climate-with-real-time-temperature-control-systems-in-smart-cities (accessed on 19 May 2025).
- Malits, M.; Brouk, I.; Nemirovsky, Y. Study of CMOS-SOI Integrated Temperature Sensing Circuits for On-Chip Temperature Monitoring. Sensors 2018, 18, 1629. [Google Scholar] [CrossRef] [PubMed]
- Lisboa, Y.; Santos, L.; Lobato, E.; Fonseca, W.; Silva, K.; Rodrigues, I.; Silva, M. Design and Implementation of a Sustainable IoT Embedded System for Monitoring Temperature and Humidity in Photovoltaic Power Plants in the Amazon. Sustainability 2025, 17, 2347. [Google Scholar] [CrossRef]
- Resquites, J.; Parrocho, M.; Vinegas, N.; Oquiño, V. IoT-Based Temperature Monitoring and Automatic Fan Control Using ESP32. Iconic Res. Eng. J. 2023, 7, 35–44. [Google Scholar]
- Texas Instruments. LM35 Precision Centigrade Temperature Sensor. Datasheet. 2016. Available online: https://www.ti.com/lit/ds/symlink/lm35.pdf (accessed on 1 June 2025).
- Texas Instruments. TMP117: High-Accuracy, I2C Temperature Sensor. Datasheet. 2020. Available online: https://www.ti.com/lit/ds/symlink/tmp117.pdf (accessed on 1 June 2025).
- Analog Devices (Maxim Integrated). MAX31855 Cold-Junction Compensated Thermocouple-to-Digital Converter. Datasheet. Rev. 4. 2011. Available online: https://www.analog.com/media/en/technical-documentation/data-sheets/MAX31855.pdf (accessed on 1 June 2025).
- Microchip Technology. MCP9700/9700A/9701/9701A—Low-Power Linear Active Thermistor ICs. Datasheet. 2005. Available online: https://ww1.microchip.com/downloads/en/DeviceDoc/21942d.pdf (accessed on 1 June 2025).
- Texas Instruments. HDC2080: Low Power Humidity and Temperature Digital Sensor. Datasheet. 2018. Available online: https://www.ti.com/lit/ds/symlink/hdc2080.pdf (accessed on 1 June 2025).
- Analog Devices. AD590: Two-Terminal Temperature Transducer. Datasheet. Rev. E. 2009. Available online: https://www.analog.com/media/en/technical-documentation/data-sheets/AD590.pdf (accessed on 1 June 2025).
- Sensefinity. Available online: https://www.sensefinity.com/ (accessed on 22 March 2025).
- Espressif Systems. ESP32 Technical Reference Manual, Version 4.4. 2021. Available online: https://www.espressif.com/sites/default/files/documentation/esp32_technical_reference_manual_en.pdf (accessed on 4 June 2025).
- Joulescope. Available online: https://www.joulescope.com/products/js220-joulescope-precision-energy-analyzer (accessed on 22 April 2025).


| Article | Cost | Effectiveness | Low-Power Operation | Power Consumption | Other Important Characteristics |
|---|---|---|---|---|---|
| [32] | Low (Approx. EUR 10–15) | Effective for real-time monitoring and automatic fan control | Moderate | Active Mode: ~160 mA, Sleep Mode: ~10 μA | Focus on automatic fan control, user convenience, and energy efficiency |
| [29] | High (EUR 1000), | Highly effective; uses advanced analytics and machine learning for precise control | Moderate | Varies widely depending on the scale and components used | Suitable for large-scale urban environments; integrates multiple data sources |
| [30] | Moderate (Approx. EUR 50–100) | Highly effective; accurate on-chip temperature measurement | High | Active Mode: ~30 μW | Suitable for analog and mixed-signal designs; no need for calibration |
| [31] | Low (Approx. EUR 20–30) | Effective for monitoring in photovoltaic systems | Moderate | Active Mode: ~160 mA, Sleep Mode: ~10 μA | Focuses on sustainability, remote updates, and centralized data visualization |
| [27] | High (Approx. EUR 500) | Highly effective; accurate and reliable measurements for industrial settings | Moderate | Varies depending on sensor type and communication protocol | Uses various wireless communication protocols; suitable for harsh environments |
| [28] | Moderate (Approx. EUR 50–100) | Effective for real-time temperature monitoring and prediction | High | Active Mode: ~5 mA, Sleep Mode: ~1 μA | Emphasizes predictive algorithms for thermal effects |
| This work | Low (EUR 20) | Highly effective; dual-sensor integration ensures reliability | High | Active Mode: ~5.3 mA, Sleep Mode: ~few μA, System OFF Mode: ~0.3 μA | Cost-effective, real-time monitoring; suitable for tracking systems |
| Sensor | Minimum Voltage (V) | Typical Consumption | Thermal Range (°C) | Observations |
|---|---|---|---|---|
| LM35 [33] | 4–30 | ~60 µA | −55 to 150 | Analog requires ADC |
| TMP117 [34] | ≥1.8 | ~3 µA (sleep), 150 µA (active) | −55 to 150 | Digital; accuracy ±0.1 °C |
| MAX31855 [35] | ≥3 | ~1.5 mA | −200 to 1350 | Only for K thermocouples |
| MCP9700 [36] | 2.3–5.5 | ~6 µA | −40 to 125 | Analog |
| HDC2080 [37] | ≥1.62 | ~0.55 µA (sleep) | −40 to 125 | Temperature and humidity |
| AD590 [38] | ≥4 | 200 µA | −55 to 150 | Current proportional to temperature |
Disclaimer/Publisher’s Note: The statements, opinions and data contained in all publications are solely those of the individual author(s) and contributor(s) and not of MDPI and/or the editor(s). MDPI and/or the editor(s) disclaim responsibility for any injury to people or property resulting from any ideas, methods, instructions or products referred to in the content. |
© 2025 by the authors. Licensee MDPI, Basel, Switzerland. This article is an open access article distributed under the terms and conditions of the Creative Commons Attribution (CC BY) license (https://creativecommons.org/licenses/by/4.0/).
Share and Cite
Pires, L.M.; Figueiredo, J.; Martins, R.; Nascimento, J.; Martins, J. Design and Development of a Low-Power IoT System for Continuous Temperature Monitoring. Designs 2025, 9, 73. https://doi.org/10.3390/designs9030073
Pires LM, Figueiredo J, Martins R, Nascimento J, Martins J. Design and Development of a Low-Power IoT System for Continuous Temperature Monitoring. Designs. 2025; 9(3):73. https://doi.org/10.3390/designs9030073
Chicago/Turabian StylePires, Luis Miguel, João Figueiredo, Ricardo Martins, João Nascimento, and José Martins. 2025. "Design and Development of a Low-Power IoT System for Continuous Temperature Monitoring" Designs 9, no. 3: 73. https://doi.org/10.3390/designs9030073
APA StylePires, L. M., Figueiredo, J., Martins, R., Nascimento, J., & Martins, J. (2025). Design and Development of a Low-Power IoT System for Continuous Temperature Monitoring. Designs, 9(3), 73. https://doi.org/10.3390/designs9030073