Article

Image Matching Algorithm for Transmission Towers Based on CLAHE and Improved RANSAC

1
Jiangmen Power Supply Bureau of Guangdong Power Grid Co., Ltd., Jiangmen 529000, China
2
School of Automation Science and Engineering, South China University of Technology, Guangzhou 510640, China
*
Author to whom correspondence should be addressed.
Designs 2025, 9(3), 67; https://doi.org/10.3390/designs9030067
Submission received: 19 April 2025 / Revised: 19 May 2025 / Accepted: 24 May 2025 / Published: 29 May 2025
(This article belongs to the Section Electrical Engineering Design)

Abstract

To address the lack of robustness against illumination and blurring variations in aerial images of transmission towers, an improved image matching algorithm for aerial images is proposed. The proposed algorithm consists of two main components: an enhanced AKAZE algorithm and an improved three-stage feature matching strategy, which are used for feature point detection and feature matching, respectively. First, the improved AKAZE enhances image contrast using Contrast-Limited Adaptive Histogram Equalization (CLAHE), which highlights target features and improves robustness against environmental interference. Subsequently, the original AKAZE algorithm is employed to detect feature points and construct binary descriptors. Building upon this, an improved three-stage feature matching strategy is proposed to estimate the geometric transformation between image pairs. Specifically, the strategy begins with initial feature matching using the nearest neighbor ratio (NNR) method, followed by outlier rejection via the Grid-based Motion Statistics (GMS) algorithm. Finally, an improved Random Sample Consensus (RANSAC) algorithm computes the transformation matrix, further enhancing matching efficiency. Experimental results demonstrate that the proposed method exceeds the original AKAZE algorithm’s matching accuracy by 4∼15% on different image sets while achieving faster matching speeds. Under real-world conditions with UAV-captured aerial images of transmission towers, the proposed algorithm achieves over 95% matching accuracy, which is higher than other algorithms. Our proposed algorithm enables fast and accurate matching of transmission tower aerial images.

1. Introduction

In recent years, the rapid advancement of unmanned aerial vehicle (UAV) technology [1,2] has led to the widespread use of aerial images in the power industry. They are now commonly employed for transmission line inspection [3,4] as well as for the planning and management of electrical engineering projects [5]. However, a single UAV aerial image often provides limited information, which may not be sufficient for these complex tasks. Image matching [6,7], which involves aligning several images captured from different spatial coordinate systems but containing the same objects in a unified coordinate framework, serves as a critical step in image fusion [8,9], image stitching [10,11], and 3-D reconstruction [12]. Transmission towers are among the most common objects in UAV aerial images [13] and are distributed across various geographic regions. Matching aerial images of these towers can provide richer and more detailed information about target areas, improving the accuracy of transmission line inspections and offering valuable visual references for power engineering planning. This capability has significant practical importance in real-world applications.
Image matching is a process of identifying identical or similar features across two or more images to establish correspondences between them. Traditional algorithms are primarily based on local features, which describe the local regions around keypoints and then match these keypoints according to distance metrics. The most popular feature-based image matching algorithms are SIFT (Scale-Invariant Feature Transform) [14], SURF (Speeded Up Robust Features) [15], ORB (Oriented FAST and Rotated BRIEF) [16], and AKAZE (Accelerated-KAZE) [17]. The SIFT [14] algorithm is highly robust to scale and illumination variations. However, its high computational cost makes it unsuitable for real-time applications. SURF [15] improves feature detection speed by using integral images for keypoint detection and introducing low-dimensional descriptors, though it still falls short of real-time performance requirements. ORB [16] combines an improved FAST detection approach with the rBRIEF binary descriptor, significantly boosting the speed. However, it struggles with robustness under scale changes. AKAZE [17] addresses these challenges by constructing a nonlinear scale space with the Fast Explicit Diffusion (FED) method and employing the Modified-Local Difference Binary (M-LDB) descriptor. This approach offers strong scale and rotation invariance while maintaining a good balance between matching accuracy and computational efficiency.
UAV platforms are often equipped with limited computational resources, so FPGA [18] and GPU [19] are often used to accelerate the algorithm operation to meet the real-time requirements. For example, Zhang et al. [18] combined FAST features with Farneback optical flow on an FPGA to reduce the feature tracking delay to milliseconds. Over the past decade, researchers have also proposed many image matching methods for transmission tower images. For instance, Tragulnuch et al. [20] introduced a transmission tower detection approach based on video sequences, utilizing the Canny–Hough transform for efficient tower detection. Zhang et al. [21] introduced a fast image stitching method for transmission towers by combining ORB keypoints with a multi-scale fusion strategy. Similarly, Guo et al. [
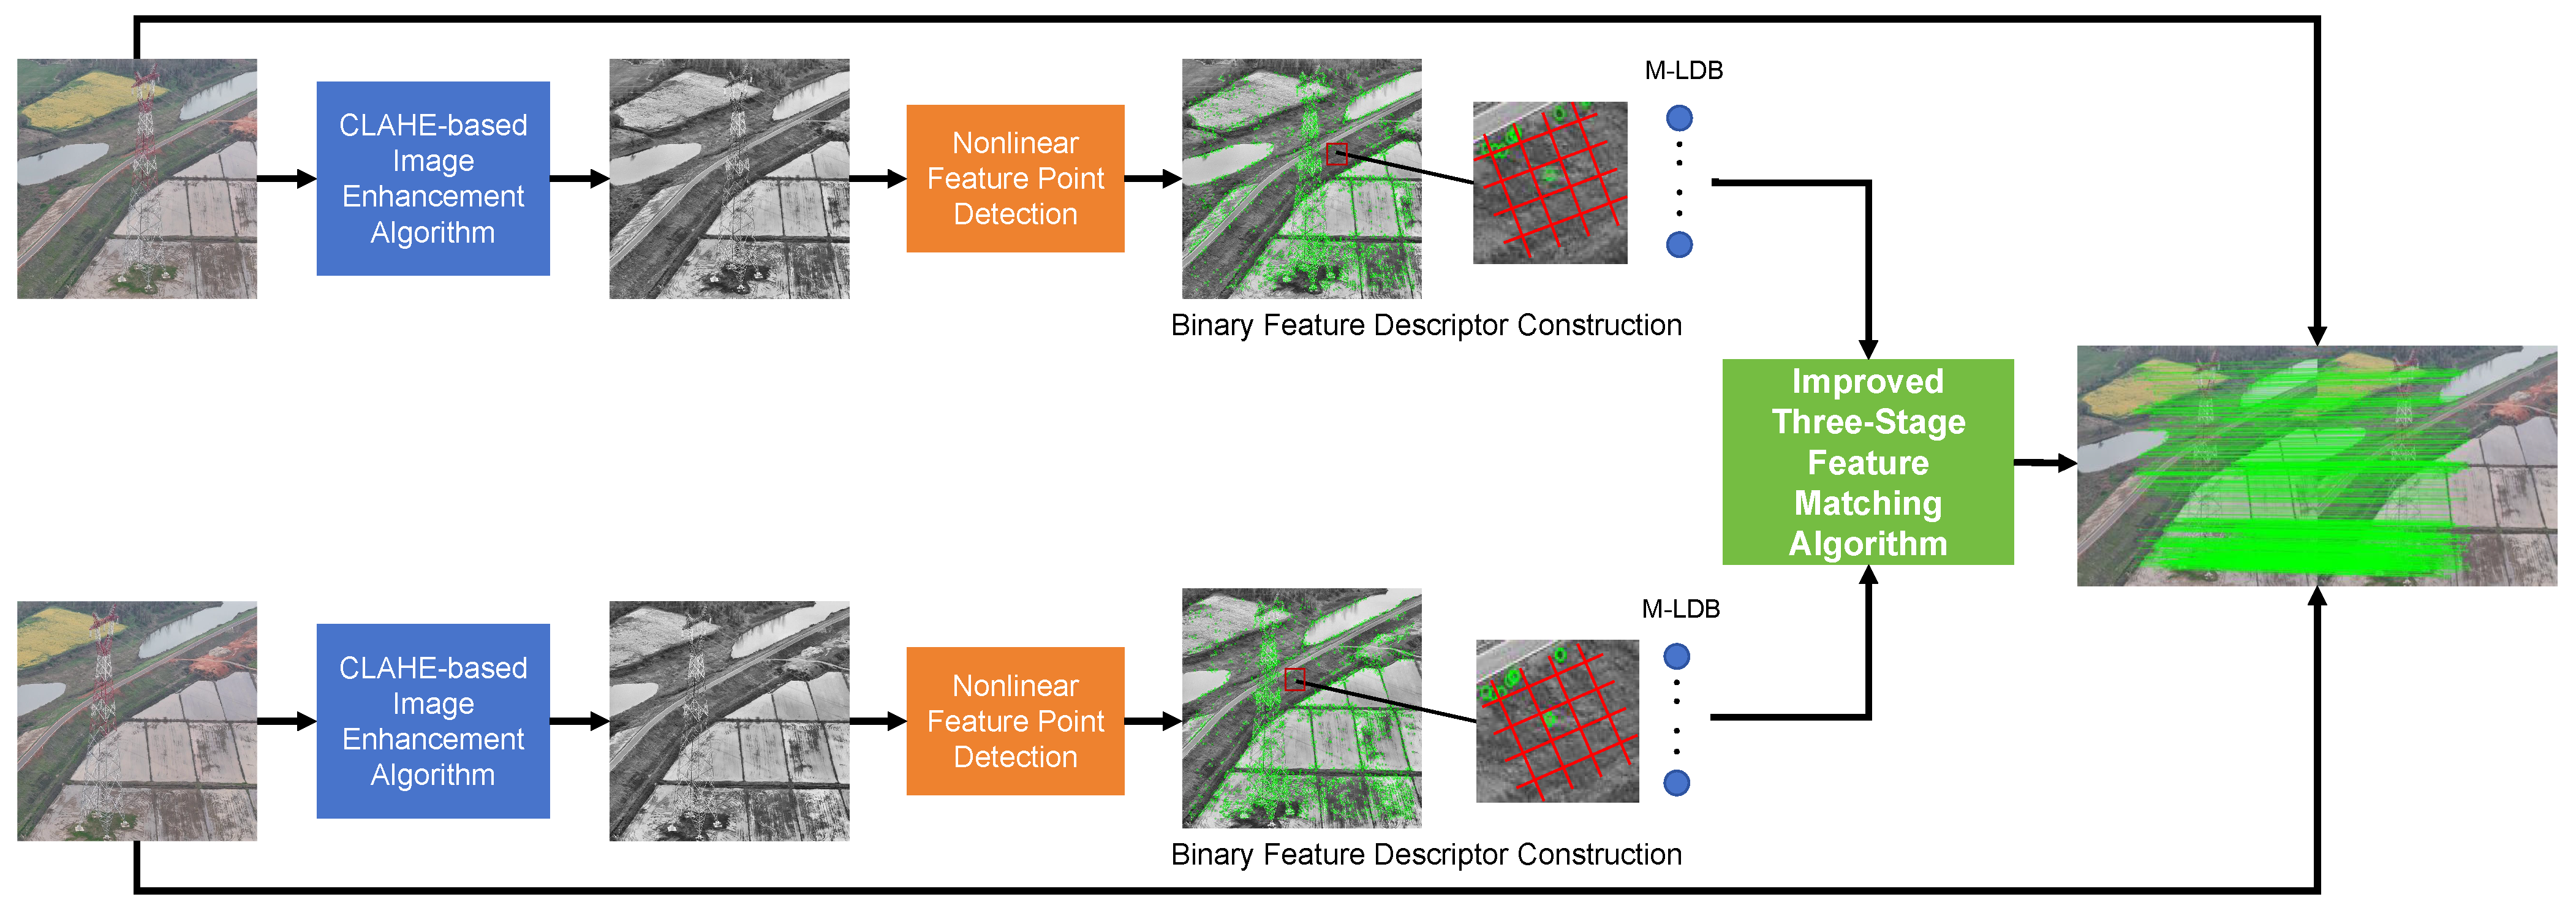
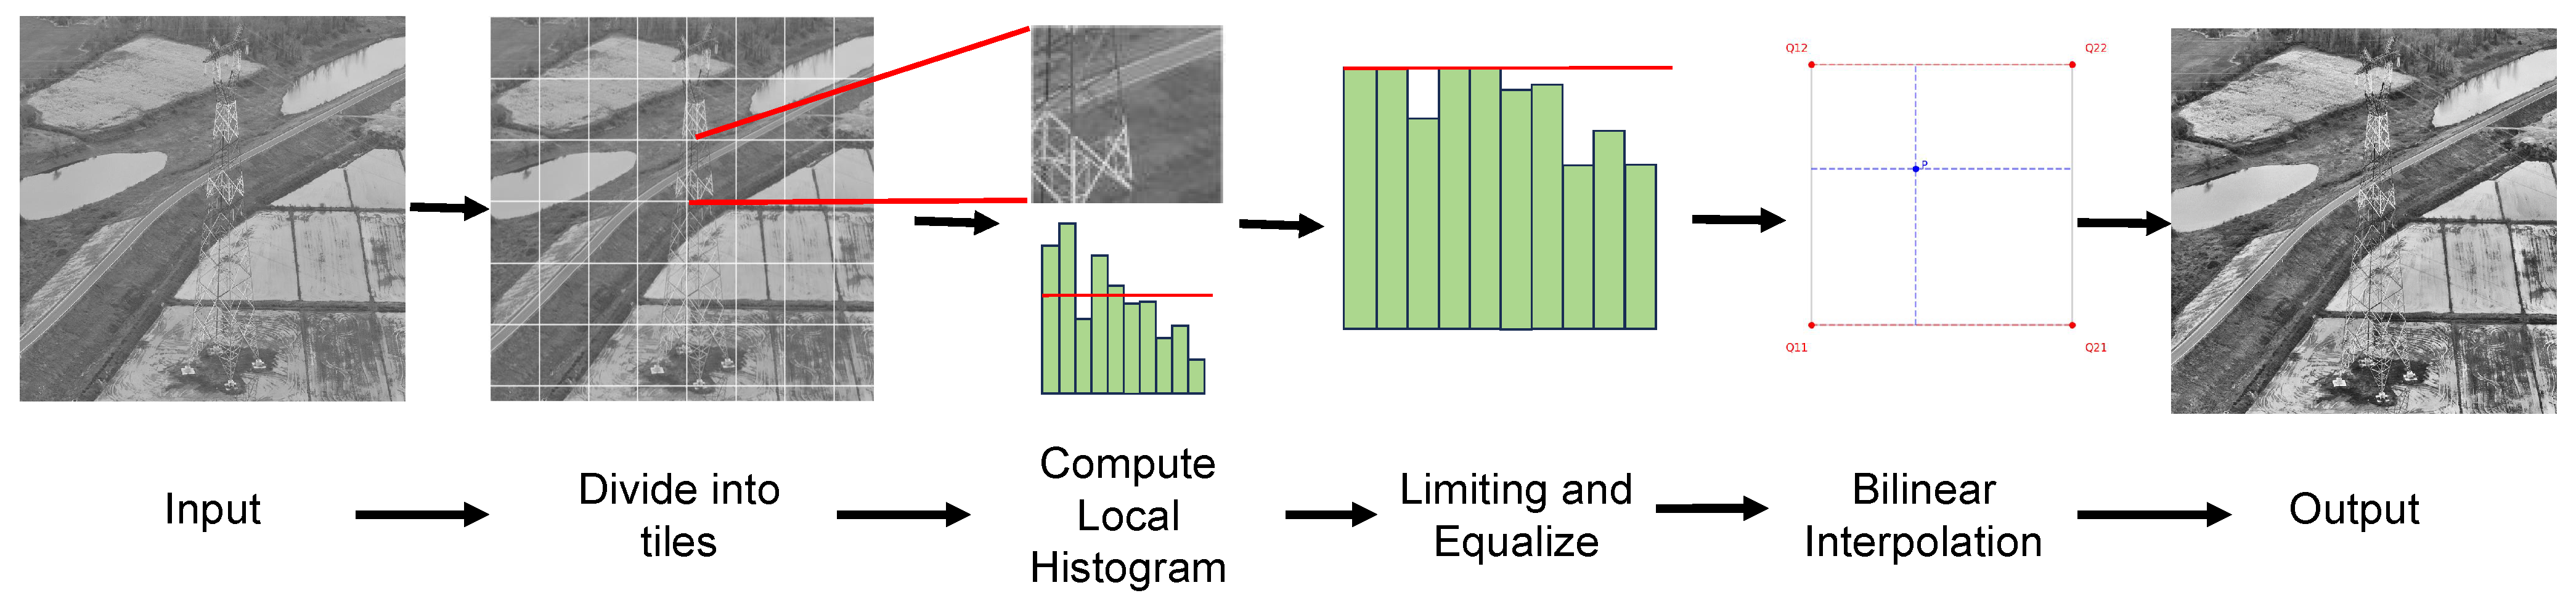
22] employed the Line Segment Detector (LSD) algorithm to detect the structural components of transmission towers accurately. However, these methods often struggle with common challenges in UAV aerial images, such as changes in illumination and image blur, which significantly affect matching accuracy. To overcome these limitations, this study proposes an improved image matching algorithm specifically designed for UAV aerial images of transmission towers. The proposed algorithm consists of two key modules based on the original AKAZE. First, an image preprocessing method is applied to enhance image quality using the Contrast-Limited Adaptive Histogram Equalization (CLAHE) algorithm [23], which adjusts the contrast of transmission tower aerial images. There is an experimental phenomenon that low brightness or great blurriness in images can obscure object features, hindering feature detection. CLAHE is used to dynamically enhance image contrast and brightness, which helps highlight target structures and increases the number of detectable keypoints. Second, a multi-stage keypoint matching strategy integrates the nearest neighbor ratio (NNR), the Grid-based Motion Statistics (GMS) algorithm [
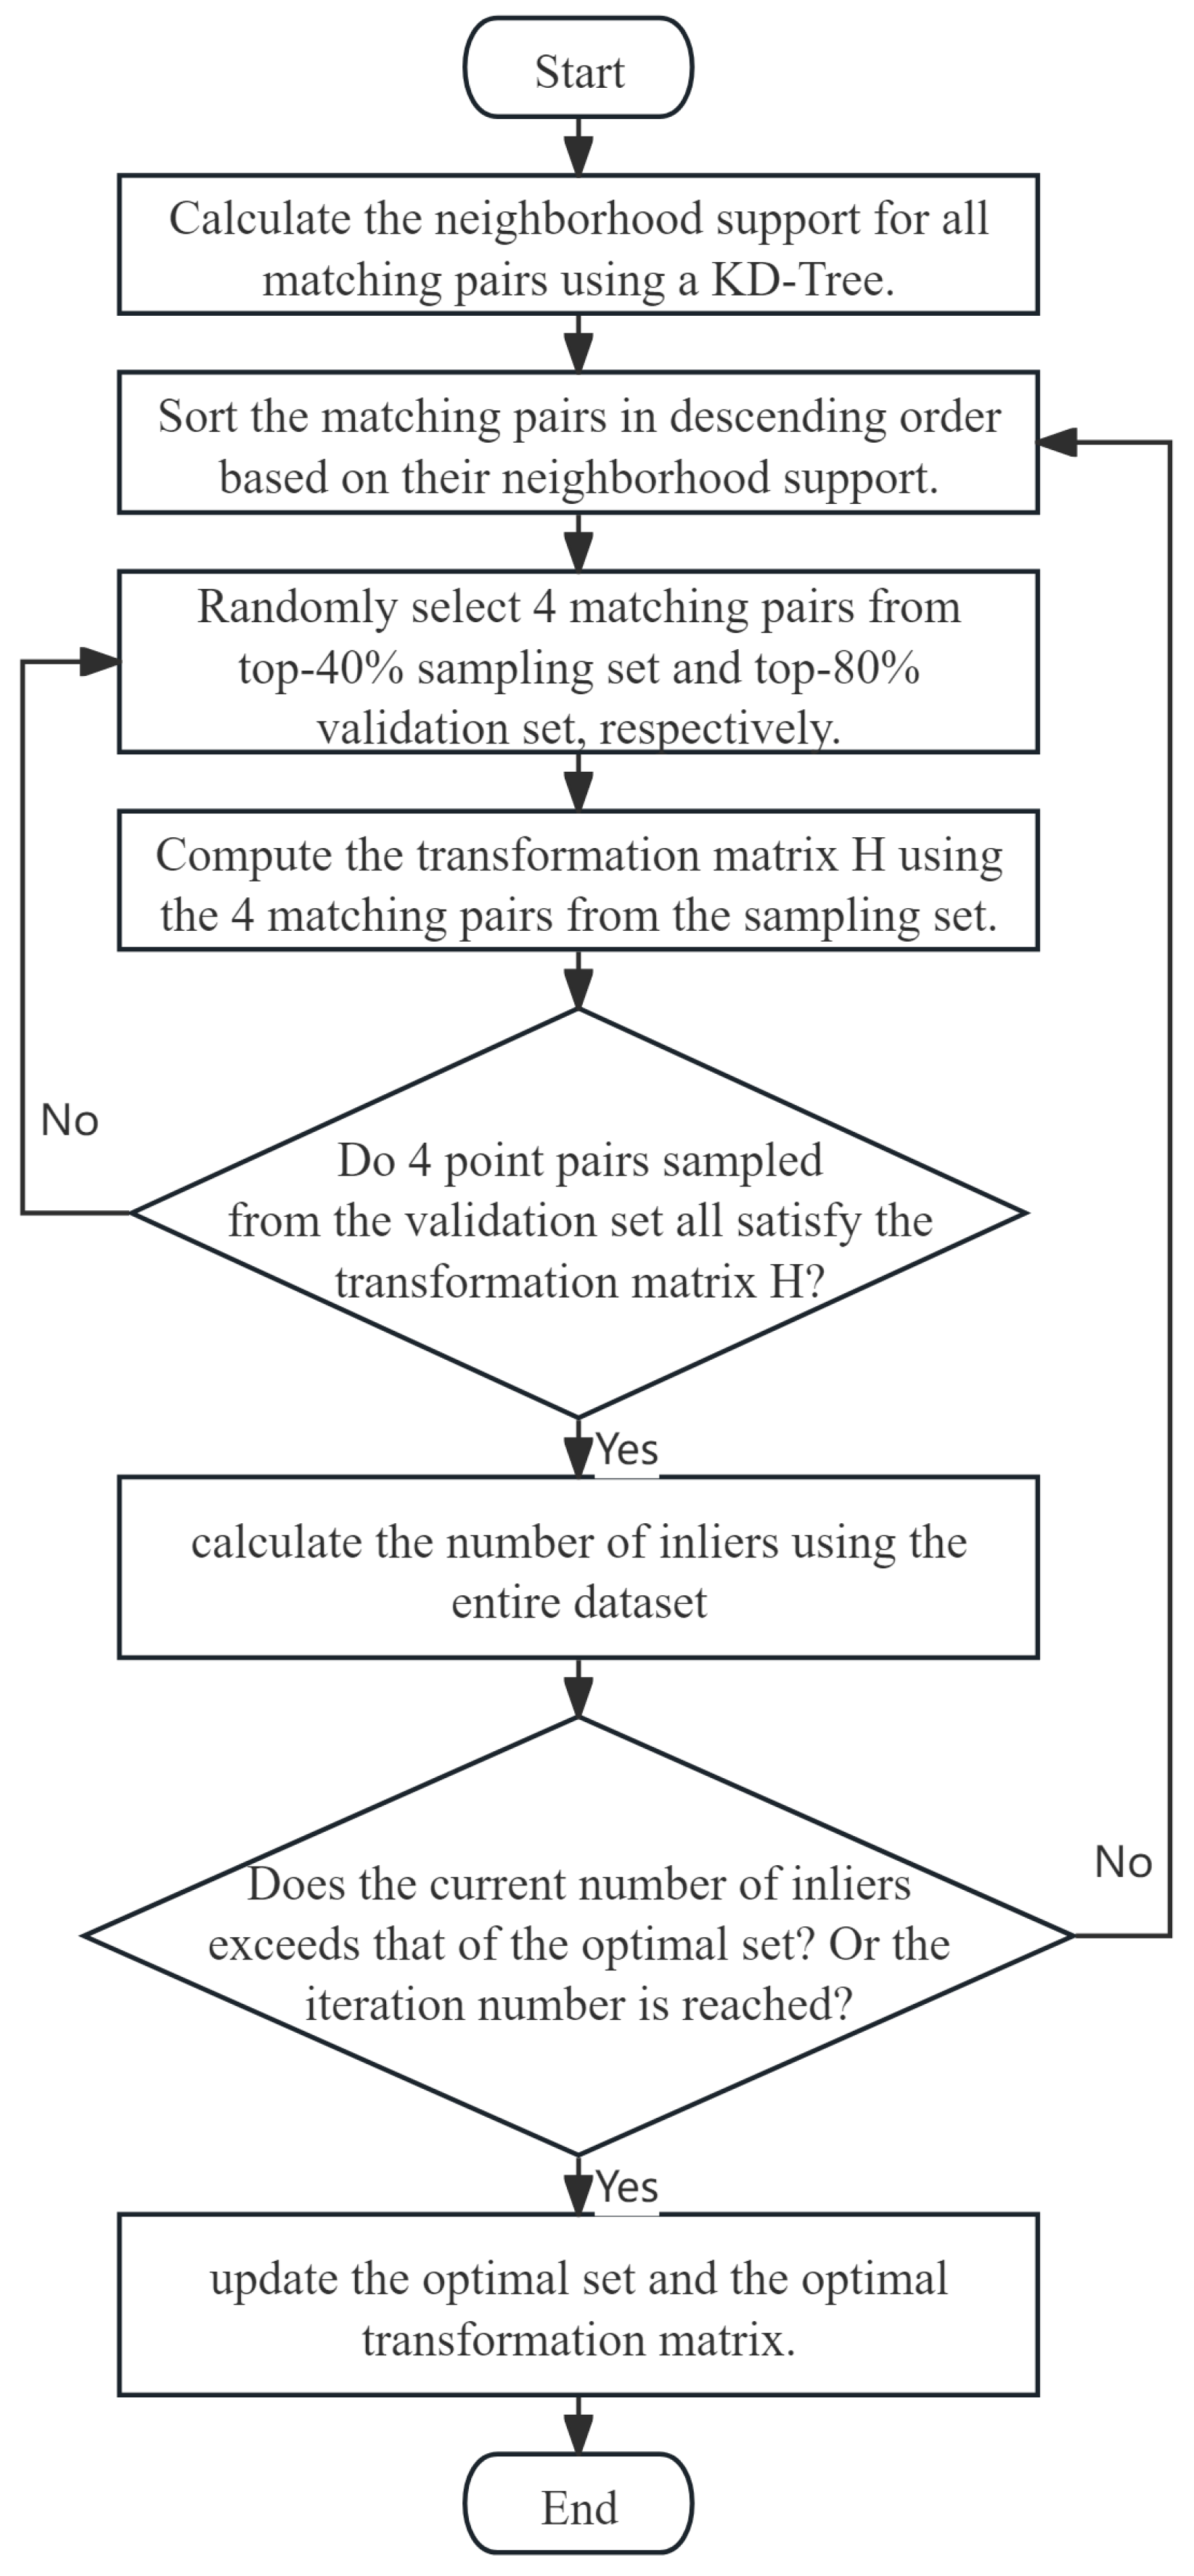
24], and an improved RANSAC algorithm, significantly enhancing matching accuracy. Inspired by the GMS algorithm’s emphasis on keypoints with strong neighborhood support, the improved RANSAC algorithm improves the estimation of transformation matrices by preferentially sampling keypoints with high local support. It can significantly enhance both the accuracy of feature matching and the computational efficiency.
Our approach is the first method that combines CLAHE, AKAZE, GMS, and the improved RANSAC for feature matching of transmission tower images. Specifically, the main contributions of our work can be summarized as follows:
We propose a novel image matching algorithm to achieve fast and accurate image matching of transmission towers, thus meeting the practical applications in the power industry.
We propose a three-stage matching strategy with an improved RANSAC, which can significantly enhance matching accuracy and computational efficiency.
The experimental results on two datasets demonstrate the effectiveness and superiority of our proposed algorithm.

2. Methods

2.1. Overall Framework

To enable fast and accurate matching of UAV-captured aerial images of transmission towers, we propose an improved image matching algorithm. The overall structure of this algorithm is illustrated in Figure 1. Specifically, it consists of two main components: an enhanced AKAZE-based feature detection module and an improved three-stage feature matching strategy. First, the enhanced AKAZE module applies the CLAHE algorithm to adaptively adjust the contrast, emphasizing edge and corner features. This improves robustness against environmental disturbances, such as clouds and smog. Then, the original AKAZE algorithm nonlinearly detects keypoints and generates binary descriptors. Based on these detected keypoints, the improved three-stage feature matching strategy is employed to estimate the geometric transformation between images. This process begins with an initial feature matching step using the NNR. Next, mismatches are filtered using the GMS algorithm. Finally, the improved RANSAC algorithm computes the transformation matrix, thereby boosting the overall matching accuracy and efficiency.

2.2. Enhanced AKAZE Algorithm

2.2.1. CLAHE-Based Image Enhancement Algorithm

The original AKAZE algorithm is quite sensitive to variations in illumination and image blur. This sensitivity poses challenges when analyzing aerial images of power transmission lines taken in low-light or low-visibility environments, where the algorithm often fails to detect enough keypoints. Additionally, its robustness against interference from complex backgrounds is limited to real applications. To overcome these limitations, this study introduces the CLAHE algorithm to enhance image quality. CLAHE enhances local contrast and emphasizes edge information, enabling more reliable detection of representative keypoints under diverse environmental conditions. Specifically, CLAHE works by dividing the image into a grid of small regions, performing histogram equalization within each region, and then blending the results using bilinear interpolation to produce the augmented image. The implementation steps of the CLAHE algorithm are as follows:
(1)
Divide the input image into equally sized local tiles by partitioning the image into a uniform grid. The scale of each tile is M × N . The tile size determines the scale of localized contrast enhancement. The feature points of transmission towers are relatively small. Thus, the region size should be set smaller to help highlight the object details, such as 8 × 8 .
(2)
Compute grayscale histogram H i to represent the distribution of pixel intensities for each tile.
(3)
Clip the histogram using a predefined clipping threshold N C L . The clipping threshold limits the maximum height of the histogram, thus avoiding over-enhancement. This threshold is generally set to 1.0–4.0, and small values can be used to suppress noise.
(4)
Redistribute the excess pixels uniformly across all grayscale intensity levels. The number of redistributed pixels per intensity level is given by
N a c p = N c l i p L g r a y ,
where L g r a y denotes the number of gray levels within the local tile, and N c l i p is the total number of clipped pixels.
(5)
Recalculate the histogram after redistributing the excess pixels. If the adjusted histogram still exceeds the clipping threshold, the redistribution process is repeated iteratively until all intensity values fall within the threshold.
(6)
Apply bilinear interpolation to merge the boundaries between adjacent tiles, ensuring smooth transitions and minimizing block artifacts in the final enhanced image.
Figure 2 presents the CLAHE-based image enhancement algorithm. Initially, the input image is converted to grayscale. It can be seen that the output enhanced image exhibits improved clarity in local details, with features such as corners and edges more distinctly emphasized, which provides a solid foundation for subsequent feature detection and matching tasks.

2.2.2. Nonlinear Feature Point Detection

Feature point detection is a critical step that directly affects real-time performance. A nonlinear diffusion filtering method is employed to construct a nonlinear scale space. This method exhibits more powerful detection accuracy and robustness than conventional linear filtering methods. Nonlinear diffusion filtering models the evolution of image intensity across multiple scales as the divergence of a flow function. This process can be described by the following nonlinear partial differential equation:
L t = div ( c ( x , y , t ) · L ) ,
where div ( · ) denotes the divergence operator, ∇ represents the image intensity gradient, and L is the image brightness value at position ( x , y ) . The variable t denotes the evolution time, and c ( x , y , t ) is the conductivity function, which controls the diffusion process.
The FED method is employed to solve this nonlinear partial differential equation. By applying the FED scheme, the solution can be expressed as
L i + 1 = I + τ A L i L i ,
where I denotes the identity matrix, A L i represents the conduction matrix along the dimension i, where i [ 0 , n 1 ] , and τ is the time step size. The keypoint detection process of the proposed algorithm consists of the following two main steps.
Construction of a nonlinear scale space. Similar to the linear scale space used in SIFT, the nonlinear scale space is also structured into O octaves, each comprising Q layers. The scale parameter for the image at the q-th layer of the o-th octave is computed as
σ i ( o , q ) = σ 0 2 o + q / Q ,
where o [ 0 , O 1 ] denotes the octave index, and q [ 0 , Q 1 ] denotes the layer index within the octave. i [ 1 , N ] , where N is the total number of images in the nonlinear scale space. σ 0 is the basic scale. To implement nonlinear diffusion filtering, the scale parameter is further converted to a time parameter using the following expression:
t i = 0.5 σ i 2 ,
Keypoint detection and localization. For various image scales, our algorithm detects keypoints by identifying local maxima of the normalized Hessian matrix determinant. The function of the Hessian matrix is
L H e s s i a n = σ 2 L x x L y y L x y 2 ,
where σ is the scale parameter, L x x and L y y are the second-order derivatives in the horizontal and vertical directions, respectively. L x y is the second-order cross derivative.
To detect keypoints, the determinant of the Hessian matrix is computed for each pixel at every scale level. Each pixel is compared with its 26 neighboring pixels, including 8 neighbors within the same scale and 18 neighbors in the adjacent scales. A pixel is identified as a keypoint if its Hessian determinant is greater than all neighboring pixels. After initial detection, the keypoint locations are refined to sub-pixel accuracy using a Taylor series expansion of the scale-space function, which improves localization precision and overall matching reliability.

2.2.3. Binary Feature Descriptor Construction

To ensure rotation invariance, the proposed algorithm determines the dominant orientation of each keypoint. We define a circular region centered at the keypoint with a radius 6 σ i . Within this region, the first-order derivatives of the sampled points are computed and weighted by a Gaussian kernel. A sliding sector window with a π / 3 angular span traverses the circular region, and the sum of the weighted gradients within each sector is calculated. The direction corresponding to the maximum resultant vector is selected as the keypoint’s dominant orientation. Subsequently, the algorithm employs the MLDB descriptor to characterize each keypoint. This descriptor captures both gradient and intensity information from the nonlinear scale space and encodes it into a 3-bit binary vector, typically. Since the descriptor is binary, keypoint matching operations can be performed efficiently using simple logical operations, significantly reducing computational complexity and improving processing speed.

2.3. Improved Three-Stage Feature Matching Algorithm

Feature matching is a crucial step in aerial image matching, involving identifying corresponding keypoints between a reference image and a target image to estimate the geometric transformation. This study introduces an improved three-stage matching algorithm to improve the process’s accuracy and efficiency. First, initial matches are identified using the NNR method, applied to keypoint features detected by the AKAZE algorithm. Secondly, GMS filters out false matches by evaluating the spatial consistency of keypoint pairs. Finally, the RANSAC algorithm further refines the matches and robustly estimates the transformation matrix between the two images.

2.3.1. Nearest Neighbor Ratio Coarse Matching Algorithm

This study first employs the NNR algorithm on initial feature matching, which is one of the most widely used coarse matching methods. The NNR algorithm employs a brute-force approach to compute the Hamming distances between all feature point descriptors in both images. For each feature point, the distance ratio between the nearest and second-nearest neighbors is calculated as
D m i n D n m i n < ε ,
where ε represents the matching threshold. If the ratio is less than ε , the match is validated, and the nearest neighbor is accepted as the corresponding point. Otherwise, the match is rejected. Choosing an appropriate value for this threshold is crucial for optimal performance. A small threshold may result in missing correct matches, while a big value could increase the number of false matches.

2.3.2. GMS-Based Mismatch Filtering

The initial matching results typically include a significant number of incorrect correspondences. To enhance the reliability of the matches, this study applies the GMS algorithm to robustly filter out mismatches. The key idea behind GMS is that correct matches tend to exhibit spatial consistency. In other words, a true match is often located near other keypoints that are also correctly matched, forming locally consistent clusters in the image space. In contrast, false matches are typically isolated, with few or no neighboring correspondences. Based on this assumption, GMS divides the image into grid cells and evaluates each cell by counting the number of matches in its neighborhood regions, effectively distinguishing robust matches from outliers. Figure 3 illustrates the distribution of neighboring matches for correct and incorrect correspondences. Let m f and m t denote the mean number of neighboring matches for false and correct correspondences, respectively. The decision threshold for retaining a match in a given grid cell is derived from the statistical characteristics of the neighborhood distributions and is computed as follows:
δ = m f + α v f ,
where v f denotes the standard deviation of the neighboring match distribution for false correspondences. Matches within a grid cell are retained only if the number of neighboring matches surpasses the threshold δ . This process effectively ensures that only the most consistent and reliable matches are preserved, substantially improving the accuracy of feature matching.

2.3.3. Transformation Matrix Solving Based on an Improved RANSAC

RANSAC is an iterative algorithm for further filtering out false feature pairs and estimating the transformation matrix. It is known for its robustness to noise and outliers, making it highly effective for model estimation. However, traditional RANSAC randomly samples feature matches in each iteration without considering the reliability of different matches. As a result, it often leads to excessive iterations and extended computation time. To address the issues, this paper proposes an improved RANSAC algorithm inspired by the GMS approach, incorporating the concept of neighborhood support. The improved RANSAC prioritizes the sampling of feature matches with strong local consistency—those surrounded by a high density of neighboring matches, thus reducing the number of necessary iterations while boosting overall efficiency. The neighborhood support of a feature point is defined as the number of matching points within a circular region centered on that point:
s i a = p j N p i a , r 1 ,
where s i a represents the neighborhood support of the i-th matching point on the image, and N p i a , r denotes all feature points in a circular neighborhood with a radius r centered on the matching point p i a . Additionally, this study calculates the neighborhood support for each feature match by using the average value of the neighborhood support of the matching points on the source image (reference image) and the target image (image to be aligned).
s k = 1 2 ( s k s o u r c e + s k t a r g e t ) ,
where s k denotes the neighborhood support of the k-th group of matching pairs, s k s o u r c e and s k t a r g e t , which represent the neighborhood support of the k-th matching point on the source and target images, respectively.
Obtaining neighborhood support involves calculating the distances between a given feature point and all other feature points in the image to determine whether they fall within a specified radius r. This process becomes computationally expensive and time-consuming, particularly when handling a large number of feature points. To improve computational efficiency, this paper employs a KD-Tree data structure [25] for organizing and storing feature points. The KD-Tree enables efficient nearest neighbor queries, substantially reducing both computation time and the overall feature matching duration. The improved RANSAC algorithm is shown in Figure 4.
  • Divide the input image into a uniform grid of equally sized local tiles. The scale of each tile is M × N .
  • Neighborhood Support Calculation: For each matched feature point pair, compute its neighborhood support by efficiently querying spatially adjacent matches using a KD-Tree structure.
  • Sorting: Rank all matching pairs in descending order according to their neighborhood support values.
  • Subset Construction: From the ranked list, select the top 40% of matching pairs to form the sampling set and the top 80% to form the validation set. Randomly sample four matching pairs from each set.
  • Model Verification: Validate the estimated transformation matrix by checking whether the four pairs from the validation set are consistent with the transformation. If they are, compute the number of inliers across the entire dataset. If consistency is confirmed, compute the number of inliers across the entire dataset. If not, discard the current model and return to step 4.
  • Model Update: If the current iteration yields more inliers than the best count found so far, update the optimal transformation matrix and its associated inlier set.
  • Termination: After reaching the predefined number of iterations, the algorithm returns the transformation matrix associated with the highest inlier count as the final matrix.

3. Experimental Setting

Datasets. To comprehensively evaluate the effectiveness and robustness of the proposed approach, we conducted experiments using two datasets: the widely used Oxford image matching dataset [
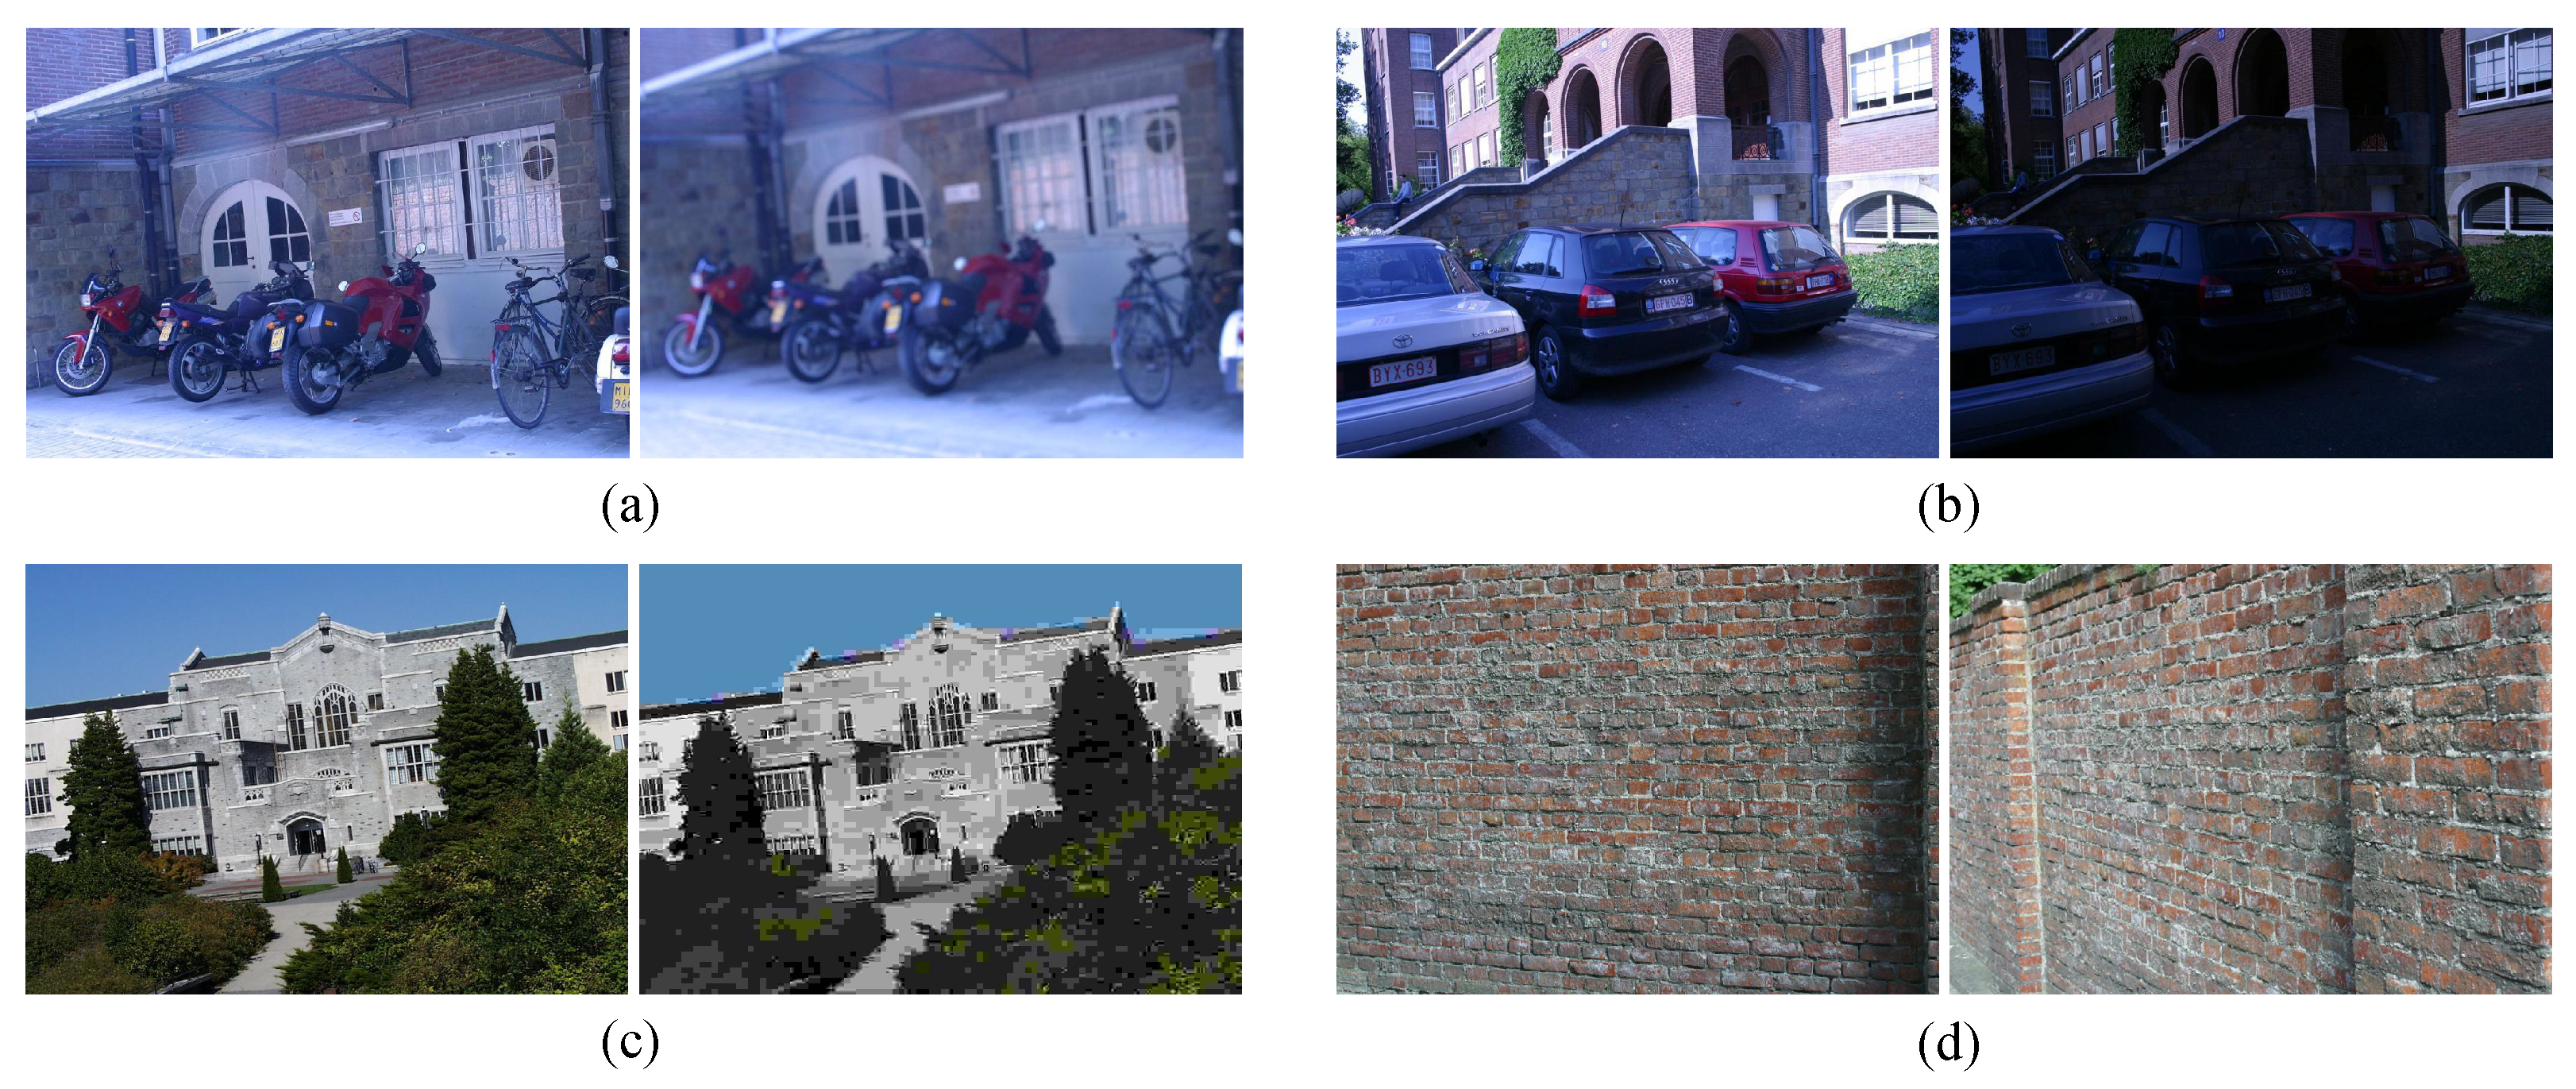
26] and a self-built dataset. The Oxford dataset is one of the most widely used benchmark datasets in image matching research, containing 8 image sequences with 6 images per sequence. Each sequence captures the same scene under different conditions, providing diverse test cases for evaluation. As illustrated in Figure 5, these variations include changes in blur, viewpoint, illumination, and other transformations, making the dataset well suited for evaluating the generalization of image matching algorithms. The self-built dataset was collected using a DJI Air 3 UAV produced by DJI company with a resolution of 1920 × 1080 in Jiangmen, China. As illustrated in Figure 6, the dataset contains aerial images of typical ground objects, including transmission towers, residential buildings, farmland, and forests. These images were captured under diverse environmental conditions, including different times of day and varying weather, providing a challenging testbed for evaluating the algorithm’s real-world performance.
Evaluation metrics. To evaluate the performance of the proposed algorithm, two main evaluation metrics were employed: feature matching time and correct matching rate (CMR). Feature matching time reflects the real-time efficiency, while CMR is used to quantify feature matching accuracy. The CMR is defined as follows:
C M R = n c n a l l ,
where n c denotes the number of correctly matched feature point pairs, and n a l l represents the total number of matched feature point pairs. A higher CMR indicates greater reliability and precision.

4. Implementation Details

All experiments were performed on the Windows 10 operating system with an AMD Ryzen 7 5800H CPU produced by Taiwan Semiconductor Manufacturing Company (TSMC) at 3.20 GHz and 16 GB of RAM. The algorithms were implemented using Python 3.8 in the PyCharm 2022.1.2 development environment, and the OpenCV 4.5.1 tool was employed for all experiments. To validate the performance of the proposed method, comparative experiments were performed against five widely used feature matching algorithms: SIFT, SURF, ORB, KAZE, and AKAZE. These methods serve as benchmarks for assessing both matching accuracy and computational efficiency.
To ensure optimal performance, several key hyperparameters were carefully configured. Following the default settings in the OpenCV library, we applied CLAHE with a clipping threshold of 2 and a local tile size of 8 × 8 pixels. For feature matching, the nearest neighbor ratio threshold was set to 0.8. The hyperparameters for the improved RANSAC algorithm were determined empirically, including a circular neighborhood radius of 50 pixels and a maximum iteration limit of 500.

5. Results and Discussion

5.1. Experimental Results on the Oxford Dataset

To evaluate performance under different conditions, we selected four image sequences from the Oxford dataset: Bikes (image blur), Wall (viewpoint change), Leuven (light change), and Ubc (JPEG compression). Each set contains six images, with the first image designated as the reference image and the remaining five used for matching tests. Each experiment was repeated multiple times with different random seeds to compute average values and standard deviations. The experimental results are presented in Table 1 and Table 2.
Table 1 shows the matching accuracy of different algorithms across the different conditions. The results demonstrate that the proposed method outperforms other algorithms in matching accuracy across all test conditions. Notably, it particularly shows strong robustness to blur and viewpoint changes while maintaining consistent performance under other variations. For instance, in the Bikes image set, the proposed method achieves an accuracy of 96.11% with a 0.26% of standard deviation, which is a notable improvement over the KAZE and AKAZE algorithms. These results prove our proposed algorithm’s enhanced stability and effectiveness in challenging visual scenarios.
As shown in Table 2, the proposed algorithm demonstrates the lowest average feature matching time across all tested data. It is approximately one-third of the SIFT algorithm, representing a substantial reduction compared to the AKAZE algorithm as well. The proposed method consistently outperforms other algorithms across all other environmental changes. In addition, the standard deviation of the average matching time of this proposed algorithm on the Oxford dataset is 8.98ms, which is much lower than other methods, demonstrating the robustness. With both outstanding accuracy and superior real-time performance, we believe that the proposed algorithm can meet the requirements for practical applications.

5.2. Experimental Results on the Self-Built Dataset

Table 3, Table 4, Table 5, Table 6 and Table 7 present the comparative analysis of experimental results between the proposed algorithm and several mainstream algorithms across five different aerial image sets. The results consistently demonstrate that the proposed method achieves the highest matching accuracy, confirming its robustness under diverse environmental conditions. For example, in the second image set featuring image blur, the proposed algorithm attains a matching accuracy of 98.62%, significantly outperforming SIFT (60.36%), SURF (70.57%), ORB (47.77%), and AKAZE (86.21%). ORB typically offers excellent speed, but its low accuracy makes it difficult to meet practical requirements. Furthermore, as shown in Table 6, the proposed method significantly outperforms the original AKAZE algorithm in handling challenging lighting conditions. While AKAZE successfully matched only eight feature point pairs in the farmland image set with severe illumination changes, our approach achieved a matching accuracy of 99.29%. This improvement is primarily attributed to the integration of the CLAHE algorithm, which enhances image contrast and emphasizes edge features, enabling reliable feature point detection even in low-light environments.
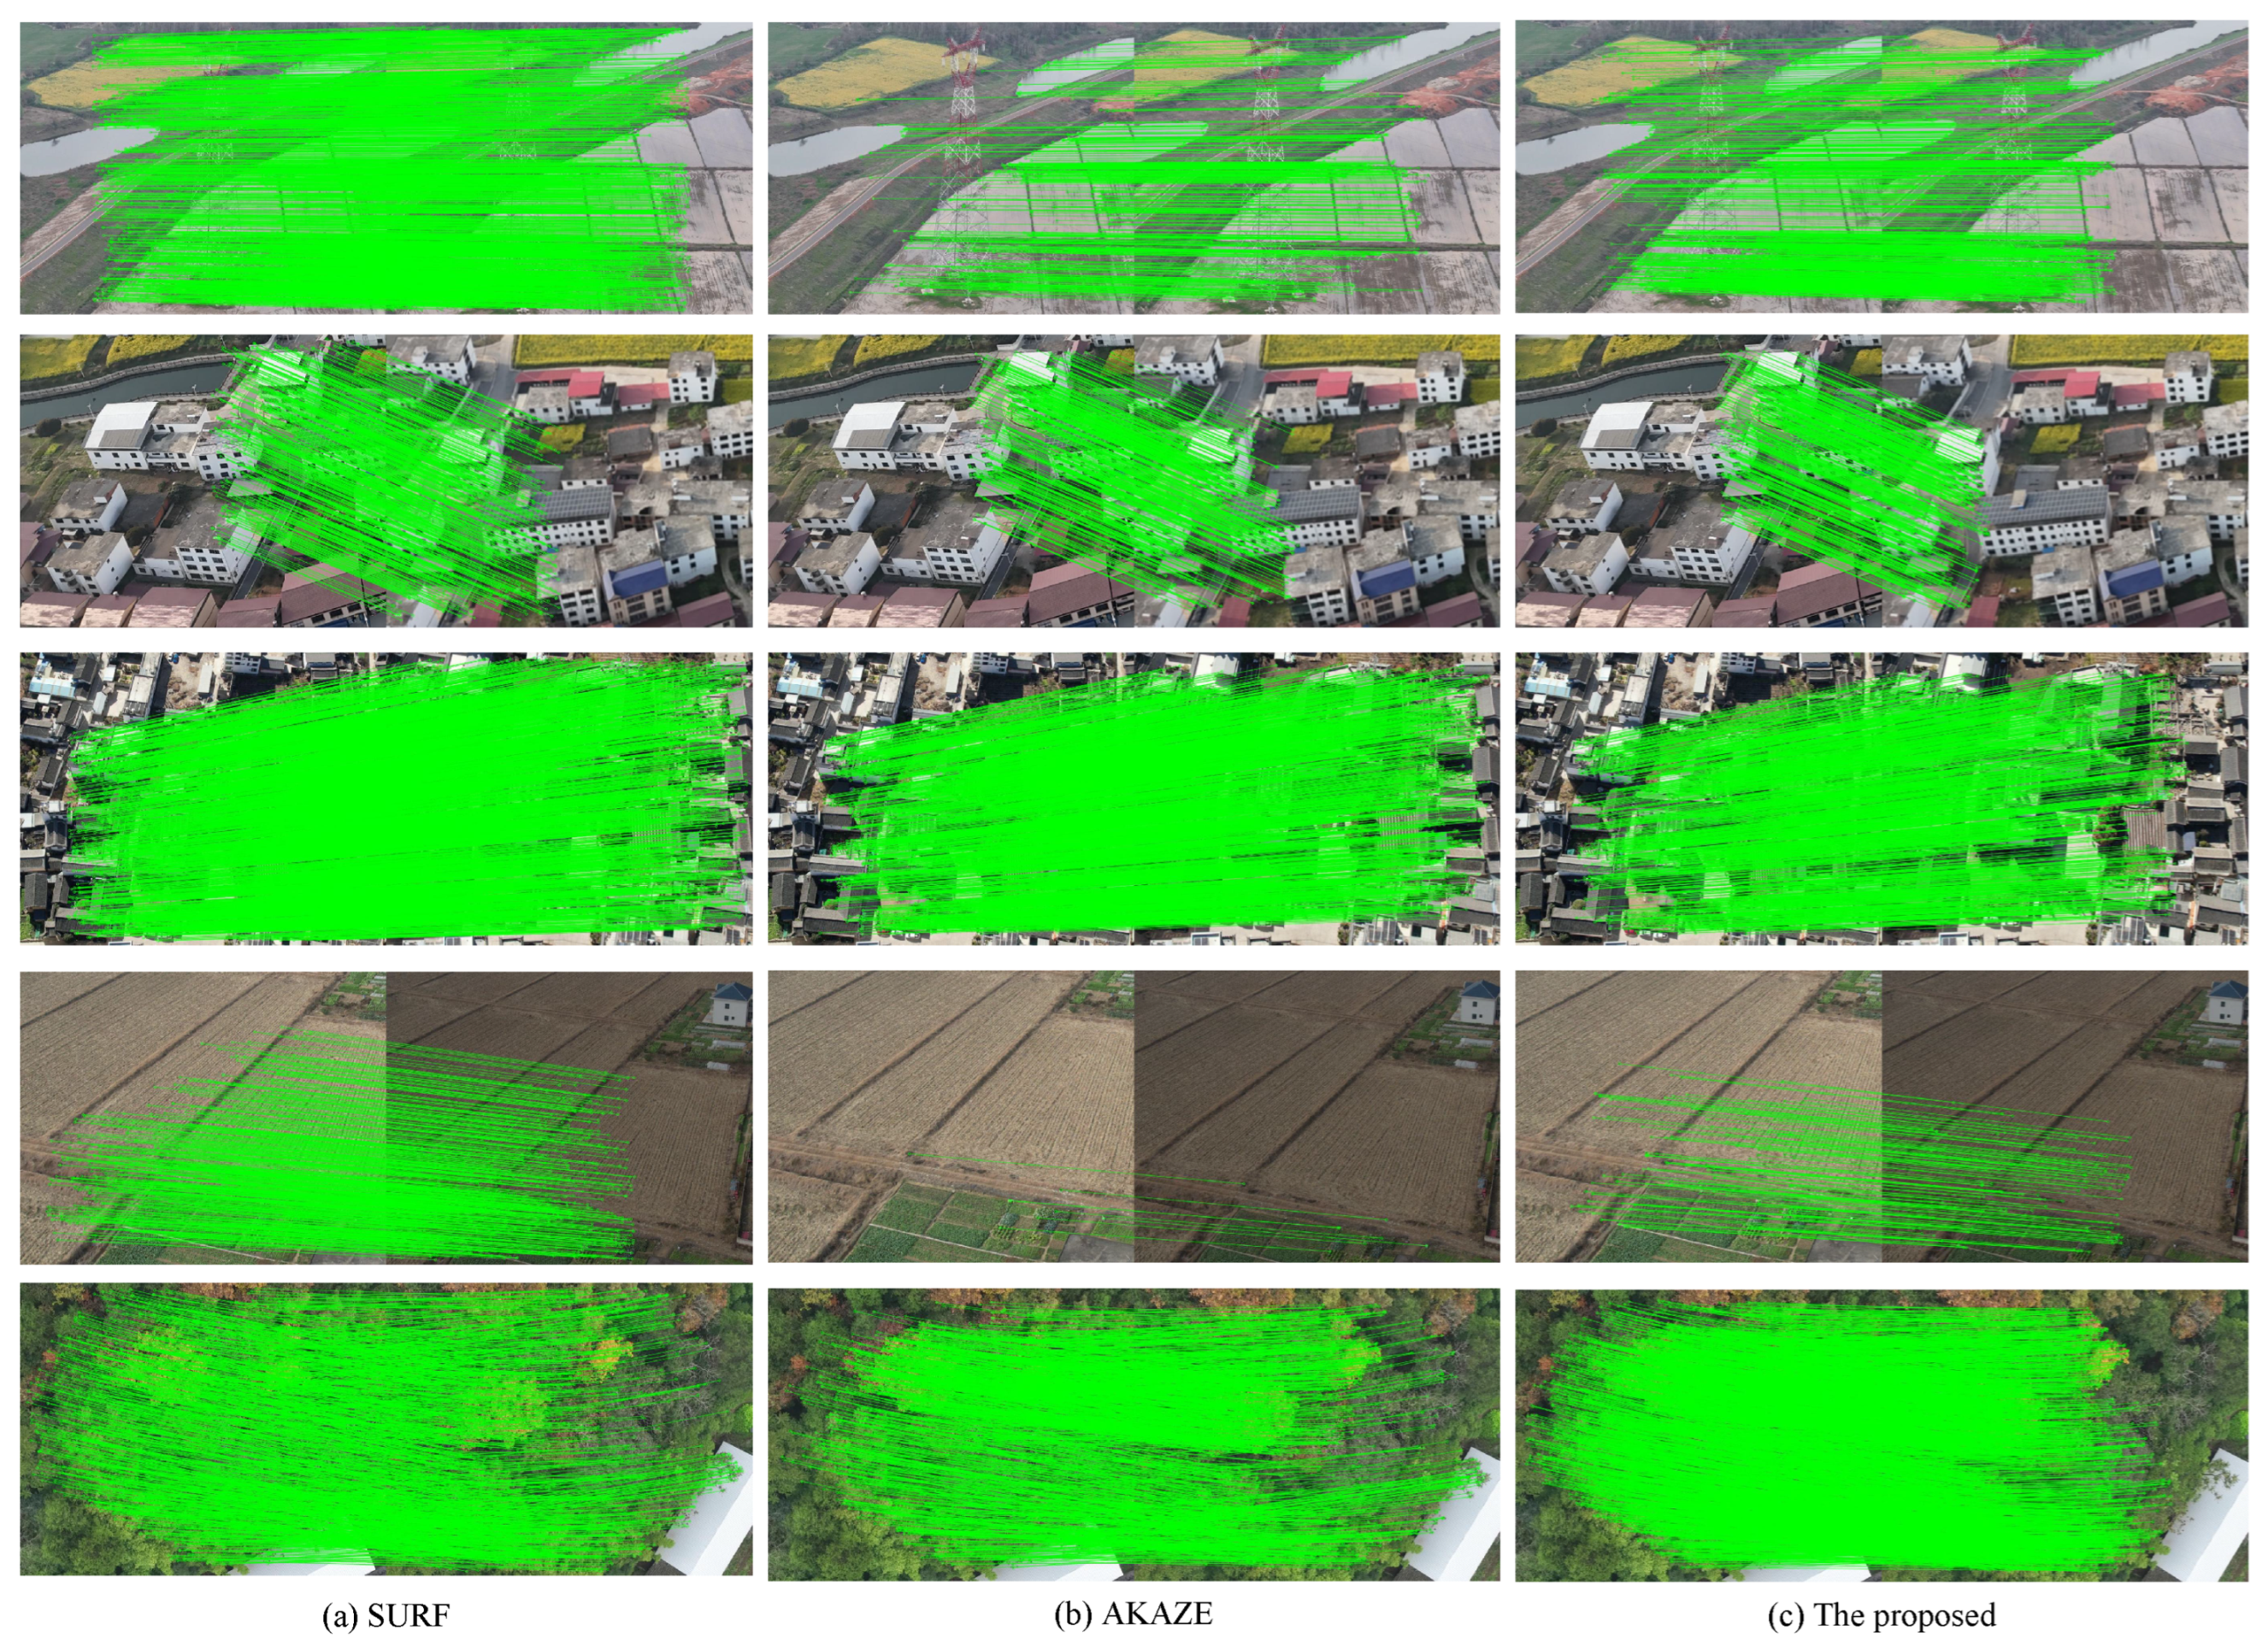
To provide a more intuitive understanding of different methods, Figure 7 presents a qualitative comparison between the proposed method and other algorithms, i.e., SURF and AKAZE. It clearly shows that the proposed algorithm can effectively detect and match a sufficient number of correct feature points under varying lighting conditions. Additionally, due to the three-stage feature matching strategy, the proposed algorithm exhibits the least false matches than other methods, resulting in a visually accurate matching performance.
Matching time is a crucial metric for evaluating the real-time performance of the proposed algorithm. As presented in the tables, the proposed method consistently achieves faster matching speeds compared to traditional approaches, significantly outperforming both SIFT and SURF. For instance, in the case of building images with scale change, our proposed approach achieves a matching time of just 972.28 ms—nearly five times faster than both SIFT and SURF (requiring only 19% and 20% of their processing time, respectively). Compared to AKAZE, the proposed method also demonstrates superior efficiency. Specifically, it needs less matching time than AKAZE even when processing twice the number of feature points as reported in Table 3, highlighting its computational efficiency. Recent advancements in deep learning-based image matching, such as SuperPoint [27], SuperGlue [28], and LoFTR [29], have shown remarkable accuracy by designing sophisticated neural network architectures. However, these methods typically require substantial computational resources supported by high-performance GPUs and rely heavily on large-scale, high-quality annotated datasets for effective training. Meanwhile, aerial image matching imposes stringent requirements for real-time performance. The experimental results demonstrate that the proposed algorithm effectively meets practical requirements in both matching accuracy and computational efficiency. Moreover, the algorithm exhibits low computational costs, making it particularly suitable for deployment in UAVs.

5.3. Experiment Results on Transmission Tower Image Matching

Detailed experiments were conducted on aerial images of transmission towers to validate the robustness of the proposed algorithm against changes in blur, scale, light, and rotation. The evaluation involved sequentially matching the original image with progressively modified versions (labeled as ’1’, ’2’, and ’3’ in Table 8, Table 9, Table 10 and Table 11), where each level represented increasing degrees of transformation. In every experiment, we recorded matching accuracy and matching time across all tested algorithms.
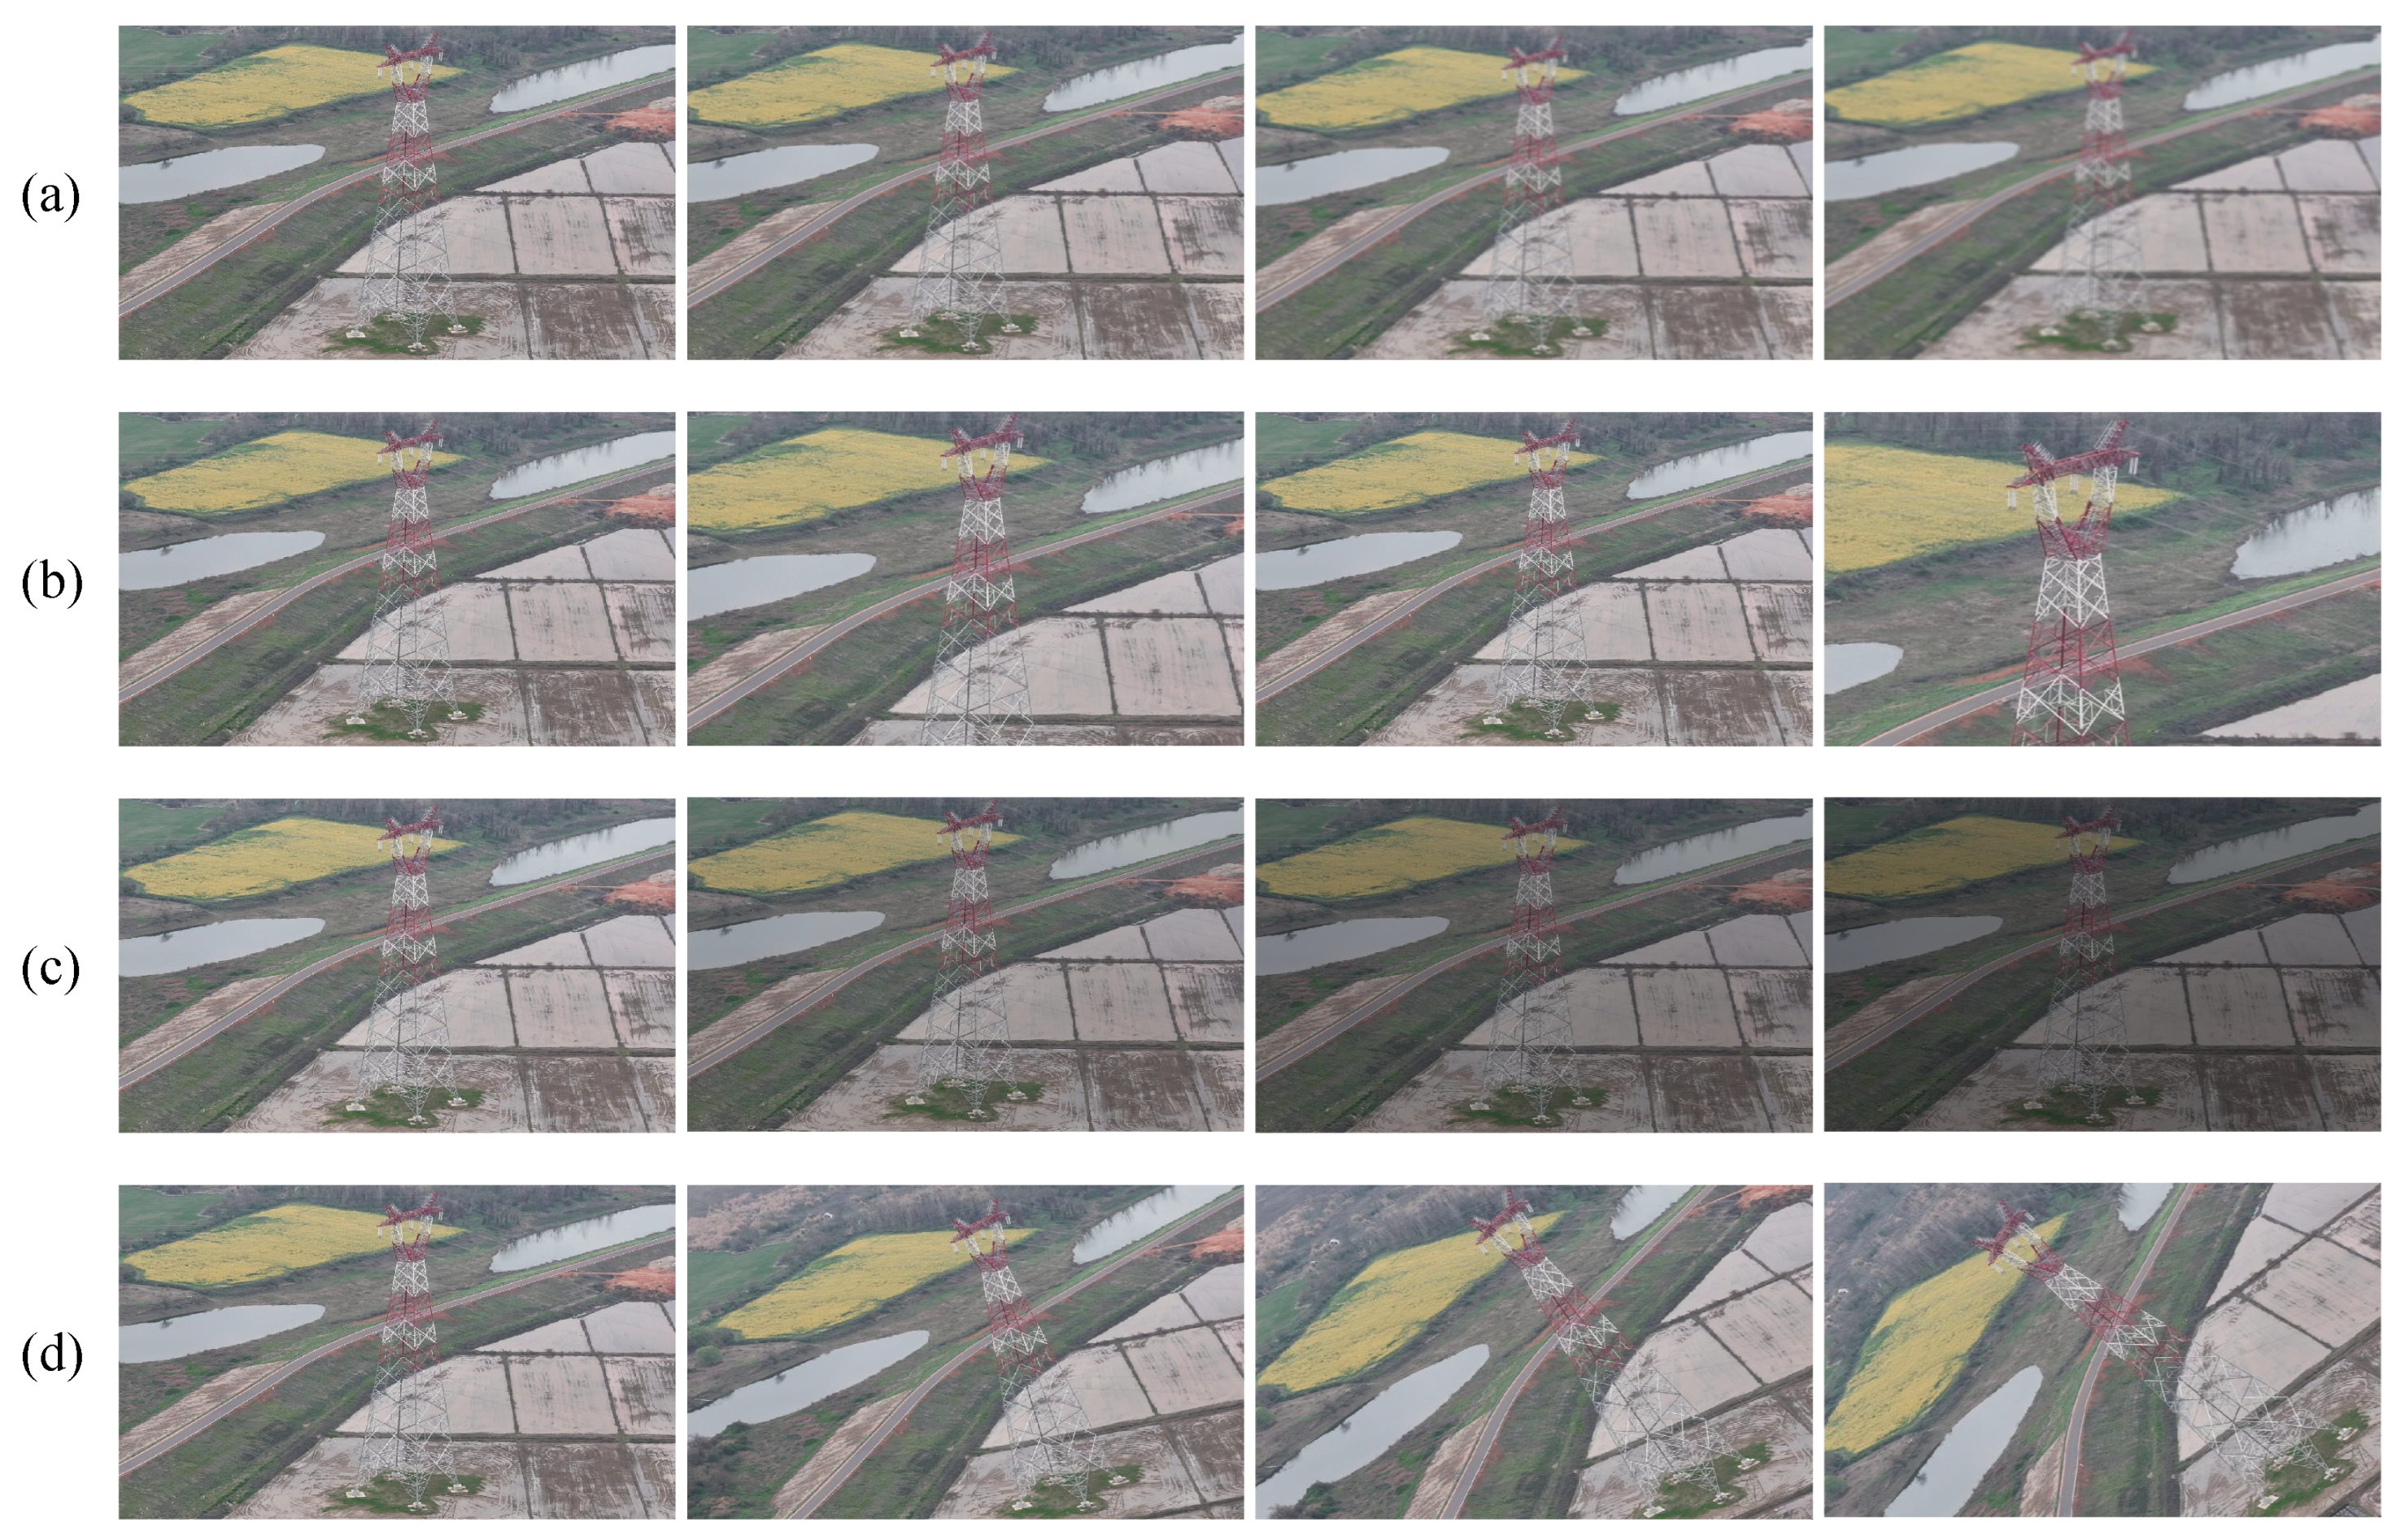
Image Blur. To simulate the blurring effects of haze on aerial images of transmission towers, this study applies varying degrees of mean blur processing. This creates a sequence of images gradually increasing in blur intensity as shown in Figure 8a. According to Table 8, the proposed algorithm consistently outperforms other methods in matching accuracy. It achieves an accuracy of 86.88% when matching the original image and heavily blurred images, demonstrating strong robustness against blur variations.
Scale change. Aerial images of transmission towers obtained by drones with different shooting distances and focal lengths vary significantly in scale. As shown in Figure 8b, this study enlarged the original image by different multiples, including 25%, 50%, and 100%, and then cut off parts of the same size image to simulate scale variations. As shown in Table 9, the proposed algorithm consistently achieves matching accuracies above 97% for images with different scale changes, while other methods degrade as scaling increases. Compared to the original AKAZE algorithm, our proposed algorithm achieves an average accuracy improvement of nearly 10%, accompanied by a stable reduction in average matching time.
Light change. By adjusting the brightness of the original image, illumination variations due to weather or time changes are simulated. As shown in Figure 8c, the aerial images of transmission towers undergo incremental decreases of 15% in brightness to obtain varying degrees of illumination variation. Table 10 compares the matching performance of different algorithms under varying lighting conditions. The proposed algorithm shows outstanding performance in matching images under varying lighting conditions. While other algorithms suffer from poor accuracy as brightness changes—for instance, AKAZE achieves only 54.26% accuracy on the third image set—our improved method maintains a consistently high matching accuracy above 99% across all test cases. This proves its strong robustness to light changes.
Rotation. To generate the rotated transmission tower images in Figure 8d, we rotated the original image counterclockwise by 15° three times. The matching results for these rotated images are presented in Table 11. Our proposed algorithm achieves an average matching accuracy approximately 4% higher than AKAZE and SIFT. Additionally, it demonstrates significantly faster matching speeds compared to SIFT and SURF, while performing on par with the original AKAZE.

5.4. Further Discussion

Runtime Performance Analysis. We tested the hardware requirements and runtime of each component of the proposed method on the self-built dataset. As shown in Table 12, the proposed method only uses 19.6% of CPU power and 3.1 MB of memory during execution, which is slightly higher than the original AKAZE algorithm. Current mainstream computing platforms or drones, such as the Specs Manifold2 and DJI Mavic 3, can easily meet this algorithm’s hardware requirements. For example, the Specs Manifold 2 is equipped with NVIDIA Jetson TX2 and 8GB of memory. It can be seen that feature matching is the main step limiting the real-time performance, with feature matching being the primary time-consuming step (more than 60%). The proposed method reduces the matching time to half that of the original algorithm, and the improved RANSAC’s runtime is only one-third of the original, significantly enhancing the algorithm’s real-world ability. This improvement is mainly attributed to the use of neighborhood support and KD-trees, which simplify the repeated computation of feature point similarity. Overall, the proposed algorithm demonstrates a good real-time performance, while its hardware requirements remain within a reasonable range.
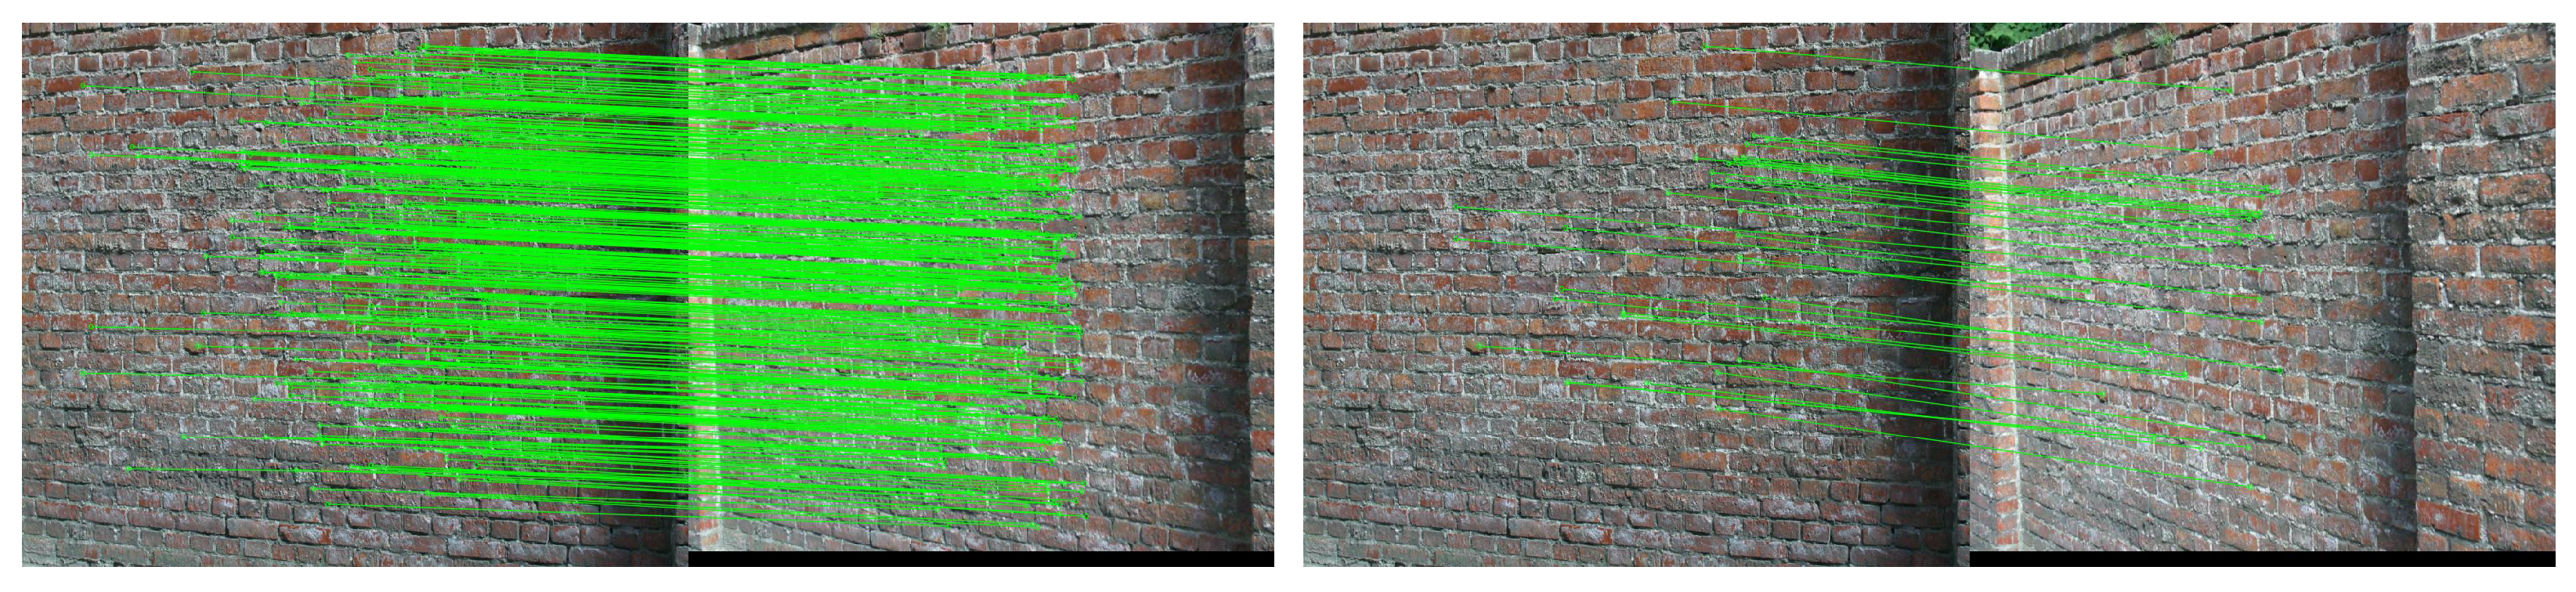
Restricted case analysis. Although our proposed method has exhibited superior performance in the image matching task compared to other algorithms, there is still room for improvement. We show the restricted cases of the proposed method on the Oxford dataset. As shown in Figure 9, the algorithm can detect a large number of feature points on normal wall images (left case) with high matching accuracy. On the other hand, only a few feature points can be detected on images with severe viewpoint changes (right case). This phenomenon is mainly because the severe view angle changes distort the local features, making it difficult to match the feature points successfully.
Embedded platform deployment. One limitation is that all our experiments were conducted on a general-purpose computing platform, which does not reflect the resource-constrained nature of typical embedded platforms used in UAV applications. While the current results provide a baseline for algorithm performance, future work could focus on evaluating the proposed method on representative constrained hardware platforms such as FPGAs. This will help to assess the real-world feasibility and optimization potential of our approach.
Operation security. In real-world UAV-based power infrastructure inspection systems, cybersecurity is a critical concern. Potential threats include sensor spoofing (e.g., using fake towers to confuse detection), tampering with the image transmission pipeline (e.g., intercepting or modifying image streams), and adversarial image perturbations that may mislead the image matching algorithm. For these problems, our proposed algorithm would introduce image integrity verification mechanisms, such as digital watermarking or cryptographic hash checking, to ensure the authenticity of the input images. In addition, a robust matching technique strategy can also be employed to enhance the resilience against cyberattacks. Image matching failures may lead to misinterpretation of structural conditions or navigation errors. In this regard, the proposed algorithm ensures the reliability of the matching output results through introducing a verification step. This step involves cross-validating the matched image features with historical grid data and applying confidence scoring.
UAV-based power infrastructure inspection is also inherently safety-critical. A failure in image matching could lead to misinterpretation of structural conditions or navigation errors. Therefore, ensuring robustness to failures, real-time response guarantees, and fallback mechanisms is essential for future deployment. The current version of our algorithm focuses on accurate and efficient image matching under normal conditions. Future work will extend the system with real-time constraints and fault-tolerance mechanisms, such as timeout-based watchdogs, multi-stage verification pipelines, or confidence-driven fallback strategies. Additionally, it is important to analyze the timing determinism of the algorithm under resource constraints, especially when deployed on embedded platforms. These aspects are vital to enhance the reliability and safety of the system in practical, autonomous operations.

6. Conclusions

This study proposes an improved image matching algorithm for aerial images of transmission towers, aiming to achieve accurate and efficient image matching. The proposed approach incorporates the CLAHE method for image preprocessing, effectively adjusting contrast and emphasizing edge features to facilitate more reliable feature keypoints. In addition, a novel three-stage matching framework is introduced to estimate the transformation matrix. In the final stage, an improved RANSAC algorithm with neighborhood support refines the set of matching points, resulting in higher accuracy and reduced computational complexity. The proposed method performs the AKAZE algorithm by 4%∼15% in terms of matching accuracy on different image sets. Meanwhile, the algorithm also exhibits strong robustness under various challenging conditions that are commonly encountered in aerial images of transmission towers. These results demonstrate that the proposed method would meet the requirements for UAV-based applications in the power system.

Author Contributions

Conceptualization, R.C. and P.Y.; methodology, R.C., P.Y., and S.W.; software, S.W. and C.L.; validation, S.W. and Y.X.; formal analysis, X.L, S.W., and Y.X.; investigation, C.L.; resources, R.C. and Y.X.; data curation, P.Y.; writing—original draft preparation, P.Y. and C.L.; writing—review and editing, R.C. and S.W.; visualization, C.L.; supervision, Y.X.; project administration, R.C. and Y.X.; funding acquisition, P.Y. All authors have read and agreed to the published version of the manuscript.

Funding

This research was supported by the Science and Technology Project of China Southern Power Grid Co., Ltd. (030700KC23070011).

Institutional Review Board Statement

Not applicable.

Informed Consent Statement

Not applicable.

Data Availability Statement

The Oxford image matching dataset can be available publicly at https://www.robots.ox.ac.uk/~vgg/research/affine (accessed on 27 March 2025).

Conflicts of Interest

Authors Ruihua Chen, Pan Yao and Shuo Wang were employed by the company Jiangmen Power Supply Bureau of Guangdong Power Grid Co., Ltd. The remaining authors declare that the research was conducted in the absence of any commercial or financial relationships that could be construed as a potential conflict of interest.

References

  1. Custers, B. Future of Drone Use; Springer: Berlin/Heidelberg, Germany, 2016. [Google Scholar]
  2. Messaoudi, K.; Oubbati, O.S.; Rachedi, A.; Lakas, A.; Bendouma, T.; Chaib, N. A Survey of UAV-Based Data Collection: Challenges, Solutions and Future Perspectives. J. Netw. Comput. Appl. 2023, 216, 103670. [Google Scholar] [CrossRef]
  3. Yang, L.; Fan, J.; Liu, Y.; Li, E.; Peng, J.; Liang, Z. A Review on State-of-the-Art Power Line Inspection Techniques. IEEE Trans. Instrum. Meas. 2020, 69, 9350–9365. [Google Scholar] [CrossRef]
  4. Lv, X.L.; Chiang, H.D. Visual Clustering Network-Based Intelligent Power Lines Inspection System. Eng. Appl. Artif. Intell. 2024, 129, 107572. [Google Scholar] [CrossRef]
  5. Tian, J.; Luo, S.; Wang, X.; Hu, J.; Yin, J. Crane Lifting Optimization and Construction Monitoring in Steel Bridge Construction Project Based on BIM and UAV. Adv. Civ. Eng. 2021, 2021, 5512229. [Google Scholar] [CrossRef]
  6. Ma, J.; Jiang, X.; Fan, A.; Jiang, J.; Yan, J. Image Matching from Handcrafted to Deep Features: A Survey. Int. J. Comput. Vis. 2021, 129, 23–79. [Google Scholar] [CrossRef]
  7. Jin, Y.; Mishkin, D.; Mishchuk, A.; Matas, J.; Fua, P.; Yi, K.M.; Trulls, E. Image Matching across Wide Baselines: From Paper to Practice. Int. J. Comput. Vis. 2021, 129, 517–547. [Google Scholar] [CrossRef]
  8. Kaur, H.; Koundal, D.; Kadyan, V. Image Fusion Techniques: A Survey. Arch. Comput. Methods Eng. 2021, 28, 4425–4447. [Google Scholar] [CrossRef]
  9. Li, H.; Wu, X.J. CrossFuse: A Novel Cross Attention Mechanism Based Infrared and Visible Image Fusion Approach. Inf. Fusion 2024, 103, 102147. [Google Scholar] [CrossRef]
  10. Wang, Z.; Yang, Z. Review on Image-Stitching Techniques. Multimed. Syst. 2020, 26, 413–430. [Google Scholar] [CrossRef]
  11. Shan, J.; Jiang, W.; Huang, Y.; Yuan, D.; Liu, Y. Unmanned Aerial Vehicle (UAV)-Based Pavement Image Stitching without Occlusion, Crack Semantic Segmentation, and Quantification. IEEE Trans. Intell. Transp. Syst. 2024, 25, 17038–17053. [Google Scholar] [CrossRef]
  12. Zhou, L.; Wu, G.; Zuo, Y.; Chen, X.; Hu, H. A Comprehensive Review of Vision-Based 3d Reconstruction Methods. Sensors 2024, 24, 2314. [Google Scholar] [CrossRef] [PubMed]
  13. Li, J.; Li, Y.; Jiang, H.; Zhao, Q. Hierarchical Transmission Tower Detection from High-Resolution SAR Image. Remote Sens. 2022, 14, 625. [Google Scholar] [CrossRef]
  14. Bellavia, F.; Colombo, C. Is There Anything New to Say about SIFT Matching? Int. J. Comput. Vis. 2020, 128, 1847–1866. [Google Scholar] [CrossRef]
  15. Bay, H.; Ess, A.; Tuytelaars, T.; Van Gool, L. Speeded-Up Robust Features (SURF). Comput. Vis. Image Underst. 2008, 110, 346–359. [Google Scholar] [CrossRef]
  16. Wu, K. Creating Panoramic Images Using ORB Feature Detection and RANSAC-Based Image Alignment. Adv. Comput. Commun. 2023, 4, 220–224. [Google Scholar] [CrossRef]
  17. Tang, Q.; Wang, X.; Zhang, M.; Wu, C.; Jiang, X. Image Matching Algorithm Based on Improved AKAZE and Gaussian Mixture Model. J. Electron. Imaging 2023, 32, 23020. [Google Scholar] [CrossRef]
  18. Zhang, J.; Xiong, S.; Liu, C.; Geng, Y.; Xiong, W.; Cheng, S.; Hu, F. FPGA-Based Feature Extraction and Tracking Accelerator for Real-Time Visual SLAM. Sensors 2023, 23, 8035. [Google Scholar] [CrossRef] [PubMed]
  19. Muzzini, F.; Capodieci, N.; Cavicchioli, R.; Rouxel, B. Brief Announcement: Optimized Gpu-Accelerated Feature Extraction for Orb-Slam Systems. In Proceedings of the 35th ACM Symposium on Parallelism in Algorithms and Architectures, Orlando, FL, USA, 17–19 June 2023; pp. 299–302. [Google Scholar]
  20. Tragulnuch, P.; Chanvimaluang, T.; Kasetkasem, T.; Ingprasert, S.; Isshiki, T. High Voltage Transmission Tower Detection and Tracking in Aerial Video Sequence Using Object-Based Image Classification. In Proceedings of the 2018 International Conference on Embedded Systems and Intelligent Technology & International Conference on Information and Communication Technology for Embedded Systems (ICESIT-ICICTES), Khon Kaen, Thailand, 7–9 May 2018; pp. 1–4. [Google Scholar]
  21. Zhang, X.; Gao, J.; Wang, W.; Liu, L.; Zhang, J. Image Mosaic Approach of Transmission Tower Based on Saliency Map. J. Comput. Appl. 2015, 35, 1133–1136. [Google Scholar]
  22. Guo, K.; Cao, R.; Wan, N.; Wang, X.; Yin, Y.; Tang, X.; Xiong, J. Image Matching Algorithm Based on Transmission Tower Area Extraction. J. Comput. Appl. 2022, 42, 1591–1597. [Google Scholar]
  23. Yuan, Z.; Zeng, J.; Wei, Z.; Jin, L.; Zhao, S.; Liu, X.; Zhang, Y.; Zhou, G. CLAHE-Based Low-Light Image Enhancement for Robust Object Detection in Overhead Power Transmission System. IEEE Trans. Power Deliv. 2023, 38, 2240–2243. [Google Scholar] [CrossRef]
  24. Shi, Z.; Wang, P.; Cao, Q.; Ding, C.; Luo, T. Misalignment-Eliminated Warping Image Stitching Method with Grid-Based Motion Statistics Matching. Multimed. Tools Appl. 2022, 81, 10723–10742. [Google Scholar] [CrossRef]
  25. Bi, W.; Ma, J.; Zhu, X.; Wang, W.; Zhang, A. Cloud Service Selection Based on Weighted KD Tree Nearest Neighbor Search. Appl. Soft Comput. 2022, 131, 109780. [Google Scholar] [CrossRef]
  26. Jiang, X.; Ma, J.; Xiao, G.; Shao, Z.; Guo, X. A Review of Multimodal Image Matching: Methods and Applications. Inf. Fusion 2021, 73, 22–71. [Google Scholar] [CrossRef]
  27. DeTone, D.; Malisiewicz, T.; Rabinovich, A. Superpoint: Self-Supervised Interest Point Detection and Description. In Proceedings of the IEEE Conference on Computer Vision and Pattern Recognition Workshops, Salt Lake City, UT, USA, 18–22 June 2018; pp. 224–236. [Google Scholar]
  28. Sarlin, P.E.; DeTone, D.; Malisiewicz, T.; Rabinovich, A. Superglue: Learning Feature Matching with Graph Neural Networks. In Proceedings of the IEEE/CVF Conference on Computer Vision and Pattern Recognition, Seattle, WA, USA, 14–19 June 2020; pp. 4938–4947. [Google Scholar]
  29. Sun, J.; Shen, Z.; Wang, Y.; Bao, H.; Zhou, X. LoFTR: Detector-Free Local Feature Matching with Transformers. In Proceedings of the IEEE/CVF Conference on Computer Vision and Pattern Recognition, Nashville, TN, USA, 19–25 June 2021; pp. 8922–8931. [Google Scholar]
Figure 1. The framework of the proposed algorithm.
Designs 09 00067 g001
Figure 2. An illustration of the image enhancement algorithm based on CLAHE.
Designs 09 00067 g002
Figure 3. Distribution diagram of incorrect and correct matching of neighborhood matching pairs.
Designs 09 00067 g003
Figure 4. Improved RANSAC algorithm flowchart.
Designs 09 00067 g004
Figure 5. Examples of the Oxford dataset. (a) Image blur, (b) light change, (c) JPEG compression, and (d) viewpoint change.
Designs 09 00067 g005
Figure 6. Examples of the self-built dataset. (a) Transmission towers with viewpoint change, (b) houses with image blur, (c) buildings with scale change, (d) farmland with light change, and (e) forests with rotation.
Designs 09 00067 g006
Figure 7. Comparison of matching results between the AKAZE algorithm and the proposed algorithm. The green line represents the successful matching of feature points in the two images.
Designs 09 00067 g007
Figure 8. Transmission tower images with (a) image blur, (b) scale change, (c) light change, (d) rotation.
Designs 09 00067 g008
Figure 9. Restricted cases of the Oxford dataset. Left: light viewpoint change; right: severe viewpoint change.
Designs 09 00067 g009
Table 1. Correct matching rates on Oxford dataset. The best and the secondary results are marked in bold and underlined, respectively.
Bikes/%Leuven/%Ubc/%Wall/%
SIFT74.43 ± 1.8796.36 ± 0.1877.37 ± 1.4665.69 ± 1.73
SURF79.52 ± 0.8395.73 ± 0.0955.55 ± 1.4359.76 ± 1.64
KAZE80.96 ± 0.9794.90 ± 0.1776.39 ± 1.0162.38 ± 1.42
AKAZE84.77 ± 0.9295.25 ± 0.1970.22 ± 1.1764.65 ± 1.74
The proposed96.11 ± 0.2697.23 ± 0.1277.10 ± 0.9469.02 ± 1.85
Table 2. Matching time on Oxford dataset.
Bikes/msLeuven/msUbc/msWall/msAverage
SIFT737.99 ± 11.99907.98 ± 13.001688.58 ± 57.222962.48 ± 107.311853.01 ± 30.72
SURF1876.00 ± 40.251998.74 ± 31.341146.11 ± 25.542049.40 ± 69.141767.56 ± 22.41
KAZE969.47 ± 16.01880.90 ± 17.361481.79 ± 61.651407.63 ± 51.761200.70 ± 20.97
AKAZE951.13 ± 10.10605.37 ± 12.281069.55 ± 37.17986.88 ± 39.79903.23 ± 14.18
The proposed591.22 ± 8.71371.61 ± 3.18599.71 ± 20.38832.57 ± 28.08598.78 ± 8.98
Table 3. Experimental results of tower image matching with viewpoint change.
Number of Point PairsNumber of Correct MatchesCMR/%Matching Time/ms
SIFT1654147289.002004.21
SURF2433211987.092908.43
ORB25416564.96312.07
AKAZE51944385.36663.15
The proposed84180996.20636.14
Table 4. Experimental results of house image matching with blur.
Number of Point PairsNumber of Correct MatchesCMR/%Matching Time/ms
SIFT50730660.36715.18
SURF94866970.571226.02
ORB1577547.77244.06
AKAZE66056986.21793.67
The proposed50750098.62507.78
Table 5. Experimental results of building image matching with scale change.
Number of Point PairsNumber of Correct MatchesCMR/%Matching Time/ms
SIFT3734352594.405088.82
SURF3441265277.074874.59
ORB36329280.44438.10
AKAZE2220195087.842621.71
The proposed1144108995.19972.28
Table 6. Experimental results of farmland image matching with light change.
Number of Point PairsNumber of Correct MatchesCMR/%Matching Time/ms
SIFT1760170696.932494.96
SURF1808158387.562311.58
ORB25223894.84417.60
AKAZE42819.0581.01
The proposed14114099.29400.15
Table 7. Experimental results of forest image matching with rotation.
Number of Point PairsNumber of Correct MatchesCMR/%Matching Time/ms
SIFT4743432091.087339.51
SURF1450106173.172086.04
ORB54047587.961243.89
AKAZE1345123391.671527.86
The proposed2488239596.261920.62
Table 8. Experimental results of matching transmission tower images with blur change.
123
CMR/% Matching Time/ms CMR/% Matching Time/ms CMR/% Matching Time/ms
SIFT95.681970.4371.54937.9252.05468.86
SURF93.784216.4882.191789.6263.19974.29
AKAZE97.571042.6793.14538.0378.2390.34
The proposed99.681568.4898.19793.0486.88477.95
Table 9. Experimental results of matching transmission tower images with scale change.
123
CMR/% Matching Time/ms CMR/% Matching Time/ms CMR/% Matching Time/ms
SIFT94.641886.3089.201455.6678.25798.19
SURF83.722614.7977.612187.4970.221243.94
AKAZE88.05559.8589.53446.1486.55264.31
The proposed97.51385.0698.33489.4197.92228.17
Table 10. Experimental results of matching transmission tower images with light change.
123
CMR/% Matching Time/ms CMR/% Matching Time/ms CMR/% Matching Time/ms
SIFT97.472546.6094.211911.3586.031096.97
SURF95.565111.8599.544552.8790.603622.72
AKAZE93.98690.0584.18403.6954.26183.72
The proposed99.761709.3899.771353.2299.63937.65
Table 11. Experimental results of matching transmission tower images with rotation change.
123
CMR/% Matching Time/ms CMR/% Matching Time/ms CMR/% Matching Time/ms
SIFT96.622461.5895.072212.3794.712034.96
SURF85.582660.1778.521809.4571.631720.19
AKAZE96.15807.2094.75770.1794.88840.83
The proposed99.43772.0999.171094.6999.06715.78
Table 12. Hardware requirements and runtime of the proposed algorithm on the self-built dataset.
MethodCPU/%Memory/
MB
CLAHE Time/msAKAZE Time/msMatching Time/msRansac Time/ms
RANSAC30.0 ± 3.312.4 ± 0.321.01308.8 ± 4.381736.5 ± 2.951655.5 ± 1.16
The improved RANSAC39.1 ± 3.023.1 ± 0.311.01307.9 ± 5.14887.4 ± 1.55546.4 ± 0.63
Disclaimer/Publisher’s Note: The statements, opinions and data contained in all publications are solely those of the individual author(s) and contributor(s) and not of MDPI and/or the editor(s). MDPI and/or the editor(s) disclaim responsibility for any injury to people or property resulting from any ideas, methods, instructions or products referred to in the content.

