1. Introduction
Geosynthetics were integral to the field of civil engineering due to their exceptional impermeability, economic viability, favorable elasticity, and ease of construction [
1]. Amidst the challenges posed by global warming and increasingly stringent carbon emission constraints in engineering construction, optimizing the long-term performance of geotechnical structures and mitigating carbon emissions through the application of geosynthetics has emerged as a critical research avenue. Among the diverse family of geosynthetics, geomembranes are particularly noted for their role as barriers against liquid or gaseous flow, effectively curtailing the migration of harmful substances or water through soil. Their utility is evident in a spectrum of engineering applications, including reservoirs, dams, landfills, reinforced soil slopes, and canals [
2,
3].
In their roles as barriers or reinforcements in landfill systems, embankments, footings, and reinforced embankments, etc., geomembranes are frequently in direct contact with soil. Given the significant disparity in strength and stiffness between these two materials, the geomembrane–soil interface is prone to slippage under the influence of gravity or external loads. Consequently, the shear strength at the geomembrane–soil interface is a pivotal parameter for ensuring the stability of structures that incorporate geomembranes. Accurate assessment of the shear resistance at this interface is essential during the design and construction phases to prevent structural failure that may arise from interface slippage [
4,
5].
Direct shear tests, pullout tests, and slope stability tests are commonly employed to investigate the shear characteristics at the geomembrane–soil interface [
6,
7]. The direct shear test, favored for its straightforward apparatus and ease of controlling experimental conditions, allows for the direct measurement of the shear stress–strain relationship and the determination of interface shear strength between soil and geomembrane [
8]. Consequently, it has garnered widespread application in research. Empirical evidence suggests that the surface characteristics of the geomembrane, including roughness and texture, as well as the properties and conditions of the soil, such as particle size, shape, and density, significantly influence the shear strength at the interface [
9,
10].
Fleming et al. [
11] delved into the shear strength of the geomembrane–soil interface under unsaturated conditions, uncovering that the effective stress–shear strength relationship of the interface could be anticipated by employing the principles of unsaturated soil mechanics, particularly at low normal stress levels [
11]. Markou and Evangelou [
12] conducted direct shear tests to scrutinize the shear resistance characteristics of the soil–geomembrane interface, discovering a pronounced dependence of shear resistance parameters on soil particle shape and geomembrane surface characteristics [
12]. Araujo et al. [
13] meticulously examined the impact of geomembrane surface roughness parameters on the shear strength of various interfaces through a comprehensive suite of inclined plane tests coupled with microscopic surface roughness analyses. Their findings revealed a robust correlation between the mean height profile element and the core material volume parameters with interfacial shear strength. Consequently, they introduced the interfacial roughness factor as a metric to estimate the interfacial friction between geomembranes and geotextiles, predicated on material properties [
13]. Khan and Latha [
14,
15] quantitatively characterized the particle shape and size and the surface roughness of the geomembrane, identifying a significant influence of particle shape on the interface strength and its formation process. Chao et al. [
16], capitalizing on data from 623 laboratory interface direct shear experiments, developed a machine learning model to predict the peak shear strength of the clay–geomembrane interface, highlighting that atmospheric pressure is the most influential factor on peak shear strength, surpassed only by geomembrane roughness. Sergio Luiz da Costa Junior [
17] performed direct shear tests on textured geomembranes with varying bump heights against two distinct soil types, observing no significant impact of bump height on interface parameters, indicating the necessity to assess additional textural properties. Feng and Wang [
18] conducted a series of direct interface shear tests on three distinct geomembranes against soil, employing a novel machine learning model that effectively forecasted the peak friction angle of the interface.
Furthermore, the interfacial behavior between geomembranes and soil masses is significantly influenced by varying hydrothermal and mechanical conditions, as well as by the test environments in direct shear tests [
19,
20]. Over 25% of the global land area is classified as permafrost regions. During temperature oscillations between positive and negative values, the freezing of water into ice within the soil substantially affects the soil’s physical and mechanical properties [
21]. Generally, soil strength tends to increase with decreasing freezing temperatures [
22]. However, during the interaction between frozen soil and structures, the frost heave deformation of the soil and the structural deformation is often asynchronous, leading to a propensity for interface slippage. The shear properties of the interface between frozen soil and traditional construction materials, such as concrete, metal, and wood, have been extensively studied. Studies indicate that the interfacial shear strength increases with decreasing temperature due to changes in the cemented ice content and temperature within the soil and at the interface, with material properties exerting a significant influence [
23,
24]. Geosynthetics, as a novel construction material with broad application prospects, are increasingly utilized in permafrost regions. The shear properties of the interface between geosynthetics and frozen soil under diverse freezing conditions and the impact of freeze-thaw cycles have garnered considerable research interest [
25]. As a flexible construction material, the shear properties and the soil particle movement characteristics (e.g., sliding, adhesion, friction, interlocking) of geosynthetics at the interface with frozen soil markedly differ from those of traditional building materials [
20].
While existing research has yielded valuable insights into the shear characteristics of the geomembrane–soil interface, there remain challenges and limitations in understanding the mechanical behavior of this interface under diverse freezing conditions. Although geosynthetics are derived from similar raw materials, such as high-density polyethylene (HDPE) and polyvinyl chloride (PVC), the weaving methods employed during their production can significantly vary. Consequently, the shear behavior of the geomembrane–soil interface under different freezing conditions remains poorly understood.
Therefore, there is a pressing need for further investigation into the response of the geomembrane–soil interface shear behavior to varying freezing temperatures. This paper presents the design of a geomembrane–soil interface test system capable of controlling freezing temperatures, based on the direct shear test method. The study analyzes the evolution of shear stress–shear displacement relationships, the variation of interfacial shear strength, and the change in strength ratio under different freezing temperatures and normal pressures. The findings of this research aim to provide a deeper understanding of the interface shear characteristics, thereby enabling engineers to more accurately assess and predict interfacial shear strength during the design of geomembrane-related structures. This, in turn, will contribute to enhancing the safety and economic efficiency of such structural designs.
3. Results and Analysis
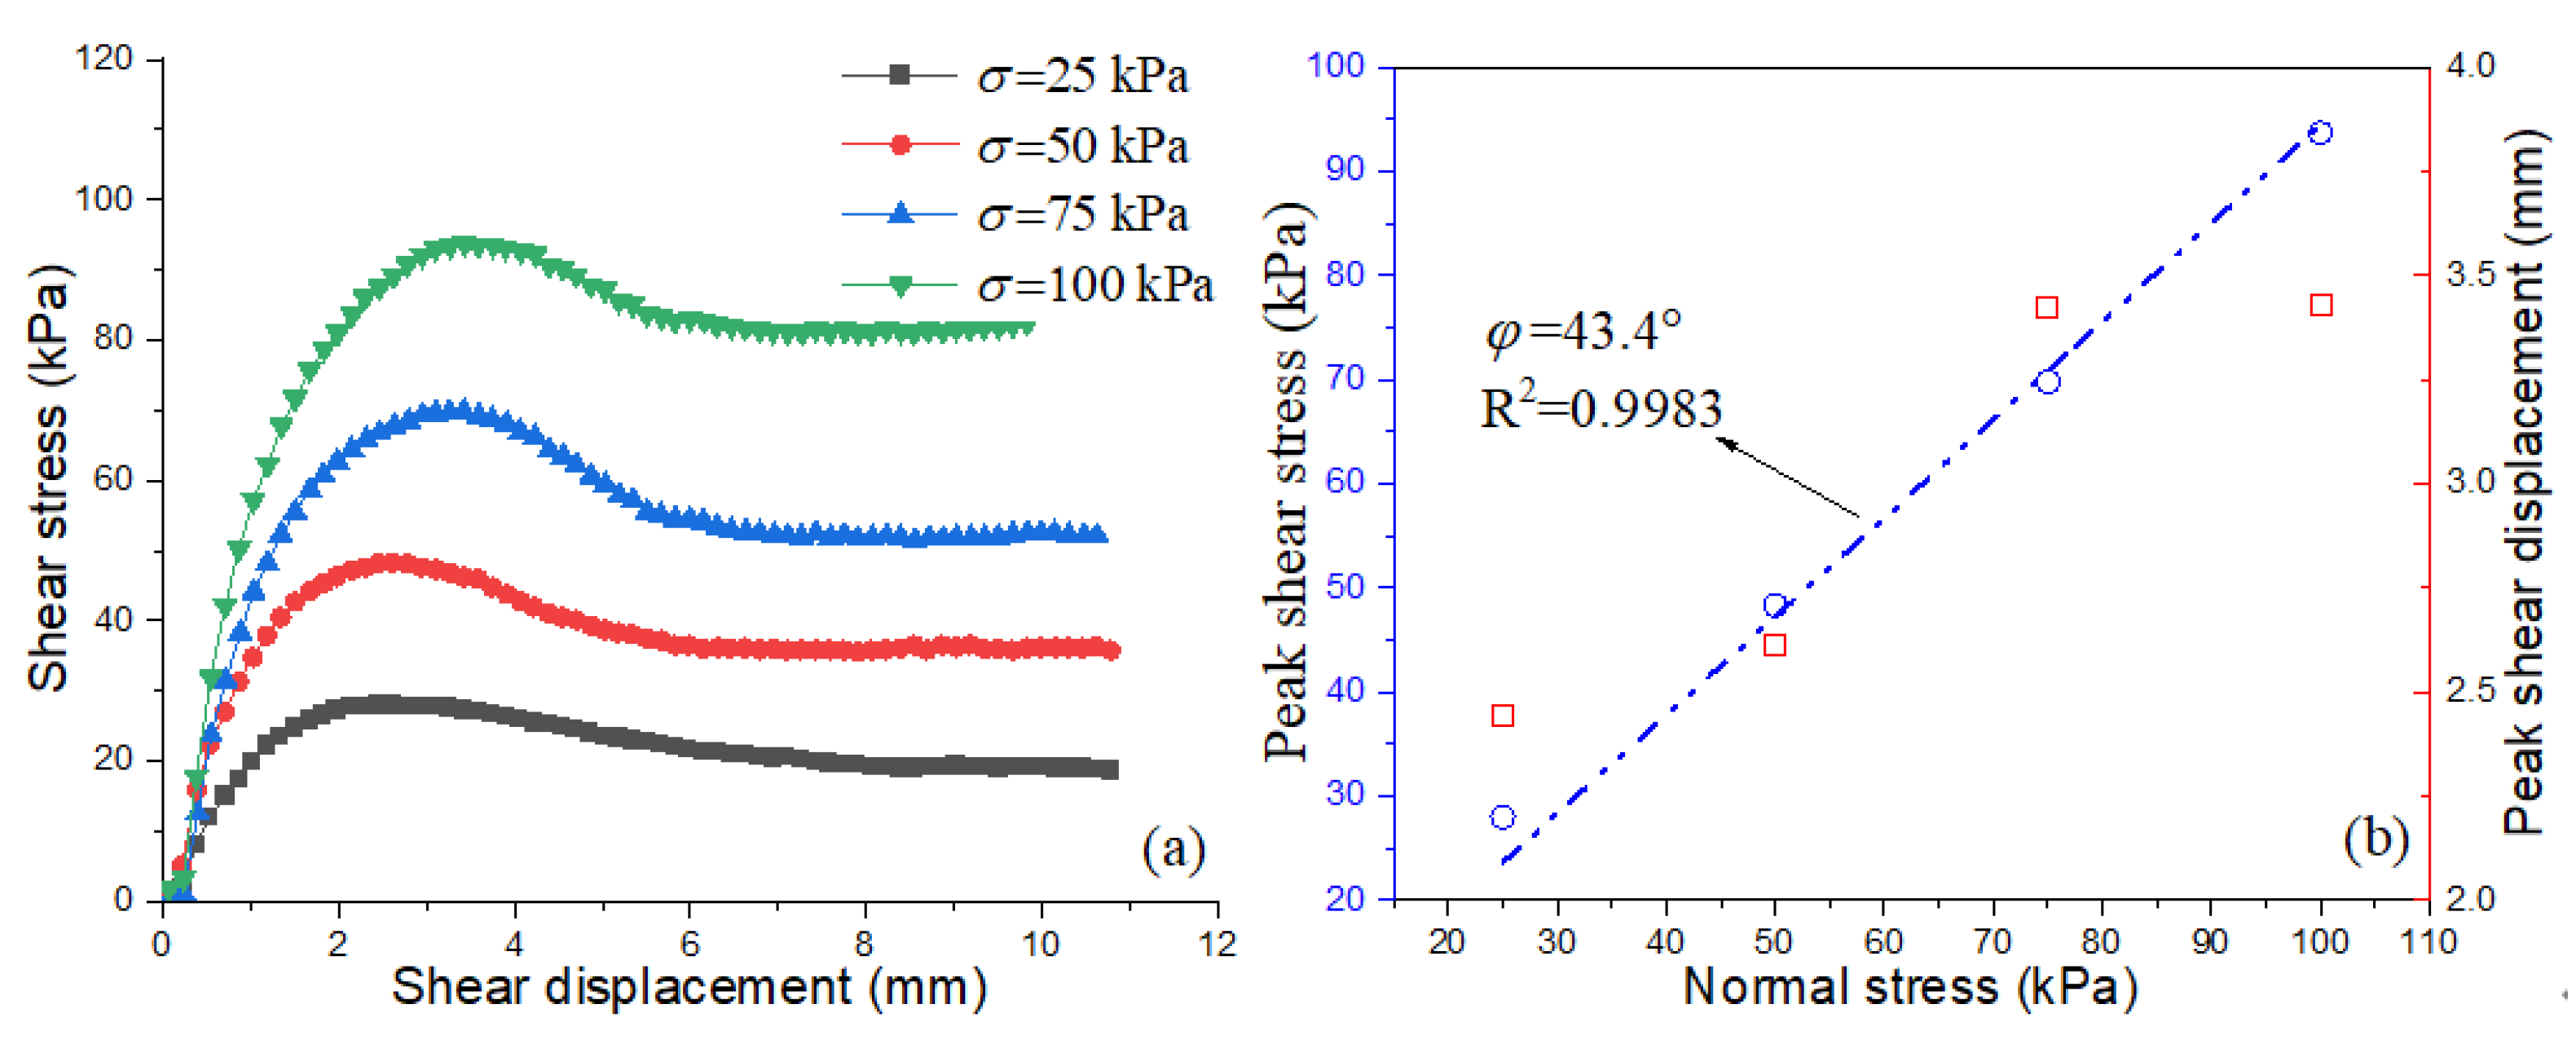
Figure 4 illustrates the response of the soil–geomembrane interface under varying normal pressures at a temperature of 20 °C.
Figure 4a depicts the shear stress–shear displacement curves, which exhibit a strain hardening trend across the different normal pressures. Initially, the shear stress increases rapidly with shear displacement, followed by a gradual deceleration in the rate of increase until a stable state is reached. In this stable state, the shear strength is observed to increase with normal pressure. This is attributed to the granular nature of the soil, where particle friction plays a predominant role in the interaction at the soil–geomembrane interface [
2,
31,
33]. As normal pressure increases, the contact between soil particles and the geomembrane surface becomes more intimate, necessitating greater energy expenditure during shearing to achieve relative displacement between the two.
Figure 4b presents the relationship between normal and horizontal displacements, indicating dilatant behavior at the interface under different normal pressures. Before reaching the peak shear displacement, normal displacement increases with shear displacement; post-peak, the displacement stabilizes. Notably, normal displacement decreases with increasing normal stress, with the maximum normal displacement ranging from 0.32 mm at 25 kPa to 0.15 mm at 100 kPa.
Figure 4c delineates the variation law of the interface peak shear strength and the strength ratio under various normal pressures. It is observed that the interface friction angle is 28.5°, which constitutes merely 65.7% of the soil’s inherent friction angle. The intensity ratio, under different normal pressures, exhibits minimal variation, fluctuating between 0.54 and 0.62. This significant reduction in interface strength is identified as a pivotal factor influencing the composite structure of geosynthetic materials [
32].
Figure 5 presents the response of the soil–geomembrane interface under varying normal pressures at −2 °C. Post-freezing, the unfrozen water content within the soil decreases with the reduction in temperature, typically experiencing a rapid decline phase before stabilizing at an equilibrium value. During freezing, the formation of ice crystals increases, leading to the development of ice cementation within the soil. The strength of this ice cementation, and consequently the frozen soil, increases with decreasing temperature [
20].
Figure 5a indicates that the shear stress–shear displacement curve at the −2 °C interface transitions from a strain hardening behavior at 20 °C to a strain softening behavior, with the softening effect being more pronounced under higher normal pressures. This is attributed to the brittle nature of the cemented ice in frozen soil, which imparts a brittle characteristic to the interface’s mechanical response [
21,
22]. Initially, the interface undergoes elastic deformation. As shear displacement increases, the bonds between the interface soil, cemented ice, and geomembrane are progressively broken, leading to the emergence of brittle fractures in the cemented ice. Additionally, since ice is a frictionless material, it contributes minimally to interface strength post-failure of the cemented ice. These factors collectively result in a rapid decrease in interfacial shear stress post-peak strength, manifesting as strain softening behavior.
Figure 5b illustrates the relationship between normal and shear displacements at −2 °C, revealing dilatant deformation at the interface under different normal pressures. Comparing the normal displacement at 20 °C as shown in
Figure 4b, it is observed that normal displacement increases at −2 °C. This increase is attributed to the formation of larger soil–ice aggregates post-freezing, which, during shearing, roll and cause greater changes in normal displacement [
34,
35,
36,
37].
Figure 5c depicts the changes in peak shear strength and strength ratio at the interface under various normal pressures. The interface friction angle is found to be 44.9 °, which is 103% of the soil’s inherent friction angle. This significant increase in interface friction angle compared to 20 °C is due to the formation of larger soil and ice particle aggregates post-freezing, which, when moved on the geomembrane surface, enhance the interface friction angle. The interfacial strength ratio varies from 0.91 to 1.25, indicating an increase in interfacial shear strength under the influence of cemented ice, thereby augmenting the strength relative to conditions at higher temperatures.
Figure 6 presents the response of the soil–geomembrane interface at −4 °C under various normal pressures. As depicted in
Figure 6a, the shear stress–shear displacement curve exhibits strain hardening at 25 kPa, while at 50 kPa to 100 kPa, the curve demonstrates strain softening, with the softening phenomenon intensifying with increasing normal pressure.
Figure 6b illustrates the relationship between normal displacement and shear displacement, indicating dilatant deformation at the interface under different normal pressures. With the augmentation of normal pressure, the normal displacement at the interface gradually diminishes, attributed to the restrictive effect of higher normal pressure on particle rolling and tumbling. Compared with
Figure 5b, it is observed that the stability value of normal displacement at the interface at −4 °C remains largely unchanged from that at −2 °C, suggesting that the cemented ice between −2 °C and −4 °C exerts minimal influence on the volume or movement process of the soil particle–ice particle aggregate at the interface.
Figure 6c displays the variations in peak shear strength and strength ratio at the interface under different normal pressures. The interface friction angle is found to be 43.8 °, which is 101% of the soil’s friction angle, a similarity to the conditions at −2 °C. The interfacial strength ratio fluctuates between 0.82 and 1.09, suggesting that while the interfacial shear strength increases under the influence of cemented ice, resulting in higher strength compared to the relatively melting state, the change is marginal compared to the conditions at −2 °C.
Figure 7 illustrates the response of the soil–geomembrane interface under various normal pressures at −6 °C. As observed in
Figure 7a, the shear stress–shear displacement curve exhibits weak softening at 25 kPa and 50 kPa and strong softening at 75 kPa and 100 kPa. Notably, at 75 kPa and 100 kPa, the shear stress rapidly decreases after reaching peak intensity and then undergoes a gradual increase to the residual stage. This phenomenon is attributed to the further decrease in temperature, which leads to an increase in the content of cemented ice at the interface. The increased cemented ice enhances the interfacial shear strength, and the brittle fracture becomes more pronounced when the stress reaches peak strength [
5,
24].
Figure 7b depicts the relationship between normal displacement and shear displacement, indicating dilatant deformation at the interface under different normal pressures, with a gradual decrease in normal displacement as normal pressure increases. However, compared to the normal displacement at 2 °C (
Figure 5b) to −4 °C (
Figure 6b), it is evident that the normal displacement at −6 °C decreases significantly. As the temperature decreases, the content of cemented ice in the soil increases, enhancing the soil’s strength and integrity. A multitude of soil particle–ice particle aggregates do not exhibit movement in geoengineering; instead, the tumbling and rolling of relatively smaller aggregates or soil particles and the sliding of the entire soil mass are observed [
38].
Figure 7c presents the variation law of interface peak shear strength and strength ratio under different normal pressures. The interface friction angle is found to be 44.9 °, which is 103% of the soil’s friction angle and similar to that at −2 °C and −4 °C. The interfacial strength ratio ranges between 0.91 and 1.18, suggesting that the interfacial shear strength increases under the influence of cemented ice, resulting in higher strength compared to the relatively melting state, but the change is minimal compared to conditions at −2 °C and −4 °C.
Figure 8 depicts the response of the soil–geomembrane interface under various normal pressures at −10 °C. As evident from
Figure 8a, the peak shear strength of the interface experiences a significant increase, with the peak shear strength at 100 kPa being 49% higher than that observed at −6 °C. This enhancement is attributed to the substantial increase in ice content within the soil and the corresponding augmentation of the contribution of cemented ice to the interface shear strength. Notably, at 75 kPa and 100 kPa, there is a pronounced brittle fracture behavior.
Figure 8b illustrates the relationship between normal displacement and shear displacement, indicating dilatant deformation at the interface under different normal pressures, with a gradual decrease in normal displacement as normal pressure increases. Comparing the normal displacement at −6 °C (
Figure 7b), it is observed that the normal displacement at −10 °C is further reduced. Since the majority of the water in the soil has frozen into ice at −10 °C, the integrity of the soil mass is further strengthened. The interaction between the soil mass and the geomembrane during interfacial shear is predominantly the sliding of the entire soil mass, resulting in minimal normal displacement during the shearing process [
37].
Figure 8c presents the variation law of peak interfacial shear strength and strength ratio under different normal pressures. The interface friction angle is found to be 55.0 °, which is 127% of the soil’s friction angle, showing a further increase compared to −6 °C. The interfacial strength ratio ranges between 1.29 and 1.76, indicating a further increase in interfacial shear strength under the influence of cemented ice.
Figure 9 delineates the temperature-dependent variation of the interface friction angle and the average strength ratio.
Figure 9a indicates that at 20 °C, the interface friction angle is significantly lower than that of the soil itself, highlighting the critical role of the soil–geomembrane interface in structural design considerations. As the temperature declines, the interface friction angle exhibits a pronounced increase, a result of the enhanced contribution of cemented ice to both soil strength and the strength of the soil–geomembrane bond [
19,
20]. In freezing, the ice content in the soil gradually increases as the temperature decreases. The adhesion strength between the soil and the structure will also increase with the increase of the ice content at the interface [
38]. Within the temperature range of −2 °C to −6 °C, the interface friction angle surpasses the soil’s intrinsic friction angle, and at −10 °C, this angle increases dramatically.
Figure 9b demonstrates that the average strength ratio at 20 °C is a concerningly low 0.58, which poses a significant risk for structures that incorporate geomembranes. Even with a design safety factor of 2, this ratio is alarmingly close to the threshold of ultimate strength. With the reduction in temperature, the strength ratio gradually ascends, approaching 1 between −2 °C and −6 °C, indicating that the interface strength at these temperatures is nearly equivalent to the soil’s strength. However, this does not mean that the safety of the structure is enhanced. The potential for frost heave in soil upon negative temperatures still poses a risk of interface instability [
39,
40,
41]. At −10 °C, the average strength ratio increases considerably, thereby augmenting the structural stability in comparison to higher temperatures.
4. Conclusions
This study examines the shear behavior of the soil–geomembrane interface under varying temperature conditions and normal pressures using a temperature-controlled direct shear instrument. The analysis of the shear stress–shear displacement curves, shear displacement–normal displacement curves, interface friction angles, and strength ratios under different test conditions yields the following conclusions:
(1) The shear stress–shear displacement curve of the soil–geomembrane interface exhibits strain hardening characteristics at positive temperatures. Conversely, at negative temperatures, the curve displays weak softening at low normal pressures and strong softening at high normal stresses.
(2) Under diverse temperatures and normal stress conditions, the shear displacement–normal displacement curves of the interface manifest dilatant behavior. At positive temperatures, normal displacement is minimal due to the tumbling and sliding of relatively small soil particles on the geomembrane surface. However, as the temperature decreases, ice cementation leads to an increase in the aggregate volume of soil particles and cemented ice particles, resulting in increased normal displacement. Upon further temperature reduction, the overall strength of the soil is significantly enhanced after a substantial amount of water has frozen, and numerous soil grain-cemented ice particles are frozen as a whole, unable to roll on the geomembrane surface, thus reducing the corresponding normal displacement.
(3) The interface friction angle at negative temperatures is markedly higher than at positive temperatures. The interface friction angle initially increases, then stabilizes, and subsequently increases again with further temperature reduction. The average strength ratio of the interface is a concerningly low 0.58 at 20 °C, posing a significant risk for geomembrane-related composite structures. Even with a structural safety factor of 2, this ratio is alarmingly close to the ultimate strength threshold. The ratio approaches 1 between −2 °C and −6 °C and increases significantly at −10 °C. Due to varying degrees of frost heave in soil after the temperature drops to negative values, the interface remains susceptible to slippage.
In this paper, the shear characteristics of the interface between sand and geomembrane under different temperature conditions are explored only by direct shear test. In engineering systems such as canals and landfills, when the system enters the frozen state, the interfacial shear strength increases, and the system will face frost heave at the same time, but the direct shear test cannot measure the frost heave process, which needs to be studied in future work by physical model experiment.


