


Design and Basic Aerodynamic Analysis of a Drone-Suspended Transport Container for Safe Biological Sample Transport


Abstract
1. Introduction
2. Materials and Methods
2.1. Operational and Technological Constraints for the Design and Construction of the Transport Container
- Weight and dimensions: The suspended transport container must have the lowest possible weight to minimize the energy requirements for transportation. Compact dimensions are necessary to facilitate transportation to various locations and future automation of loading and unloading the contents. In our case, the maximum weight of the container is considered along with the loaded sample transport module, as shown in Figure 1, with dimensions (height × width × depth) of 44 mm × 110 mm × 210 mm and a weight of 935 g. The dimensions of the suspended transport container depend on the drone used, but the maximum dimensions are (height x width x depth) 220 mm × 220 mm × 400 mm. The maximum weight of the suspended transport container, along with the fully loaded sample transport module, is set at a maximum of 3000 g.
- Damage protection: The suspended transport container must be sufficiently sturdy and durable, at a minimum complying with IP66 and IK10 standards, to protect the biological material from damage and contamination during transport. The IP66 standard, defined by the IEC 60529/EN 60529 norm, specifies that the container must be completely dust-tight (IP6X) and protected against powerful water jets from any direction (IPX6). This ensures that the container can withstand challenging environmental conditions, such as exposure to dust, rain, or cleaning processes using high-pressure water. The IK10 standard, specified in IEC 62262/EN 62262, ensures resistance to mechanical impacts of up to 20 joules, equivalent to the impact of a 5 kg object falling from a height of 40 cm. This level of protection guarantees the structural integrity of the container, safeguarding it from accidental drops, collisions, or other mechanical stresses. Additionally, the container should offer adequate protection against vibrations to prevent the devaluation of the transported biological samples by impacts and other forms of damage. In line with project ITMS2014+:313011 ATR9 objectives, impact tests were conducted by another group of researchers in collaboration with authorized certification authorities of the Slovak Republic, and the prototype designed and realized by our team successfully passed all required evaluations. The container should be equipped with an external mechanical lock controlled remotely, allowing it to be opened only from a central control point.
- Accessibility and manipulability: The container should be designed to easily accommodate and facilitate the removal of standard hospital modules with hospital samples, as illustrated in Figure 1. Additionally, the design should enable future possibility of manipulation using automated handling equipment.
- Factors influencing the flight characteristics of drones with a suspended transport container: These can be divided into several categories, such as aerodynamic, me-chemical, electronic, and environmental. Based on these categories, the selection of the simulated factor and its justification will be carried out.
- Selection of a suitable transport drone for the shipping container, in terms of standards and requirements: Standard sizes of drones vary depending on their use and type, but generally, they are usually categorized into several basic groups based on their weight and wingspan or dimensions. Each of these categories has specific rules and regulations depending on the country where the drones are used. Within these categories, further subdivisions based on wingspan, dimensions, or performance can be encountered. Manufacturers and drone designers often provide specifications that allow for comparison of different models within these categories.
- Safety and legal regulation: In the design and construction of the suspended transport container for drones, it is necessary to comply with safety standards and regulations applicable to their operation within the European Union and the bordering states of the Slovak Republic, as mentioned in references [46,47,48,49,50,51,52,53]. Considering the specification of EU project ITMS2014+:313011 ATR9, the operation is planned primarily in EU countries, especially in the Central European region, with a focus on the transportation of samples within urban areas from hospitals to laboratories.
- External climatic conditions: The container should be designed to provide sufficient protection for the samples against adverse climatic conditions, such as extreme temperatures, humidity, wind, snow, etc. An automatic thermoregulation system is preliminarily addressed as well, should the transported biological samples require it following the execution of real-world experiments.
2.2. Methodology for the Selection of the Shape of the Transport Container
- Elliptical cylinders: These shapes could further streamline the aerodynamic profile while maintaining sufficient internal volume for sample modules. Compared to a rounded cylinder, elliptical cylinders could reduce drag more effectively, especially at higher speeds.
- Teardrop shapes: Inspired by natural aerodynamic forms, teardrop shapes might offer superior drag reduction. They are especially beneficial at speeds exceeding the operational limits of typical quadcopters, as their tapered design minimizes turbulence.
- Multi-faceted geometries: Shapes combining flat and curved surfaces, such as hexagonal cylinders with rounded ends, might balance ease of manufacturing with improved airflow management. These shapes could also provide modularity, allowing integration of additional features like thermoregulation systems.
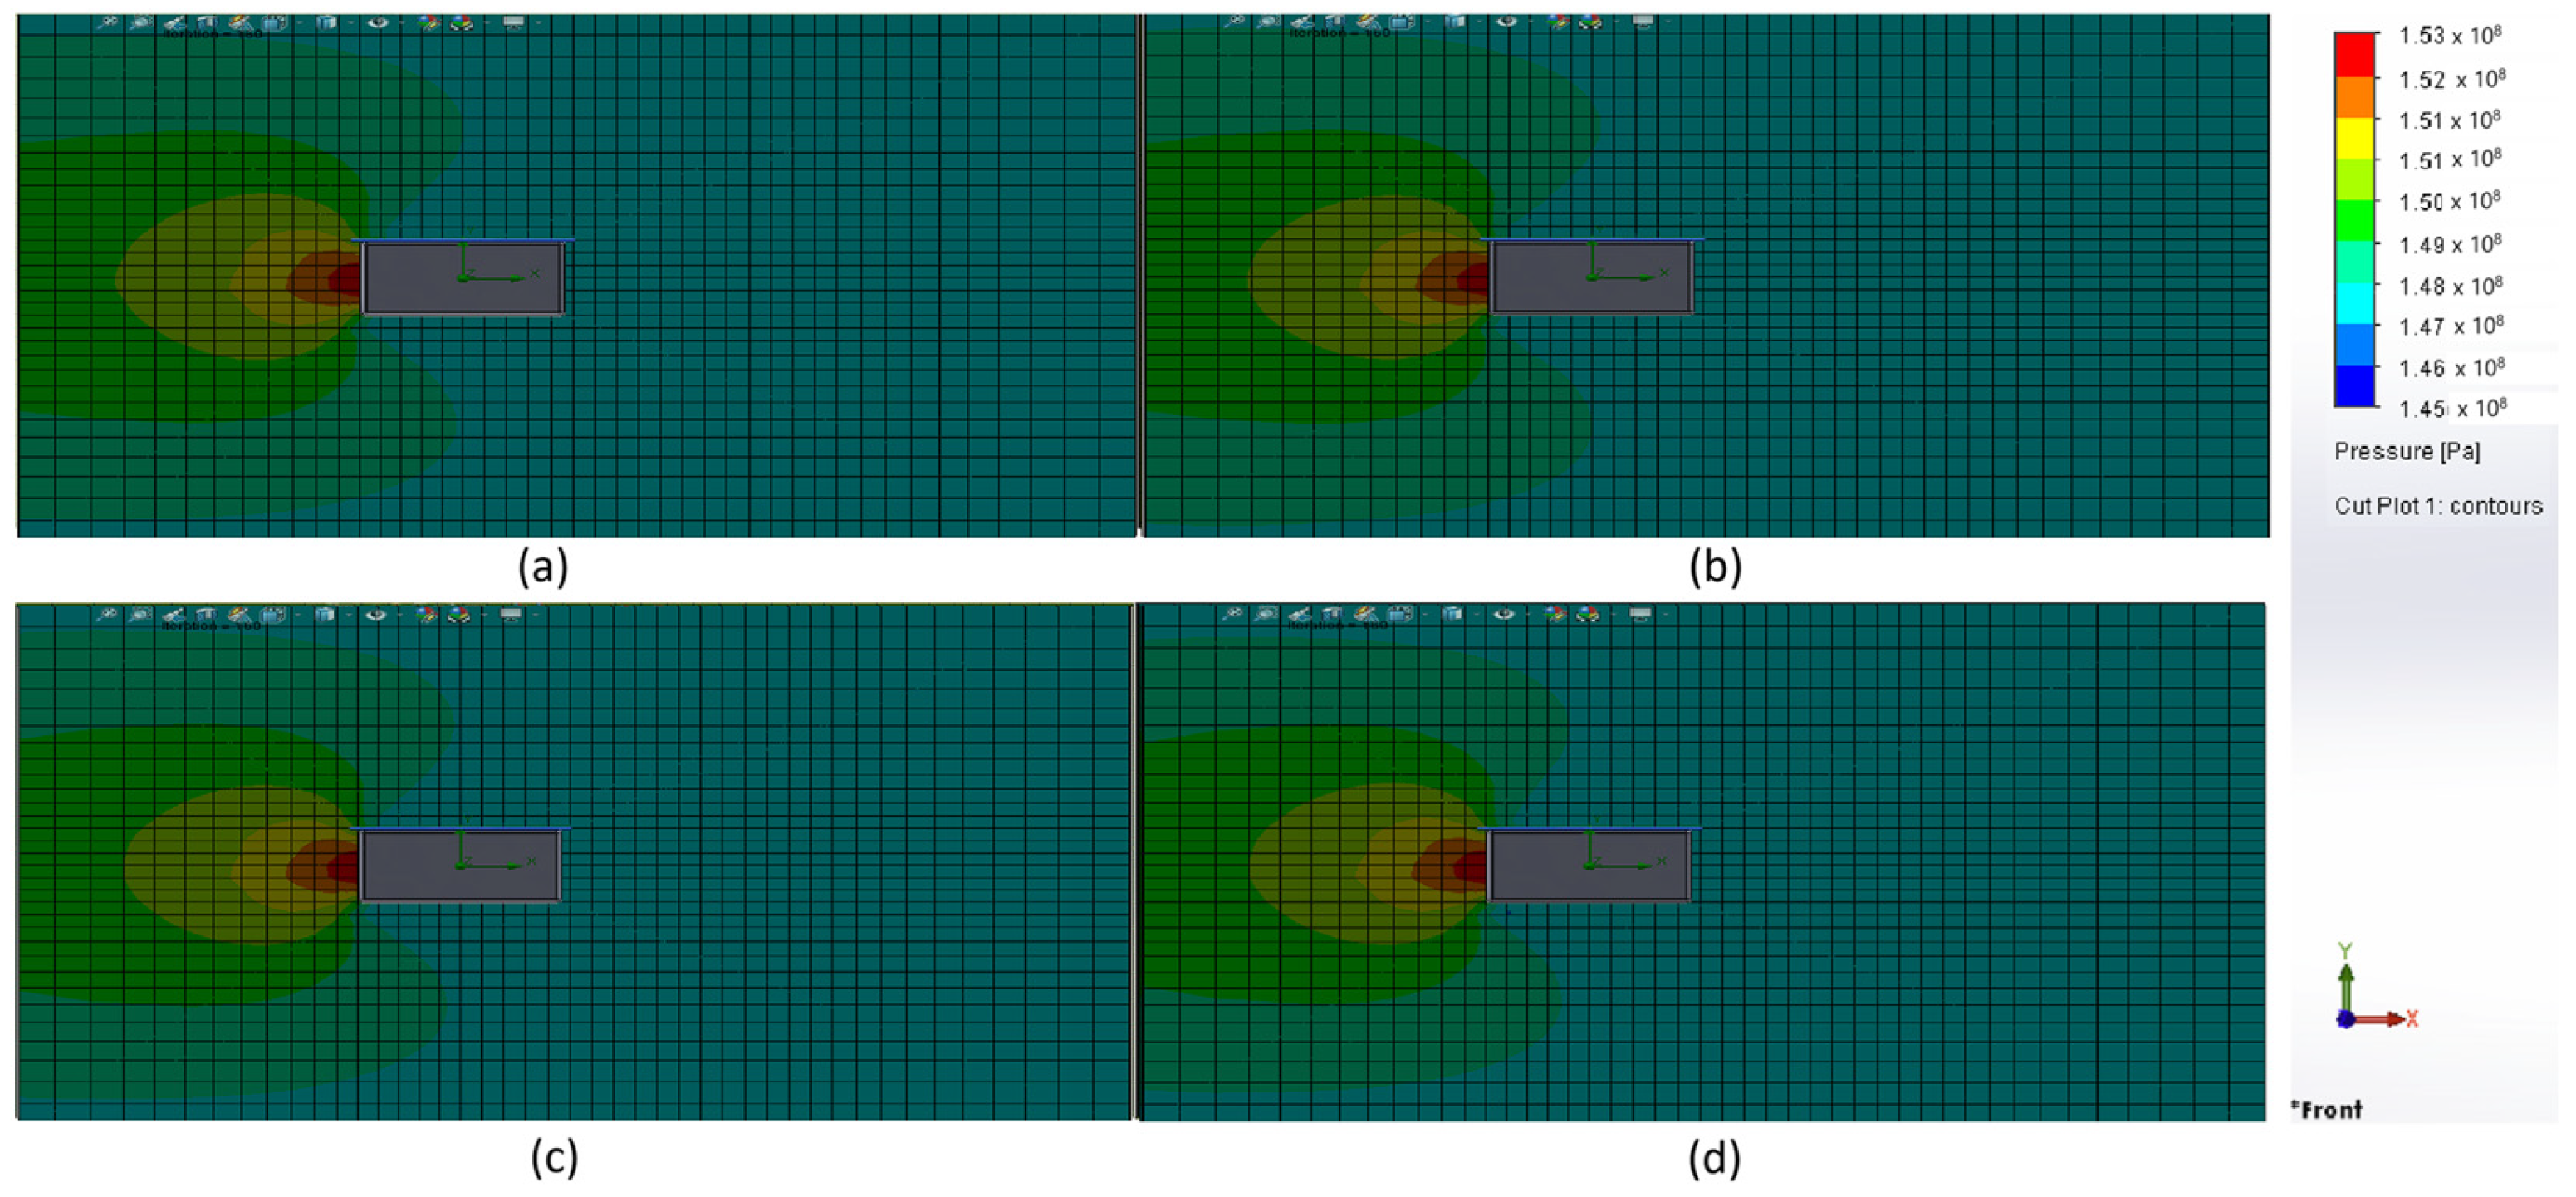
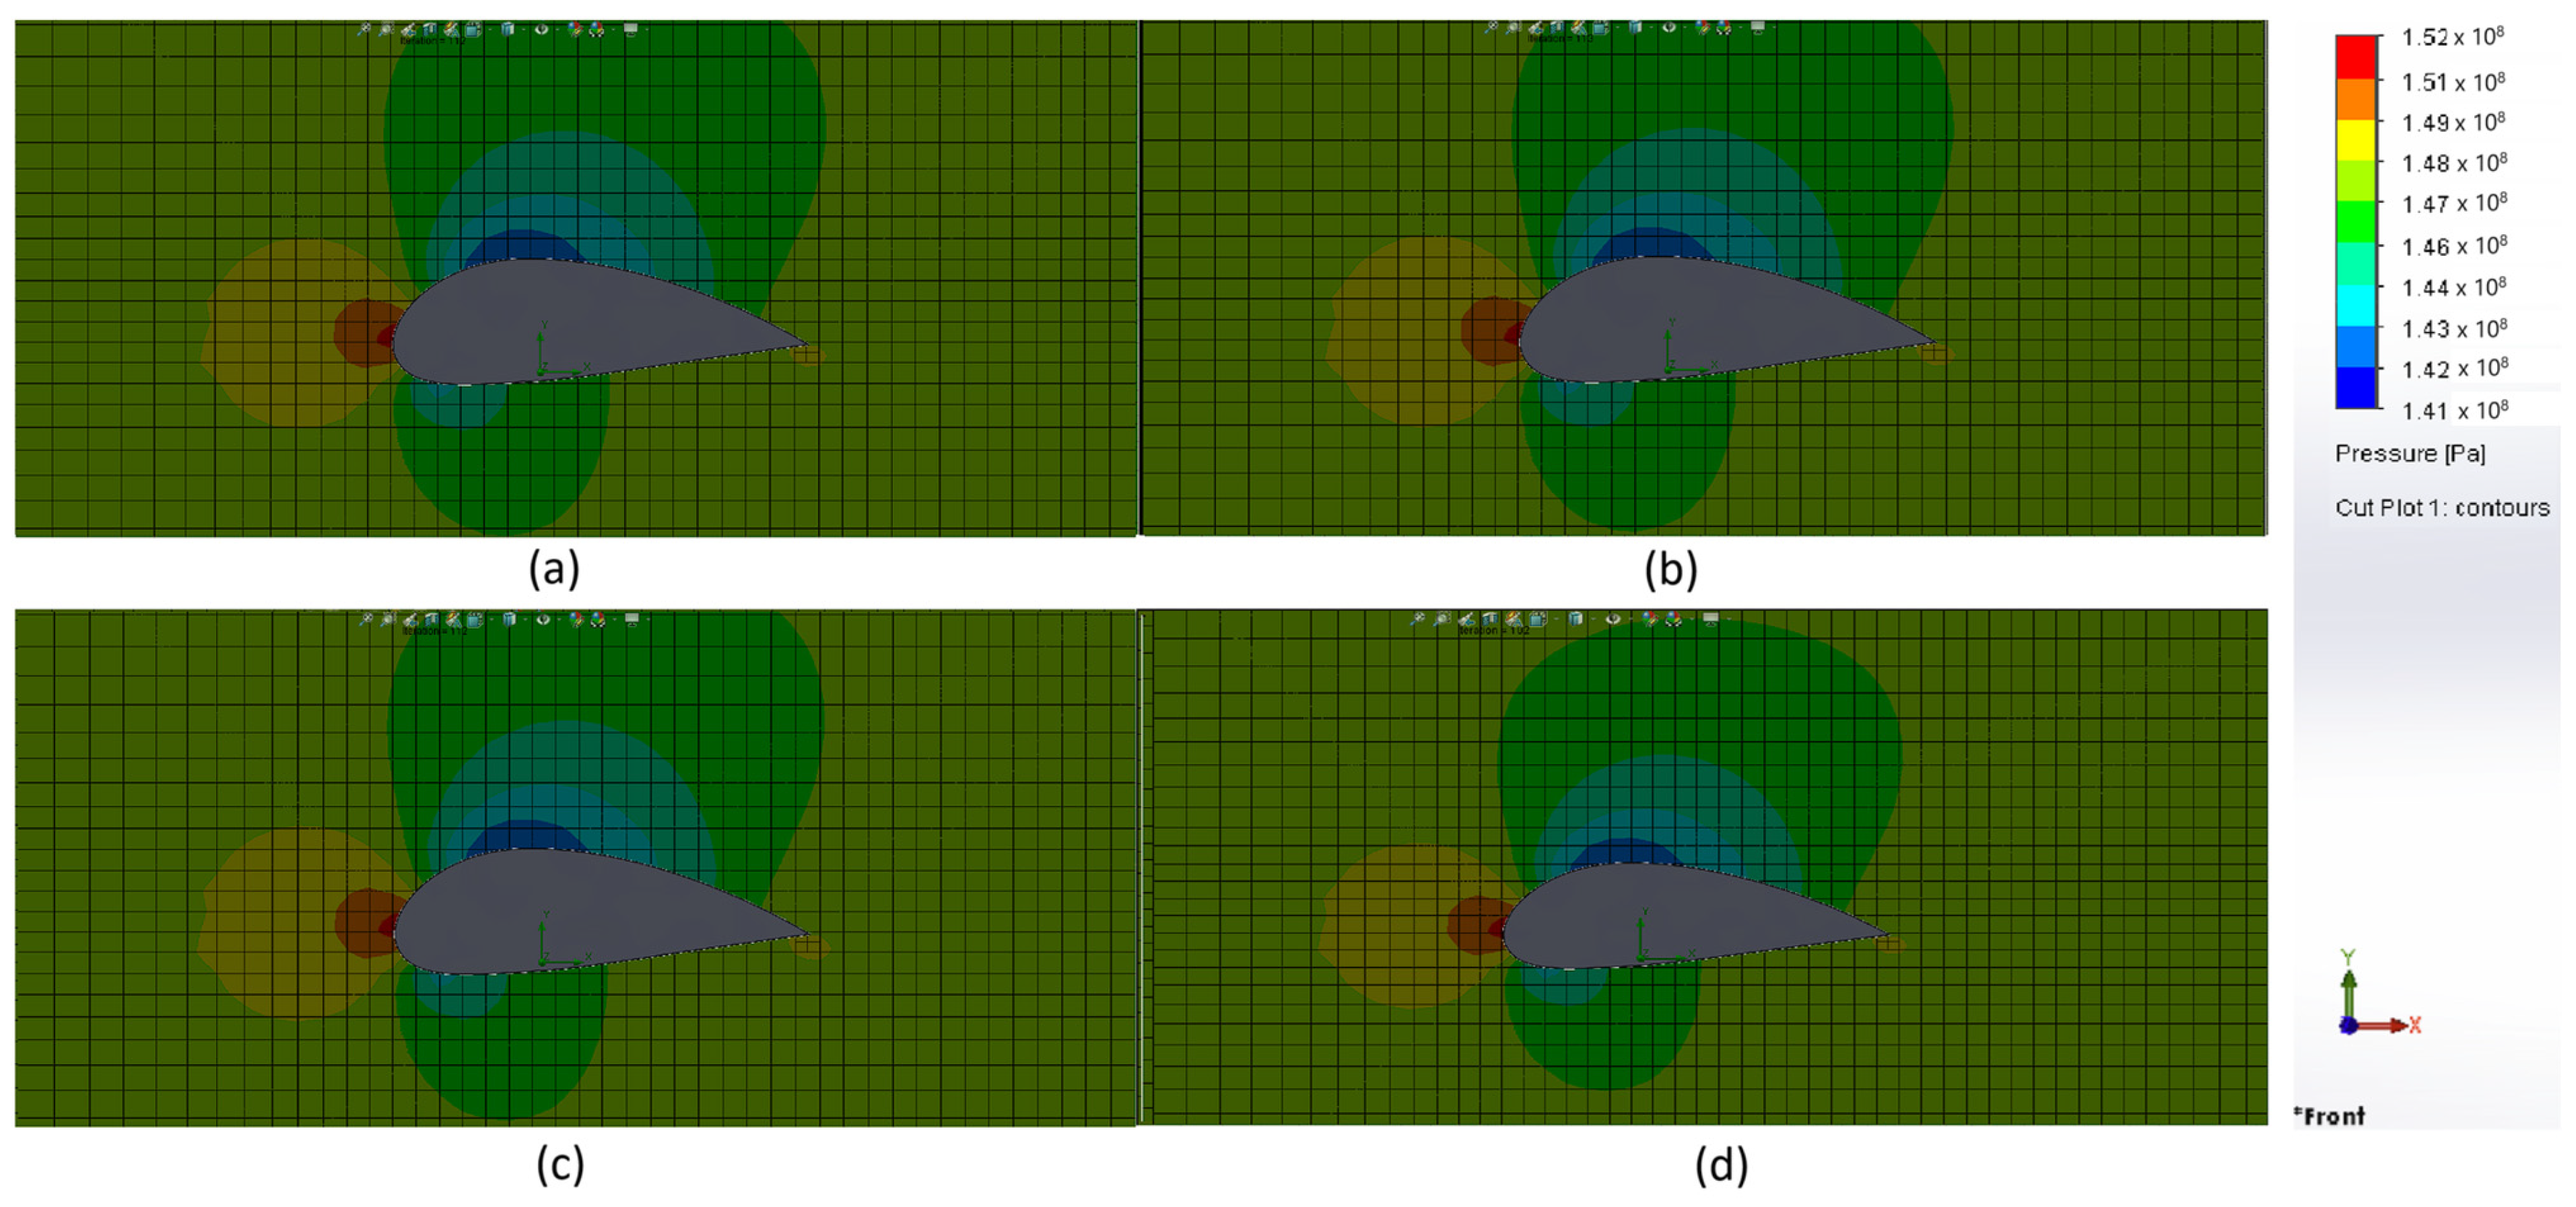
- The rectangular prism shown in Figure 2 represents the most basic shape a transport container can have. It is structurally simple and cheap to manufacture. It does not include unnecessary volumetric shapes that would increase the weight in the form of so-called dead weight—unused volume. From an aerial transport perspective, its frontal flat surface creates the greatest aerodynamic resistance among all the chosen shapes. It is easy to handle and suitable for automated manipulation. However, in the event of the container falling, there is a risk of rotation around its longest edge, potentially causing damage to the transported sensitive biological samples due to centrifugal rotational force. The simulation results can generally be aligned to those of a transport container in the shape of a cube, as the air pressure acting during forward flight will be approximately the same.
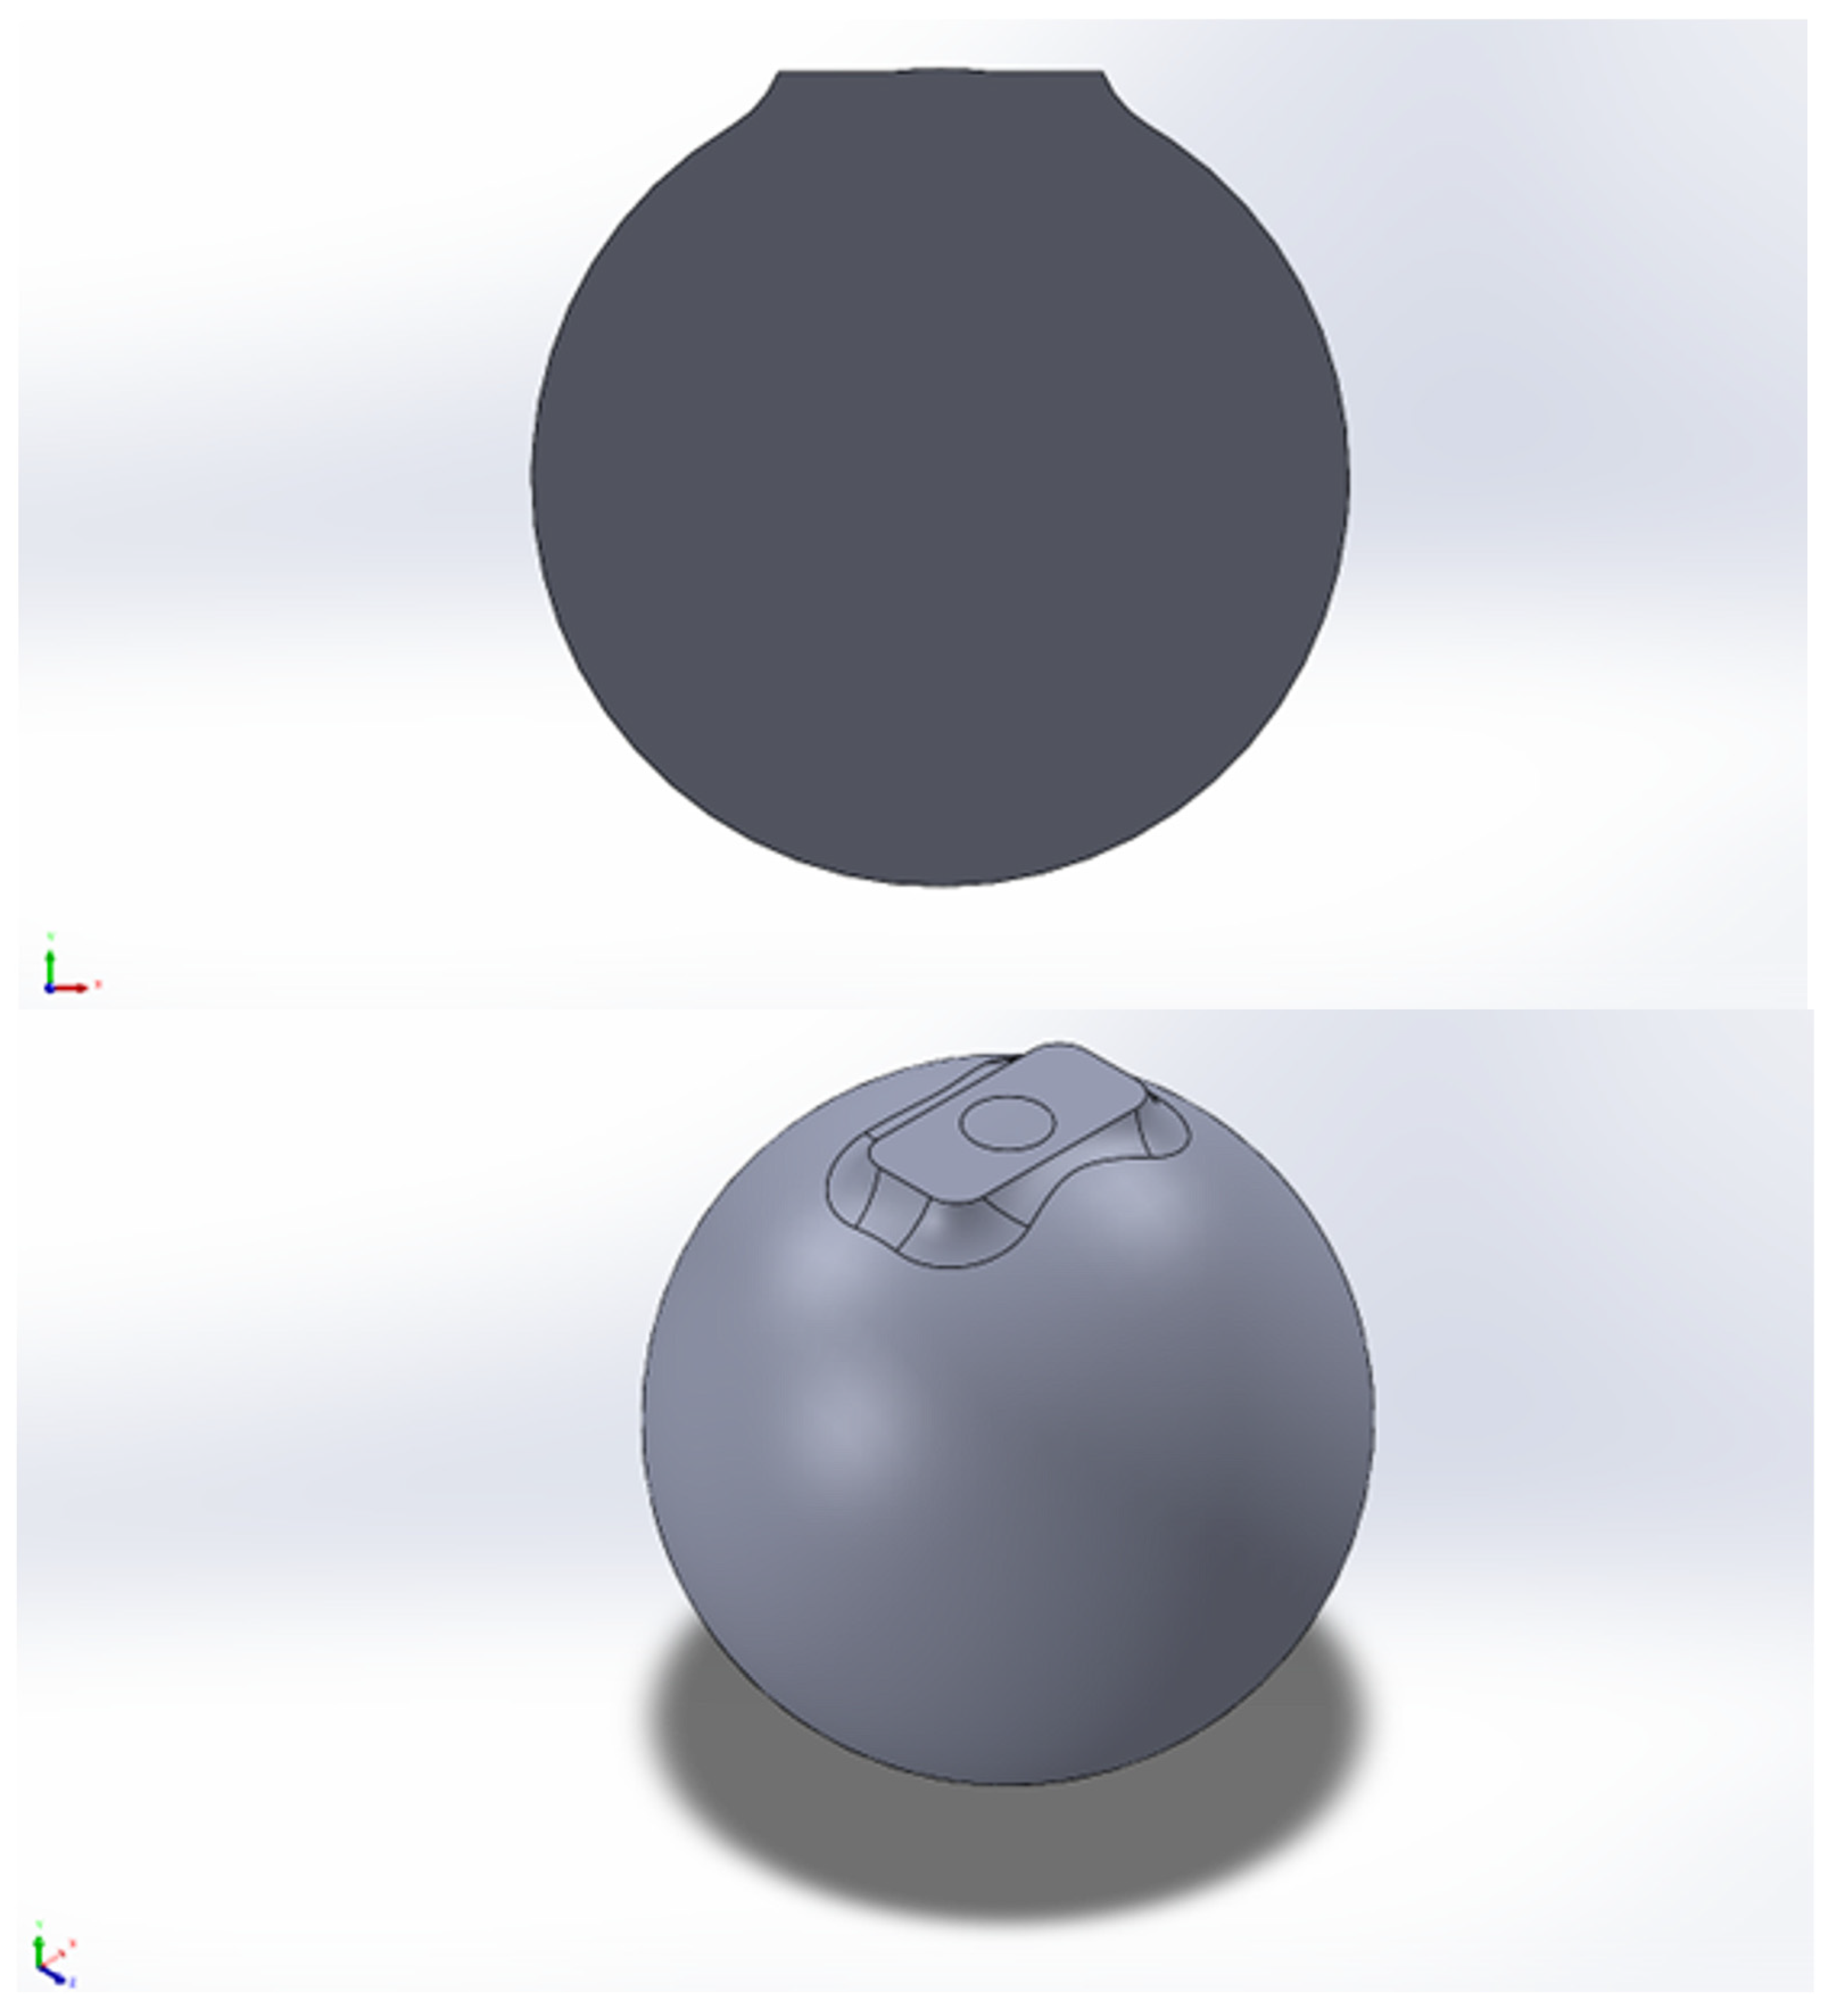
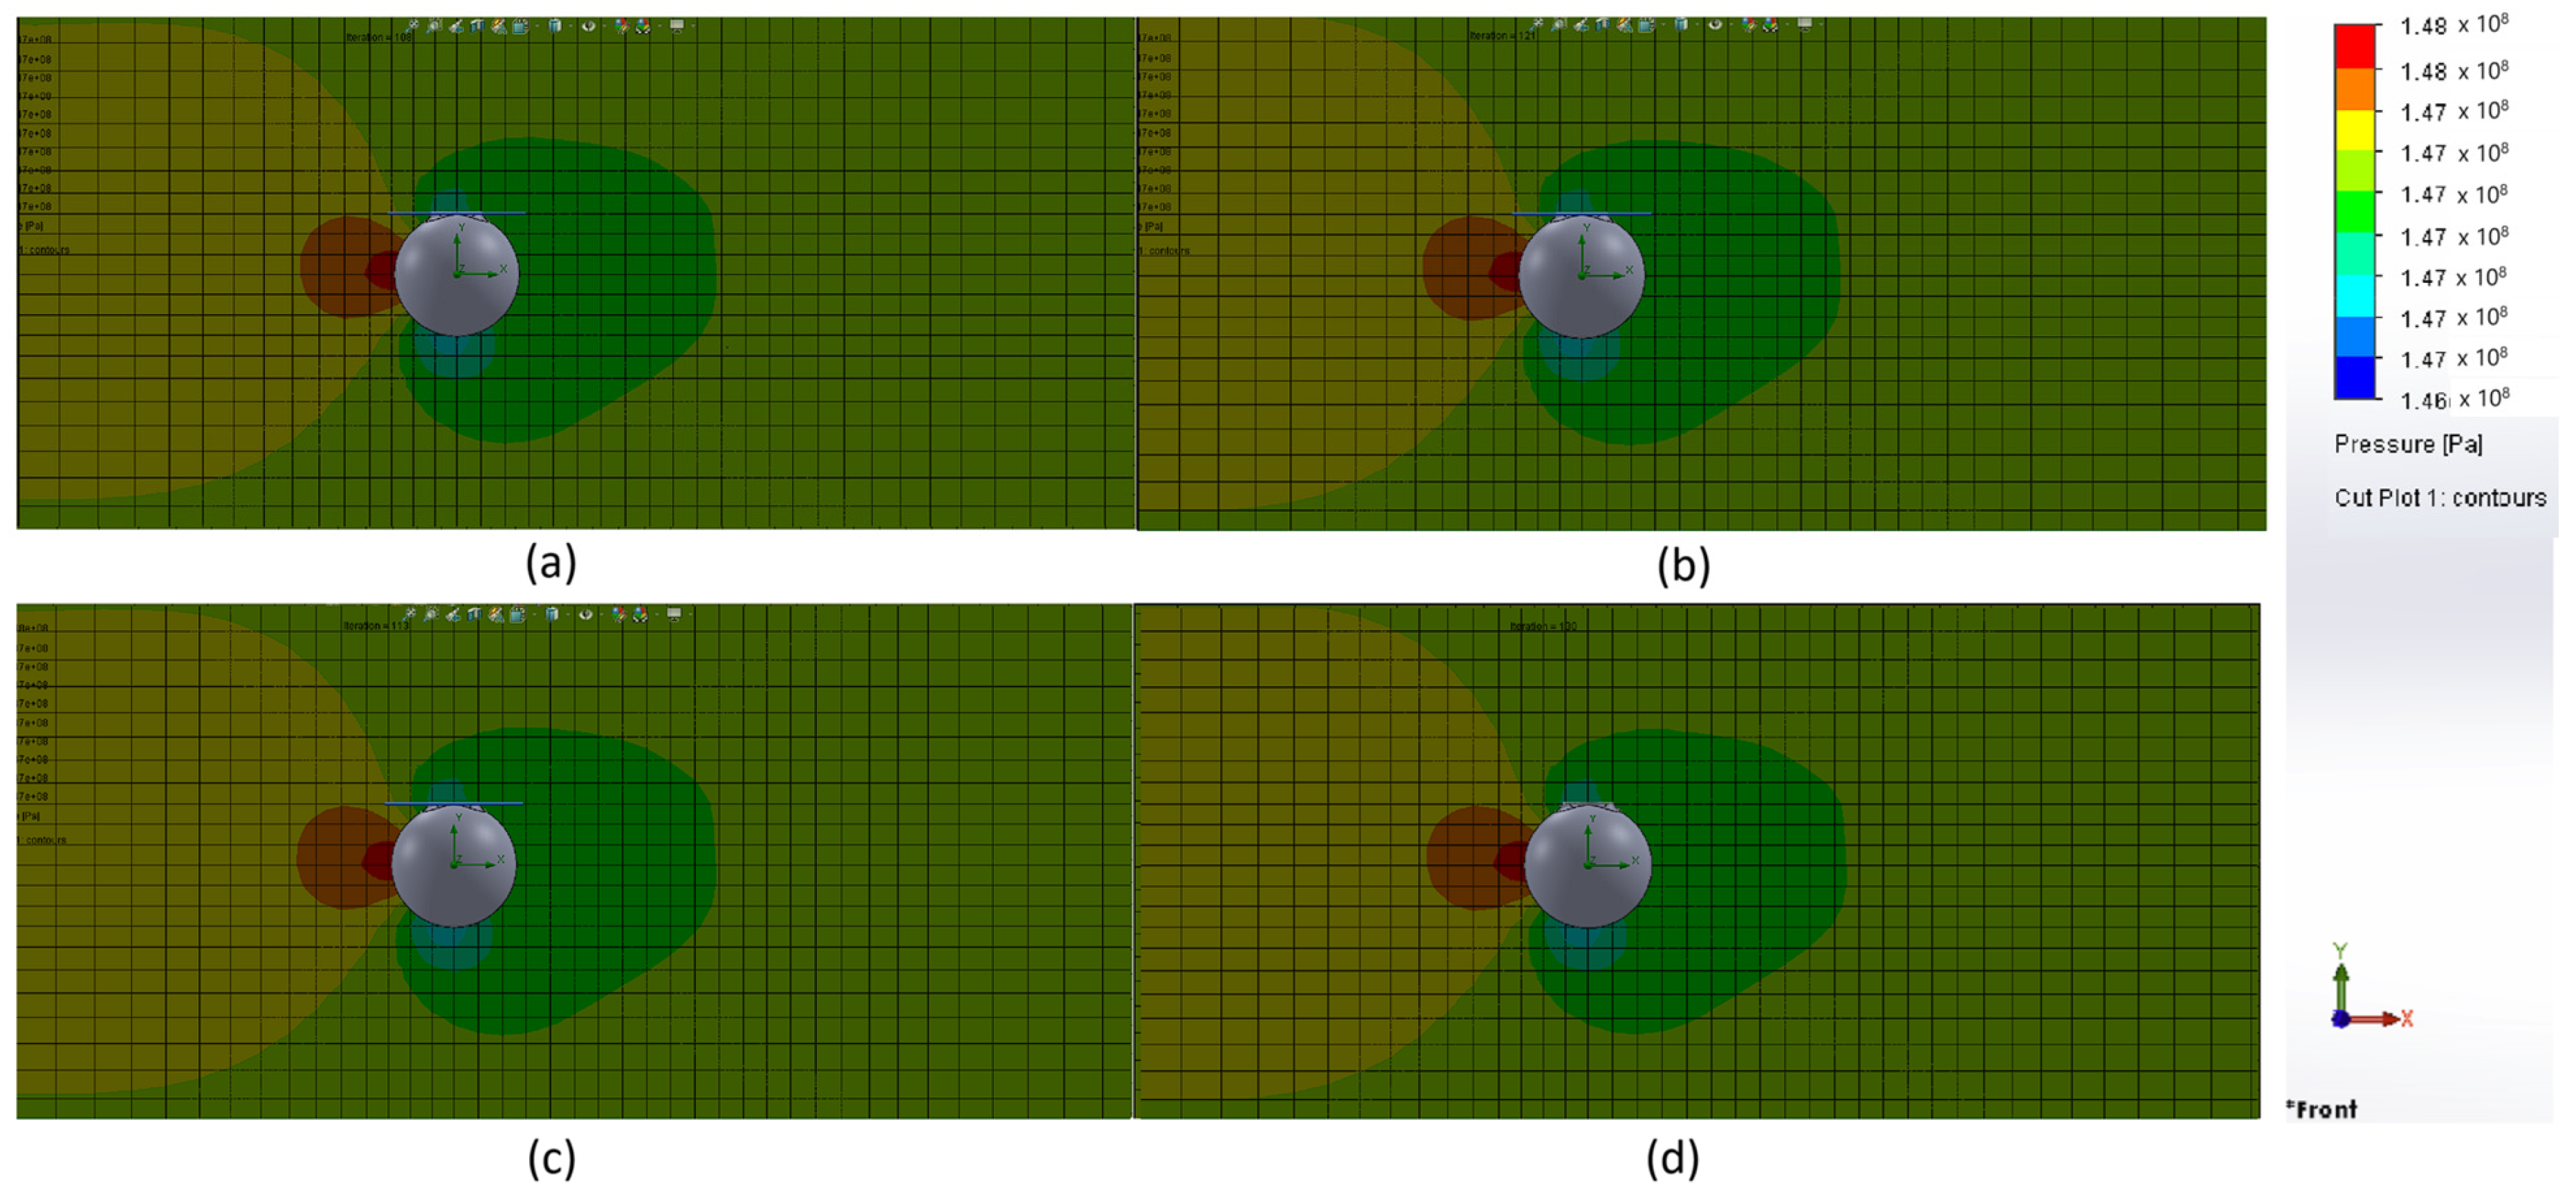
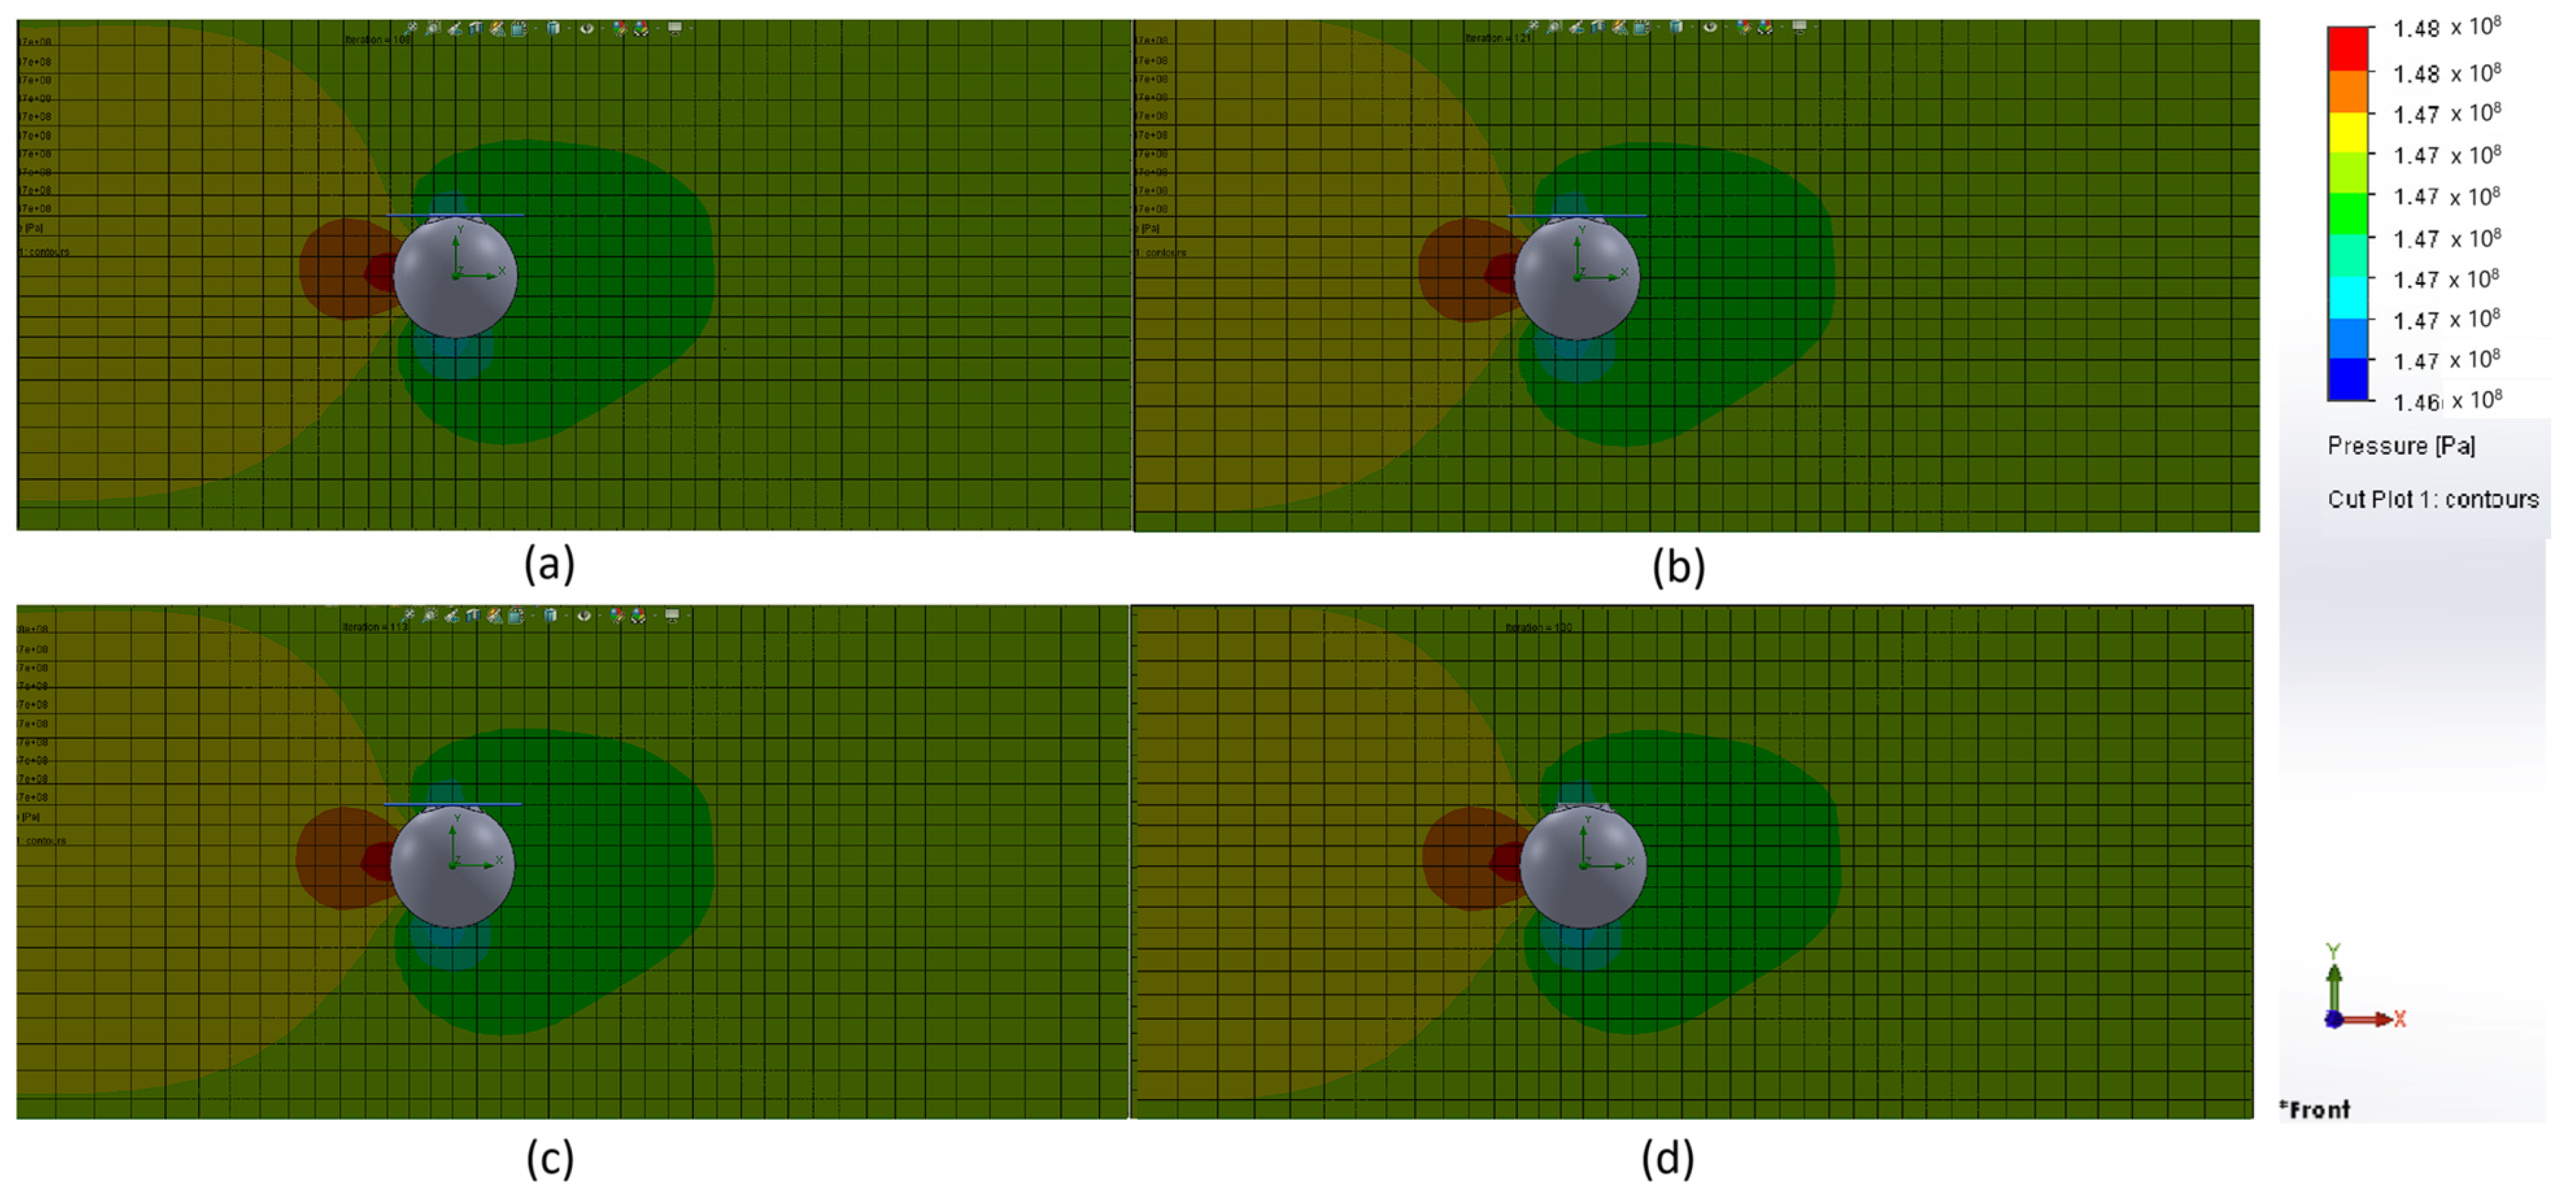
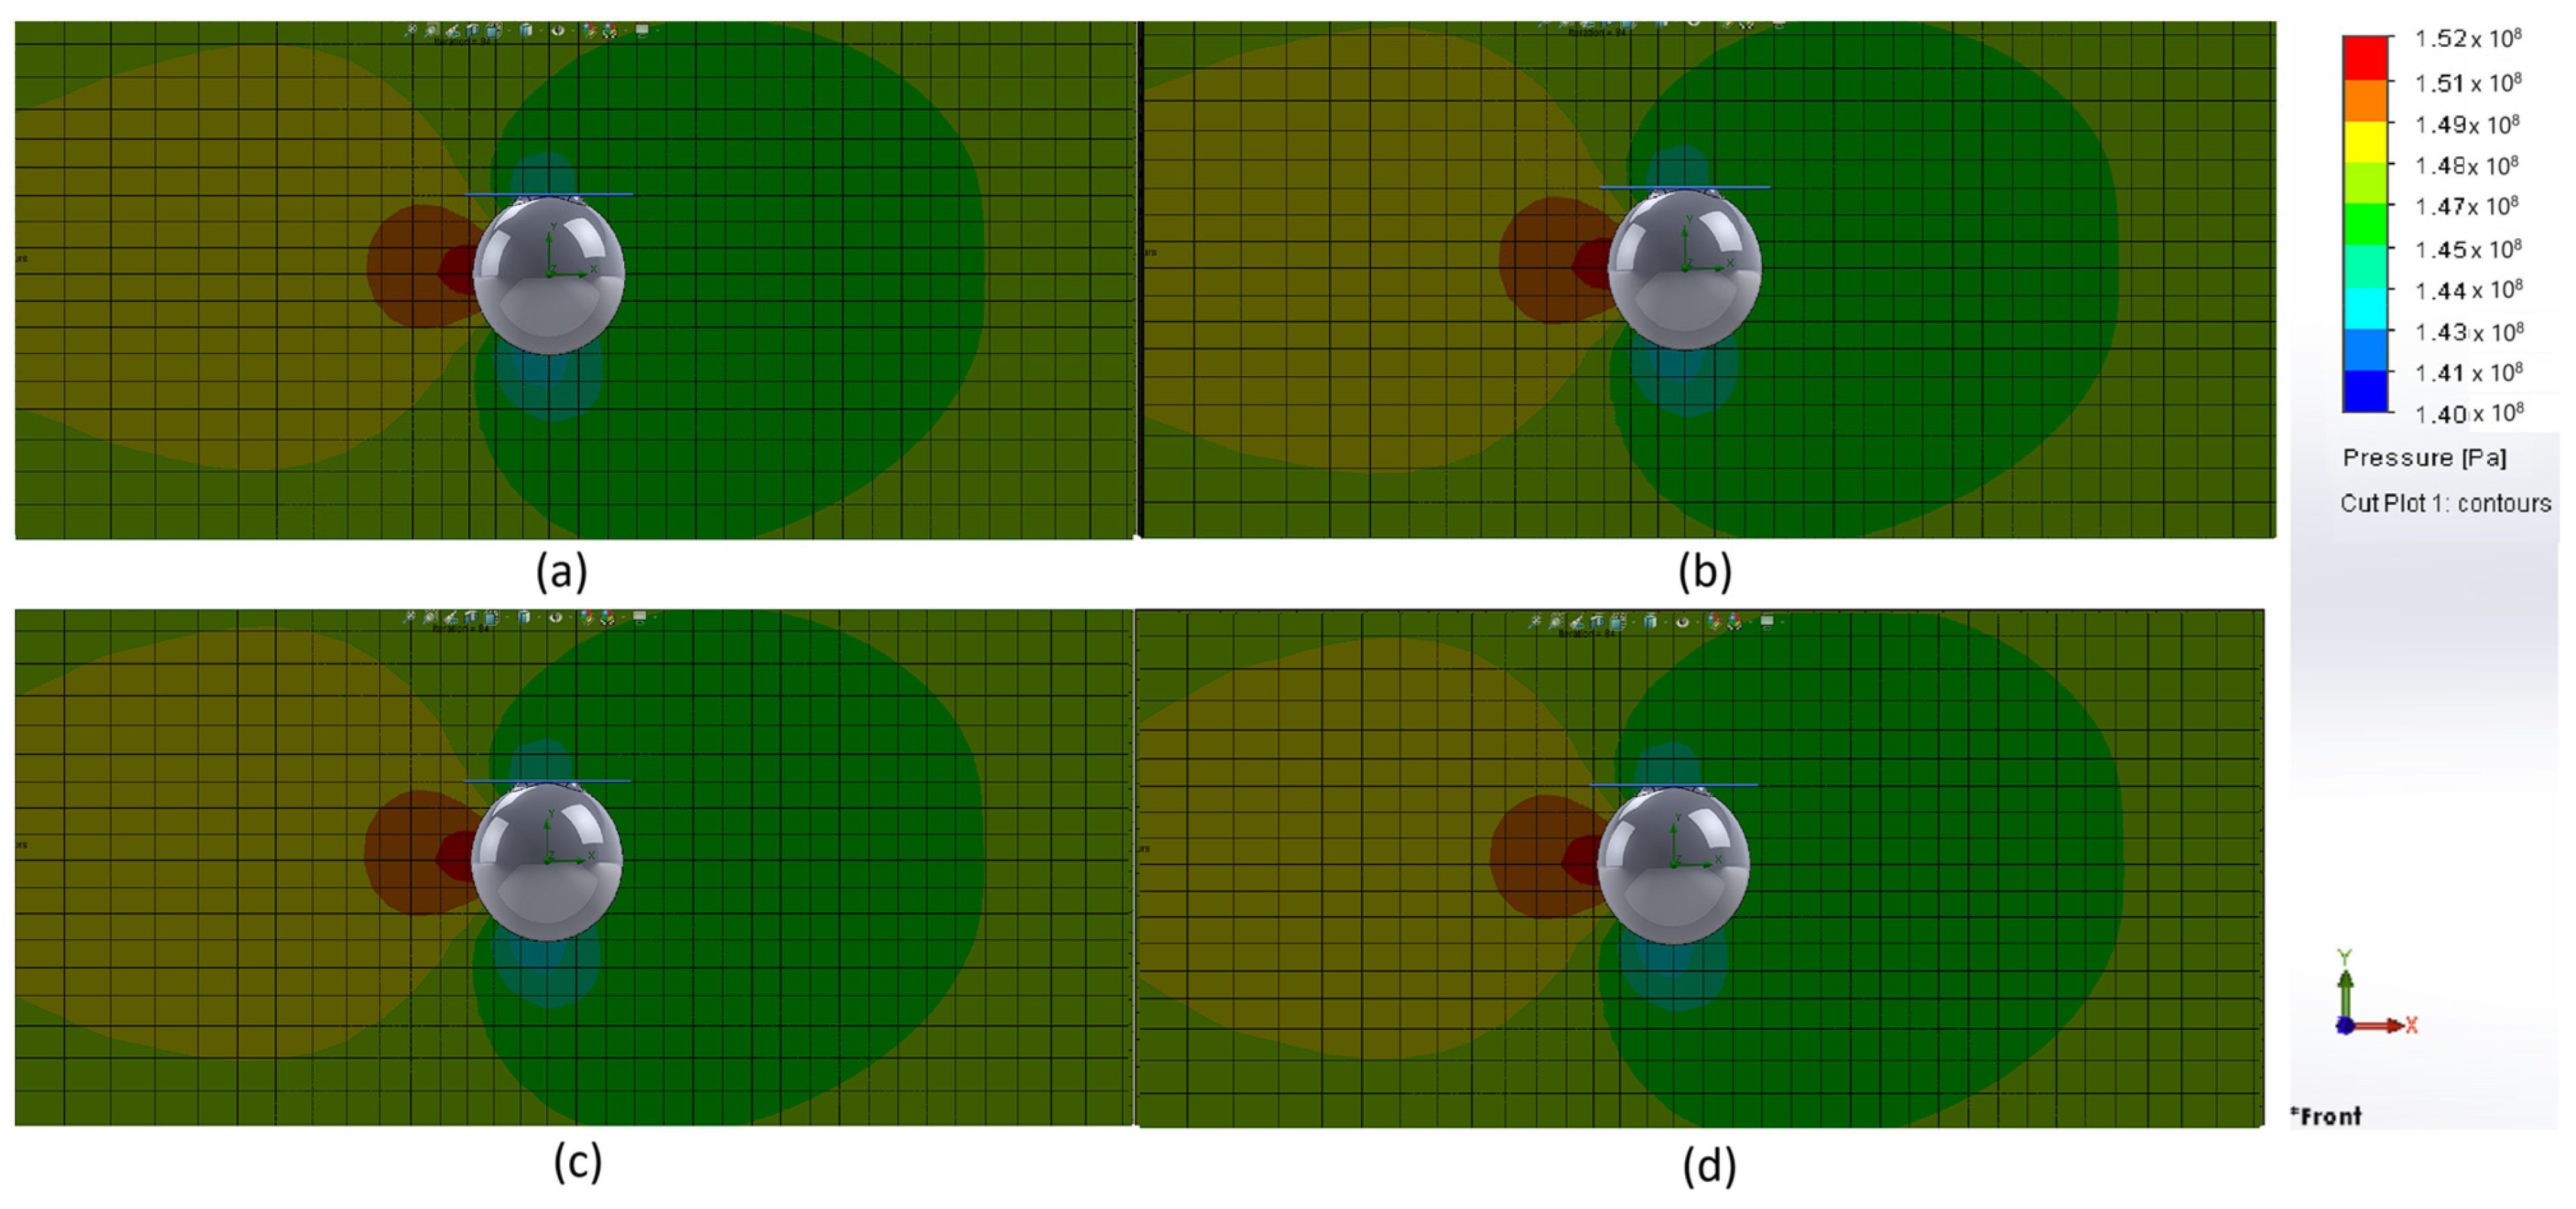
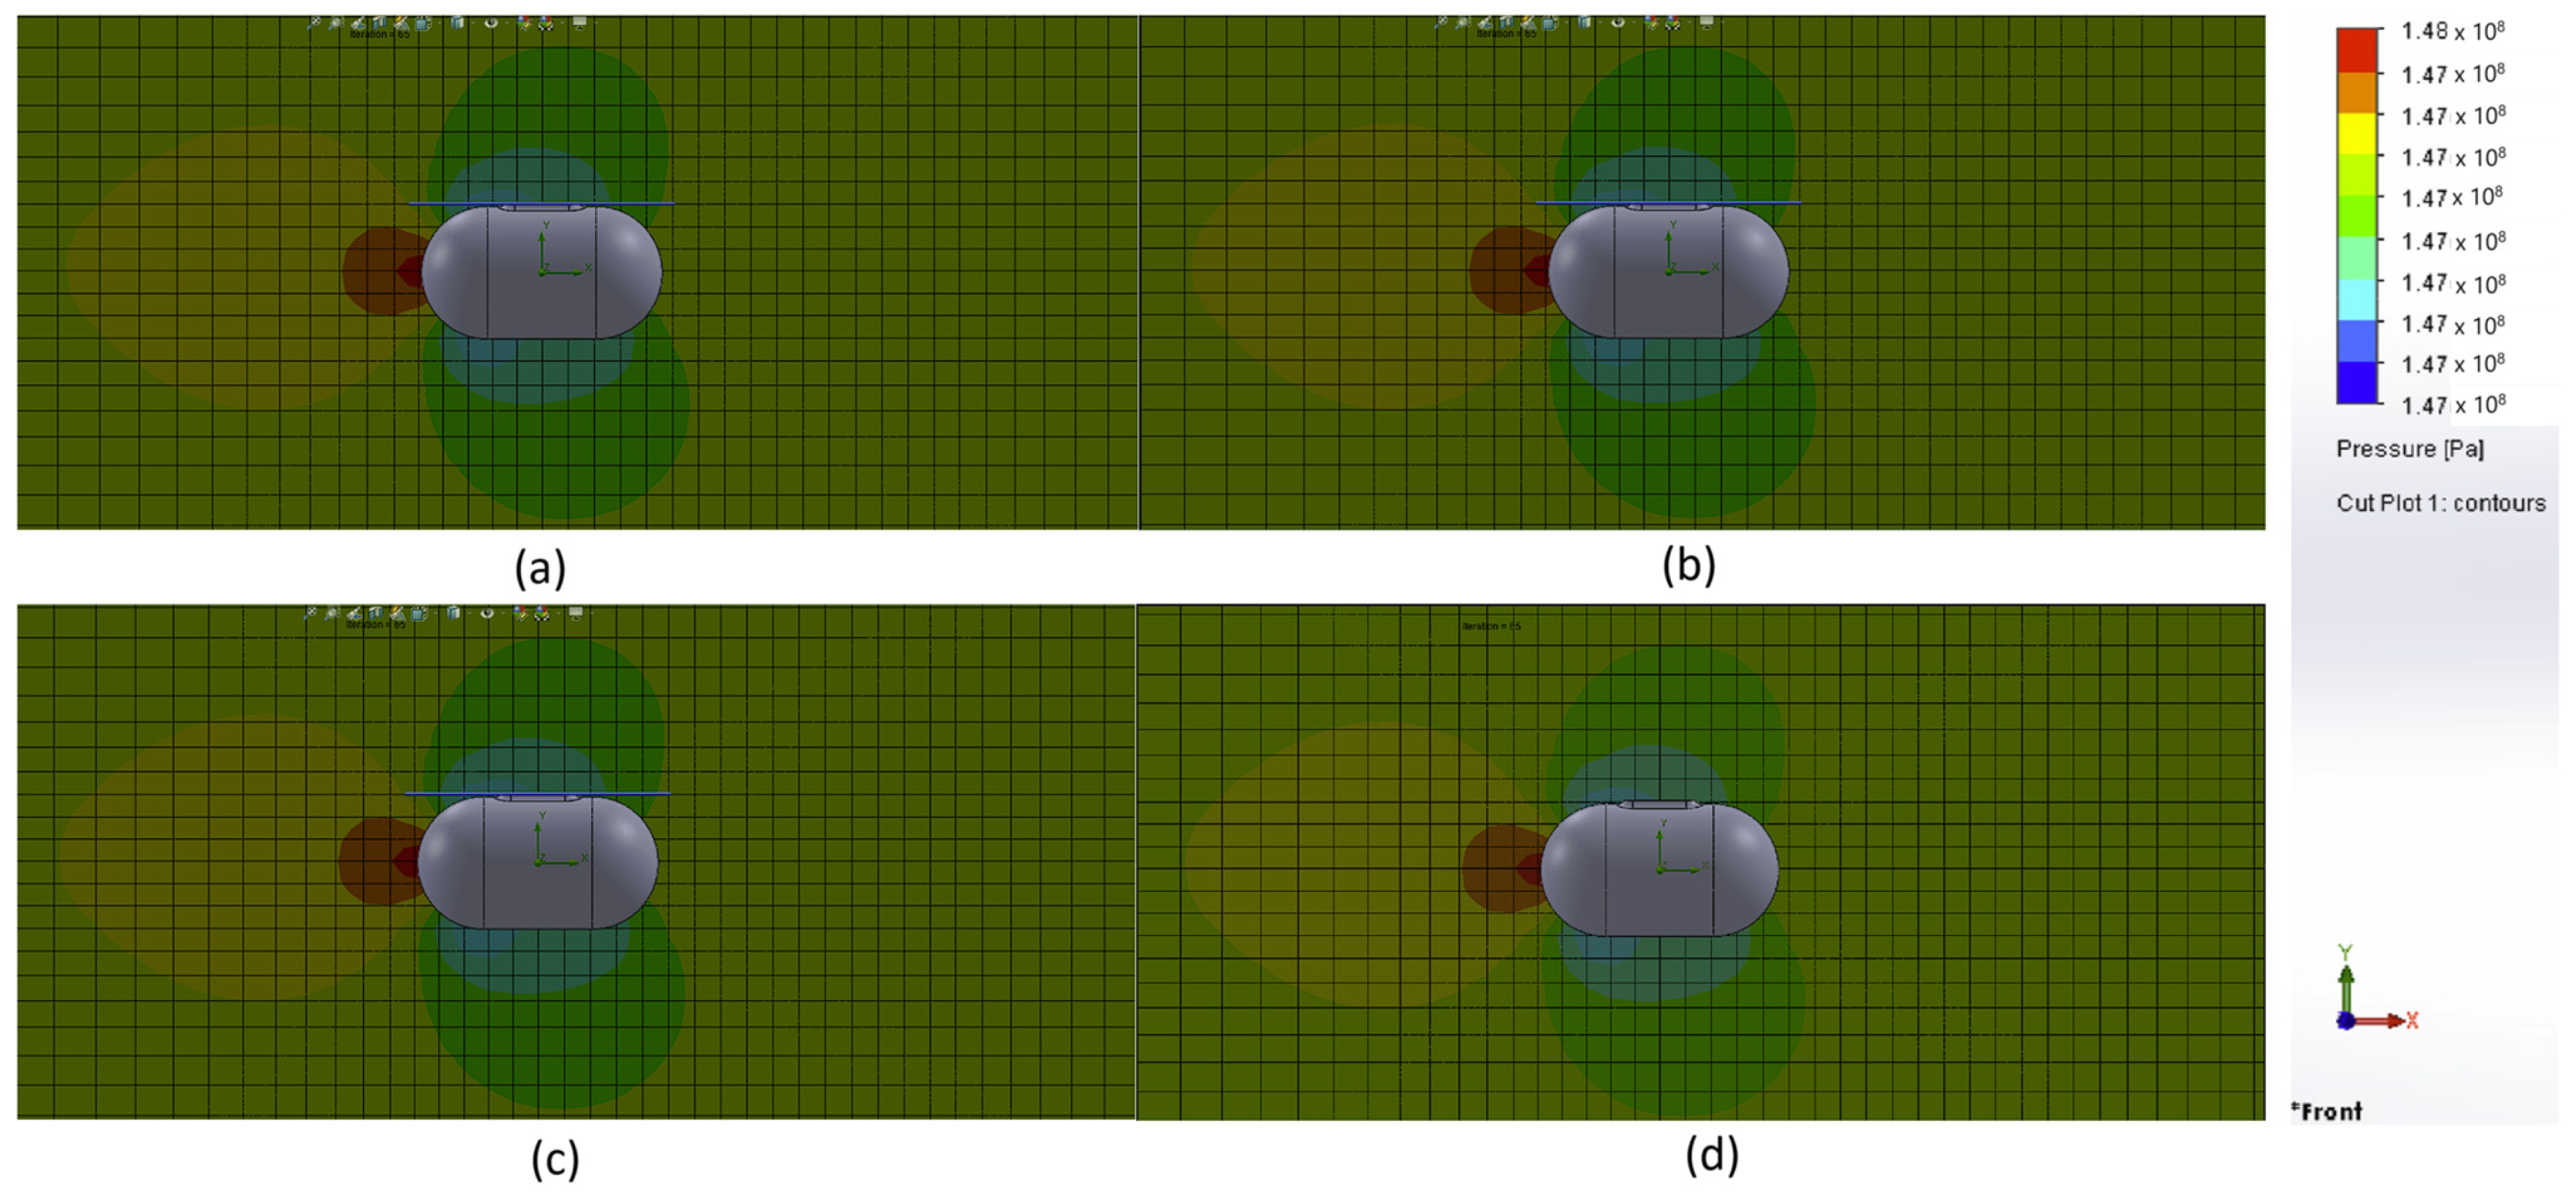
- Sphere shown in Figure 3: This represents another simple geometric shape for the transport container. However, its production is much more complex and complicated compared to the rectangular prism. It contains many unnecessary volumes—dead weight, which cannot be directly utilized for storing the internal hospital transport module. Hypothetically, these spaces could be used for a thermoregulation system, battery, control electronics, and mechanical locks. In terms of aerodynamic resistance, it performs significantly better than the previous rectangular prism shape. It has equal surfaces from every side. In the event of the container’s fall, with a suitably designed center of gravity, there should not be any rotation of the container and subsequent damage to the sensitive biological samples.
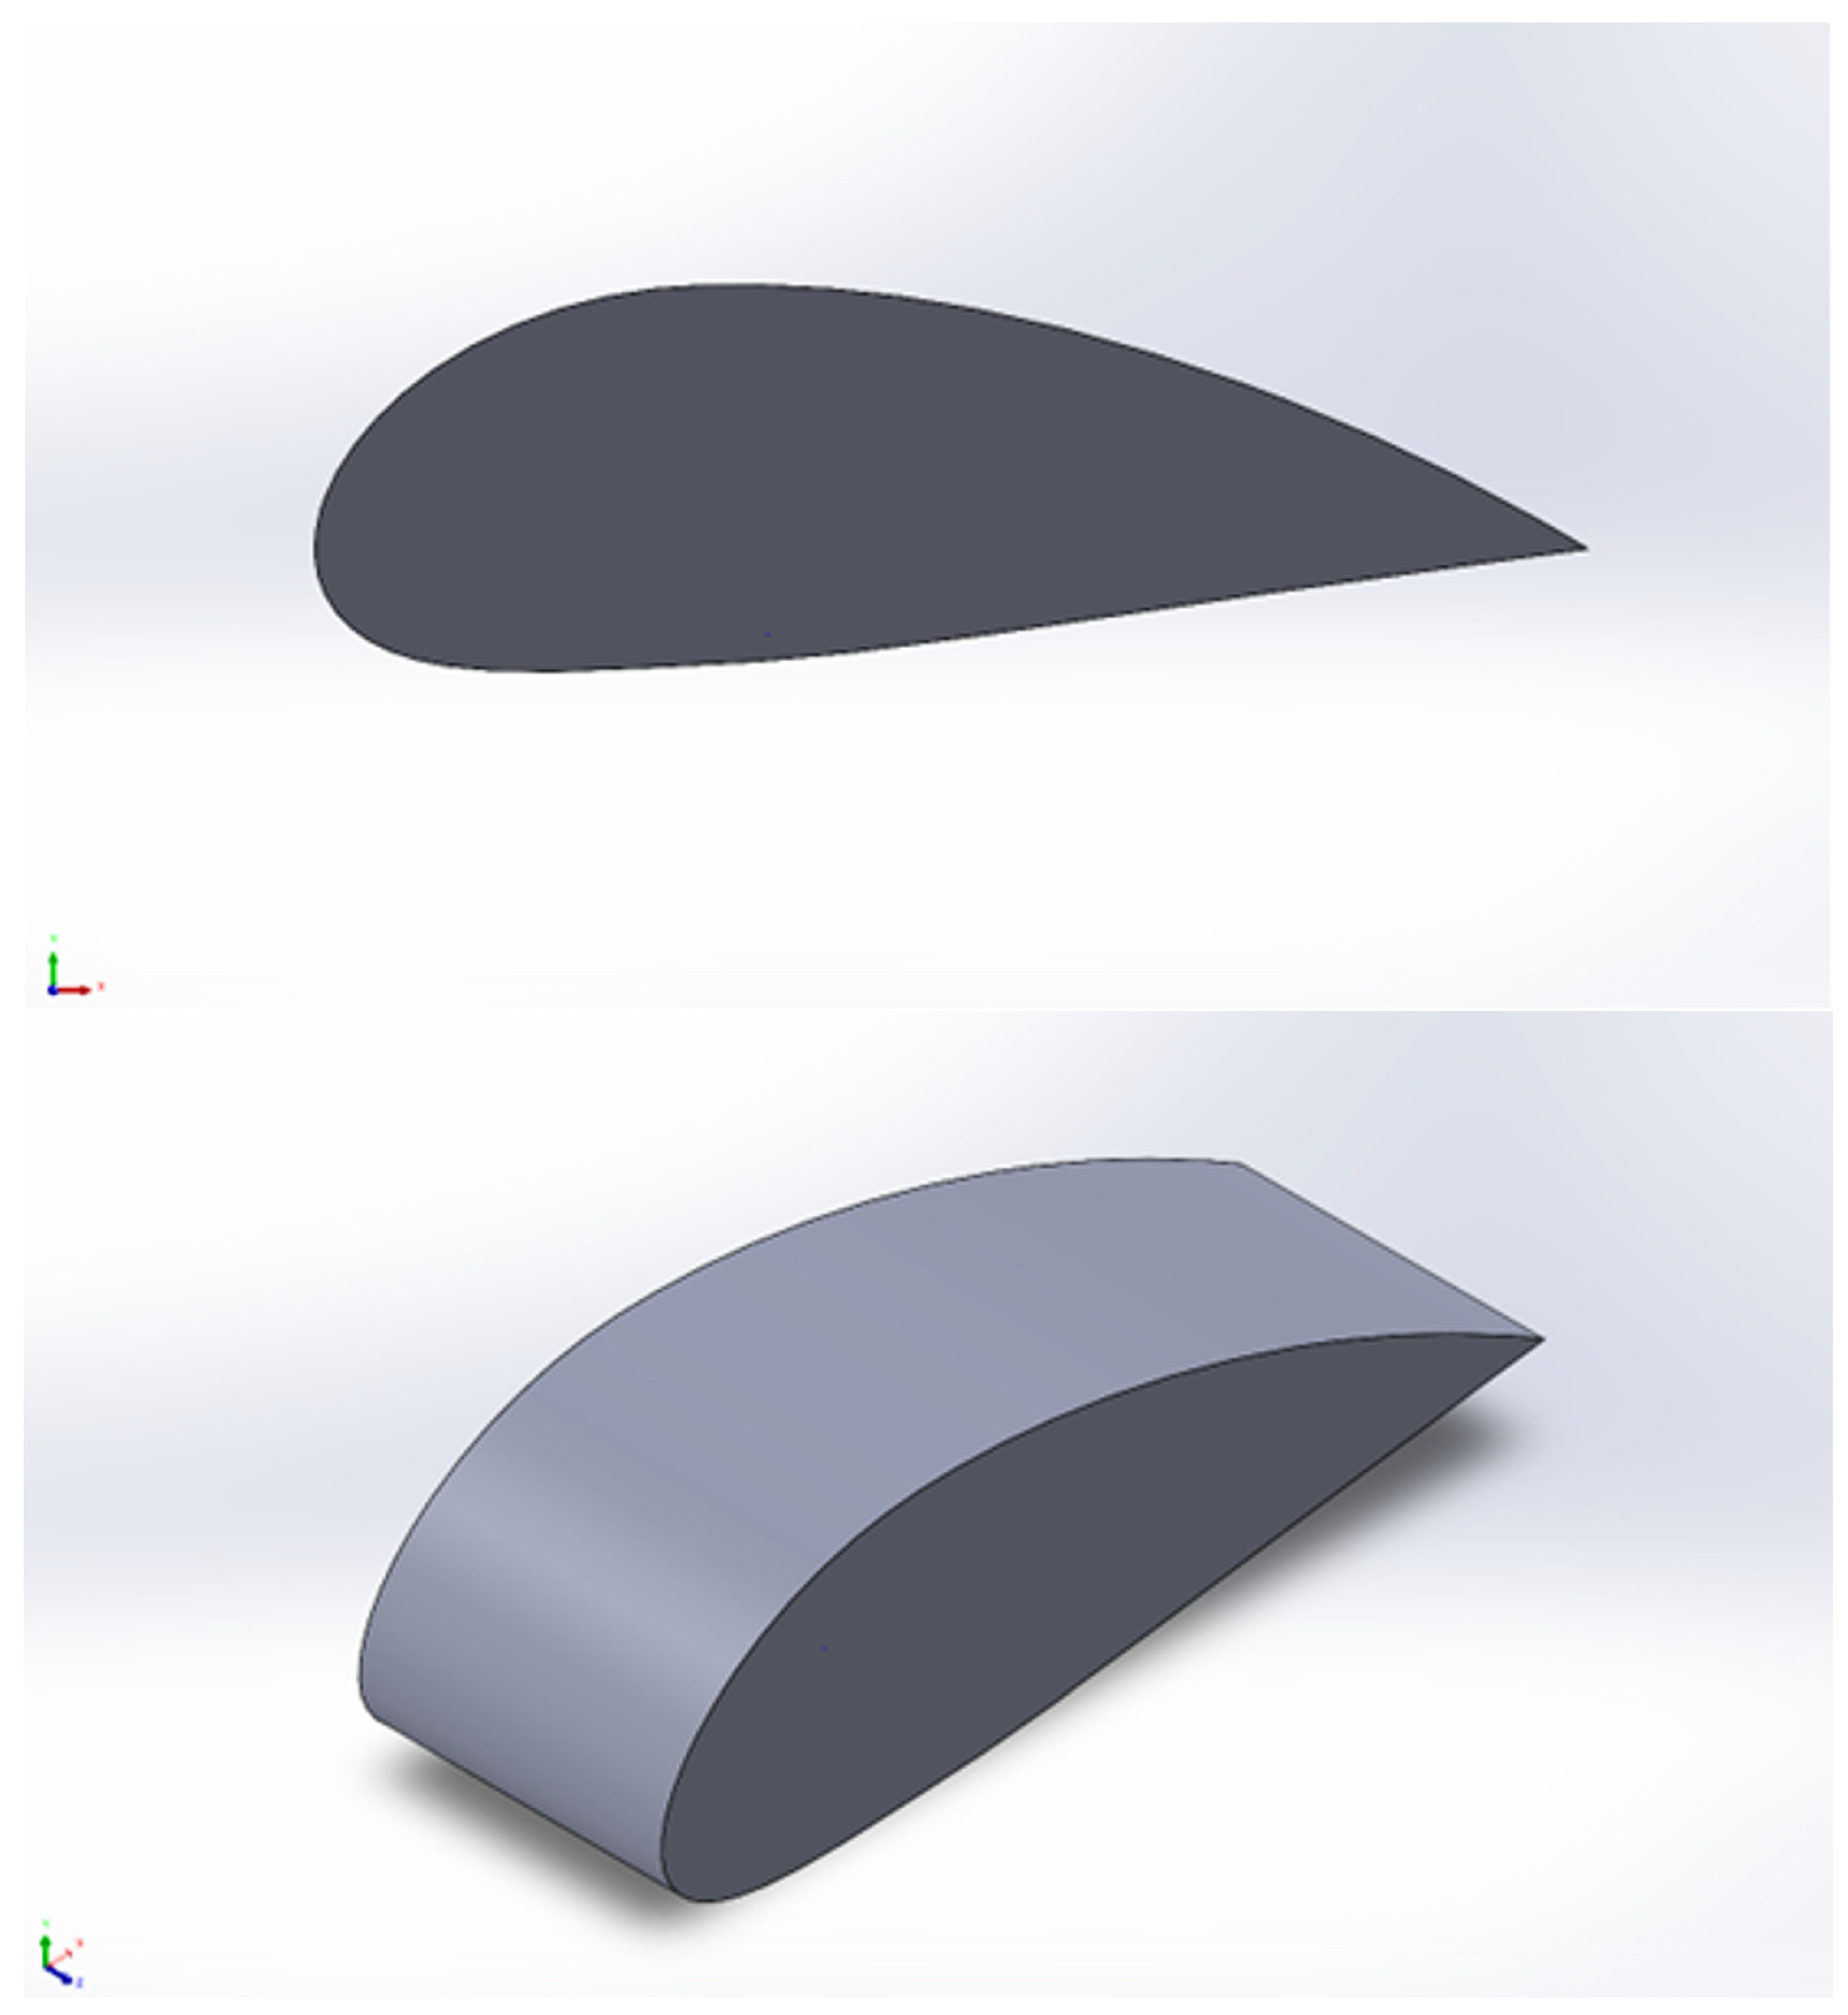
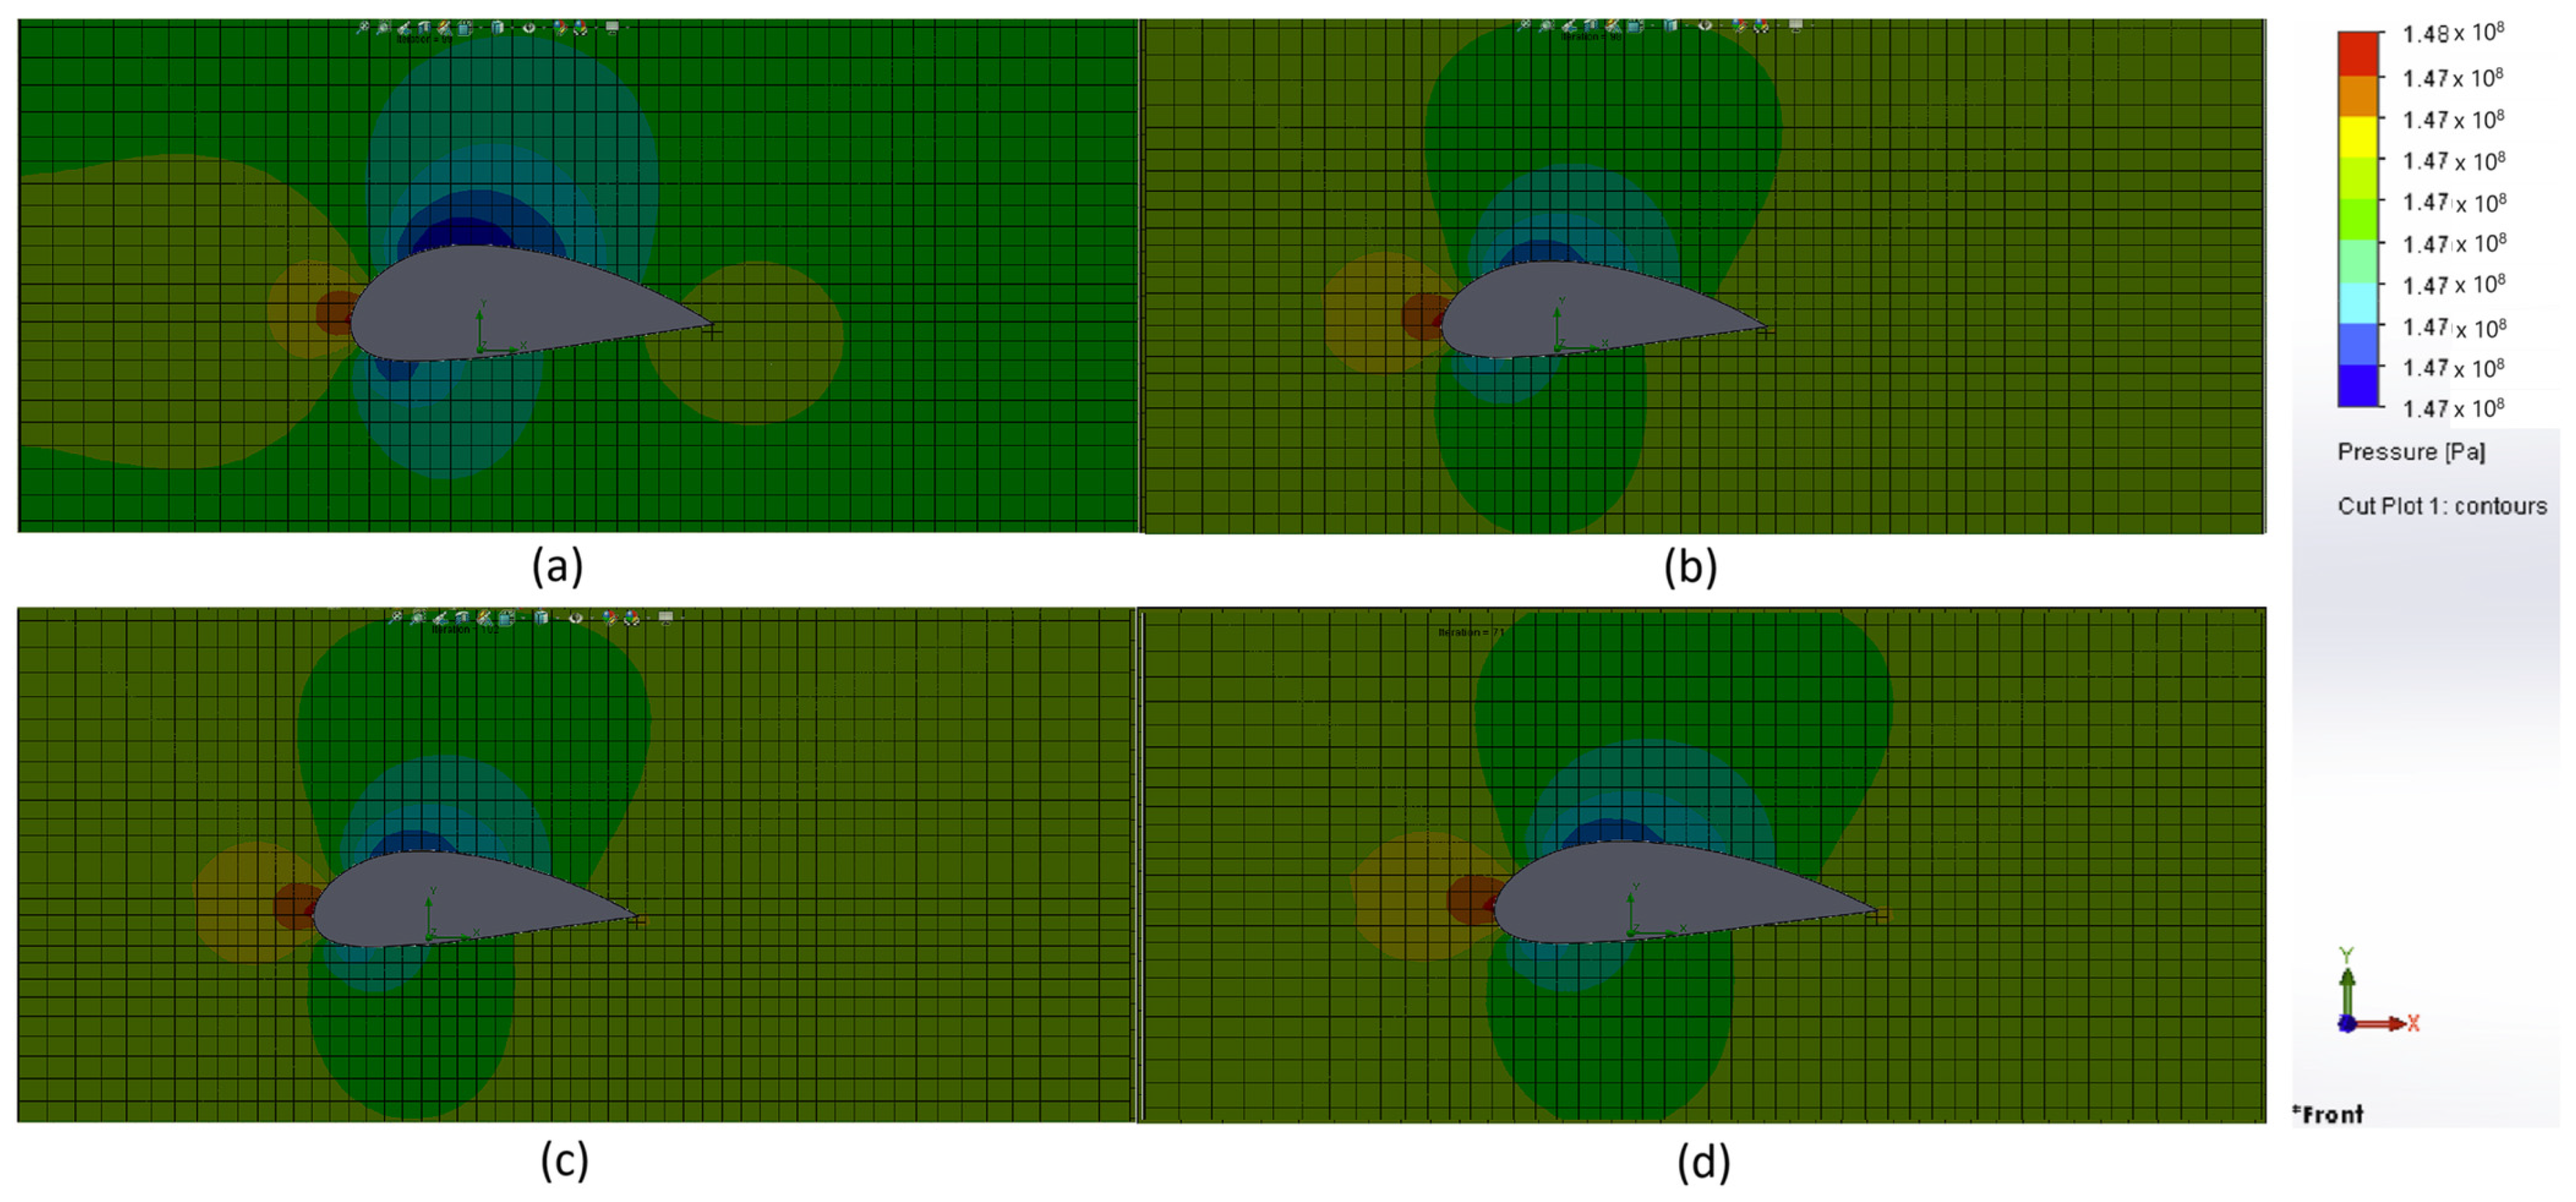
- NACA 9330 profile shown in Figure 4: This is a complex geometric shape for a transport container. Its production, however, is much more complex and complicated compared to a rectangular prism or sphere. It is a standard wing profile developed in 1933 by the National Advisory Committee for Aeronautics (NACA), the predecessor to NASA (National Aeronautics and Space Administration). Among its fundamental characteristics, it achieves good aerodynamic stability and low air resistance at flight speeds ranging from 0 to 250 km/h. It has the shape of a symmetrical bent profile with minimum thickness in the central part and maximum thickness near the wing root. In terms of the distribution of aerodynamic resistance, it performs the best among the chosen shapes for transport containers. The NACA 9330 profile is used as a reference profile in the design and testing of new wing profiles. Therefore, we have also selected it as a reference shape for the transport container in terms of its aerodynamic parameters.
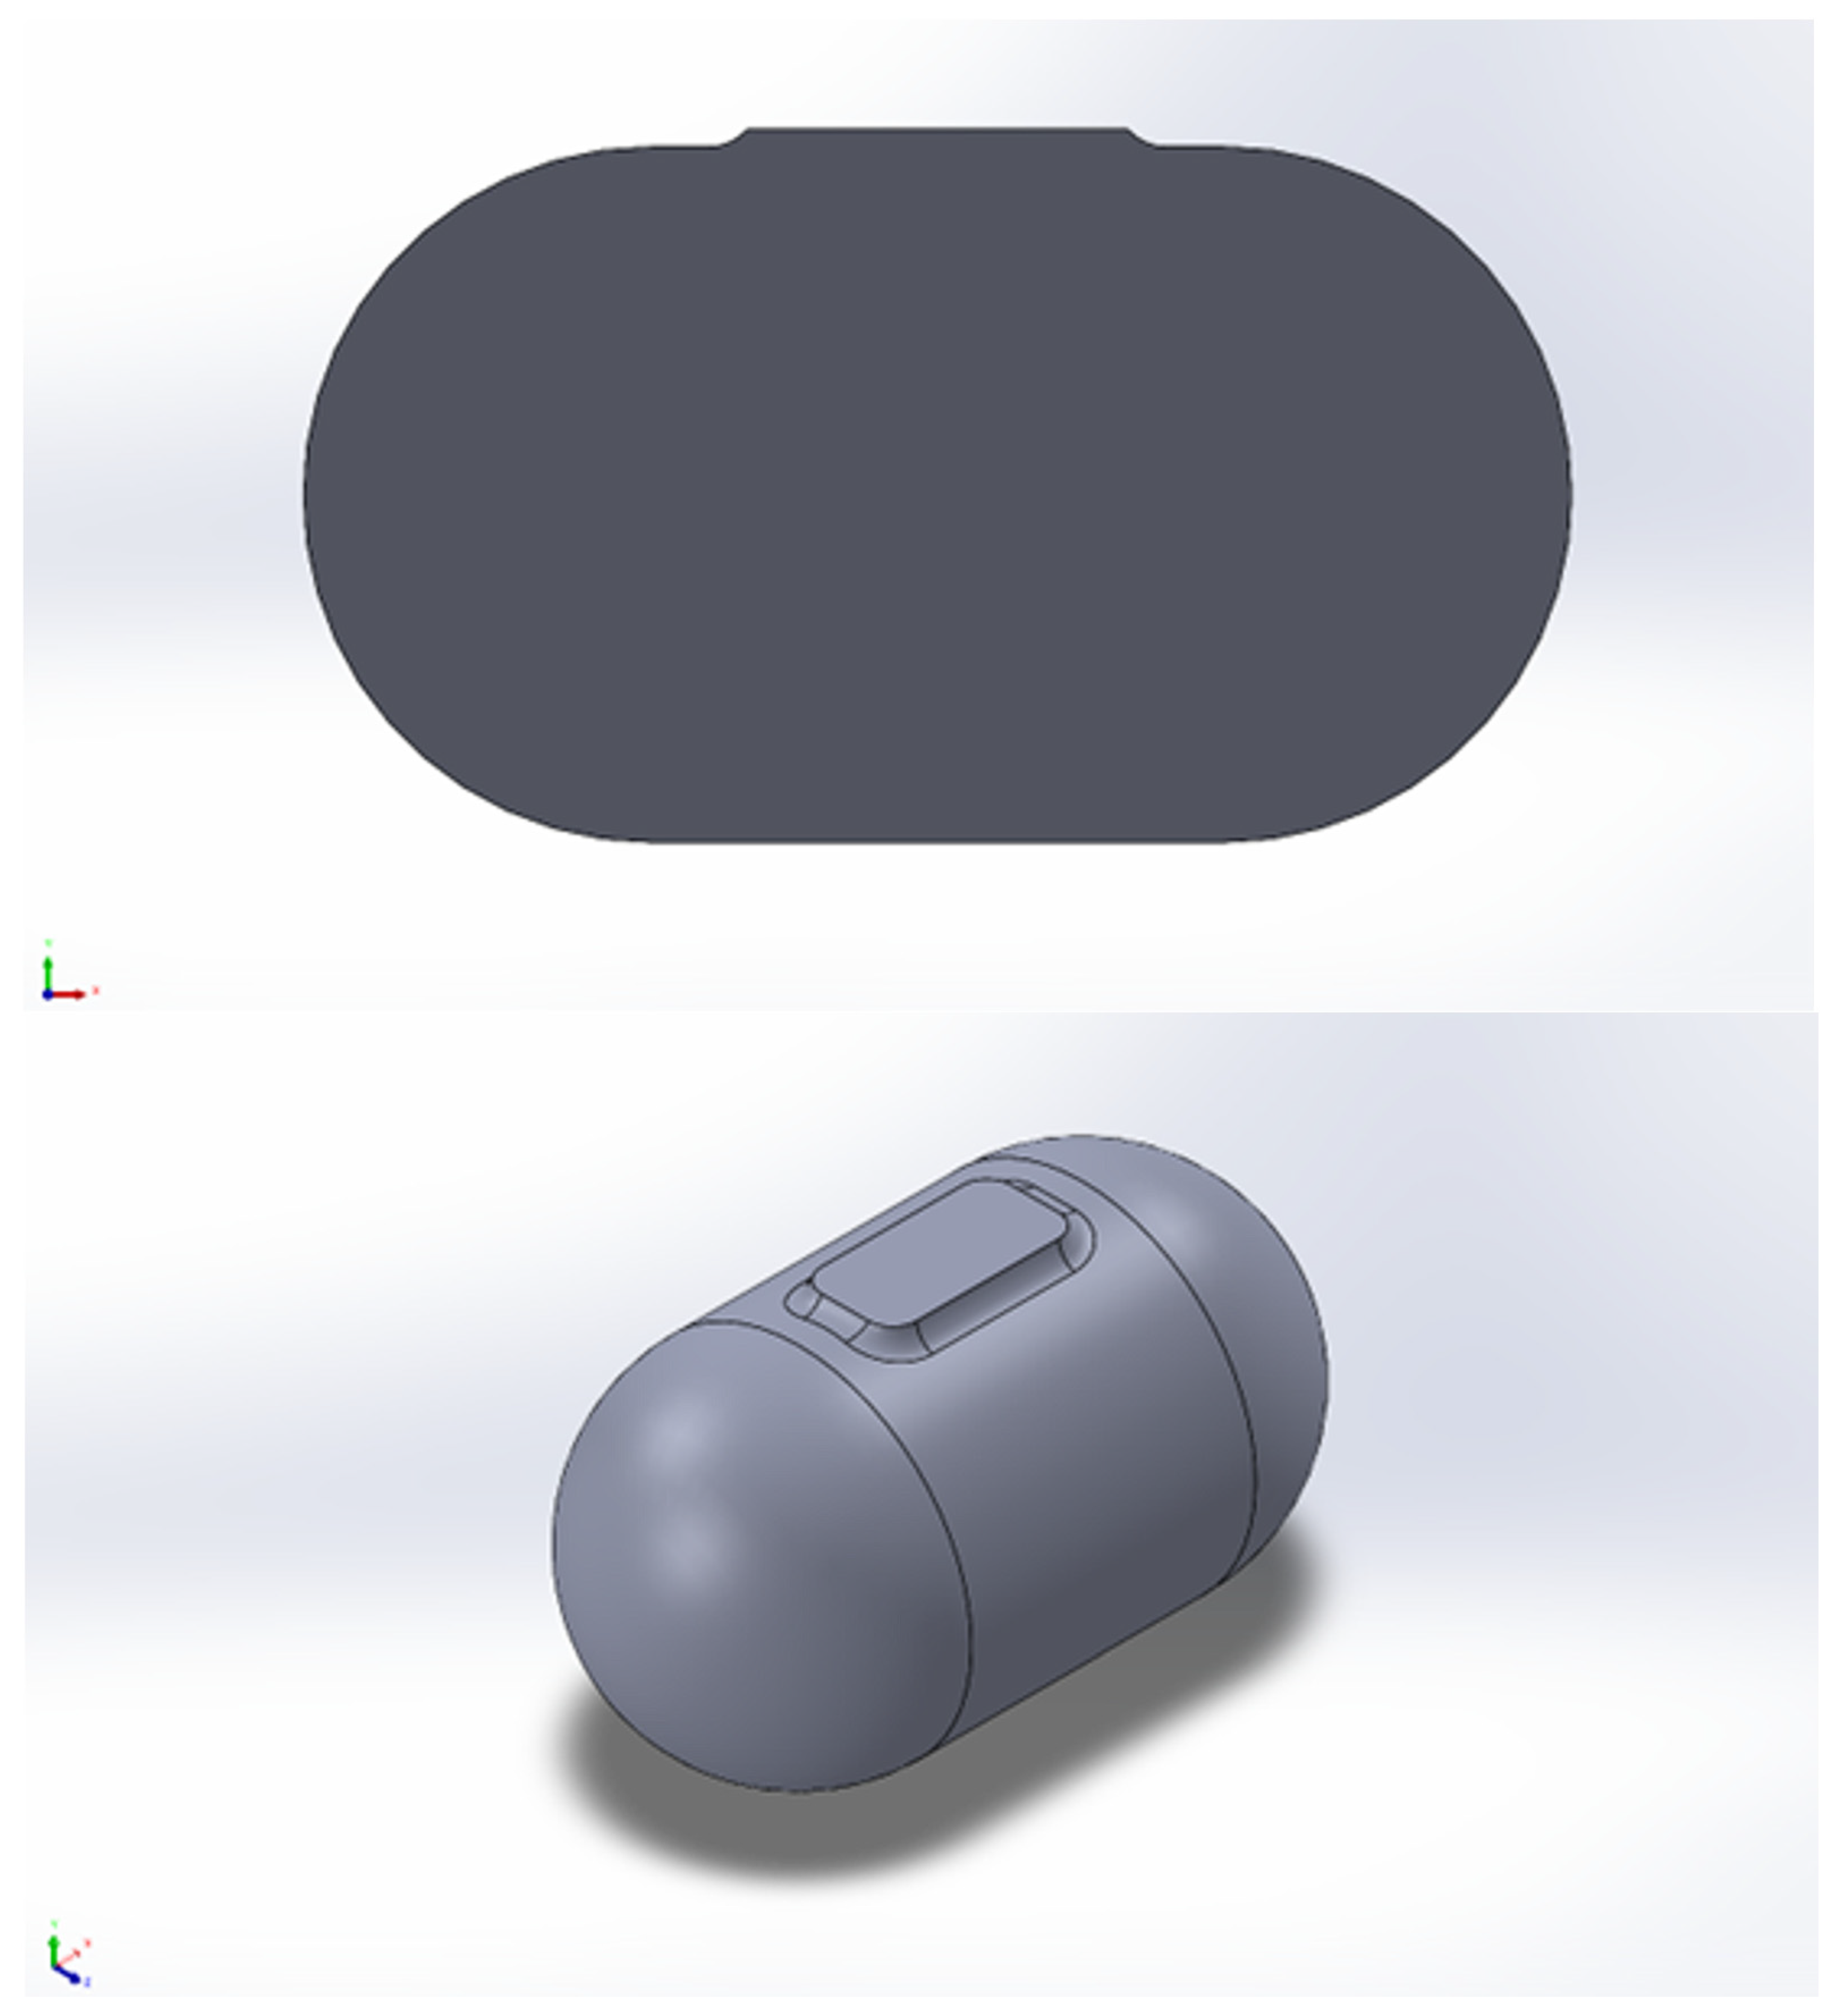
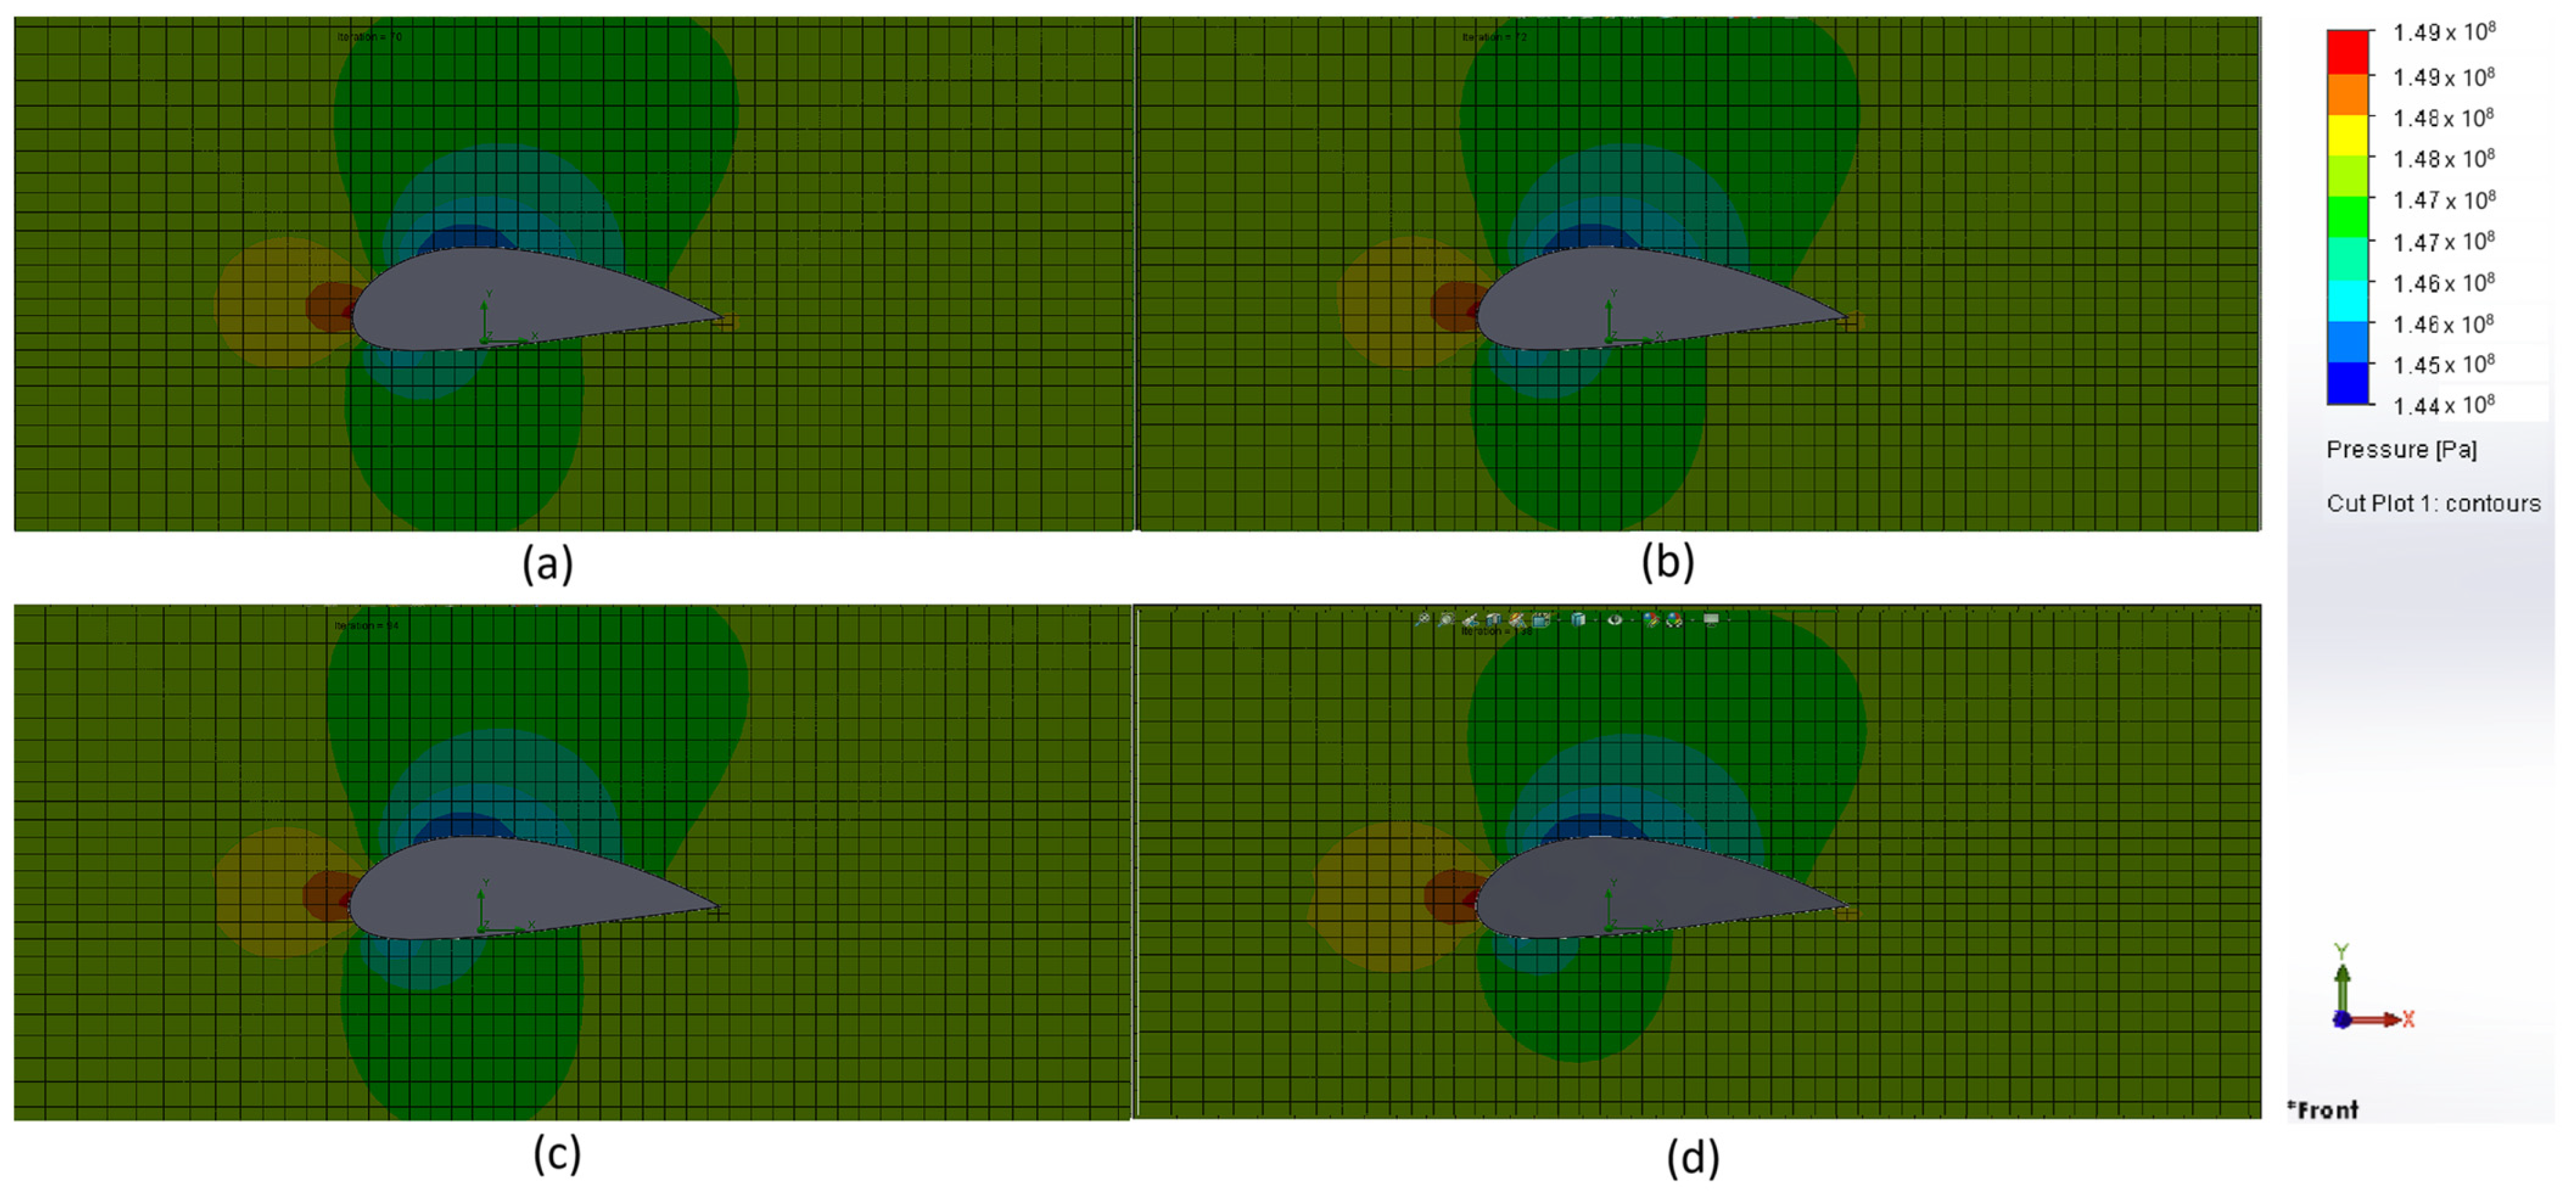
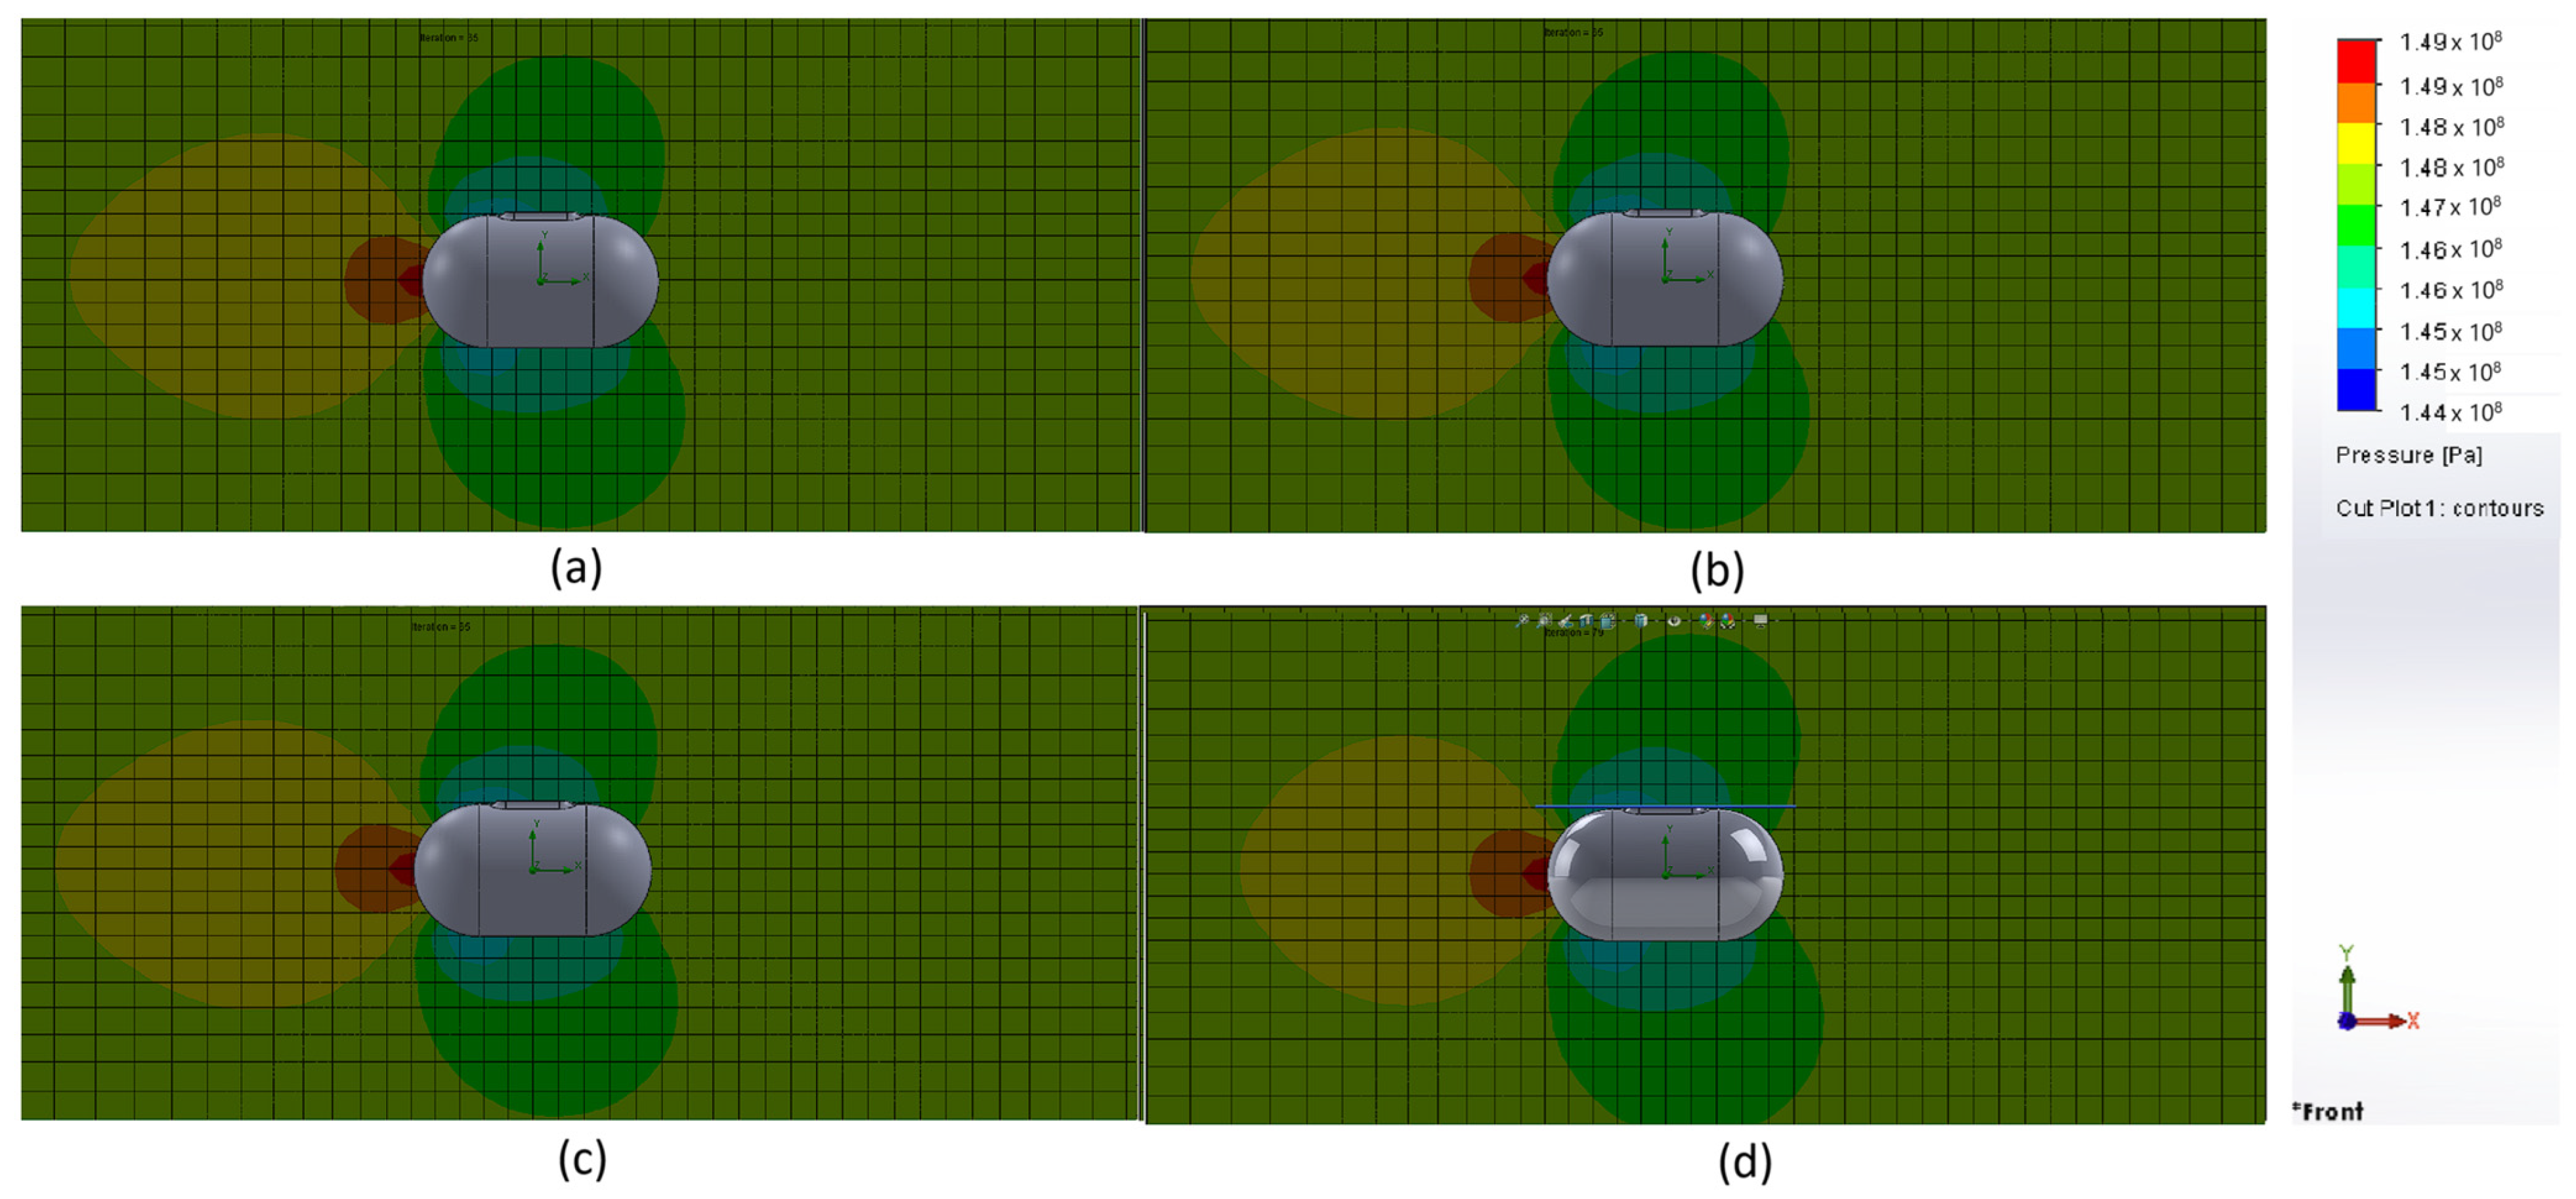
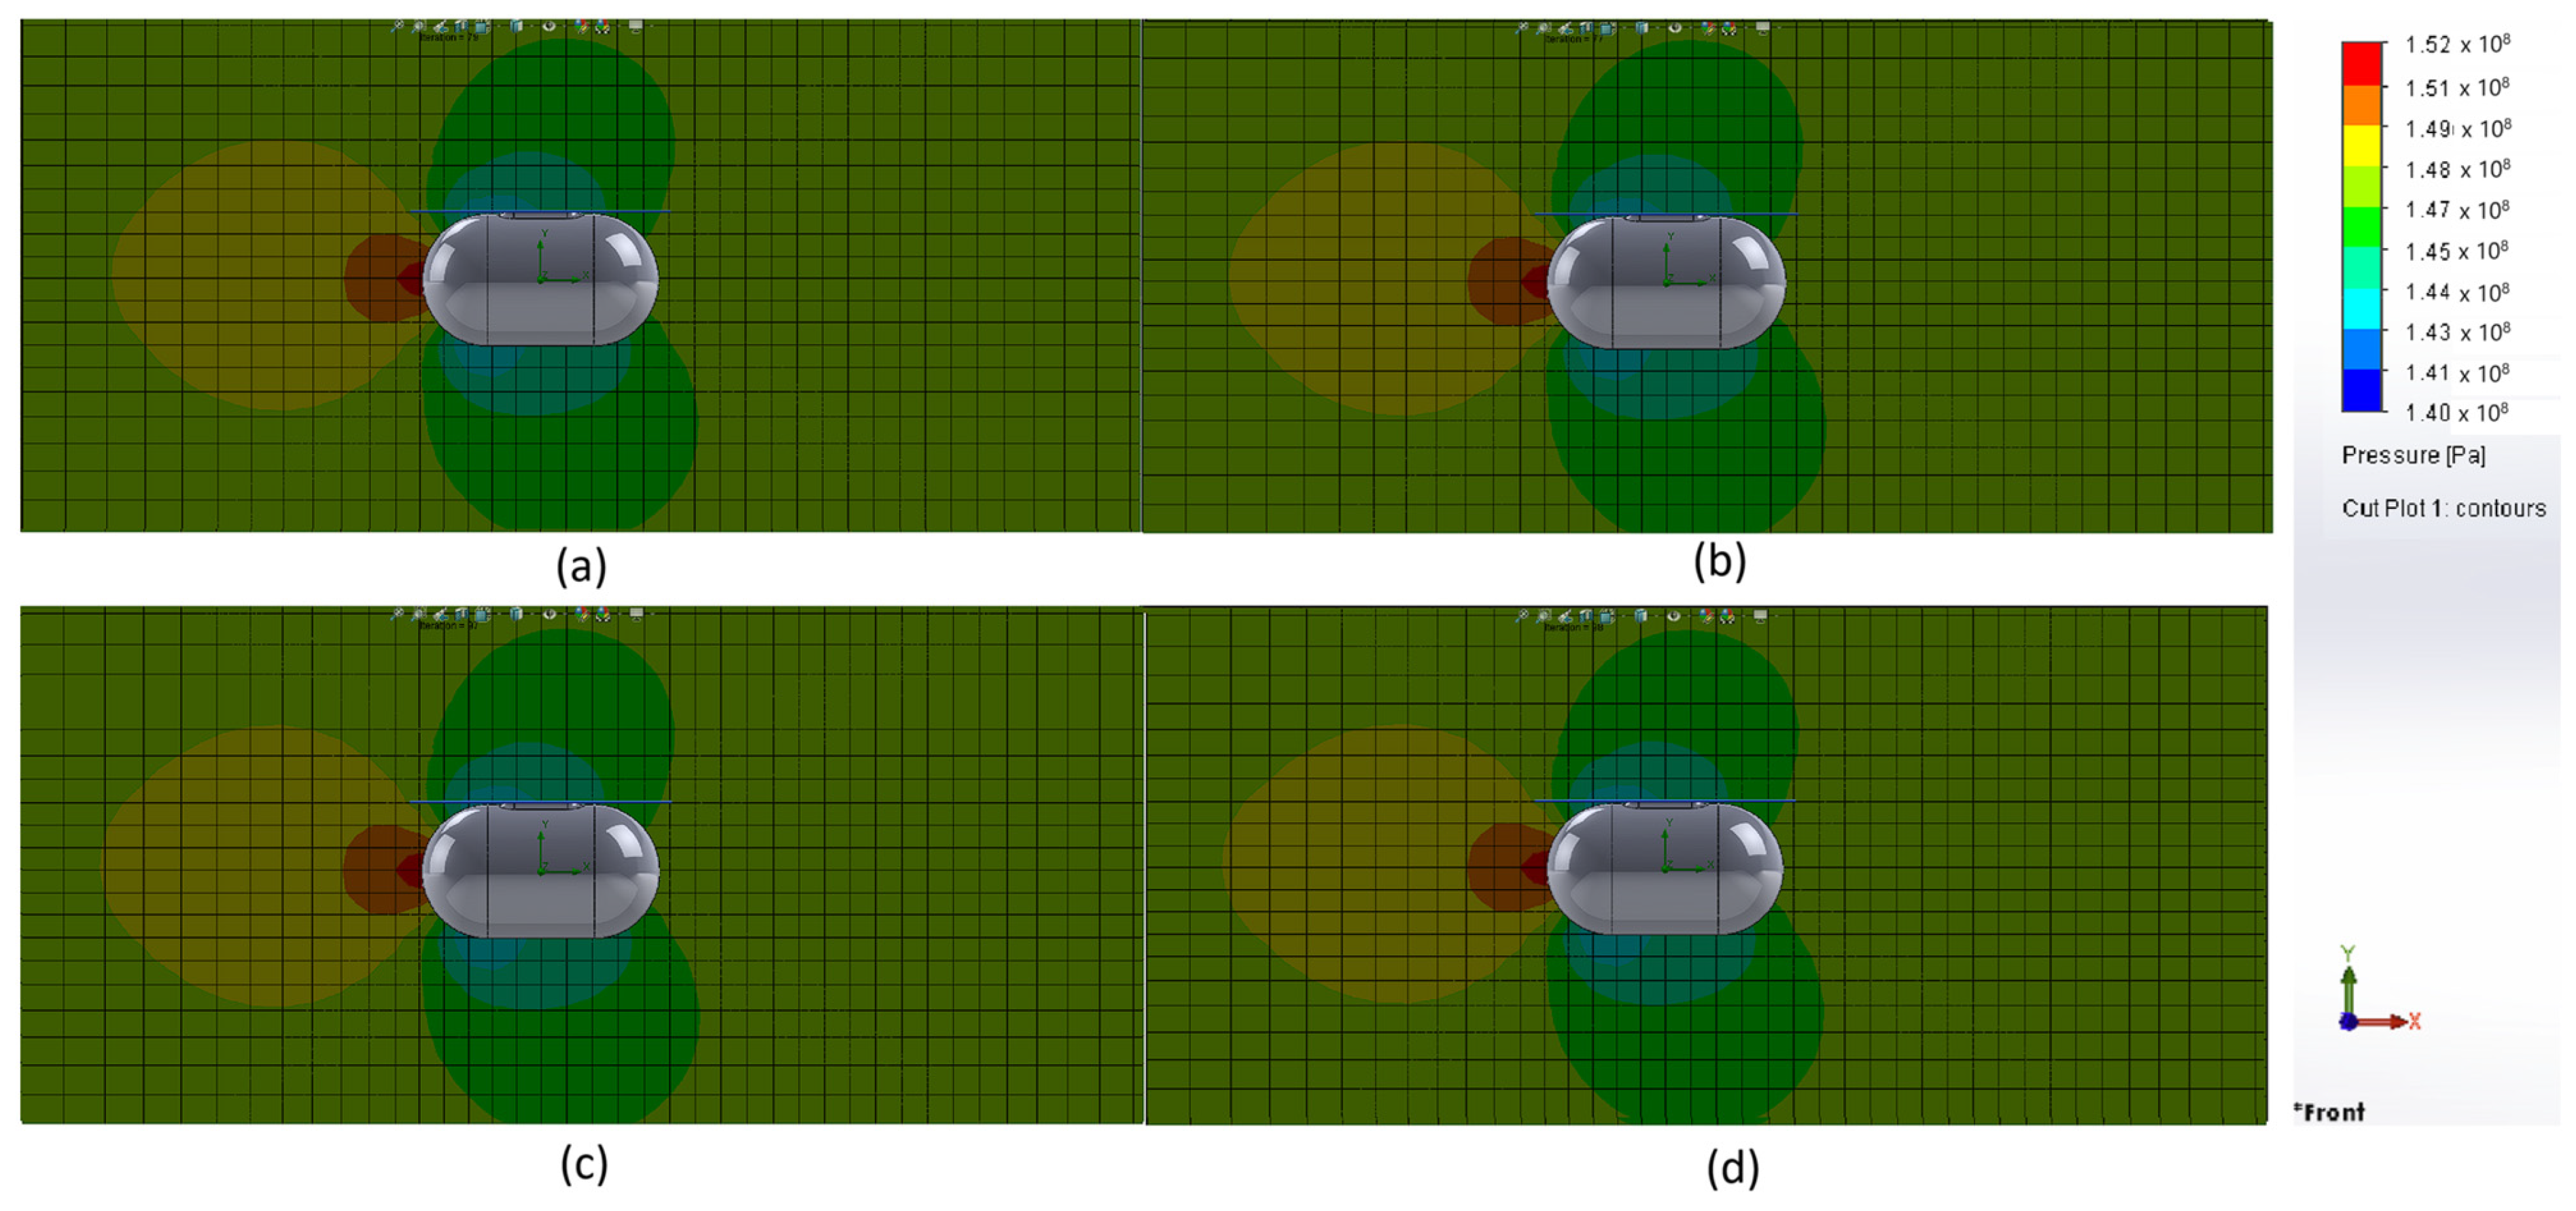
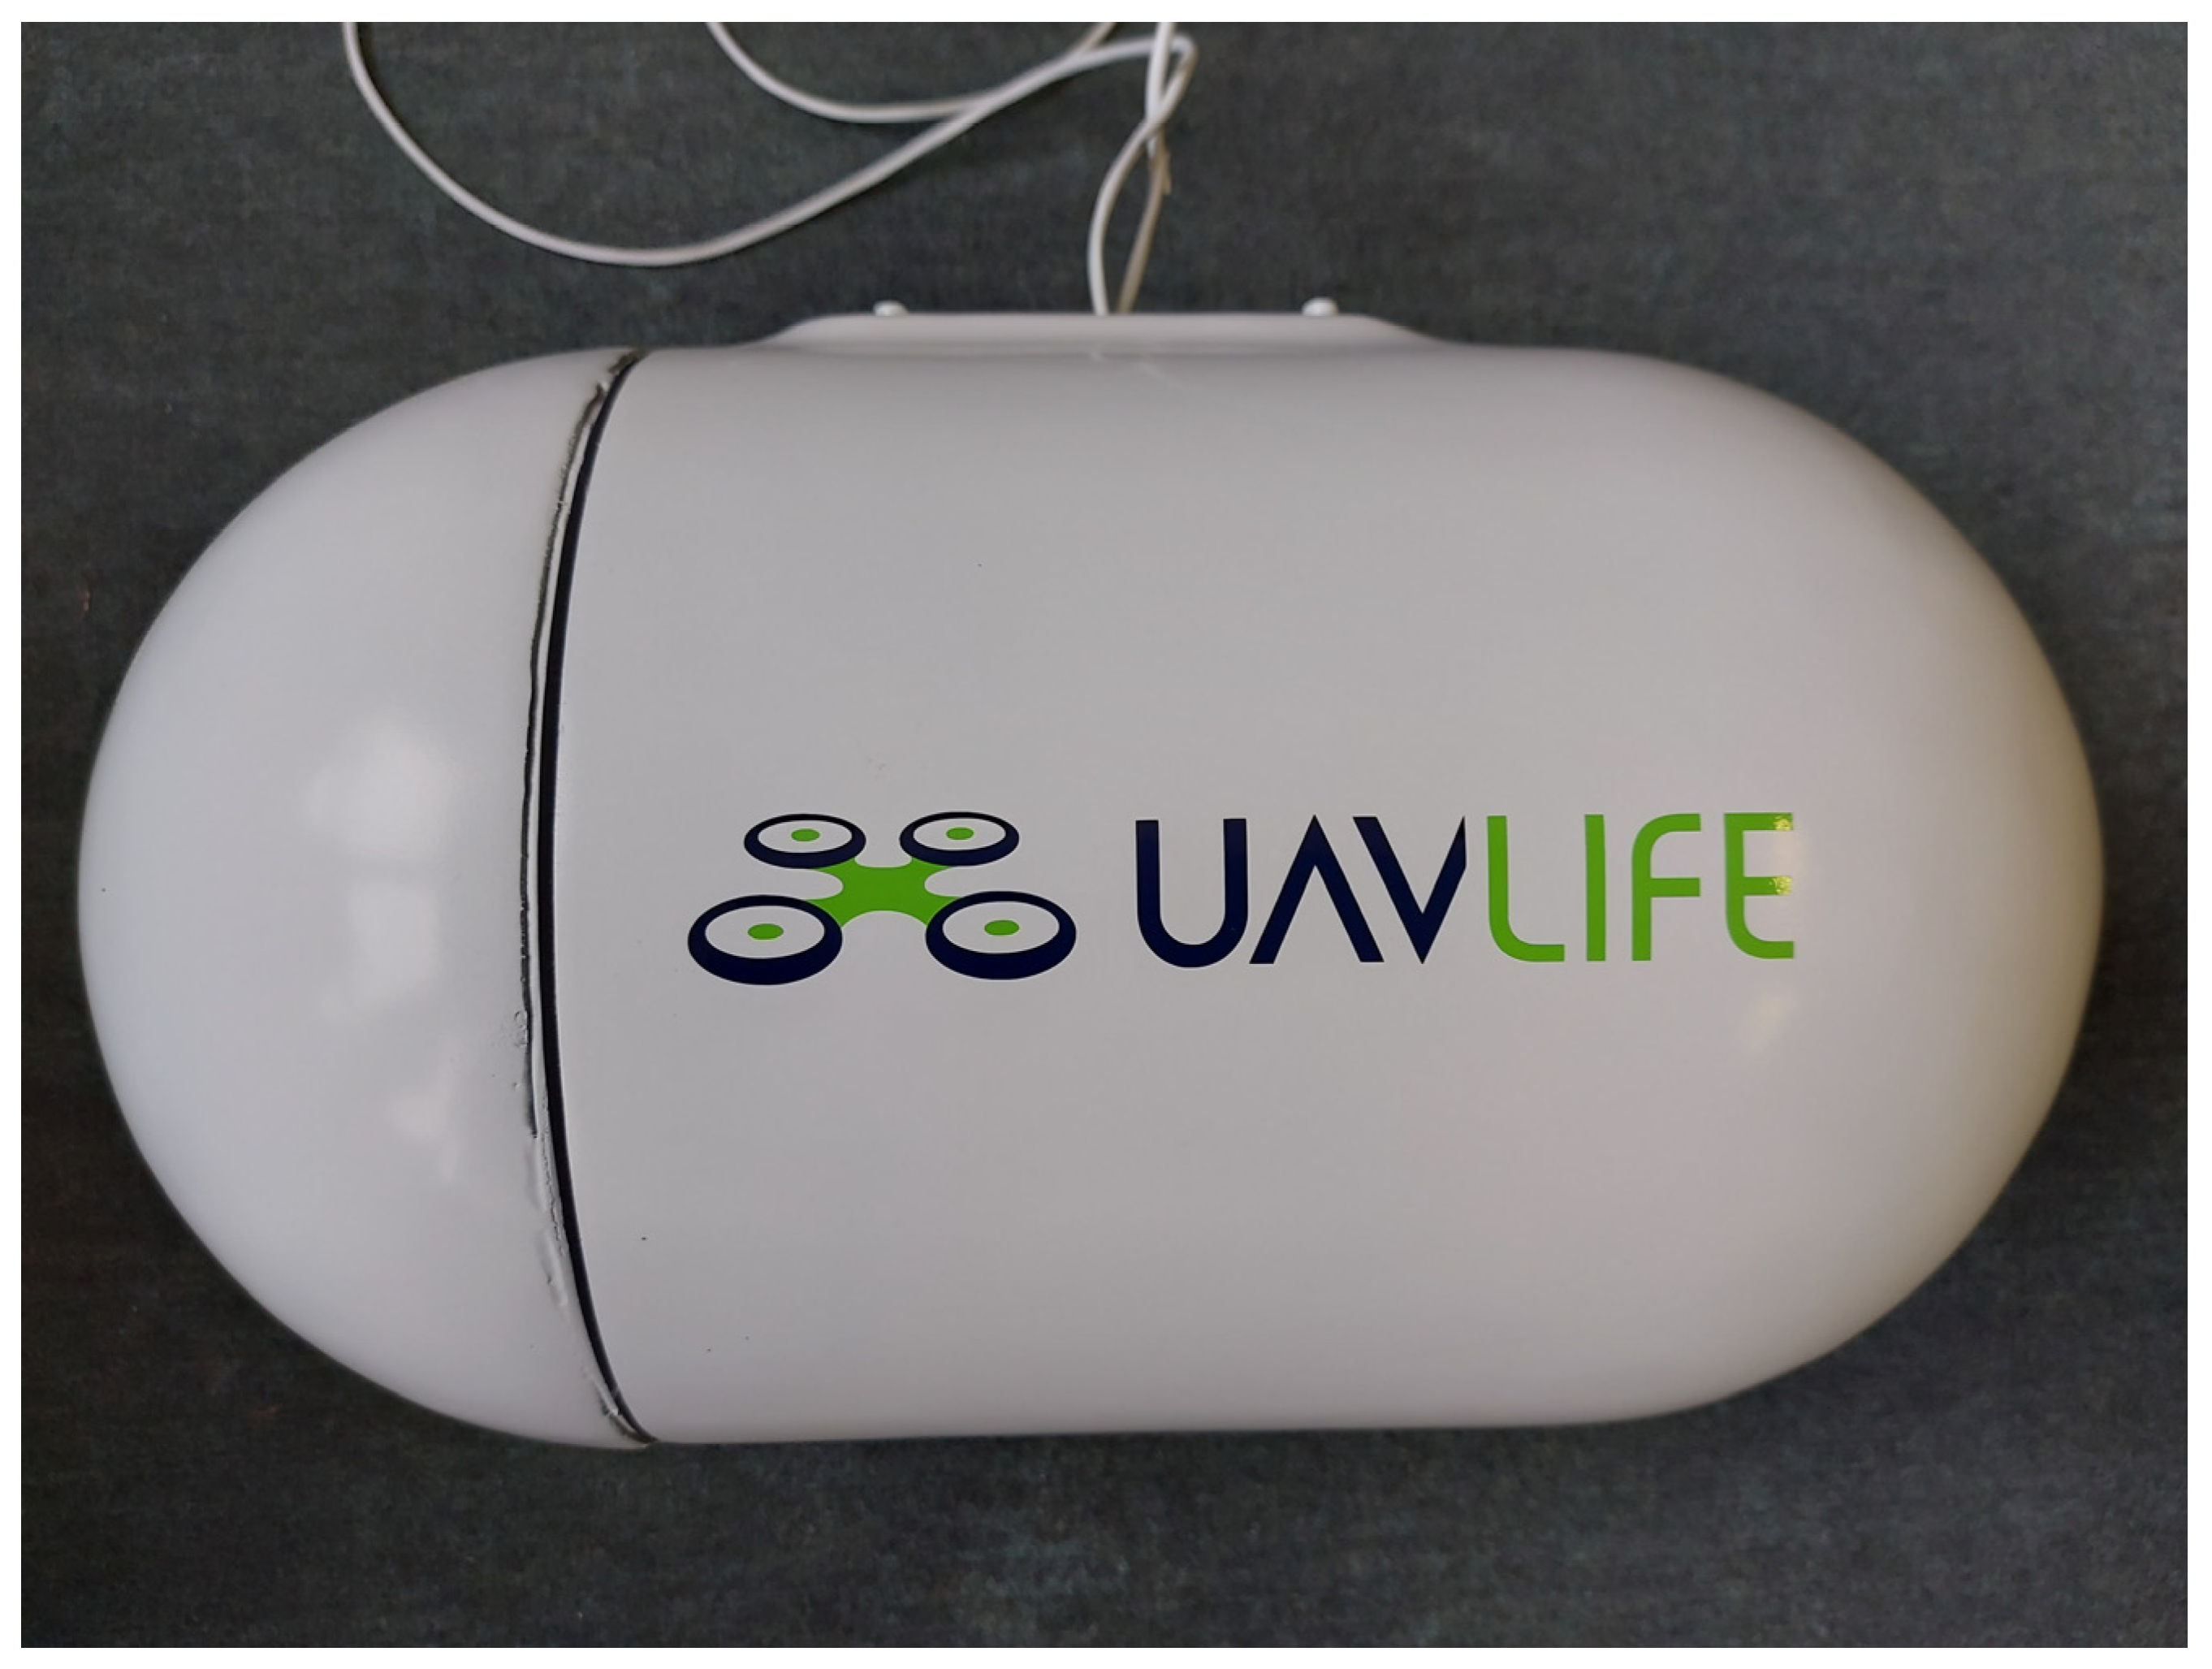
- Rounded cylinder shown in Figure 5: This is another one of the simple geometric shapes for a transport container. Its manufacturing involves the production of the middle cylindrical part and the side hemispherical shapes. However, its production is again more complex and complicated than that of a rectangular prism or sphere, though not as complex as the NACA 9330 profile. It again contains unnecessary volumes—dead weight, which cannot be directly utilized for storing the internal hospital transport module. However, these spaces could be used for a thermoregulation system, battery, control electronics, and mechanical locks. In terms of aerodynamic resistance, it performs significantly better than the previous shape in the form of a rectangular prism. It has equal surfaces on each side. In the event of the container’s fall, with a suitably designed center of gravity, there should not be any rotation of the container and subsequent damage to the sensitive biological samples.
2.3. Methodology for Testing the Suitability of the Shape of the Transport Container

| Parameter | Value/Setting | Notes |
|---|---|---|
| Unit System | SI Metric | Adopted for consistent measurements. |
| Analysis Type | External | Analyzes the effect of airflow around the container. |
| Medium | Air (Gas) | Selected as the medium; the predefined list also includes other gases, such as CO2, ethane, etc. |
| Flow Type | Laminar and Turbulent | Inclusion of both regimes for realistic flow simulation. |
| Thermodynamic Parameters | Temperature: 293.15 K (20 °C) | Reflects typical atmospheric conditions. |
| Density: 1.0 kg/m3 | ||
| Pressure: 101.325 kPa | ||
| Velocity Range | 5.556 m/s (20 km/h) to 66.667 m/s (240 km/h) in 5.556 m/s (20 km/h) increments | Key velocities include 60 km/h (maximum drone speed) and higher speeds simulating VTOL usage. |
| Simulation Goals | Static Pressure, Total Pressure, Dynamic Pressure, Force (X), Force (Y) | Measurement of goals to analyze the effects of airflow and forces on the container. |
| Geometric Parameters | 1 m × 1 m × 1 m | Simplified unified dimensions of the computational domain for medium-accuracy simulation. Dimensions can be adjusted based on the geometry requirements. |
| Discretization Settings | Global Mesh Size: Medium (Mesh Level 3) | Domain discretization with medium grid density, suitable for general-purpose simulations. The y+ value ensures accurate near-surface flow effects capture. |
| Minimum Cell Size: Automatic | ||
| y+: ~1–5 | ||
| Boundary Conditions | Inlet: Air velocity starting at 20 km/h and increased iteratively based on simulation requirements. | The inlet air velocity was defined based on the simulation goals, starting at 20 km/h and increasing incrementally. Outlet and wall conditions used default settings. |
| Outlet: Static Pressure = 0 Pa | ||
| Wall: No Slip (fixed wall) | ||
| Turbulence Model | k-ε two-equation turbulence model | Used for general-purpose flow simulations, balancing accuracy and computational costs. |
| Numerical Scheme | Finite Volume Method | Ensures stable and accurate computation. Uses the finite volume method to solve equations and second-order accuracy for discretization. |
| Second-Order Upwind Scheme | ||
| SIMPLE Algorithm |
2.4. Methodology for Evaluating Results Obtained from Simulations
Conversion to Pressure Coefficients (Cp) for Comparative Analysis
- ρ: air density, set as 1.0 kg/m3 based on the simulation environment;
- V: flight speed in meters per second;
- temperature: set to 293.15 K (20 °C).
- As flight speed increases, Cp decreases significantly due to the squared velocity term in q∞. For example, doubling the speed reduces Cp approximately by a factor of four for the same profile, highlighting the sensitivity of pressure coefficients to velocity changes.
- This reduction is more pronounced for streamlined shapes, which inherently maintain smoother airflow at higher velocities.
2.5. Factors Influencing the Flight Characteristics of Drones with an Underslung Transport Container
2.5.1. Aerodynamic Effects
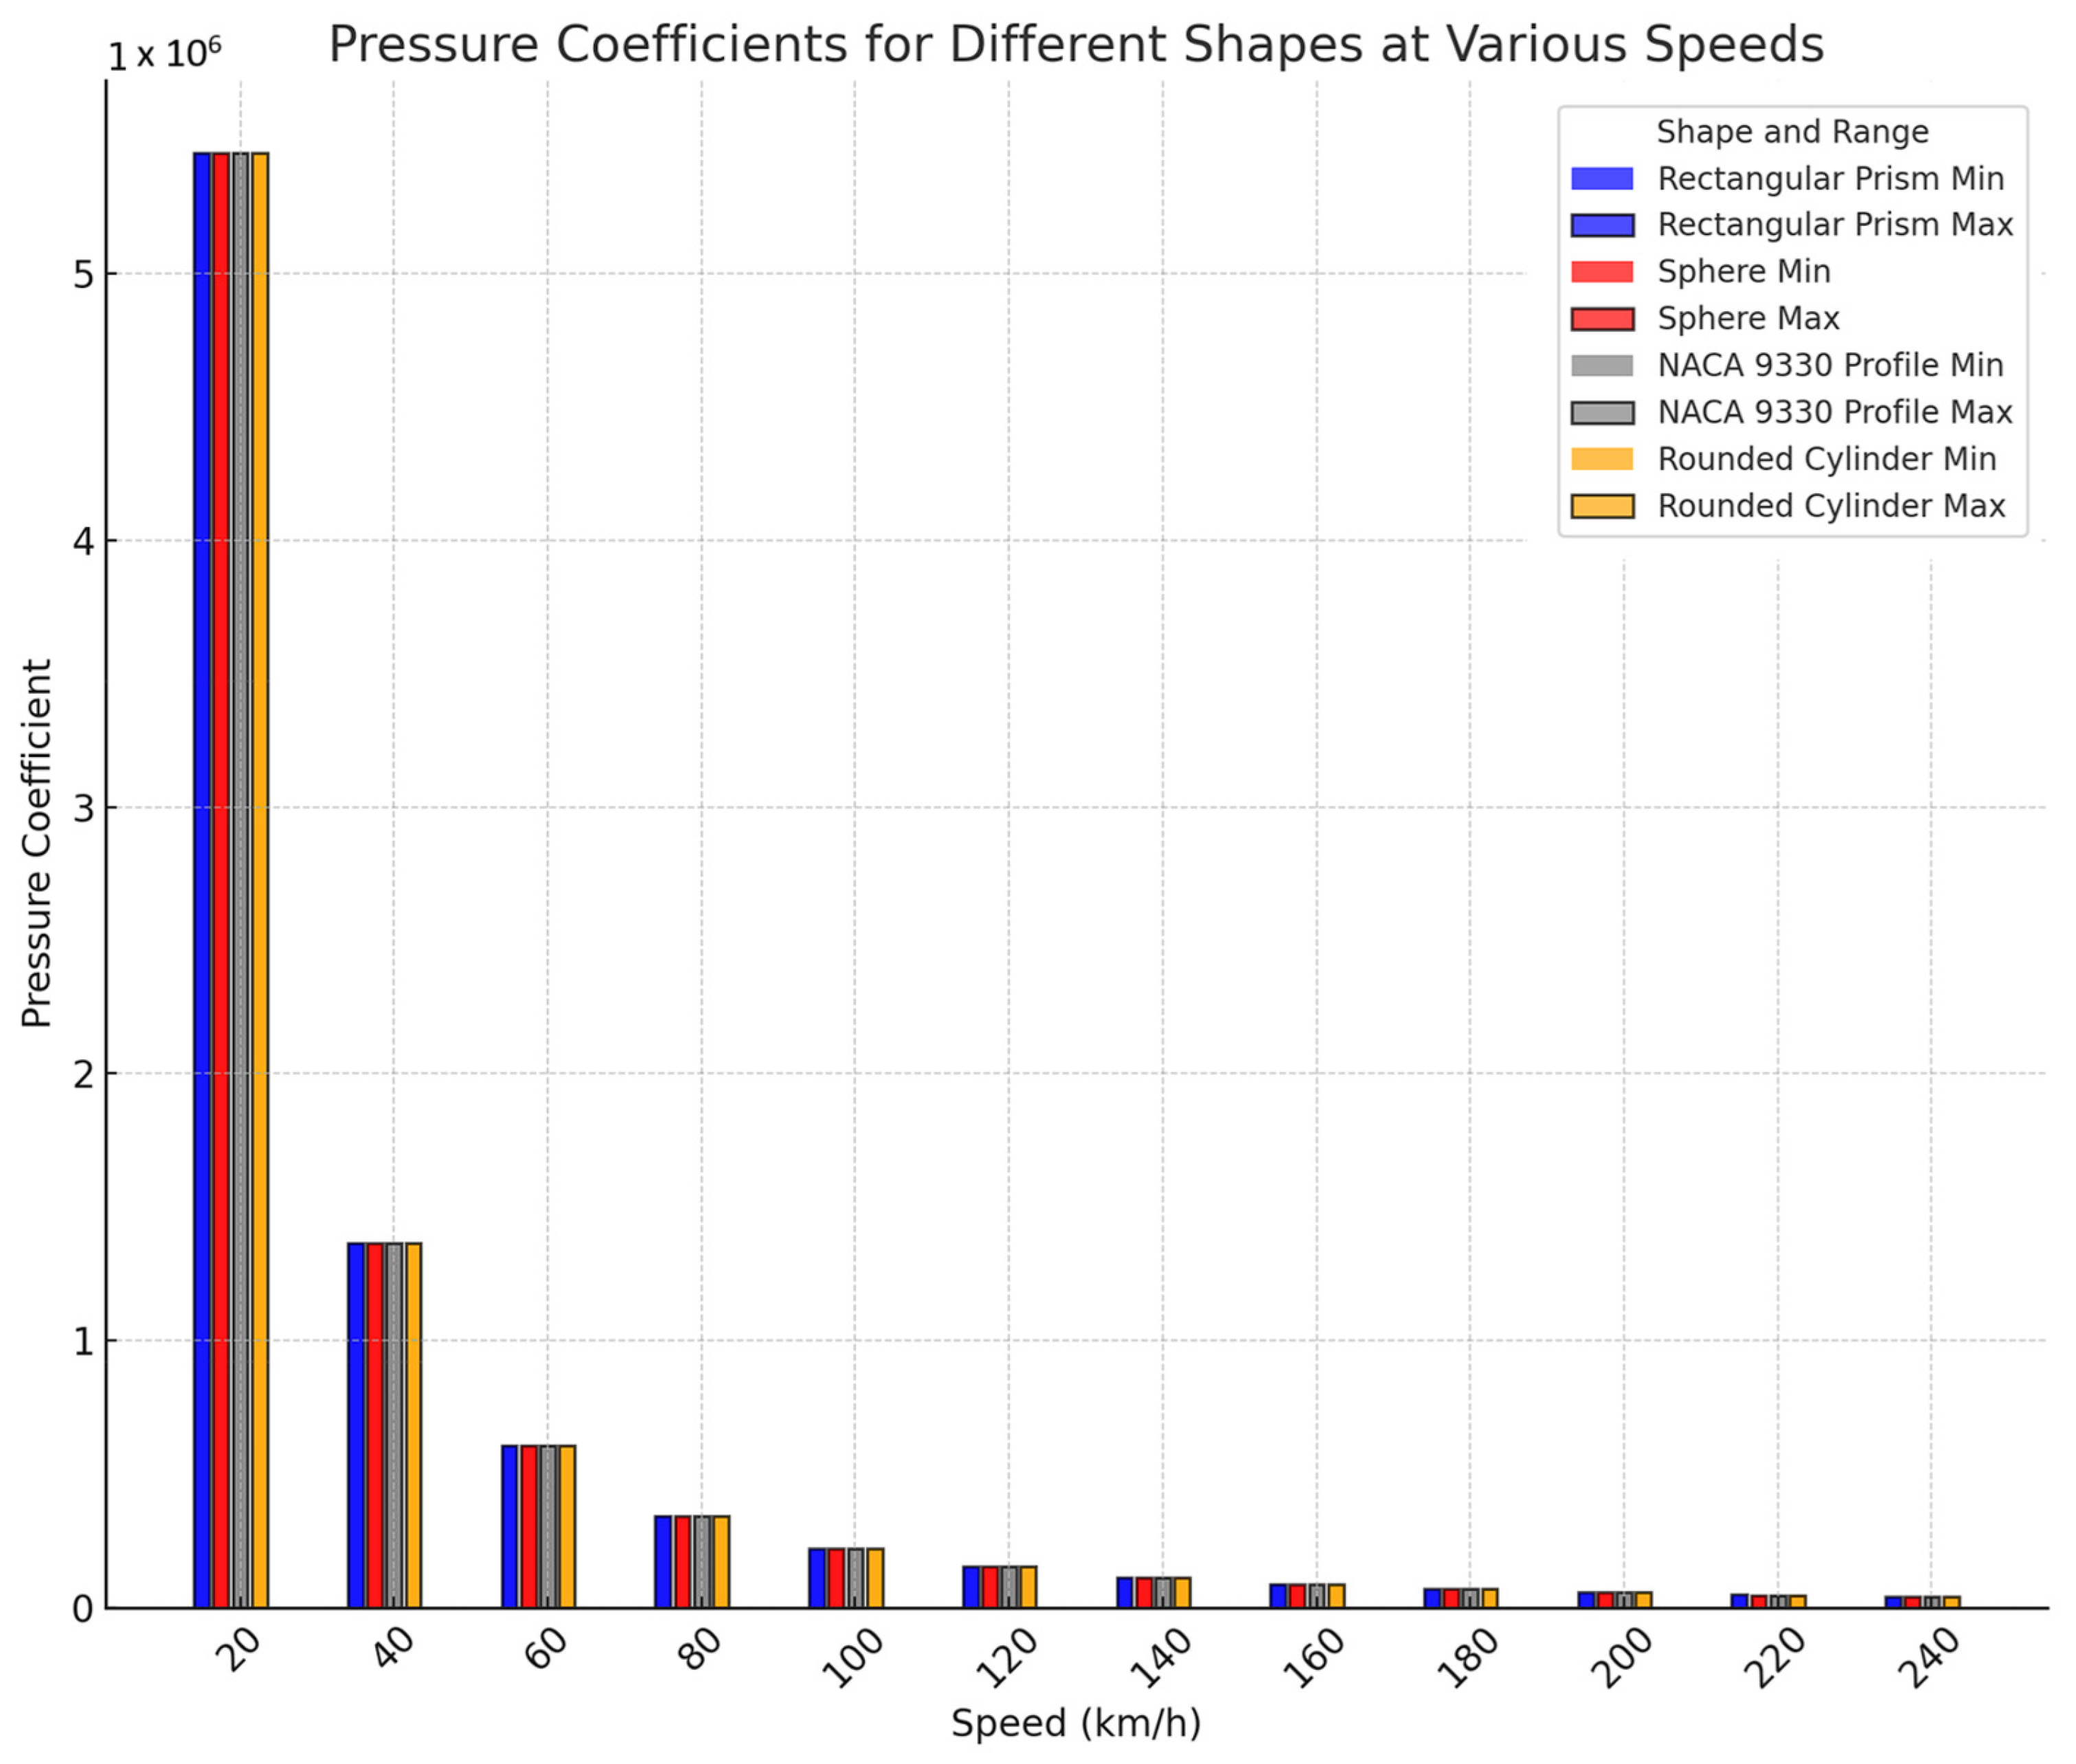
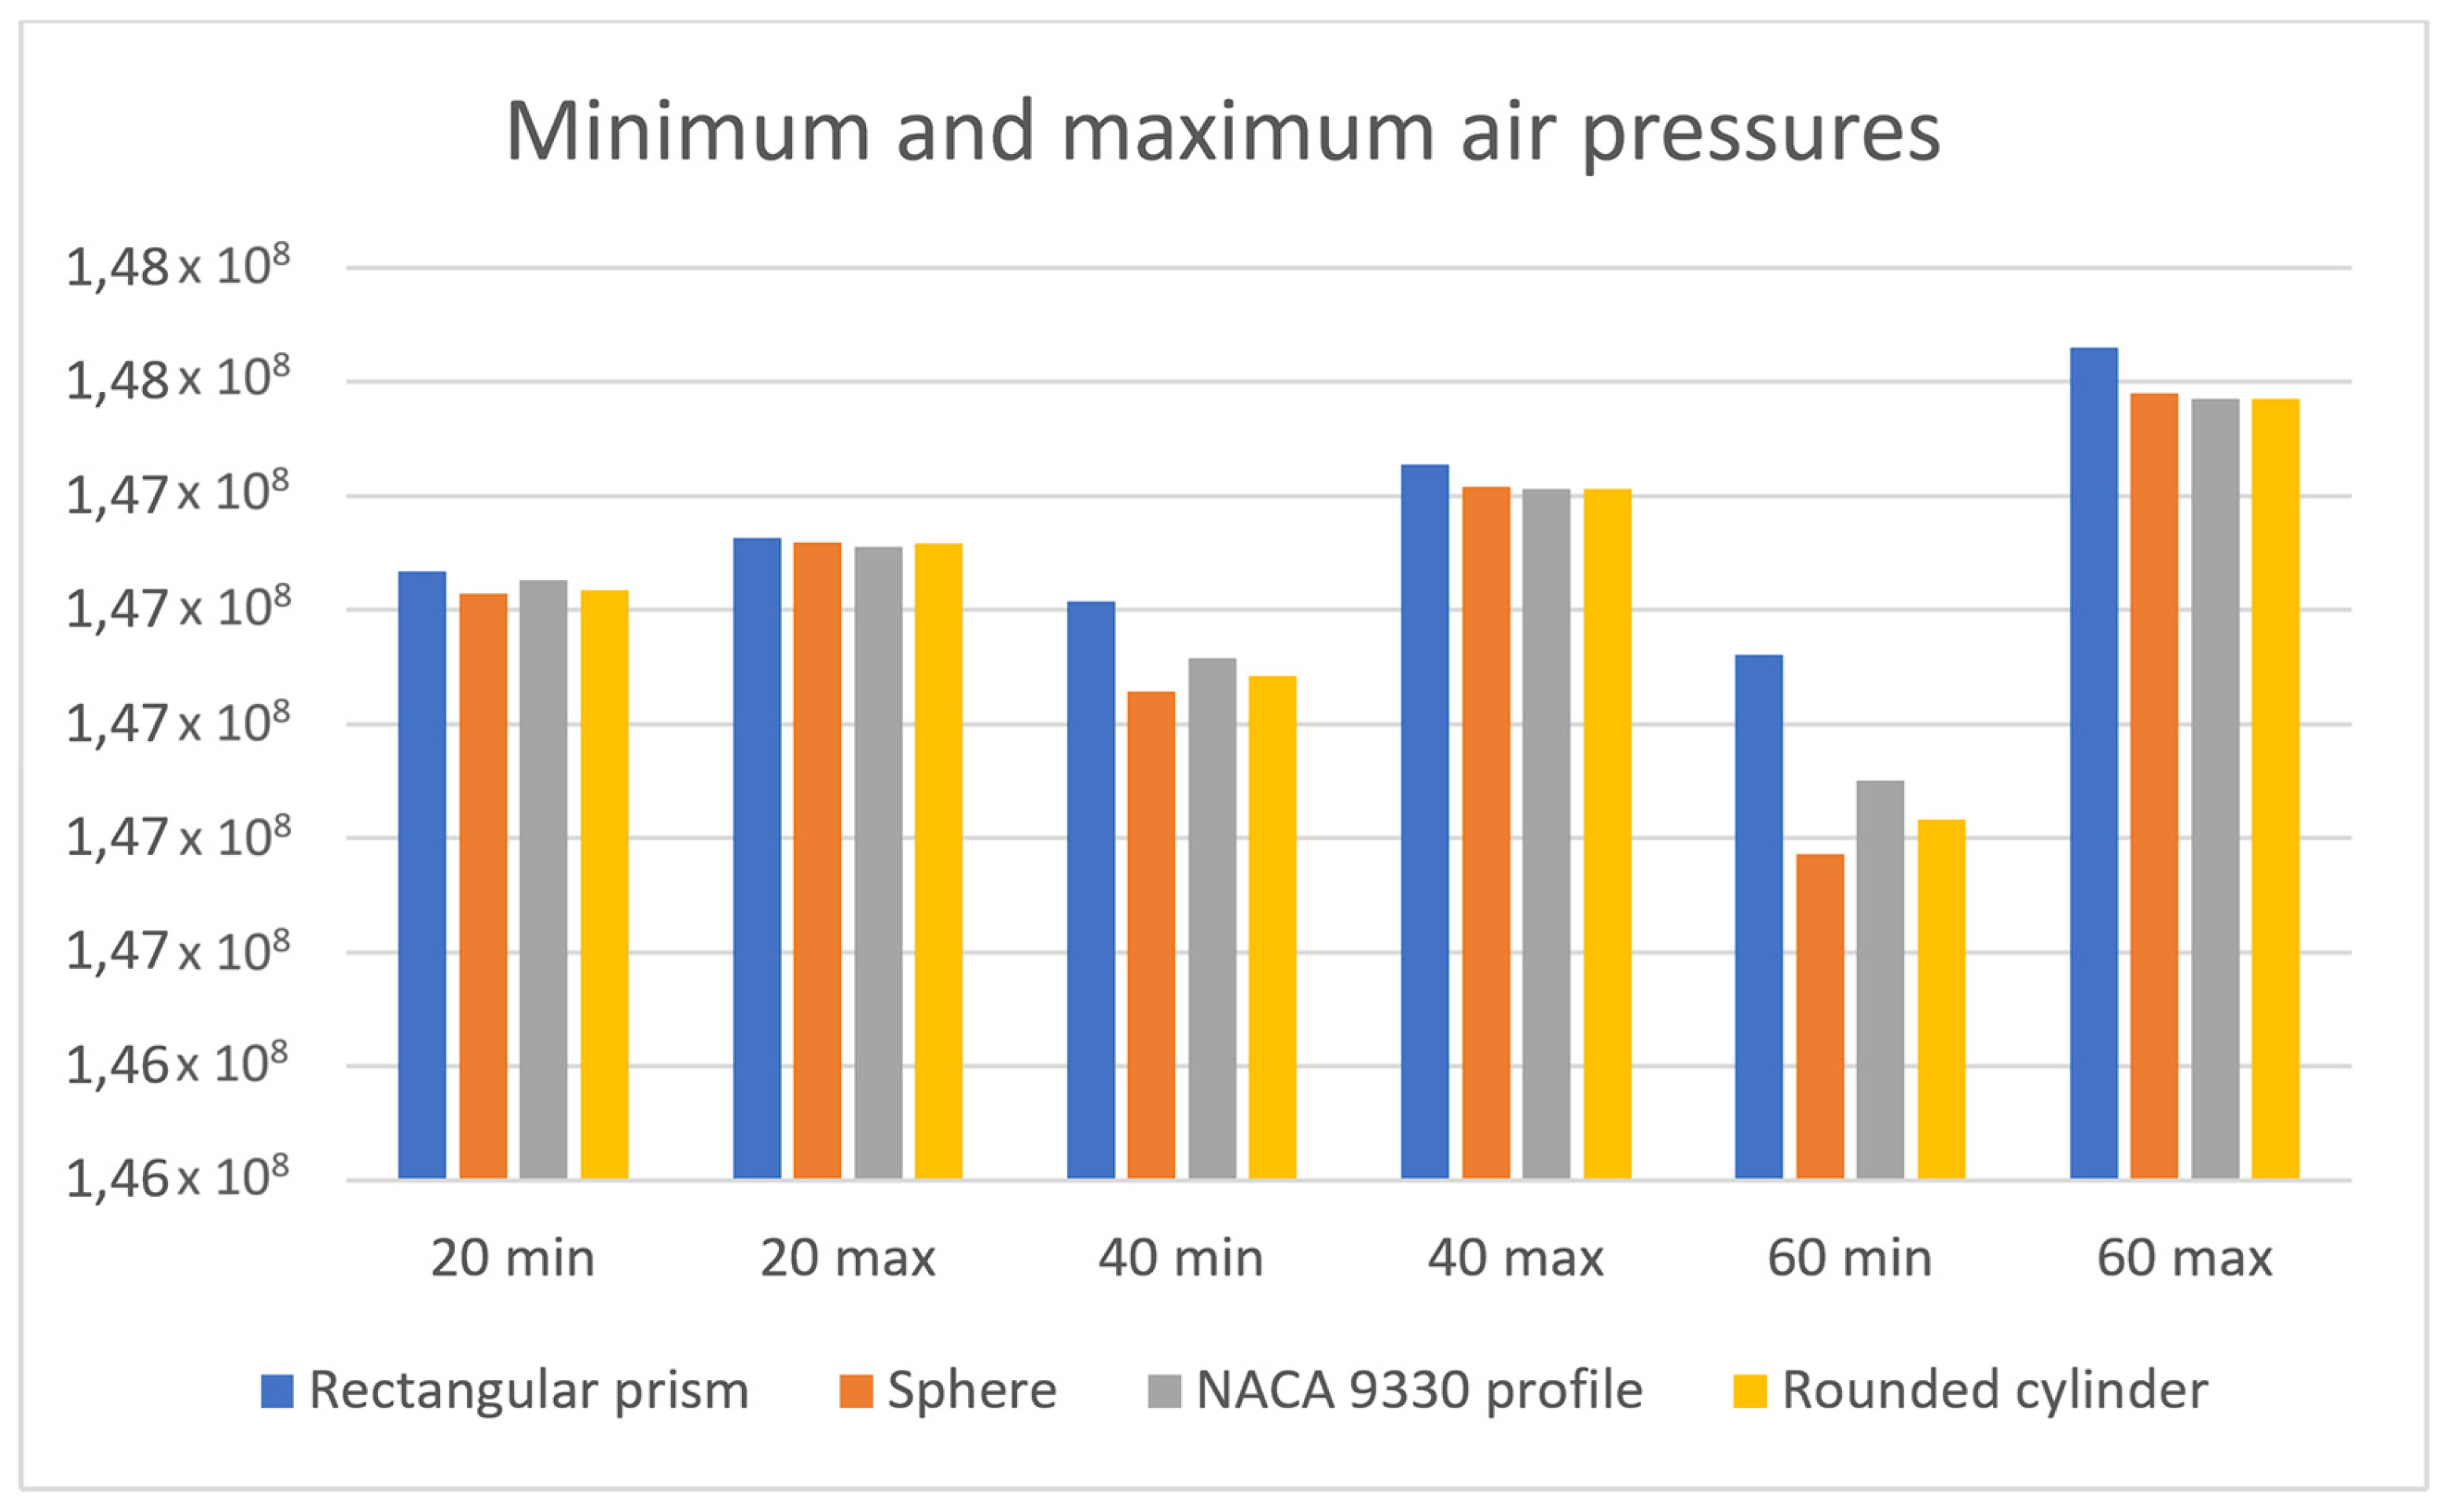
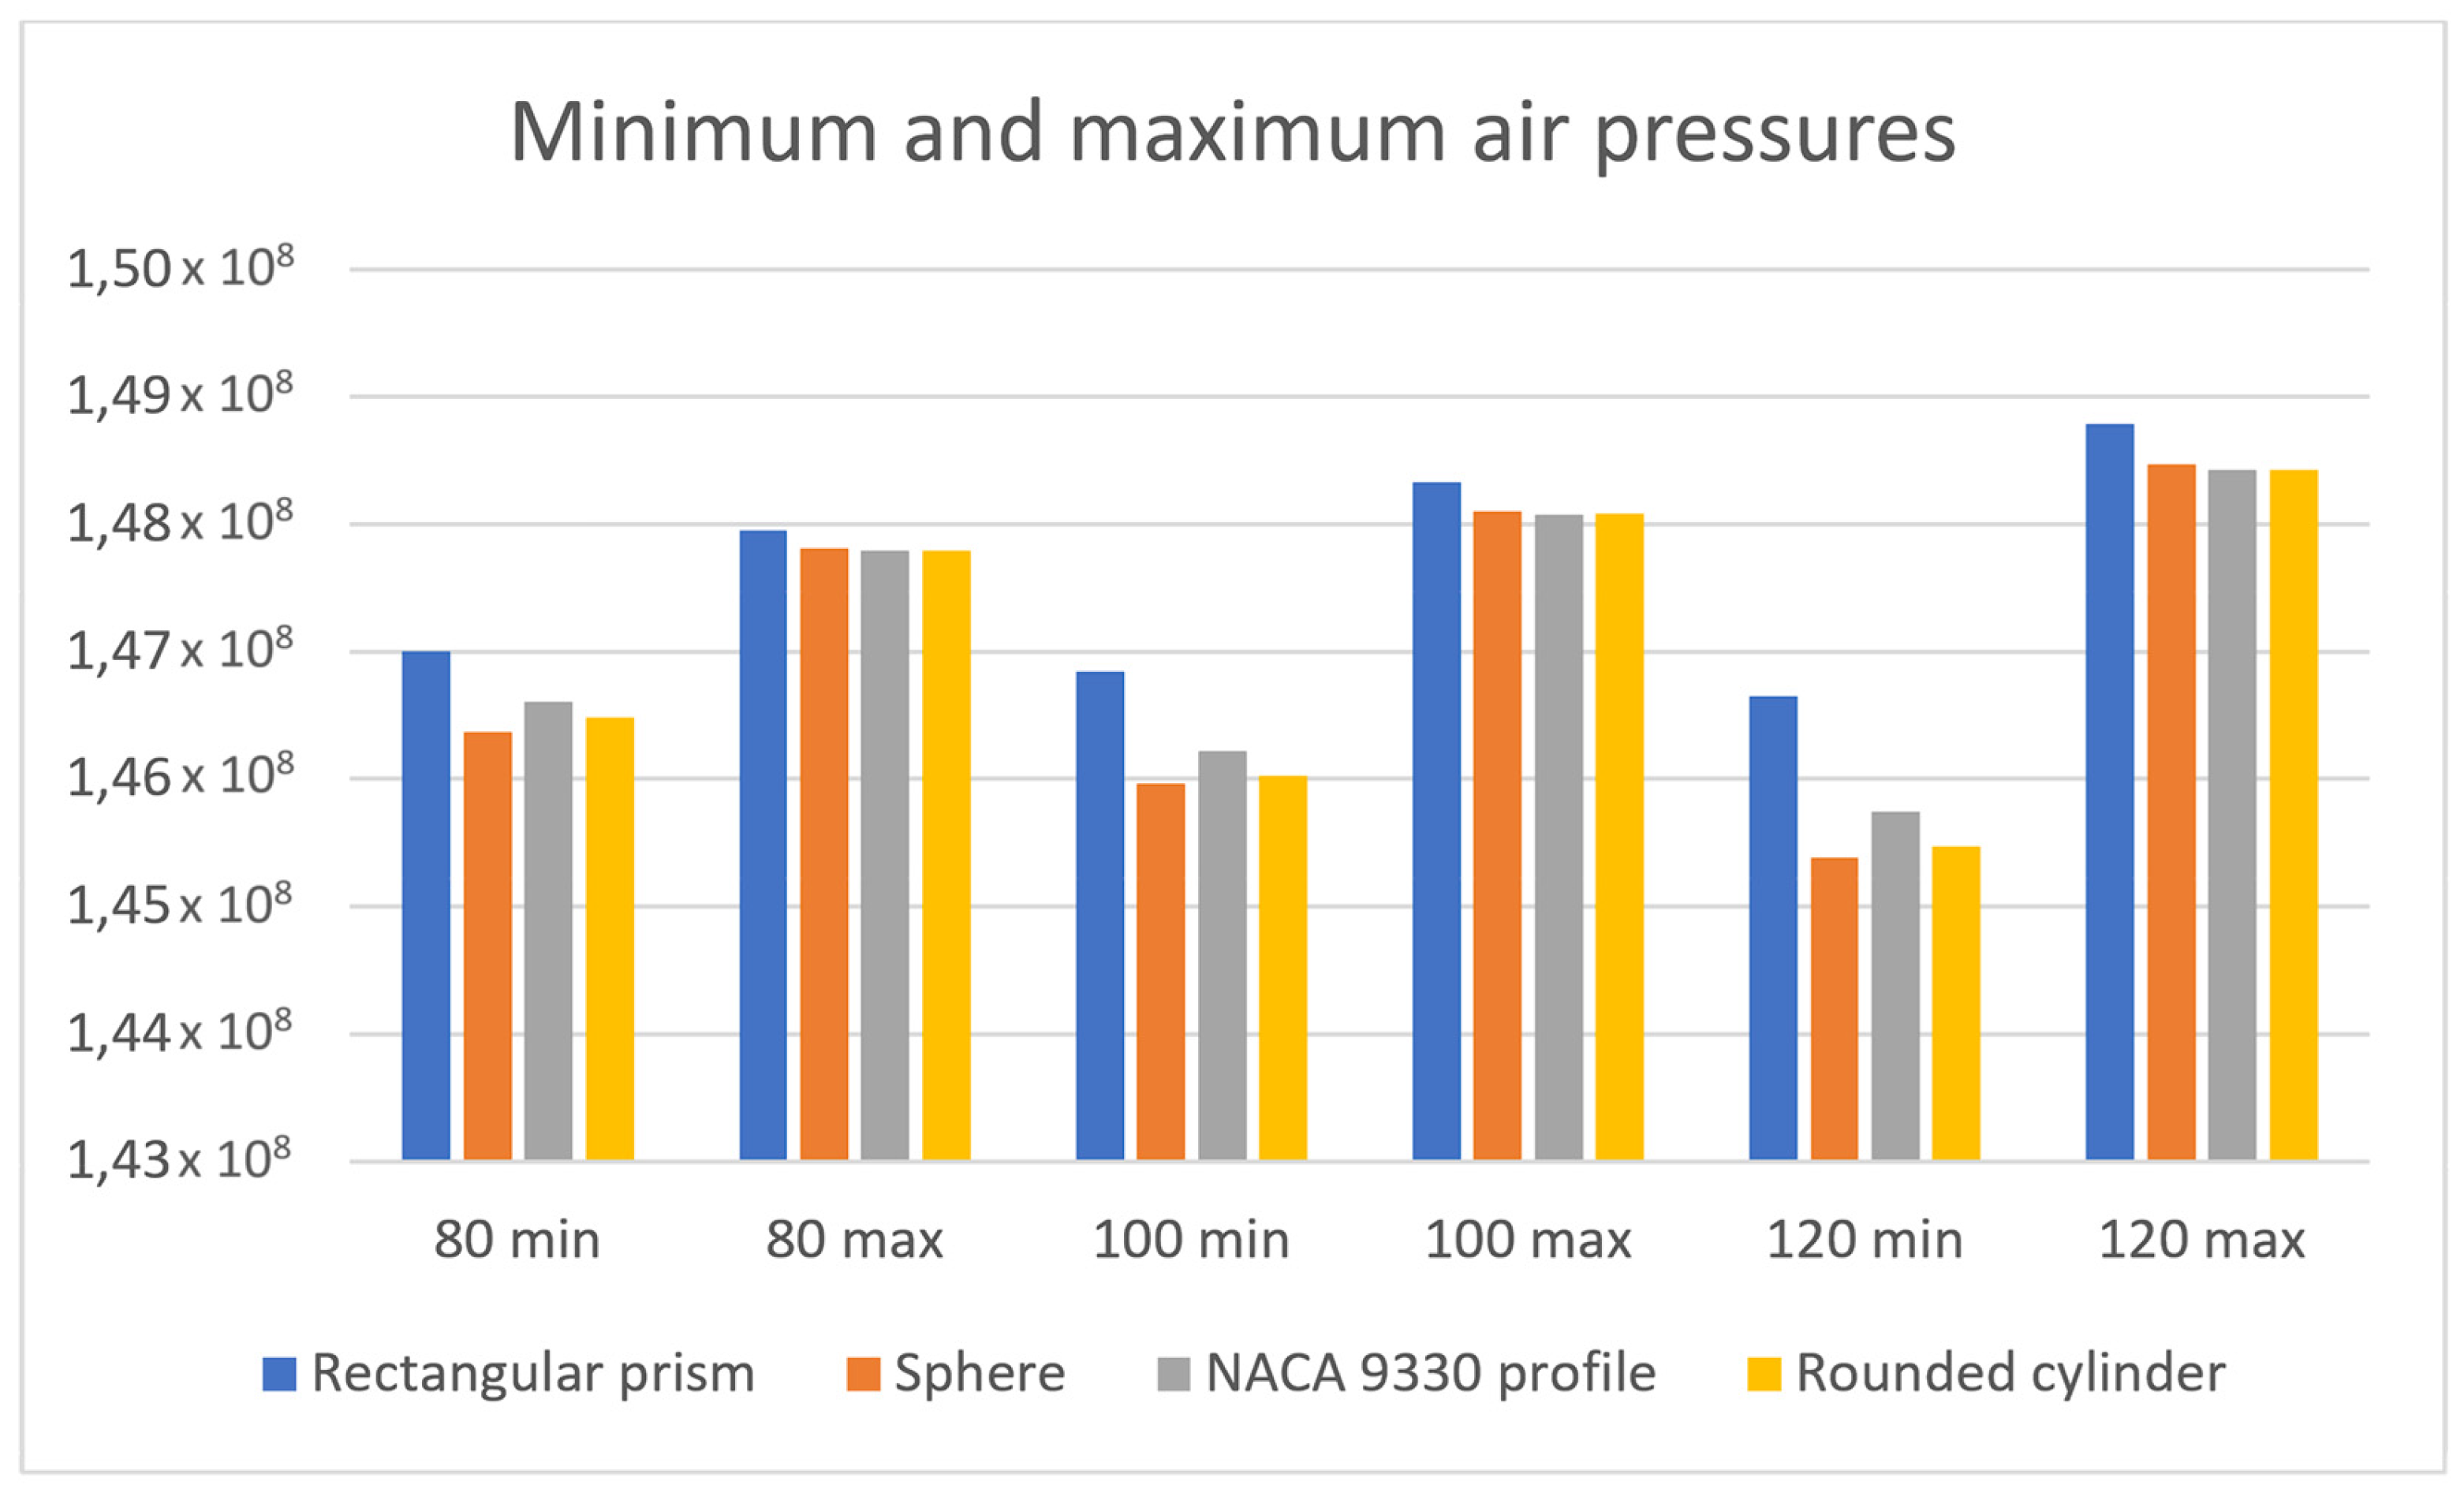
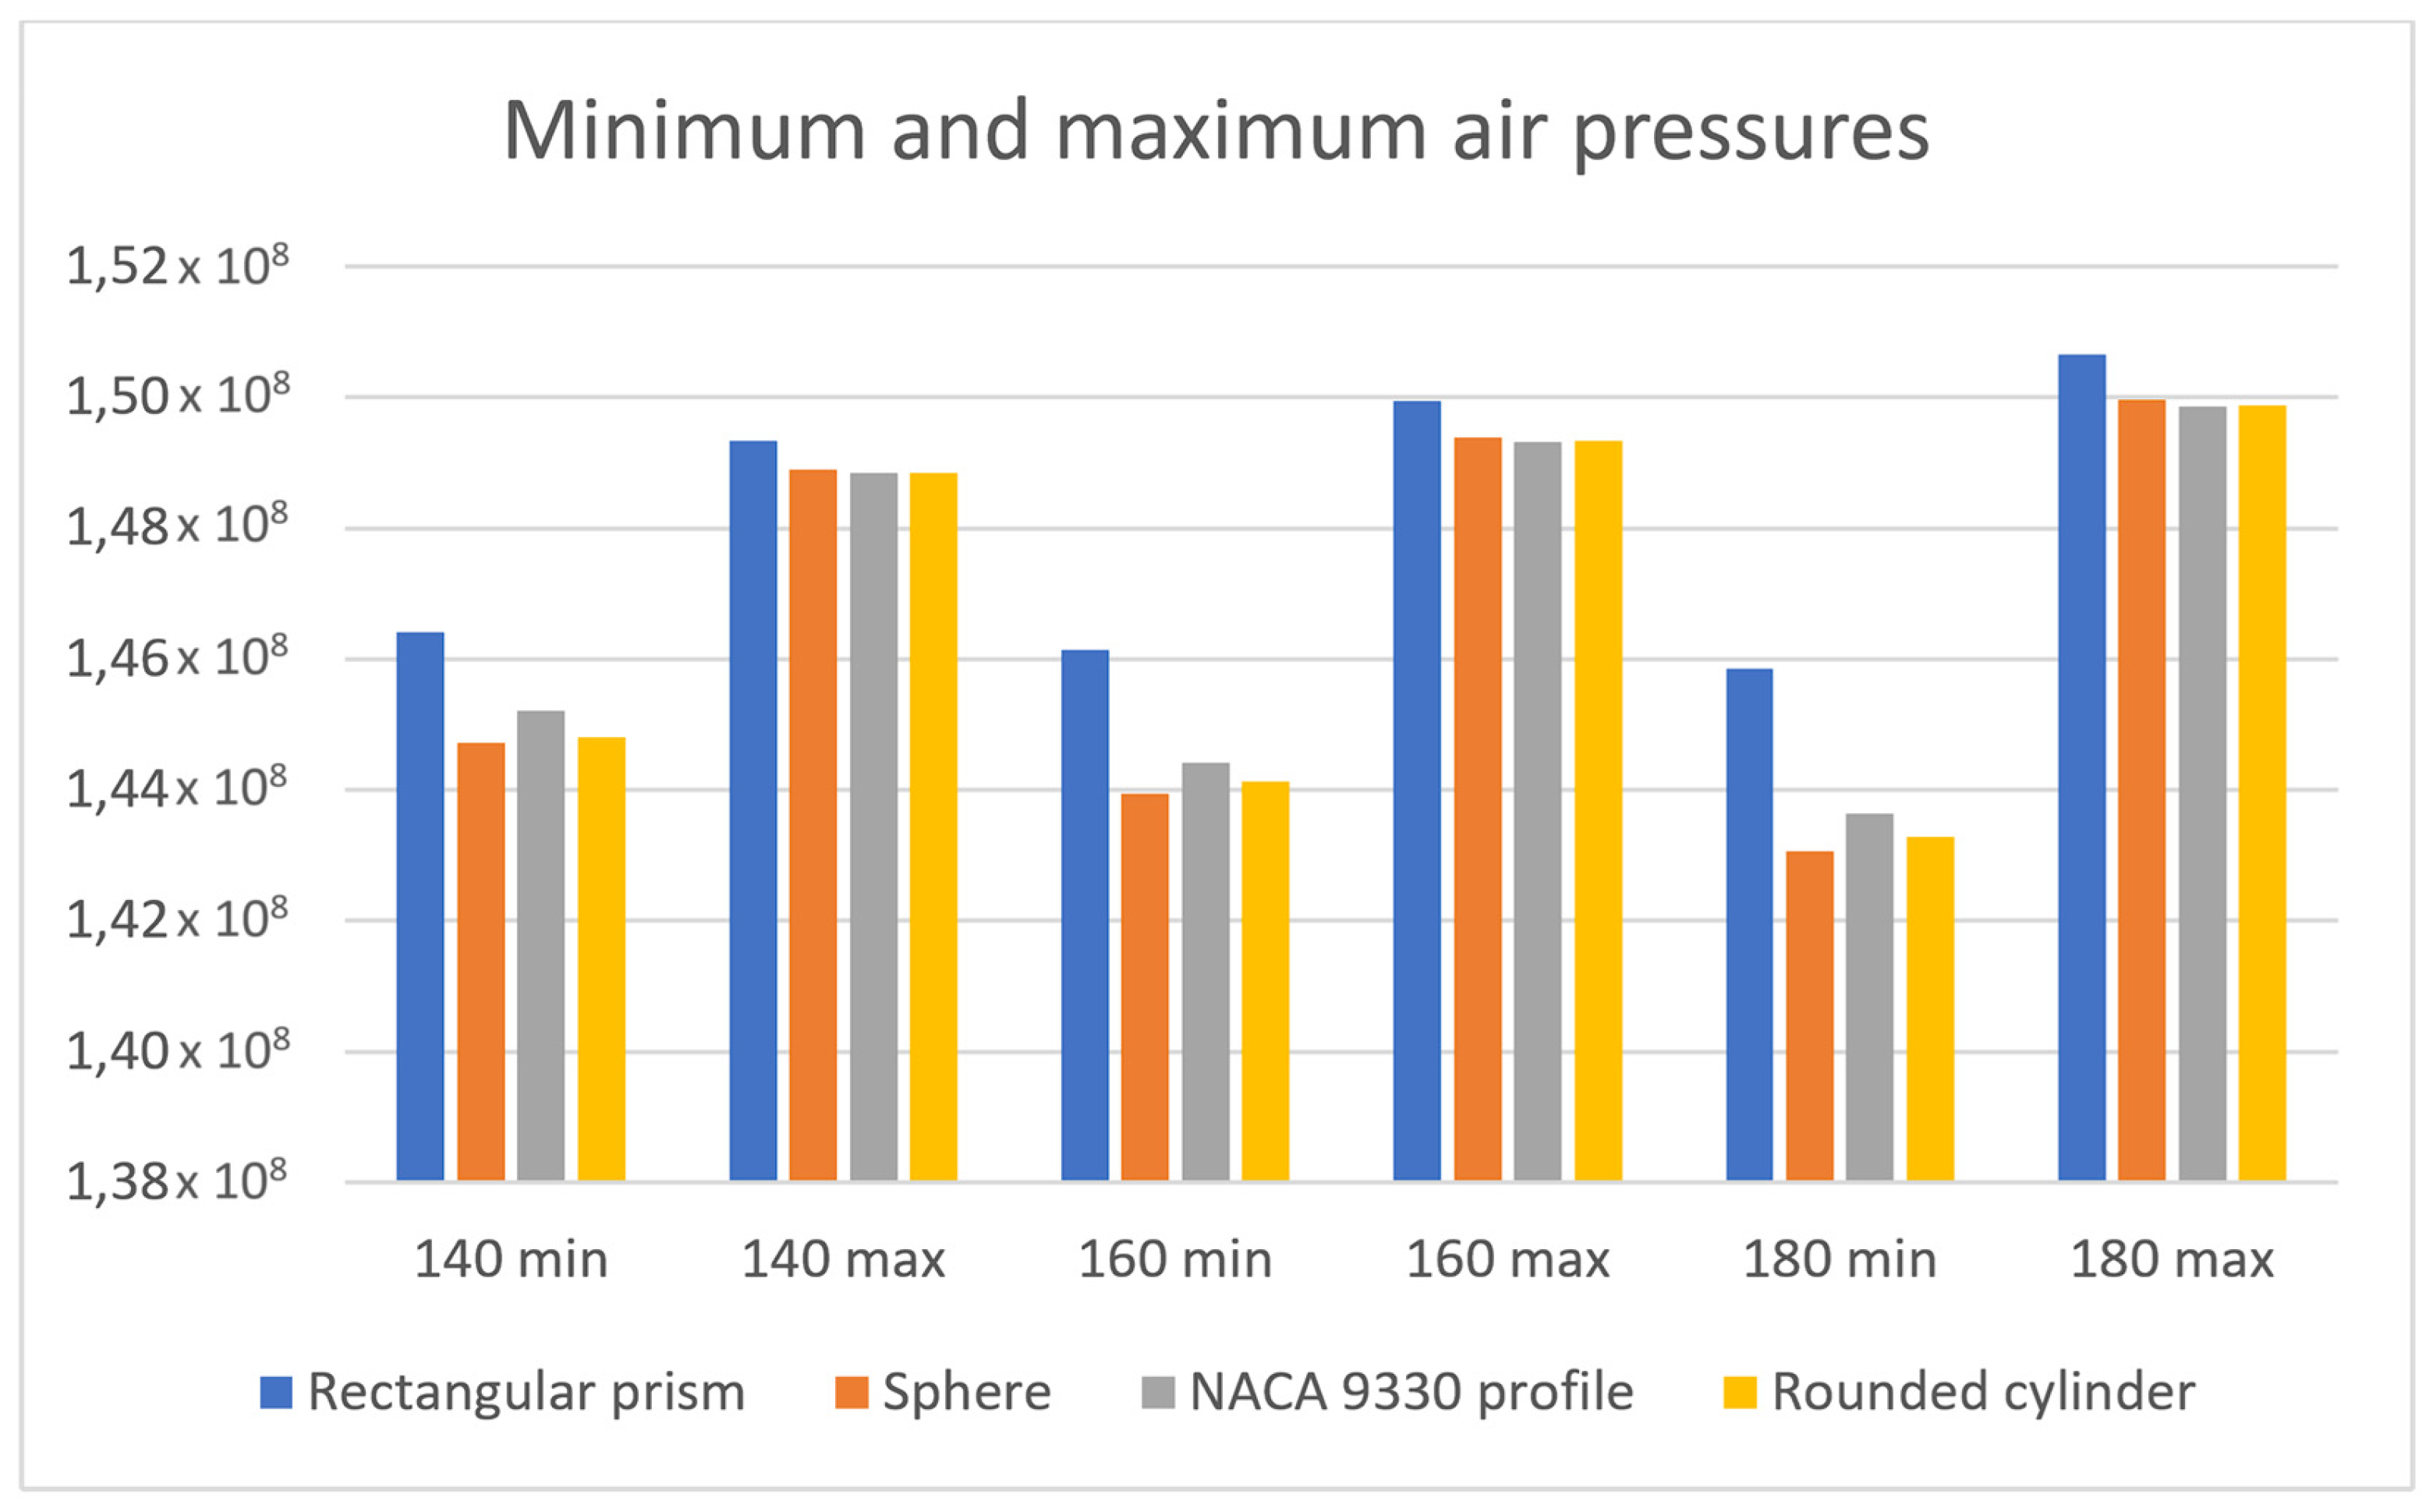
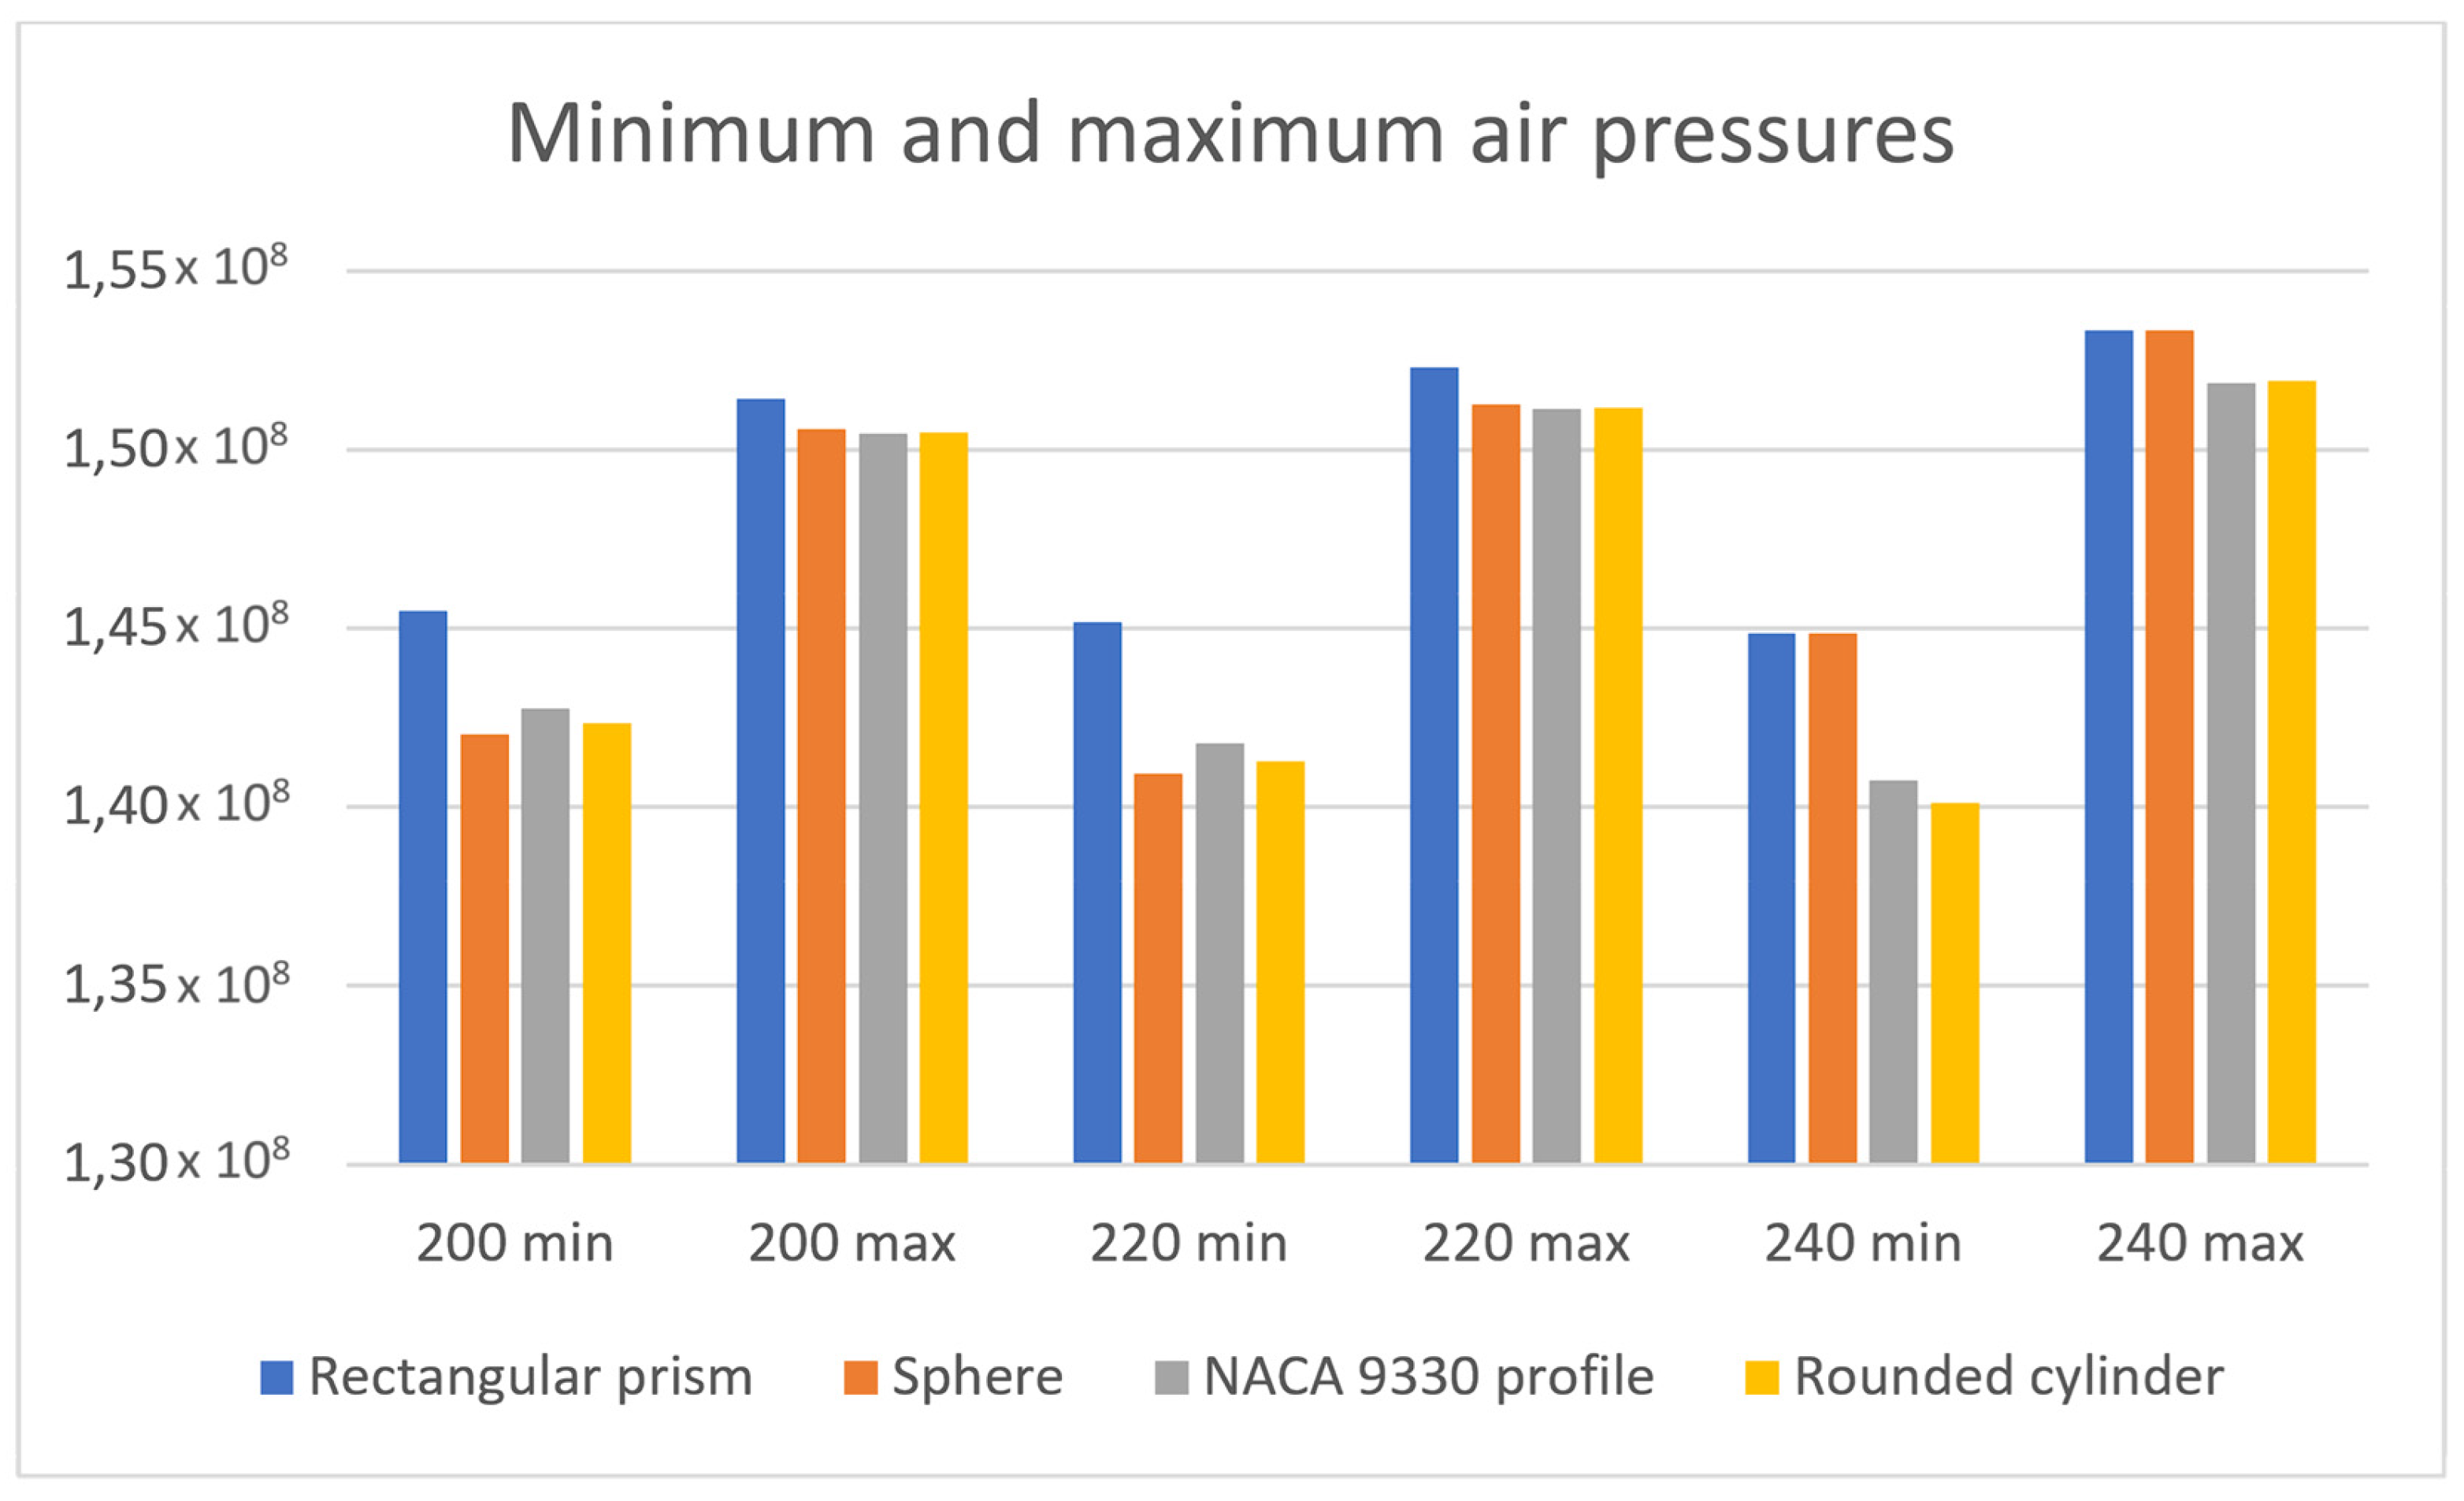
- Increased drag: Simulations in Chapter 3 revealed that drag increases by approximately 12–15% for non-aerodynamic shapes such as rectangular prisms, particularly at speeds exceeding 80 km/h. This increase is attributed to the pressure differential between the leading and trailing surfaces of the drone–container system. For rounded shapes, such as cylinders or spheres, drag increased by only 5–8% under similar conditions. This information is derived from the cumulative graph which is presented in Chapter 3. It illustrates the increase in maximum air pressure for various shapes at different speeds. By comparing the differences between the rectangular prism and aerodynamic shapes, such as the rounded cylinder, it is evident that non-aerodynamic shapes exhibit significantly steeper pressure increases as speed increases.
- Lift alteration: The container modifies the airflow around the body of the drone. Numerical simulations in Section 3 demonstrate that this effect reduces lift efficiency by up to 10% for rectangular containers, whereas the impact on rounded designs remains below 5%.
- At lower speeds (20–60 km/h): The differences between shapes were minimal, with drag and lift variations generally within a 2% margin. This suggests that the choice of shape has a negligible impact on aerodynamic behavior in this speed range.
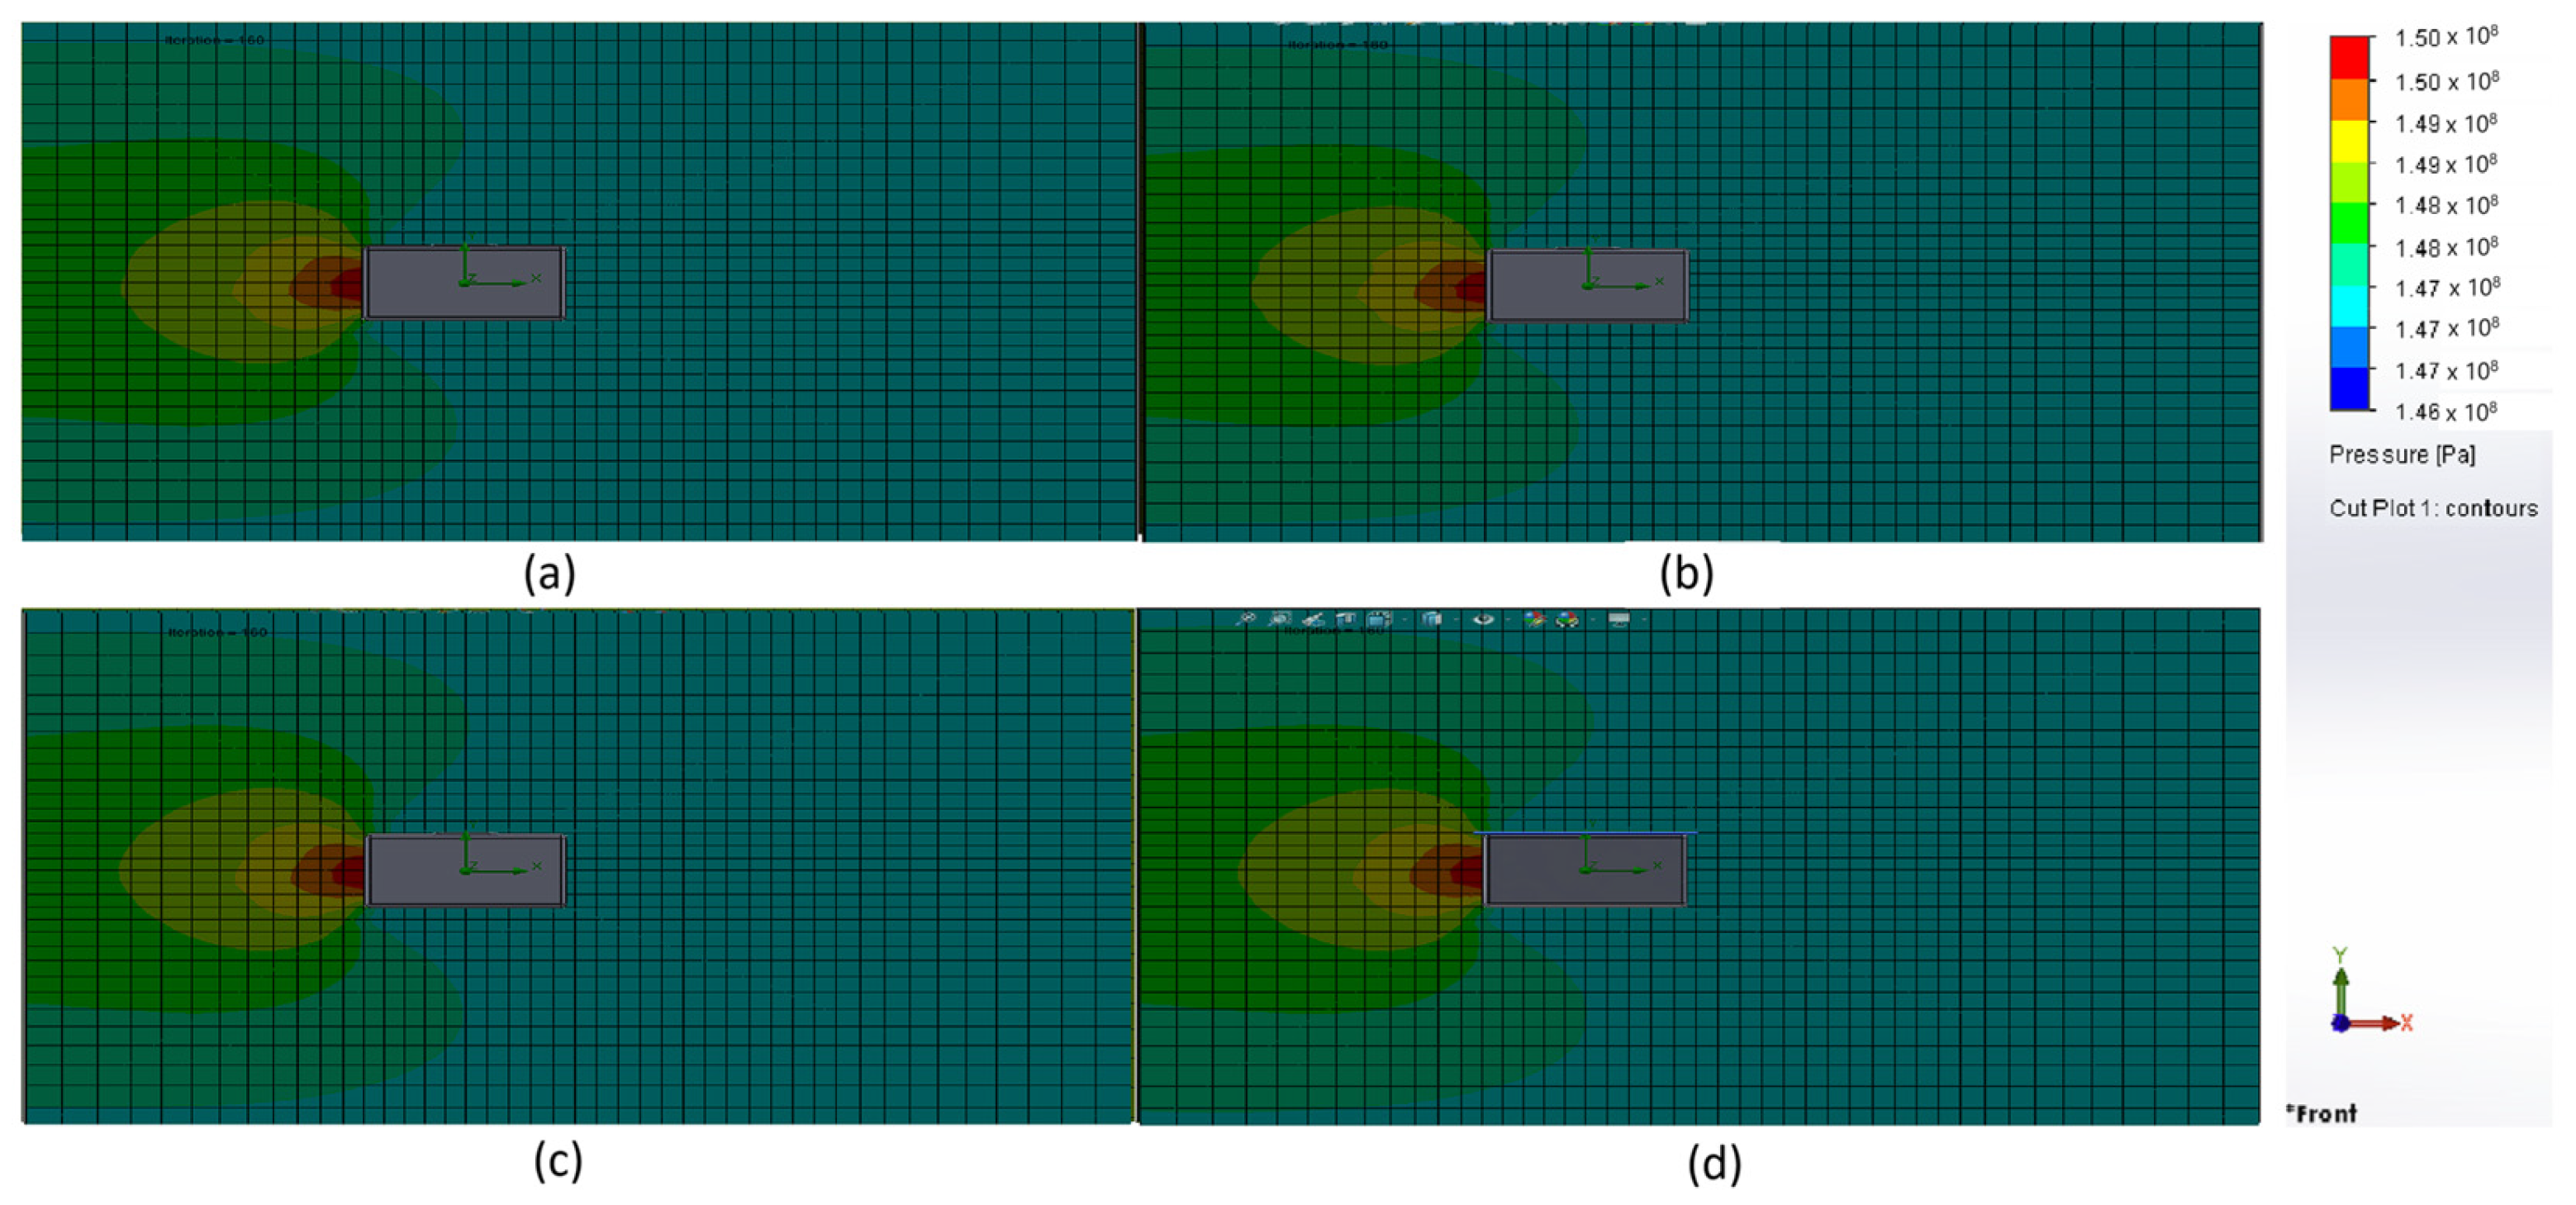
- Beyond 80 km/h: A trend of increasing drag and pressure differentials became apparent for non-aerodynamic shapes, such as rectangular prisms, while aerodynamic designs like the NACA 9330 profile showed more consistent characteristics. In some cases, maximum pressures for non-aerodynamic shapes appeared to approach values around 1.5 × 10⁷ Pa, highlighting the potential aerodynamic advantages of streamlined shapes.
2.5.2. Stability and Control
- Impact on center of gravity: The addition of a suspended container inevitably shifts the center of gravity downward, with non-aerodynamic shapes causing a more pronounced shift compared to aerodynamic shapes. This shift can lead to reduced pitch stability and increased demand for stabilization from the flight controller.
- Dynamic behavior: Changes in the center of gravity and aerodynamics affect the drone’s dynamic response. Non-aerodynamic shapes generally impose a higher stabilization burden on the control system, particularly at higher speeds.
2.5.3. Energy Efficiency
- Simulations suggest that non-aerodynamic shapes, such as rectangular prisms, may lead to a 15–20% increase in energy consumption compared to aerodynamic designs. This is inferred from the observed higher drag forces and pressure differences in the simulation results. Based on these estimates, the increased energy demand could potentially reduce battery endurance by approximately 10 min per hour of flight. Aerodynamic shapes, such as rounded cylinders or the NACA 9330 profile, appeared to result in a smaller increase in energy consumption, estimated at around 5%, under similar simulated conditions.
- At higher speeds exceeding 180 km/h, the difference in energy consumption becomes more pronounced. Cumulative data trends from the simulations, such as those illustrated in Chapter 3, indicate that rectangular containers may require up to 25% more energy than rounded cylinders. This highlights the importance of aerodynamic optimization for applications involving sustained high-speed drone operations.
- E represents energy consumption;
- Cd is the drag coefficient;
- v3 is the velocity of the drone.
- P_thrust is the power required to counteract the weight of the container and payload;
- P_drag accounts for aerodynamic resistance.
2.5.4. Design and Engineering Solutions
- Pressure reduction: Rounded designs showed a noticeable decrease in pressure differential between the front and rear surfaces compared to rectangular prisms, potentially by a significant margin.
- Drag minimization: Streamlined profiles demonstrated more stable drag behavior across the tested speed range, indicating better energy efficiency in comparison to non-aerodynamic shapes.
2.6. Selection of a Suitable Transport Drone for the Shipping Container, in Terms of Standards and Requirements
- Mini or micro drones: These drones typically weigh less than 250 g and are small enough to fit in the palm of a hand. They are ideal for recreational use and in many countries often do not require registration.
- Small drones: These drones weigh from 250 g to approximately 2 kg. They are often quadcopters used for amateur and semi-professional applications, such as photography and video recording.
- Medium-sized drones: These drones weigh between 2 and 25 kg and are commonly used for commercial applications, including geographic mapping, security operations, and, in some cases, delivery services.
- Large drones: These can weigh more than 25 kg and often require special permissions for use. They are used for specific purposes, such as heavy loads, agricultural applications, or large film productions.
- VTOL drones: This category includes drones capable of vertical take-off and landing, allowing them to operate from limited spaces without the need for runways. Unlike traditional quadcopters, VTOL drones are often hybrids between drones and fixed-wing aircraft, which provides them with greater aerodynamic efficiency and extended range at higher speeds. Typical VTOL drone speeds range from 100 to 200 km/h, depending on the design and intended purpose. These drones are well-suited for demanding tasks, such as longer-distance delivery or surveillance operations, where higher speed and efficiency are required.
2.7. Other Factors Affecting the Drone’s Maneuverability and Control Response
3. Results

| Speed [km/h] | Minimum Pressure [Pa] | Maximum Pressure [Pa] | Pressure Difference [Pa] |
|---|---|---|---|
| 20 | 147,267,585 | 147,327,383 | 59,798 |
| 40 | 147,214,708 | 147,454,485 | 239,777 |
| 60 | 147,121,997 | 147,659,363 | 537,366 |
| 80 | 146,999,048 | 147,953,031 | 953,983 |
| 100 | 146,841,997 | 148,331,190 | 1,489,193 |
| 120 | 146,648,245 | 148,788,320 | 2,140,075 |
| 140 | 146,407,904 | 149,332,991 | 2,925,087 |
| 160 | 146,135,838 | 149,939,608 | 3,803,770 |
| 180 | 145,848,368 | 150,663,173 | 4,814,805 |
| 200 | 145,493,985 | 151,411,291 | 5,917,306 |
| 220 | 145,180,020 | 152,307,148 | 7,127,128 |
| 240 | 144,856,286 | 153,332,829 | 8,476,543 |
| Speed [km/h] | Minimum Pressure [Pa] | Maximum Pressure [Pa] | Pressure Difference [Pa] |
|---|---|---|---|
| 20 | 147,228,771 | 147,318,228 | 89,457 |
| 40 | 147,056,667 | 147,416,100 | 359,433 |
| 60 | 146,773,069 | 147,579,304 | 80,6235 |
| 80 | 146,369,578 | 147,808,052 | 1,438,474 |
| 100 | 145,963,733 | 148,103,499 | 2,139,766 |
| 120 | 145,382,943 | 148,468,639 | 3,085,696 |
| 140 | 144,719,140 | 148,895,044 | 4,175,904 |
| 160 | 143,949,531 | 149,391,569 | 5,442,038 |
| 180 | 143,065,448 | 149,953,698 | 6,888,250 |
| 200 | 142,022,091 | 150,585,158 | 8,563,067 |
| 220 | 140,944,972 | 151,281,451 | 10,336,479 |
| 240 | 139,800,937 | 152,045,238 | 12,244,301 |
| Speed [km/h] | Minimum Pressure [Pa] | Maximum Pressure [Pa] | Pressure Difference [Pa] |
|---|---|---|---|
| 20 | 147,253,001 | 147,311,841 | 58,840 |
| 40 | 147,115,421 | 147,412,383 | 29,6962 |
| 60 | 146,901,123 | 147,570,913 | 669,790 |
| 80 | 146,603,095 | 147,792,808 | 1,189,713 |
| 100 | 146,217,150 | 148,079,291 | 1,862,141 |
| 120 | 145,742,296 | 148,427,797 | 2,685,501 |
| 140 | 145,205,211 | 148,845,902 | 3,640,691 |
| 160 | 144,415,476 | 149,317,401 | 4,90,1925 |
| 180 | 143,639,057 | 149,858,161 | 6,219,104 |
| 200 | 142,765,952 | 150,465,921 | 7,699,969 |
| 220 | 141,794,140 | 151,136,304 | 9,342,164 |
| 240 | 140,728,871 | 151,872,598 | 11,143,727 |
| Speed [km/h] | Minimum Pressure [Pa] | Maximum Pressure [Pa] | Pressure Difference [Pa] |
|---|---|---|---|
| 20 | 147,235,287 | 147,317,339 | 82,052 |
| 40 | 147,084,225 | 147,412,530 | 328,305 |
| 60 | 146,832,192 | 147,571,279 | 739,087 |
| 80 | 146,479,037 | 147,793,642 | 1,314,605 |
| 100 | 146,024,970 | 148,079,978 | 2,055,008 |
| 120 | 145,467,528 | 148,430,121 | 2,962,593 |
| 140 | 144,808,727 | 148,844,730 | 4,036,003 |
| 160 | 144,128,976 | 149,334,436 | 5,205,460 |
| 180 | 143,283,829 | 149,880,978 | 6,597,149 |
| 200 | 142,336,704 | 150,493,229 | 8,156,525 |
| 220 | 141,273,526 | 151,173,261 | 9,899,735 |
| 240 | 140,118,419 | 151,917,187 | 11,798,768 |
Collective Evaluation of Simulations for Selected Shapes of Transport Containers
| Speed (km/h) | Rectangular Prism Min Pc | Rectangular Prism Max Pc | Sphere Min Pc | Sphere Max Pc | NACA 9330 Profile Min Pc | NACA 9330 Profile Max Pc | Rounded Cylinder Min Pc | Rounded Cylinder Max Pc |
|---|---|---|---|---|---|---|---|---|
| 20 | 5,453,108 | 5,455,322 | 5,451,671 | 5,454,983 | 5,452,568 | 5,454,747 | 5,451,912 | 5,454,950 |
| 40 | 1,362,787 | 1,365,007 | 1,361,324 | 1,364,651 | 1,361,868 | 1,364,617 | 1,361,579 | 1,364,618 |
| 60 | 605,301 | 607,512 | 603,866 | 607,183 | 604,393 | 607,148 | 604,109 | 607,150 |
| 80 | 340,197 | 342,405 | 338,741 | 342,070 | 339,281 | 342,034 | 338,994 | 342,036 |
| 100 | 217,493 | 219,699 | 216,193 | 219,362 | 216,568 | 219,326 | 216,283 | 219,327 |
| 120 | 150,838 | 153,039 | 149,536 | 152,710 | 149,906 | 152,668 | 149,623 | 152,670 |
| 140 | 110,638 | 112,848 | 109,362 | 112,517 | 109,729 | 112,480 | 109,429 | 112,479 |
| 160 | 84,550 | 86,750 | 83,285 | 86,433 | 83,554 | 86,390 | 83,388 | 86,400 |
| 180 | 66,673 | 68.874 | 65,401 | 68,550 | 65,663 | 68,506 | 65,501 | 68,517 |
| 200 | 53,874 | 56,065 | 52,588 | 55,759 | 52,864 | 55,715 | 52,705 | 55,725 |
| 220 | 44,428 | 46,609 | 43,132 | 46,295 | 43,392 | 46,250 | 43,232 | 46,262 |
| 240 | 37,248 | 39,428 | 36,030 | 39,064 | 36,187 | 39,052 | 36,030 | 39,064 |
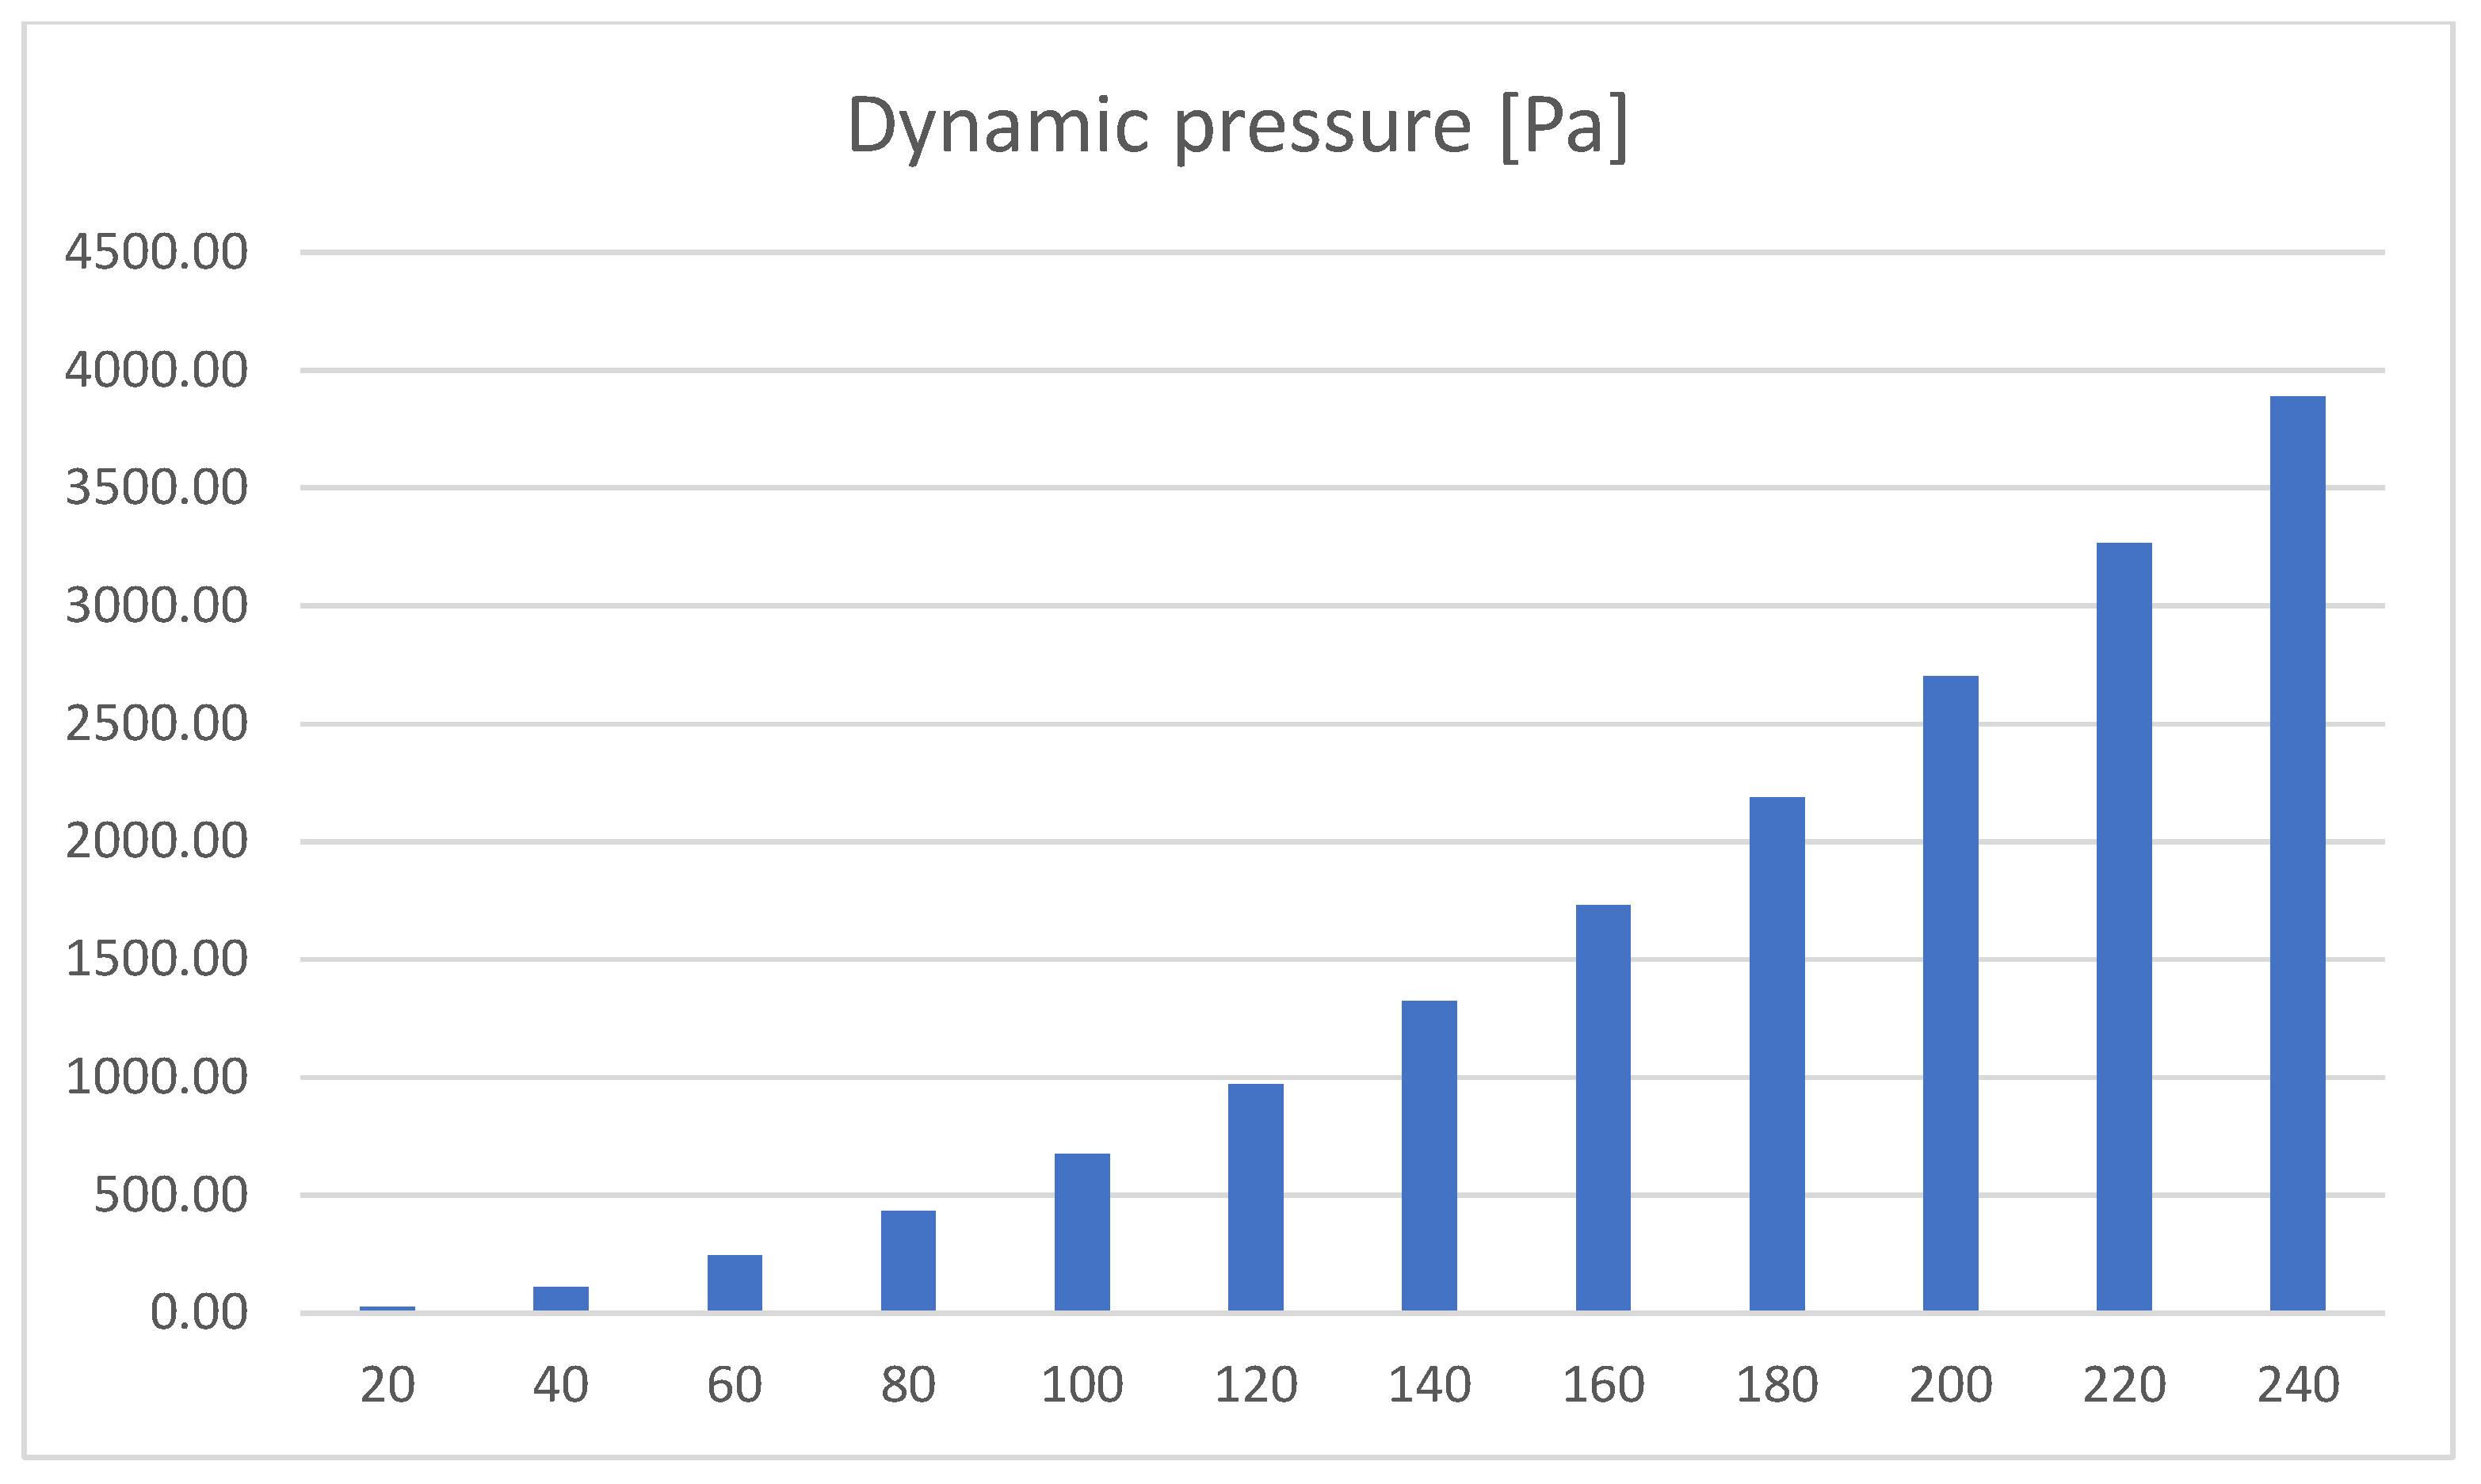
| Speed [km/h] | 20 | 40 | 60 | 80 | 100 | 120 | 140 | 160 | 180 | 200 | 220 | 240 |
|---|---|---|---|---|---|---|---|---|---|---|---|---|
| Dynamic pressure [Pa] | 27.01 | 108.02 | 243.06 | 432.10 | 675.15 | 972.22 | 1323.30 | 1728.40 | 2187.50 | 2700.62 | 3267.75 | 3888.89 |
4. Discussion
5. Conclusions
Author Contributions
Funding
Data Availability Statement
Acknowledgments
Conflicts of Interest
References
- Michael, N.; Kumar, V. Opportunities and challenges with autonomous micro aerial vehicles. Int. J. Robot. Res. 2012, 31, 1279–1291. [Google Scholar] [CrossRef]
- Yao, H.; Qin, R.; Chen, X. Unmanned Aerial Vehicle for Remote Sensing Applications—A Review. Remote Sens. 2019, 11, 1443. [Google Scholar] [CrossRef]
- Laghari, A.A.; Jumani, A.K.; Laghari, R.A.; Nawaz, H. Unmanned aerial vehicles: A review. Cogn. Robot. 2023, 3, 8–22. [Google Scholar] [CrossRef]
- Estrada, M.A.R.; Ndoma, A. The uses of unmanned aerial vehicles—UAV’s—(or drones) in social logistic: Natural disasters response and humanitarian relief aid. Procedia Comput. Sci. 2019, 149, 375–383. [Google Scholar] [CrossRef]
- Eskandaripour, H.; Boldsaikhan, E. Last-Mile Drone Delivery: Past, Present, and Future. Drones 2023, 7, 77. [Google Scholar] [CrossRef]
- Azzollini, I.A.; Mimmo, N.; Marconi, L. An Extremum Seeking Approach to Search and Rescue Operations in Avalanches using ARVA. IFAC-PapersOnLine 2020, 53, 1627–1632. [Google Scholar] [CrossRef]
- Alsamhi, S.H.; Shvetsov, A.V.; Kumar, S.; Shvetsova, S.V.; Alhartomi, M.A.; Hawbani, A.; Rajput, N.S.; Srivastava, S.; Saif, A.; Nyangaresi, V.O. UAV Computing-Assisted Search and Rescue Mission Framework for Disaster and Harsh Environment Mitigation. Drones 2022, 6, 154. [Google Scholar] [CrossRef]
- Rudol, P.; Doherty, P. Human body detection and geolocalization for UAV search and rescue missions using color and thermal imagery. In Proceedings of the 2008 IEEE Aerospace Conference, Big Sky, MT, USA, 1–8 March 2008; IEEE: Piscataway, NJ, USA, 2008; pp. 1–8. [Google Scholar]
- Rizk, M.; Slim, F.; Charara, J. Toward AI-Assisted UAV for Human Detection in Search and Rescue Missions. In Proceedings of the 2021 International Conference on Decision Aid Sciences and Application (DASA), Virtual, 7–8 December 2021; IEEE: Piscataway, NJ, USA, 2021; pp. 781–786. [Google Scholar]
- Srivastava, S.K.; Seng, K.P.; Ang, L.M.; Pachas, A.‘N.A.; Lewis, T. Drone-Based Environmental Monitoring and Image Processing Approaches for Resource Estimates of Private Native Forest. Sensors 2022, 22, 7872. [Google Scholar] [CrossRef]
- Colomina, I.; Molina, P. Unmanned aerial systems for photogrammetry and remote sensing: A review. ISPRS J. Photogramm. Remote Sens. 2014, 92, 79–97. [Google Scholar] [CrossRef]
- Nex, F.; Remondino, F. UAV for 3D mapping applications: A review. Appl. Geomat. 2014, 6, 1–15. [Google Scholar] [CrossRef]
- Janoušek, J.; Jambor, V.; Marcoň, P.; Dohnal, P.; Synková, H.; Fiala, P. Using UAV-Based Photogrammetry to Obtain Correlation between the Vegetation Indices and Chemical Analysis of Agricultural Crops. Remote Sens. 2021, 13, 1878. [Google Scholar] [CrossRef]
- Na, J.; Xue, K.; Xiong, L.; Tang, G.; Ding, H.; Strobl, J.; Pfeifer, N. UAV-Based Terrain Modeling under Vegetation in the Chinese Loess Plateau: A Deep Learning and Terrain Correction Ensemble Framework. Remote Sens. 2020, 12, 3318. [Google Scholar] [CrossRef]
- Remondino, F.; Barazzetti, L.; Nex, F.; Scaioni, M.; Sarazzi, D. UAV Photogrammetry for mapping and 3D modeling—Current status and future perspectives. Int. Arch. Photogramm. Remote Sens. Spatial Inf. Sci. 2011, XXXVIII-1/C22, 25–31. [Google Scholar] [CrossRef]
- Khan, M.A.; Ectors, W.; Bellemans, T.; Janssens, D.; Wets, G. Unmanned Aerial Vehicle-Based Traffic Analysis: A Case Study for Shockwave Identification and Flow Parameters Estimation at Signalized Intersections. Remote Sens. 2018, 10, 458. [Google Scholar] [CrossRef]
- Coifman, B.; McCord, M.; Mishalani, R.G.; Iswalt, M.; Ji, Y. Roadway traffic monitoring from an unmanned aerial vehicle. IEE Proc. Intell. Transp. Syst. 2006, 153, 11–20. [Google Scholar] [CrossRef]
- Butilă, E.V.; Boboc, R.G. Urban Traffic Monitoring and Analysis Using Unmanned Aerial Vehicles (UAVs): A Systematic Literature Review. Remote Sens. 2022, 14, 620. [Google Scholar] [CrossRef]
- Bubeníková, E.; Pirník, R.; Holečko, P.; Franeková, M. The ways of streamlining digital image processing algorithms used for detection of lines in transport scenes video recording. IFAC-PapersOnLine 2015, 48, 174–179. [Google Scholar] [CrossRef]
- Sishodia, R.P.; Ray, R.L.; Singh, S.K. Applications of Remote Sensing in Precision Agriculture: A Review. Remote Sens. 2020, 12, 3136. [Google Scholar] [CrossRef]
- Sankaran, S.; Khot, L.R.; Espinoza, C.Z.; Jarolmasjed, S.; Sathuvalli, V.R.; Vandemark, G.J. Low-altitude, high-resolution aerial imaging systems for row and field crop phenotyping: A review. Eur. J. Agron. 2015, 70, 112–123. [Google Scholar] [CrossRef]
- Wang, L.; Lan, Y.; Zhang, Y.; Zhang, H.; Tahir, M.N.; Ou, S.; Liu, X.; Chen, P. Applications and Prospects of Agricultural Unmanned Aerial Vehicle Obstacle Avoidance Technology in China. Sensors 2019, 19, 642. [Google Scholar] [CrossRef]
- Tsouros, D.C.; Bibi, S.; Sarigiannidis, P.G. A Review on UAV-Based Applications for Precision Agriculture. Information 2019, 10, 349. [Google Scholar] [CrossRef]
- Kim, J.; Kim, S.; Ju, C.; Son, H.I. Unmanned Aerial Vehicles in Agriculture: A Review of Perspective of Platform, Control, and Applications. IEEE Access 2019, 7, 105100–105115. [Google Scholar] [CrossRef]
- Borghetti, F.; Caballini, C.; Carboni, A.; Grossato, G.; Maja, R.; Barabino, B. The Use of Drones for Last-Mile Delivery: A Numerical Case Study in Milan, Italy. Sustainability 2022, 14, 1766. [Google Scholar] [CrossRef]
- Zhong, R.Y.; Newman, S.T.; Huang, G.Q. Big data for supply chain management in the service and manufacturing sectors: Challenges, opportunities, and future perspectives. Comput. Ind. Eng. 2016, 101, 572–591. [Google Scholar] [CrossRef]
- Li, X.; Tupayachi, J.; Sharmin, A.; Martinez Ferguson, M. Drone-Aided Delivery Methods, Challenge, and the Future: A Methodological Review. Drones 2023, 7, 191. [Google Scholar] [CrossRef]
- Benarbia, T.; Kyamakya, K. A Literature Review of Drone-Based Package Delivery Logistics Systems and Their Implementation Feasibility. Sustainability 2022, 14, 360. [Google Scholar] [CrossRef]
- Valencia-Arias, A.; Rodríguez-Correa, P.A.; Patiño-Vanegas, J.C.; Benjumea-Arias, M.; De La Cruz-Vargas, J.; Moreno-López, G. Factors Associated with the Adoption of Drones for Product Delivery in the Context of the COVID-19 Pandemic in Medellín, Colombia. Drones 2022, 6, 225. [Google Scholar] [CrossRef]
- Springer, P.J. Military Robots and Drones: A Reference Handbook; Contemporary World Issues; ABC-CLIO: Santa Barbara, CA, USA, 2013; 297p. [Google Scholar]
- Stelmack, K. Weaponized Police Drones and Their Effect on Police Use and Force. J. Technol. Law Policy 2014, 15, 276. [Google Scholar] [CrossRef]
- Marin, L.; Krajčíková, K. Deploying Drones in policing southern European borders: Constraints and challenges for data protection and human rights. In Drones and Unmanned Aerial Systems; Springer: Berlin/Heidelberg, Germany, 2016; pp. 101–127. [Google Scholar]
- Saranya, C.; Pavithira, L.; Premsai, N.; Lavanya, H.; Govindarajan, R. Recent trends of drones in the field of defense. Int. J. Electr. Appl. 2015, 1, 47–55. [Google Scholar]
- Cravero, C.; Marsano, D. Computational Investigation of the Aerodynamics of a Wheel Installed on a Race Car with a Multi-Element Front Wing. Fluids 2022, 7, 182. [Google Scholar] [CrossRef]
- Fernandez-Gamiz, U.; Gomez-Mármol, M.; Chacón-Rebollo, T. Computational Modeling of Gurney Flaps and Microtabs by POD Method. Energies 2018, 11, 2091. [Google Scholar] [CrossRef]
- Magnusson, S.; Pettersson-Hagerfors, P. Drone Deliveries of Medical Goods in Urban Healthcare. Master’s Thesis, Department of Technology Management and Economics Division of Service Management and Logistics, Chalmers University of Technology, Gothenburg, Sweden, 2019. [Google Scholar]
- Amukele, T.K.; Hernandez, J.; Snozek, C.L.; Wyatt, R.G.; Douglas, M.; Amini, R.; Street, J. Drone transport of chemistry and hematology samples over long distances. Am. J. Clin. Pathol. 2017, 148, 427–435. [Google Scholar] [CrossRef] [PubMed]
- Thiels, C.A.; Aho, J.M.; Zietlow, S.P.; Jenkins, D.H. Use of unmanned aerial vehicles for medical product transport. Air Med. J. 2015, 34, 104–108. [Google Scholar] [CrossRef] [PubMed]
- Balasingam, M. Drones in medicine—The rise of the machines. Int. J. Clin. Pract. 2017, 71, e12989. [Google Scholar] [CrossRef]
- Du, L.; Li, X.; Gan, Y.; Leng, K. Optimal Model and Algorithm of Medical Materials Delivery Drone Routing Problem under Major Public Health Emergencies. Sustainability 2022, 14, 4651. [Google Scholar] [CrossRef]
- Scott, J.E.; Scott, C.H. Drone Delivery Models for Healthcare. In Proceedings of the 50th Hawaii International Conference on System Sciences, Hilton Waikoloa Village, HI, USA, 4–7 January 2017; Available online: http://hdl.handle.net/10125/41557 (accessed on 20 January 2025).
- Oxtoby, K. Drone transportation of medical supplies: Case study insights. Hospital Healthcare Europe, 8 November 2024. Available online: https://hospitalhealthcare.com/in-depth/health-technology/drone-transportation-of-medical-supplies-case-study-insights/ (accessed on 21 January 2025).
- Liuliu, S.; Yang, G.; Yao, S. Large eddy simulation of flow past a square cylinder with rounded leading corners: A comparison of 2D and 3D approaches. J. Mech. Sci. Technol. 2018, 32, 2671–2680. [Google Scholar]
- Cravero, C.; Marogna, M.; Marsano, D. A Numerical Study of Correlation between Recirculation Length and Shedding Frequency in Vortex Shedding Phenomena. WSEAS Trans. Fluid Mech. 2021, 16, 48–62. [Google Scholar] [CrossRef]
- UAVLIFE. Research and Development of the Applicability of Autonomous Flying Vehicles in the Fight Against the Pandemic Caused by COVID-19. Available online: https://uavlife.sk/ (accessed on 17 May 2023).
- European Union Aviation Safety Agency. EU Nations Drone Regulator and Regulations. Available online: https://www.easa.europa.eu/en/the-agency/faqs/drones-uas (accessed on 17 May 2023).
- AgEagle Aerial Systems. European Union Drone Regulations Explained. AgEagle, 10 December 2022. Available online: https://ageagle.com/blog/european-union-drone-regulations-explained/ (accessed on 17 May 2023).
- The Ministry of Transport and Construction of The Slovak Republic. Available online: https://www.mindop.sk/en (accessed on 3 April 2018).
- Civil Aviation Authority of Czech Republic. Available online: http://lis.rlp.cz/predpisy/predpisy/dokumenty/L/L-2/data/effective/doplX.pdf (accessed on 17 May 2023).
- Austro Control. Operation of Unmanned Aerial Vehicles-Drones. Available online: https://www.austrocontrol.at/en/aviation_agency/licenses__permissions/flight_permissions/rpas (accessed on 17 May 2023).
- Hungary’s General Directorate for Air Transport (GDAT). Drone Regulator in Hungary. Available online: https://web.archive.org/web/20181105152729/https://www.nkh.gov.hu/en/web/english/ (accessed on 17 May 2023).
- Polish Aviation Centenary. Safe Sky-Regulations on Flying Drones in Poland. Available online: http://dziennikustaw.gov.pl/DU/2013/440/ (accessed on 17 May 2023).
- Tsiamis, N.; Efthymiou, L.; Tsagarakis, K.P. A Comparative Analysis of the Legislation Evolution for Drone Use in OECD Countries. Drones 2019, 3, 75. [Google Scholar] [CrossRef]
- Ostojić, G.; Stankovski, S.; Tejić, B.; Đukić, N.; Tegeltija, S. Design, control and application of Quadcopter. Int. J. Ind. Eng. Manag. 2015, 6, 43–48. [Google Scholar] [CrossRef]
- Allaka, G.; Anasuya, B.D.P.P.S.L.; Yamini, C.; Vaidehi, N.; Ramana, Y.V. Modelling and Analysis of Multicopter Frame and Propeller. Int. J. Res. Eng. Technol. 2013, 2, 481–483. [Google Scholar]
- Bertin, J.; Cummings, R. Aerodynamics for Engineers, 6th ed.; Pearson: London, UK, 2013; ISBN 978-0132832885. [Google Scholar]
- Akdeniz, H.Y. A Study on Aerodynamic Behavior of Subsonic UAVs’ Wing Sections with Flaps. Int. J. Aviat. Sci. Technol. 2021, 2, 22–27. [Google Scholar] [CrossRef]
- Akdeniz, H.Y. Performance Analysis of a Wing Used in Unmanned Systems. In Proceedings of the International Symposium on Electric Aviation and Autonomous Systems—International Symposium Technology, MRO and Operations Proceedings, Kyiv, Ukraine, 20–24 September 2020. [Google Scholar]
- Alam, G.J.; Mamun, M. Characteristics of Aerofoil Shaped Fuselage UAV Model and Compare With the Conventi Using CFD Software. AIP Conf. Proc. 2021, 2324, 040001. [Google Scholar]
- Sobachkin, A.; Dumnov, G. Numerical Basis of CAD-Embedded CFD. In Proceedings of the NAFEMS World Congress 2013, Salzburg, Austria, 9–12 June 2013. [Google Scholar]
- Saponi, M.; Borboni, A.; Adamini, R.; Faglia, R.; Amici, C. Embedded Payload Solutions in UAVs for Medium and Small Package Delivery. Machines 2022, 10, 737. [Google Scholar] [CrossRef]
- Shohan, A.S.; Ahmed, G.A.; Moon, F.A.; Savanur, W.C.S. Conceptual design, Structural and Flow analysis of an UAV wing. IOSR J. Mech. Civ. Eng. 2016, 13, 78–87. [Google Scholar]
- Islam, M.S.; Hasan, M.M.; Al Kamah Tamal, M.M.; Mian, M.J.; Evan, M.T.R. Detail Solidworks Design and Simulation of an Unmanned Air Vehicle. IOSR J. Mech. Civ. Eng. (IOSR-JMCE) 2013, 8, 95–100. [Google Scholar] [CrossRef]
- Theja, B.; Gupta, S. Design and Fluid Flow Analysis of Unmanned Aerial Vehicle (UAV). Int. J. Sci. Technol. 2015, 4, 573–577. [Google Scholar] [CrossRef]
- Stanko, J.; Stec, F.; Palkovic, L.; Rodina, J.; Rau, D. Towards Automatic Inventory Checking Using an Autonomous Unmanned Aerial Vehicle. In Proceedings of the 2022 IEEE 27th International Conference on Emerging Technologies and Factory Automation (ETFA), Stuttgart, Germany, 6–9 September 2022; pp. 1–8. [Google Scholar] [CrossRef]
- Stanko, J.; Stec, F.; Rodina, J. Process Automation of Warehouse Inspection Using an Autonomous Unmanned Aerial Vehicle. MM Sci. J. 2022, 2022, 5656–5663. [Google Scholar] [CrossRef]
- Cigánek, J.; Žemla, F. Complex Mechatronic System for the Motion Control of a Garage Door. In Proceedings of the 2022 Cybernetics & Informatics (K&I), Visegrád, Hungary, 11–14 September 2022; pp. 1–6. [Google Scholar] [CrossRef]
- Rau, D.; Vršanský, T. Sensorless field-oriented control inverter of BLDC motor for copter. J. Electr. Eng. 2023, 74, 210–217. [Google Scholar] [CrossRef]
- Žemla, F.; Cigánek, J.; Rosinová, D.; Kučera, E.; Haffner, O. Complex Positioning System for the Control and Visualization of Photovoltaic Systems. Energies 2023, 16, 4001. [Google Scholar] [CrossRef]
- Mykhailyshyn, R.; Duchoň, F.; Virgala, I.; Sinčák, P.J.; Majewicz Fey, A. Optimization of Outer Diameter Bernoulli Gripper with Cylindrical Nozzle. Machines 2023, 11, 667. [Google Scholar] [CrossRef]
- Psotka, M.; Duchoň, F.; Roman, M.; Michal, T.; Michal, D. Global Path Planning Method Based on a Modification of the Wavefront Algorithm for Ground Mobile Robots. Robotics 2023, 12, 25. [Google Scholar] [CrossRef]


Disclaimer/Publisher’s Note: The statements, opinions and data contained in all publications are solely those of the individual author(s) and contributor(s) and not of MDPI and/or the editor(s). MDPI and/or the editor(s) disclaim responsibility for any injury to people or property resulting from any ideas, methods, instructions or products referred to in the content. |
© 2025 by the authors. Licensee MDPI, Basel, Switzerland. This article is an open access article distributed under the terms and conditions of the Creative Commons Attribution (CC BY) license (https://creativecommons.org/licenses/by/4.0/).
Share and Cite
Vachálek, J.; Habara, M.; Nyeky, D. Design and Basic Aerodynamic Analysis of a Drone-Suspended Transport Container for Safe Biological Sample Transport. Designs 2025, 9, 20. https://doi.org/10.3390/designs9010020
Vachálek J, Habara M, Nyeky D. Design and Basic Aerodynamic Analysis of a Drone-Suspended Transport Container for Safe Biological Sample Transport. Designs. 2025; 9(1):20. https://doi.org/10.3390/designs9010020
Chicago/Turabian StyleVachálek, Ján, Marek Habara, and Daniel Nyeky. 2025. "Design and Basic Aerodynamic Analysis of a Drone-Suspended Transport Container for Safe Biological Sample Transport" Designs 9, no. 1: 20. https://doi.org/10.3390/designs9010020
APA StyleVachálek, J., Habara, M., & Nyeky, D. (2025). Design and Basic Aerodynamic Analysis of a Drone-Suspended Transport Container for Safe Biological Sample Transport. Designs, 9(1), 20. https://doi.org/10.3390/designs9010020