Abstract
This article explores several aspects of the three-dimensional concrete printing (3DCP) industry. More specifically, it begins with a literature review discussing the background of this technology. This literature review also explores several of the challenges that the industry is currently facing. In this way, a knowledge gap is identified. More specifically, there are few studies that have explored the structural and thermal performance of typical walls printed in this industry. Therefore, we used the simulation tool in SolidWorks to examine the structural behavior of several different wall types when pressure was applied to the exterior face. In addition to this, the thermal performance of different wall types was also studied in SolidWorks by applying a temperature difference between the exterior and interior faces of each wall. For example, one wall shape in this study had minimum factor of safety of approximately 100 due when a load was applied, and the same wall lost approximately 212 W due to the temperature difference applied in this study. Finally, SolidWorks was used to calculate the moment of inertia of the cross sections of several of these walls, which helped to provide a better understanding of each wall’s structural rigidity.
1. Introduction
The construction industry is constantly aiming to improve, and as a result, new innovations are constantly being created. One of these innovations introduced in recent years is three-dimensional (3D) concrete printing (3DCP). The 3D concrete printers act in a similar manner to other forms of 3D printers that are commonly used throughout society [1]. Instead of printing plastic, 3D concrete printers extrude concrete from their nozzles, following the designated path of the programmer [1]. More specifically, the programmer inputs the desired path of the nozzle using a computer-aided design (CAD) software, which the machine then translates into a path so as to print the given shape by stacking concrete layers on top of each other [1]. More specifically, companies that utilize 3DCP extrude concrete to create a wall outline and cavities (similar to formwork) [1]. The cavities present in these printed shapes are then filled with concrete and/or insulation [1]. Nevertheless, there are several companies at the forefront of this new technology, each utilizing a different arrangement of concrete and insulation inside the wall.
With 3DCP being such a new technology, there has not been substantial research into the effects of each company’s different wall configurations. Thus, the main objective of this study was to determine the structural and thermal performance of several different wall configurations. An examination of online resources, the literature, and other sources helped us to determine the wall shapes that are used in the industry.
2. Literature Review
2.1. Background of the 3DCP Industry
According to Zhang et al. [2], a certain construction industry issue that has increased in severity in recent years is related to the migration of individuals to urbanized areas [2]. Of the current issues, none are more severe than the inability to find qualified workers, the overuse of construction materials, and even the safety of construction workers [2].
As a result, researchers across the world have developed possible solutions to help the construction industry to overcome these problems. In 1997, Joseph Pegna originally developed the idea of concrete that could quickly be cured [3]. Then, in 2002, Behrokh Khoshnevis developed the idea of extruding concrete layer by layer to create a formwork which can later be filled with cast concrete [2,3]. This process is now known as contour crafting [2,3]. In more detail, Elfatah discussed several advantages that are possible within the 3DCP industry, including the improvement of the construction time, the creation of more elaborate designs, improvement of the accuracy of construction, and even reductions in construction waste [1]. Since these ideas were initially developed by Pegna and Khoshnevis, concrete printing technology has grown significantly. More specifically, universities have begun testing and research using this technology [3]. Additionally, several companies throughout the world have started to use 3D printing technology to construct buildings.
2.2. State of 3DCP Technology
As mentioned above, there are universities and companies currently engaged either in R&D related to 3DCP or in the actual construction of buildings with printed walls [3]. As for the process of 3DCP, initially, the users of the technology must start by mixing their concrete [4] using water, and then they must pump the concrete into the printer’s head [4]. As it stands, there are two main printer types: the robotic arm style and gantry style [1]. In a gantry-style printer, the printer head sits on a metal frame, which has the capability of moving the printer head on all three axes [1]. On the other hand, a robotic-arm-style printer places the printer head at the end of an arm, which is connected to the main podium of the printer [1]. This printer has the ability to extend and contract its arm and rotate in order to print concrete [1]. After the concrete is pumped into the printer’s head, it will flow through the nozzle, which deposits the concrete onto the printing surface [4]. Though this is how a typical gantry-style printer works; other printer types follow a similar process [4]. As previously mentioned, the concrete is extruded onto the desired surface and built up layer by layer to create a formwork in contour crafting [2,4]. However, through the work of researchers, many challenges have already been addressed in an attempt to improve 3DCP. For example, researchers and users of 3DCP have been able to identify several printing characteristics that affect the effectiveness of the extruded concrete.
First, pumpability is a characteristic that has been extensively studied in 3DCP [5]. Verian et al. defined pumpability as “the ease and reliability with which material is moved through the delivery system” [5]. Additionally, printability is another characteristic that affects the quality of printed concrete [5]. This term refers to the ease with which concrete flows out of the nozzle of the printer [5]. Buildability is another key characteristic of printed concrete, which is defined as the printed concrete’s “resistance to deformation under load when it is not fully cured” [5]. Clearly, this is an essential characteristic of printed concrete, as extruded concrete is not fully set by the time additional layers are extruded on top of the previously printed layers [5]. In summary, researchers have highlighted these characteristics, which are important for construction quality using this technology [5].
Additionally, bonding between subsequently printed layers has been a point of emphasis for researchers. For example, Verian et al. [5] stated that they developed a means to reduce cold joint forming between subsequent layers, regardless of the time between the printing of subsequent layers [5]. To increase the bond between layers, Verian et al. [5] suggested applying a primer to the previously printed layer directly before the next concrete layer is printed, which, accordingly, increases the bonding between layers. Developments such as these are key to the advancement of this technology and allow the material to behave even more effectively. In fact, Buswell et al. [6] outlined some key developments, such as achieving a density as strong or even higher compared to that of cast concrete.
The 3DCP industry also faces the challenge of improving the durability of printed shapes [6]. For example, Buswell et al. stated that cracking can propagate through printed structures due to shrinkage [6]. In other words, after concrete is extruded from the printer’s nozzle, it hardens and shrinks, which leads to cracking in the structure [6]. Buswell et al. also stated that this is due to the elimination of forms during the curing phase of the concrete [6]. As a result, the printed concrete is exposed to its surroundings while curing [6]. Although the removal of concrete forms is beneficial for the construction industry, shrinkage and durability concerns must be addressed.
Additionally, researchers have examined the effect of incorporating insulation into these concrete printed structures [7]. Dey et al., in particular, completed an experiment showing the effect of including insulation in 3DCP structures [7]. In this experiment, printed concrete slabs were heated from one side, and then the thermal inertia of the slab was measured with and without insulation [7]. In conclusion, it was found that the presence of insulation increased the thermal inertia of the slab, meaning that the temperature difference between the exterior and interior surfaces was higher when insulation was present versus when no insulation was present [7]. Pessoa et al. introduced several hypotheses, such as that of placing insulation inside cavities to further enhance the thermal performance of these walls and, at the same time, limit thermal bridging [8].
As previously mentioned, the 3DCP industry is attempting to improve sustainability in construction and reduce material waste, which currently plagues this industry [2]. Reducing construction waste is especially important for the 3DCP industry, as concrete and brick are the two materials that contribute most to construction waste [9]. In this regard, a study conducted by Wu et al. discussed the use of construction waste as a replacement for cement [9]. Aligning with the overarching goals of the 3DCP industry, this new type of mixture has the potential to be used in the 3DCP industry [9]. During the study conducted by Wu et al., it was found that ground brick and concrete waste are viable replacements for part of the cement and sand that is typically used in a concrete mixture [9]. More specifically, Wu et al. concluded that it is best to use ground concrete and brick waste to replace 10% of the concrete’s cement and 10% of the concrete’s sand [9]. Innovations such as these are increasingly being studied in the construction industry as a whole and have potential to be used in the 3DCP industry and to further one of its overarching goals (sustainability).
2.3. Knowledge Gap in the 3DCP Industry
Despite all of this development, there are still many unknowns in the concrete printing industry. As previously mentioned, there are several companies currently using the concrete printing techniques discussed above, and many of these companies utilize different wall shapes. However, it remains unknown how the shapes of the walls change their structural and thermal behaviors when filled with cast concrete and insulation. More specifically, many studies have been conducted throughout this industry in regard to the consistency, strength, and other parameters of concrete that is used for 3DCP. However, very little research has been conducted on the effect that each unique shape has on the wall’s structural and thermal behaviors. As a result, the goal of this study is to determine the structural and thermal behaviors of different walls according to the shapes that they take. In this way, the wall shapes can be compared and contrasted.
3. Study Setup in SolidWorks
3.1. Structural Study Setup in SolidWorks
In order to determine the structural and thermal behaviors of each wall, SolidWorks’ simulation tool, which uses finite element analysis, was used to analyze models based on the applied conditions [10]. The printing process starts with the printing of the formwork using a specific type of 3D printer, which is usually either the gantry frame type or a robotic arm system [1]. Once the formwork has been printed, the appropriate cavities are filled with concrete or insulation [1]. To model these walls in SolidWorks, each wall’s formwork and cavities were initially sketched and modeled in SolidWorks. The overall shape of each wall was determined and created based on online images provided by different companies, the literature, and other resources. As the exact dimensions of each company’s wall were unavailable, each wall was sketched using an estimation of certain dimensions based on these photos. It should be noted that the exterior and interior faces of every wall were connected via a continuous piece of concrete to close the sides of each wall. This allowed us to remain consistent for every wall modeled and to see how the overall shape of each wall affected its behavior. Additionally, there were several constants maintained for each wall so as to compare and contrast the walls more accurately. For example, each wall was taken to have an overall length of 1.8034 m (71 in.), an overall height of 2.438 m (96 in.), and a depth of 0.3048 m (12 in.). Additionally, each layer of concrete was taken to have a thickness of 0.0381 m (1.5 in.). Furthermore, each edge of the wall was filleted to avoid local “singularities”, which are defined in SolidWorks as unbounded stress values caused by sharp edges that occur during finite element analysis (but do not appear in the real world) [11,12]. To verify that there are no local singularities in each wall, SolidWorks’ built-in hotspot detection function can be used (using its default settings). This function runs throughout the entire model to ensure that there are no singularities present throughout the model during the structural study of each wall [13].
Once the concrete portions of each wall had been modeled, the material properties were assigned to each model to accurately represent the behavior of a concrete wall. For this purpose, the properties of concrete were researched, and then these properties were assigned to a new material created in SolidWorks. First, a compressive strength of 27,579,000 Pa (4000 psi) for the concrete was found in the software database [14]. It should be noted that this value is towards the upper limit of the range defined by the companies in the industry for the compressive strength of their printed materials (between 2000 psi to 3500 psi) [15]. Then, the elastic modulus was found, according to Section 19.2.2 of the ACI 318 Code (http://aghababaie.usc.ac.ir/files/1506505203365.pdf and https://mattia.ir/wp-content/uploads/2020/10/ACI-318R-19.pdf; accessed on 28 December 2022), using the equation 57,000 × (compressive strength in psi)1/2, which yielded a value of approximately 25,000,000,000 Pa (about 3,600,000 psi) [16]. Additionally, Poisson’s ratio was taken to be 0.2 [14]. Then, the shear modulus was found using the equation elastic modulus/(2 × (1 + Poisson’s ratio)), which yielded a value of 10,420,000,000 Pa (1,511,293 psi). Additionally, the density and the tensile strength were found to be 2402.77 kg/m3 (150 lb/ft3) and 3,447,000 Pa (500 psi), respectively [14]. Finally, the thermal conductivity and the specific heat were found to be 3 W/m·K (1.734 BTU/h·ft·°F) [17] and 750 J/kg·K (0.179 BTU/lb·°F), respectively [14]. As for the failure criterion, Mohr–Coulomb stress was used, since this is more accurate for brittle materials (such as concrete) [18]. All of these values were assigned to a material that we defined and called “concrete” in the SolidWorks software (which can be found in Figure 1), and we then assigned the properties of this “concrete” to the concrete that was previously defined and modeled (as discussed above). In this study, concrete was defined as a linear elastic material. Though, in tension, this is true until failure, in compression, concrete is linear and elastic up to the point where it nonlinearly reaches its ultimate compressive strength [19]. It was noted that the stress–strain curve of concrete is linear elastic up to approximately half of its compressive strength [20]. Therefore, for this study, the linear-elastic portion of concrete’s stress–strain curve was used to evaluate the stiffness of different walls while still uncracked. Thus, the compressive strength was taken to be 2000 psi, and the tensile strength was taken to be 500 psi, which were considered as the failure points for this study. This showed the stiffness of uncracked sections and displayed the weak points in each wall, as well as the overall behavior of each wall before cracking occurred.
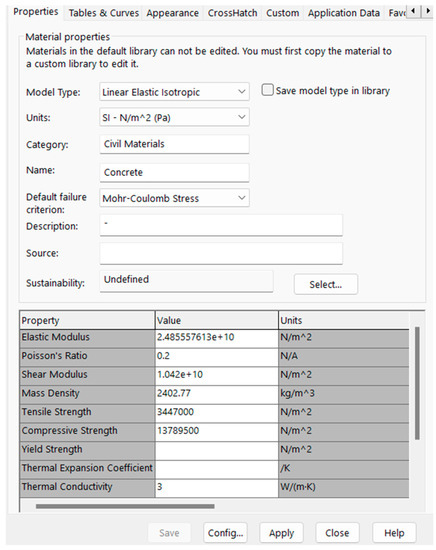
Figure 1.
Creation of Concrete Material Properties.
Once the “concrete” material had been created and assigned to the model, the structural study (also called simulation in SolidWorks) could be set up. The first step in this process was to create fixities in the model. For this study, it was determined that the top and bottom faces (sections) of the wall would be fixed (could not move in any direction). These fixities could produce results most similar to the real world, because the bottom of the wall was connected to the footing embedded in the ground (thus being unable to move in any direction), and the top of the wall was connected to the concrete slab of the roof (e.g., for a single-story building), which was also assumed to be unable to move in any direction. Though this top portion may be able to move slightly in a building, it is more conservative to assume that it cannot move in any direction, as it results in larger wall end moments due to such fixity. For this reason, both the top and bottom of the wall were assumed to be fixed. Next, a pressure of 717.25 Pa (14.98 lb/ft2) was applied to the exterior surface of the wall in the direction towards the interior of the wall. The value of this pressure was calculated using the wind pressure equation from ASCE 7-16, assuming a wind speed of 90 mph, C exposure category, and II risk category [21]. This calculation can be found in Table 1. It should also be noted that each abbreviation in Table 1 represents a specific parameter: Kz is the coefficient based on velocity and pressure at height z of the structure, Kzt is the topographic factor of the region, Kd is the factor based on the direction of the wind, Ke is the factor based on the ground’s elevation, V is the wind velocity used for the study, and qh is the calculated pressure of the wind perpendicular to the wall. These parameters were chosen for the walls due to their use in the real-world applications of companies using this technology to print the walls of one-story homes using these wall shapes [22]. After the results were recorded using this pressure, a separate pressure of 717.25 Pa (14.98 lb/ft2) was applied in place of the previous pressure to the exterior surface of the wall in the direction away from the interior of the wall.

Table 1.
Calculation of Pressure Using ASCE 7-16.
As mentioned above, the main goal of this study was to determine the flexural ability of different walls based on their shapes. In order to do this, a pressure was applied to the exterior face of each wall, as discussed and calculated above. However, it is recognized that there are other factors that determine whether or not a wall will fail. For example, factors such as extreme wind loads in hurricanes, earthquake loads, and support settlement (due to low soil-bearing capacity) could be limiting factors for the safety of a wall. Though these considerations are recognized for the actual design of buildings, the main goal of this study was not to analyze these behaviors. Instead, a study of the behavior of each wall, with the same applied wind pressure inducing tensile and compressive stresses in the wall models based on the wall’s shape alone, was the main objective. Then, since this was a comparative study, the results for each wall were compared and contrasted to those of the other walls studied. In this way, weak points in specific walls (due to their shape), relative to other walls, could be identified.
Following the applied loads, the object was meshed in SolidWorks, allowing us to perform finite element analysis. In general, the default mesh options were used in SolidWorks to create the mesh. However, certain characteristics were checked to ensure that the mesh was of high quality. This means that the tetrahedron that comprises the mesh of the model possess nodes at the corners of the tetrahedron and the midpoints of the lines connecting the corners of the tetrahedron [23]. This high-quality mesh allows for more accurate results during the analysis part of the study [23]. Additionally, after the mesh was created, the aspect ratio of the mesh was checked. To ensure a mesh of a high quality, 90% of the elements or more had to possess an aspect ratio of less than 3 based on the longest and shortest connecting nodes on each tetrahedron comprising the mesh [23]. As a result, a smaller aspect ratio results in a better mesh because each tetrahedral is more uniformly shaped [23]. If the mesh generated with the default mesh settings in SolidWorks creates a mesh with less than 90% of the elements having an aspect ratio of less than 3, a denser (also referred to as a finer) mesh will be created until more than 90% of the elements have an aspect ratio of less than 3. This essentially means that the tetrahedron comprising the mesh will be smaller in size, resulting in more tetrahedrons comprising the mesh.
Finally, the process includes the performance of strength analysis using the Mohr–Coulomb failure criterion, which provides more accurate results for brittle materials such as concrete [18] and allows for a factor of safety plot to be generated for the model for several scenarios [18]:
Additionally, SolidWorks helps to define the principal stresses [24], where portions of a structure can be broken down into smaller cubes, each experiencing normal and shear stresses [24]. To calculate the maximum normal stresses these cubes experience, SolidWorks rotates these cubes so that the shear stresses are negligible [24]. At this point, the only stresses that remain on the rotated portion are the normal stresses [24]. In general, each face of the cube has a corresponding face on the opposite end of the cube with the same stress [24]. As a result, there are a total of three different stresses acting on the faces of this rotated cube, the largest called the first principal stress, the second-largest stress called the second principal stress, and the smallest called the third principal stress [24], as shown in the visualization in Figure 2.
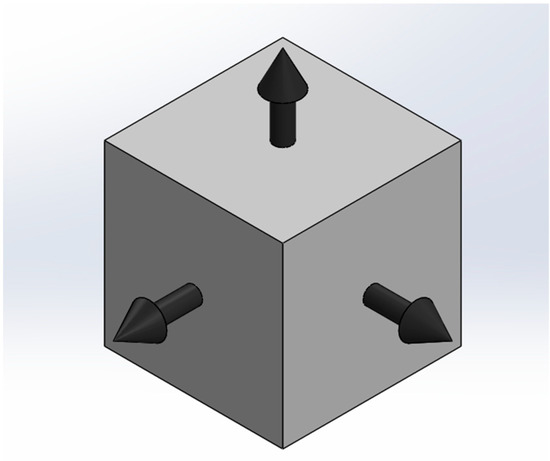
Figure 2.
Three Principal Stresses on a Cube Element.
Essentially, the factor of safety values show how close each portion of the model is to failure, where the lower the factor of safety is, the closer that portion of the model is to failure. To accurately display the strength of the most vulnerable portion of each wall, the middle portion of each wall (also known as the midplane) must be the focus of the stress evaluation. Initially, several results, due to each load case, will be shown and discussed, including an overall plot of the factor of safety for each side of each wall. Then, a plot for three points along the midplane of the wall will be shown: a plot for the exterior of the wall, a plot for the interior of the wall, and a plot for the portion of the exterior concrete meeting the insulation of the wall. Together, these data will help to determine the flexural ability of each wall and where potential failure points could occur in each wall.
Additionally, with 3D concrete printing being such a new technology, certain assumptions must be made due to a lack of information available. For example, some companies use rebar in cavities of the printed shell parts of their walls and surround this rebar with cast concrete [25]. However, to remain consistent across walls made by different companies, no rebar was modeled in this study, because some companies use different spacings and other companies do not use rebar at all [26]. It should be noted that the effect of rebar prior to cracking is negligible, and since this analysis considers uncracked sections, neglect of the rebars for such modeling is reasonable. This enables the overall goal of this study to be met, i.e., showing the effect that the shape of the wall has on the uncracked strength of the wall.
Additionally, when beginning to print, companies print their overall framework (as a mold) and leave the cavities open (to be filled later) [1]. Then, once the framework has been created, companies fill in several of the cavities inside the wall with concrete and/or insulation [1]. For this study, the concrete that is later poured into cavities and the existing extruded concrete from the nozzle (acting as formwork) are assumed to act as one monolithic concrete component. Furthermore, insulation is ignored in the structural analysis part of the study. More specifically, the insulation cavity (where insulation is placed in the wall) is kept as an open void, since insulation provides little to no structural stiffness or, thus, resistance. Additionally, each wall studied is assumed to possess the same amount of material strength, so that the only variable between walls is their shape. Finally, since the main goal of this study is to determine the effect that the shape of the wall, alone, has on the structural performance, the quality of bonding between subsequent layers of extruded concrete placed on top of each other is not considered in this study, meaning the assumption is that there are no cold joints or gaps between layers. Additionally, it was assumed in this study that the cast concrete core of each wall does not separate (i.e., de-bond) from the printed formwork under any of the loading conditions considered.
Finally, a total of five different wall configurations were analyzed in this study. The overall shape of each wall was based on the shapes found in the industry through the research conducted (especially from [22,25,26,27,28,29,30]). In all, the five walls consisted of a symmetric two-cavity wall (as seen in Figure 3), an internal small-arched two-cavity wall (as seen in Figure 4), a zigzag cavity wall (as seen in Figure 5), a trapezoidal cavity wall (as seen in Figure 6), and an internal large-arched multicavity wall (as seen in Figure 7).
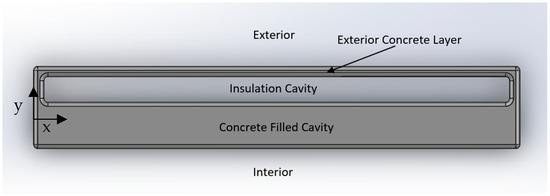
Figure 3.
Symmetric Two-Cavity Wall Printed Formwork Filled with Concrete, Labeled. Modeled in reference to [26].
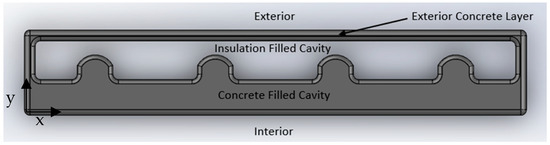
Figure 4.
Internal Small-Arched Two-Cavity Wall Printed Formwork Filled with Concrete, Labeled. Modeled in reference to [25].
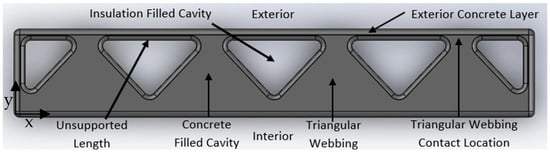
Figure 5.
Zigzag Cavity Wall Printed Formwork Filled with Concrete, Labeled. Modeled in reference to [27,28].
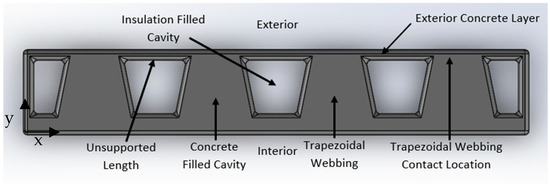
Figure 6.
Trapezoidal Cavity Wall Printed Formwork Model with Fillets and Labels. Modeled in reference to [29].
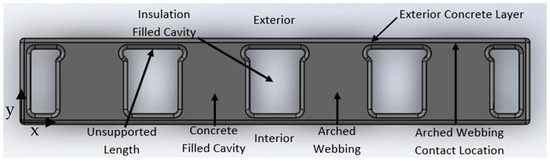
Figure 7.
Internal Large-Arched Multicavity Wall Printed Formwork Model with Concrete Labeled. Modeled in reference to [22,30].
3.2. Thermal Study Setup in SolidWorks
At this point, the structural wall model (the part of the wall made of concrete) from the structural study still had an empty cavity present where the insulation was set to be placed. As a result, the insulation was modeled to fit within the remaining cavities for each wall. For the modeling of the insulation, the sketch dimensions were based on the remaining open cavities for each wall. Again, the height of the insulation was taken to be 8 ft so as to extend from the bottom to the top of each wall. Once the insulation had been modeled, an assembly was created to fit the insulation into the remaining empty cavity of the wall. Once completed, the concrete and insulation for this study were both modeled.
Next, the properties of the insulation material (rigid polyurethane foam) were determined. Since insulation was not used for the structural study, only the density and the thermal properties of the insulation were defined. The density, thermal conductivity, and specific heat were defined based on the literature [31], being 30 kg/m3, 0.025 W/m·K, and 1500 J/kg·K, respectively. These properties were then assigned to an insulation material that we created and gave the name “insulation” in SolidWorks, which can be seen in Figure 8.
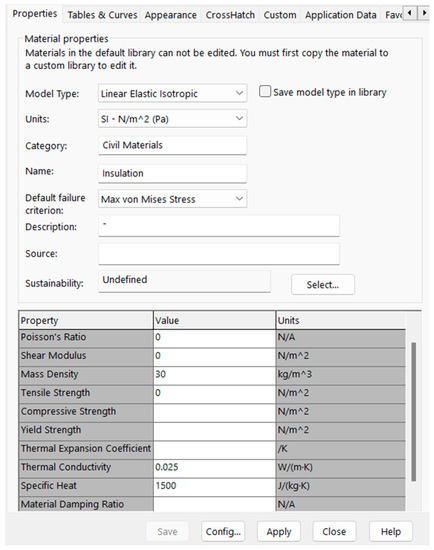
Figure 8.
Creation of Insulation Material Properties.
To set up the thermal study, several components needed to be defined. First, the component interactions between members of the assembly (e.g., the insulation and concrete) needed to be defined as either bonded or insulated. Insulated component interaction stops the flow of heat from one component to another (where they are in contact) [32]. However, for this study, this is not desirable, because the insulation has its own insulating behavior that serves to stop the flow of heat (and this does not increase on the contact surface). On the other hand, bonded contact interaction allows the concrete and insulation to act as one component with different thermal properties [32]. For this study, this is preferable, as it allows the flow of heat through the wall to be carried out as it would be in the real world. It should also be noted that the fillet for the edge where the insulation cavity meets the concrete at the top and bottom of each wall must be removed. The removal of this fillet aims to ensure that the insulation and concrete remain in full contact for the entire time during the thermal study, which would not be possible if these edges were filleted.
Once the component interaction has been defined, the difference in temperature between the exterior and interior wall surfaces can be generated. To determine the thermal performance of each wall, a warm temperature was applied to the interior side of the wall and a cold temperature was applied to the exterior side of the wall. More specifically, a temperature of 295 K (approximately room temperature) was applied to the interior side of the wall to replicate an inside wall exposed to indoor temperatures. On the other hand, the exterior side of the wall was subjected to a convection thermal load. It was subjected to a heat transfer coefficient of 5 W/m2·K (approximately that of standing air) and a bulk ambient temperature of 273.15 K to replicate a wall on the outside of a house that is exposed to cold air [33]. Finally, all of the meshing techniques and checks previously used for the structural study were also replicated for this study.
Proceeding with this approach, several thermal results were obtained to display the thermal performance of each wall. More specifically, an overall plot of the temperatures for each portion of the wall is shown to display the locations where more or less thermal energy is transferred from the interior to the exterior. Additionally, the amount of heat power lost on the exterior surface of the wall is also demonstrated. This shows the amount of heat that each wall loses due to the change in temperature [34].
4. Solid Concrete Wall Structural Study
As an example, the behavior of a solid concrete wall with the same conditions as those used for the other walls in this study was modeled in SolidWorks. More specifically, the top and bottom faces of the wall were taken to be fixed, and a pressure of 717.25 Pa was applied to the wall. Then, the result of this study was compared to a hand calculation of the factor of safety value (using the Mohr–Coulomb failure criterion) of this same wall. The SolidWorks result can be seen in Figure 9. In this figure, the central portion of the back face of the wall is in tension, which can be seen with yellow shading. Upon closer examination, the factor of safety value for this portion of the wall was 304.8. The loading conditions and shear and moment diagrams for this wall can be seen in Figure 10. To complete the hand calculation, the top and bottom faces of the wall were fixed (as they were in SolidWorks). Then, equilibrium conditions were applied to determine the respective moment and force values of the wall. Following this, the shear and moment diagrams were drawn. The principal stress at the center of the wall was then calculated using the flexural formula. This principal stress value was then divided by the tensile limit (as performed in SolidWorks) to determine the factor of safety value for the central portion of the back face of the wall. The value for this portion of the wall resulted in a factor of safety of 300. Thus, the two values are comparable.
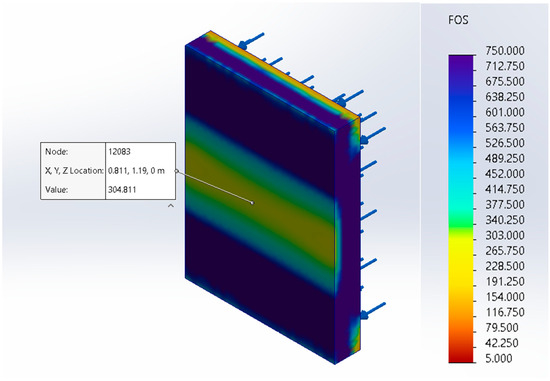
Figure 9.
Factor of Safety Plot of a Solid Concrete Wall.
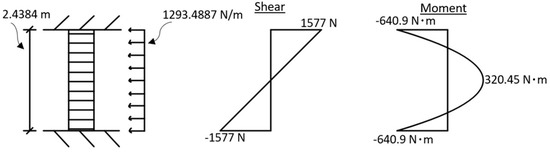
Figure 10.
Loading and Moment and Shear Diagrams for Wind Loading Conditions.
At the midpoint:
Stress calculation at the midpoint of the wall:
Factor of safety calculation at the midpoint of the wall:
Additionally, to display the effect that a seismic load could have on different portions of a wall in a structure, the seismic loading conditions were determined and converted to a distributed load for a 100 ft by 25 ft structure with 1 ft thick concrete walls and a flat concrete slab above these 8 ft walls. The seismic loadings for two locations were determined (New York, NY, USA and San Francisco, CA, USA) using the equivalent lateral force method in ASCE 7-16 for a building in risk category II and soil class C. First, the seismic coefficients for each were found using the ASCE 7 Hazard Tool Online, as can be seen in Table 2. Then, the appropriate coefficients were found to determine the amount of seismic loading present according to ASCE 7-16. It should be noted that the abbreviations in Table 2 stand for different parameters: SMS is the spectral response acceleration for short periods, SM1 is the spectral response acceleration for 1 s periods and a damping of 5%, SDS is the spectral response acceleration for the short periods used for design, SD1 is the spectral response acceleration at 1 s used for design, TL is the transition period for long periods, and SDC is the Seismic Design Category of a building in this location. First, the seismic loading for New York was determined. In this way, the equivalent lateral force was determined to be 24.375 K. This force was then converted to a distributed load along a 1.8034 m wide section of the wall (as seen in this study). Ultimately, this distributed seismic load resulted in a factor of safety value of 36.9 for the interior center of the wall. The calculations for this step can be found below, and a drawing of the loading and a shear and moment diagram can be found in Figure 11.
Table 2.
Seismic Coefficients for New York City, New York [35].
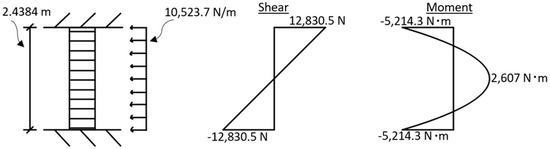
Figure 11.
Loading and Moment and Shear Diagrams for Conditions in New York City, New York.
For concrete structures from ASCE 7-16 [21]:
R = 5
Ie = 1.0
Weight of structure:
Loading calculation [21]:
Converting the load to newtons:
Converting the loading to a distributed load for a 1.8034-meter-wide section of the wall:
At the midpoint:
Stress calculation at the midpoint of the wall:
Factor of safety calculation at the midpoint of the wall:
Once completed, the same process was repeated to determine the loading for San Francisco, California. The seismic coefficients can be found in Table 3. In this case, the equivalent lateral load was found to be 117 K. This was then converted to a distributed load along a 1.8034 m wide section of the wall. Ultimately, this resulted in a factor of safety value of 7.7. The calculations for this loading and factor of safety determination can be found below. Additionally, Figure 12 shows the drawing of the loading and the shear and moment diagrams.
Table 3.
Seismic Coefficients for San Francisco, California [35].
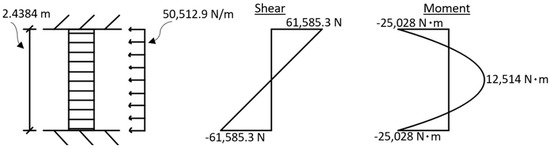
Figure 12.
Loading and Moment and Shear Diagrams for Conditions in San Francisco, California.
Loading calculation [21]:
Converting the load to newtons:
Converting the loading to a distributed load for a 1.8034-meter-wide section of the wall:
At the midpoint:
Stress calculation at the midpoint of the wall:
Factor of safety calculation at the midpoint of the wall:
Though the value for seismic loading produces lower factor of safety values, the loading used in this study was 717.25 Pa (14.98 psf) (from the wind loading). The overall goal of this study was to compare and contrast different walls based on their shape. As a result, the application of any pressure (such as 717.25 Pa) would still enable us to accomplish this goal. More specifically, a 717.25 Pa (14.98 psf) applied pressure would still produce factor of safety values relative to the other walls and highlight where potential weak points in each wall type could develop. As a result, the comparative study could be carried out using this pressure.
5. Zigzag Cavity Wall
5.1. Zigzag Cavity Wall Structural Study
5.1.1. Pressure Applied on the Exterior Face towards the Interior
The zigzag cavity wall was the third wall to be modeled and studied [27,28]. Here, there is a printed zigzag portion running through the middle of the wall, which creates cavities throughout for insulation and concrete. The sketch used in this study for a zigzag cavity wall can be found in Figure 13, together with its dimensions.
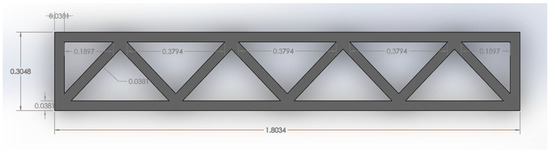
Figure 13.
Zigzag Cavity Wall Printed Formwork Model. Modeled in reference to [27,28].
After the creation of the formwork in SolidWorks, all of the sharp edges present in the wall were filleted. A 0.015 m fillet was used to reduce these sharp edges and prevent the formation of local singularities during the study. Additionally, the wall was extruded to a height of 2.438 m (8 ft), which was the same as that of the other walls studied.
Once the formwork was modeled, the cavities could be filled with concrete. It is not entirely clear which cavities companies fill with concrete and insulation. Thus, to remain consistent with other walls, the cavities closer to the interior of the wall were filled with concrete in this study, and the exterior cavities were filled with insulation. Once the filled concrete cavity was modeled in SolidWorks (as seen in Figure 14 and Figure 15), the concrete material properties were applied to the modeled portions of the wall. At this point, the structural study was set up.
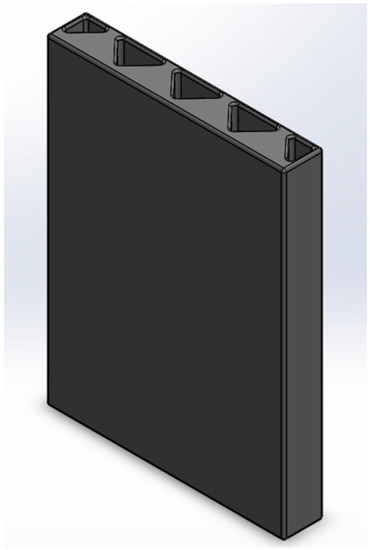
Figure 14.
Zigzag Cavity Wall Printed Formwork with Interior Cavity Filled with Concrete.
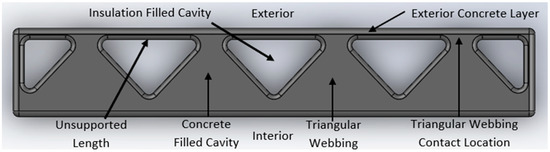
Figure 15.
Zigzag Cavity Wall Printed Formwork Filled with Concrete, Labeled.
Again, the top and bottom of the wall were fixed, meaning it could not move in any direction. Next, 717.25 Pa (14.98 psf) of pressure was applied to the exterior face of the wall in the direction towards the interior of the wall. Subsequently, the meshing of the wall was completed and checked in SolidWorks. More specifically, it was ensured that the aspect ratios of at least 90% of the elements were less than 3. Additionally, the mesh was checked for hotspots using the built-in tool in SolidWorks. The meshing met both of these criteria; thus, the factor of safety results were then checked and gathered for the wall.
The first set of information gathered was related to the isometric factor of safety plot of the entire wall. As seen in Figure 16, the wall possesses several locations that have lower factor of safety values. More specifically, the isometric view on the left of Figure 16 shows that the wall acts in a manner similar to a vertically oriented fixed–fixed wall. In more detail, since there is significant webbing connecting the interior and exterior faces of the wall, the wall appears to behave more like a solid fixed–fixed wall, that is, a wall fixed on the top and bottom. More specifically, if a pressure is applied to its face (as for this wall), and it is fixed at its top and bottom faces, then tension will be present next to its supports and in the middle of its back face. In the case of this wall, there are lower factor of safety values for the center of the interior face of the wall. The wall also has low factor of safety values at the top and bottom of its exterior face. As previously discussed, these lower factor of safety values indicate that these portions of the wall are in tension, since the tensile limit of concrete is much lower than the compressive limit of concrete. For a better understanding, Figure 17 displays two images of the deflected shape of this wall from the perspectives of the side and midplane.
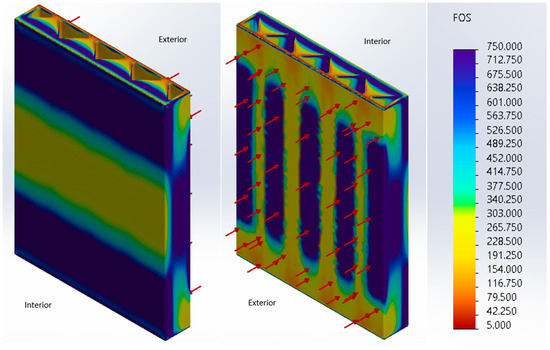
Figure 16.
Zigzag Cavity Wall Structural Study Isometric Results After Applying Pressure to the Interior.
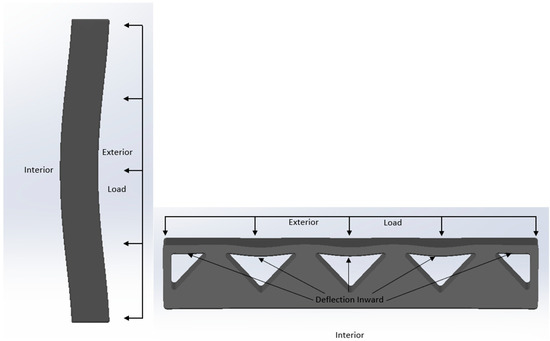
Figure 17.
Zigzag Cavity Wall’s Side and Midplane (Not to Scale).
In addition, it is clear from this isometric view that the concrete-filled triangular webbing connecting the interior and exterior faces transfers stress from the exterior to the interior of the wall. This is clear from the yellow color present at the tips of the triangles that slowly transitions to a blue color. This is a key characteristic of this wall, as the previous two walls did not contain webbing in the middle of the wall that allowed stress to be transferred from its exterior to interior faces.
Figure 18 displays the results of the study for the exterior concrete layer of the zigzag cavity wall. From these results, we can see that there are five unsupported lengths (where the insulation cavity meets the exterior concrete layer) that also act in a similar manner to fixed–fixed walls, one of which is labeled “unsupported length” in Figure 15. More specifically, each time the triangular webbing makes contact with the exterior face, it provides rigidity and support to the wall at this location. This triangular webbing contact location is displayed in Figure 15. Thus, the unsupported lengths of the exterior concrete layer that span between these contact locations act in a similar way to a fixed–fixed wall. The results in Figure 18 show this behavior. More specifically, the triangular webbing contact locations experience tension (and, thus, lower factors of safety) on the exterior face. This behavior can be seen in the left picture in Figure 18. On the interior side, the unsupported lengths experience tension at their center. This behavior can be seen in the middle picture in Figure 18. As previously discussed, this behavior is consistent with a fixed–fixed wall.
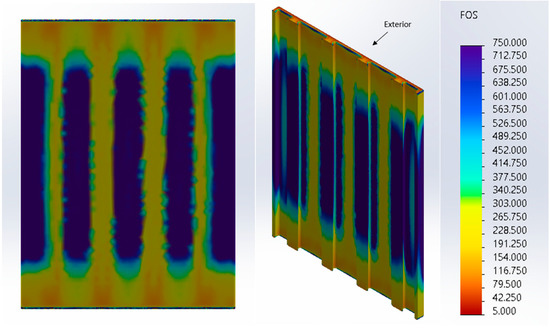
Figure 18.
Zigzag Cavity Wall Exterior Concrete Layer Results After Applying Pressure to the Interior. Left: Exterior Side of Exterior Concrete Layer; Middle: Interior Side of Exterior Concrete Layer; Right: Color Scale of Results.
The following graphs in the figures below graphically display the factor of safety values for several locations on the midplane of each wall. The first of these graphs in Figure 19 shows the factor of safety values along the exterior edge of the zigzag cavity wall. This graph shows that there are relatively low factor of safety values (around 200) at the triangular webbing contact locations, which indicates that tension is present. On the other hand, this graph displays high factor of safety values at the unsupported portions of the wall (around 750). This indicates that this portion of the wall is in compression.

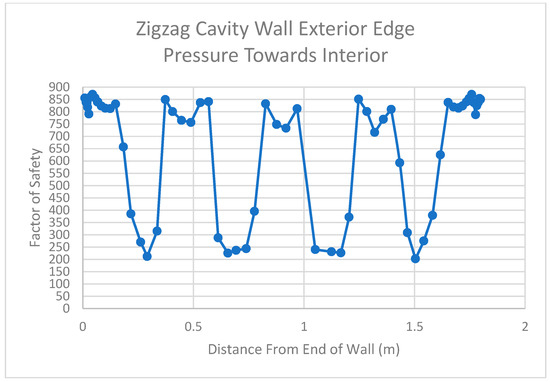
Figure 19.
Results for Exterior Edge of Zigzag Cavity Wall After Applying Pressure to the Interior.
The graph displayed in Figure 20 shows the factor of safety values for the zigzag wall where the insulation cavity meets the exterior concrete layer. In this case, there are lower factor of safety values at the center of each unsupported length. For this reason, there are five drops in the factor of safety plot that reach a value as low as approximately 200.
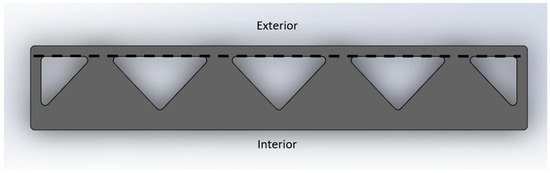
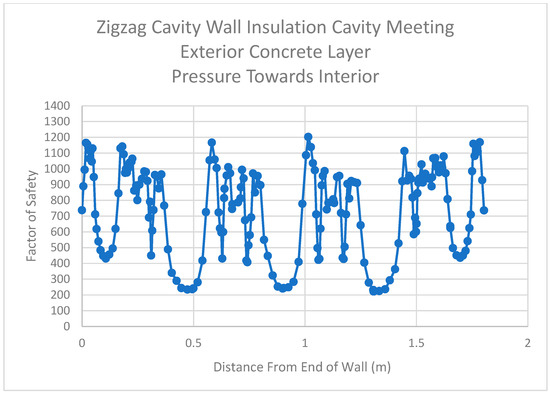
Figure 20.
Results for Insulation Cavity Meeting the Exterior Concrete Layer of the Zigzag Cavity Wall After Applying Pressure to the Interior.
The factor of safety graph in Figure 21 shows the values for the interior side of the wall. The values all remain in a relatively small range (between 250 and 270). This is due to the fact that the interior side of the wall in the midplane is in tension, because it acts in a similar way to a vertically oriented fixed–fixed wall, as previously discussed. Nevertheless, there still appears to be a drop in the factor of safety (larger tension stress) where there is a continuous connection between the exterior and interior faces of the wall, thus showing that there is a transfer of stress due to the triangular webbing that connects these two faces.
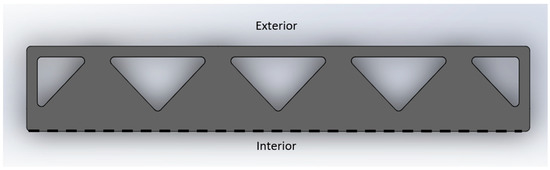
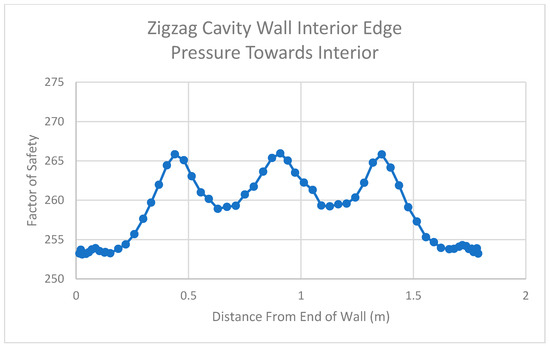
Figure 21.
Results for Interior Edge of Zigzag Cavity Wall After Applying Pressure to the Interior.
5.1.2. Pressure Applied on the Exterior Face away from the Interior
Next, the study was repeated for a pressure acting on the exterior face but away from the interior of the wall. This study resulted in factor of safety values similar to those obtained when pressure was applied to the interior of the wall. However, the interior and exterior faces of the wall exhibited behaviors different from before. When pressure was applied to the interior of the wall, the interior face of the wall experienced tension at its center. However, as pressure was applied in the opposite direction at this point, the interior face of the wall then experienced compression at its center. Similarly, the exterior face of the wall experienced tension at its center, whereas when the pressure was flipped, it experienced compression at its center. Thus, when the pressure’s direction is flipped, the tension and compression regions in the wall are also flipped. The isometric view of the factor of safety plot for this scenario can be seen in Figure 22. In addition to Figure 22, Figure 23 displays the deflected shape of this wall in its side profile and midplane.
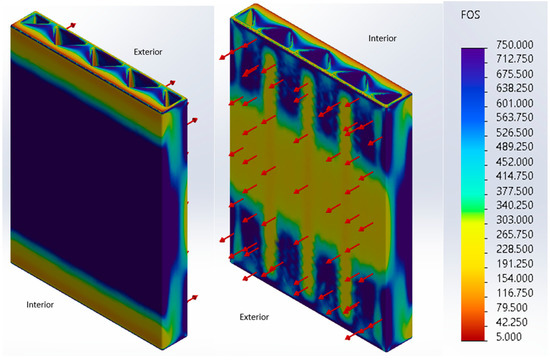
Figure 22.
Zigzag Cavity Wall Structural Study Isometric Results for Pressure Applied Away from the Interior.
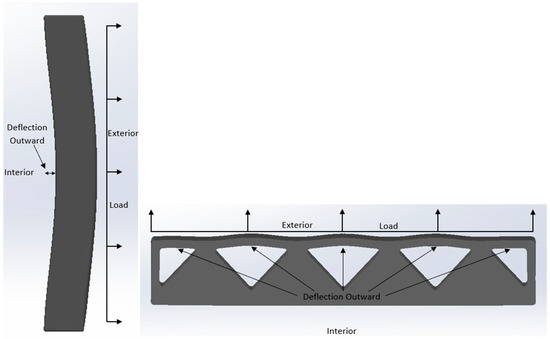
Figure 23.
Deflected Shape of Zigzag Cavity Wall’s Side and Midplane (Not to Scale).
As mentioned in the previous paragraph, flipping the pressure’s direction also flips the tension and compression regions in the wall. This is no different for the exterior concrete layer, as can be seen in Figure 24. In this case, the unsupported lengths now experience tension on the exterior face of the exterior concrete layer. On the other hand, the triangular webbing contact locations now experience tension on the interior face of the exterior concrete layer. This is consonant with the previous statement that flipping the direction of the pressure will put regions previously in tension into compression.
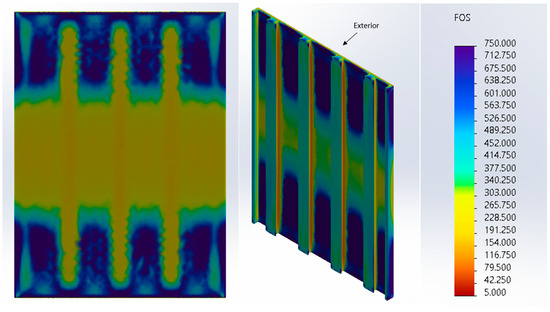
Figure 24.
Zigzag Cavity Wall Exterior Concrete Layer Results for Pressure Applied Away from the Interior. Left: Exterior Side of Exterior Concrete Layer; Middle: Interior Side of Exterior Concrete Layer; Right: Color Scale of Results.
Next, the factor of safety graphs were generated to display the midplane behavior of the wall. First, the exterior edge of the wall is shown in Figure 25. This graph clearly shows that the unsupported lengths of the wall possess lower factor of safety values and are thus in tension. On the other hand, the triangular webbing contact locations possess higher factor of safety values, indicating that the wall is further from failure at this point.
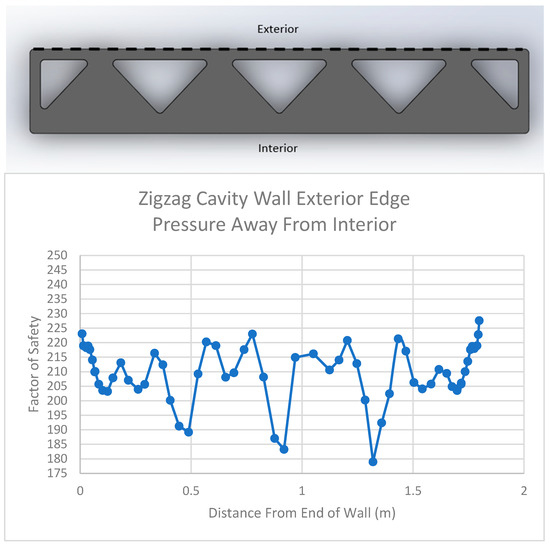
Figure 25.
Zigzag Cavity Wall Exterior Edge Results for Pressure Applied Away from the Interior.
The next graph in Figure 26 shows the portion of the wall where the insulation cavity meets the exterior concrete layer. This graph clearly shows that in this portion of the wall, the unsupported lengths have higher factor of safety values (over 325). On the other hand, the triangular webbing contact locations have relatively lower factor of safety values of approximately 100, which indicates that this portion of the wall is in tension.

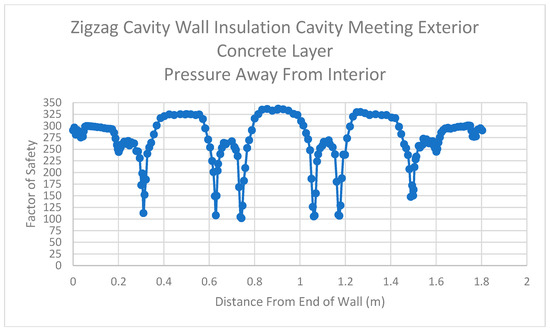
Figure 26.
Results for Insulation Cavity Meeting the Exterior Concrete Layer of the Zigzag Cavity Wall for Pressure Applied Away from the Interior.
The graph in Figure 27 displays the factor of safety values for the interior edge of the zigzag wall. The factor of safety values for this portion of the wall are relatively high (reaching upwards of 1000). This is due to the fact that the interior side of the wall in its midplane is in compression for this direction of pressure. This behavior can clearly be seen in Figure 22, which shows an isometric view of the results. It should again be noted that there are lower factor of safety values where the concrete is continuous throughout the wall. This indicates that the webbing is able to transfer stress from the exterior face to the interior face.
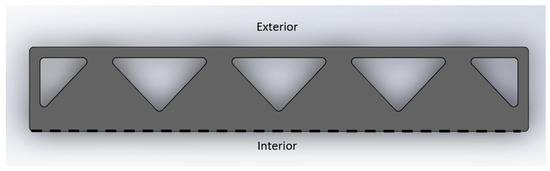
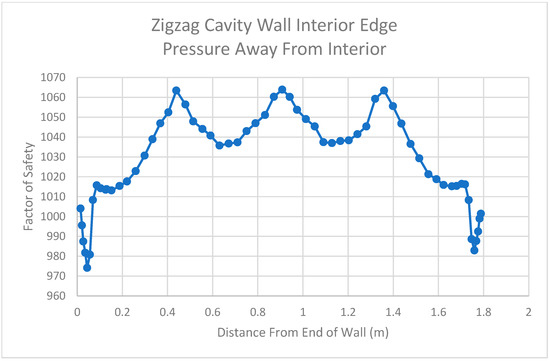
Figure 27.
Zigzag Cavity Wall Interior Edge Results for Pressure Applied Away from the Interior.
5.2. Zigzag Cavity Wall Thermal Study
After the results for the structural study were obtained, the thermal study of the zigzag cavity wall was conducted. First, the concrete portion of the wall (without fillets) was filled with a modeled insulation. This insulation was then assigned the insulation properties discussed in the setup section. The assembly and the labeled cross section of the assembly can be seen in Figure 28.
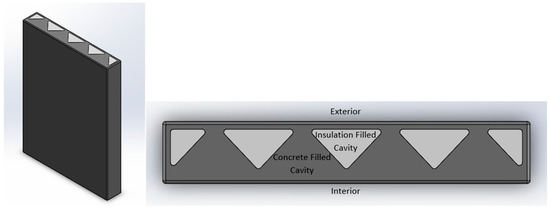
Figure 28.
Zigzag Cavity Wall Concrete and Insulation Assembly.
Once the wall assembly was modeled, the insulation and concrete portions of the wall were connected as a bonded connection in SolidWorks. To represent a wall exposed to cold outdoor temperatures, a convection thermal load was applied to the exterior of the wall. This convection thermal load was given a heat transfer coefficient of 5 W/m2·K with a bulk ambient temperature of 273.15 K [33]. Additionally, a 295 K temperature was assigned to the interior side of the wall. The wall was then meshed in SolidWorks. Again, it was ensured that 90% or more of the elements in the mesh had an aspect ratio of less than 3. Subsequently, the results were gathered.
Figure 29 shows an isometric view of the temperature distribution within the wall examined in this study. From the figure, it is clear there is less heat loss where there is insulation. This can be seen from the teal color shown in the middle image in Figure 29. On the other hand, there are clear thermal bridging locations present throughout the wall. For example, in every location where the concrete is continuous (from the exterior to the interior face), there appears to be thermal bridging. For example, on the exterior face of the wall, there is clear yellow shading on the exterior face (where the concrete is continuous) that represents thermal bridging locations. These thermal bridging locations can be seen more clearly in Figure 30, which shows an overhead view of the wall. Again, there is less heat loss where the insulation comes into contact with the exterior concrete layer (shown in blue).
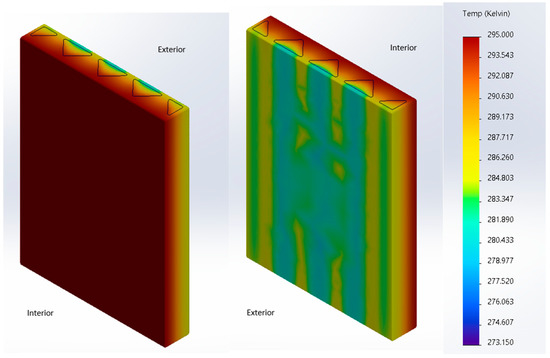
Figure 29.
Zigzag Cavity Wall Isometric Temperature Plot.
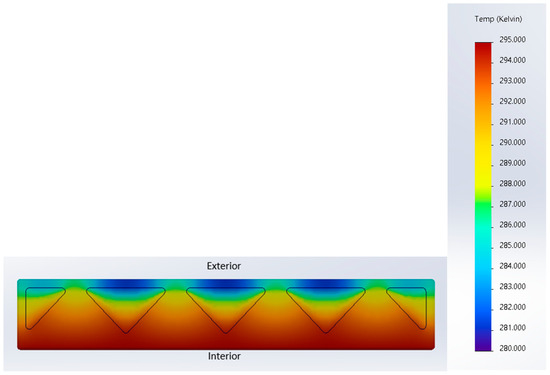
Figure 30.
Zigzag Cavity Wall Overhead Temperature Plot.
Additionally, the heat power of the exterior face of the wall was calculated using SolidWorks. When calculated, it was found that the wall lost a total of 211.83 W of power. This heat loss is a direct result of the warm temperature traveling along the continuous concrete portions of the wall to the exterior face of the wall. Again, concrete possesses a higher thermal conductivity value than the insulation. Thus, when continuous, the concrete results in thermal bridging. The results of the heat power calculation in SolidWorks can be seen in Figure 31.
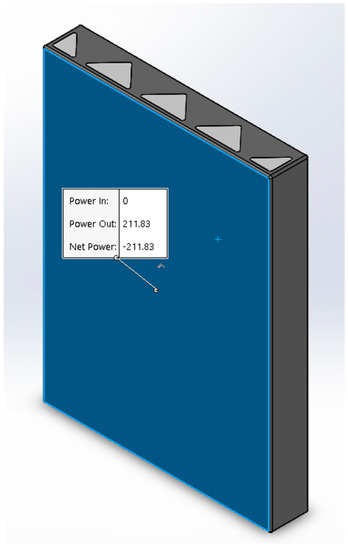
Figure 31.
Zigzag Cavity Wall Net Power.
6. Relative Stiffness Determination for Different Wall Shapes
To further develop the structural aspect discussion, the moment of inertia values for each wall’s cross section were calculated using SolidWorks and then compared to the moment of inertia value of a solid wall with the same dimensions. It should be noted that the same solid wall used for the example calculation in a previous section was also used for this calculation. Additionally, the moment of inertia of each wall was taken about the x-axis, which is the axis parallel to the width of each wall. To clarify, the width is the 1.8034 m dimension in this study. In addition, the moment of inertia was calculated for walls with no filleted edges and for the filled concrete cavities and the insulation cavities left empty. Thus, the shapes that were used can be found in Figure 3, Figure 4, Figure 5, Figure 6 and Figure 7, with the fillets removed for this calculation. In all, these values provide a very useful indication of the relative stiffness of each wall studied. Additionally, Table 4 shows the areas of printed concrete, poured concrete, and insulation for the studied walls.
Table 4.
Cross Sectional Area of Each Wall Studied.
Figure 32 shows the moment of inertia values relative to the moment of inertia value of a solid wall with the same dimensions. From this figure, it is clear which walls produce the largest moment of inertia values. The symmetric two-cavity wall and the internal small-arched two-cavity wall produced relatively low moment of inertia values. On the other hand, the zigzag cavity wall, the trapezoidal cavity wall, and the internal large-arched multicavity wall all produced higher moment of inertia values. From this finding and the flexural formula (σ = My/I), it is clear that the amount of stress generated in these walls is inversely proportional to the moment of inertia of the wall. This means that the larger the moment of inertia is, the less stress is generated in the wall. Accordingly, it is clear that a larger moment of inertia value is beneficial for reducing the amount of stress present within the wall’s cross section. Additionally, the walls that contain webbing connecting the interior and exterior faces of the wall (the zigzag cavity wall, the trapezoidal cavity wall, and the internal large-arched multicavity wall) are seen to possess relatively larger moment of inertia values. Thus, it can be inferred that these walls generate less stress (due to an applied moment) as a result. Consequently, the walls with webbing (that have higher moment of inertia values) possess more stiffness relative to the walls without webbing.
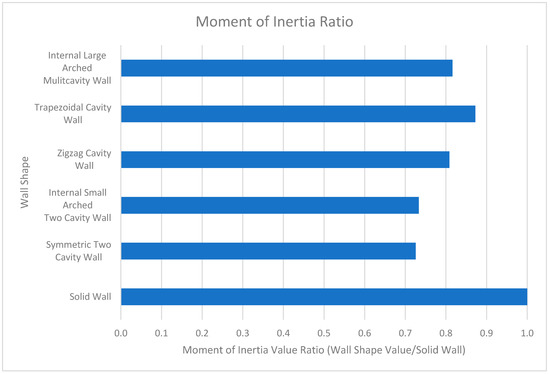
Figure 32.
Moment of Inertia Ratio Chart.
7. Discussion of Results
The structural results of each wall show several revealing trends that should be noted. The walls used in this study and their results can be found in Figure 3, Figure 4, Figure 5, Figure 6 and Figure 7. First, the concrete connecting the exterior and interior faces of these walls allowed for the entire thickness of the wall to act in resisting the stress applied to the wall. It is seen that in the first two walls studied (the symmetric two-cavity wall and the internal small-arched two-cavity wall), there is no concrete webbing on the interior and exterior faces of the walls. As a result, the thinner exterior concrete layer was responsible for resisting the majority of the applied load. This was not the case for the last three walls that were studied (zigzag cavity wall, trapezoidal cavity wall, and internal large-arched multicavity wall). In these walls, there was significant webbing present to connect the interior and exterior faces of the wall. As a result, pressure could be transferred from the exterior face (where the pressure was applied) to the interior face of the wall, thus showing that the entire thickness of the wall was utilized to resist the applied pressure. The factor of safety values for each wall studied (when pressure was applied to the interior of the wall) can be seen in Figure 33, Figure 34 and Figure 35.
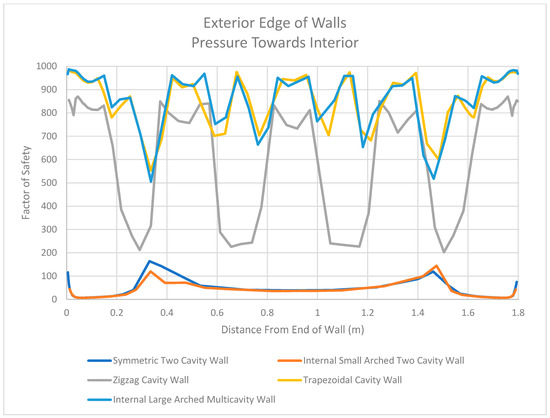
Figure 33.
Factor of Safety Values for Exterior Edge of Walls in the Midplane When Pressure Is Directed Towards the Interior.
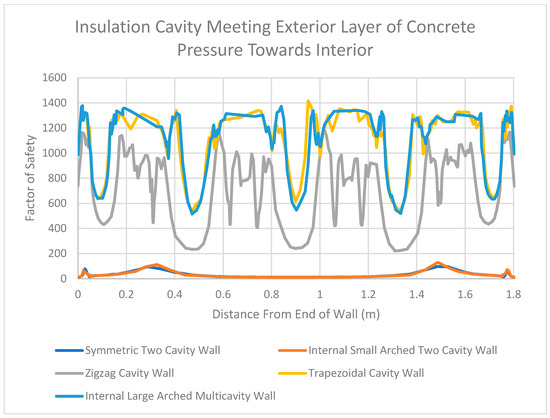
Figure 34.
Factor of Safety Values for Insulation Cavity Meeting Exterior Layer of Concrete in the Midplane When Pressure Is Directed Towards the Interior.
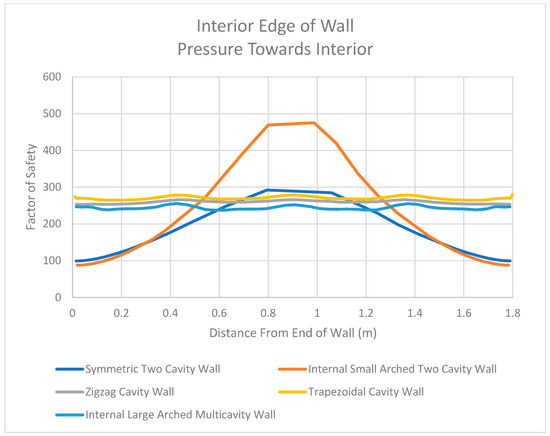
Figure 35.
Factor of Safety Values for Interior Edge of Walls in the Midplane When Pressure Is Directed Towards the Interior.
Additionally, it was seen that the first two walls studied (the symmetric two-cavity wall and the internal small-arched two-cavity wall) had much lower factor of safety values where the insulation cavity came into contact with the exterior concrete layer. When pressure was applied to the interior of the wall, the middle portion of this exterior concrete layer had factor of safety values as low as approximately 10 for these two walls, which can be seen in the graph in Figure 34. The remaining three walls that were studied (zigzag cavity wall, trapezoidal cavity wall, and internal large-arched multicavity wall) had higher factor of safety values at these locations. More specifically, the lowest factor of safety value occurred at the center of the unsupported length of each wall’s exterior concrete layer (when pressure was applied to the interior). The factor of safety value reached as low as 200 for the zigzag cavity wall at this location, which can also be seen in Figure 34. Though much larger in value than 10, this factor of safety value of 200 is logical. It was mentioned that the unsupported lengths of these walls acted in a manner analogous to a fixed–fixed wall. When calculating the stress for a fixed–fixed wall that is transversely loaded (as is the case in this study), the flexural formula can be utilized (σ = M × y/I).
When the unsupported lengths of the wall are reduced due to webbing acting as supports (as seen in the zigzag cavity wall, as compared with the symmetric two-cavity wall and internal small-arched two-cavity wall), the cross section of the wall does not change. Thus, the y and I variables in the flexural formula do not change. However, the moment value in the flexural formula does change. It should be noted that the moment value for this type of loading can be calculated using the equation w × L2/12, where w is the distributed load and L is the unsupported length. For the first two walls, the unsupported length of the wall is approximately 1.7272 m. When the webbing in the zigzag cavity wall is introduced, the unsupported length is reduced to approximately 0.39 m, while the pressure does not change. Therefore, plugging 1.7272 m into the moment equation above and comparing it to the moment value for 0.39 m yields a moment value that is approximately 20 times larger. Carrying this relationship over to the flexural formula results in a stress that is approximately 20 times larger for the first two walls than for the zigzag cavity wall. When comparing the factor of safety values for the symmetric two-cavity wall and the zigzag cavity wall examined in this study (10 to 200), the exact same relationship between the walls is found. As a result, the walls with webbing tend to limit the amount of stress developed in the exterior concrete layer of the wall and tend to perform better than walls with no webbing at all.
Similar behaviors can be seen when the direction of the pressure is applied away from the interior of the wall. For example, Figure 36, Figure 37 and Figure 38 display the results of each wall for three locations along the midplane due to pressure applied away from the interior of the wall. In this figure, one can see relationships similar to those seen when pressure was directed towards the interior of the wall. More specifically, the walls without webbing present larger unsupported lengths. As a result, the factor of safety values were lower for these walls than the walls with webbing. Additionally, the walls with webbing were more able to transfer stress from the exterior face to the interior face of the wall. This can also be seen in Figure 38, where the factor of safety values drop at the interior locations where webbing is present.
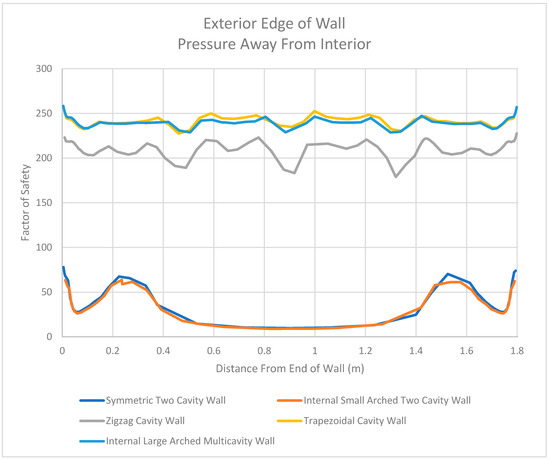
Figure 36.
Factor of Safety Values for Exterior Edge of Walls in the Midplane When Pressure Is Directed Away from the Interior.
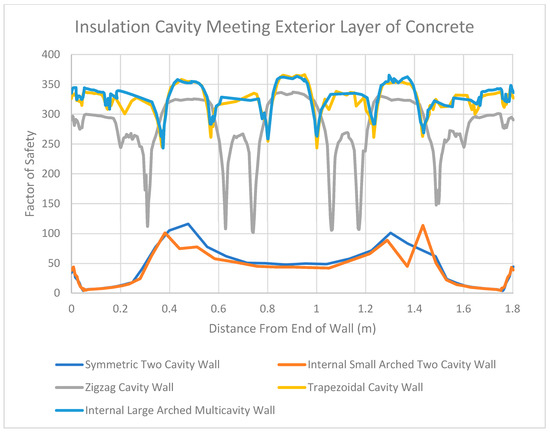
Figure 37.
Factor of Safety Values for Insulation Cavity Meeting Exterior Layer of Concrete in the Midplane When Pressure Is Directed Away from the Interior.
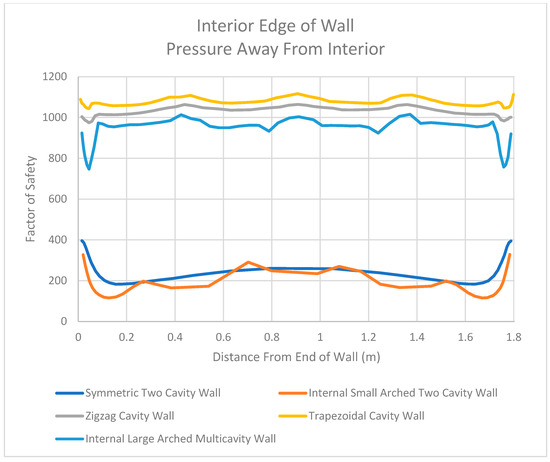
Figure 38.
Factor of Safety Values for Interior Edge of Walls in the Midplane When Pressure Is Directed Away from the Interior.
However, this was not the case when comparing the walls in the thermal study. As seen in the temperature distribution plots for each wall, the walls that contain webbing between the interior and exterior face of the wall contain more thermal bridging locations than those without webbing. For example, the first two walls studied (the symmetric two-cavity wall and internal small-arched two-cavity wall) had only two thermal bridging locations. On the other hand, the last three walls studied (the zigzag cavity wall, trapezoidal cavity wall, and internal large-arched multicavity wall) had several thermal bridging locations. This behavior was quantified using the net power function in SolidWorks. This function provides the ability to quantify the amount of heat lost to the exterior surface of each wall. From these calculations, it was clear that the walls without webbing (the symmetric two-cavity wall and internal small-arched two-cavity wall) lost between 55 W and 60 W. On the other hand, the walls with webbing lost over 200 W. Figure 39 displays the lost power that was calculated for each wall throughout the study.
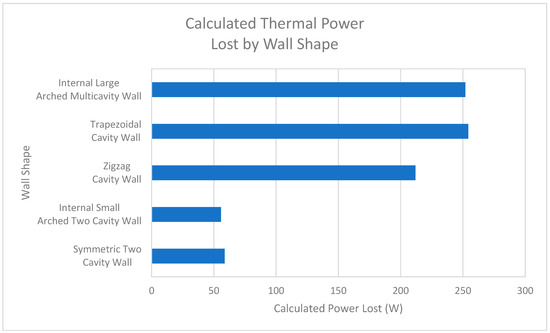
Figure 39.
Calculated Thermal Power Lost According to Wall Shape.
8. Conclusions
The structural and thermal studies showed that there is no single best wall configuration. Certain characteristics of each wall allow it to perform better in certain categories. For example, a wall with webbing possesses better flexural ability than a wall without webbing. However, a wall without webbing loses less heat due to thermal bridging. In conclusion, each wall studied has its benefits and drawbacks. For certain locations and applications, a wall with better flexural ability may be key. However, for other cases, a wall that performs well thermally may be more important. For this reason, each wall has a proper use and can be utilized by practicing companies. It may even become common for companies to use different wall types based on the locations of their buildings.
From the results of the structural study, it appears that webbing is required in order for stress to be transferred from the exterior concrete layer to the interior of the wall. This can be seen in the difference between the symmetric two-cavity wall and the zigzag cavity wall in Figure 35. The webbing allows the stress to be transferred to the interior face of the wall for the zigzag cavity wall (as seen from the drops in the factor of safety values), whereas this is not the case for the symmetric two-cavity wall. Therefore, it can be concluded that reinforcements placed on the interior sides of the walls with webbing would be effective in increasing the strength of the walls. On the other hand, reinforcements placed on the interior sides of the wall (where the filled concrete is present, as shown in Figure 3 and Figure 4) would not significantly increase the strength of walls without webbing (such as the symmetric two-cavity wall and the internal small-arched two-cavity wall).
While this study provides a brief review of the performance of different wall shapes, there is more work to be done. First, this study did not take into account the individual layers stacked on top of each other (and the bonding between them). Additionally, this study used the properties of typical concrete. Follow-up studies using the material properties of printed concrete and developing optimized shapes based on the results would be highly beneficial and complementary.
Author Contributions
Conceptualization, N.D.B. and A.M.M.; methodology, N.D.B. and A.M.M.; software, N.D.B.; validation, A.M.M.; formal analysis, N.D.B. and A.M.M.; investigation, N.D.B. and A.M.M.; resources, N.D.B. and A.M.M.; data curation, N.D.B. and A.M.M.; writing—original draft preparation, N.D.B.; writing—review and editing, A.M.M.; visualization, N.D.B.; supervision, A.M.M.; project administration, A.M.M. All authors have read and agreed to the published version of the manuscript.
Funding
This research received no external funding.
Data Availability Statement
All of the data are provided within the manuscript.
Conflicts of Interest
The authors declare no conflict of interest.
References
- Elfatah, A.S.A. 3D Printing in Architecture, Engineering and Construction. Eng. Res. J. 2019, 162, 119–137. [Google Scholar] [CrossRef]
- Zhang, J.; Wang, J.; Dong, S.; Yu, X.; Han, B. A review of the current progress and application of 3D printed concrete. Compos. Part A Appl. Sci. Manuf. 2019, 125, 105533. [Google Scholar] [CrossRef]
- García-Alvarado, R.; Moroni-Orellana, G.; Banda-Pérez, P. Architectural evaluation of 3D-printed buildings. Buildings 2021, 11, 254. [Google Scholar] [CrossRef]
- Bos, F.; Wolfs, R.; Ahmed, Z.; Salet, T. Additive manufacturing of concrete in construction: Potentials and challenges of 3D concrete printing. Virtual Phys. Prototyp. 2016, 11, 209–225. [Google Scholar] [CrossRef]
- Verian, K.P.; Carli, M.D.; Bright, R.P.; Maandi, E. Research Development in 3DCP: Cured-on-Demand with Adhesion Enhancement Delivery System. ResearchGate, Laticrete International. 2018. Available online: https://www.researchgate.net/profile/Kho-Verian/publication/328757411_Research_Development_in_3DCP_Cured-on-Demand_with_Adhesion_Enhancement_Delivery_System/links/5be23cb292851c6b27ac6370/Research-Development-in-3DCP-Cured-on-Demand-with-Adhesion-Enhancement-Delivery-System.pdf (accessed on 2 January 2023).
- Buswell, R.A.; Leal de Silva, W.R.; Jones, S.Z.; Dirrenberger, J. 3D printing using concrete extrusion: A roadmap for Research. Cem. Concr. Res. 2018, 112, 37–49. [Google Scholar] [CrossRef]
- Dey, D.; Panda, B. An experimental study of thermal performance of 3D printed concrete slabs. Mater. Lett. 2023, 330, 133273. [Google Scholar] [CrossRef]
- Pessoa, S.; Guimarães, A.S.; Lucas, S.S.; Simões, N. 3D printing in the construction industry—A systematic review of the thermal performance in buildings. Renew. Sustain. Energy Rev. 2021, 141, 110794. [Google Scholar] [CrossRef]
- Wu, H.; Hu, R.; Yang, D.; Ma, Z. Micro-macro characterizations of mortar containing construction waste fines as replacement of cement and sand: A comparative study. Constr. Build. Mater. 2023, 383, 131328. [Google Scholar] [CrossRef]
- SolidWorks. Solidworks Simulation. 2022. Available online: https://www.solidworks.com/product/solidworks-simulation (accessed on 28 December 2022).
- Frei, W. Should I Fillet the Geometry in My Electromagnetic Heating Analysis? COMSOL. 2017. Available online: https://www.comsol.com/blogs/should-i-fillet-the-geometry-in-my-electromagnetic-heating-analysis/#:~:text=When%20building%20finite%20element%20models,a%20fillet%20avoids%20this%20singularity (accessed on 28 December 2022).
- Bi, Z. Finite Element Analysis Applications; Academic Press: Cambridge, MA, USA, 2019. [Google Scholar]
- SolidWorks. Stress Hot Spot Property Manager. Stress Hot Spot PropertyManager—2021—SOLIDWORKS Help, SolidWorks. 2021. Available online: https://help.solidworks.com/2021/english/SolidWorks/cworks/hidd_stress_hot_spot.htm (accessed on 28 December 2022).
- The Engineering Toolbox. Concrete Properties. Engineering ToolBox. 2008. Available online: https://www.engineeringtoolbox.com/concrete-properties-d_1223.html (accessed on 28 December 2022).
- ICON. Vulcan. ICON. 2022. Available online: https://www.iconbuild.com/vulcan (accessed on 30 March 2022).
- ACI 318-19; Building Code Requirements for Structural Concrete. American Concrete Institute: Farmington Hills, MI, USA, 2019.
- Talebi, H.R.; Kayan, B.A.; Asadi, I.; Hassan, Z. Investigation of Thermal Properties of Normal Weight Concrete for Different Strength Classes. J. Environ. Treat. Tech. 2020, 8, 908–914. [Google Scholar]
- SolidWorks. Mohr-Coulomb Stress Criterion. Mohr-Coulomb Stress Criterion—2018—SOLIDWORKS Help, SolidWorks. 2018. Available online: https://help.solidworks.com/2018/english/solidworks/cworks/r_mohr-coulomb_stress_criterion.htm (accessed on 28 December 2022).
- Elkady, A. #21 Abaqus Tutorial: Defining Concrete Damage Plasticity Model + Failure and Element Deletion. YouTube, YouTube. 2021. Available online: https://www.youtube.com/watch?v=wy84XGamn3g (accessed on 4 January 2023).
- The Constructor. Stress-Strain Curve for Concrete. The Constructor. 2018. Available online: https://theconstructor.org/concrete/stress-strain-curve-concrete/6159/ (accessed on 18 January 2023).
- ASCE/SEI 7-16; Minimum Design Loads and Associated Criteria for Buildings and Other Structures. American Society of Civil Engineers: Reston, VA, USA, 2017.
- SQ4D. 3D Printed Houses by SQ4D. SQ4D. 2022. Available online: https://www.sq4d.com/ (accessed on 12 April 2022).
- Petrock, S. Learn Solidworks Simulation in Less than 30 Min. Here’s All You Need to Know to Get Started. YouTube, YouTube. 2021. Available online: https://www.youtube.com/watch?v=Gthsy6OOjo0 (accessed on 28 December 2022).
- SolidWorks. Principal Stresses Definition. Principal Stresses Definition—2017—SOLIDWORKS Help. 2017. Available online: https://help.solidworks.com/2017/english/SolidWorks/cworks/c_principal_stresses_definition.htm?verRedirect=1 (accessed on 18 January 2023).
- Risinger, M. Is This the Future of Construction? 3D Concrete Printed Homes. YouTube. 2021. Available online: https://www.youtube.com/watch?v=_MsOXrprYXs (accessed on 30 March 2022).
- Gross, J. The Most Innovative 3D Printed House in the World [Mense-Korte]. YouTube. 2021. Available online: https://www.youtube.com/watch?v=qWBA-6NgIJg (accessed on 30 March 2022).
- Gross, J. Secrets of 3D Printed Concrete Exposed|Bold Black Buffalo 3D Shares All. YouTube. 2021. Available online: https://www.youtube.com/watch?v=R7lAnIWy5lg (accessed on 30 March 2022).
- WinSun. 3D Printing Architecture Profile. Yingchuang Building Technique Shanghai Co., Ltd. (Winsun). Available online: http://www.winsun3d.com/En/Product/pro_inner/id/1 (accessed on 21 September 2022).
- Apis Cor. 3D Houses. Apis Cor. 2022. Available online: https://www.apis-cor.com/showroom (accessed on 30 March 2022).
- CyBe. R & DRone Laboratory. CyBe. 2022. Available online: https://cybe.eu/cases/rdrone-lab/ (accessed on 30 March 2022).
- BING. Thermal Insulation Materials Made of Rigid Polyurethane Foam. Federation of European Rigid Polyurethane Foam Associations. 2006. Available online: https://highperformanceinsulation.eu/wp-content/uploads/2016/08/Thermal_insulation_materials_made_of_rigid_polyurethane_foam.pdf (accessed on 28 December 2022).
- SolidWorks. Types of Contact. Types of Contact—2020—SOLIDWORKS Help, SolidWorks. 2020. Available online: https://help.solidworks.com/2020/english/SolidWorks/cworks/ID_HELP_CONTACT_PAIR.htm?id=c5b1c459da654e7b9be880b23724a100#Pg0 (accessed on 28 December 2022).
- Kosky, P.G.; Balmer, R.; Keat, W.; Wise, G. Exploring Engineering: An Introduction to Engineering and Design; Academic Press: Waltham, MA, USA, 2013. [Google Scholar]
- SolidWorks. Heat Power/Energy Property Manager. Heat Power/Energy PropertyManager—2019—SOLIDWORKS Help, SolidWorks. 2019. Available online: https://help.solidworks.com/2019/english/SolidWorks/cworks/IDH_HELP_HEAT_POWER.htm?verRedirect=1 (accessed on 28 December 2022).
- American Society of Civil Engineers. ASCE 7 Hazard Tool. ASCE 7 Hazard Tool. 2021. Available online: https://asce7hazardtool.online/ (accessed on 14 February 2023).
Disclaimer/Publisher’s Note: The statements, opinions and data contained in all publications are solely those of the individual author(s) and contributor(s) and not of MDPI and/or the editor(s). MDPI and/or the editor(s) disclaim responsibility for any injury to people or property resulting from any ideas, methods, instructions or products referred to in the content. |
© 2023 by the authors. Licensee MDPI, Basel, Switzerland. This article is an open access article distributed under the terms and conditions of the Creative Commons Attribution (CC BY) license (https://creativecommons.org/licenses/by/4.0/).