Article

Effect of Chill Plate Thickness on Surface Hardening and Dimensional Accuracy of Nodular Cast Iron Gears Manufactured by the Chill Casting Method

by
Natalino Fonseca Da Silva Guterres
1,2,*,
Rusnaldy Rusnaldy
1 and
Achmad Widodo
1
1
Department of Mechanical Engineering, Diponegoro University, Prof. Soedharto Street, Tembalang, Semarang 50275, Indonesia
2
Department of Mechanical Engineering, Dili Institute of Technology, Ai-meti Laran Street, Dili P.O. Box 207, Timor-Leste
*
Author to whom correspondence should be addressed.
Designs 2023, 7(2), 56; https://doi.org/10.3390/designs7020056
Submission received: 26 February 2023 / Revised: 4 April 2023 / Accepted: 7 April 2023 / Published: 11 April 2023
(This article belongs to the Section Mechanical Engineering Design)

Abstract

:
The gear manufacturing method is an important determinant of their performance and service life. Surface hardness and dimensional accuracy play a significant influence in determining wear and contact fatigue in gears. This study’s goal was to measure the gear profile dimensions and surface behavior of nodular cast iron made using the chill casting technique. Chill plates made of 304 stainless steel with thicknesses of 0.2, 0.4, and 0.6 mm were used to provide good surface cooling rates during the chill casting of gears performed using open molds of silica sand. Chill plates are plated onto the walls of the mold, and then the molten material is poured at 1400 °C. The obtained gears were tested using photographs, microstructures, SEM-EDX, microhardness, wear, and dimensional measurements. The thickness of the chill plate can affect the hardening process of the gear surface. Thicker chill plates result in slower cooling rates, resulting in a more homogeneous microstructure and increasing the hardness level of the hardened layer. Whereas thinner chill plates result in a faster cooling rate, which results in a higher hardness and wear resistance of the hardened layer. Reducing the thickness of the chill plate from 0.6 mm to 0.2 mm increases the cooling rate and increases the amount of diffusion that can occur. The results showed that M7C3 and the (FeCrC)7C3 matrices were formed, with an average hardness within a range of 700–994.96 HV. A chill plate with a thickness of 0.4 mm produces gear with the best accuracy and precision.

1. Introduction

Ductile iron has often been used to make components using the casting method. However, to change the mechanical properties, one must use heat treatment procedures or use the material as a mold to produce a pearlite, ferritic, or martensitic structure [1]. The temperature range for ductile iron heat treatment varies depending on the grade and composition of the material. Heat treatment typically used for ductile iron includes stress relief, annealing, normalizing, hardening, and tempering. Generally, stress relief and annealing are performed at 510–625 °C and 900–950 °C, respectively. Normalizing at 870–940 °C improves tensile properties. To reduce stresses, hardening and tempering are conducted at 845–925 °C. The temperature range used depends on the desired microstructure and mechanical properties of the material, as well as its intended application [2].
Gray and nodular cast iron can be used for manufacturing gears because it has superior properties to carbon steel and alloy steel [3]. Nodular cast iron has a few benefits over gray cast iron and other types of cast iron.
Gray cast iron has great ductility, making it easier to manufacture and more durable than white cast iron and steel [4]. Additional benefits include the ability to manufacture complex components very precisely, as well as friction and impact resistance [5,6].
However, it has weaknesses, including a propensity for defect during casting, so that it can produce pitting and cracking on the tooth flank, particularly on the flank surface [7]. Additionally, its lower toughness compared to gray cast iron is another drawback [8]. These were exclusively used for producing large-scale gears for very heavy loads [9]. Gear profile modeling through casting and machining, followed by surface hardening and polishing, is one of the phases in the production of gears (along with blasting, grinding, and others). Moreover, surface hardening is also done to create a tough surface region for wear resistance [10].
The important aspect in gear manufacturing is the quality assessment of the tooth profile, which includes measuring the tooth’s surface hardness for wear resistance, minimizing microgeometry errors to reduce running noise, and enhancing surface integrity to increase load bearing capacity. The operating performance and service life of the gears can be impacted by indigent surface states, such as those in the addendum and dedendum sections, in addition to an increase in gearbox noise, particularly at higher rotating speeds [11,12,13]. Geometry, manufacturing techniques used, and the dimensional precision of manufactured gears are a few elements that influence gear performance during operation [14]. The contact points and contact angles of the gears during operation are affected by the dimensional accuracy of the tooth profile, such as that of the pitch circle [15,16,17]. Compressive stress will be reduced by changes in contact angle [18]. According to the findings of Xu et al., improper surface hardness will result in micro-holes and excessive wear of the tooth flanges [19]. Another factor that affects the performance of gears during operation is the property and elemental content of the raw materials used [20,21,22,23].
Before now, to create a cementite structure, ductile cast iron underwent a surface hardening progression by varying the temperature [24,25]. The process of diffusion of elements onto the surface of the specimen being cast, such as gears, is a more effective surface hardening method than other methods. Diffusion has been used in numerous experiments to harden the specimens of nodular iron material products. Through a variety of techniques, including the Plasma Transferred Arc (PTA) process, ferrous carbide is formed on the surface using elements such as chromium, nickel, molybdenum, and cobalt [26]. Other techniques include manual TIG welding [27], laser surface treatment (LST) [28], laser surface hardened melting [29], and fine particle bombardment (FPB) treatment [30]. Several of these techniques produced high hardness. However, it is still challenging to harden the surface of the tooth profile of the gear with a hard and thin layer. On the specimen surface of nodular iron, a martensitic phase with a high hardness can be formed using electroless nickel-duplex coating and laser spot hardening. However, it is still challenging to use this technique for hardening the surface of gears [31,32].
Horizontal Continuous Casting Machine (HCCM) is a casting method with a modest cost, fine cast product quality, and the ability to produce products with high accuracy. This method is also able to control the tensile stress value, elongation, and hardness of the resulting product. Before casting, the inside of the mold is coated with stainless steel as a coolant, which causes Cr elements to precipitate and form FeC structures on the surface of the specimen. In addition to that, the matrix structure formed is white iron with the thinnest, finest grain size and good uniformity on the surface. However, using this technique on really complicated components, such as gears, is still challenging [33]. The surface can be hardened using manual shielded metal arc welding techniques and laser patterning. The surface hardness levels produced by this technology, which employs austenitic and ferritic stainless steel electrodes, range from 1001 HV to 1150 HV. However, the cost remains high, and applying the coating process to the gear tooth profiles is quite delicate [34,35].
Research conducted by Nixon et al. used stainless steel to coat-harden the surface of a nodular iron specimen using the method of friction welding. However, the method used in this study failed to produce a high hardness value [36]. The specimen surface of nodular iron could be successfully coated with a hard grain structure using a nickel (Ni) alloy with a layer thickness of 1 mm to 2 mm by using Tungsten Inert Gas Welding and a Laser Cladding Method. This material is known as Inconel 617. The final microstructure is composed of a eutectic inter-dendritic carbide M23C6 and a dendritic solid solution that is enriched with Ni, although applying this technique to gears is still challenging due to the components’ high complexity and abrupt curves [37,38]. Qian M. et al. used chilled casting to make ferro-carbide structures on the surface of the specimen with a hardness of 650 HV and a hardening depth of 1 mm [39]. However, their investigation is still limited to rectangular specimens (100 × 80 × 10 mm).
The method of hardening the gear profile surface using chill casting is an option for solving the limitations of the previously described method. The chill casting method involves the rapid cooling rate that occurs throughout the casting process’s solidification phase. Using the chill casting method will cause an iron carbide structure to form at a quicker rate during the cooling process, giving the material great hardness and high wear resistance [40]. When chilling a metal surface in a mold, a material or component having a high thermal conductivity is used to speed up the cooling rate. To enable quick cooling and to facilitate diffusion of the chiller’s component parts to the surface of the specimen being cast, chillers made of nickel, copper, cast iron, and other materials are positioned on the surface of a pattern of holes [41,42]. To ensure that the mold’s surface is cold, the powder is the most usual type employed [43,44]. Aside from that, there is a chill plate as well as a liquid chill form that may be sprayed [39,45,46]. The chill method of casting has been extensively employed in the casting industry, particularly for surface hardening. However, the majority of the time, it only applied to steel casting as a method of recrystallizing the grain structure using the principle of speeding up the cooling to produce a good hardness on the surface [47]. In order to maximize the rapid cooling rate on the surfaces, a very uniform finish with smooth grain structures needs to be created. The chill casting technique has also been designed for the casting of numerous other types of aluminum alloys [48,49,50,51].
In the casting of nodular and gray iron, the Cr, Ni, Cu, Mo, and other elements in the chill plate can be changed to make sure that the elements reach the surface, form the cementite structure, and make the surface harder [52,53]. The specimen’s surface will have an M7C3 structure matrix with a hardness of 1176 HV as a result of the creation of the graphite structure [54]. Furthermore, the process of preheating the chiller material can be carried out to improve the homogeneous diffusion process of the elements in the material being cast [55,56].
In this study, spur gears made of nodular cast iron were made using the chilled casting method, which focused on surface hardening analysis and the dimensional accuracy of the resulting product. To make chill plates, 304 stainless steel is used. To produce a ferrous chromium and ferro-carbide matrix structure with a thin layer and high hardness on the tooth flank, the surface of the gear tooth profile must be coated with 304 stainless steel plates. Additionally, preheating the surface of the cold plate lets Cr atoms move evenly from the surface of the stainless steel to the surface of the nodular cast iron, which speeds up the cooling process and makes FeC. To the best of our knowledge, gear manufacturing using the chill casting method is still very limited. Furthermore, this method was chosen because the process is very simple, and the processing time is very short, thereby saving on the cost of the gear production process.

2. Materials and Methods

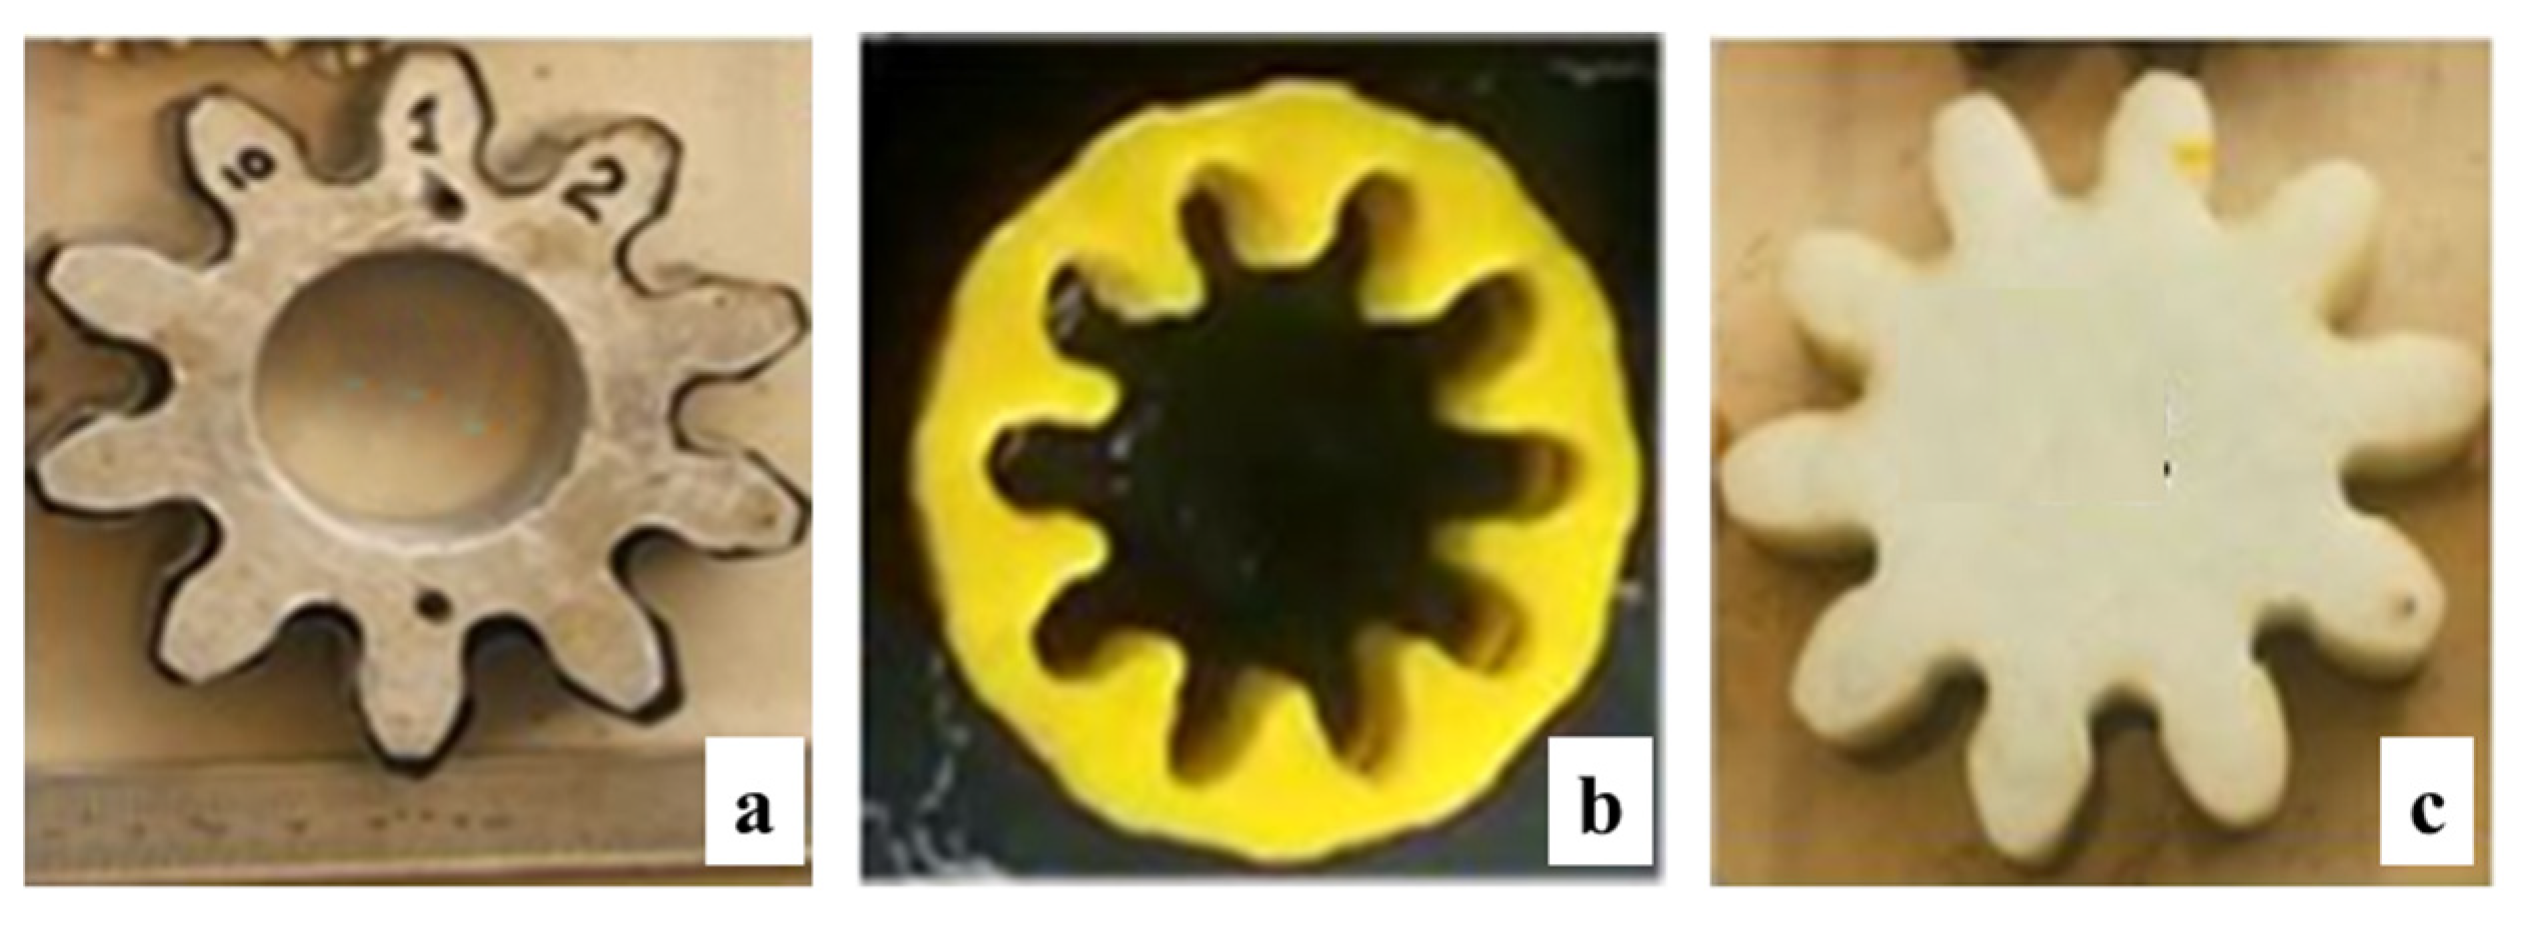
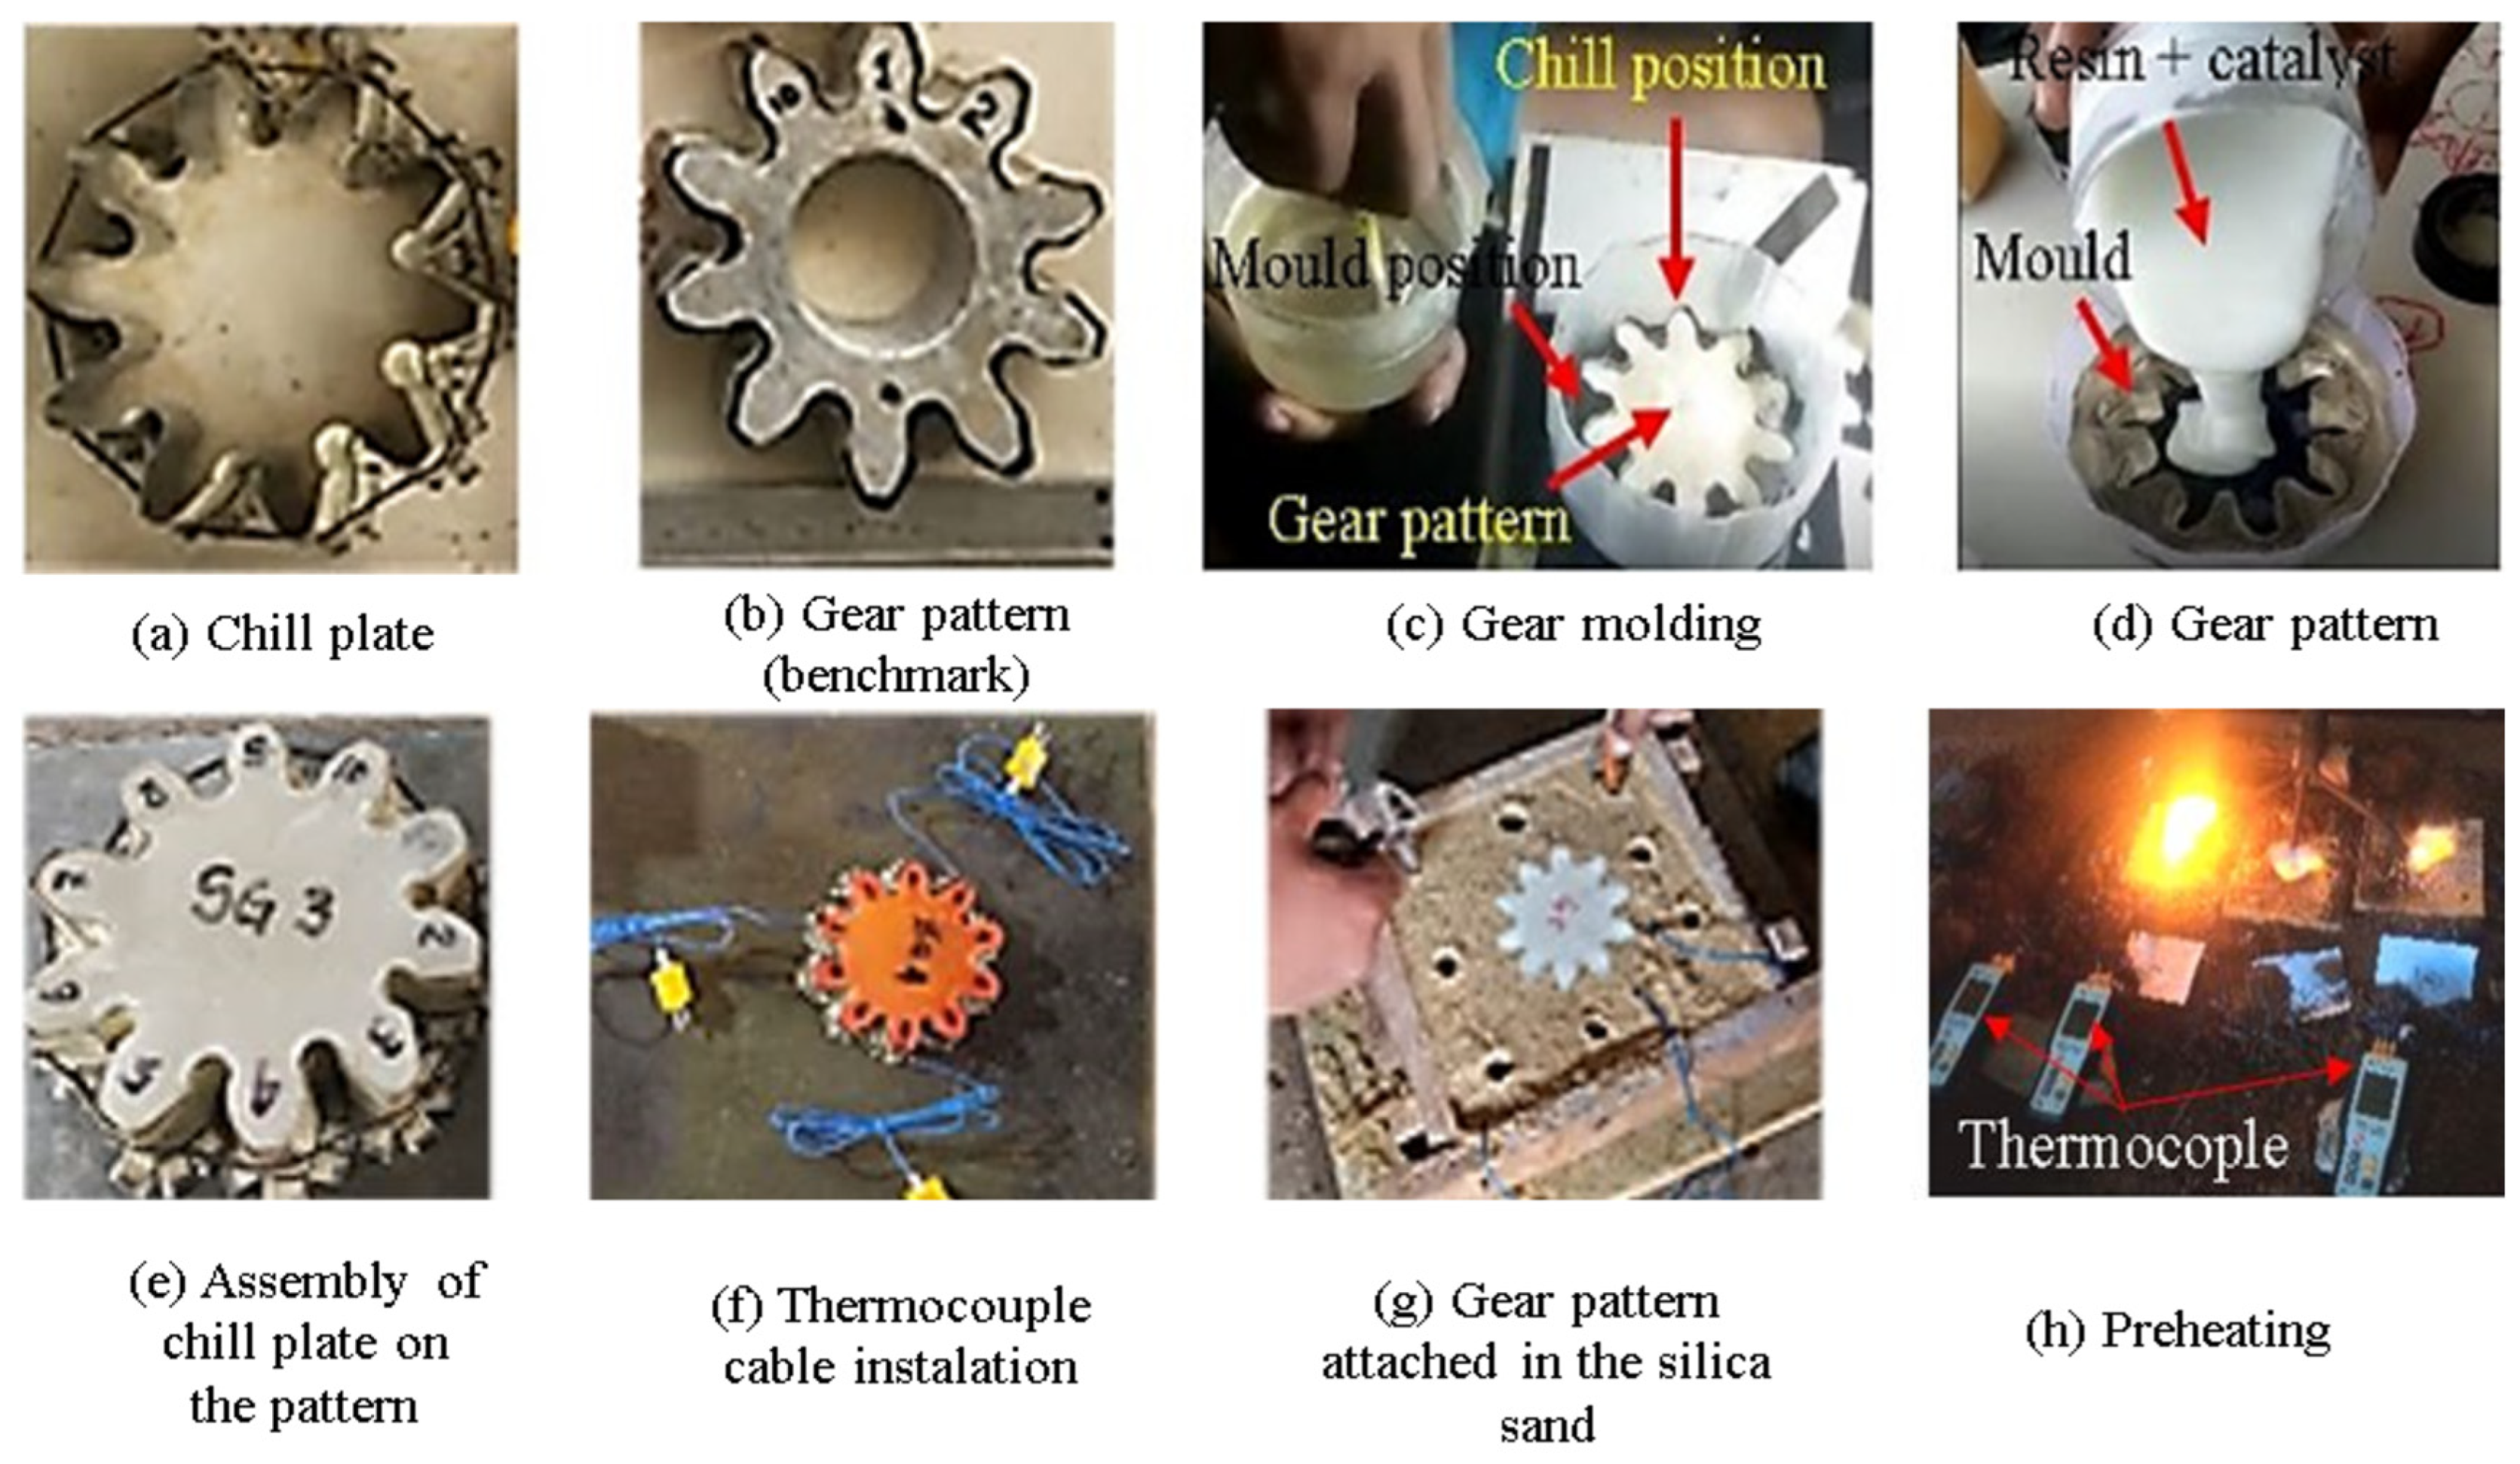
2.1. Materials and Manufacturing Processes

In this study, a spheroidal graphite nodule microstructure was produced by melting scrap steel and iron according to the method in previous studies [57,58,59,60]. Table 1 shows the elemental composition of the 304 stainless steel used as the chill plate material in this study [39,54]. Wooden slabs are used to make silica sand molds. The sand’s formula is a blend of silicon dioxide (SiO2), bentonite, and water in proportions of 89%, 7.5%, and 3.5%. Alkaline phenolics are used for adhesives.
The benchmark aluminum gear pattern (Figure 1a) was created using a hobbing machine, while the resin gear’s mold (Figure 1b) and gear pattern (Figure 1c) were made using a resin and silicon rubber alloy. Table 2 shows detailed benchmark gear specifications (G1).
Chill casting is a manufacturing process that involves pouring molten metal into a mold made of metal, which is then cooled rapidly to form the desired shape. Compared to other manufacturing methods, such as sand casting or investment casting, chill casting has several advantages in the production of gears, including improved mechanical properties, greater dimensional accuracy, reduced finishing time, improved consistency, and a lower cost. In this study, the chill casting method is utilized for spur gear fabrication, with the experimental setting shown in Figure 2.
The chill plate is created by cutting a 304 stainless steel plate to the maximum length and a width that is greater than the gear’s (30 mm) facing thickness.
Figure 2a,b show how easily the chill plate can be folded around the gear teeth. Three different cold plate thicknesses of 0.2 mm, 0.4 mm, and 0.6 mm were used in this investigation and were to be coated with resin molds (Figure 2c). For G2, G3, and G4 samples, 0.2 mm of enhancer plate thickness is utilized. Specimens G2, G3, and G4 used chill plates with different thicknesses of 0.2 mm, 0.4 mm, and 0.6 mm, respectively. The G1 specimen is an aluminum gear that was produced using a hobbing machine, and it is considered the benchmark gear for the study (Table 3).
The average size values for each resin gear pattern are shown in Table 3. The resin gear pattern is designed to change the thickness of the chill plate. After the gear pattern and chill plate are assembled (Figure 2e). The thermocouple cable is attached to the teeth with the T1, T4, and T8 codes, as shown in Figure 2f. Moreover, the silica sand mold has a gear pattern attached to it, as shown in Figure 2g. The dimensions of the silica sand mold used in this study were 600 mm × 450 mm × 230 mm. The chill plate is preheated at 700 °C and controlled by a digital thermocouple, a 4-channel Type K HT-9815 (Figure 2h).
An electric furnace (75 kVa, 50 W) is used to melt iron and steel scraps in 20 kg crucibles. After the pouring process, the sample is allowed to naturally reach room temperature. Specimens with dimensions that match the aluminum benchmark gear profile were generated using a wire-cut Electric Discharge Machine (EDM). EDM wire cutting was chosen because it has the ability to produce samples with a high level of precision [61,62].

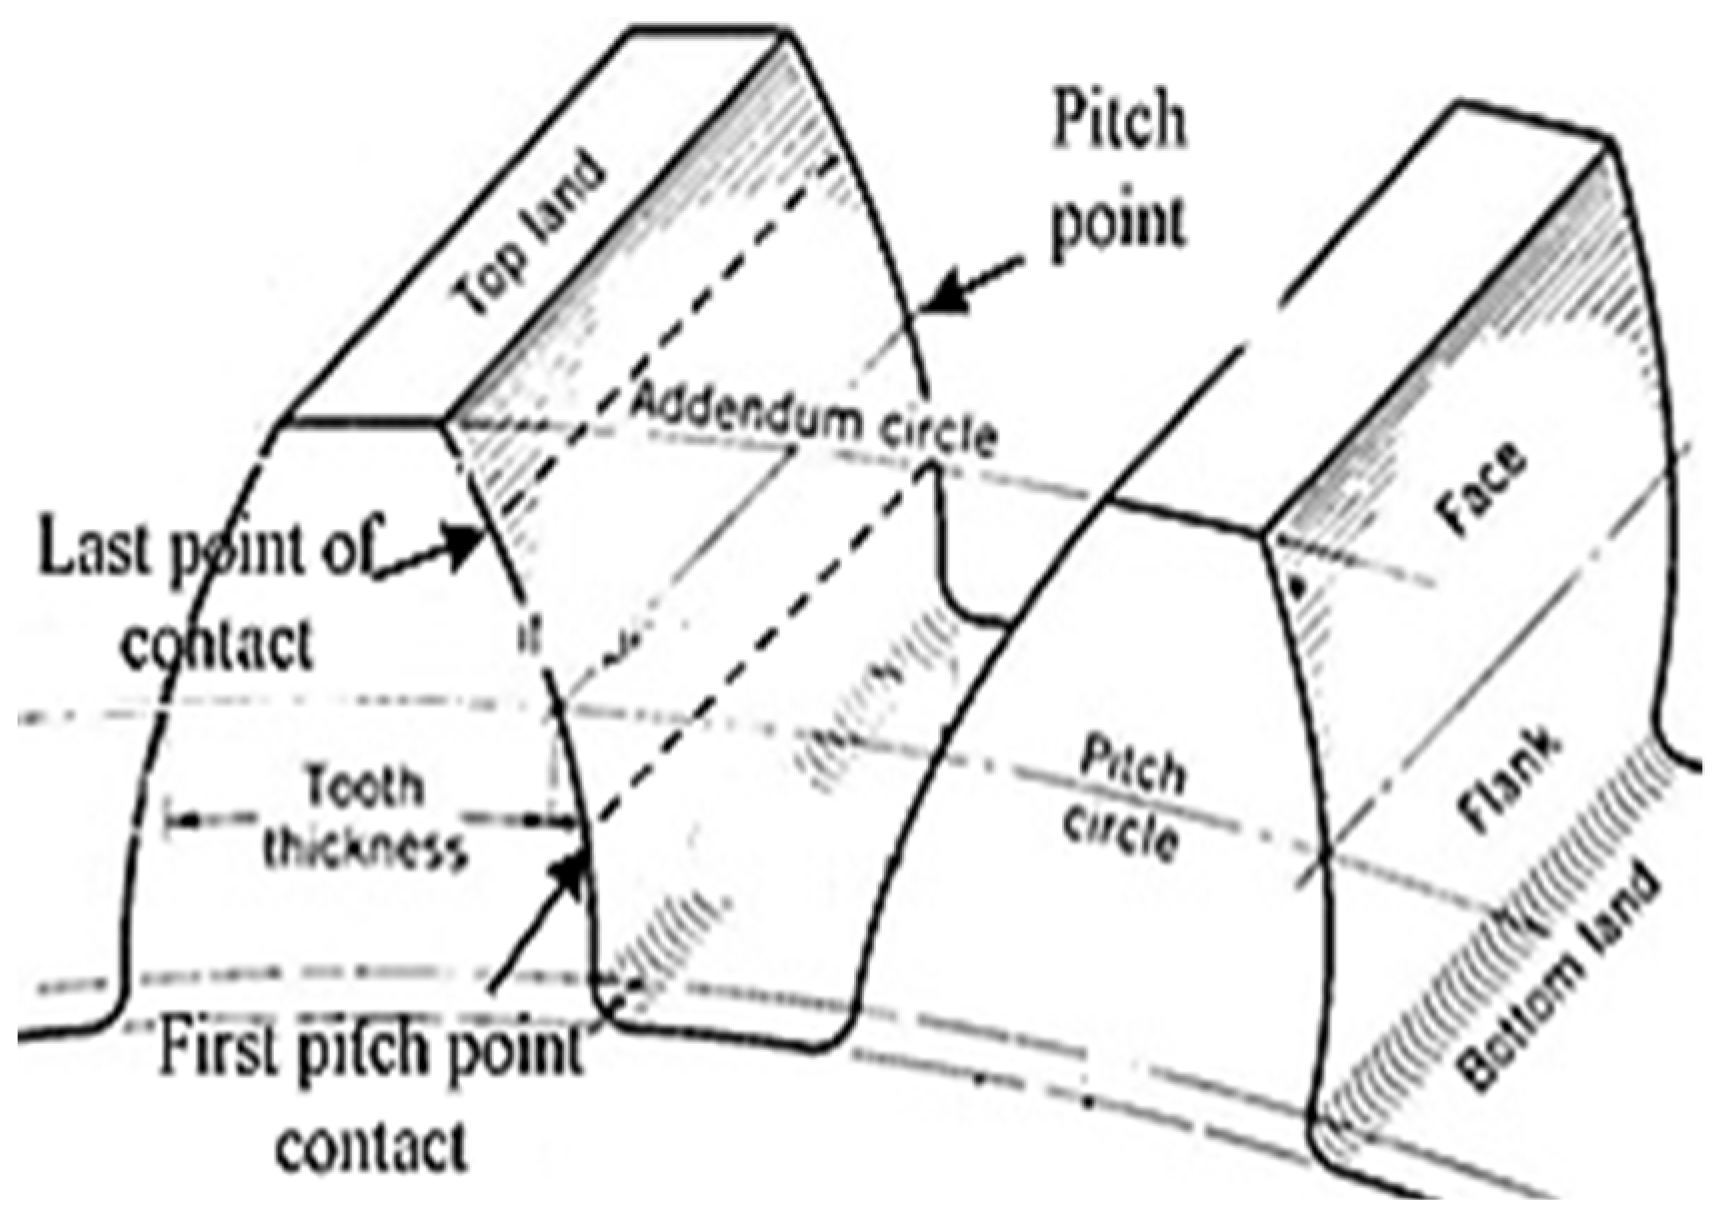
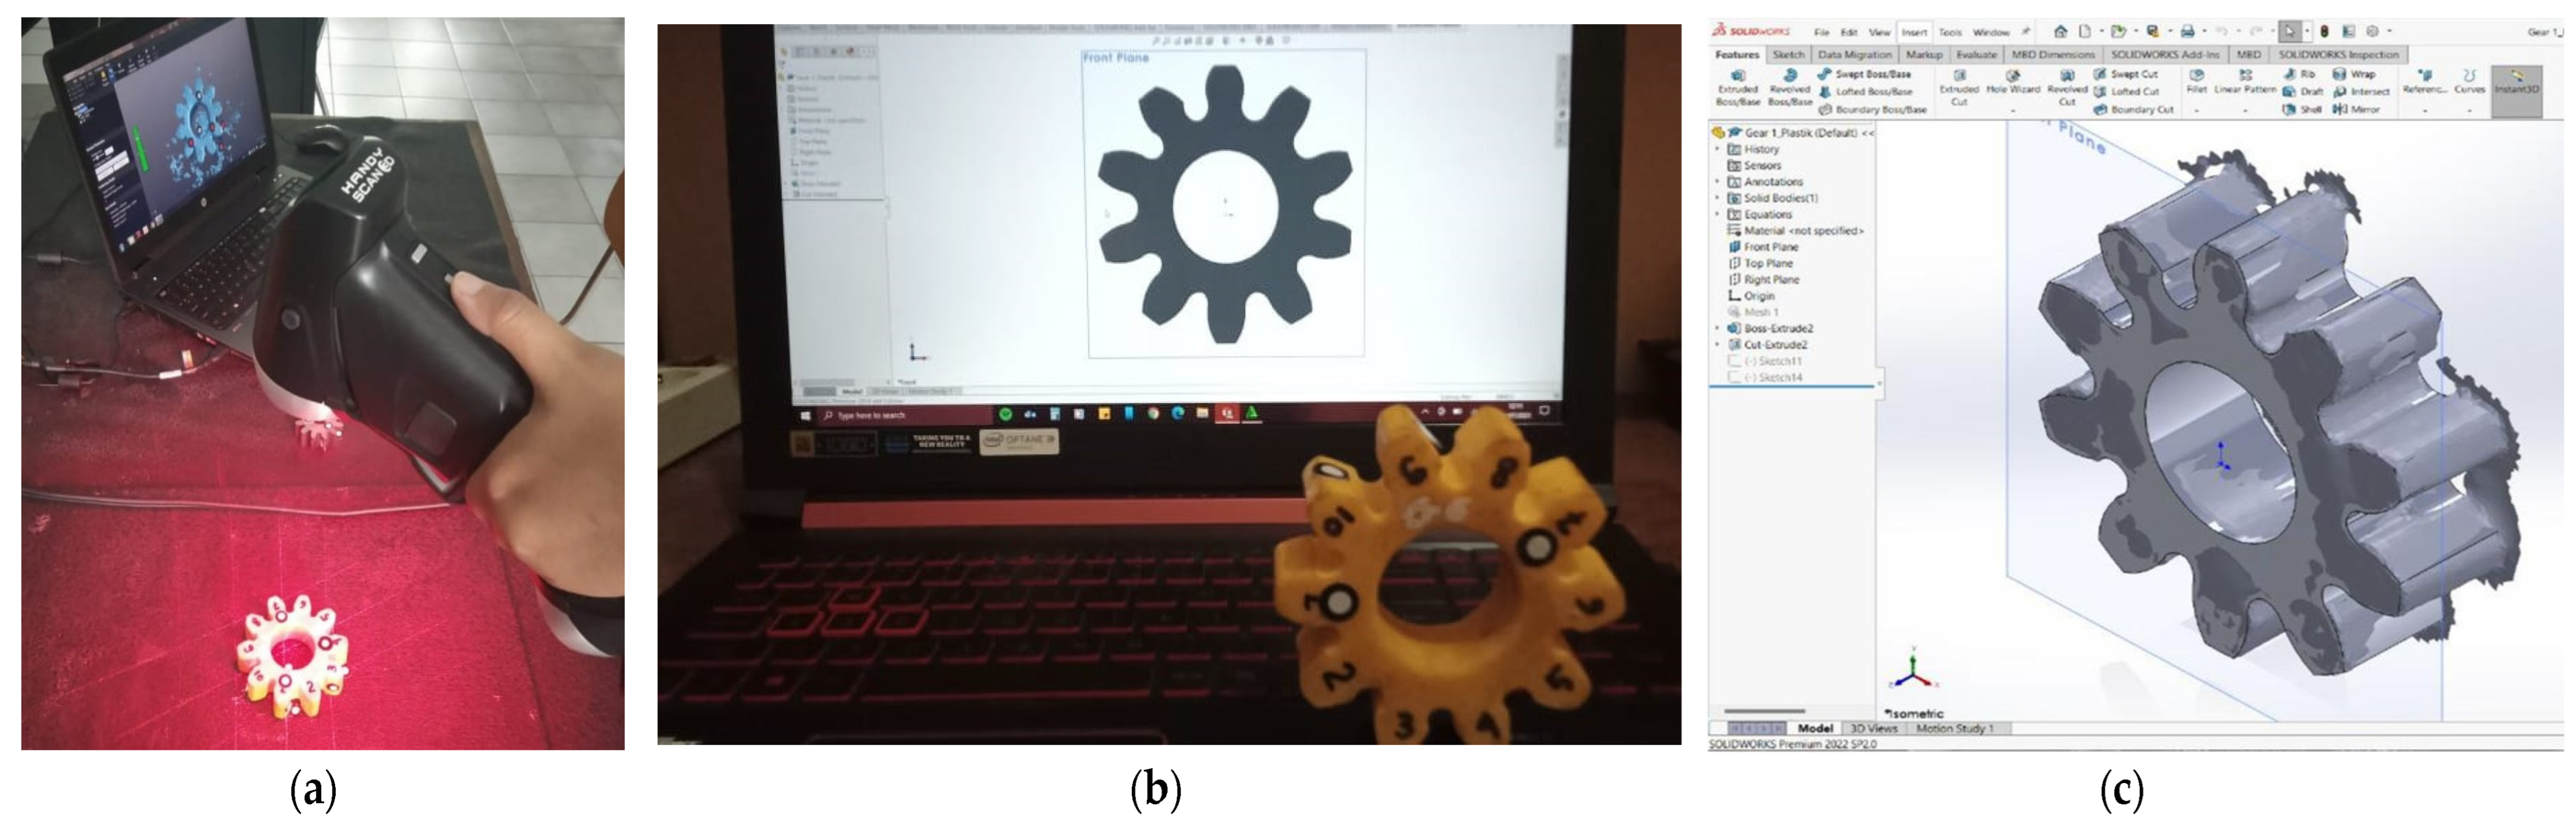
2.2. Gear Dimensional Measurement

In this study, measuring gears was done in three steps: measuring gear patterns, measuring gears after they were cast, and measuring gears after they were finished. By keeping an eye out for dimension changes like shrinkage and expansion brought on by liquid contraction during chilling and solidification, the examination of dimensional defects will be carried out. The gear is then finished using a wire-cutting procedure to determine the tooth profile’s dimensional accuracy. The most important areas for inspection are at the intersection of the addendum circle diameter, tooth thickness, and pitch circle diameter, where they are concentrated along the line of action or close to the pitch points where rolling and sliding contact often occurs [12]. It is as shown in Figure 3.
Gear geometry measurements in this study used the Creaform HandySCAN 3D Laser Scanner (Figure 4). Creaform HandySCAN 3D is a tool that can measure dimensions with an accuracy of 0.025 mm and volumetric accuracy of 0.020 mm + 0.040 mm/m. It also has a measurement resolution of 0.025 mm and can handle parts with a 0.05−4 m size range. Moreover, the scanned data is recorded in the SolidWorks® part (SLDPRT) file type so that SolidWorks software can operate it, as shown in Figure 4c. Each tooth profile area’s measurement points were obtained three times, and the average value was then determined.

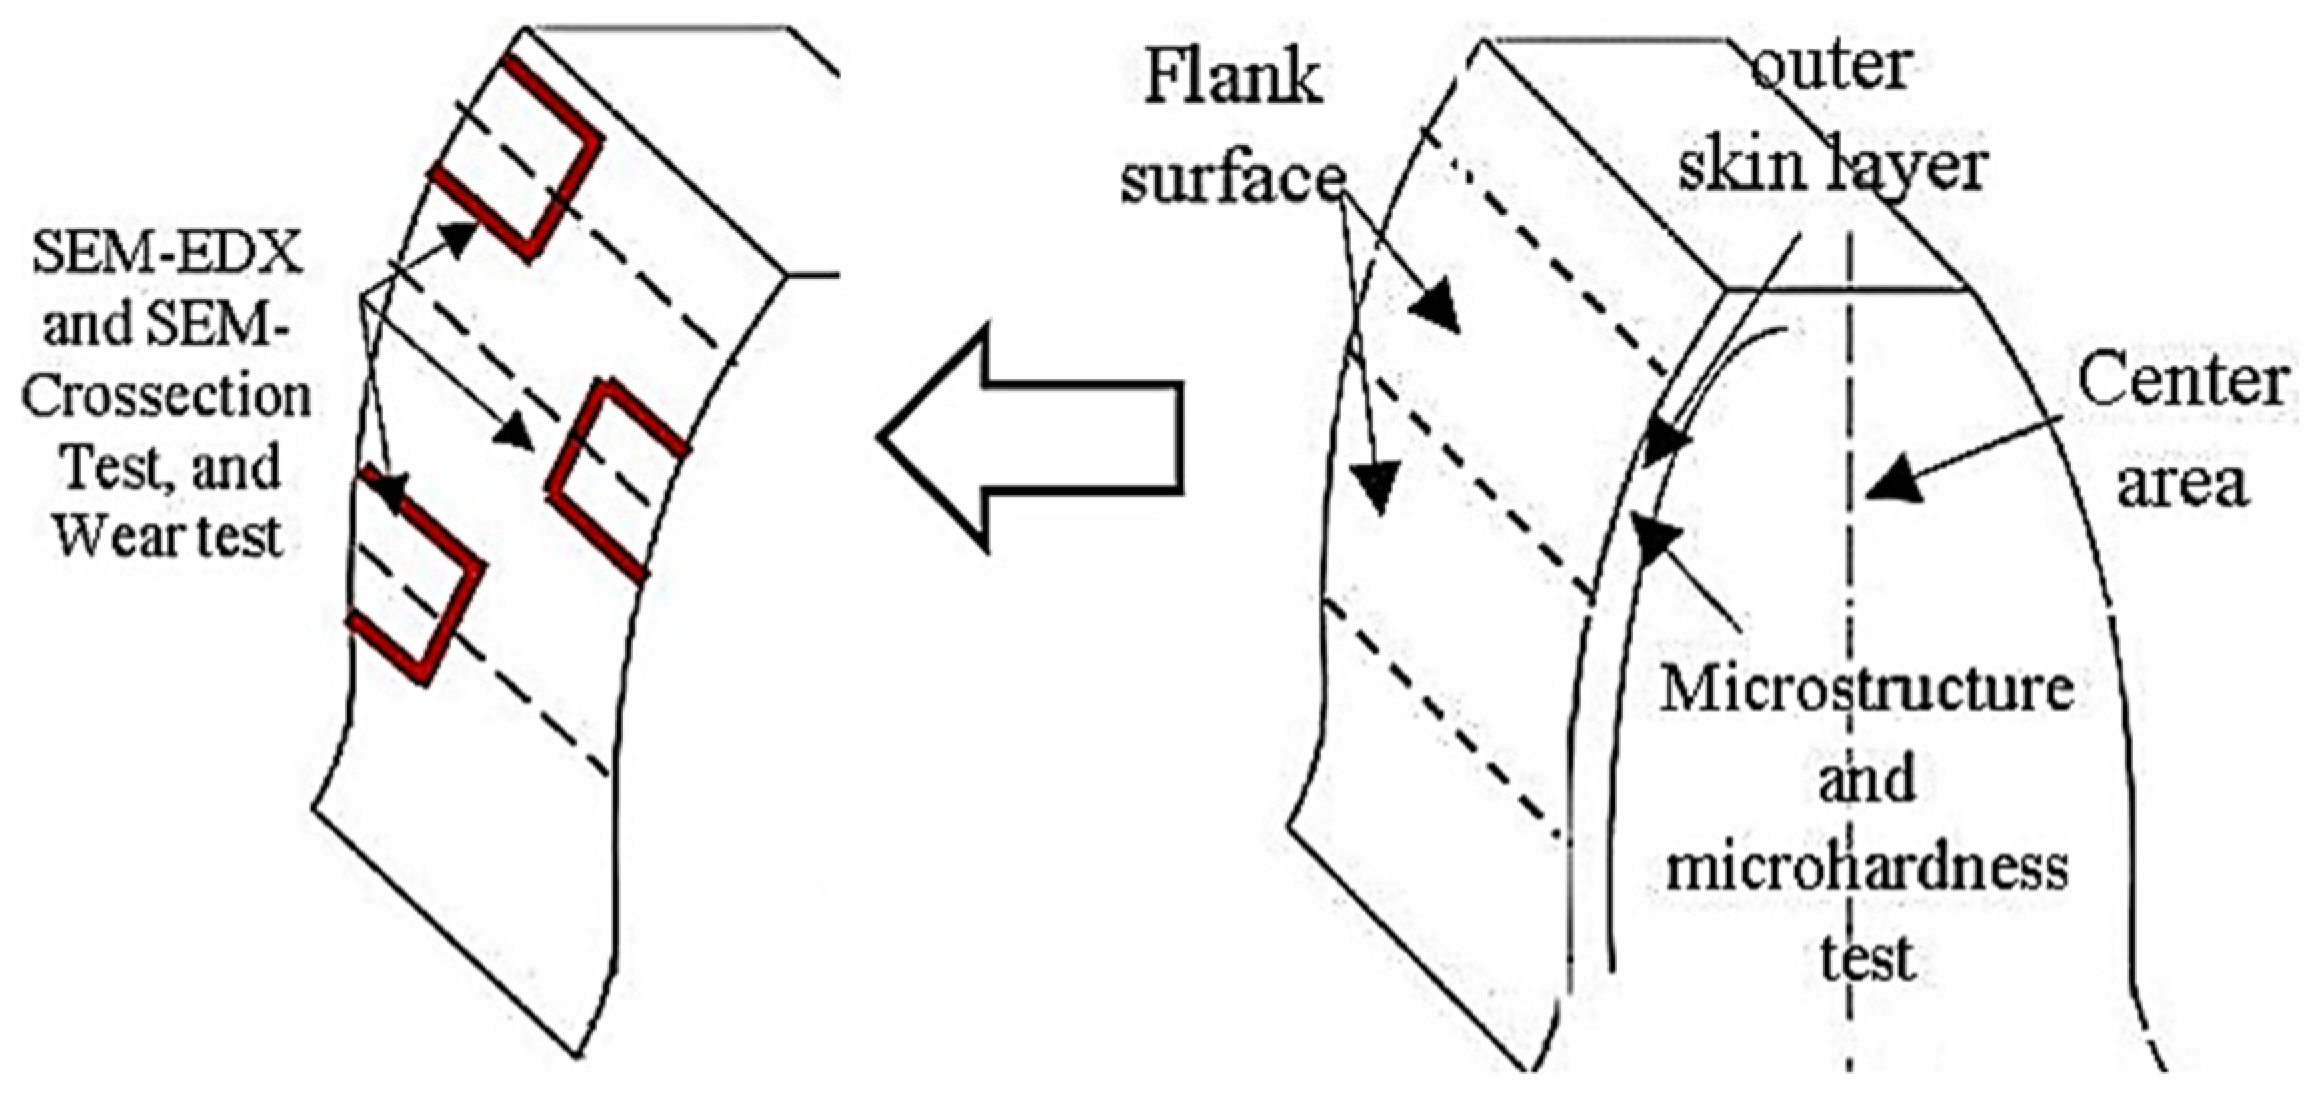
2.3. Microstructure Testing

Figure 4 represents the three teeth (T1, T4, and T8) that were cut out of each gear sample for testing. The 0.3 mm fine sandpaper was used to polish with an alumina and water solution before being polished with a soft towel.
The sample is immersed for 4 s in a solution of 98% ethanol and 2% picric acid before being washed with water. Standard metallographic techniques are used in this procedure [63]. For usage in macrophotography, a digital microscope with a CMOS image sensor, a focal range of 15–40 mm, and an image resolution of up to 640 × 480 pixels is required. At the areas of the gear profile depicted in Figure 5, the thickness of the surface layer was measured at a zoom range of 50×–1600×. The thickness of the surface layer was calculated using the Hi-View setup, version 1.4 (2019). For microstructural evaluation of the center and outer skin layers, an OLYMPUS BX41M optical microscope was utilized.

2.4. Scanning Electron Microscope-Energy Dispersive X-ray (SEM-EDX)

Scanning electron microscopy (SEM) and EDX were utilized to determine the elements dispersed on the coating’s top surface by a 20 kV accelerating voltage. The ferro-chromium-carbide (FeCrC) formation’s thickness will be measured using the SEM cross-section test [64]. Figure 5 shows the area chosen for this study, which has a sample size of 3 × 3 × 3 mm.

2.5. Microhardness Testing

A Vickers hardness tester was used to measure the microhardness in the chill-coated area. A Buehler MMT-7 microhardness tester under a load of 200 g was used. From the surface of the skin’s outer layer to its middle, the hardness value is separated from 0.1 to 0.6 mm. The left and right flanks of the tooth are where the micro hardness test points are located, but for each position of the left and right flanks, three points are located at the outer skin layer of the pitch point, three points at the first pitch point contact, and three points at the last point of contact.

2.6. Wear Test

The point of contact on the tooth surface flank, as shown in Figure 4, is used as a guide for cutting the gear teeth for the wear testing. The cut was made to produce a sample dimension with a size of 10 × 10 × 5 mm. Using the High-Speed Universal Wear Testing Machine with the type of OAT-U (Ogoshi wear test method) in accordance with the ASTM G99 standard, the wear characteristics of the chilled coating zone were examined [65]. The test object will experience frictional force from the 200 rpm rotation of a rotating disc, the 66.6 m sliding distance, the 3 mm width of the rotating disk, and the 2.12 kg test weight. Repeated contact between the surfaces as a result of the frictional contact will cause part of the material on the test object’s surface to be removed in order to determine the worn area’s volume using the wear testing requirements [66]. The amount of wear on the tooth flank surface is calculated using the friction trace’s magnitude. Additionally, the wear scar can be examined using a 200× optical microscope for analysis.

3. Results and Discussions

3.1. Photographic Analysis

Photographs of the gears obtained in this study reveal a thick layer of gray on the surface of the tooth flank that varies, especially those related to the point of last touch, the first pitch point, and the pitch point contact (Figure 6).
The gray area found on the gear surface indicates the formation of a hard layer after the chill casting process (black arrows). The image’s results show a very thin layer, a light gray region with an average thickness of 0.2 mm, was found in the outer skin layer of the G2 gear sample, as shown in Figure 6a–c (yellow arrows). The cold plate with a thickness of 0.2 mm in G2 results in a very fast cooling reaction rate on the surface between the cast specimen and the mold wall. This is in contrast to the gear samples using chill plates with a thickness of 0.4 mm (Figure 6d–f) and 0.6 mm (Figure 6g–i), which show wider light gray areas. The widest light gray layers formed on the gear sample G4 (Figure 6g–i) with a spacing of 3 mm.
According to the findings of this study, increasing the thickness of the chill plate results in a wider hardening region on the gear surface since the cooling rate is very low. The thickness of the chill plate can have a significant impact on the surface hardening process. In surface hardening, a chill plate is used to rapidly cool the surface of a workpiece, which leads to the formation of a hard, wear-resistant layer on its surface. The thickness of the chill plate affects the cooling rate, which will determine the hardness and microstructure of the hardened layer. A thicker chill plate will provide a slower cooling rate, which can lead to a more homogeneous microstructure and a more uniform hardness distribution in the hardened layer. This can be beneficial in applications where the workpiece needs to retain its toughness and ductility [67,68,69].
On the other hand, a thinner chill plate will provide a faster cooling rate, which can lead to higher hardness in the hardened layer [69]. This can be beneficial in applications where high hardness and wear resistance are the primary requirements. In general, a thicker chill plate will result in deeper hardness penetration into the material. This is because a thicker chill plate will conduct more heat away from the surface of the material, allowing for more time for the surface to harden and leading to a deeper depth of hardness. Furthermore, slower cooling rates will result in deeper hardness penetrations, while faster cooling rates will result in shallower penetration [67,68,69].

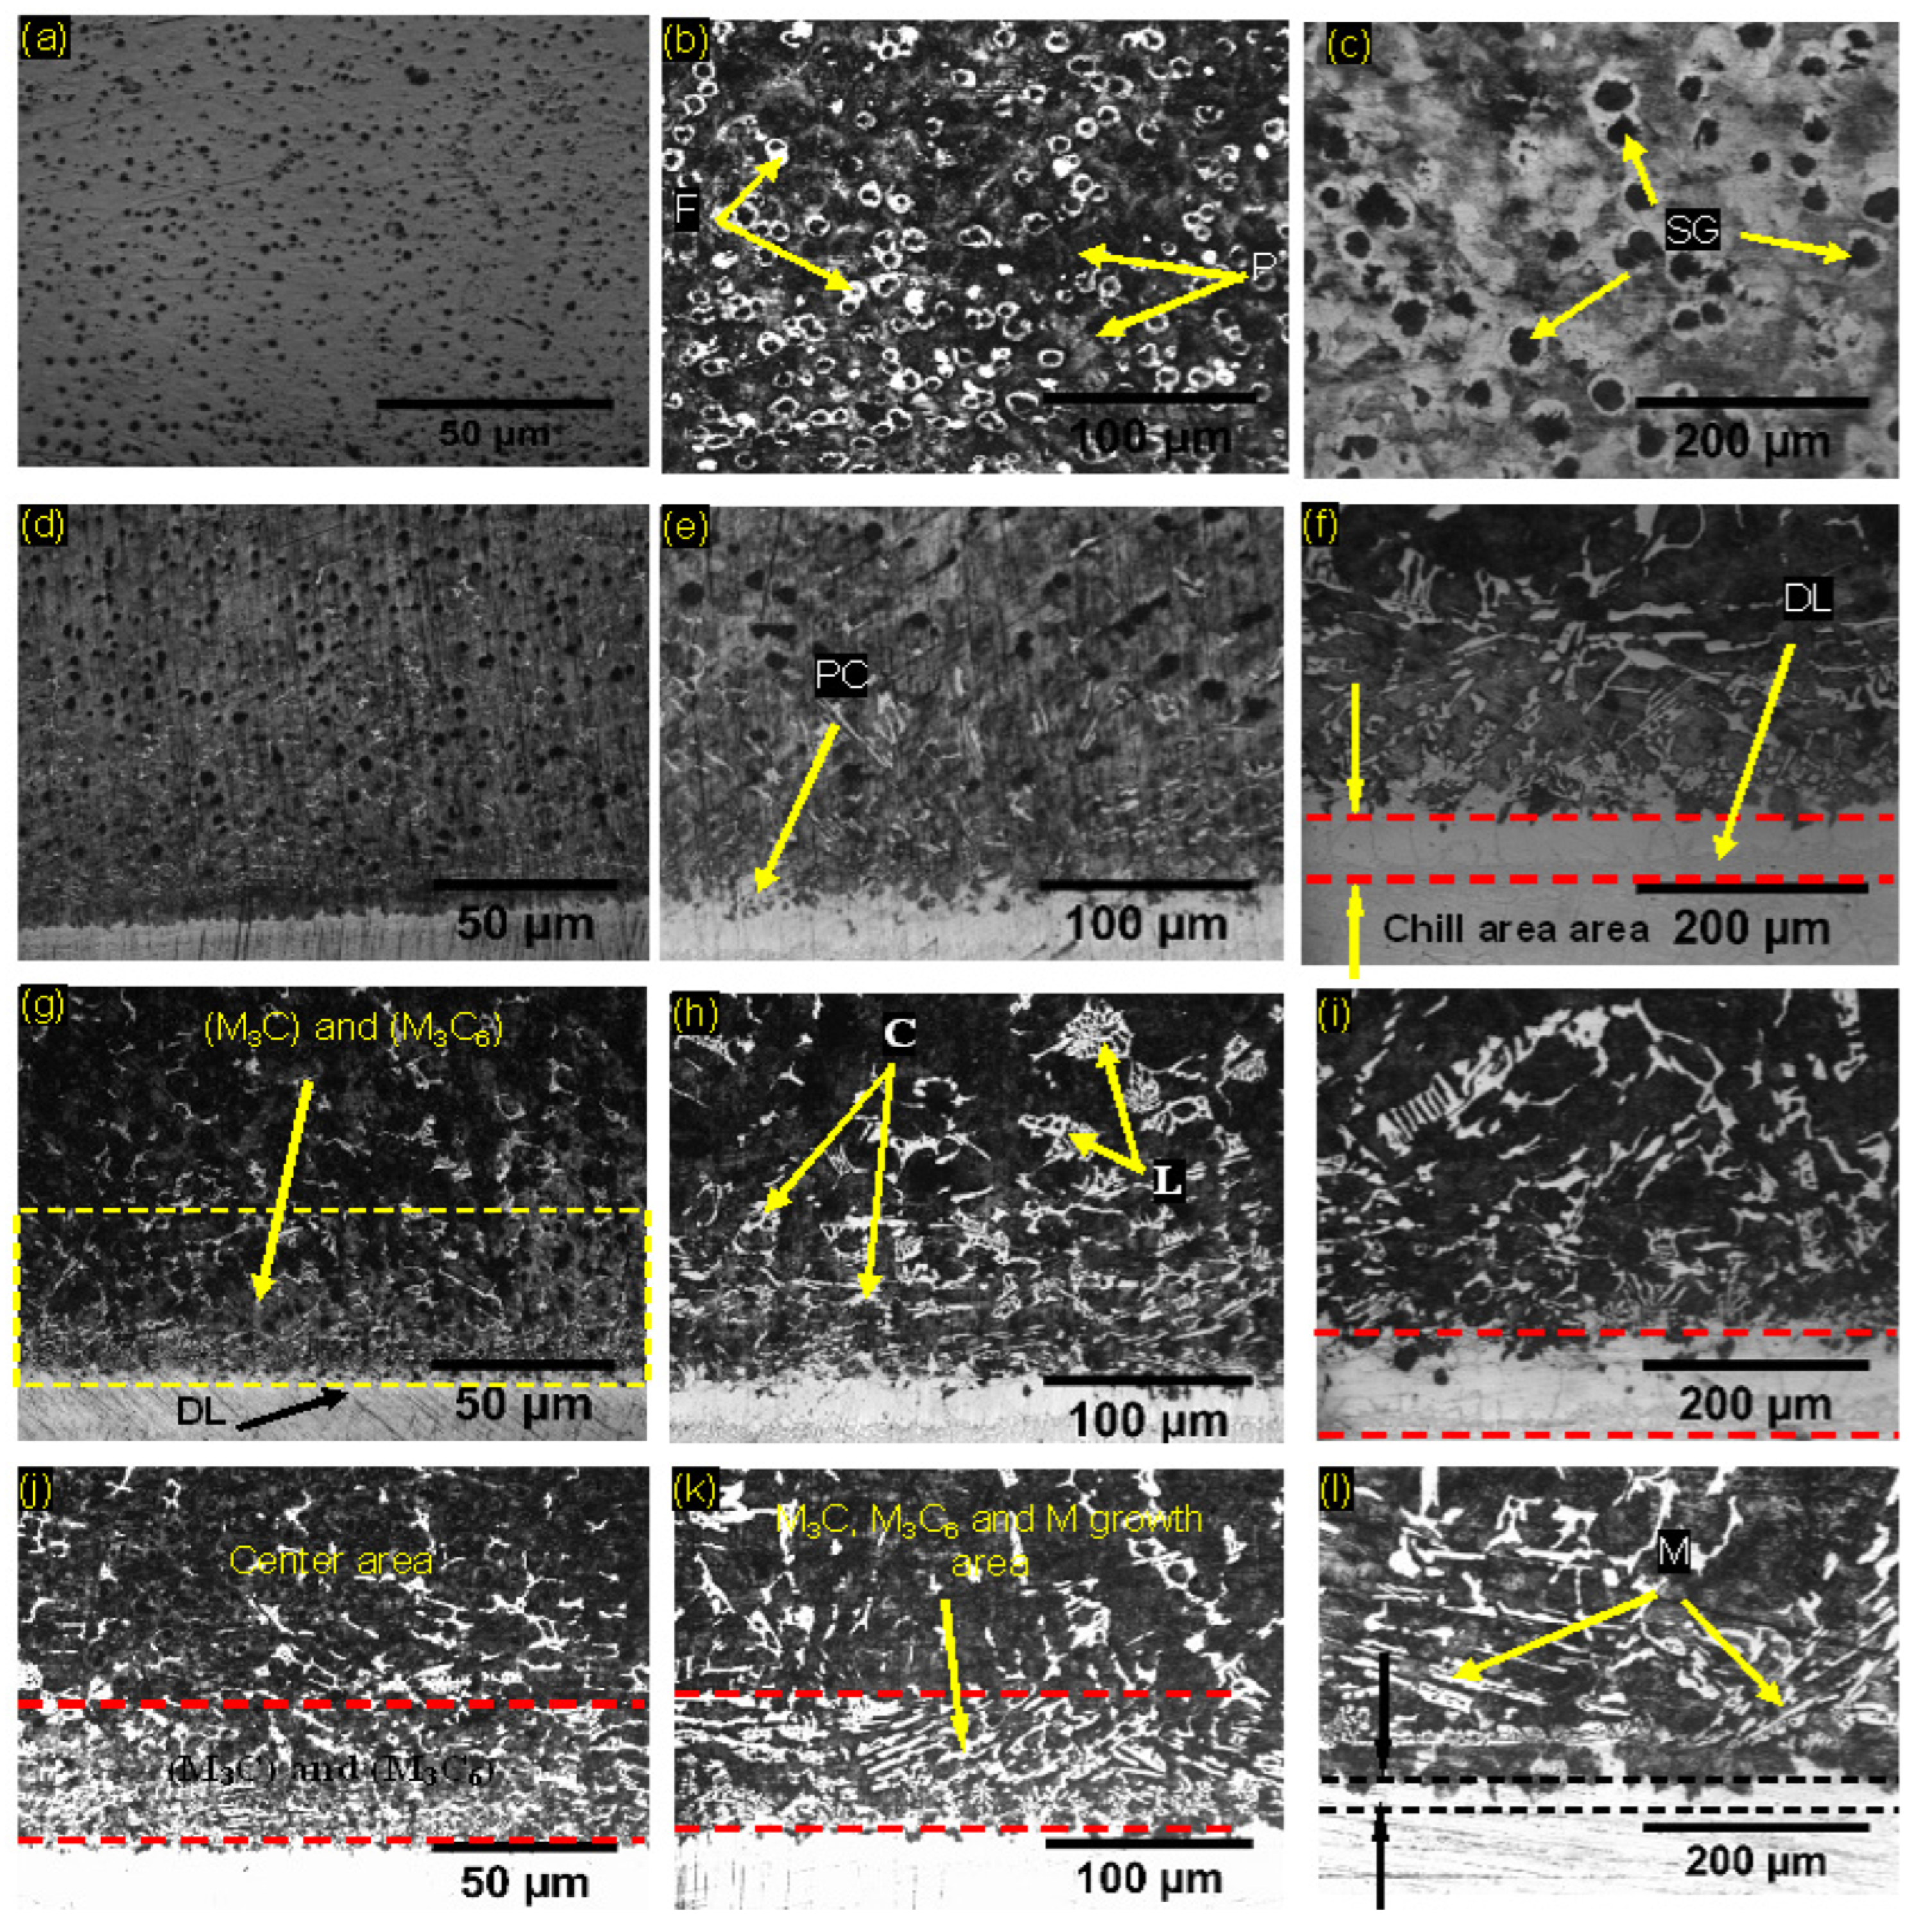
3.2. Microstructure and Chemical Composition Analysis

Microstructure and chemical composition studies were performed in the central area of all gear samples after surface hardening using chill in the casting process. In this study, the chemical composition of the gear specimens is shown in Table 4. The chemical composition of gear specimens was tested using a spectrometer tool from WAS/PMI Master Pro, Germany, which has a serial number of S/N 13L0086.
A type of ferrite-pelitic ductile iron generated in this study in accordance with the ASTM A 536 standard is recommended for the production of wear-resistant parts such as rollers, pinions, gears, and slides [58]. Si elements have been shown in a related investigation to increase the quantity and size of graphite deposits [58]. If the SiC percentage in the charge is very high, it also affects the alloy’s compaction properties and the way that spheroid graphite deposits grow, which results in the surface developing a scaly shell. To obtain the correct shape of graphite, it is also necessary to manage elements like Mg, Ce, and a few other elements. When elements like Ti, Zr, and others have an impact on the growth of graphite nodules, cerium (Ce) works to protect them as does the presence of substances acting as carbide formers, pearlite stabilizers, or ferrite promoters, such as Cr, Ni, Mo, and others [70]. Figure 7b,c show that the graphite spheroid structure is surrounded by ferrite and pearlite phases in the middle part of the microstructure. The following criteria were used to classify it as a form of ductile iron: based on SAE J343, the D700 Typical Matrix Standard Microstructures [71].
The outcome of the microstructure that developed on the surface of all samples (G2, G3, and G4) measured from 1 mm to 4 mm from the outer skin layer to the center, as illustrated in Figure 7. The observation results show that in the cementite and ledeburite phases, near the chill-coated area, there is a ferro carbide structure M3C and M7C3. Chromium carbide ((FeCr)7C3) structure (Figure 7f) was found on the chill-coated surface, and it can be explained by the binary systems of iron-carbon and iron-chromium-carbon and the system ternary phase diagram by the fact that chromium has a strong affinity for carbon and stabilizes all carbides, including cementite [72]. Hence, with the formation of a very dense element of chromium in the area of the flank surface layer as a result of diffusion (Figure 7e,f). According to an earlier study, the preheating method used is what causes diffusion to occur at the interface [55,56].
The dendritic grain structure that always occurs due to the ledeburite phase is located between 0.3 and 3 mm in thickness apart from the diffusion site, where cementite and martensite structures predominate at the base, as shown in Figure 7j–l. The nature of the ledeburite phase is high hardness; this phase is formed when austenite transforms into cementite and pearlite on cooling [73]. The study findings are in line with those obtained by Dong Qi et al. [74]. In addition, there are the black, round particles, which are pearlitic-ferritic nodules of graphite. Sample G4 contains the region with a broader ferrous carbide phase, as depicted in Figure. This occurs because the chill plate thickness used in Figure 7j,k results in a relatively poor cooling rate. Moreover, as compared to samples employing a chill thickness of 0.2 mm and 0.4 mm, the diffusion layer’s thickness is thinner. As shown in Figure 7f, preheating a sample of G3 with a chill plate thickness of 0.4 mm made the diffusion layer bigger. This made it possible for the chill plate to reach the austenite temperature and form a metal carbide with the M7C3 structure on the gear surface.

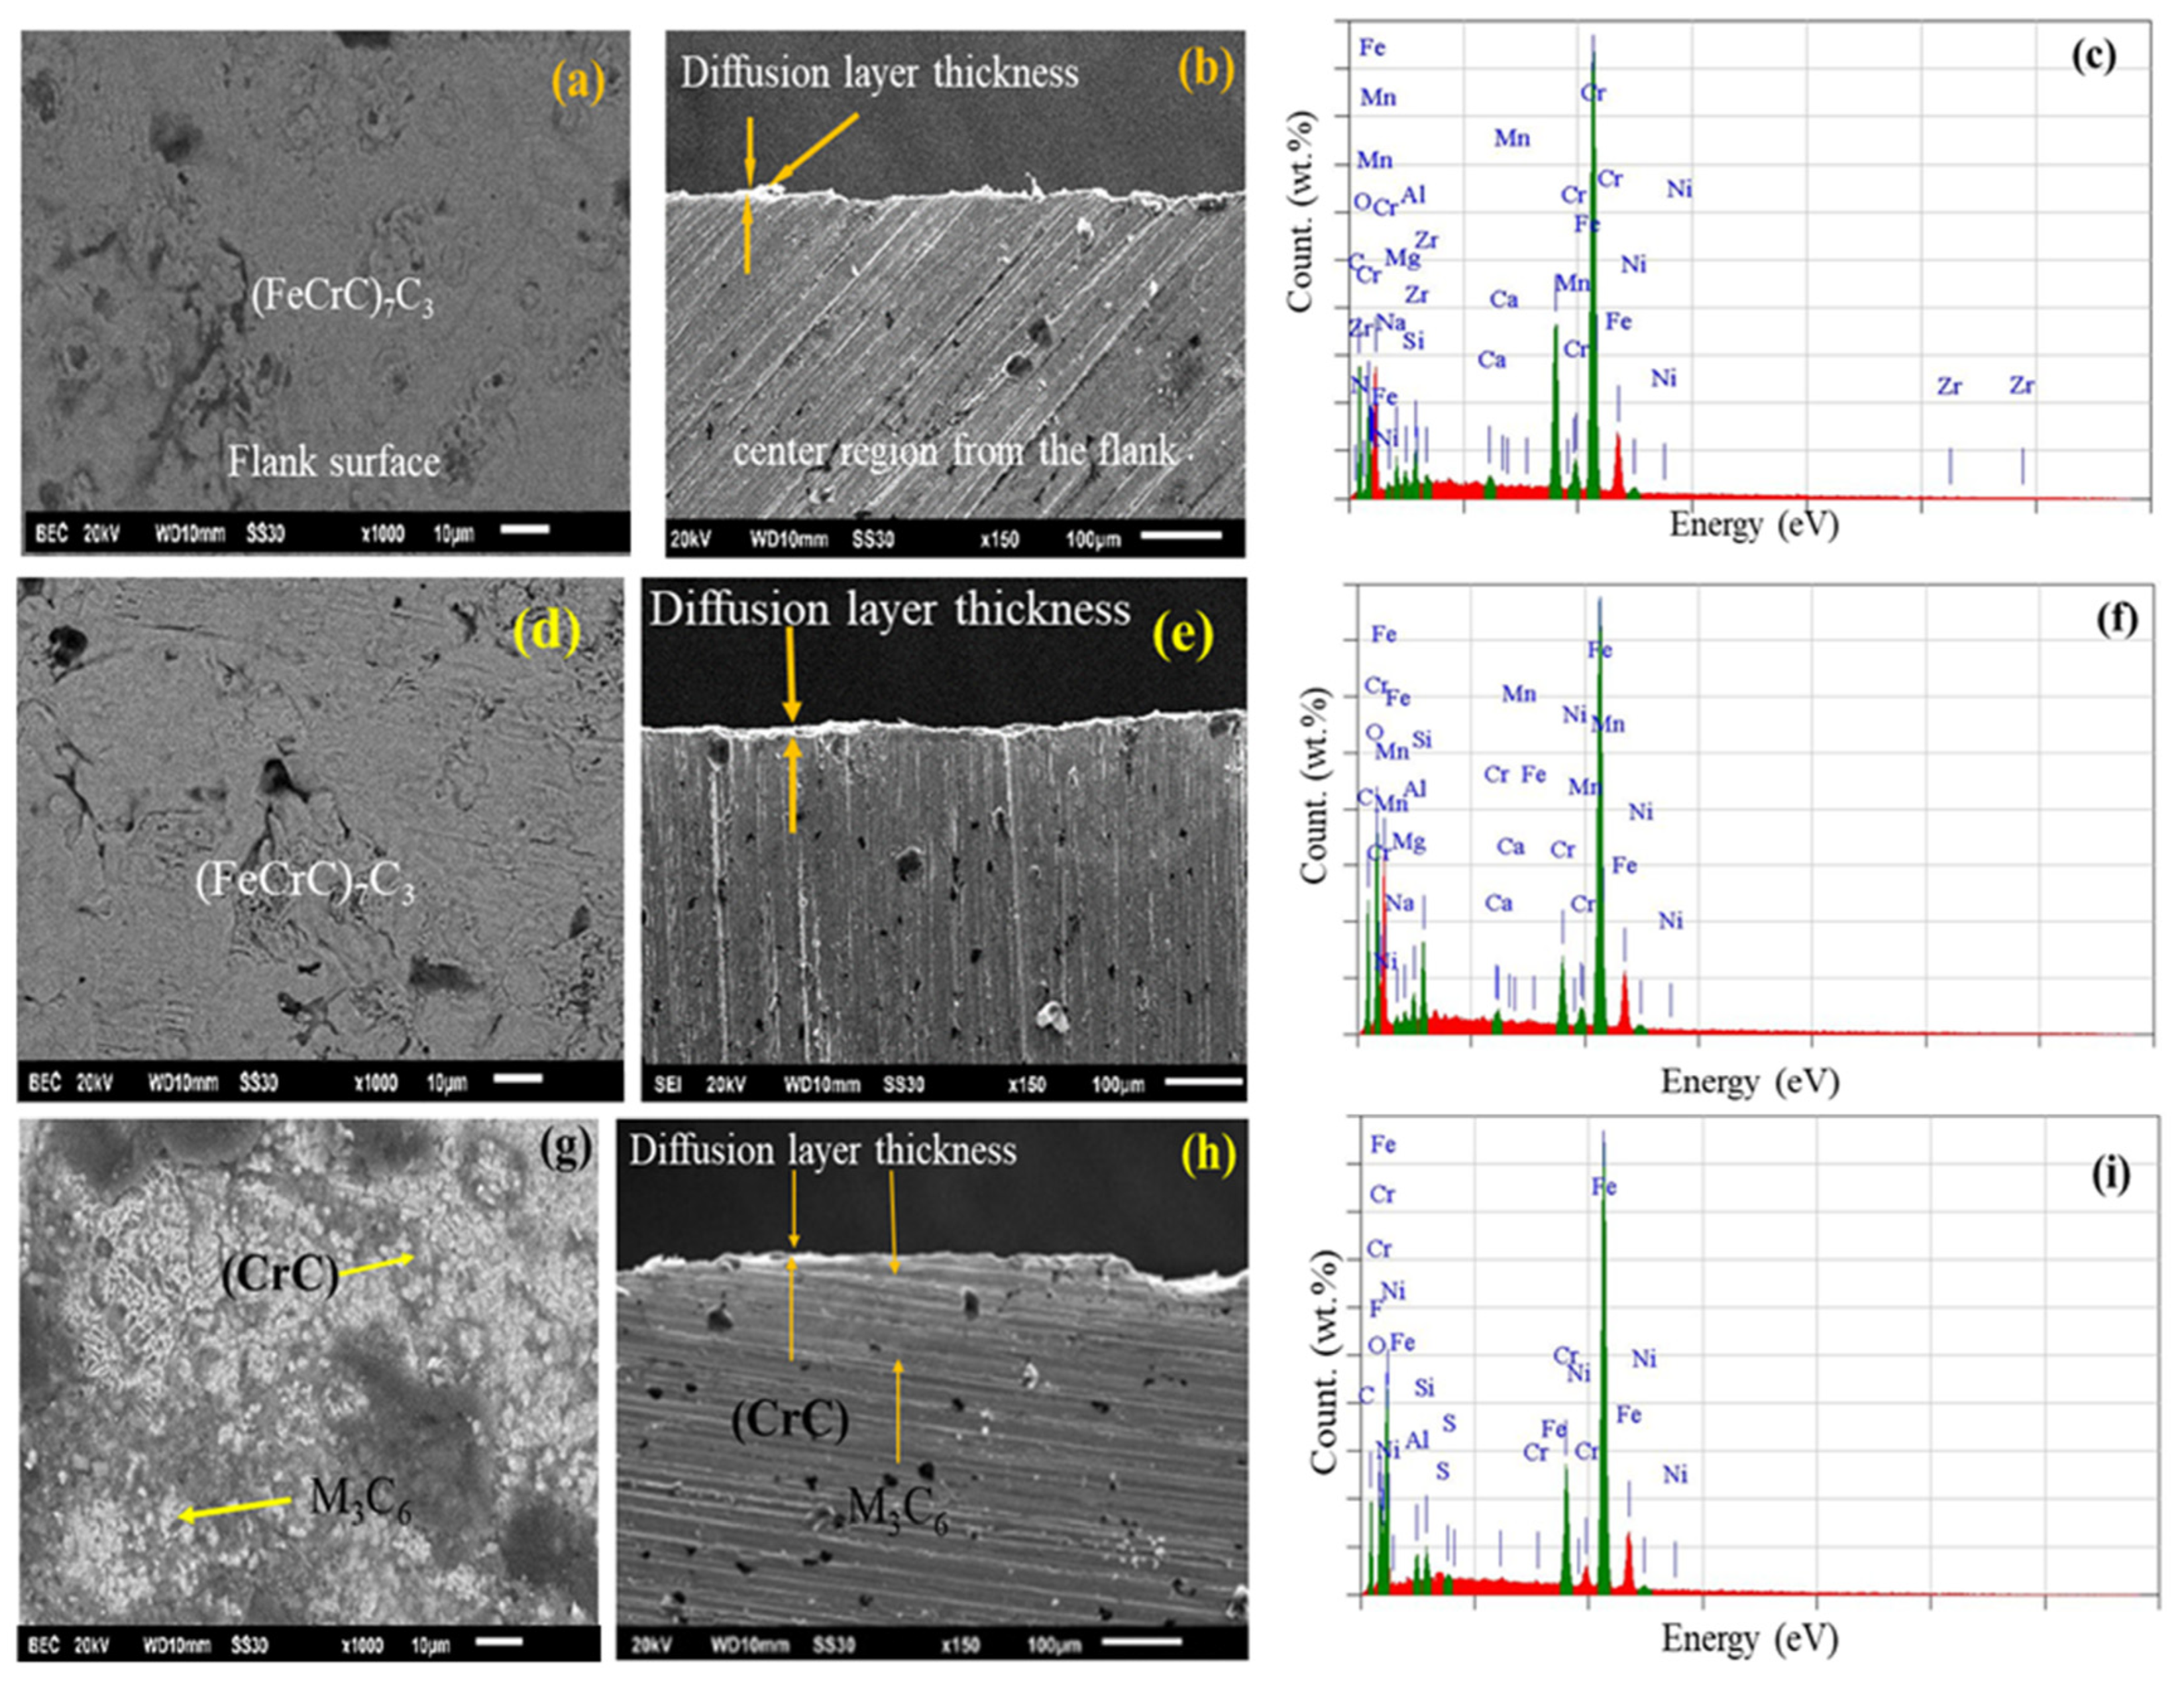
3.3. SEM-EDX Analysis

The results of the EDX SEM testing on samples G2, G3, and G4 are shown in Figure 8. Figure 8a,d,g show the flank surface topography after diffusion on samples G2, G3, and G4, respectively. Figure 8a shows the results of SEM EDX detecting the matrix structure in the diffusion region, which is (FeCrC)7C3. The matrix structure created is (FeCrC)7C3 and M7C3 in the diffusion area, which can be observed in Figure 8d. Meanwhile, Figure 8g shows the formation of M3C and M6C3 matrices in sample G4. The findings of the SEM-EDX test demonstrate that the primary carbides are rich in chromium. The results of this investigation are consistent with those of studies by X.M. Meng et al. [75] and N.F.D.S. Guterres et al. [54,55,56].
In this study, the ImageJ software was utilized to determine the average diffusion thickness. Figure 8b,e demonstrate that the mean diffusion thickness in G2 and G3 is 0.1 mm and 0.2 mm, respectively, while Figure 8h displays that the average diffusion thickness in G4 is very thin. The findings of this study are similar to the research conducted by Rusdi Nur et al. [61]. The SEM-EDX revealed that only 11.18% of the mass of chromium had been deposited on the flank surface of the G4 sample and that ferrous carbide structures had grown on the surface in the range from 0.3 mm to 3 mm (M3C and M6C3). Table 5 displays the elemental content on the flank surface of the samples following chilled casting. The element in the gear sample that uses the chill thickness of 0.2 mm for the G2 sample is diffused and dominated by Cr, with a total chromium value of 13.91% in the flank surface area. In comparison to the tooth’s center, the chemical element Cr increases on the flank surface. It was also found that other elements such as Mg and Mn were 1.31% and 0.74%, respectively. The hardness and wear resistance will shift to higher levels in the presence of chromium and nickel components [76].
The dispersed element in the G3 sample is dominated by chromium until it reaches 14.40% on the flank surface. Nickel (Ni) content increased to 1.97%, and other elements, including silicon (Si), were also discovered. In comparison to the gear sample employing a cold thickness of 0.2 mm, the Cr element developing on the flank surface was higher. Decreasing the chill plate thickness from 0.6 mm to 0.2 mm increases the cooling rate. By using a thicker chill plate, the cooling rate of the surface layer is reduced, which limits the amount of diffusion that can occur [77]. The quantity of elements that are diffused is relatively small using a thicker chill. A poor metallurgical bond results from the preheating temperature not reaching the austenitization temperature for the solid portion transformation of the chromium element. As previously reported in research, this extra diffusion deposited chromium grains into the flank surface to create ferro chromium carbide, but at high temperatures, it fractures the surface [75]. Moreover, preheating can alter the percentage value of the chemical composition on the surface with the cold coating.

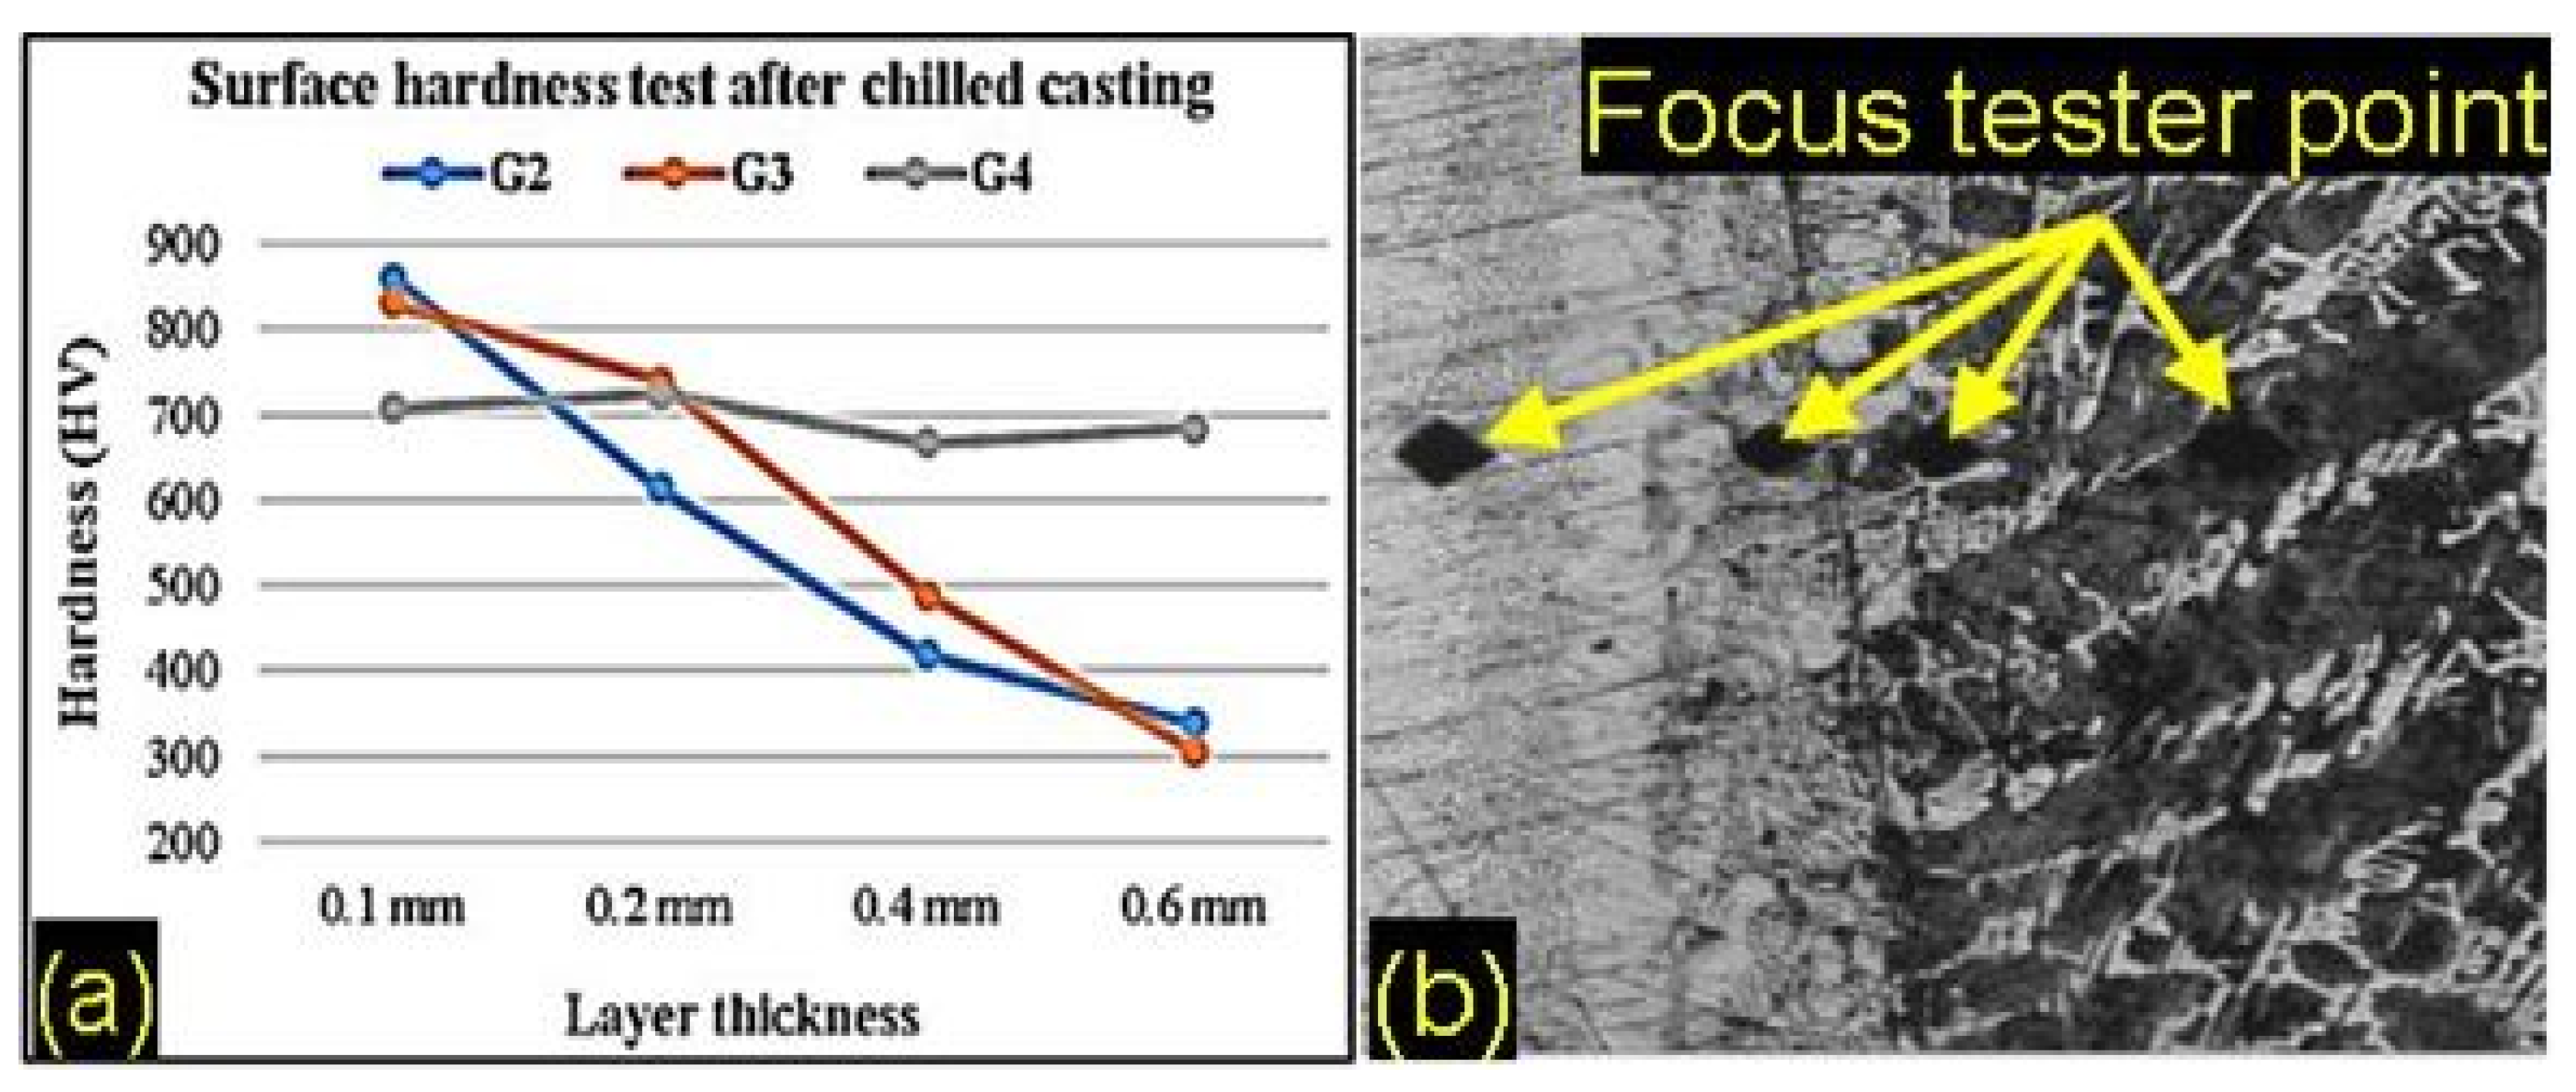
3.4. Microhardness Analysis
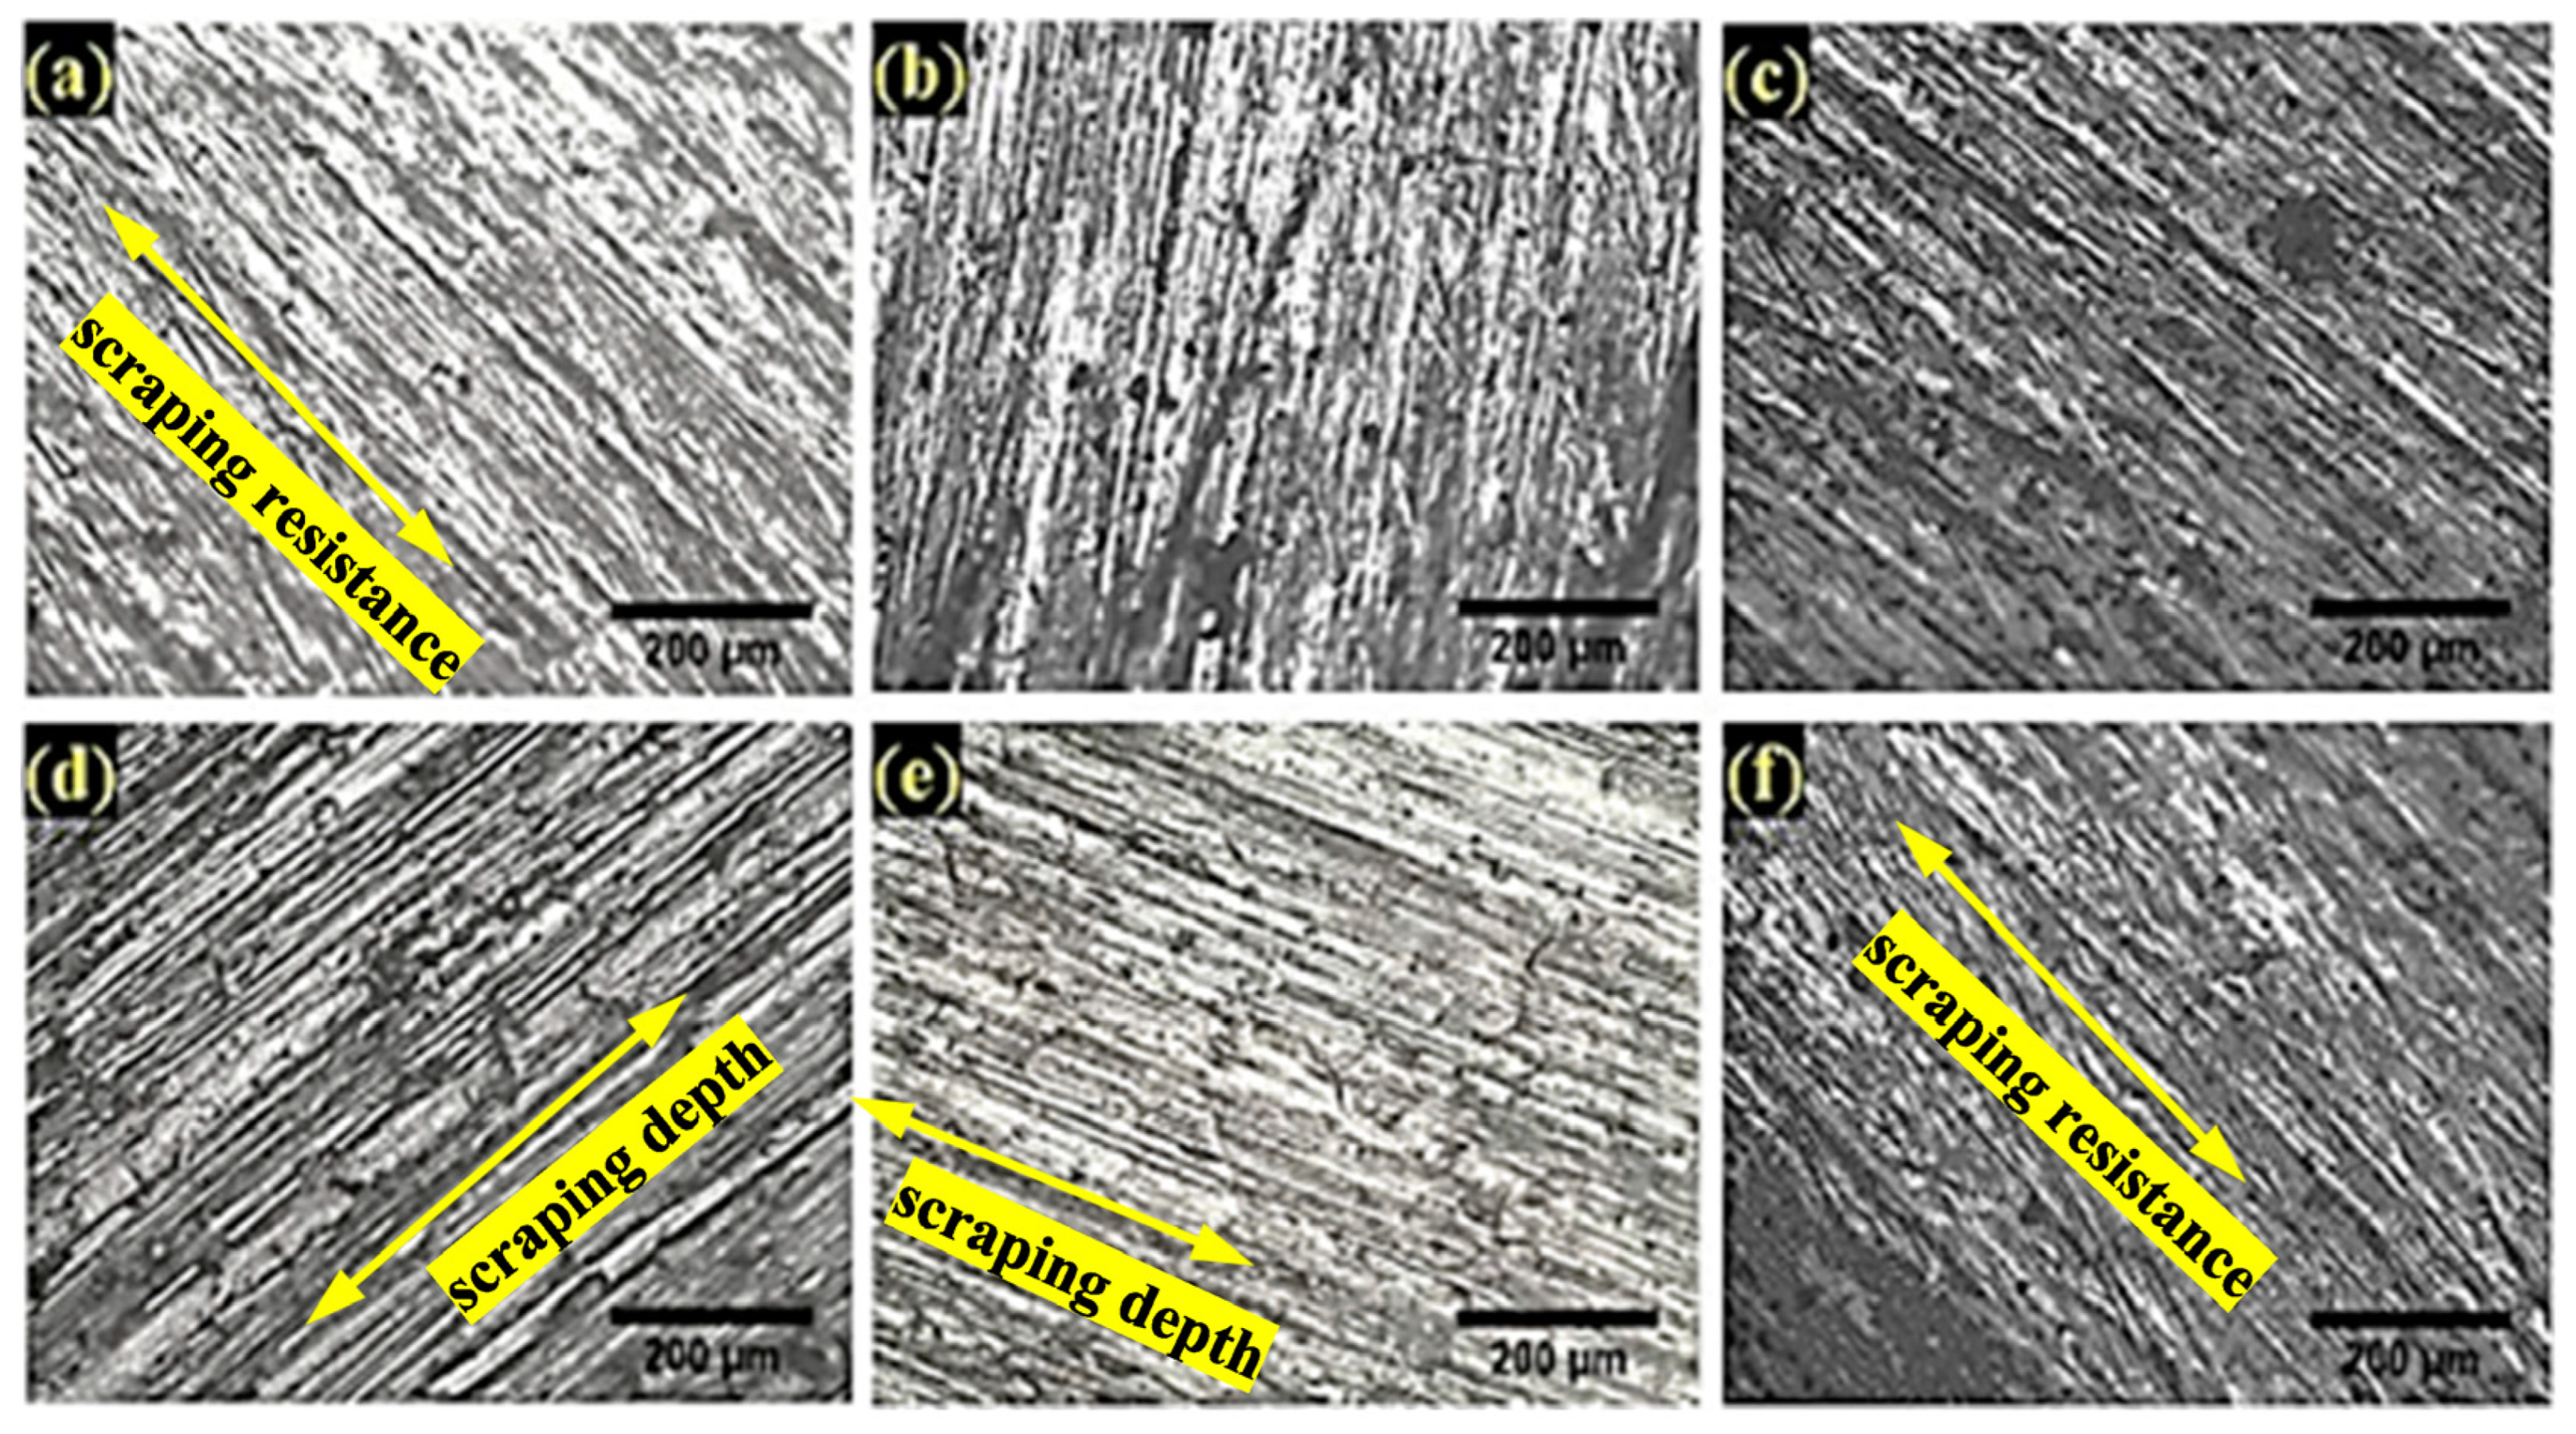
The microhardness test is crucial for analyzing the hardness behavior of the cold coating layer present along the gear tooth surface, particularly on the surface’s outer skin layer. Figure 9 displays the outcomes of the gear sample hardness test. The distance between the central area and the outer skin layer during the hardness test is between 0.1 and 0.6 mm. Sample G2 has the highest hardness value at the test point of 0.1 mm. At this point (0.1 mm), the hardness of G2, G3, and G4 is 861.20 HV, 831.13 HV, and 708.10 HV, respectively. The thinner the chill plate used, the faster the cooling rate, and thus the higher the microhardness produced on the material’s surface. The findings of this study are consistent with those of Ojha et al. According to the findings of their study, specimens with a cooling rate of 20 °C/s had a higher hardness value than specimens with a cooling rate of 10 °C/s [78]. The finding of this study shows that the thickness of the chill plate can have a significant effect on the hardness of the material being surface hardened. Generally, a thinner chill plate will result in a faster cooling rate, which will produce a harder surface layer. This is because a faster cooling rate will cause the austenite to transform into martensite, which is a harder and more brittle phase.
A thicker chill plate, on the other hand, will result in a slower cooling rate, which will produce a softer surface layer. This is because a slower cooling rate will allow more of the austenite to transform into ferrite and pearlite, which are softer and more ductile phases.
The flank surface, which is composed of chromium carbides scattered in a martensitic matrix, has been discovered to have a higher surface hardness than the outer skin layer as a result of the matrix structure in the chill-coated area. These findings are consistent with those of Cardoso et al. [79]. The solubility of Cr atoms in M3C increases with preheating temperature, which leads to lattice distortion and affects the value of the element Cr diffused to the flank surface uniformly. However, part of the transformation into M7C3 with better hardness, as described in related studies, also plays a role [80]. Additionally, the flank surface has a higher nickel value, which is why the CrNi is intended to harden during cooling in the mold at the same time the carbide picks up some Cr and transforms into M3C with the same shape and an increased hardness value [80].
The ferrous carbide phase grows as a result of the rapid cooling rate brought on by a chill, and the average hardness value for all samples is 700 HV. However, this rapid cooling rate only occurs with thicker chill plates; conversely, as the preheating temperature and cooling rate increase, the hardness value will decrease, as shown in related research [54]. The sample gear used a chill thickness of 0.6 mm (G4), and this ferro carbide structure grows very broadly. It demonstrates that the highest hardness value is in the outer skin layer at a distance of between 0.1 mm and 0.2 mm from the surface, but the hardness value is decreasing as it approaches the center area, with the average hardness value falling to 201.05 HV. The outcomes of this hardness value are not significantly different from those of earlier investigations [55,56]. The average hardness value from this study is 745.98 HV. The standard from the American Gear Manufacturers Association (AGMA) specifies a hardness value on the gear profile of 58–60 HRC. So that the chill method for surface hardening of spur gears is suitable for use in gear casting [81].

3.5. Wear Analysis

The results of the wear test using the Ogoshi method on gear samples with different chill plate thicknesses are shown in Table 6. After the profile cutting has diffused, the Cr element value in the flank surface of the G2 gear sample is 13.91%, forming the structural matrix (FeCrC)7C3 and M7C3, and the average hardness in the diffusion area is 861.20 HV. As a result, the wear value is the specific value obtained, which is 5.197 × 10⁻⁶ mm2/kg. All teeth have the same small scratch marks, as shown in Figure 10a, that can be found in the chill-coated area. Due to the highly dispersed carbide grains in the matrix, the scratch scars are not deeper. Additionally, it is evident from this sample that the predominant wear process was plowing. Thin-coated samples were used in the investigation by M. Shamanian et al. because the cutting type of mechanism was more prevalent at higher hardness values [35].
The matrix structure of this material, which is a white cast iron structure, is ferro chromium carbide, and the skin layer is exceedingly hard and brittle.
Compared to the wear scratch marks on the G2 sample, Figure 10b demonstrates that the wear scar surface on the G3 sample, utilizing a chill thickness of 0.4 mm, is rough. The results of this wear value, which is 6.408 × 10⁻⁶, are not significantly different from those of earlier investigations [82]. These findings suggest that the abraded particle is very small due to friction. The wear scar is smooth because the surface flank is in a highly hard condition (831.13 HV), the matrix structure in the surface flank is dominated by (FeCrC)7C3), and the SEM-EDX results show that 14.40% Cr of diffused chromium is present. The distribution of hardness throughout the depth of the diffusion layer is more uniform than in the sample, which employed a chill thickness of 0.6 mm; this will be explained based on the results of this wear scar. It can be inferred that the eutectic ledeburite and cementite microstructures are relatively homogenous. This fact leads to the assumption that high hardness can result in higher wear resistance because, theoretically, metal carbide particles are hard due to strong M-C bonding forces in a structure where some carbon and chromium atoms are located in the formed octahedral gap by Cr, Ni, and Fe atoms, as explained by [26]. The wear analysis of the G4 sample is provided in Table 6. The wear scar on the surface is rougher than the wear scratch marks of the G3 and G4 samples. The scratches appear wide, and the specific wear value obtained is reduced by 4.901 × 10⁻⁶.
Figure 10c shows that the wear scars demonstrate how the wear resistance decreases with decreasing hardness values. On the surface of the G2 gear specimen after profile cutting, the cementite structure in the skin layer has been cut a lot by EDM cutting, so the wear scratches are very deep and look rough (Figure 10d). Figure 10e depicts the existence of wear on the surface of the G3 gear sample after the finishing process. The G3 sample is very hard, and after the profile cutting process, it has some eroded areas. The formation of an uneven cementite matrix structure is thought to be the cause of this condition. Figure 10f shows the wear traces that develop on the G4 sample’s surface after the profile-cutting operations. The material is difficult to erode in the middle because the surface of the middle layer is still hard. Because of the surface area exposed to slow cooling, this condition is expected to form a thick cementite matrix. The slow cooling rate is caused by the use of a chill thickness of 0.6 mm. A thicker chill plate will cool more slowly, resulting in a more homogeneous microstructure and a more uniform distribution of hardness in the hardened layer. Very deep scratches are produced by the exceedingly low dispersion of carbide inside the matrix. Iron carbide does not adequately shield the matrix, as has been shown in earlier experiments, so the abrasive particles come into direct contact with the soft matrix [83]. The low preheating temperature is the reason for this. Hence, it is determined that adding CrC to a cooled site to form a matrix structure increases hardness and wear resistance. It is true that the ferritic-pearlitic structures in cast irons can be more susceptible to the chromium carbide structure, as demonstrated in a prior work using austempered ductile iron [84,85].

3.6. Dimensional Change Analysis

The dimensions resulting from the resin gear pattern are measured and compared with the gears after the chill casting process and the gears after the finishing process. The measurements of the resin gear pattern’s dimensions can be seen in Table 7. Examination of flaws that develop after the gear specimen has been cooled from the chill casting process, specifically in the most crucial areas like tooth thickness, addendum circle diameter, and pitch circular diameter, shows that casting has caused a contraction or expansion of the tooth profile. As part of the casting process, the initial dimension measurement is made to ascertain how the gear’s dimensions have changed as a result of surface hardening.
Additionally, the second dimension is measured after the finishing process (cutting the tooth profile) is complete so that the dimensional accuracy may be assessed by looking at the error number. The error number is taken from the value of the benchmark gear measurement results minus the value of the gear measurement results after finishing the process with EDM cutting. A comparison between the benchmark gear and the gear after it has been cast can be used to display information on the effects of shrinkage or expansion problems. Additionally, the benchmark gear and the gear following the finishing process are compared using the data to evaluate the dimensional correctness. Moreover, all teeth are discussed to determine the tolerance value and error value so that the G2, G3, and G4 gear samples may be contrasted with the benchmark gear. In order to ensure that the dimensions are precise, the comparison aims to determine which chill plate thickness is appropriate for the surface hardening process utilizing the chill due to casting. The results of a graphic analysis [86] between the benchmark gear and the gear after completion will yield the error value, which can be represented as error bars with red and black colors. The error bars with red colors show the thickness of leftovers that have not been cut (expansion). In addition, the error bars with black colors show the cutting thickness over the dimensional limit.
Furthermore, the graph shows several error numbers with a minimum symbol (-) and red symbols and numbers, indicating the cutting of tooth profile thickness leftovers that have not been cut in the tooth thickness according to the benchmark gear, as opposed to black numbers and symbols (which do not have a minimum symbol (-)) indicating the cutting of tooth profile thickness over the dimensional limit in the tooth thickness according to the benchmark gear.

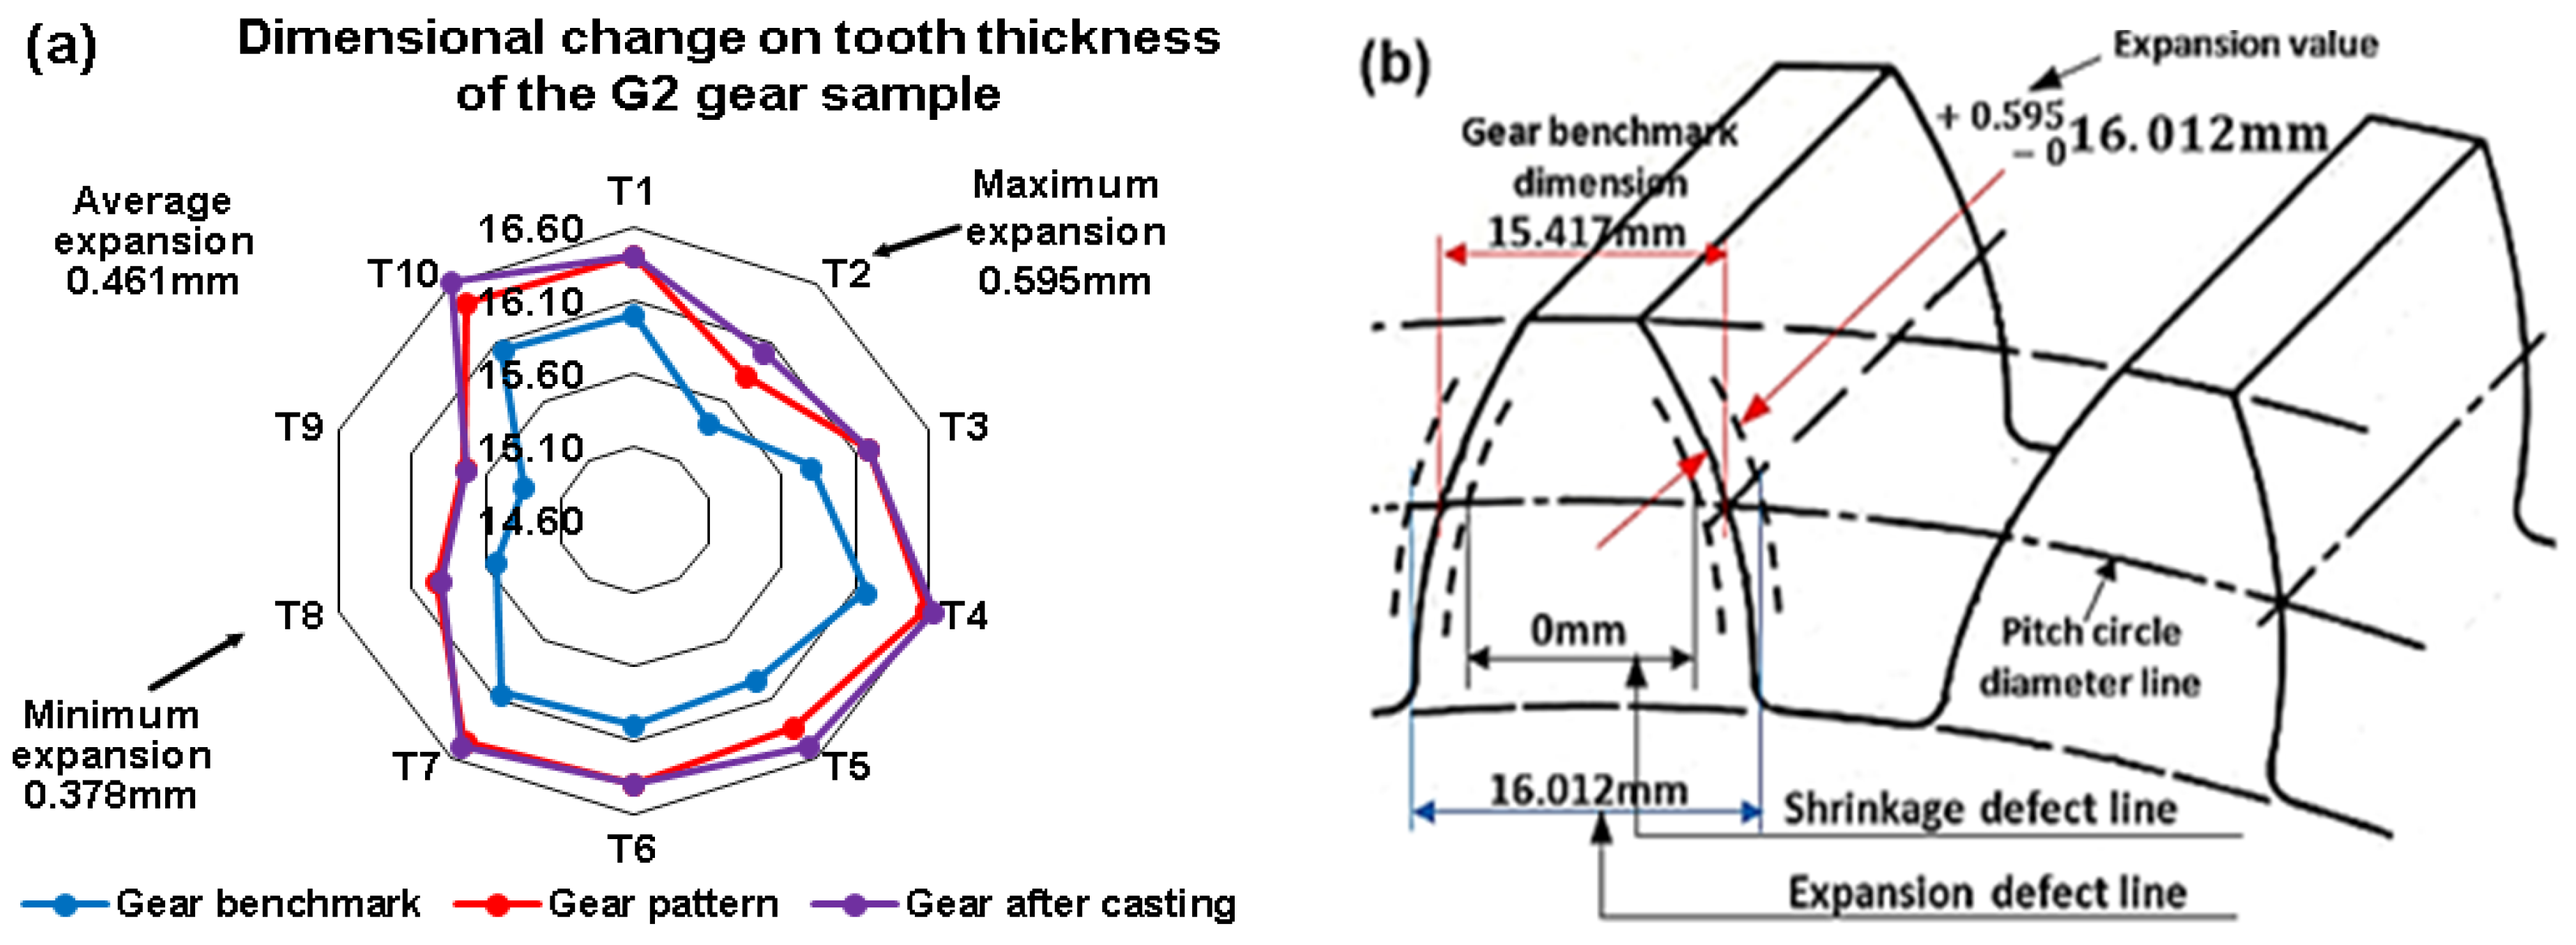
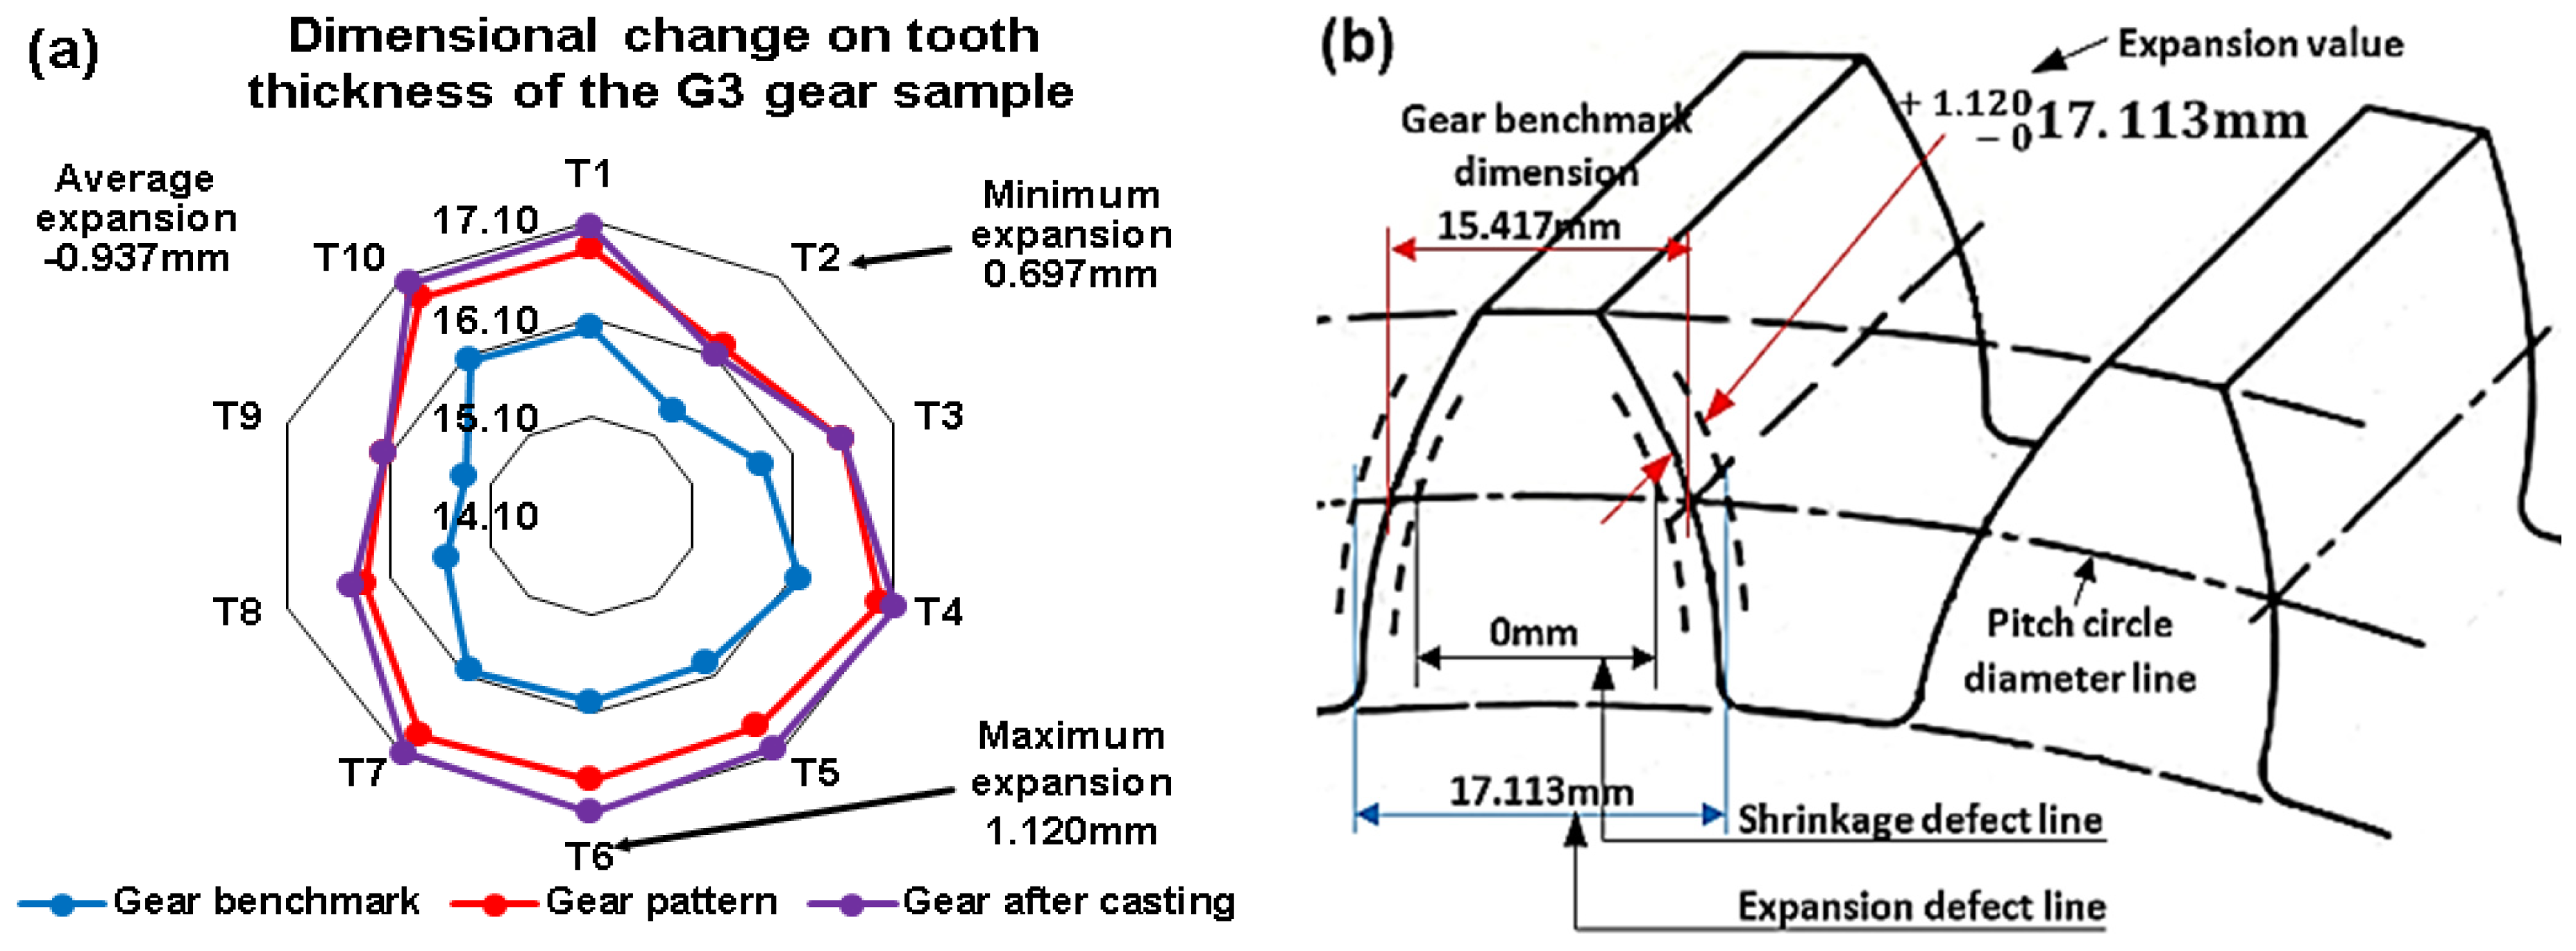
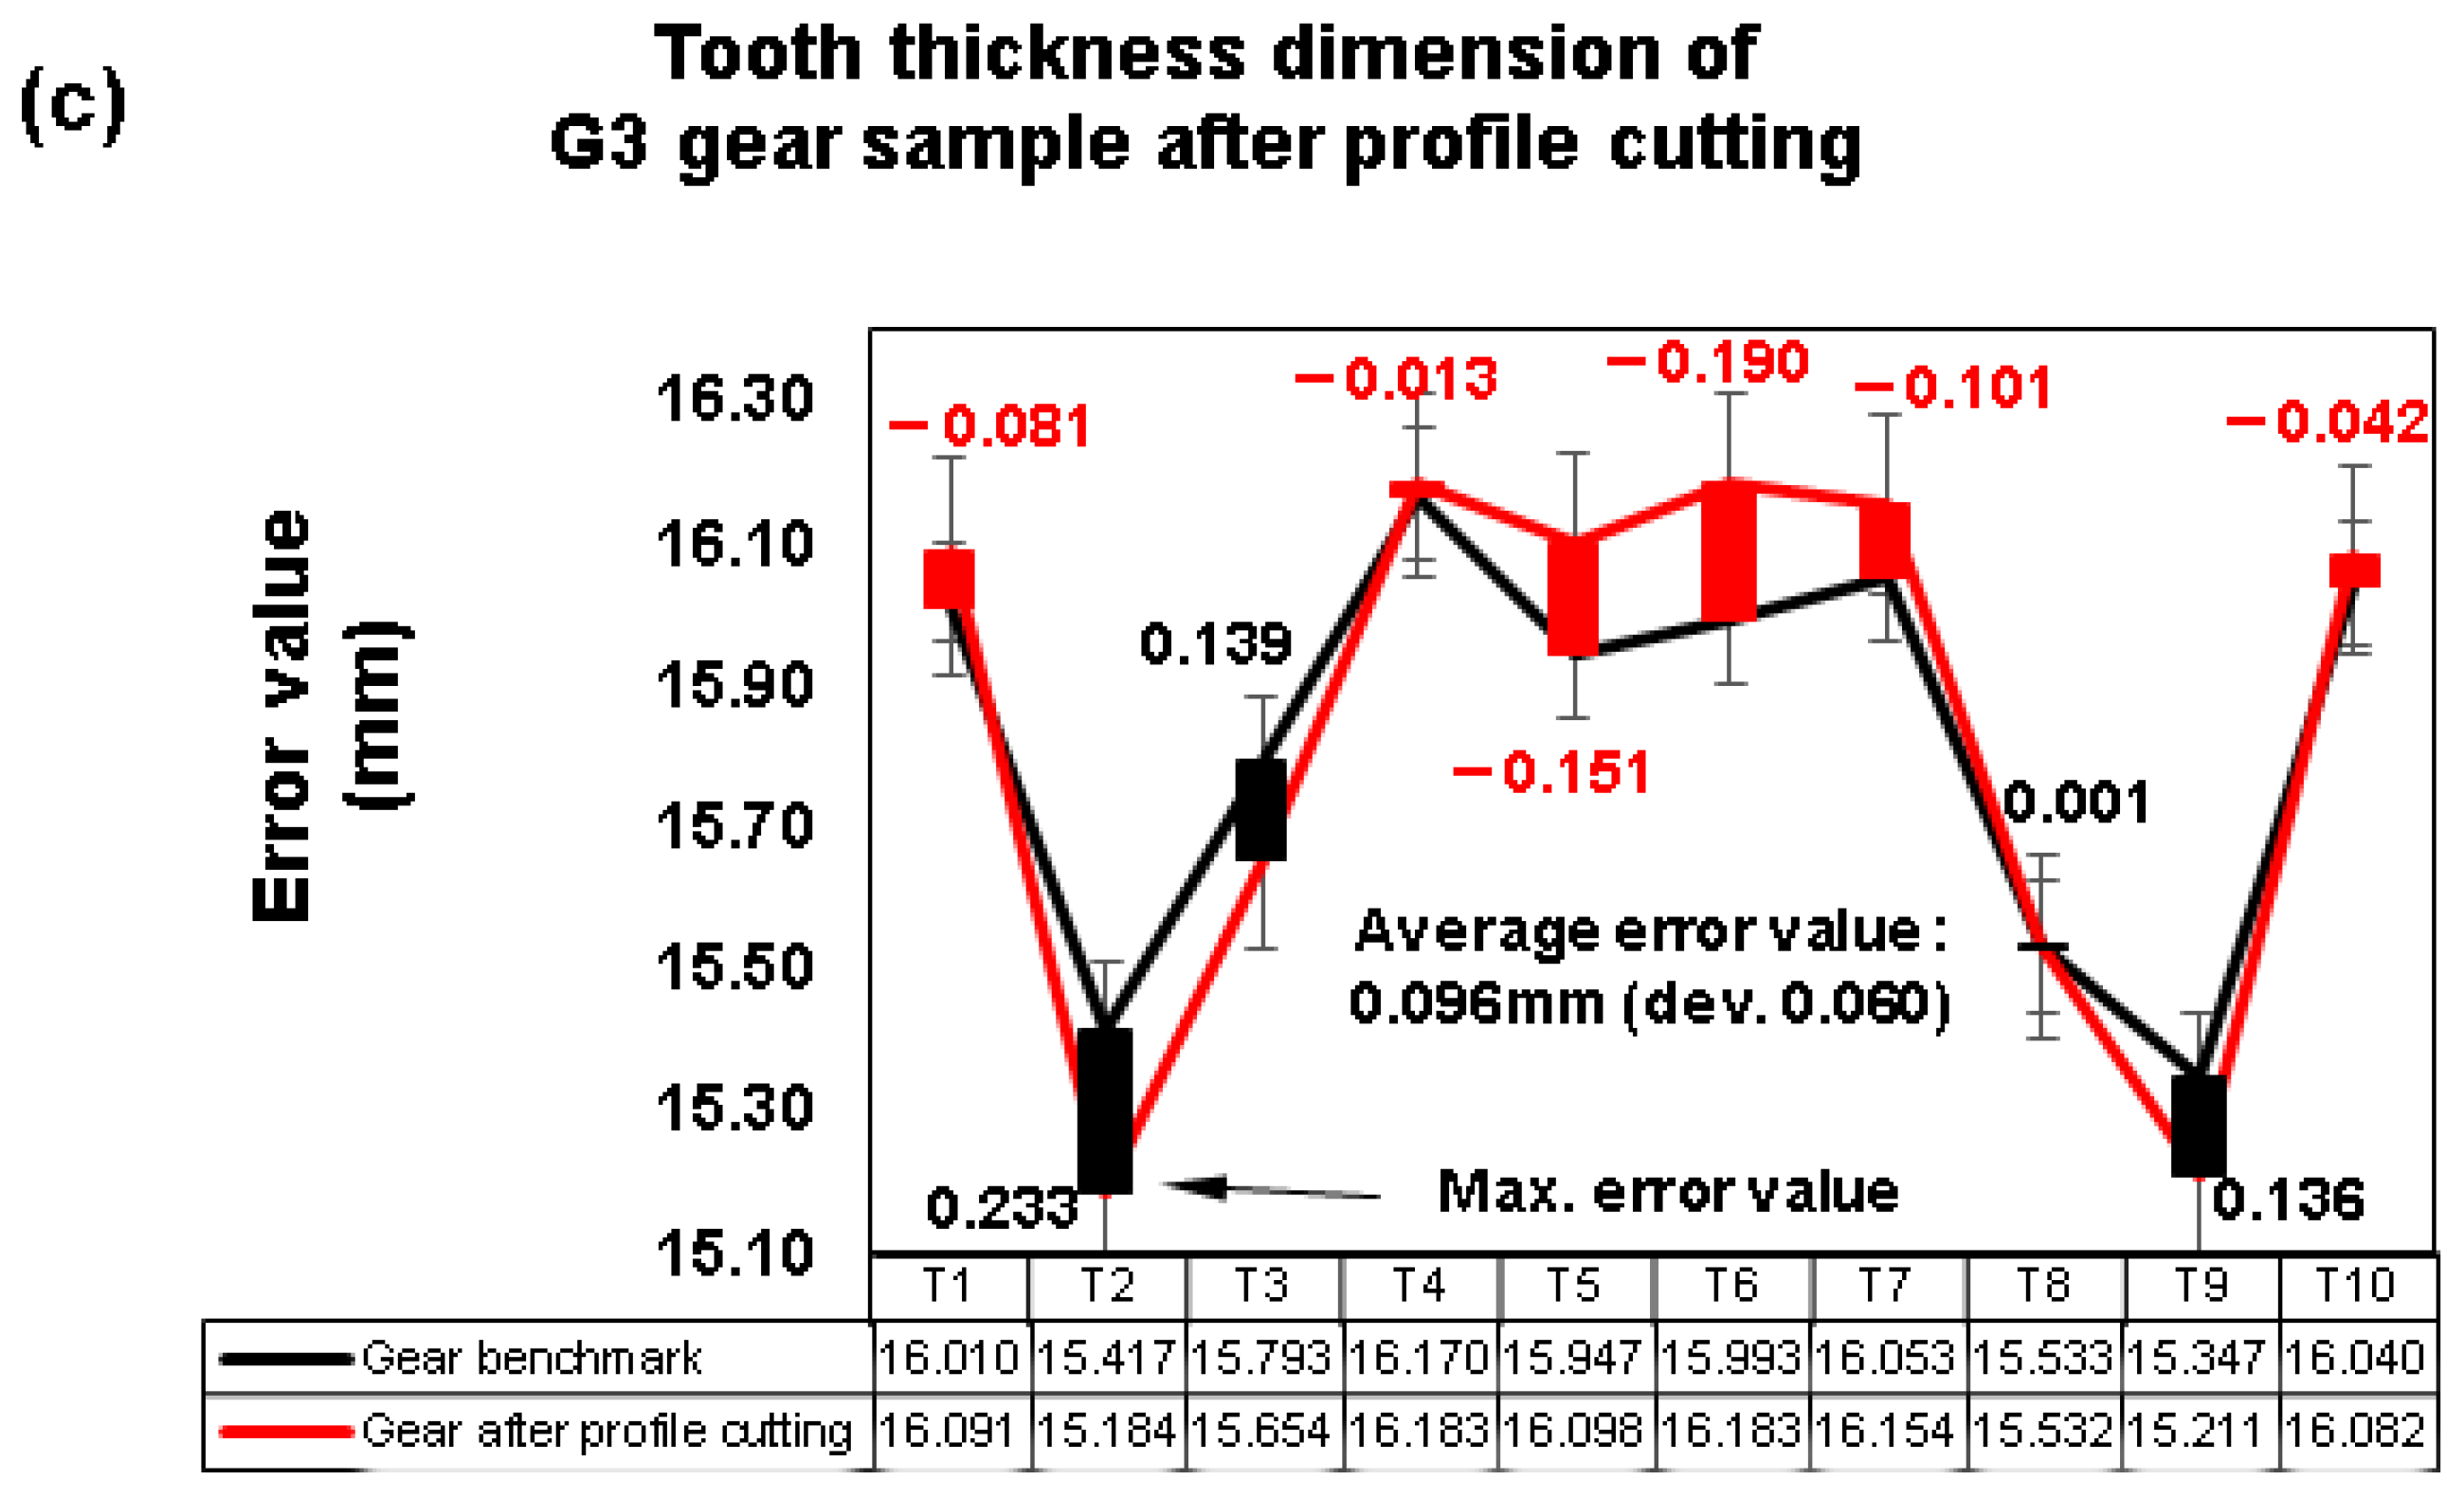
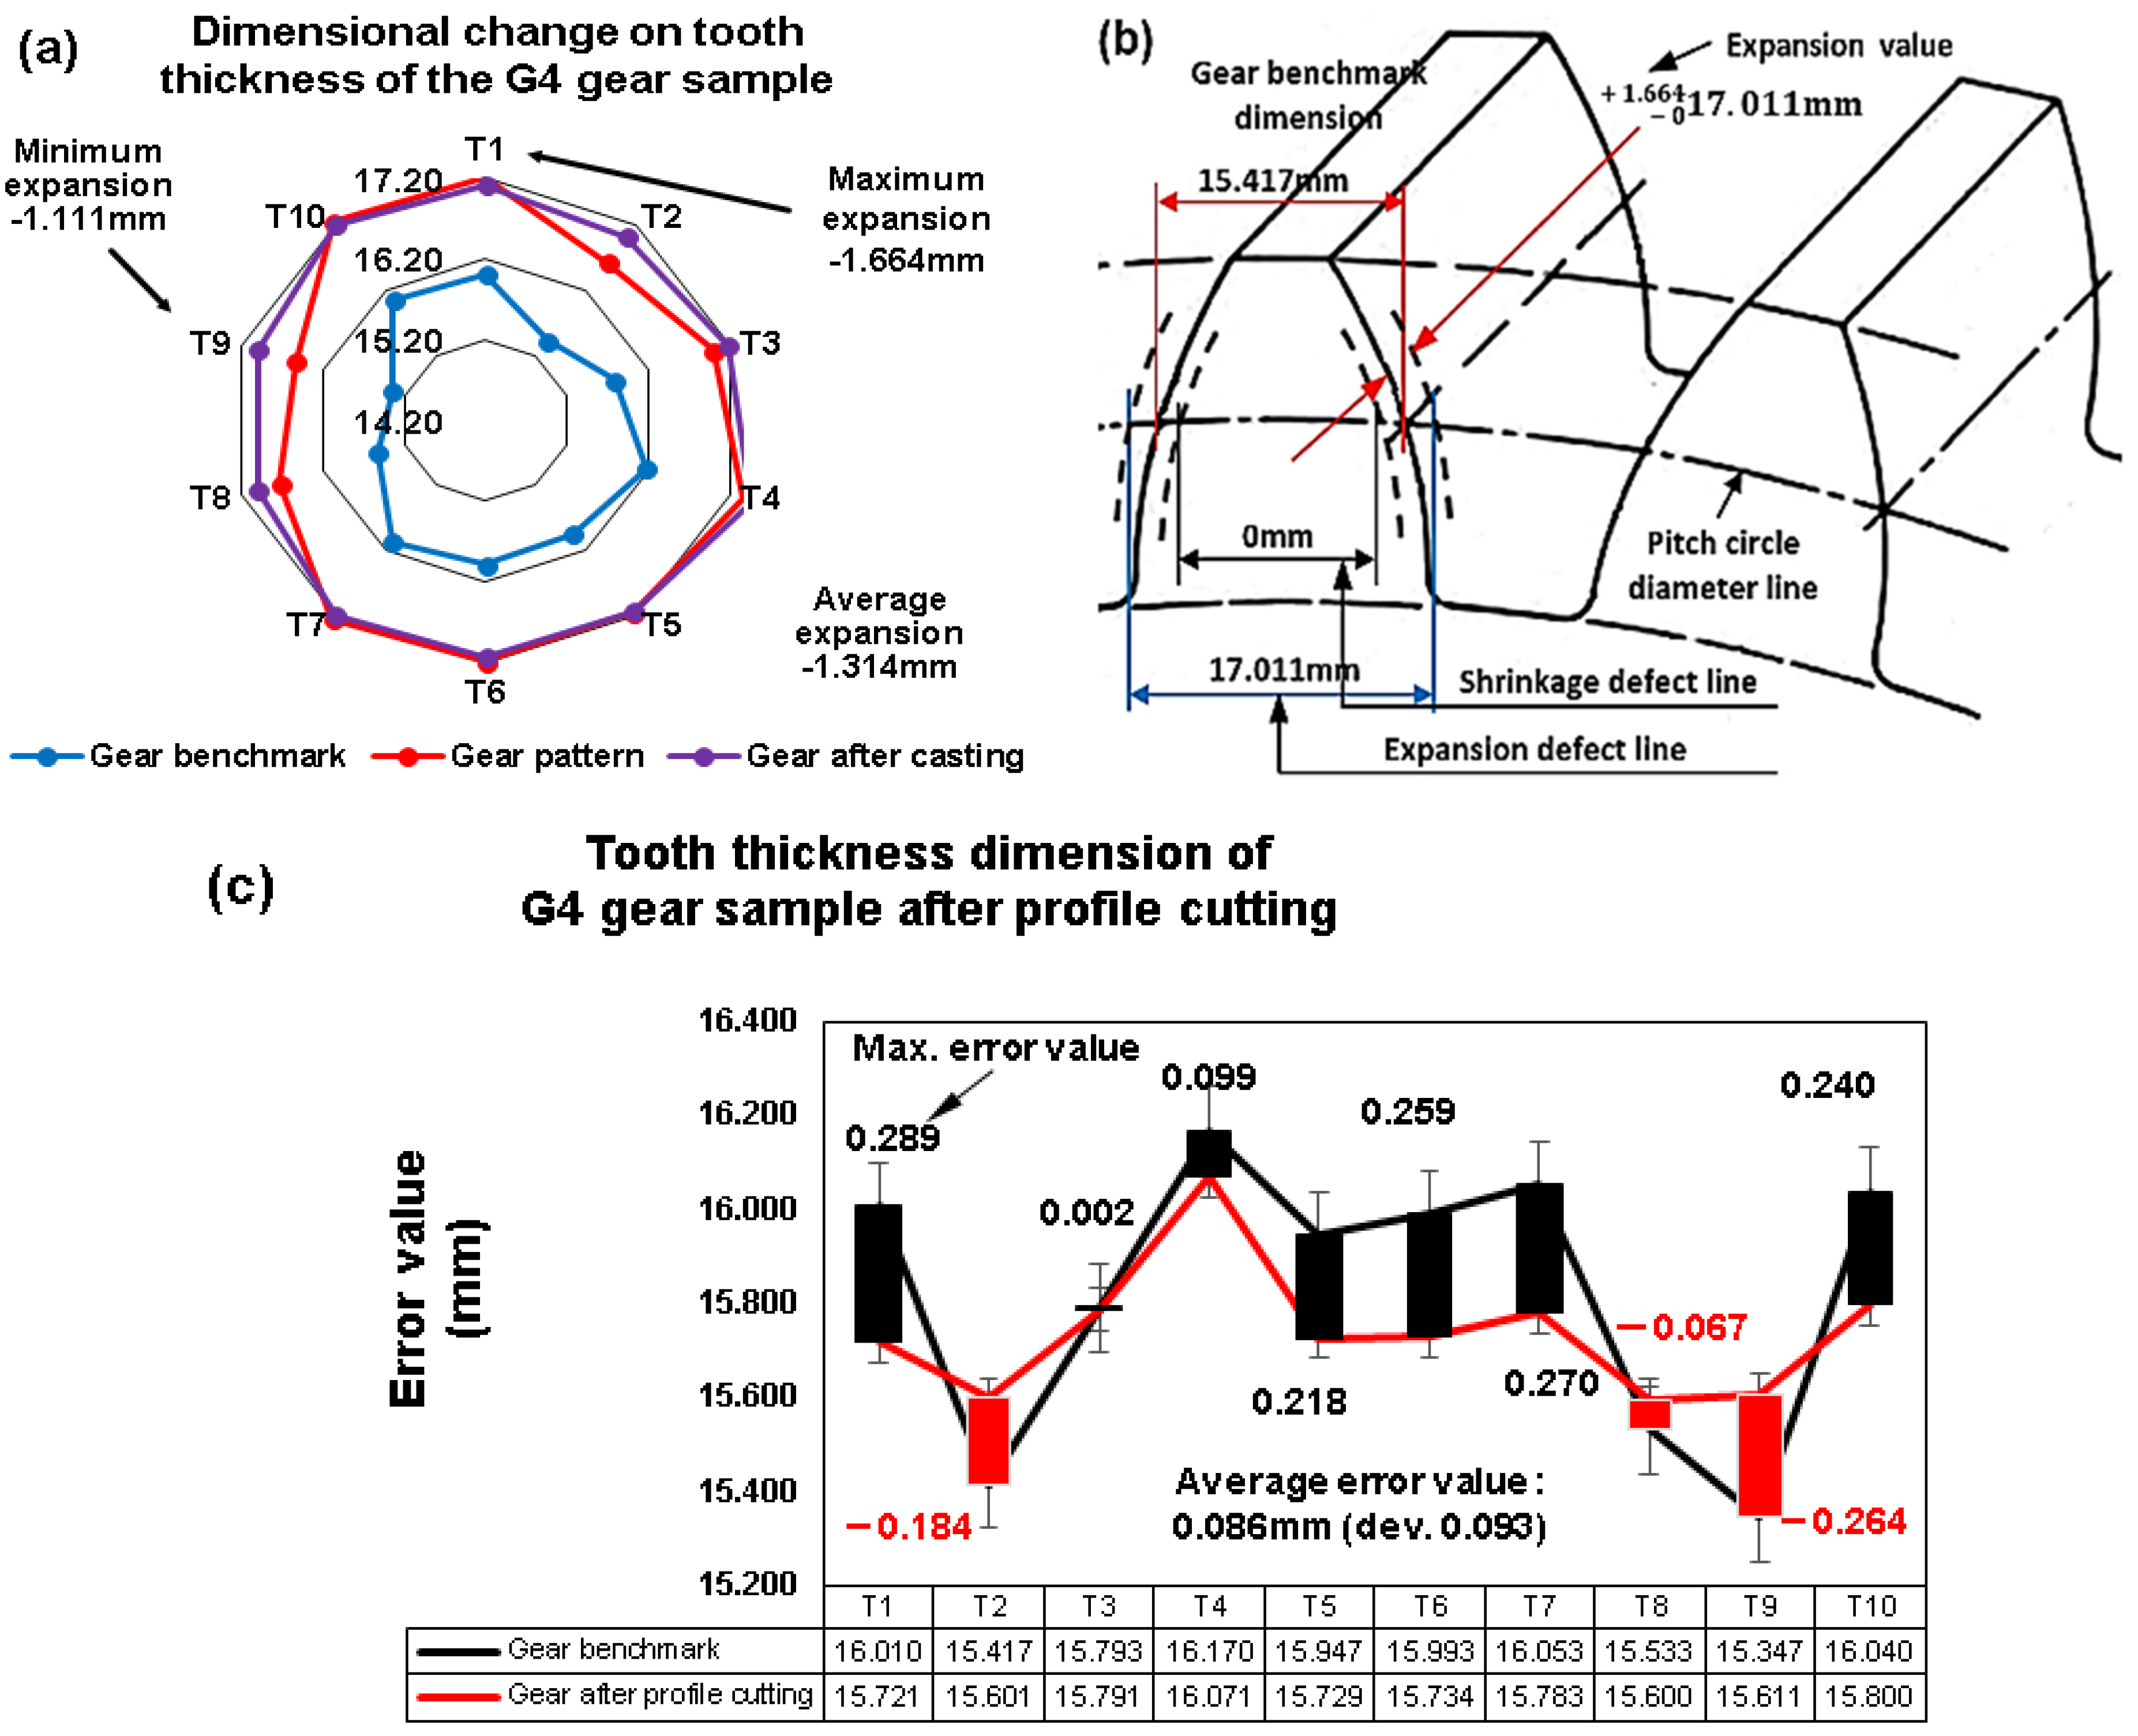
3.6.1. Tooth Thickness Analysis

The type of defect that occurs in the tooth thickness of the G2 gear sample is that all teeth have expansion defects, which are depicted in Figure 11a. The error value after the G2 gear sample due to the finishing process is discussed in Figure 11c, and Figure 11b shows an example of teeth that have changed size. Figure 11 explains the phenomenon of expansion defects in the form of an increased dimensional change of 0.595 mm occurring in tooth number two (T2). See the purple and blue graphic lines, while the smallest dimensional change is 0.378 mm in tooth number eight (T8). In addition, the average value of dimensional changes for all teeth in the G2 gear sample is 0.461 mm, with a deviation value of 0.078 mm.
Figure 12a illustrates the expansion faults in tooth thickness that affect all the G3 gear samples’ teeth after chilled casting. The average value is −0.937 (dev 0.130). The graph’s blue line represents the gear benchmark, while the purple line represents the gear after casting. The greatest expansion defect among the teeth after chilled casting is 1.120 mm, while the smallest expansion value is 0.697 mm. Figure 12c shows the study of the error value following the completion of the G3 gear sample’s EDM wire cutting finishing operation. Based on the blue line in the graph, which represents the benchmark gear, and the red line, which represents the gear after completion, the average error value identified is −0.096 mm (dev 0.060), which indicates that the gear has not been cut to size limits such as gear benchmarks.
The so-called error value, which is 0.092 mm on average, is then trimmed past the boundary. The G3 sample gear’s overall maximum error value is −0.190 mm, indicated by the red line and tooth number six. The gear’s smallest error value is 0.013 mm, indicated by the red line and tooth number four, (T4). In contrast, the lowest error value is 0.001 mm at the black line at tooth number eight, while the greatest value that is cut over the line limit is 0.233 mm, as seen in the black line at tooth number two in Figure 12c (T8).
The gear tooth profile representation in Figure 12b, which depicts the condition that occurs in the tooth thickness after the casting process, uses gear number six (T6) to illustrate the dimensional changes as expansion lines and shrinkage lines.
Figure 13a displays the outcomes of dimensional changes in tooth thickness, namely the typical proportion of teeth with expansion flaws during chilled casting of the G4 gear sample. The condition of the tooth thickness area for tooth number 1 (T1) that changes in dimensions can be illustrated in Figure 13b. Figure 13c discusses the error value following the finishing procedure for the G4 gear sample. As a result, it has been determined that the purple line in Figure 13a, which represents the gear after casting, is actually the comparison blue line from the benchmark gear. The average error value is 1.314 mm, and the deviation is 0.193 mm for the expansion faults that develop in the teeth after casting. Yet, as seen in Figure 13a, tooth number T1 had the largest expansion defect across all teeth at 1.664 mm, while tooth number 9 (T9) had the lowest expansion defect value at −1.111 mm.
The results of the finishing procedure for the G4 sample are presented in Figure 13c, which demonstrates that, while all the tooth profiles were cut at a depth of 1.4 mm, the average error value is 0.172 mm due to the thickness that was not cut. In addition, the cutting thickness suffers an average error value of 0.197 mm due to the dimensional limit. According to Figure 13c, the maximum error value currently has a cutting thickness on tooth number T1 that is over the dimensional limit of 0.298 mm (dev. 0.193) and a minimum of 0.002 mm on tooth number three (T3). While the thickness of uncut leftovers has a maximum error value of −0.264 mm at tooth number nine (T9) and a minimum of −0.067 mm at tooth number eight (T8). A min (-) symbol is also found in some teeth after comparing the calculation results from the gear dimensions of the benchmark sample and the G4 gear sample.
The minimum (-) number can be understood as a tooth profile that has leftover tooth thickness that has not been cut in accordance with the standard gear cutting procedure (benchmark gear).

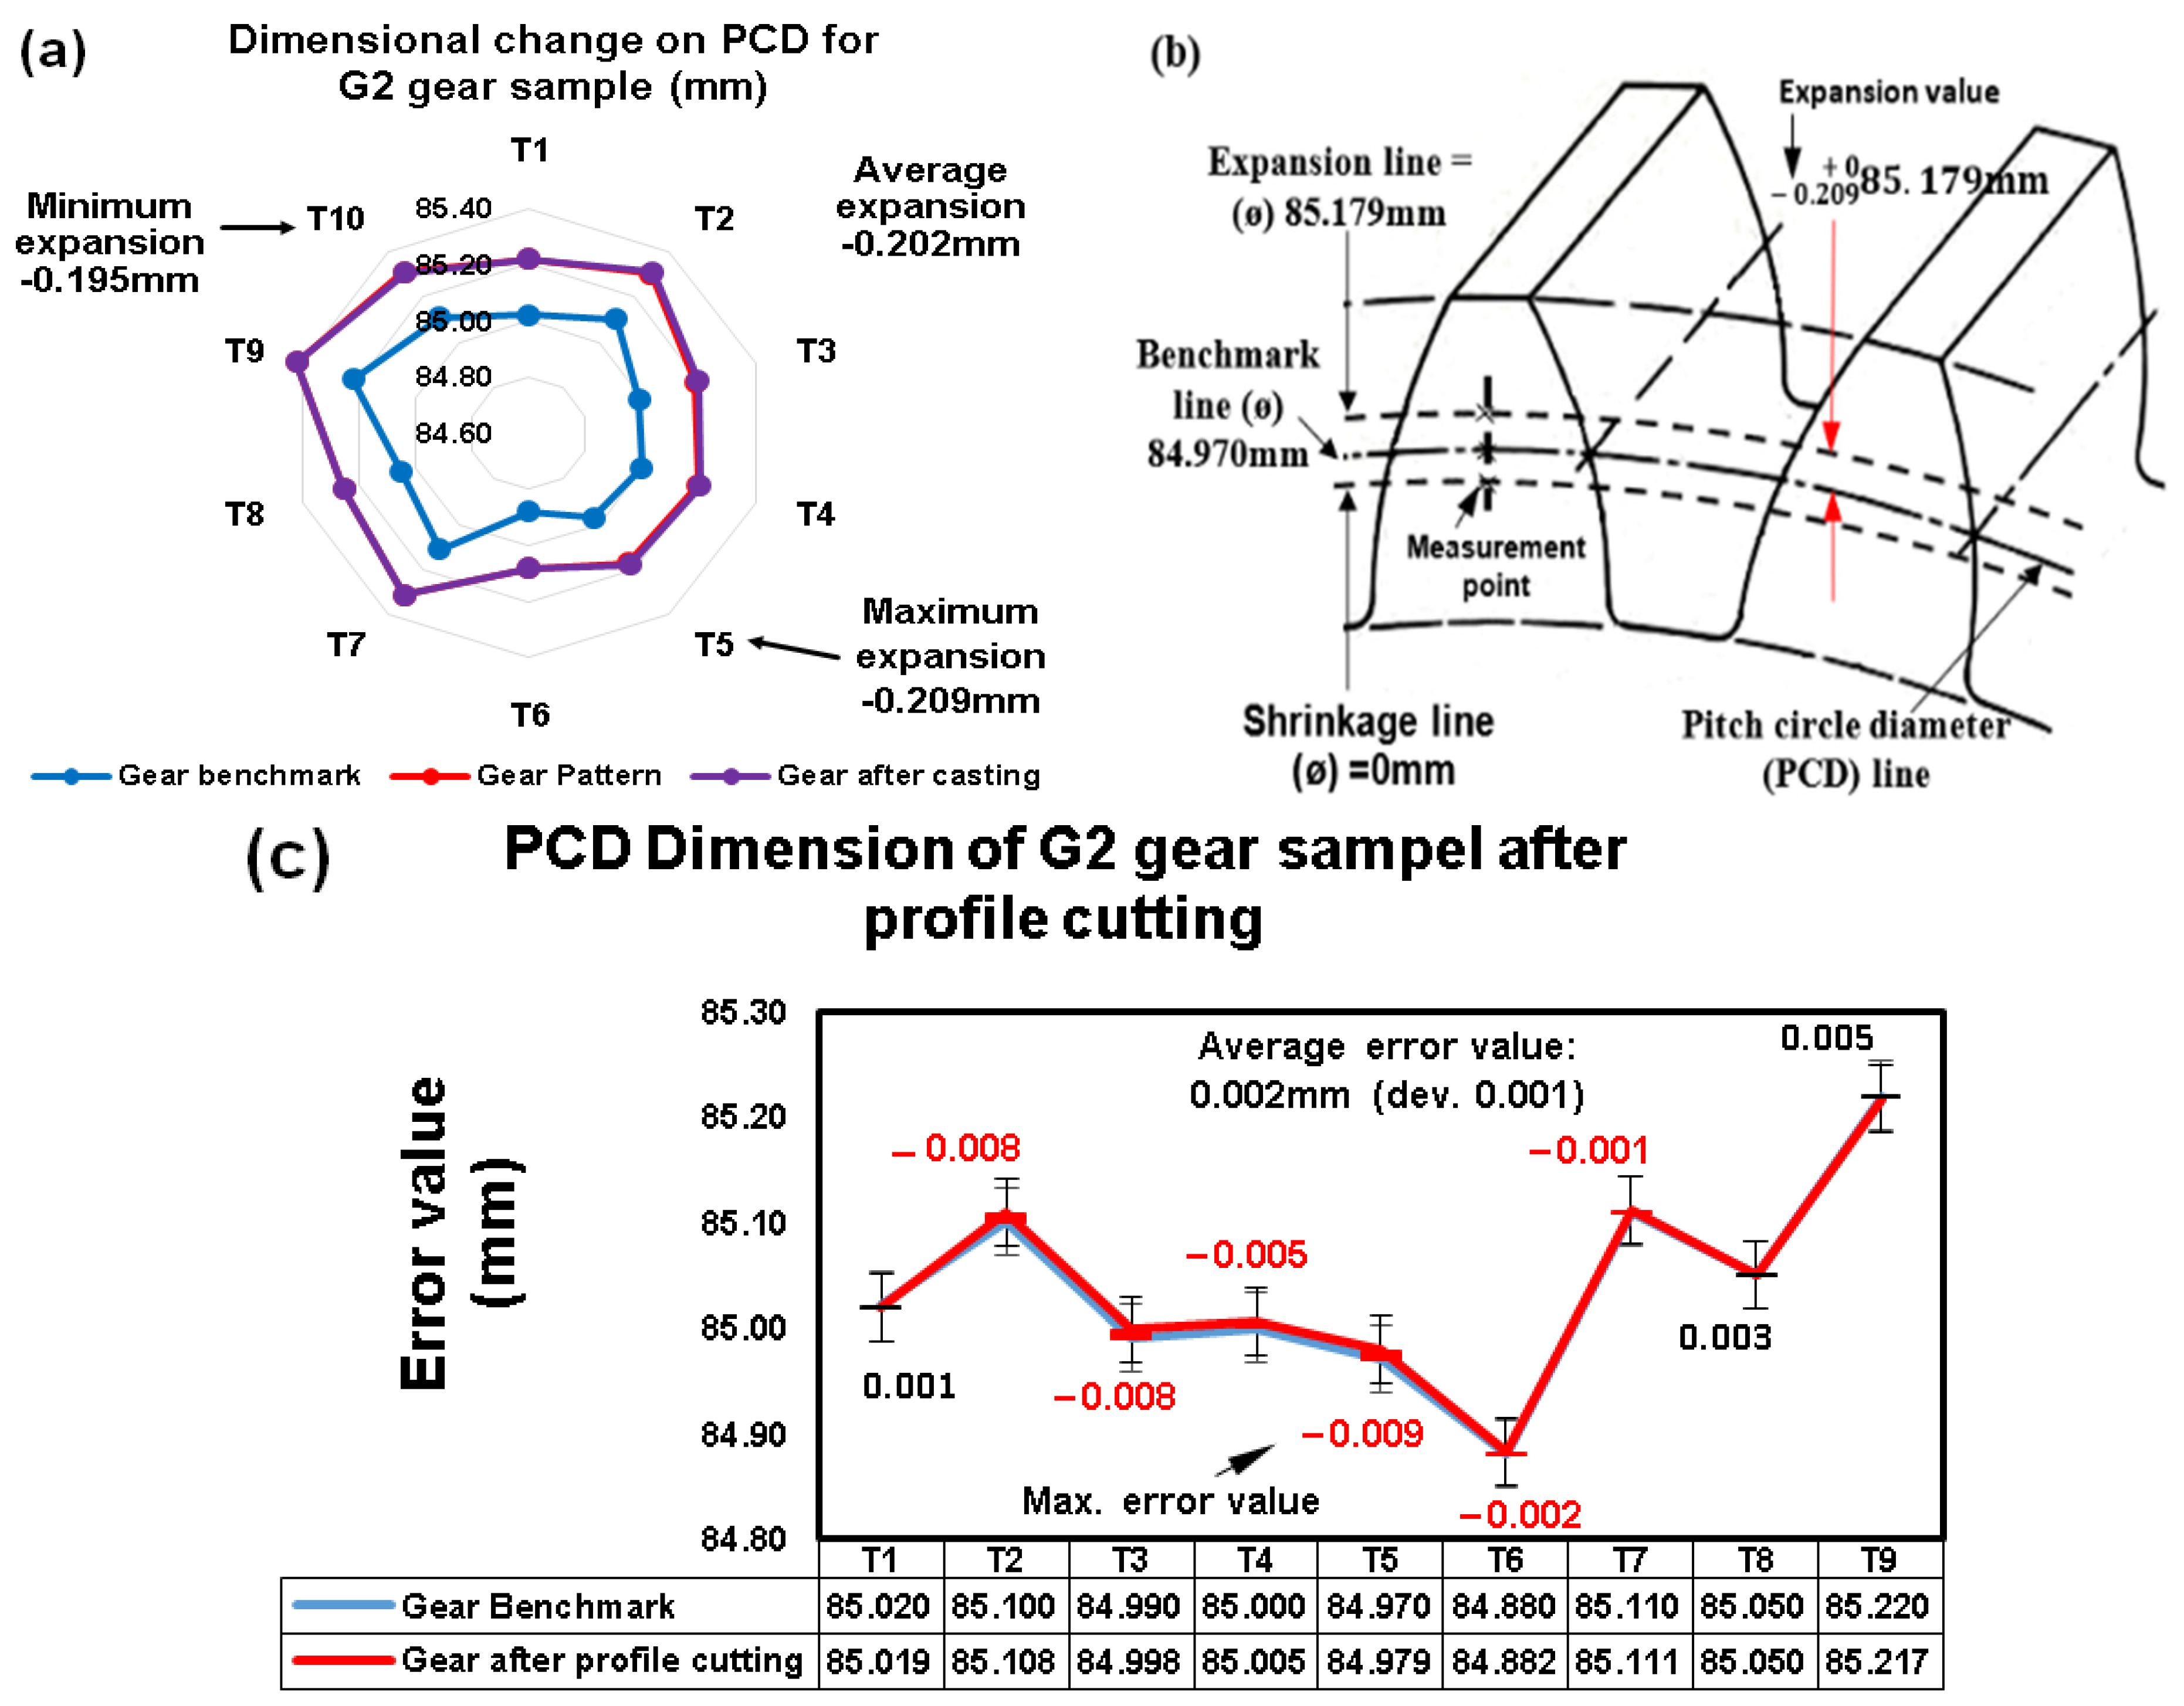
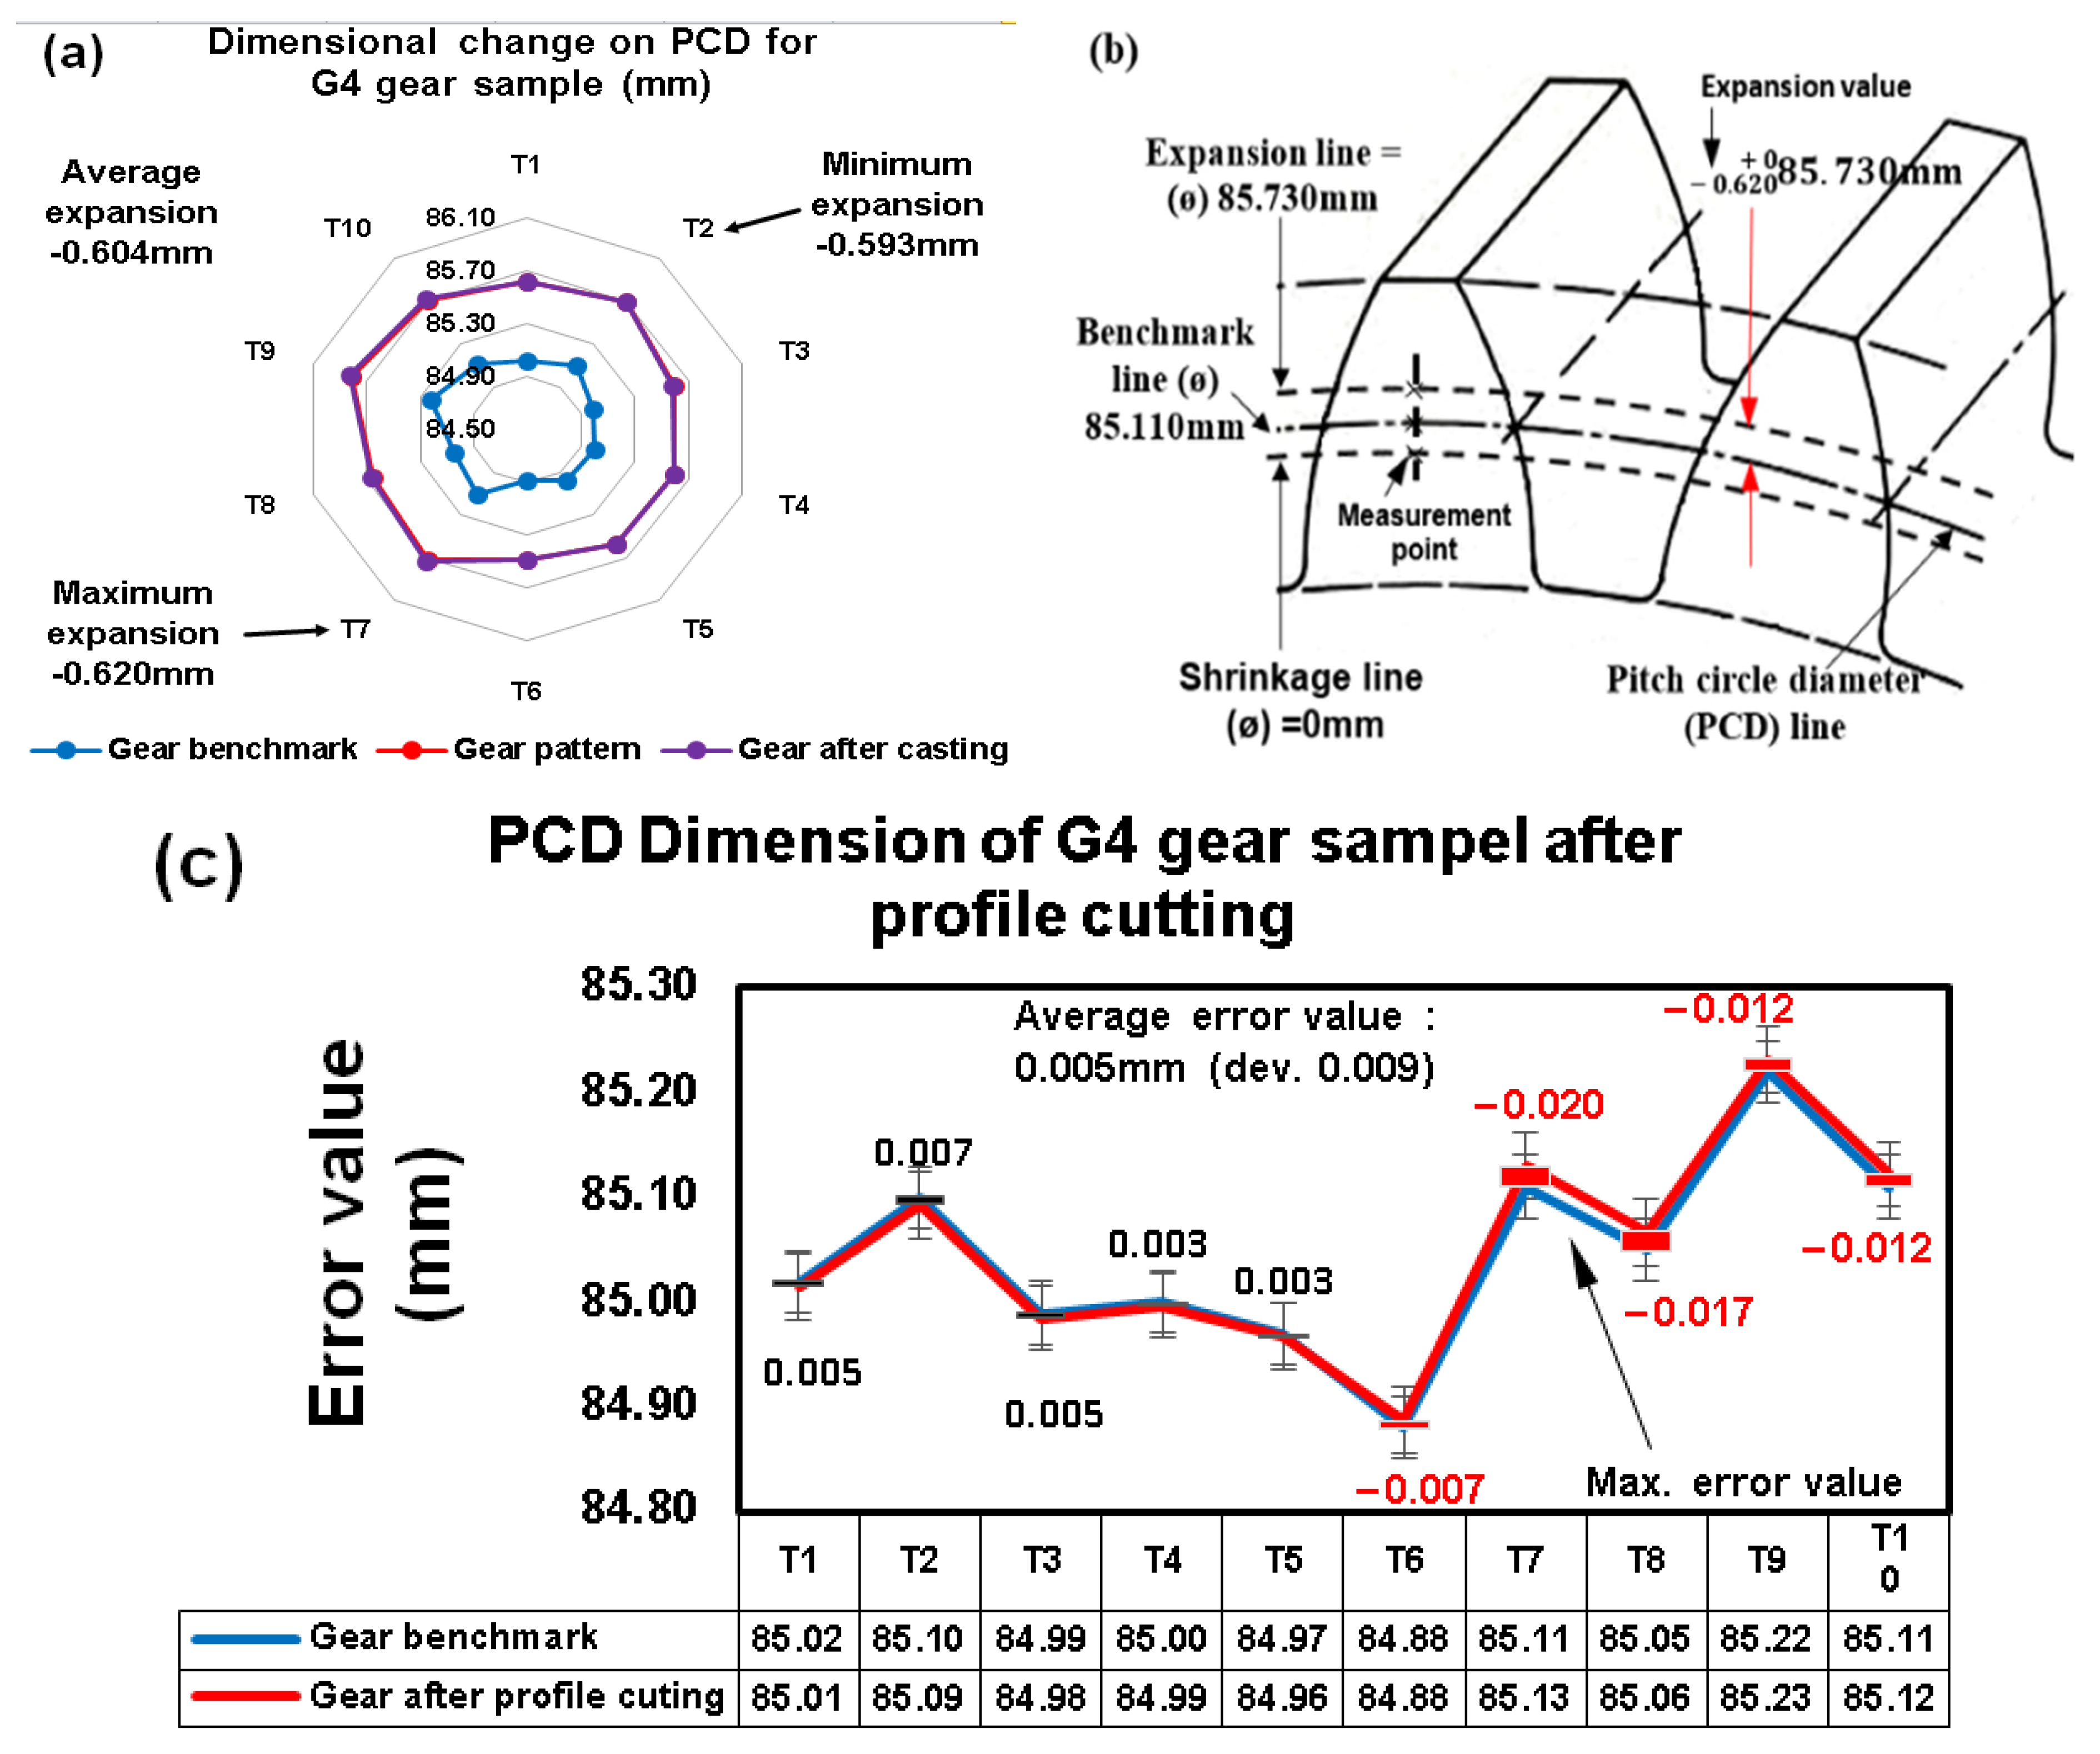
3.6.2. Pitch Circle Diameter (PCD) Analysis

The findings of the dimensional changes in the pitch circle diameter (PCD) for the G2 gear sample after chilled casting are shown in Figure 14. The gear used as a benchmark is represented by the blue graphic line, which will be contrasted with the gear after casting, which is represented by the purple line. As a result, any defects that do arise are largely the result of progress.
The average expansion defect was 0.202 mm (dev. 0.005), but the tooth with the largest expansion defect was tooth number T5, and the one with the lowest expansion was tooth number T10. The G2 sample is then carried on to the finishing process, where each tooth is cut with a thickness of 0.2 mm and an average error value of 0.002 mm is determined (dev. 0.001). This result indicates that the material’s thickness has exceeded the boundary. The pitch circle diameter has an average error value of 0.006 mm (dev. 0.003), meaning that the thickness is not cut off at the boundary line. The error values range from −0.009 mm to −0.001 mm (untruncated), respectively (Figure 14c). The graph shows a maximum error value of 0.005 mm and a minimum error value of −0.001 mm (cut above the limit) (Figure 14c). Provided that the thickness of the material that is not cut to the boundary line is indicated by the minimum (-) symbols in the number. Figure 14b shows the PCD area in tooth number T10 that has changed size as a result of the casting process.
Figure 15 illustrates that all of the teeth on the G3 sample gear have expansion faults in the PCD, with an average value of −0.403 mm (dev 0.006). The gear benchmark is represented by the blue line in Figure 15a, whereas the gear after casting is represented by the purple line. The teeth with the highest expansion fault after chilled casting are −0.413 mm, while the teeth with the lowest expansion value are −0.395 mm. Figure 15b is an illustration of the PCD area that has changed dimensions in tooth number T19 after the casting process. Figure 15c shows the examination of the error value after the G3 sample owing to the finishing procedure. The gear benchmark line will be compared to the gear following the finishing process, which is represented by the red color line based on the blue line in the graphic.
The average detected error value of −0.006 mm (dev 0.003) that is not cut to the size limit of the benchmark gear happens after all tooth profiles are cut with a thickness of 0.4 mm. The average error value of 0.006 mm is then truncated past the boundary. The G3 sample gear exhibits uncut error values with a maximum of −0.008 mm and a minimum of −0.004 mm for all the teeth. While the maximum and minimum values that are cut over the line limit are 0.010 mm and 0.002 mm, respectively.
Figure 16b is an illustration of the ACD area that has changed dimensions in tooth number T9 after the casting process. Figure 16a shows the dimensional changes on the PCD, specifically the average of the teeth that have expansion flaws after the G4 sample due to chilled casting. After the finishing process, the error value is discussed in Figure 16c.
It has been determined that the blue line in the illustration represents the benchmark gear to be compared with the purple line, which represents a gear after casting. The average expansion fault value after casting is −0.604 mm (dev 0.010). The results are depicted in Figure 16c, where the highest expansion defect value across all teeth was −0.620 mm and the lowest expansion was −0.593 mm. The G4 sample goes to the finishing process, where all tooth profiles are cut with a thickness of 0.6 mm, so that the average error value discovered is −0.014 mm (dev 0.004) due to thickness leftovers that have not been cut.

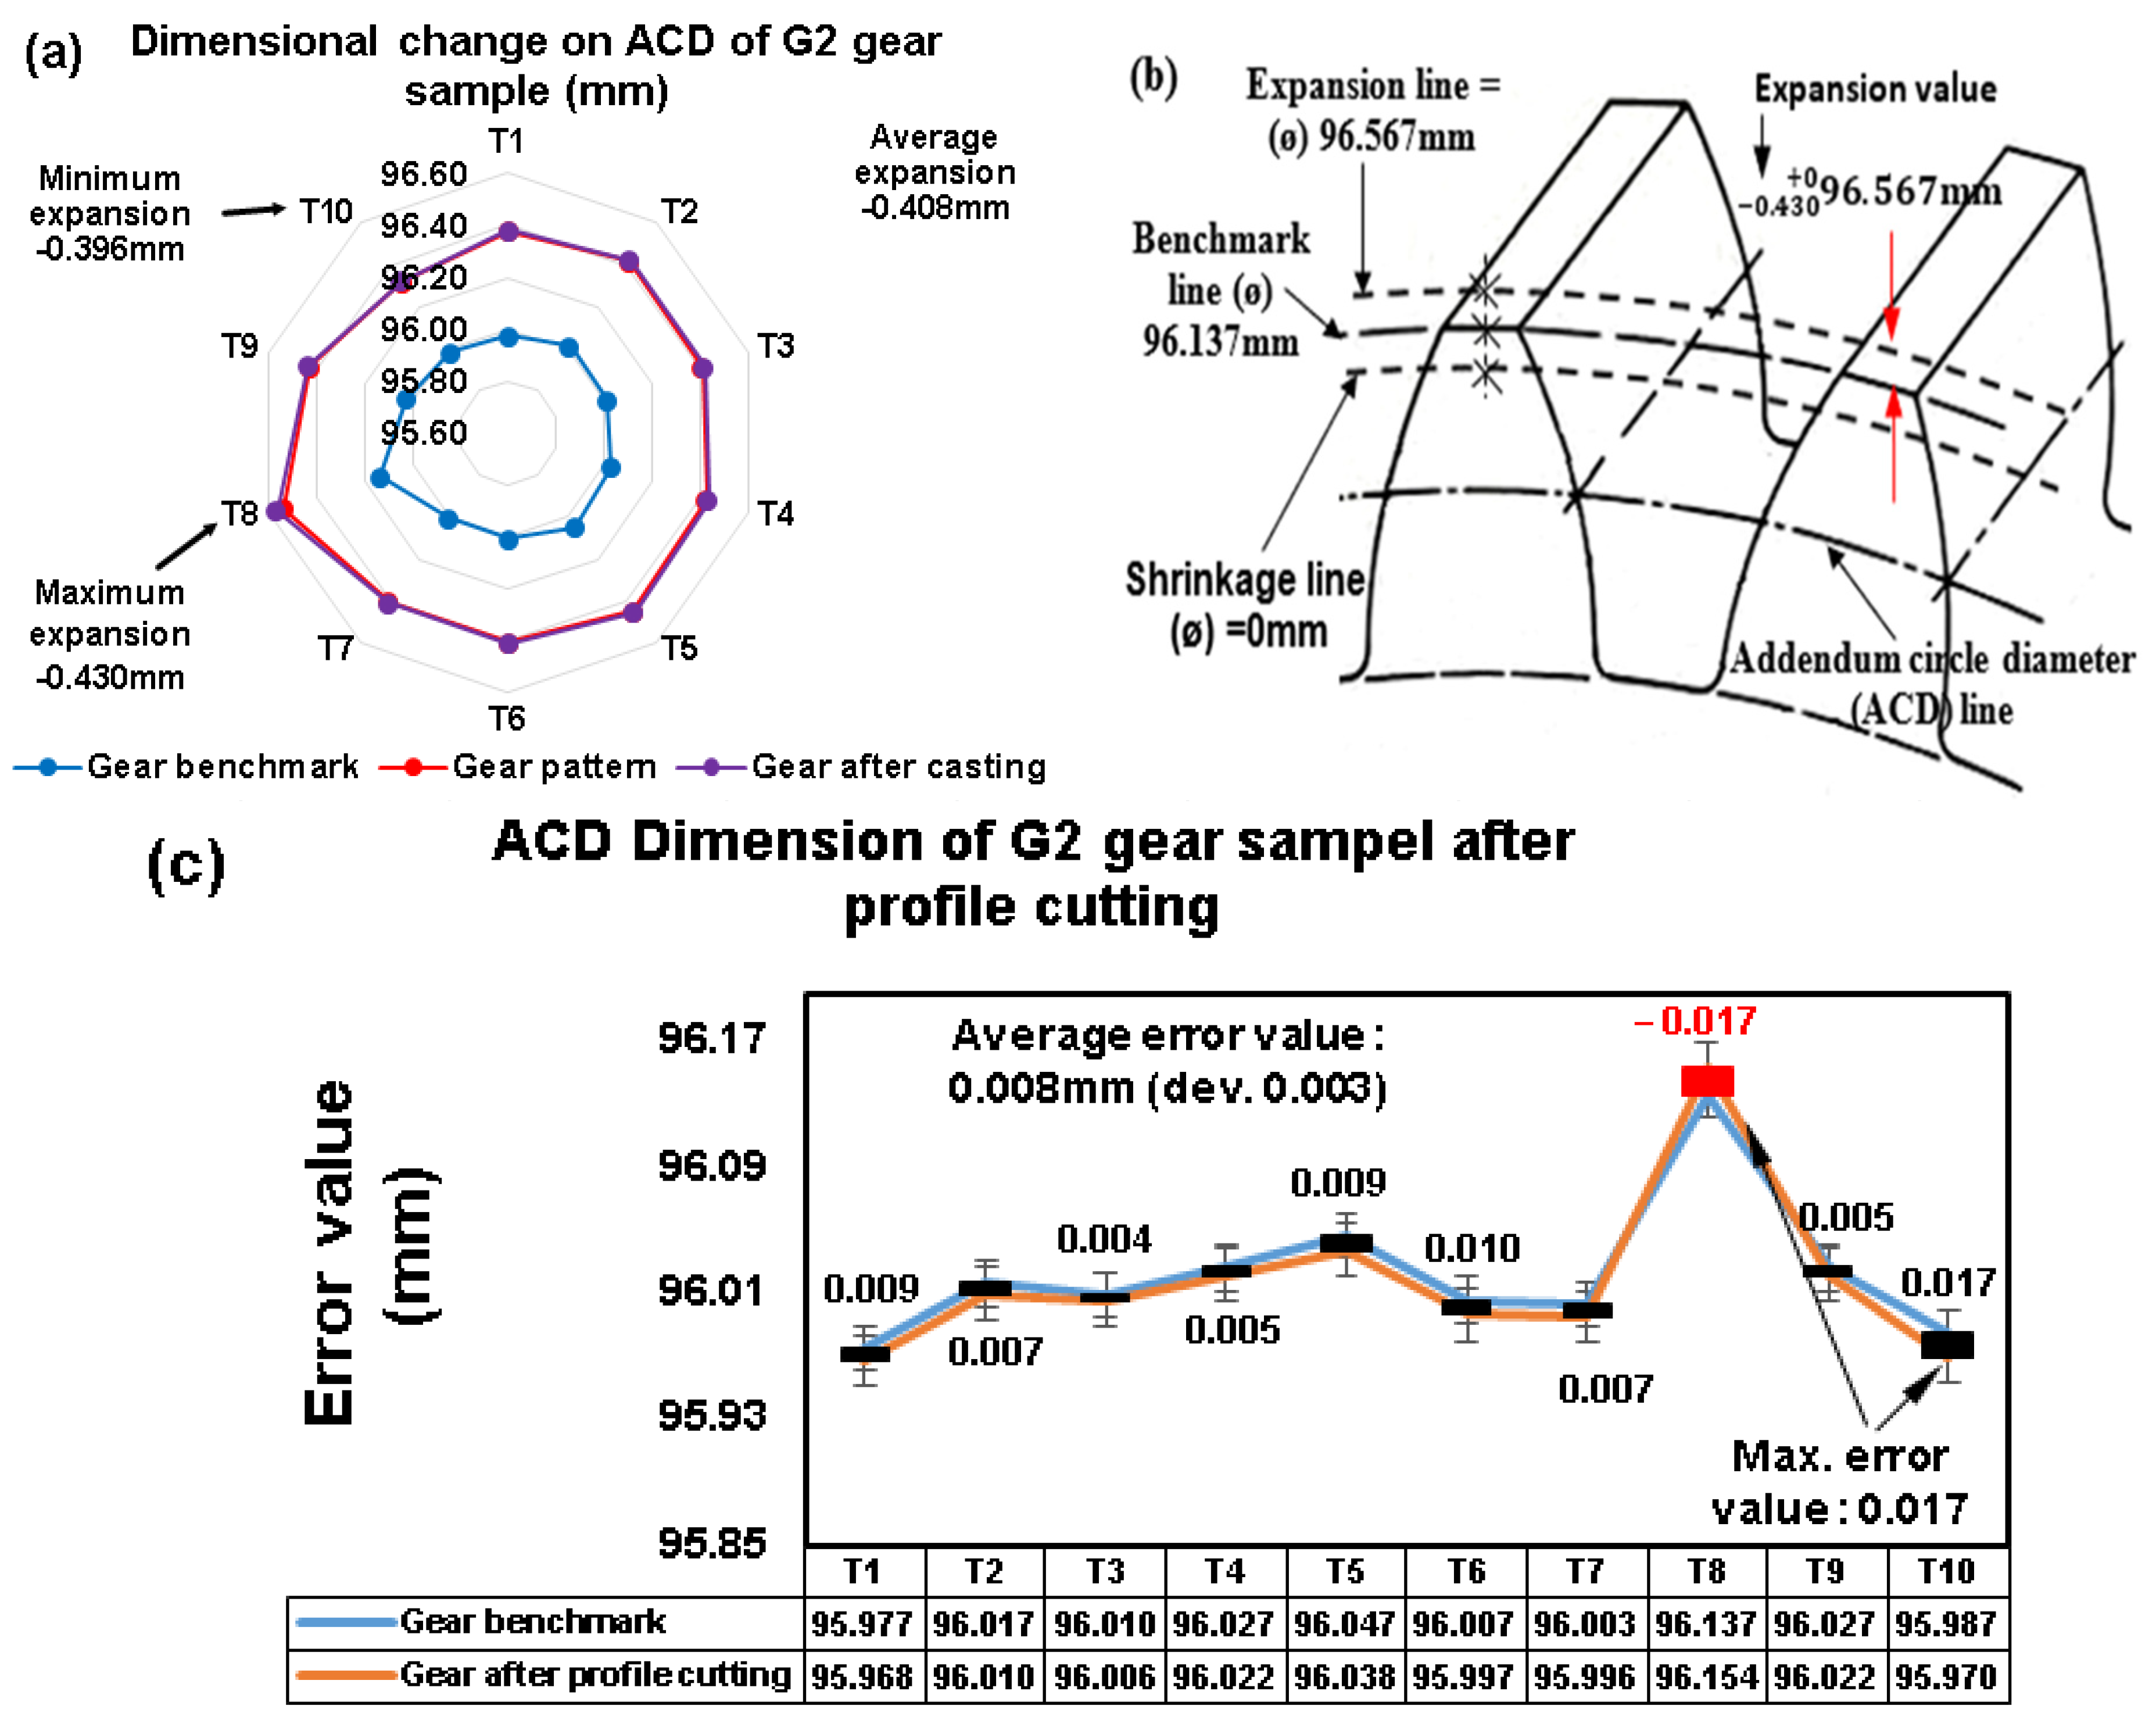
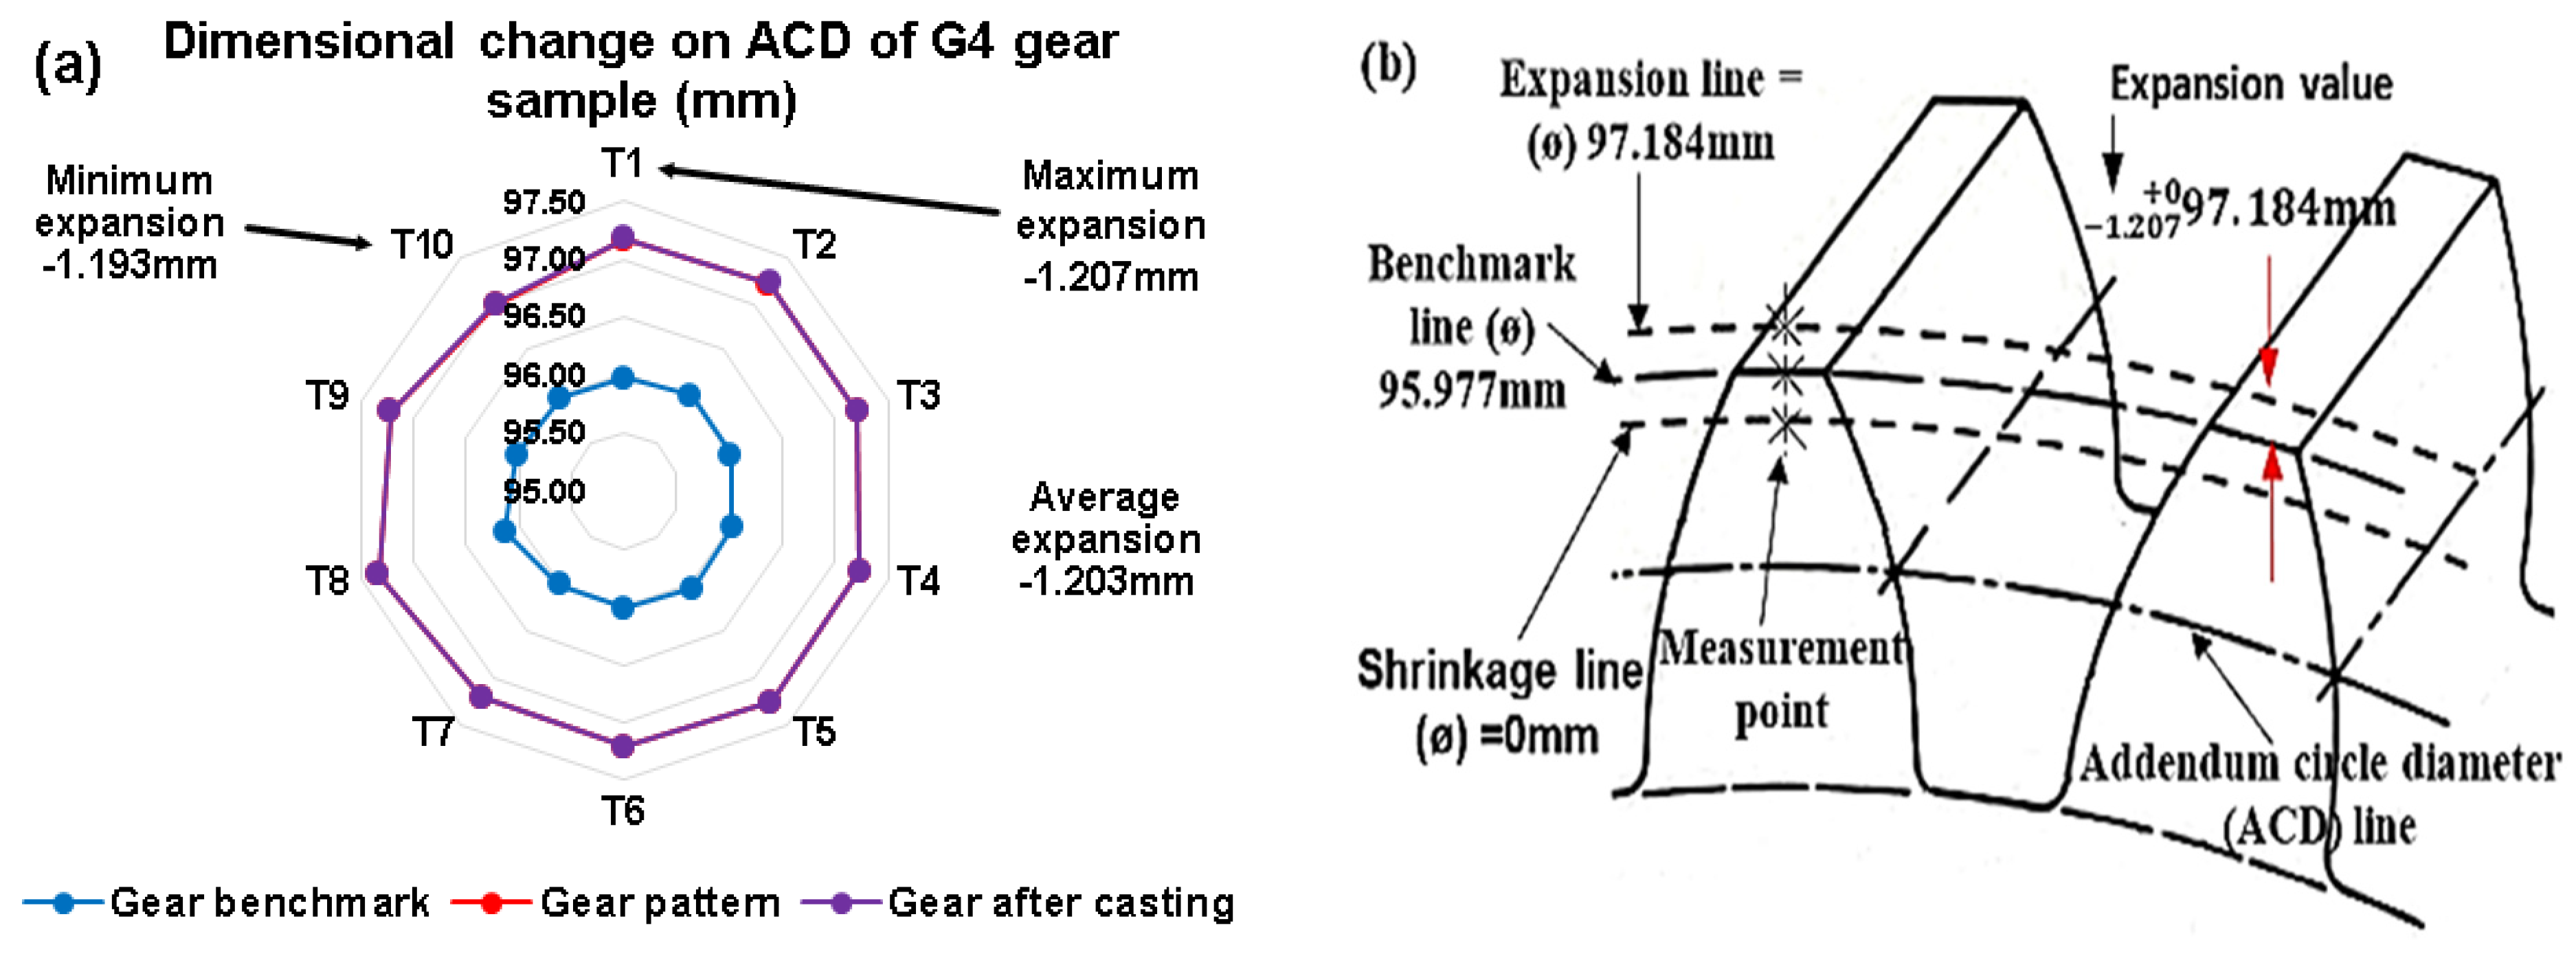
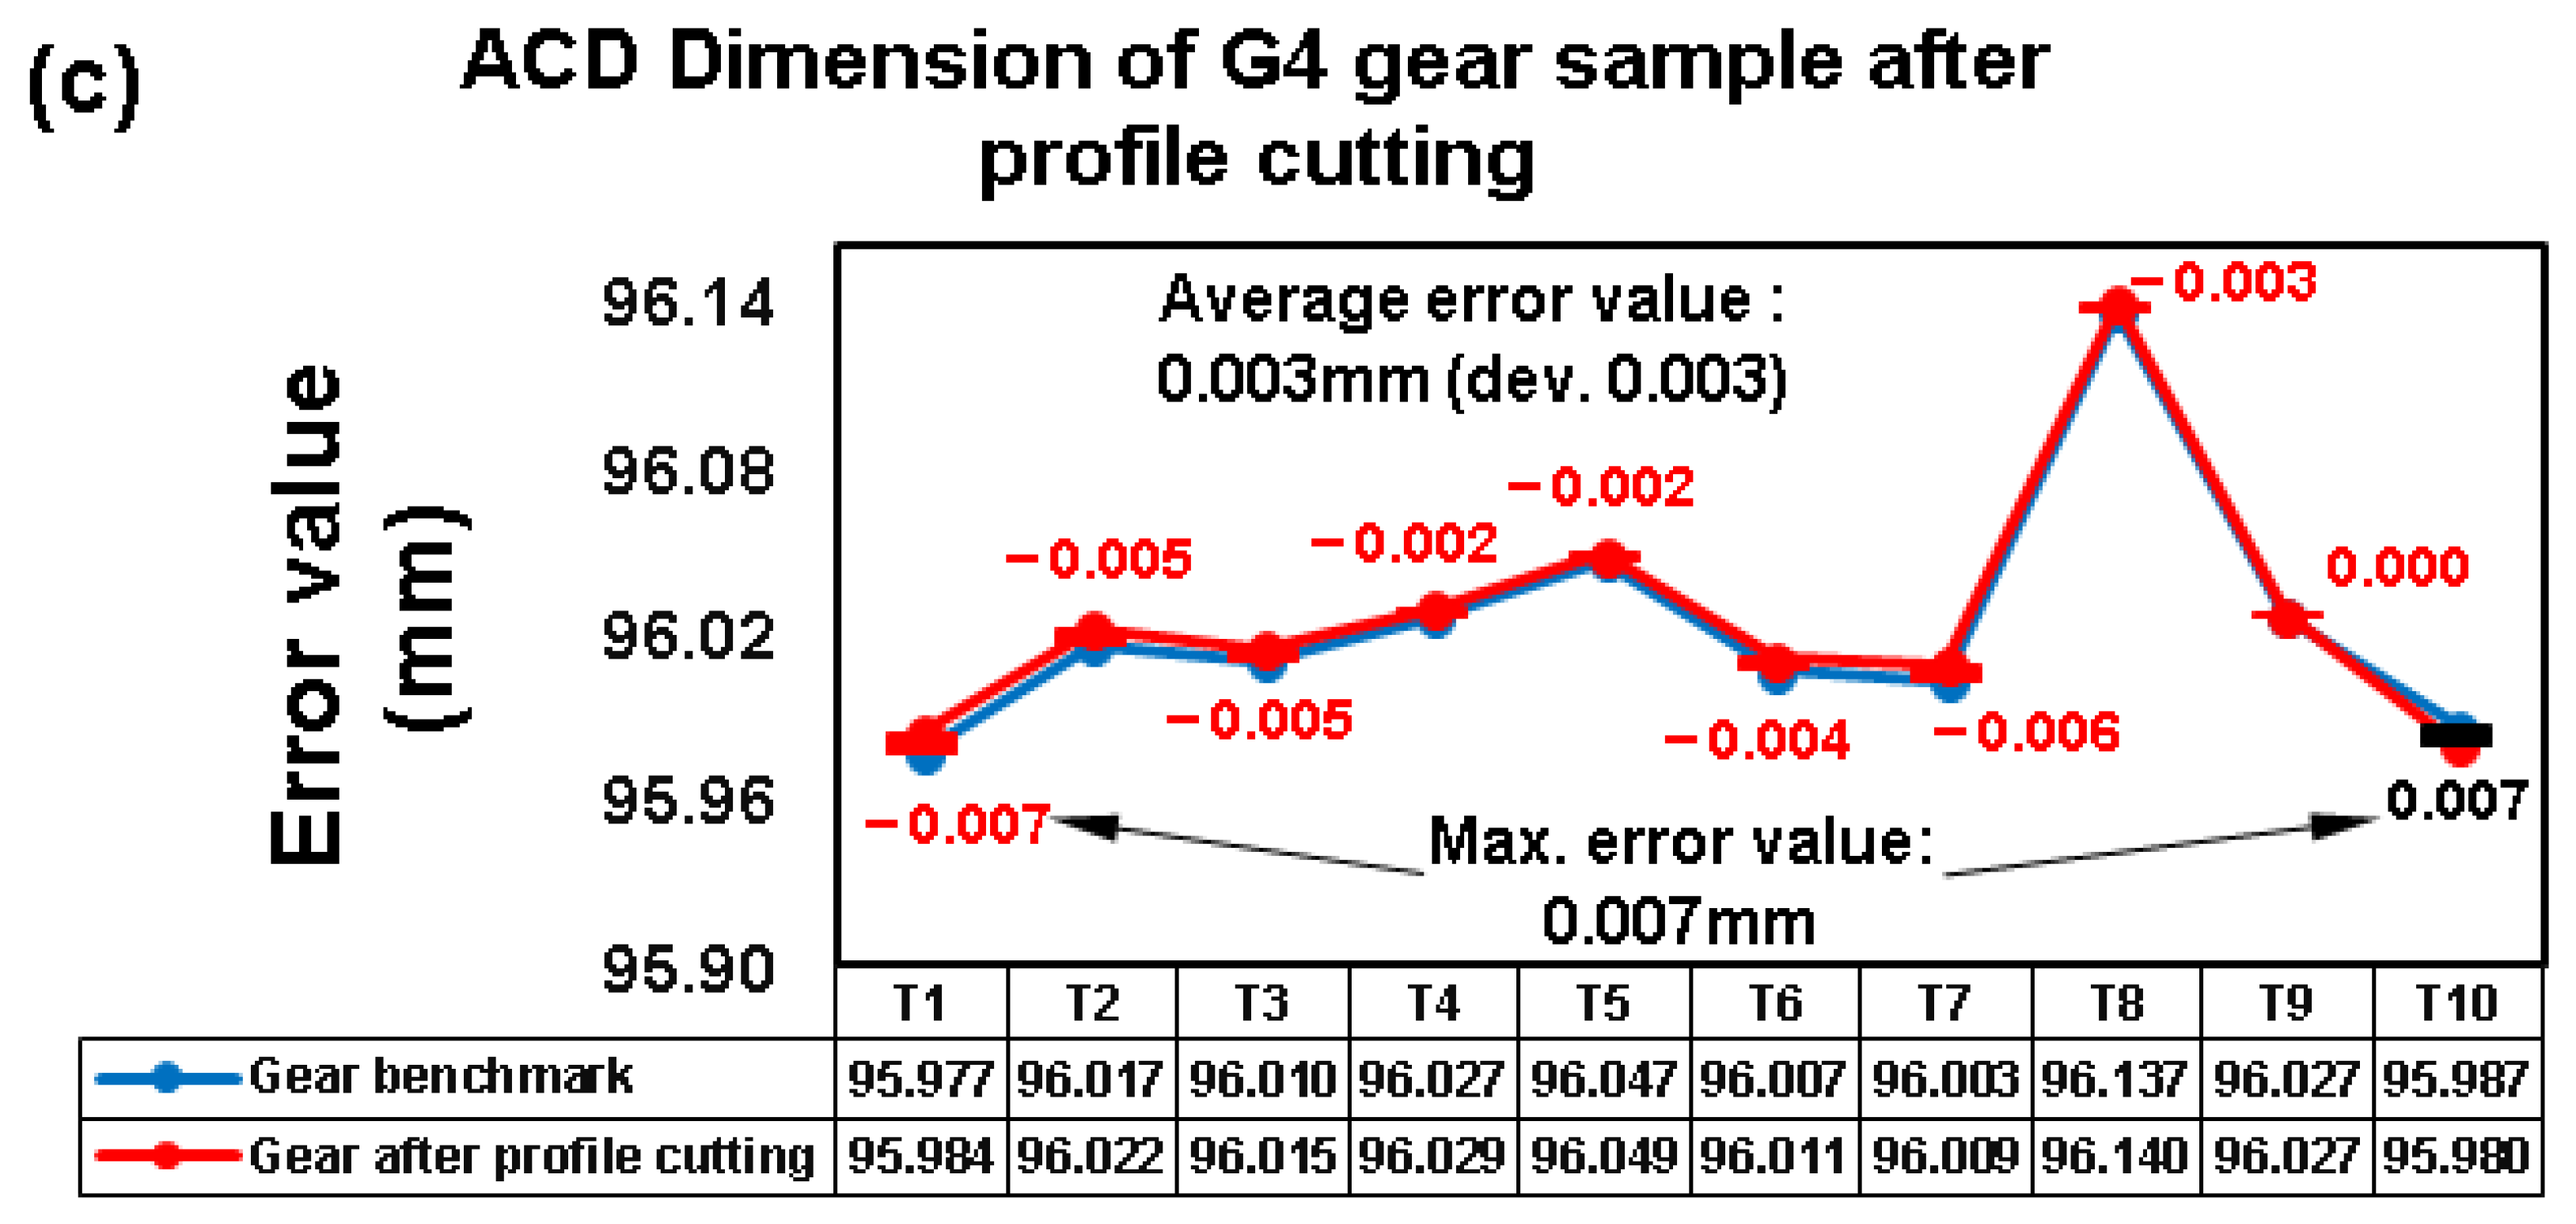
3.6.3. Addendum Circle Diameter (ACD)

Figure 17 illustrates the results of the dimensional change on the addendum circle diameter of the G2 sample after the casting process. The benchmark gear is shown by the blue line in the illustration (Figure 17a), which will be contrasted with the gear after casting, represented by the purple line. Then, the fault that manifests itself usually just involves expansion. The maximum expansion defect value for all teeth was −0.430 mm, while the lowest expansion was −0.396 mm. The average expansion defect that occurred was −0.408 mm (dev 0.009).
Figure 17b shows how, following the casting process, the ACD area’s dimensions in the T8 tooth number have changed. The G2 gear sample is then carried on to the last stage, where each tooth is cut with a thickness of 0.4 mm and an average error value of 0.008 mm is discovered (dev. 0.003). This result indicates that the material’s thickness has been cut beyond the line of confinement. In the ACD, tooth number eight (T8) experiences an error value of −0.017 mm, meaning that a thickness of 0.017 mm is not cut to the boundary line (Figure 17c). The graph in Figure 16c can be used to display the results, with the highest error values of −0.017 mm that are not cut off in tooth number T8 and 0.017 mm that are cut off beyond tooth number 10 (T10).
Figure 18a displays the findings of the dimensional changes caused by chilled casting in the ACD after the G3 gear sample. The purple line, which represents the gear after casting, will be compared to the blue line in the picture, which represents the benchmark gear. As a result, defects typically only manifest as expansion in casting gear. All teeth had an expansion fault with a range from −0.809 mm to −0.007 mm, with −0.809 mm being the largest. The average expansion defect that occurred was −0.803 mm (dev 0.009). Figure 18b shows the ACD region after casting, where the tooth number of T3 has modified the dimensions. When the G3 sample is taken to the finishing step, each tooth is cut to a thickness of 0.8 mm, resulting in an error value that is typically −0.011 mm (dev. 0.002). This number indicates that the material’s thickness had approached the boundary line even though it had not been cut. The pitch circle diameter error value is −0.016 mm; only one tooth has been cut past the limit. Figure 18c shows that while the maximum error of 0.016 mm was cut over the limit, the maximum error value of −0.014 mm was not cut over the limit.
Figure 19a shows the effects of change on the ACD dimensions, particularly the average expansion defects in the teeth that emerge in the G4 sample after the casting process. Figure 19c describes the error value after the G4 gear sample as a result of the finishing process, while Figure 19b illustrates the ACD region that has changed dimensions in the tooth number of T1 after the casting process.
The benchmark gear, represented by the blue line in Figure 19a, will be contrasted with the gear after casting, represented by the purple line. After cold casting, all teeth had an average expansion defect value of −1.203 mm (dev 0.004). While the lowest expansion was −1.193 mm, the highest expansion fault in all teeth measured −1.207 mm. The results of the finishing procedure for the G4 gear sample are given in Figure 19c.
All of the gear tooth profiles were cut with a 1.2 mm cutting depth, resulting in an average error value of −0.004 mm (dev. 0.002) due to thickness remnants that had not been cut. Moreover, the cutting thickness is beyond the dimensional limit, resulting in an average error value of 0.003 mm (dev 0.003).
The thickness of residual material that has not been cut currently has a maximum error value of −0.007 mm and a minimum of −0.002 mm, with the maximum error value for cutting thickness exceeding the dimensional limit occurring only in one tooth at 0.007 mm. After comparing the calculation results from the gear dimensions of the benchmark sample and the G4 gear sample, the minimum (-) symbol can be understood as a tooth profile that contains the thickness leftovers that have not been cut according to the standard gear, i.e., the gear benchmark.
The results of this cutting cannot affect the accuracy of the gear dimensions, as recommended by the ANSI/AGMA standard, which includes a standard tolerance for tooth thickness of 0.302 mm [87]. The high error value depends on the thickness of the cut, and the thickness of the cut will depend on the thickness of the hardness layer that occurs. Thus, the chill thickness parameter used is a determination. So it can be concluded that material hardness is a causal factor. A production process, particularly dimensional precision, is another consideration in addition to material factors. The rate of change in the tooth flank’s dimensions is particularly rapid, which will cause the tooth contact point to shift and reduce wear resistance [16]. The pitch point position on the mesh tooth profiles will be very essential for determining the uniformity and strength of tooth flank wear at maximum torque capacity [88].

4. Conclusions

This research investigated the surface behavior and dimensional accuracy of the spur gear after the surface hardening process using chill (Chilled Casting). The gear surface hardening method runs on one casting stage. To determine the hardness value and thickness of the hardness layer, the parameter used is the chill thickness variation as a determination of the rapid cooling rate on the surface so that the hardness value and hardness thickness increase on the surface of the tooth profile. The application of preheating to the chill plate can diffuse chemical elements from the chill material to the gear profile to form a white cast iron structure.
To increase the value of dimensional accuracy by preventing shrinkage or expansion, variations in the thickness of the gear pattern dimensions are used. While the dimensional accuracy value can be analyzed by detecting the error value after the process of measuring tooth thickness, pitch circle diameter, and addendum circle diameter.
Thus, the results that have been found can be concluded as follows:
  • Using chill in the gear casting process has succeeded in changing the value of hardness and hardness thickness layer, type of microstructure, chemical composition content, and wear resistance in the surface area of the chill-coated tooth profile;
  • The use of chill in the casting process causes a fast-cooling rate on the surface of the tooth profile, thus changing the graphite nodule structure into a cementite phase, a martensitic phase, and a ledeburite phase in the chilled tooth profile surface area;
  • Using chill can increase the hardness value in the chilled area. The hardness value on the surface in the tooth flank area is higher, reaching 700 HV–887 HV, than the hardness value in the middle area of the gear, which is 296 HV–301.04 HV. The thickness of the chill plate affects the cooling rate, which will determine the hardness and microstructure of the hardened layer. A thicker chill plate will provide a slower cooling rate, which can lead to a more homogeneous microstructure and a more uniform hardness distribution in the hardened layer. On the other hand, a thinner chill plate will provide a faster cooling rate, which can lead to higher hardness in the hardened layer;
  • With the formation of a matrix structure of ferrous chromium carbide (FeCrC) due to elemental diffusion from the chill material, it can increase the hardness value so that the wear resistance is very good, which has an average specific wear value ranging from 2.691 × 10⁻⁶ mm2/kg to 5.502 × 10⁻⁶ mm2/kg;
  • Using modified gear patterns with various dimensions, such as an enhancer plate thickness of 0.2 mm, can prevent shrinkage in the tooth profile after casting.
The average tooth thickness experienced an expansion from 0.314 mm to 1.314 mm. Furthermore, after the finishing process, the average error value ranges from 0.011 mm to 0.096 mm. The problem of shrinkage and expansion defects that occur in the pitch circle diameter and addendum circle diameter areas is smaller than that in the tooth thickness area.

Author Contributions

Writing—original draft, methodology, investigation, N.F.D.S.G.; project administration, resource, supervision, formal analysis, R.R.; writing—review and editing, funding acquisition, conceptualization, formal analysis, A.W. All authors have read and agreed to the published version of the manuscript.

Funding

This study was funded by the Dili Institute of Technology, Timor Leste, with Grant No. 0009/CARPS-CS/DIT/VII/2022.

Data Availability Statement

Not applicable.

Acknowledgments

The authors would like to express their gratitude to the Department of Mechanical Engineering, Dili Institute of Technology, for supporting this research. The material characterization was partially supported by research funds from the Department of Mechanical Engineering, Faculty of Engineering, Diponegoro University, 2022.

Conflicts of Interest

The authors declare no conflict of interest.

References

  1. AGMA Standard. Gear Materials And Heat Treatment Manual AGMA 2004-B89. In Metallurgy and Materials Committee; American National Standard: Alexandria, VA, USA, 1989; Volume 89, p. 79. ISBN 1-55589-524-7. [Google Scholar]
  2. Shama, S. Comparison of Mechanical Properties of Austenitic Ductile Cast Iron with Ferritic/Pearlitic Ductile Cast Iron; Metallurgical and Materials Engineering National Institute of Technology Rourkela Certificate of Examination, National Institute of Technology: Rourkela Odisha, India, 2017. [Google Scholar]
  3. Davis, J.R. Gear Materials, Properties, and Manufacture; Davis, J.R., Ed.; ASM International: Materials Park, OH, USA, 2005; ISBN 0871708159. [Google Scholar]
  4. Callister, W.D.; David, G. Rethwisch Materials Science and Engineering an Intruduction, 8th ed.; John Wiley and Sons, Inc.: Hoboken, NJ, USA, 2010; ISBN 978-0-470-41997-7. [Google Scholar]
  5. Samaddar, S.; Das, T.; Chowdhury, A.K.; Singh, M. Manufacturing of Engineering Components with Austempered Ductile Iron—A Review. Mater. Today Proc. 2018, 5, 25615–25624. [Google Scholar] [CrossRef]
  6. Hsu, C.H.; Chuang, T.L. Influence of Stepped Austempering Process on the Fracture Toughness of Austempered Ductile Iron. Metall. Mater. Trans. A Phys. Metall. Mater. Sci. 2001, 32, 2509–2514. [Google Scholar] [CrossRef]
  7. Concli, F. Austempered Ductile Iron (ADI) for Gears: Contact and Bending Fatigue Behavior. Procedia Struct. Integr. 2018, 8, 14–23. [Google Scholar] [CrossRef]
  8. Geffroy, P.-M.; Lakehal, M.; Goñi, J.; Beaugnon, E.; Silvain, J.-F. Thermal and Mechanical Behaviour of Grey Cast Iron and Ductile Iron Castings Using Magnetic Molding and Lost Foam Processes. J. Mater. Process. Technol. 2009, 209, 4103–4111. [Google Scholar] [CrossRef]
  9. Gupta, K.; Jain, N.K.; Laubscher, R.F. Advanced Gear Manufacturing and Finishing (Classical and Modern Processes); Elsevier Ltd.: London, UK, 2017; ISBN 978-0-12-804460-5. [Google Scholar]
  10. Davis, J.R. Surface Engineering, 1st ed.; Davis, J.R., Ed.; ASM International The Material Information Society: Materials Park, OH, USA, 2001; ISBN 0871707004. [Google Scholar]
  11. Conrado, E.; Gorla, C.; Davoli, P.; Boniardi, M. A Comparison of Bending Fatigue Strength of Carburized and Nitrided Gears for Industrial Applications. Eng. Fail. Anal. 2017, 78, 41–54. [Google Scholar] [CrossRef]
  12. Dhanasekaran, S.; Gnanamoorthy, R. Gear Tooth Wear in Sintered Spur Gears under Dry Running Conditions. Wear 2008, 265, 81–87. [Google Scholar] [CrossRef]
  13. Imrek, H.; Düzcükoǧlu, H. Relation between Wear and Tooth Width Modification in Spur Gears. Wear 2007, 262, 390–394. [Google Scholar] [CrossRef]
  14. Pisula, J.M.; Budzik, G.; Przeszłowski, Ł. An Analysis of the Surface Geometric Structure and Geometric Accuracy of Cylindrical Gear Teeth Manufactured with the Direct Metal Laser Sintering (DMLS) Method. J. Mech. Eng. 2019, 65, 78–86. [Google Scholar] [CrossRef] [Green Version]
  15. Kawalec, A.; Wiktor, J.; Ceglarek, D. Comparative Analysis of Tooth-Root Strength Using ISO and AGMA Standards in Spur and Helical Gears with FEM-Based Verification. J. Mech. Des. Trans. ASME 2006, 128, 1141–1158. [Google Scholar] [CrossRef]
  16. Liu, L.; Pines, D.J. The Influence of Gear Design Parameters on Gear Tooth Damage Detection Sensitivity. J. Mech. Des. Trans. ASME 2002, 124, 794–804. [Google Scholar] [CrossRef]
  17. Ristivojević, M.; Lazović, T.; Vencl, A. Studying the Load Carrying Capacity of Spur Gear Tooth Flanks. Mech. Mach. Theory 2013, 59, 125–137. [Google Scholar] [CrossRef]
  18. Venkatesh, B.; Prabhakar Vattikuti, S.V.; Deva Prasad, S. Investigate the Combined Effect of Gear Ratio, Helix Angle, Facewidth and Module on Bending and Compressive Stress of Steel Alloy Helical Gear. Procedia Mater. Sci. 2014, 6, 1865–1870. [Google Scholar] [CrossRef] [Green Version]
  19. Xu, X.; Lai, J.; Lohmann, C.; Tenberge, P.; Weibring, M.; Dong, P. A Model to Predict Initiation and Propagation of Micro-Pitting on Tooth Flanks of Spur Gears. Int. J. Fatigue 2019, 122, 106–115. [Google Scholar] [CrossRef]
  20. Weibring, M.; Gondecki, L.; Tenberge, P. Simulation of Fatigue Failure on Tooth Flanks in Consideration of Pitting Initiation and Growth. Tribol. Int. 2019, 131, 299–307. [Google Scholar] [CrossRef]
  21. Budynas, R.G.; Nisbett, J.K. Mechanical Engineering Design, 9th ed.; McGraw-Hill Education: New York, NY, USA, 2015; Volume XXXIII, ISBN 9780073398204. [Google Scholar]
  22. Das, D.; Bhattacharya, S.; Sarkar, B. Decision-Based Design-Driven Material Selection: A Normative-Prescriptive Approach for Simultaneous Selection of Material and Geometric Variables in Gear Design. Mater. Des. 2016, 92, 787–793. [Google Scholar] [CrossRef]
  23. Boiadjiev, I.; Witzig, J.; Tobie, T.; Stahl, K. Tooth Flank Fracture—Basic Principles and Calculation Model for a Sub Surface Initiated Fatigue Failure Mode of Case Hardened Gears. In Proceedings of the International Gear Conference 2014, Lyon, France, 26–28 August 2014; pp. 670–680. [Google Scholar] [CrossRef] [Green Version]
  24. Wan, B.; Barber, G.C.; Tao, C.; Sun, X.; Xu, R. Characteristics of Tempering Response of Austempered Ductile Iron. J. Mater. Res. Technol. 2017, 7, 198–202. [Google Scholar] [CrossRef]
  25. Myszka, D.; Kłębczyk, M.; Kwiatkowski, L.; Zych, A. The Surface Layer of Austempered Ductile Iron Investment Castings Properties. Arch. Foundry Eng. 2009, 9, 157–162. [Google Scholar]
  26. Cao, H.T.; Dong, X.P.; Pan, Z.; Wu, X.W.; Huang, Q.W.; Pei, Y.T. Surface Alloying of High-Vanadium High-Speed Steel on Ductile Iron Using Plasma Transferred Arc Technique: Microstructure and Wear Properties. Mater. Des. 2016, 100, 223–234. [Google Scholar] [CrossRef]
  27. Jeshvaghani, R.A.; Jaberzadeh, M.; Zohdi, H.; Shamanian, M. Microstructural Study and Wear Behavior of Ductile Iron Surface Alloyed by Inconel 617. Mater. Des. 2014, 54, 491–497. [Google Scholar] [CrossRef]
  28. Ceschini, L.; Campana, G.; Pagano, N.; Angelini, V. Effect of Laser Surface Treatment on the Dry Sliding Behaviour of the EN-GJS400-12 Ductile Cast Iron. Tribiol. Int. 2016, 104, 342–351. [Google Scholar] [CrossRef]
  29. Hurtado-Delgado, E.; Huerta-Larumbe, L. Microcracks Reduction in Laser Hardened Layers of Ductile Iron. Coatings 2021, 11, 368. [Google Scholar] [CrossRef]
  30. Zeng, D.; Lu, L.; Zhang, N.; Zhang, Y.; Zhang, J. Investigation on the Scuffing Resistance of Ductile Cast Iron as Affected by Fine Particle Bombardment to Produce Surface Hardened Layer and Micro-Dimpled Surface. Wear 2017, 378–379, 174–182. [Google Scholar] [CrossRef]
  31. Zammit, A.; Abela, S.; Charles, J.; Michalczewski, R.; Kalbarczyk, M.; Grech, M. Scuffing and Rolling Contact Fatigue Resistance of Discrete Laser Spot Hardened Austempered Ductile Iron. Wear 2019, 422–423, 100–107. [Google Scholar] [CrossRef]
  32. Hsu, C.H.; Chen, M.L.; Hu, C.J. Microstructure and Mechanical Properties of 4% Cobalt and Nickel Alloyed Ductile Irons. Mater. Sci. Eng. A 2007, 444, 339–346. [Google Scholar] [CrossRef]
  33. Pongsak, C.; Chaengkham, P. Continuously Cast Ductile Iron : Processing, Structures, and Properties. J. Mater. Process. Tech. 2011, 211, 1372–1378. [Google Scholar] [CrossRef]
  34. Romano, J.M.; Liang, Y.; Dashtbozorg, B.; Dong, H.; Penchev, P.; Dimov, S.S. Combined Surface Hardening and Laser Patterning Approach for Functionalising Stainless Steel Surfaces. Appl. Surf. Sci. 2018, 439, 516–524. [Google Scholar] [CrossRef]
  35. Shamanian, M.; Abarghouie, S.M.R.M.; Pour, S.R.M. Effects of Surface Alloying on Microstructure and Wear Behavior of Ductile Iron. Mater. Des. 2010, 31, 2760–2766. [Google Scholar] [CrossRef]
  36. Nixon, R.G.S.; Mohanty, B.S. Friction Surfacing of Metal Coatings on Stainless Steel AISI 304 over Spheroidal Graphite Iron Substrate. Adv. Mater. Res. 2013, 816–817, 271–275. [Google Scholar] [CrossRef]
  37. Mahmood, K.; Stevens, N.; Pinkerton, A.J. Laser Surface Modification Using Inconel 617 Machining Swarf as Coating Material. J. Mater. Process. Technol. 2012, 212, 1271–1280. [Google Scholar] [CrossRef]
  38. Li, Y.; Dong, S.; Yan, S.; Liu, X.; He, P.; Xu, B. Microstructure Evolution during Laser Cladding Fe-Cr Alloy Coatings on Ductile Cast Iron. Opt. Laser Technol. 2018, 108, 255–264. [Google Scholar] [CrossRef]
  39. Qian, M.; Harada, S.; Kuroshima, Y.; Nagayoshi, H. Surface Hardening of Ductile Cast Iron Using Stainless Steel. Mater. Sci. Eng. A 1996, 208, 88–92. [Google Scholar] [CrossRef]
  40. Orłowicz, A.W.; Trytek, A. Effect of Rapid Solidification on Sliding Wear of Iron Castings. Wear 2003, 254, 154–163. [Google Scholar] [CrossRef]
  41. Hurst, S. Metal Casting Appropriate Technology in the Small Foundry; Intermediate Technology Publications Ltd.: London, UK, 1996; ISBN 1 85339 197 2. [Google Scholar]
  42. Campbell, J. Complete Casting Handbook Metal Casting Process, Techniques and Design, 1st ed.; Elsevier Ltd.: Alpharetta, GA, USA, 2011; ISBN 9781856178099. [Google Scholar]
  43. da Silva, L.J.; Scheuer, C.J.; D’Oliveira, A.S.C.M. Effect of Microstructure on Wear Performance of NiCrSiBC Coatings. Wear 2019, 428–429, 387–394. [Google Scholar] [CrossRef]
  44. Lagos, M.A.; Agote, I.; Leizaola, I.; Lopez, D.; Calero, J.A. Fabrication of Chromium Carbide Cermets by Electric Resistance Sintering Process: Processing, Microstructure and Mechanical Properties. Int. J. Refract. Met. Hard Mater. 2021, 95, 105417. [Google Scholar] [CrossRef]
  45. Laino, S.; Sikora, J.A.; Dommarco, R.C. Development of Wear Resistant Carbidic Austempered Ductile Iron (CADI). Wear 2008, 265, 1–7. [Google Scholar] [CrossRef]
  46. König, M.; Svensson, I.L.; Wessén, M. The Influence of Alloying Elements on Chill Formation in CGI. Key Eng. Mater. 2011, 457, 126–131. [Google Scholar] [CrossRef]
  47. Jaromin, M.; Dojka, R.; Jezierski, J.; Dojka, M. Influence of Type and Shape of the Chill on Solidification Process of Steel Casting. Arch. Foundry Eng. 2019, 19, 35–40. [Google Scholar] [CrossRef]
  48. Wankhede, D.M.; Narkhede, B.E.; Mahajan, S.K.; Choudhari, C.M. Influence of Pouring Temperature and External Chills on Mechanical Properties of Aluminum Silicon Alloy Castings. Mater. Today Proc. 2018, 5, 17627–17635. [Google Scholar] [CrossRef]
  49. Pavithra, H.S.; Anantha Prasad, M.G. Study on Microstructure and Mechanical Properties of Al/SiO2/C Hybrid Metal Matrix Composite, with the Influence of Chills. Mater. Today Proc. 2018, 5, 6053–6058. [Google Scholar] [CrossRef]
  50. Gafur, M.A.; Haque, M.N.; Prabhu, K.N. Effect of Chill Thickness and Superheat on Casting/Chill Interfacial Heat Transfer during Solidification of Commercially Pure Aluminium. J. Mater. Process. Technol. 2003, 133, 257–265. [Google Scholar] [CrossRef]
  51. Mehr, F.F.; Reilly, C.; Cockcroft, S.; Maijer, D.; Mackay, R. Effect of Chill Cooling Conditions on Cooling Rate, Microstructure and Casting/Chill Interfacial Heat Transfer Coefficient for Sand Cast A319 Alloy. Int. J. Cast Met. Res. 2014, 27, 288–300. [Google Scholar] [CrossRef]
  52. Elsawy, E.E.T.; Mahallawi, I.S.E. El Effect of Manganese Silicon and Chromium Additions on Microstructure and Waer Characteristics of Grey Cast Iron Suger Industries Applications. Wear 2017, 390–391, 113–124. [Google Scholar] [CrossRef]
  53. Kalpakjian, S.; Schmid, S.R. Manufacturing Engineering and Technology, 6th ed.; Pearson Publishing Company: Upper Saddle River, NJ, USA, 2010; ISBN 978-0-13-608168-5. [Google Scholar]
  54. Sohi, M.H.; Ebrahimi, M.; Ghasemi, H.; Shahripour, A. Microstructural Study of Surface Melted and Chromium Surface Alloyed Ductile Iron. Appl. Surf. Sci. 2012, 258, 7348–7353. [Google Scholar] [CrossRef]
  55. Guterres, N.D.F.S.; Rusnaldy; Widodo, A.; Syamsudin, A. Investigate Temperature Preheating on the Chill Plate to Identify Surface Characteristic on the Ductile Iron by Sand Casting. Int. J. Eng. Mater. Manuf. 2021, 6, 141–151. [Google Scholar] [CrossRef]
  56. Guterres, N.F.D.S.; Rusnaldy; Widodo, A.; Carwita, T. The Effect of Chills Thickness to Microstructure and Surface Hardness Layer on Specimen Ductile Cast Iron. AIP Conf. Proc. 2020, 2384, 040004. [Google Scholar]
  57. Hughes, I.C.H. ASM Metals Handbook, Volume 15 Casting; ASM International: Materials Park, OH, USA, 1988. [Google Scholar]
  58. Janerka, K.; Kostrzewski, Ł.; Stawarz, M.; Jezierski, J. The Importance of SiC in the Process of Melting Ductile Iron with a Variable Content of Charge Materials. Materials 2020, 13, 1231. [Google Scholar] [CrossRef] [PubMed] [Green Version]
  59. Olawale, J.O.; Ibitoye, S.A.; Oluwasegun, K.M. Processing Techniques and Productions of Ductile Iron: A Review. Int. J. Sci. Eng. Res. 2016, 7, 397–423. [Google Scholar]
  60. Alabbasian, F.; Boutorabi, S.M.A.; Kheirandish, S. Effect of Inoculation and Casting Modulus on the Microstructure and Mechanical Properties of Ductile Ni-Resist Cast Iron. Mater. Sci. Eng. A 2016, 651, 467–473. [Google Scholar] [CrossRef]
  61. Nur, R.; Muas, M.; Apollo; Risal, S. Effect of Current and Wire Speed on Surface Roughness in the Manufacturing of Straight Gear Using Wire-Cut EDM Process. IOP Conf. Ser. Mater. Sci. Eng. 2019, 619, 012002. [Google Scholar] [CrossRef] [Green Version]
  62. Bouquet, J.; Hensgen, L.; Klink, A.; Jacobs, T.; Klocke, F.; Lauwers, B. Fast Production of Gear Prototypes—A Comparison of Technologies. Procedia CIRP 2014, 14, 77–82. [Google Scholar] [CrossRef]
  63. Interanational, A. ASTM E3-01 Standard Guide for Preparation of Metallographic Specimens Standard Guide for Preparation of Metallographic Specimens. In ASTM International; Internasional ASTM: West Conshohocken, PA, USA, 2017; Volume 03.01, pp. 1–12. [Google Scholar]
  64. American Gear Manufacturers Association. ANSI/AGMA 2004---B89 Gear Materials And Heat Treatment Manual. In ANSI/AGMA Standard; AGMA STANDARD: Alexandria, VA, USA, 1995; Volume 89, p. 71. ISBN 1-55589-524-7. [Google Scholar]
  65. ASTM Standard G99; Standard Test Method for Wear Testing with a Pin-on-Disk Apparatus. ASTM International: Materials Park, OH, USA, 2006; Volume V.
  66. Ruff, A.W. ASM Handbook Vol. 18 Friction, Lubrication and Wear Technology; ASM Handbook Committee, Ed.; ASM International Handbook: Materials Park, OH, USA, 1992; Volume 18, ISBN 0-87170-380-7. [Google Scholar]
  67. Górny, M.; Tyrała, E. Effect of Cooling Rate on Microstructure and Mechanical Properties of Thin-Walled Ductile Iron Castings. J. Mater. Eng. Perform. 2013, 22, 300–305. [Google Scholar] [CrossRef] [Green Version]
  68. Vicente, A.; De Souza, R.L.; Espinosa, D.C.R.; De Aguiar, R.R.; Paul, P.; Botelho, A.B. Effect of Relative Plate Thickness in the Heat Flow and Cooling Rate during Welding of Super Duplex Stainless Steel. Saudi J. Eng. Technol. 2020, 5, 244–250. [Google Scholar] [CrossRef]
  69. Megahed, H.; El-Kashif, E.; Shash, A.Y.; Essam, M.A. Effect of Holding Time, Thickness and Heat Treatment on Microstructure and Mechanical Properties of Compacted Graphite Cast Iron. J. Mater. Res. Technol. 2019, 8, 1188–1196. [Google Scholar] [CrossRef]
  70. Washko, S.D.; Aggen, G. ASM Handbook Volume 1 Properties and Selection: Irons Steels and High Performance Alloys, 10th ed.; ASM International: Materials Park, OH, USA, 1990; ISBN 0-87170-380-7. [Google Scholar]
  71. SAE J434; Automotive Ductile (Nodular) Iron Castings. SAE Internasional: Warrendale, PA, USA, 1986; pp. 1–10.
  72. Davidson, J.H. Microstructure of Steels and Cast Irons; Springer: New York, NY, USA, 2004; ISBN 3540209638. [Google Scholar]
  73. Radzikowska, J.M. ASM Handbook Volume 9, Metallography and Microstructures; ASM Handbook Committee, Ed.; ASM International Handbook: Materials Park, OH, USA, 2004; ISBN 0-87170-706-3. [Google Scholar]
  74. Qi, D.; Shuming, X.; Bo, Q. Effect of Casting Pressure on Microstructural Evolution and Wear Behavior of Fe-Cr-C White Cast Iron. Mater. Res. Express 2019, 6, 66538. [Google Scholar] [CrossRef]
  75. Meng, X.M.; Zhang, J.B.; Han, W.; Zhao, J.; Liang, Y.L. Influence of Annealing Treatment on the Microstructure and Mechanical Performance of Cold Sprayed 304 Stainless Steel Coating. Appl. Surf. Sci. 2011, 258, 700–704. [Google Scholar] [CrossRef]
  76. Günen, A.; Kalkandelen, M.; Karahan, I.H.; Kurt, B.; Kanca, E.; Gök, M.S.; Karakaş, M.S. Properties and Corrosion Behavior of Chromium and Vanadium Carbide Composite Coatings Produced on Ductile Cast Iron by Thermoreactive Diffusion Technique. J. Eng. Mater. Technol. Trans. ASME 2020, 142, 041008. [Google Scholar] [CrossRef]
  77. Sun, W.; Dierolf, V.; Jain, H. Molecular Dynamics Simulation of the Effect of Cooling Rate on the Structure and Properties of Lithium Disilicate Glass. J. Non. Cryst. Solids 2021, 569, 120991. [Google Scholar] [CrossRef]
  78. Sungkhaphaitoon, P.; Plookphol, T. Effect of Cooling Rate on the Microstructure and Mechanical Properties of Sn-0.7wt.%Cu Solder Alloy. Key Eng. Mater. 2016, 675–676, 513–516. [Google Scholar] [CrossRef]
  79. Cardoso, P.H.S.; Israel, C.L.; Strohaecker, T.R. Abrasive Wear in Austempered Ductile Irons: A Comparison with White Cast Irons. Wear 2014, 313, 29–33. [Google Scholar] [CrossRef]
  80. Berns, H. Comparison of Wear Resistant MMC and White Cast Iron. Wear 2003, 254, 47–54. [Google Scholar] [CrossRef]
  81. Errichello, R.L. AGMA 11FT17 Technical Paper Morphology of Micropitting. In AGMA Technical Resources; AGMA National Standard: Alexandria, VA, USA, 2011; p. 19. ISBN 978-1-61481-016-2. [Google Scholar]
  82. Ribeiro, L.; Barbosa, A.; Viana, F.; Baptista, A.M.; Dias, C.; Ribeiro, C.A. Abrasion Wear Behaviour of Alloyed and Chilled Cast Irons. Wear 2011, 270, 535–540. [Google Scholar] [CrossRef]
  83. Tian, H.; Wang, C.; Guo, M.; Tang, Z.; Wei, S.; Xu, B. Study of the Frictional-Wear Performance and Abrasion Resistance Mechanism of a High-Speed Arc-Sprayed FeNiCrAl Coating. Surf. Coat. Technol. 2019, 370, 320–330. [Google Scholar] [CrossRef]
  84. Vélez, J.M.; Tanaka, D.K.; Sinatora, A.; Tschiptschin, A.P. Evaluation of Abrasive Wear of Ductile Cast Iron in a Single Pass Pendulum Device. Wear 2001, 250–251, 1315–1319. [Google Scholar] [CrossRef] [Green Version]
  85. Cruz-Crespo, A.; Fernández-Fuentes, R.; Ferraressi, A.V.; Gonçalves, R.A.; Scotti, A. Microstructure and Abrasion Resistance of Fe-Cr-C and Fe-Cr-C-Nb Hardfacing Alloys Deposited by S-FCAW and Cold Solid Wires. Soldag. Inspeção 2016, 21, 342–353. [Google Scholar] [CrossRef] [Green Version]
  86. Atraszkiewicz, R.; Januszewicz, B.; Kaczmarek, Ł.; Stachurski, W.; Dybowski, K.; Rzepkowski, A. High Pressure Gas Quenching: Distortion Analysis in Gears after Heat Treatment. Mater. Sci. Eng. A 2012, 558, 550–557. [Google Scholar] [CrossRef]
  87. ANSI/AGMA 2000-A88 American National Standard. Gera Classification and Inspection Handbook: Tolerance and Measuremnet Methodes for Unassembled Spur and Helical Gears. In Handbook; AGMA Association, Ed.; American National Standard: Washington, DC, USA, 1988; Volume 1988, p. 147. ISBN 155589495X. [Google Scholar]
  88. Masuyama, T.; Miyazaki, N. Evaluation of Load Capacity of Gears with an Asymmetric Tooth Profile. Int. J. Mech. Mater. Eng. 2016, 11, 11. [Google Scholar] [CrossRef] [Green Version]
Figure 1. The benchmark gear. (a) Moldings, (b) gear pattern, and (c) the sample.
Designs 07 00056 g001
Figure 2. The experimental setup.
Designs 07 00056 g002
Figure 3. Gear geometry terminology relevant to the measurements in this study.
Designs 07 00056 g003
Figure 4. Measurement of gear geometry using the Creaform HandySCAN 3D Laser Scanner. (a) Scanning position and distance, (b) displaying the results of the scan on the laptop screen, and (c) determining the size of the line drawing from CAD/CAM software.
Designs 07 00056 g004
Figure 5. The gear sectioning to be tested.
Designs 07 00056 g005
Figure 6. Photographs of the gears after surface hardening by using chill casting with 10× magnifications.
Designs 07 00056 g006
Figure 7. Microstructure results on the outer skin layer after chill hardening. (a) Center area before etching, (b) center area observed at 100× magnification after etching, (c) center area observed at 200× magnification after etching, (d) surface region for G2 sample and T1, (e) surface region for G2 and T4, (f) surface region for G2 and T8, (g) surface region for G3 and T1, (h) surface region for G3 and T4, (i) surface region for G3 and T8, (j) surface region for G4 and T1, (k) surface region for G4 and T4, and (l) surface region for G4 and T8. (SG = spheroidal graphite; F = ferrite; PC = primary carbides; DL = diffusion layer; P = perlite; C = cementite; M = martensite; L = ledeburite).
Designs 07 00056 g007
Figure 8. SEM EDX analysis of the flank surface topography after a diffusion G2 sample. (ac) G3 sample and (df) G4 sample (gi).
Designs 07 00056 g008
Figure 9. Microhardness test results. (a) Average hardness value on the outer skin layer to the center area and (b) focus test point on the outer skin layer.
Designs 07 00056 g009
Figure 10. Using an optical microscope, a surface scar shape is investigated to evaluate wear qualities. (a) Wear scar on the G2 sample before profile cutting, (b) wear scar on the G3 sample before profile cutting, (c) wear scar on the G4 sample before profile cutting, (d) wear scar on the G2 sample after profile cutting, (e) wear scar on the G3 sample after profile cutting, and (f) wear scar on the G4 sample after profile cutting.
Designs 07 00056 g010
Figure 11. Dimensional change in tooth thickness for the G2 sample. (a) Dimensional change after casting process, (b) tooth profile illustration of gear number 2 (T2) to show the dimensional changes that occur in the tooth thickness after the casting process, and (c) dimensional error after cutting profile.
Designs 07 00056 g011aDesigns 07 00056 g011b
Figure 12. Dimensional change in tooth thickness for the G3 sample. (a) Dimensional change after casting process, (b) tooth profile illustration of gear number 6 (T6) to show the dimensional changes that occur in the tooth thickness after the casting process, and (c) dimensional error after cutting profile.
Designs 07 00056 g012aDesigns 07 00056 g012b
Figure 13. Dimensional change in tooth thickness for the G4 gear sample. (a) Dimensional change after casting process, (b) tooth profile illustration of gear number 1 (T1) to show the dimensional changes that occur in the tooth thickness after the casting process, and (c) dimensional error after cutting profile.
Designs 07 00056 g013
Figure 14. Dimensional change on PCD for G2 gear sample. (a) Dimensional change after casting process, (b) tooth profile illustration of gear number 10 (T10) to show the dimensional changes that occur in the PCD area after the casting process, and (c) dimensional error after cutting profile.
Designs 07 00056 g014
Figure 15. Dimensional change on PCD for G3 gear sample. (a) Dimensional change after casting process, (b) tooth profile illustration of gear number 9 (T9) to show the dimensional changes that occur in the PCD area after the casting process, and (c) dimensional error after cutting profile.
Designs 07 00056 g015
Figure 16. Dimensional change on PCD for G4 gear sample. (a) Dimensional change after casting process, (b) tooth profile illustration of gear number 9 (T9) to show the dimensional changes that occur in the PCD area after the casting process, and (c) dimensional error after cutting profile.
Designs 07 00056 g016
Figure 17. Dimensional change on ACD for G2 gear sample. (a) Dimensional change after casting process, (b) tooth profile illustration of gear number 8 (T8) to show the dimensional changes that occur in the ACD area after the casting process, and (c) dimensional error after cutting profile.
Designs 07 00056 g017
Figure 18. Dimensional change on ACD for G3 gear sample. (a) Dimensional change after casting process, (b) tooth profile illustration of gear number 3 (T3) to show the dimensional changes that occur in the ACD area after the casting process, and (c) dimensional error after cutting profile.
Designs 07 00056 g018
Figure 19. Dimensional change on ACD for G4 gear sample. (a) Dimensional change after casting process, (b) tooth profile illustration of gear number 1 (T1) to show the dimensional changes that occur in the ACD area after the casting process, and (c) dimensional error after cutting profile.
Designs 07 00056 g019aDesigns 07 00056 g019b
Table 1. 304 stainless steel’s chemical composition.
ElementsFeCSiMnNiCrSP
(wt.%)Balance0.0590.271.327.9119.340.0110.009
Table 2. Benchmark gear specifications produced using aluminum materials.
NomenclatureDimensionalDescriptions
Gear Teeth Number (N)100.27
Module (m)8N = Number of teeth and
D = Outside diameter,
m = D/N.
Face Width (f), (mm)25-
Diameter Shaft (r), (mm)40-
Whole Depth (ht), (mm)18(Addendum + Dedendum), (10 mm + 8 mm = 18 mm).
Pressure Angle (α)/(deg)25-
Addendum Circle Diameter (Do), (mm)96-
Tooth Thickness (t), (mm)15-
Circular Pitch (ϕ), (mm)76D = N/P
Table 3. Labels and parameters of gear pattern samples.
SpecimensModuleGear Teeth NumberEnhancer Plate Thickness (mm)Chill Thickness
(mm)
Average Dimension Value from All Teeth
Tooth Thickness (mm)Addendum Circle Diameter (mm)Pitch Circle Diameter (mm)
G1810--15.83096.02485.045
G28100.20.216.23096.41785.245
G38100.20.416.63096.81085.445
G48100.20.617.03097.20485.645
Table 4. Chemical composition of gear specimens.
ElementsCMnSiCrNiMoCuMgCePS
(wt.%)3.670.242.550.0230.070.040.120.0520.0050.0370.014
Table 5. Elemental content in the tooth flank region after diffusion.
SamplesElements (wt.%)
CNiNaMgMnSiCaAlZrSCr
G226.751.970.291.210.741.540.290.030.750.4113.91
G313.901.410.181.240.561.320.210.070.690.3914.40
G422.011.380.111.180.401.770.190.090.580.4011.18
Table 6. Wear rates on the flank surface before and after EDM wire cutting.
Gear SampleAverage Matrix Structure on the Surface (%)Average Hardness
on the Surface Flank (HV)
Wear Specifics (Ws) × 10−6 (mm2/kg)
before Profile Cuttingafter Profile Cuttingbefore Profile Cuttingafter Profile Cutting
G2(FeCrC)7C3 and M7C3861 HV461 HV5.1972.301
G3(FeCrC)7C3 and M7C3831 HV583 HV6.4082.279
G4CrC, M3C, and M7C3700 HV730 HV4.9014.803
Table 7. Each product’s resin gear pattern on the gear tooth profile is measured.
Gear NomenclatureGear SampleTooth Number
T1 T2 T3 T4 T5 T6 T7 T8T9 T10
Tooth Thickness (mm)G1 (benchmark)16.01015.41715.79316.17015.94715.99316.05315.53315.34716.040
G216.41015.81716.19316.57016.34716.39316.45315.93315.74716.440
G316.81016.21716.59316.97016.74716.79316.85316.33316.14716.840
G417.21016.61716.99317.37017.14717.19317.25316.73316.54717.240
Pitch Circle Diameter (mm)G1 (benchmark)85.02085.10084.99085.00084.97084.88085.11085.05085.22085.110
G285.22085.30085.19085.20085.17085.08085.31085.25085.42085.310
G385.42085.50085.39085.40085.37085.28085.51085.45085.62085.510
G485.62085.70085.59085.60085.57085.48085.71085.65085.82085.710
Addendum Circle Diameter (mm)G1 (benchmark)95.97796.01796.01096.02796.04796.00796.00396.13796.02795.987
G296.37796.41796.41096.42796.44796.40796.40396.53796.42796.320
G396.77796.81796.81096.82796.84796.80796.80396.93796.82796.653
G497.17797.21797.21097.22797.24797.20797.20397.33797.22796.987
Disclaimer/Publisher’s Note: The statements, opinions and data contained in all publications are solely those of the individual author(s) and contributor(s) and not of MDPI and/or the editor(s). MDPI and/or the editor(s) disclaim responsibility for any injury to people or property resulting from any ideas, methods, instructions or products referred to in the content.

