

Technical and 2E Analysis of Hybrid Energy Generating System with Hydrogen Production for SRM IST Delhi-NCR Campus

 , ,
, ,  and
and 
Abstract
1. Introduction
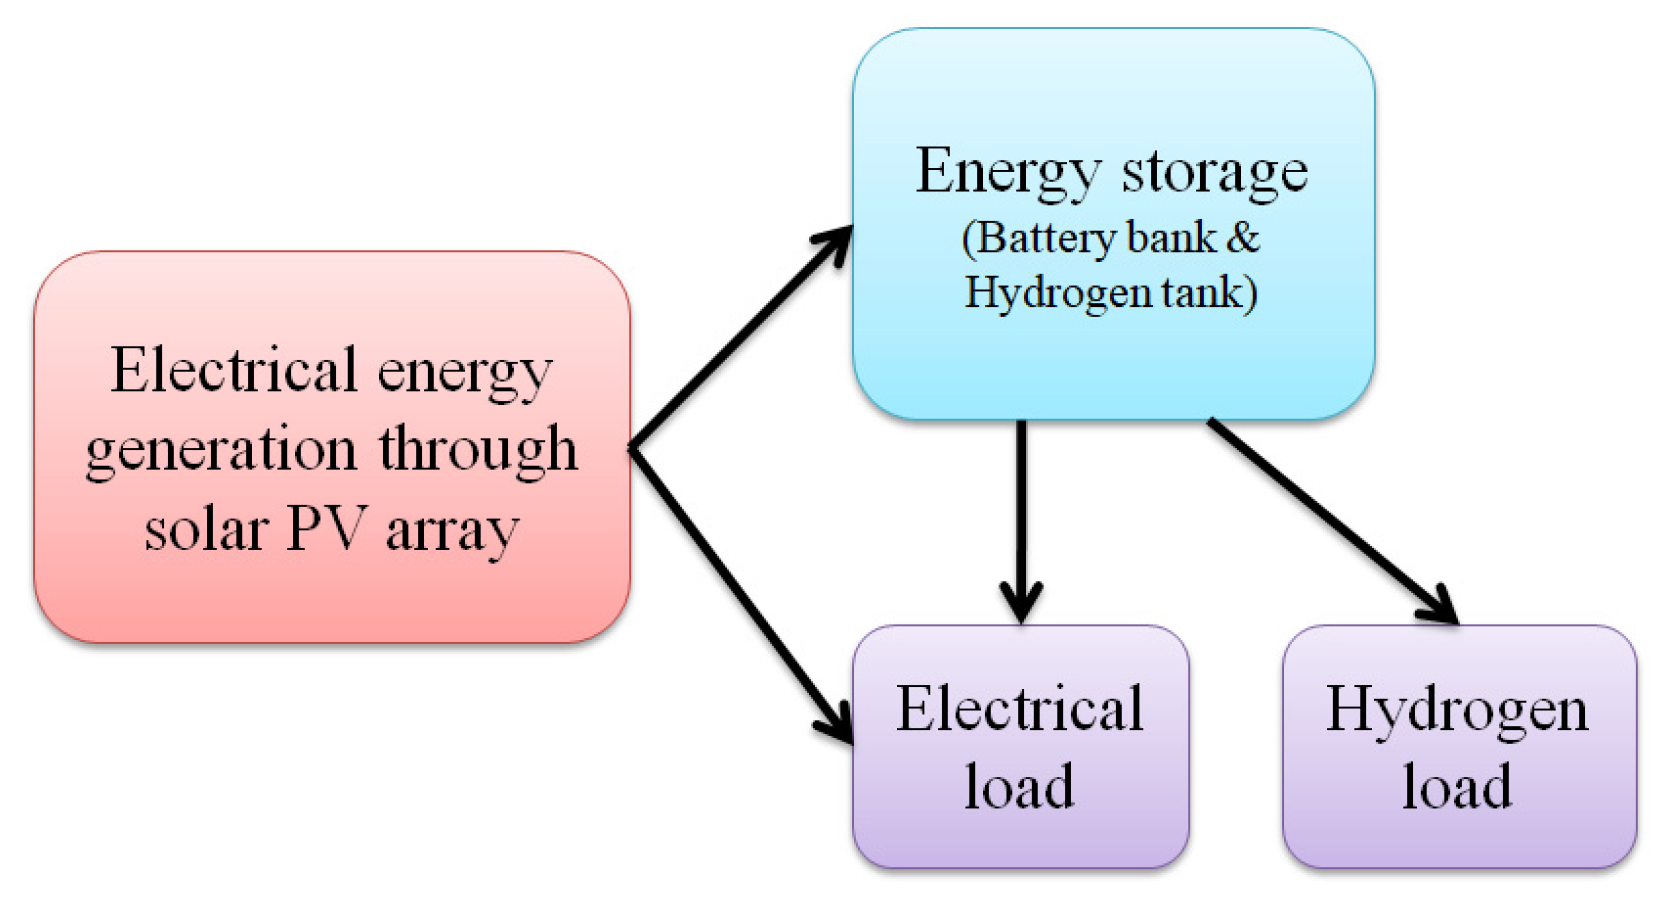
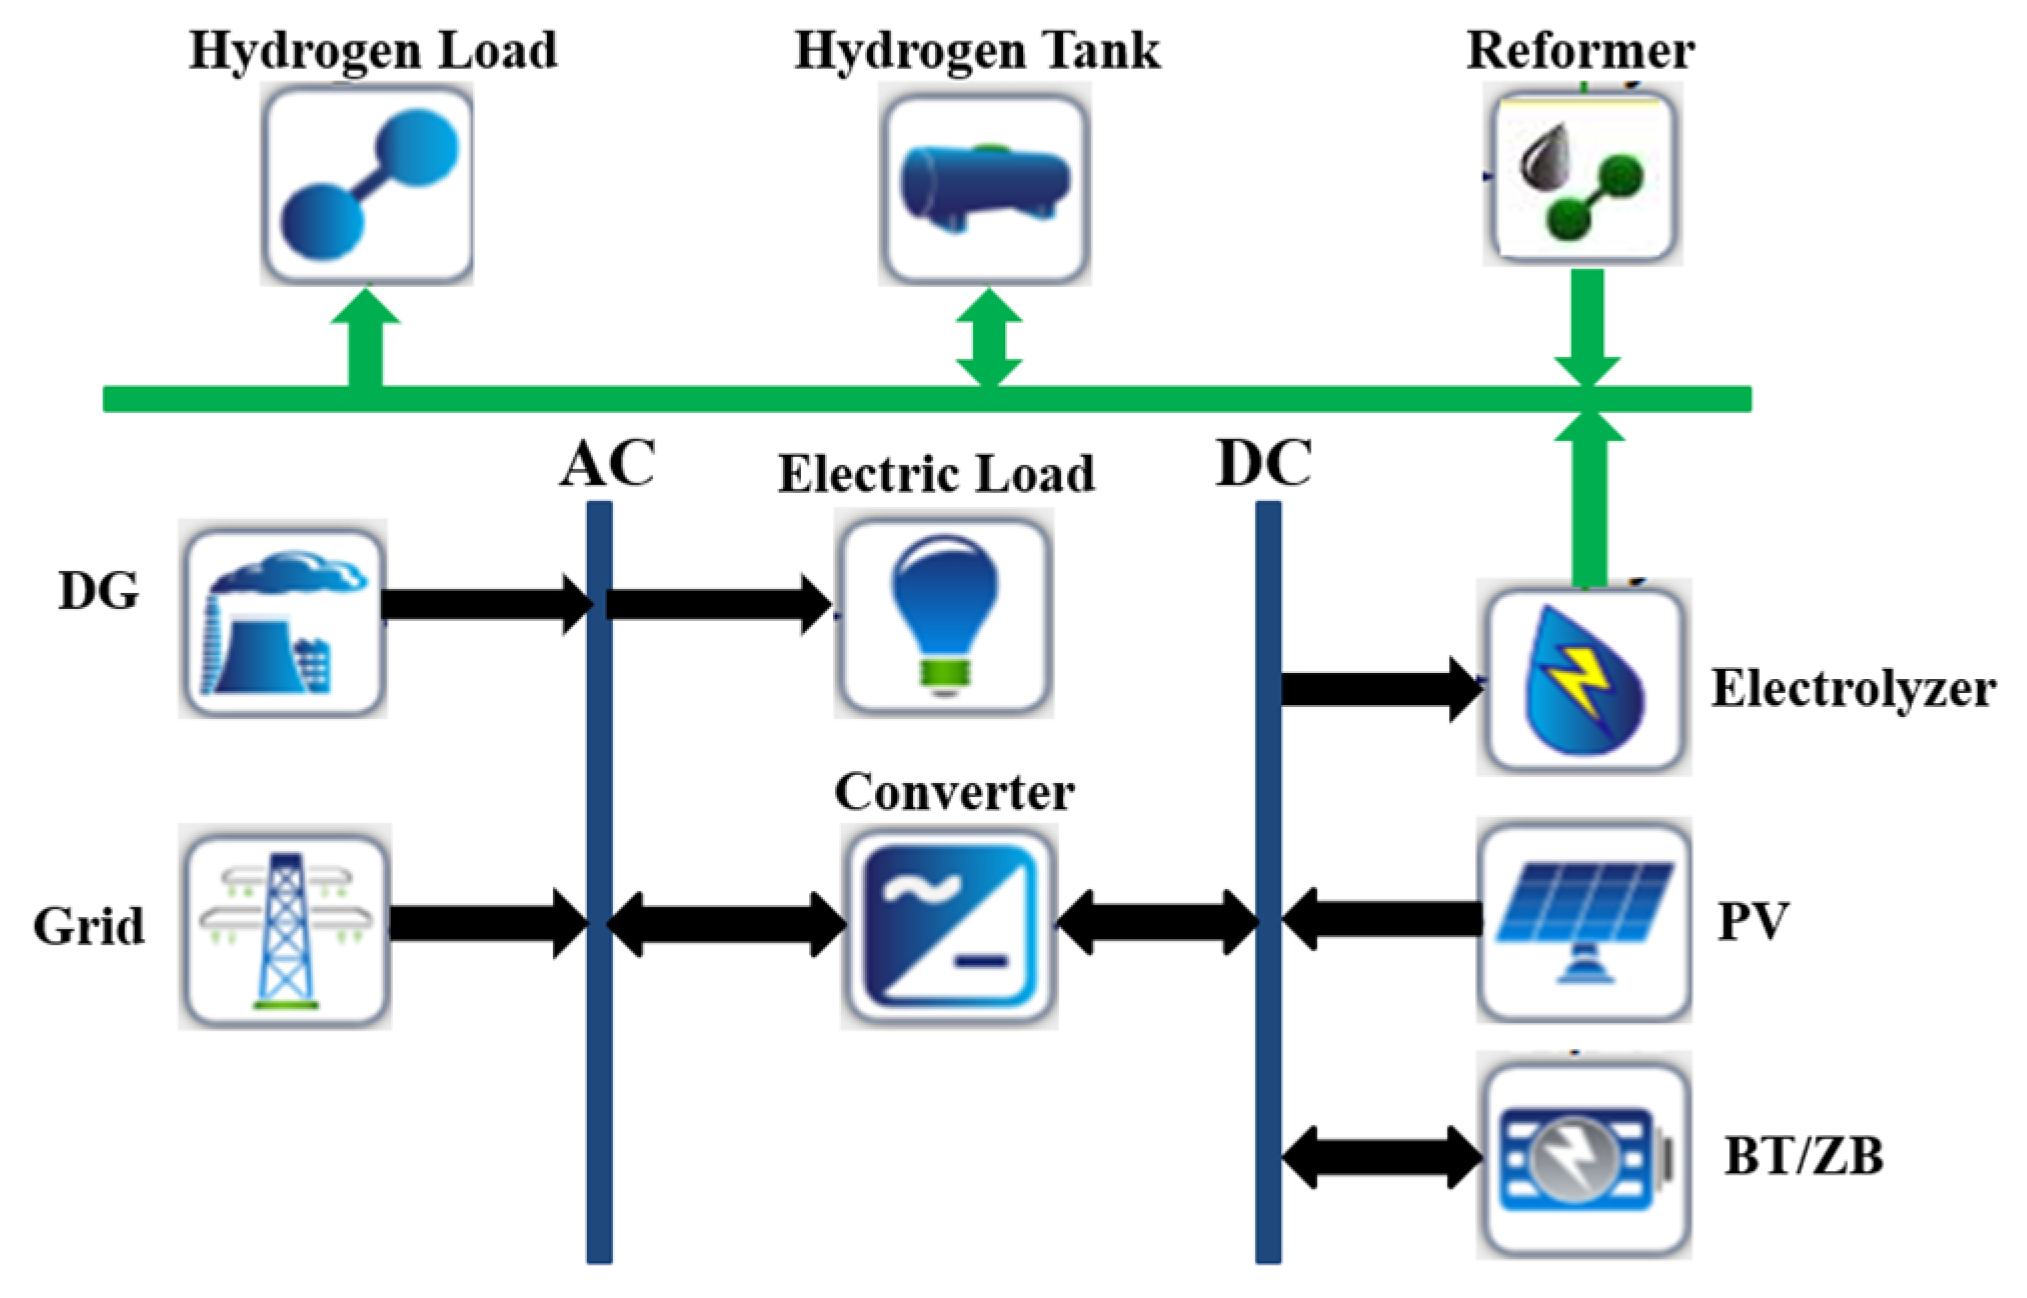
2. The Hybrid Energy Generating System (HEGS)
2.1. Energy Generation
2.2. Energy Conversion
2.3. Energy Storage
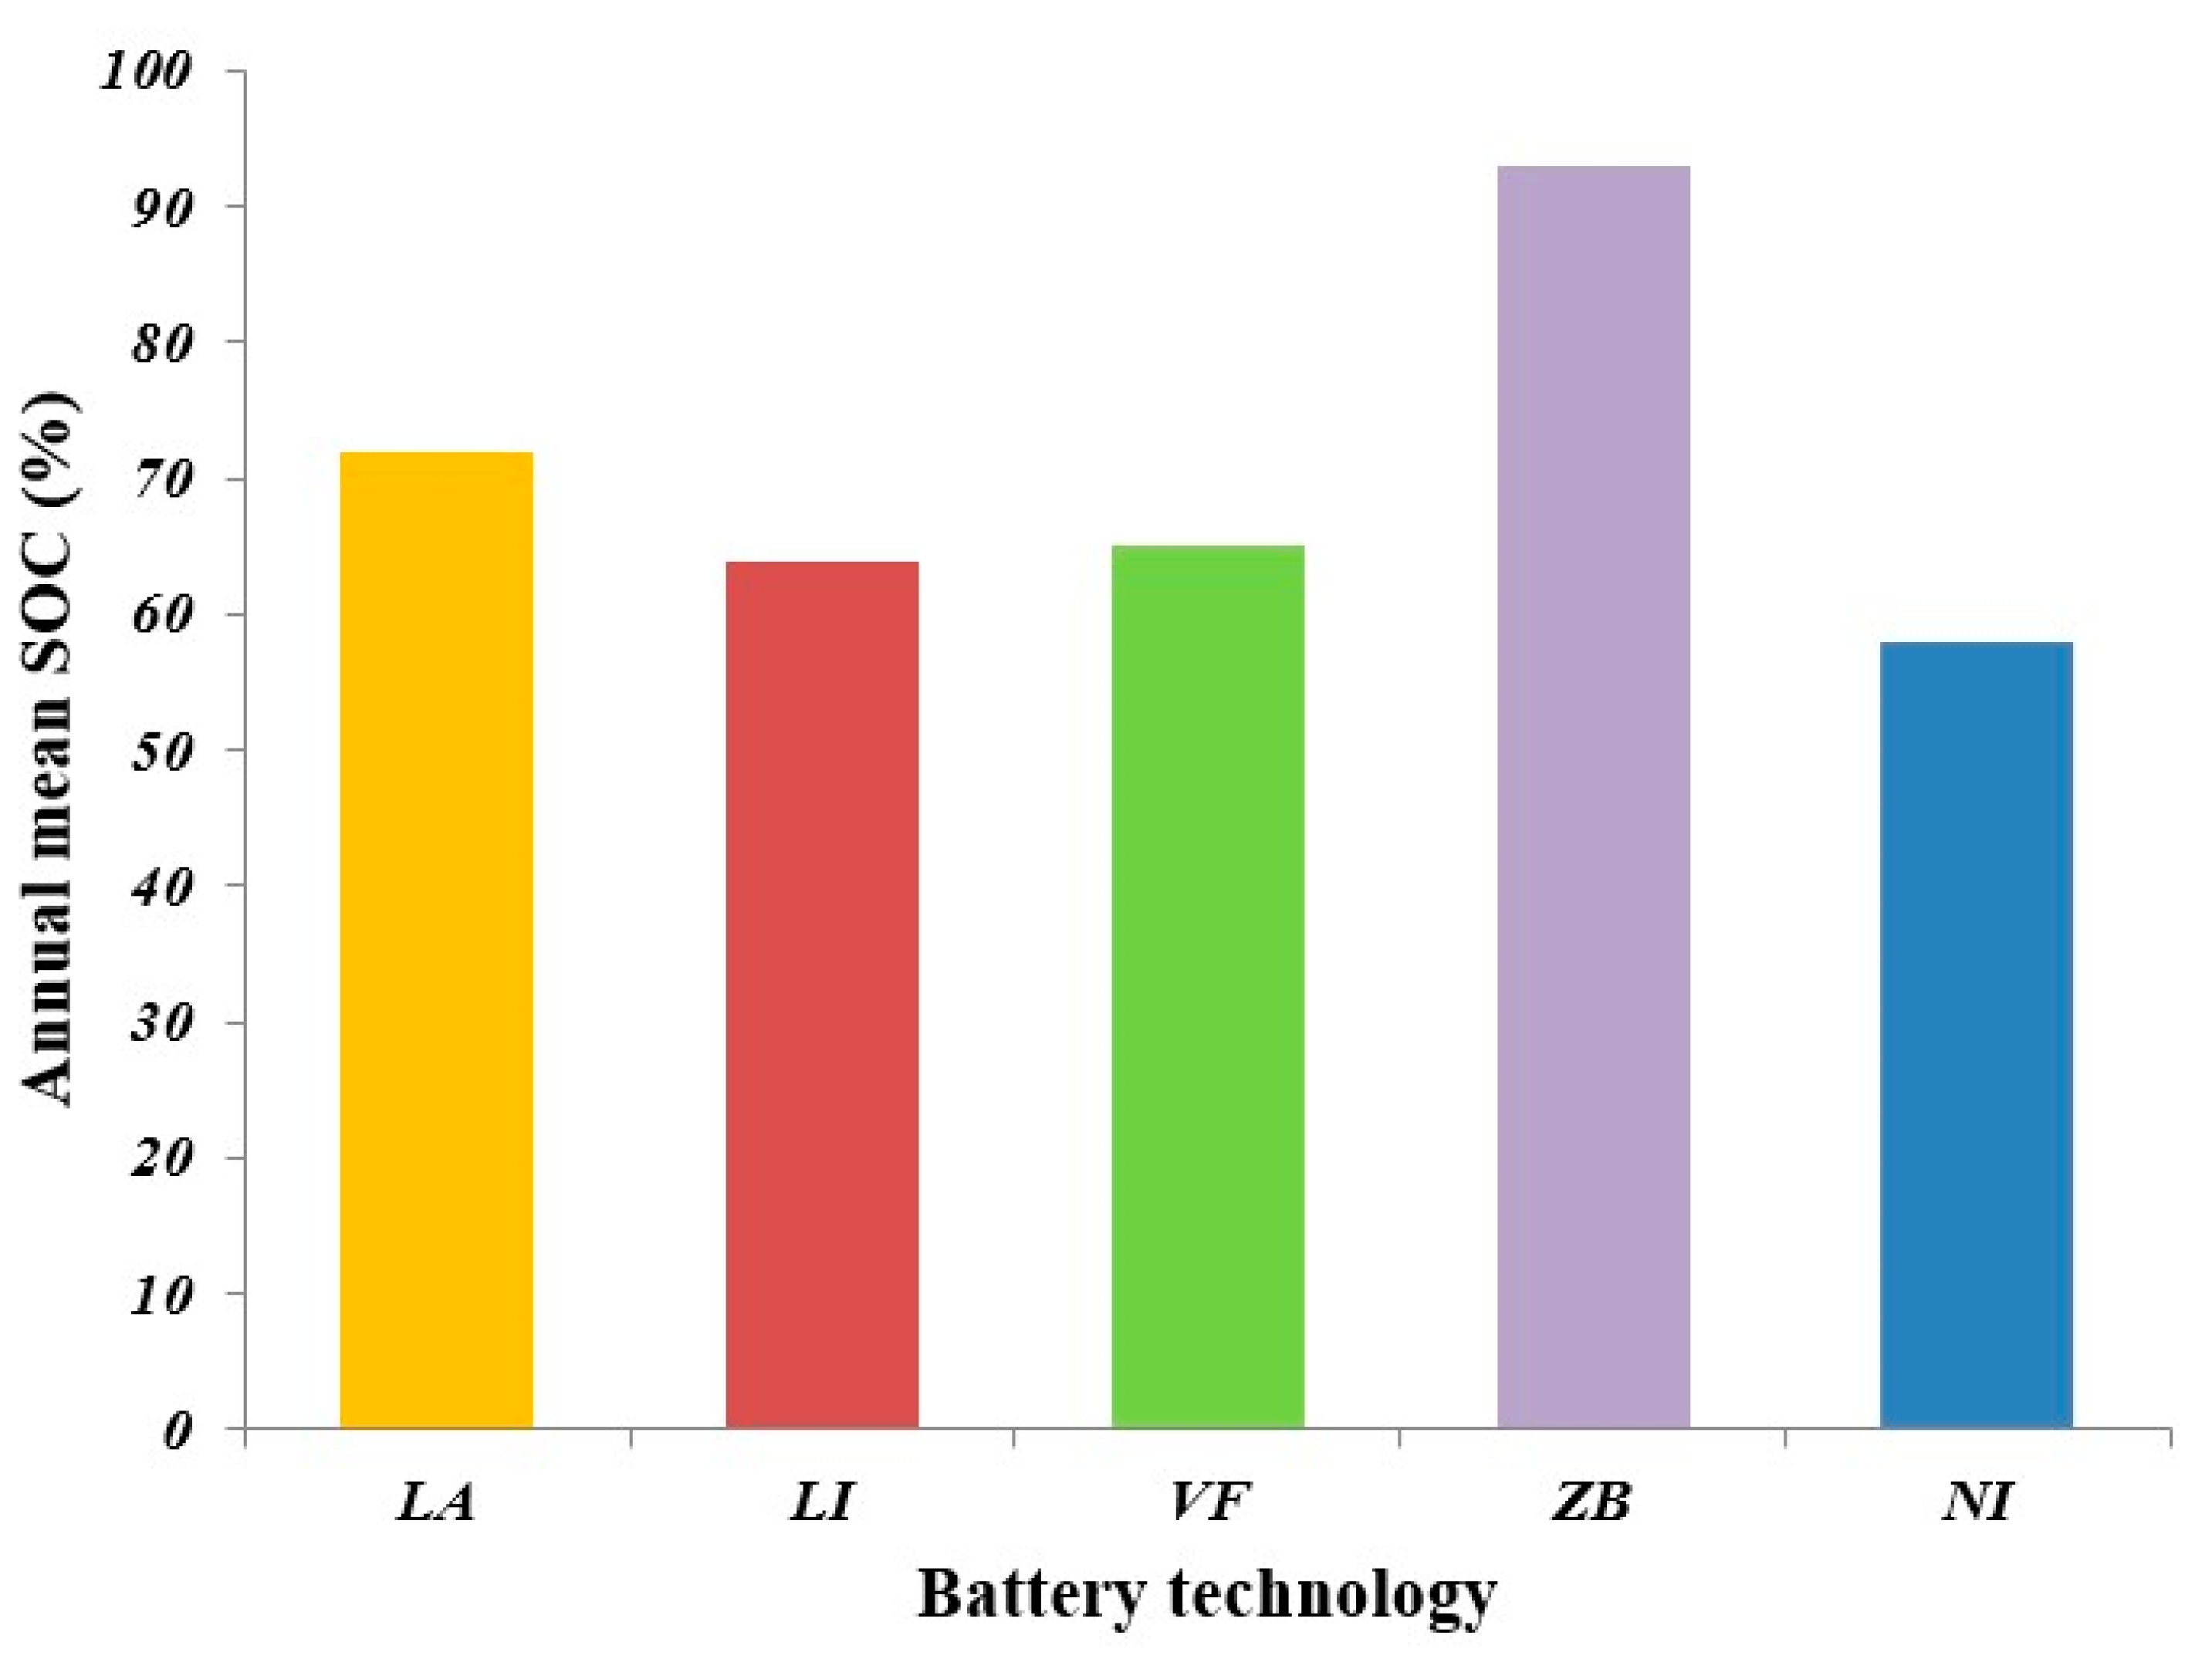
Comparison of Battery Technologies
3. Sizing and Economics of HEGS Components
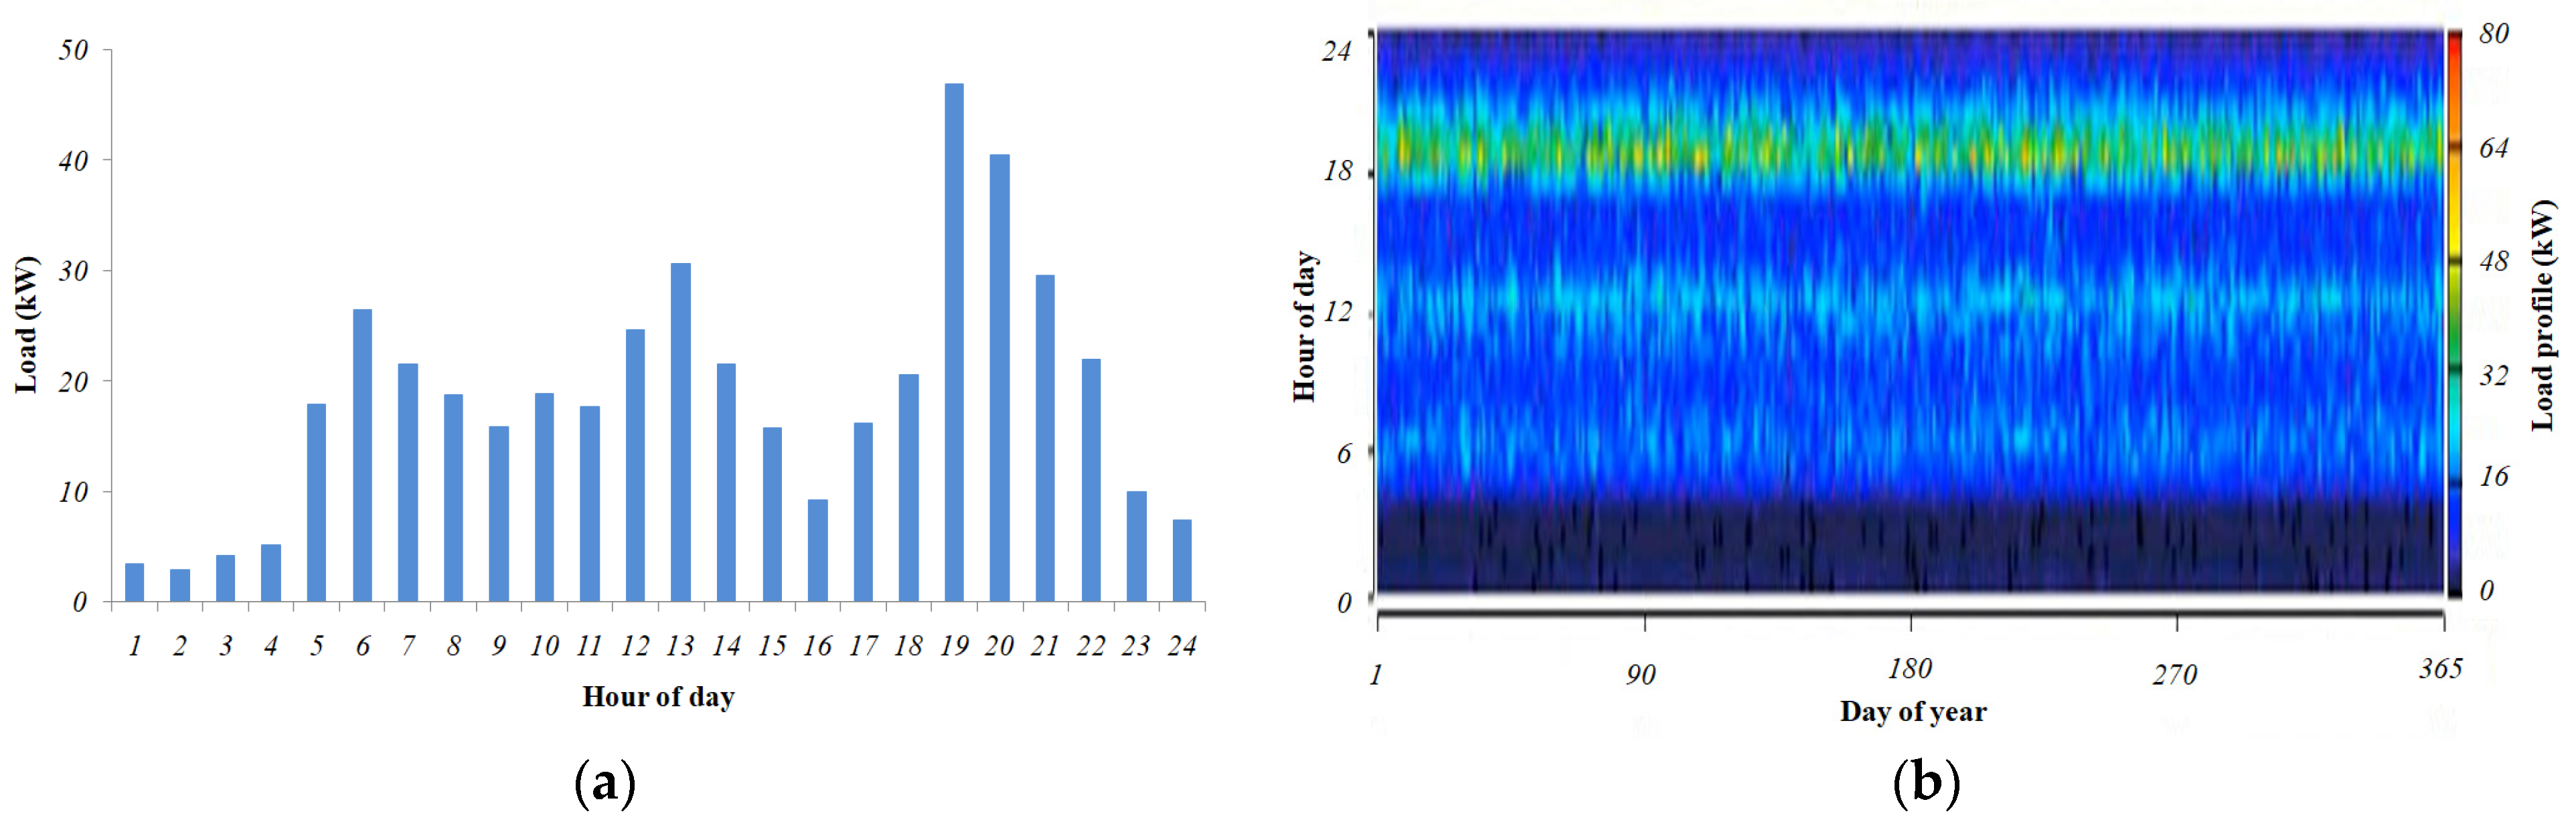
3.1. Electric Load Demand Estimation
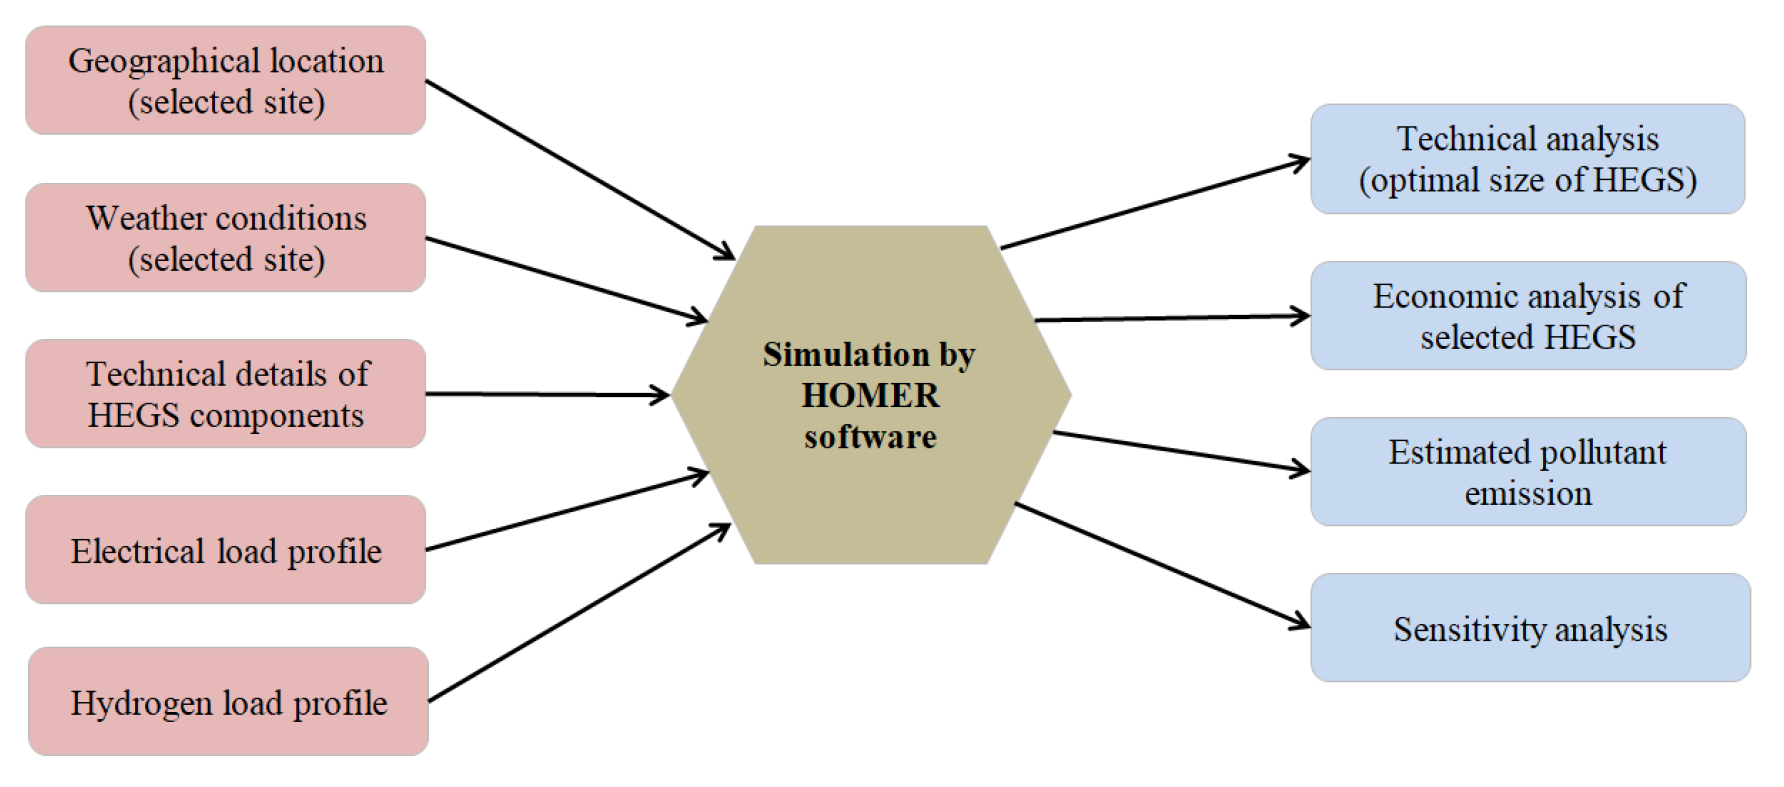
3.2. HOMER Pro Software
3.3. Cost Estimation of HEGS
4. Results and Discussions
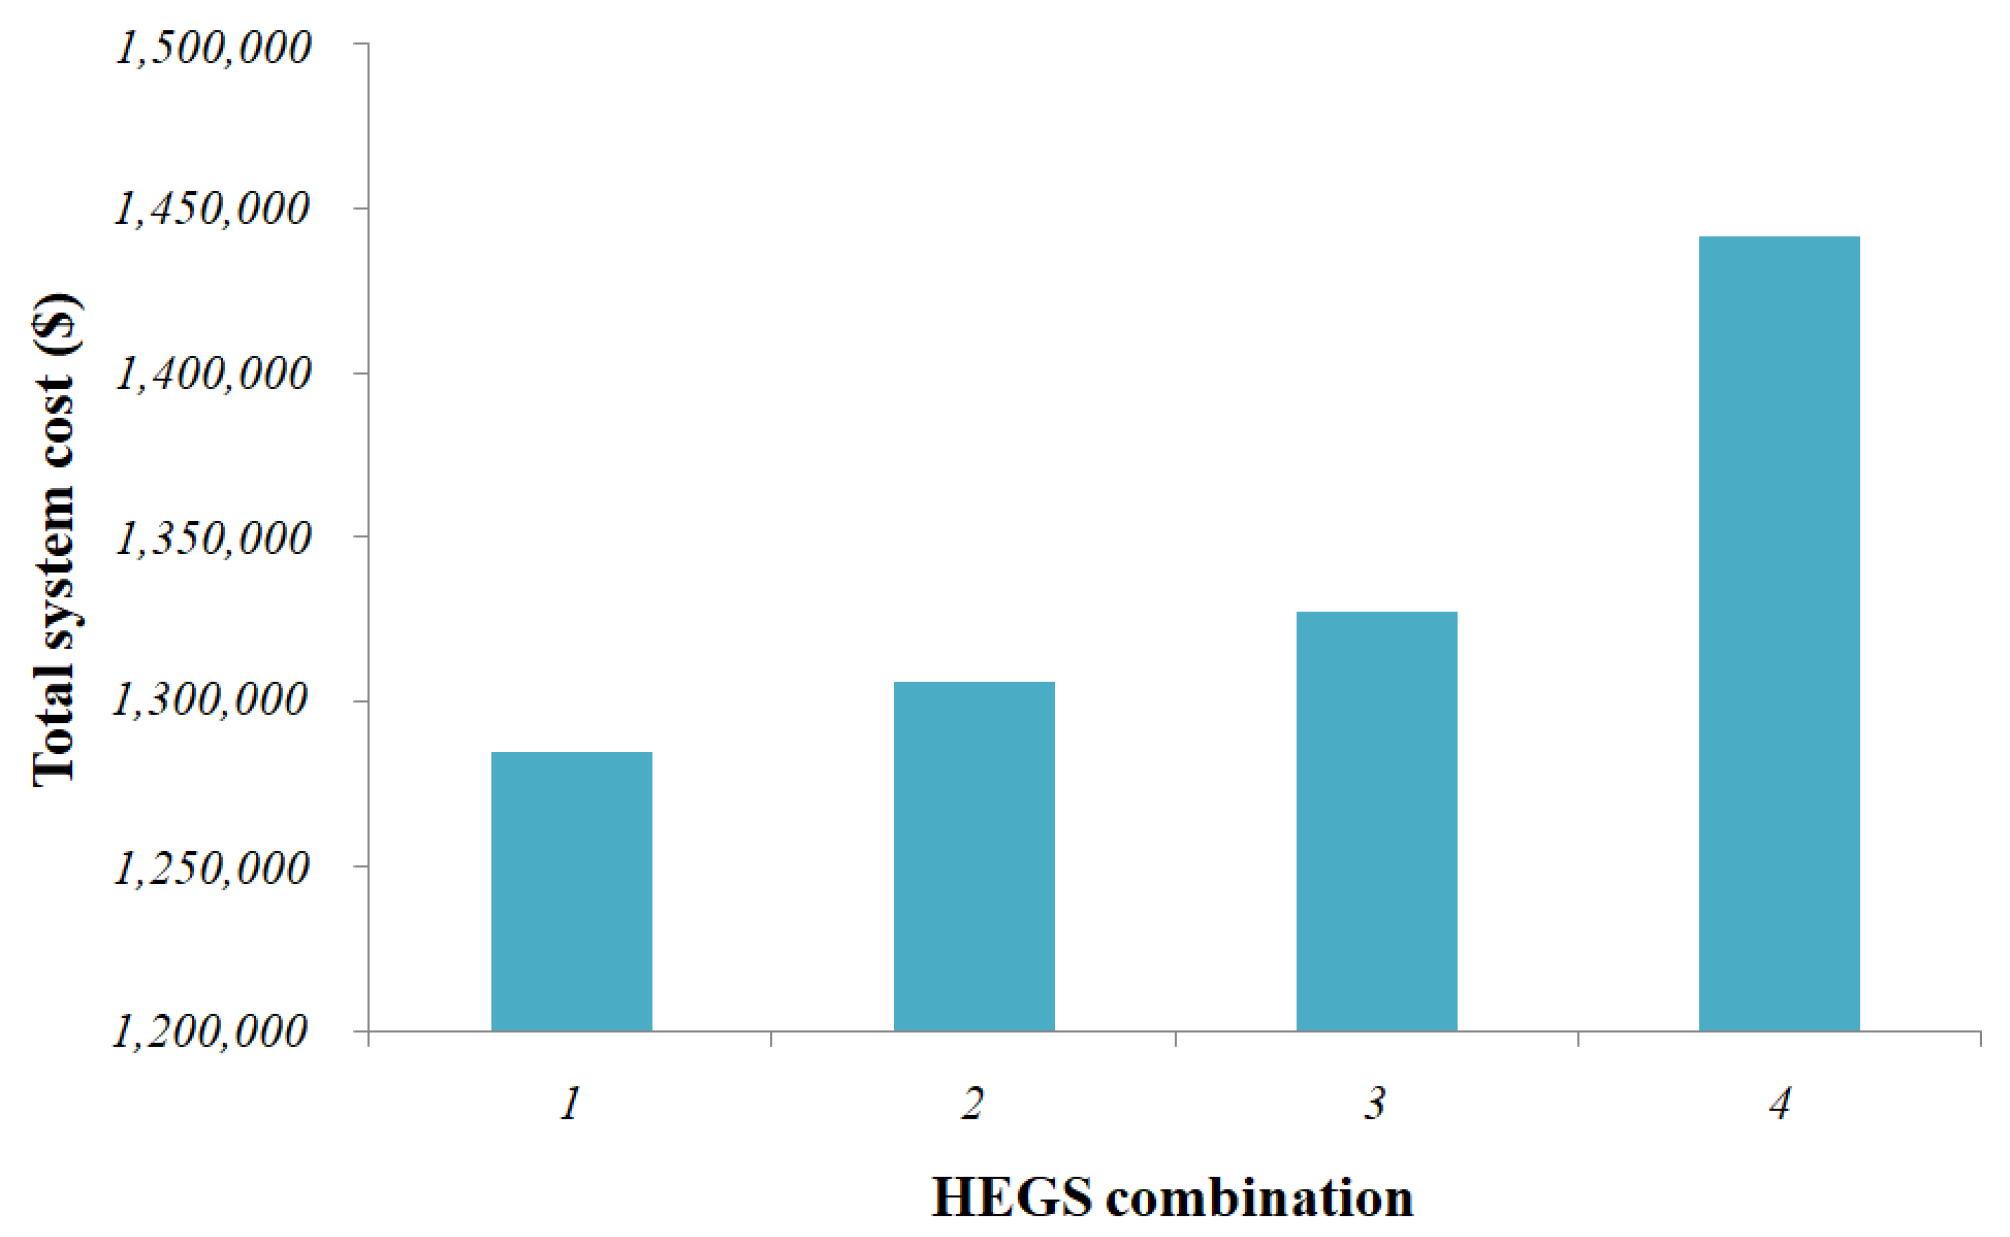
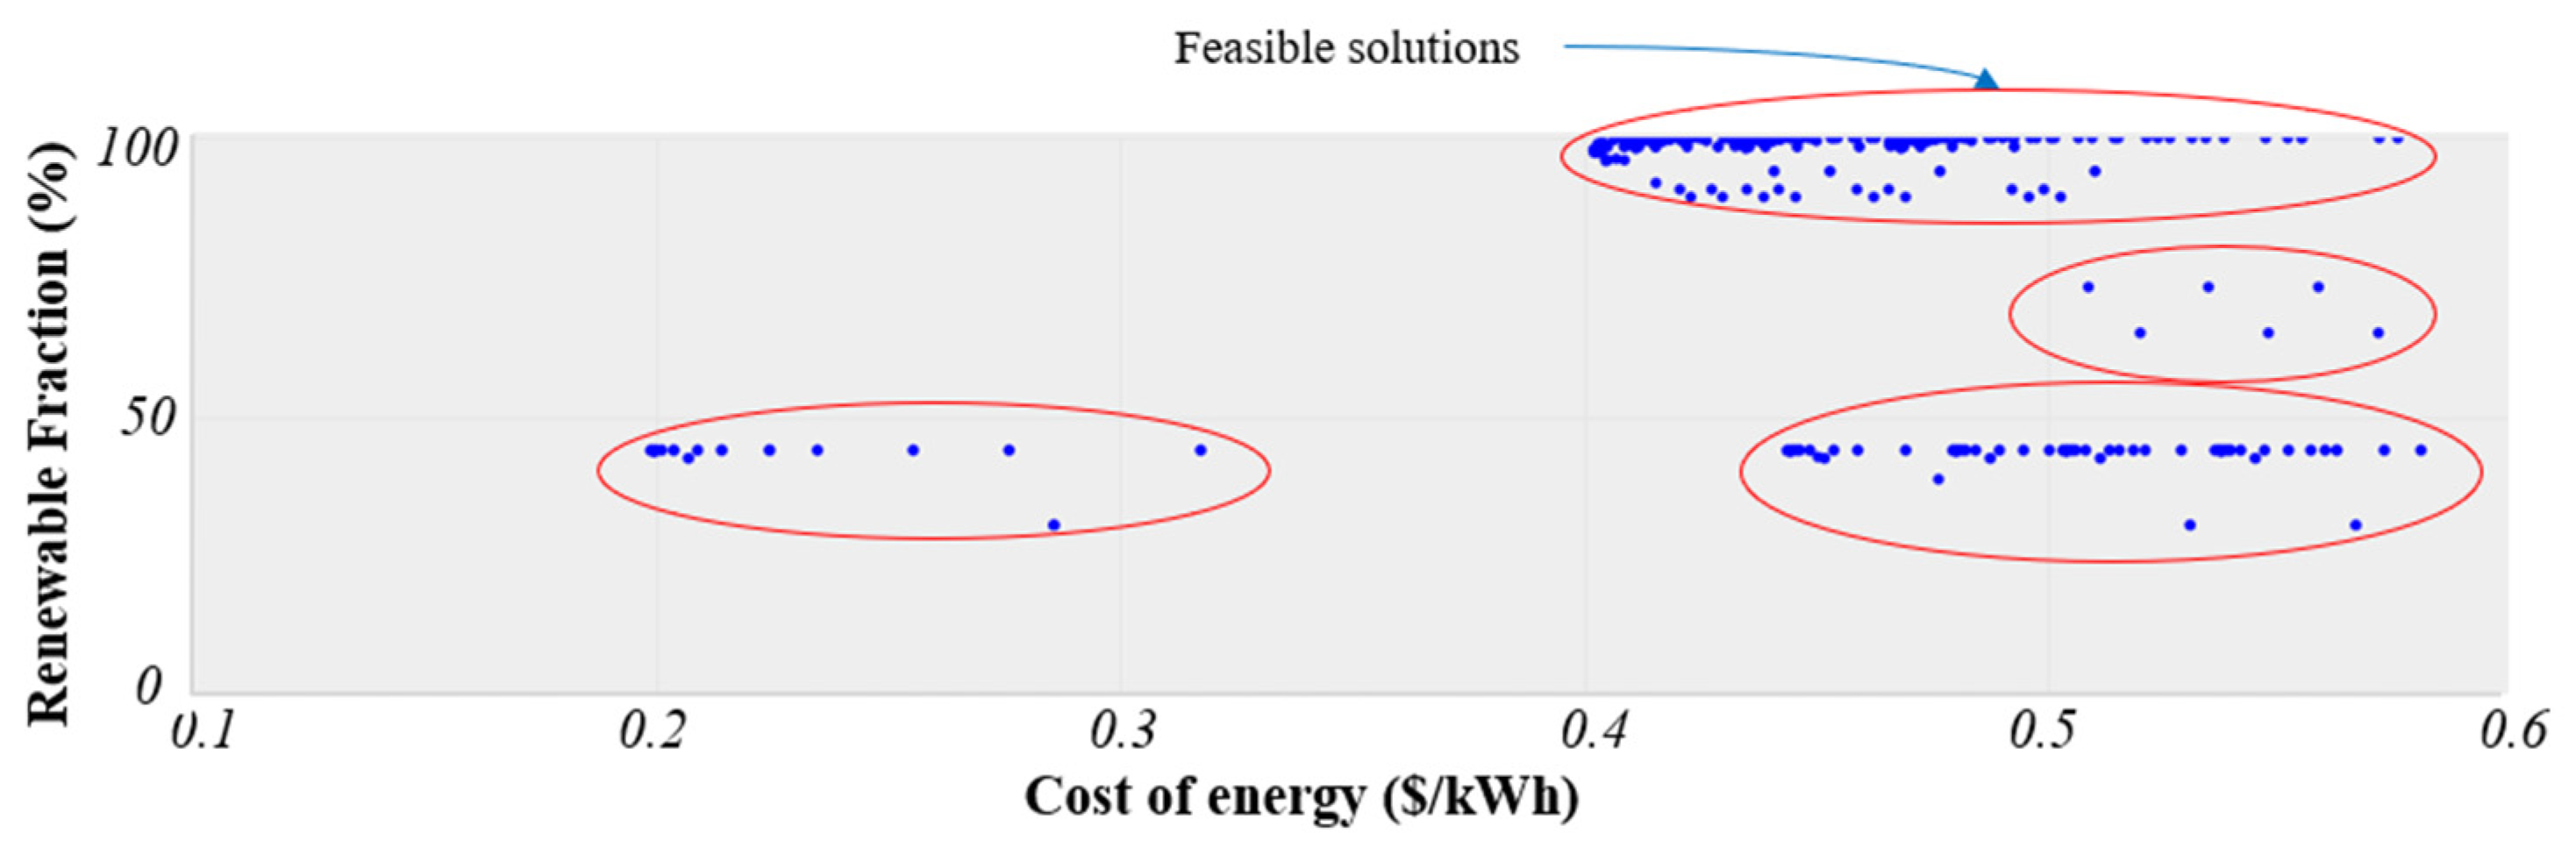
4.1. Optimization Results and Economic Analysis
4.2. Technical Analysis
4.3. Time-Series Analysis
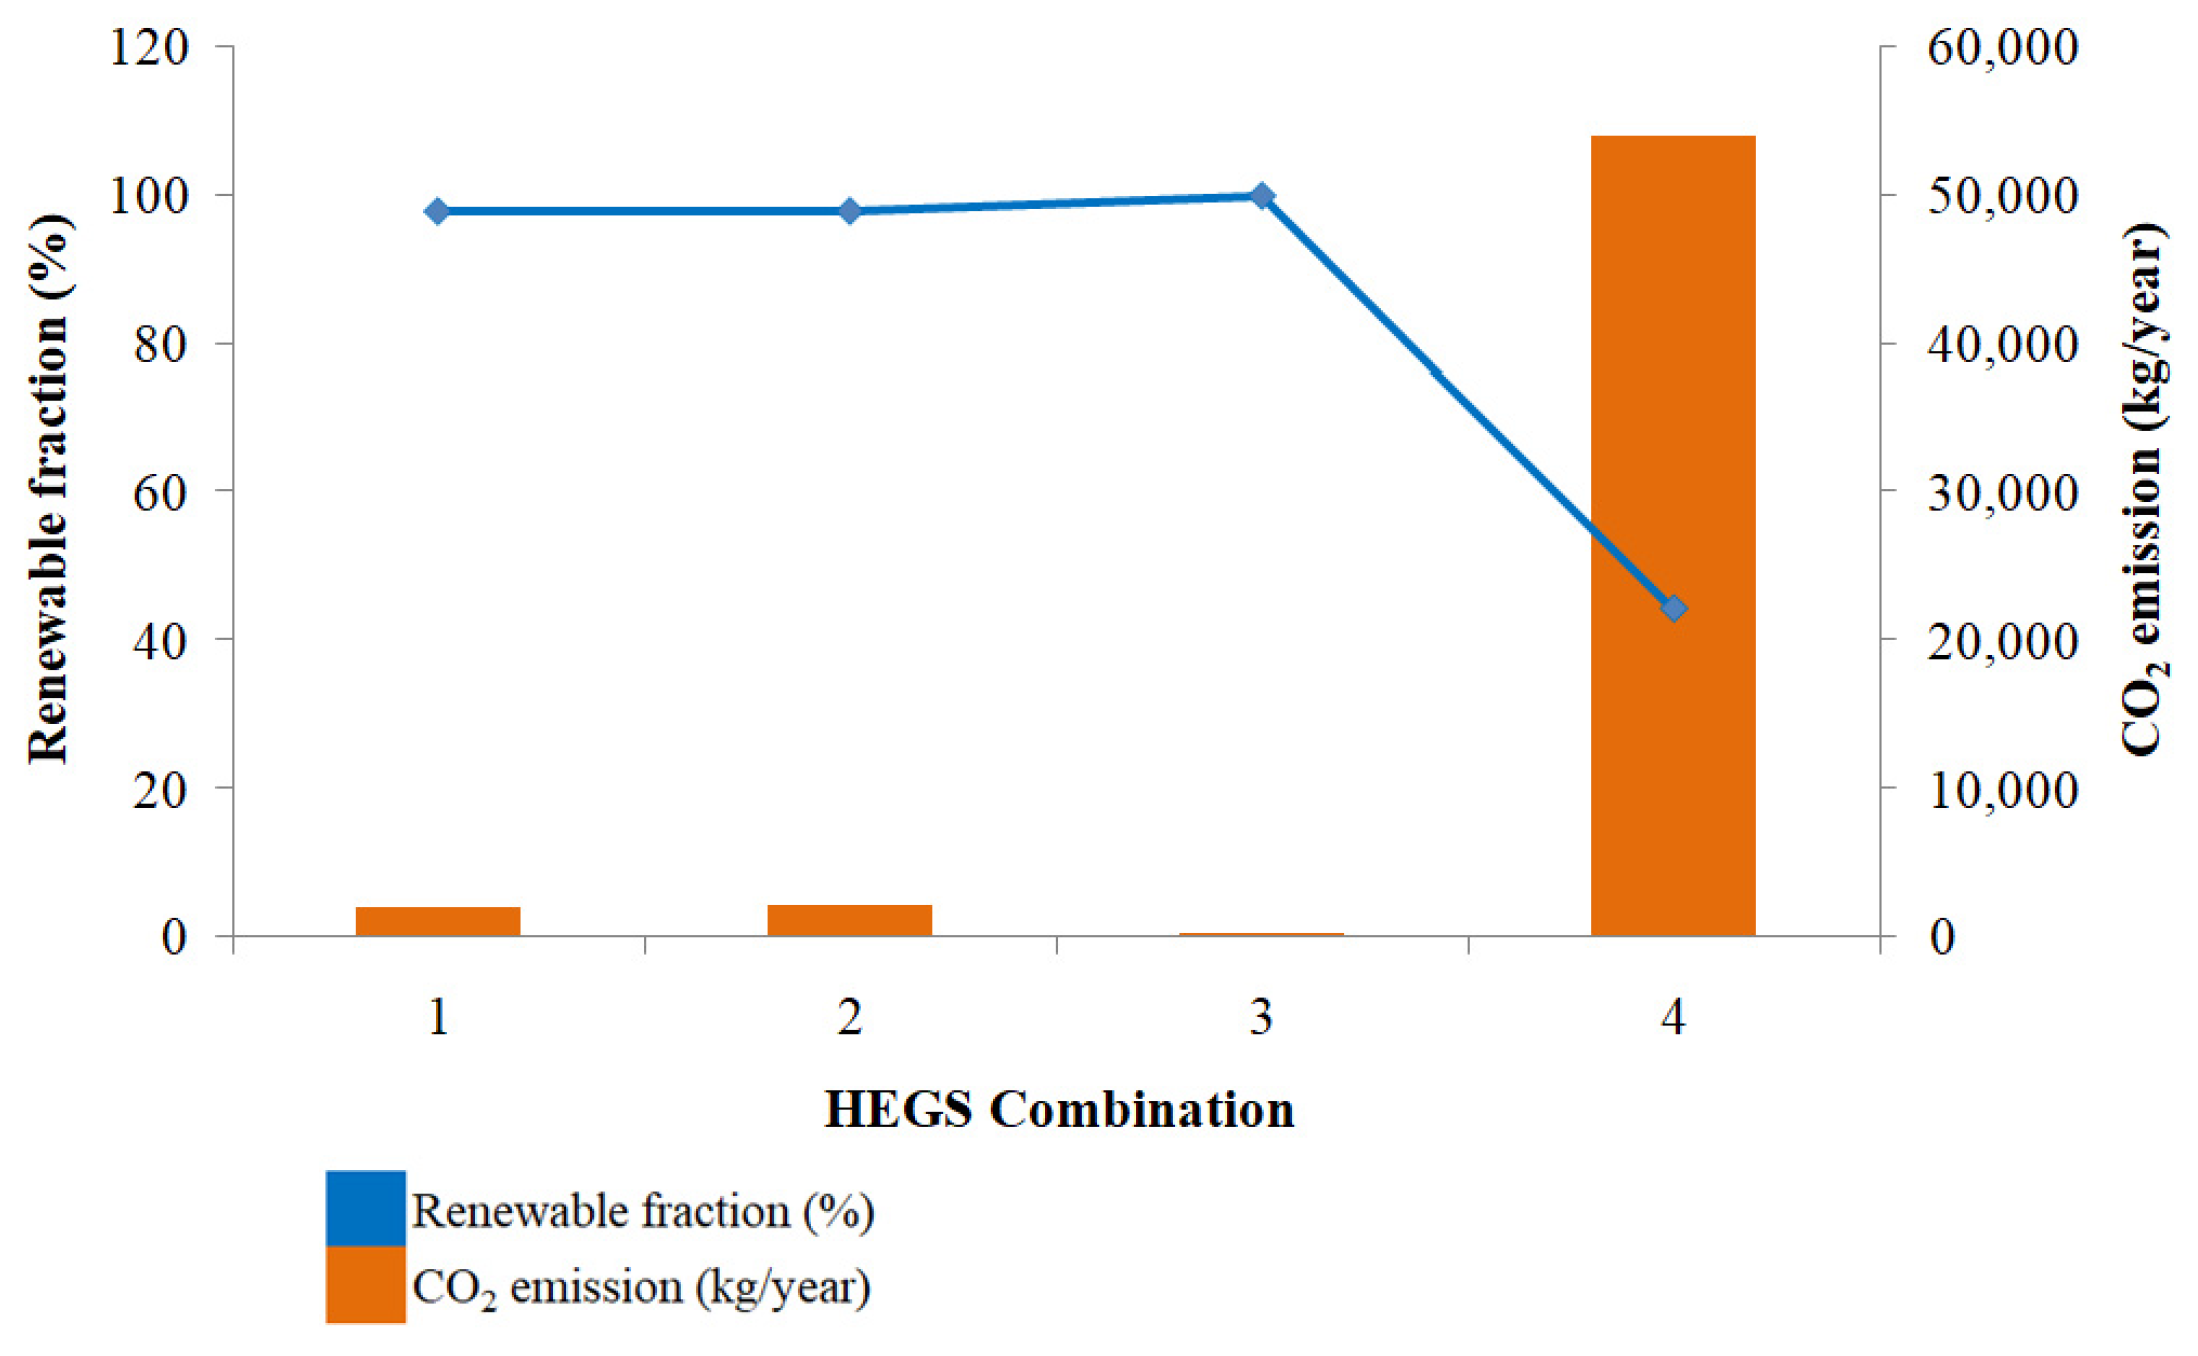
4.4. Pollutant Emissions
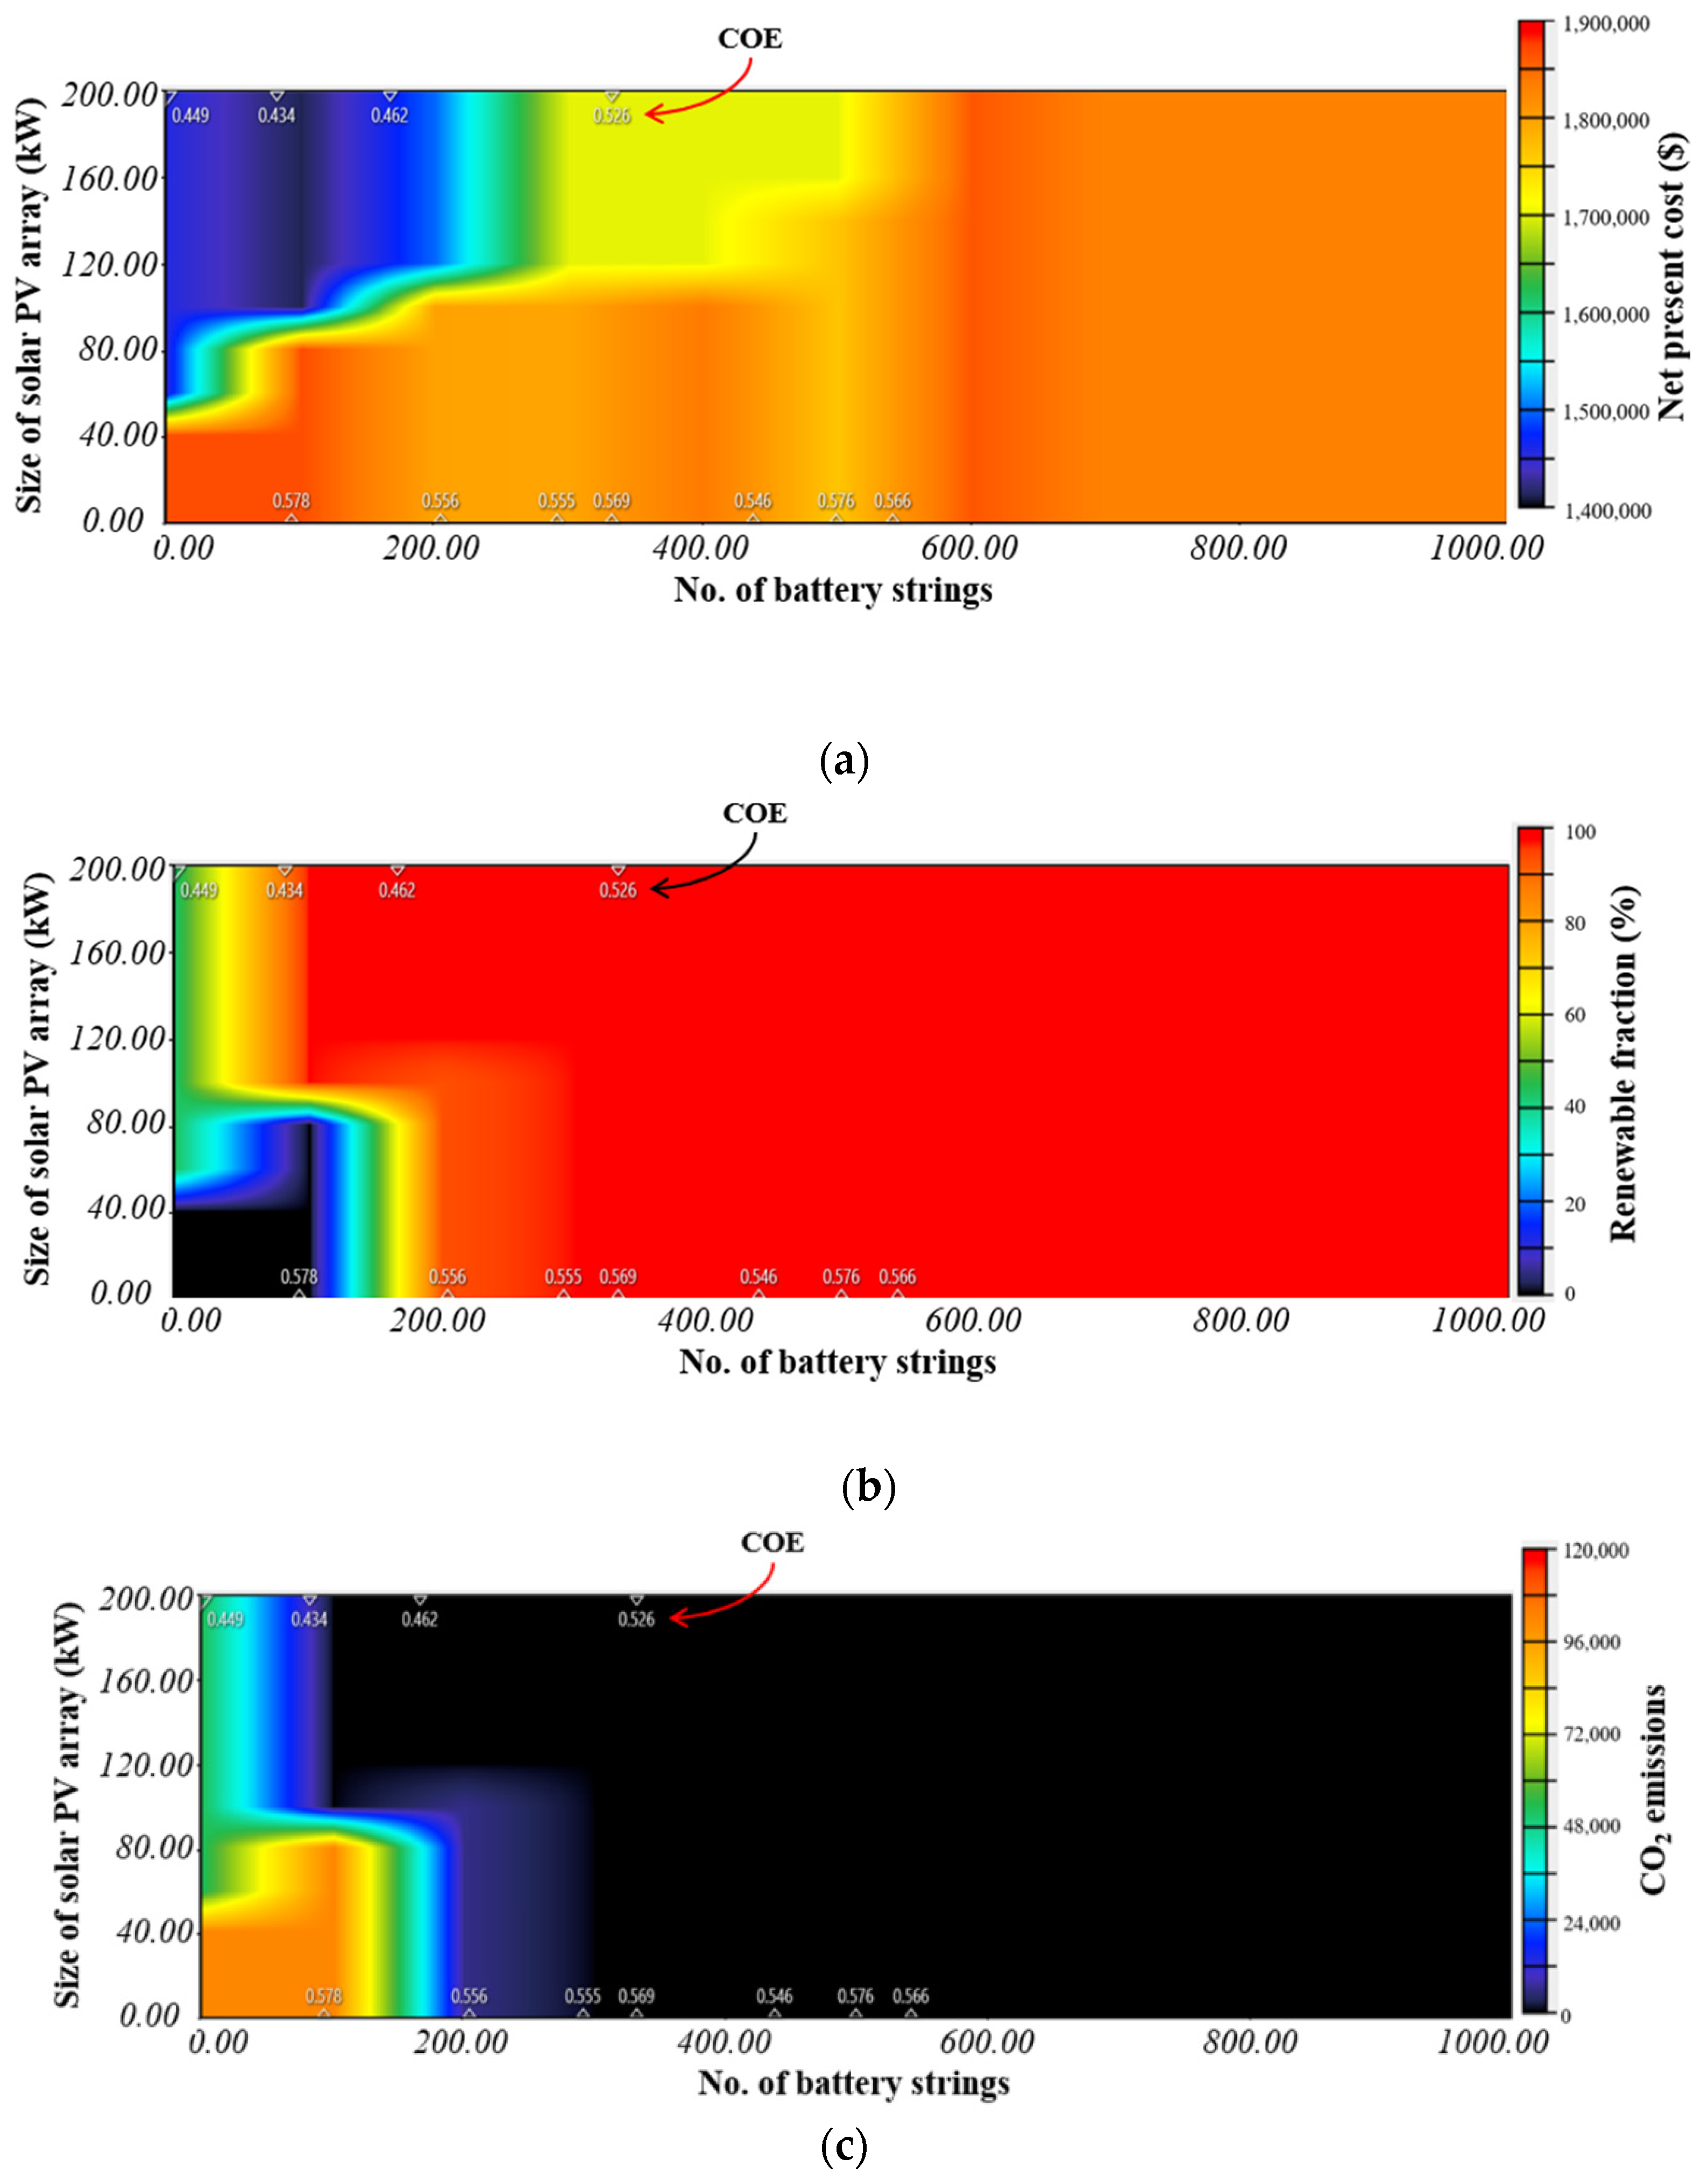
5. Sensitivity Analysis
6. Conclusions
- The electricity generation has been using 200 kW PV, 82 kW DG, 7000 kWh BT, and a converter of 70 kW, with a CC dispatch strategy.
- The initial cost of HEGS has been estimated to be $727,756, and the operating cost is $26,942 per year.
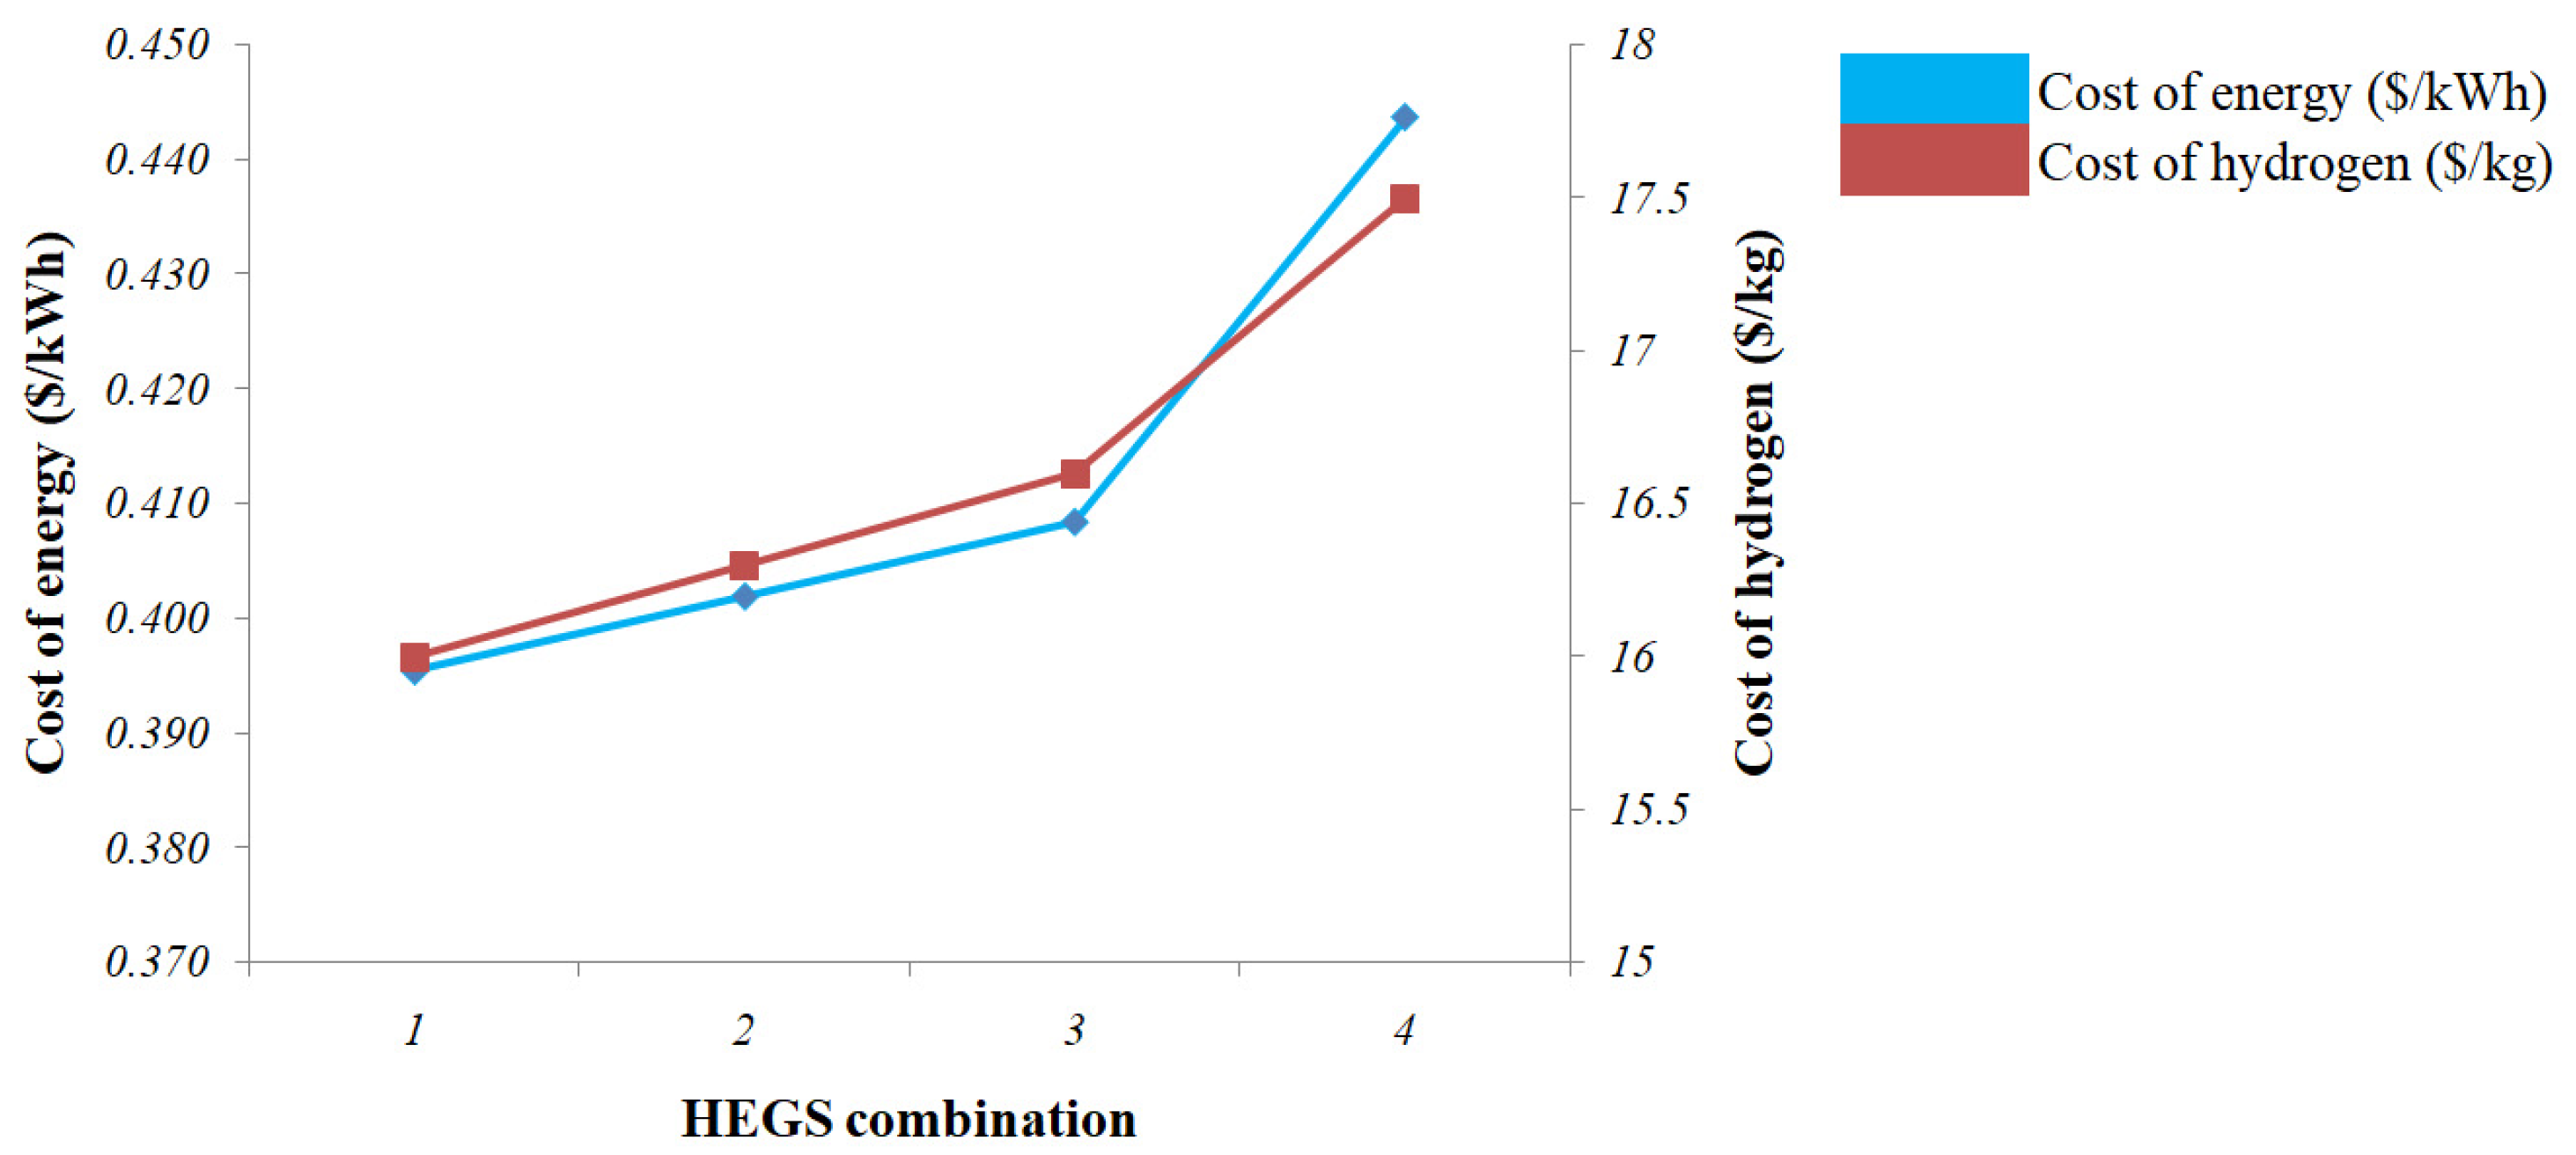
- The NPC has been estimated to be $1,327,521; the estimated COE will be $0.408 per kWh, and the cost of hydrogen will be $16.6 per kg.
- The CO2 emission will be reduced to 247 kg/year.
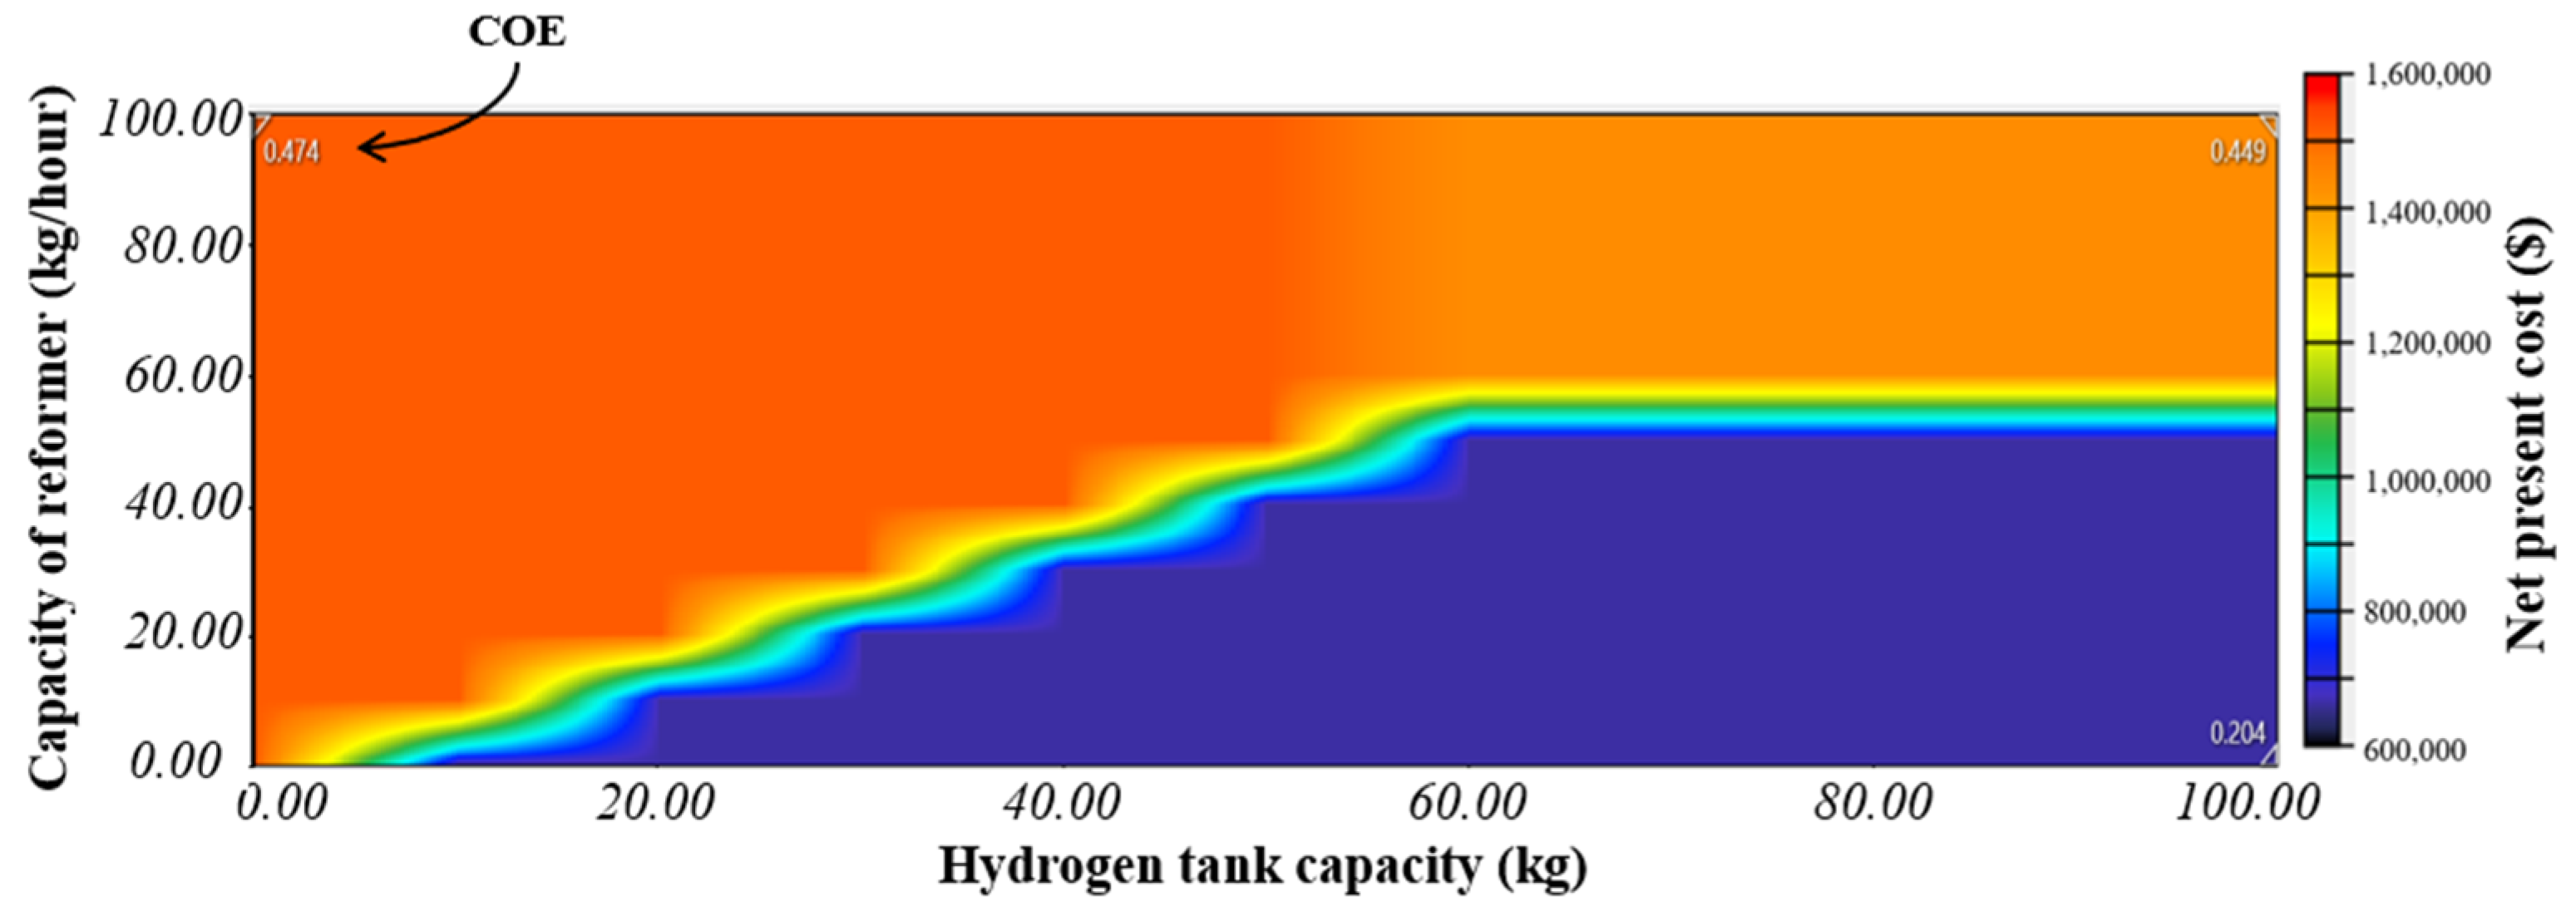
- Sensitivity analysis has been performed in two parts—(a) the impact of variation in solar PV array size & number of battery strings has been studied with sensitivity variables such as NPC, renewable fraction & CO2 emissions, and (b) the impact of variation in reformer capacity & hydrogen tank capacity, has been studied with NPC as sensitivity variable.
Author Contributions
Funding
Institutional Review Board Statement
Informed Consent Statement
Data Availability Statement
Conflicts of Interest
Appendix A

| Description | Value | |
|---|---|---|
| Solar PV array | Type of panel | Flat plate |
| Rated capacity (kWp) | 1 | |
| Capital cost ($/kW) | 470 | |
| Replacement cost ($/kW) | 470 | |
| O&M cost ($/year) | 2.66 | |
| Lifetime (years) | 25 | |
| Derating factor (%) | 80 | |
| Temperature coefficient (per °C) | −0.5 | |
| Nominal operating cell temperature (°C) | 47 | |
| Efficiency (%) | 0.13 | |
| Diesel generator | Fuel | Diesel |
| Capital cost ($/kW) | 665 | |
| Replacement cost ($/kW) | 535 | |
| O&M cost ($/h) | 0.027 | |
| Fuel price ($/L) | 1.14 | |
| Lifetime (hours) | 15,000 | |
| CO (g/L/fuel) | 16.5 | |
| Unburned HC (g/L fuel) | 0.72 | |
| Particulates (g/L fuel) | 0.1 | |
| Fuel sulfur to PM (%) | 2.2 | |
| NOX (g/L fuel) | 15.5 | |
| Battery | Nominal voltage (V) | 600 |
| Nominal capacity (kWh) | 1000 | |
| Maximum capacity (Ah) | 1670 | |
| Round-trip efficiency (%) | 90 | |
| Maximum charge current (A) | 1670 | |
| Maximum discharge current (A) | 5000 |
Appendix B


References
- Abdin, Z.; Mérida, W. Hybrid energy systems for off-grid power supply and hydrogen production based on renewable energy: A techno-economic analysis. Energy Convers. Manag. 2019, 196, 1068–1079. [Google Scholar] [CrossRef]
- Ekonomou, L.; Fotis, G.P.; Vita, V.; Mladenov, V. Distributed Generation Islanding Effect on Distribution Networks and End User Loads Using the Master-Slave Islanding Method. J. Power Energy Eng. 2016, 4, 1–24. [Google Scholar] [CrossRef]
- Amini, A.; Abedi, M.; Nesari, E.; Daryadel, E.; Kolahi, M.; Mianabadi, H.; Fisher, J. The paris agreement’s approach toward climate change loss and damage. World Aff. 2023, 186, 46–80. [Google Scholar] [CrossRef]
- Shapiro, A.F.; Metcalf, G.E. The macroeconomic effects of a carbon tax to meet the U.S. Paris agreement target: The role of firm creation and technology adoption. J. Public Econ. 2023, 218, 104800. [Google Scholar] [CrossRef]
- Sharma, H.; Pal, N.; Singh, Y.; Sadhu, P.K. Development and Simulation of Stand Alone Photovoltaic Model Using Matlab/Simulink. Int. J. Power Electron. Drive Syst. 2015, 6, 703. [Google Scholar] [CrossRef]
- Hofrichter, A.; Rank, D.; Heberl, M.; Sterner, M. Determination of the optimal power ratio between electrolysis and renewable energy to investigate the effects on the hydrogen production costs. Int. J. Hydrogen Energy 2023, 48, 1651–1663. [Google Scholar] [CrossRef]
- Fotis, G.; Dikeakos, C.; Zafeiropoulos, E.; Pappas, S.; Vita, V. Scalability and Replicability for Smart Grid Innovation Projects and the Improvement of Renewable Energy Sources Exploitation: The FLEXITRANSTORE Case. Energies 2022, 15, 4519. [Google Scholar] [CrossRef]
- Peyvandi, M.; Hajinezhad, A.; Moosavian, S.F. Investigating the intensity of GHG emissions from electricity production in Iran using renewable sources. Results Eng. 2023, 17, 100819. [Google Scholar] [CrossRef]
- Dogan, E.; Hodžić, S.; Šikić, T.F. Do energy and environmental taxes stimulate or inhibit renewable energy deployment in the European Union? Renew. Energy 2023, 202, 1138–1145. [Google Scholar] [CrossRef]
- He, S.; Barati, B.; Hu, X.; Wang, S. Carbon migration of microalgae from cultivation towards biofuel production by hydrothermal technology: A review. Fuel Process. Technol. 2023, 240, 107563. [Google Scholar] [CrossRef]
- Sambhi, S.; Sambhi, S.; Bhadoria, V.S. IoT based optimized and secured ecosystem for energy internet: The state of the art. In Internet of Things in Business Transformation: Developing an Engineering and Business Strategy for Industry 5.0; Scrivener Publishing LLC: Beverly, MA, USA, 2021; pp. 91–126. [Google Scholar] [CrossRef]
- Mukhammadiev, M.M.; Urishev, B.U.; Uulu, A.A.; Almardanov, O.; Karimova, N.E.; Murodov, H. The role of renewable energy sources in providing the efficiency of the power system in the conditions of digital energy transformation. In AIP Conference Proceedings; AIP Publishing LLC: Melville, NY, USA, 2023; Volume 2552, p. 050019. [Google Scholar] [CrossRef]
- Kreishan, M.Z.; Fotis, G.P.; Vita, V.; Ekonomou, L. Distributed Generation Islanding Effect on Distribution Networks and End User Loads Using the Load Sharing Islanding Method. Energies 2016, 9, 956. [Google Scholar] [CrossRef]
- Adewumi, O.B.; Fotis, G.; Vita, V.; Nankoo, D.; Ekonomou, L. The Impact of Distributed Energy Storage on Distribution and Transmission Networks’ Power Quality. Appl. Sci. 2022, 12, 6466. [Google Scholar] [CrossRef]
- Sambhi, S.; Sharma, H.; Kumar, P.; Fotis, G.; Vita, V.; Ekonomou, L. Techno-Economic Optimization of an Off-Grid Hybrid Power Generation for SRM IST, Delhi-NCR Campus. Energies 2022, 15, 7880. [Google Scholar] [CrossRef]
- Le, S.T.; Nguyen, T.N.; Linforth, S.; Ngo, T.D. Safety investigation of hydrogen energy storage systems using quantitative risk assessment. Int. J. Hydrogen Energy 2023, 48, 2861–2875. [Google Scholar] [CrossRef]
- Bovo, A.; Poli, N.; Trovò, A.; Marini, G.; Guarnieri, M. Hydrogen energy storage system in a Multi-Technology Microgrid:technical features and performance. Int. J. Hydrogen Energy 2023, 48, 12072–12088. [Google Scholar] [CrossRef]
- Walter, V.; Göransson, L.; Taljegard, M.; Öberg, S.; Odenberger, M. Low-cost hydrogen in the future European electricity system–Enabled by flexibility in time and space. Appl. Energy 2023, 330, 120315. [Google Scholar] [CrossRef]
- National Green Hydrogen Mission. Available online: https://pib.gov.in/PressReleasePage.aspx?PRID=1888547 (accessed on 8 January 2023).
- Assareh, E.; Dejdar, A.; Ershadi, A.; Jafarian, M.; Mansouri, M.; Roshani, A.S.; Azish, E.; Saedpanah, E.; Lee, M. Techno-economic analysis of combined cooling, heating, and power (CCHP) system integrated with multiple renewable energy sources and energy storage units. Energy Build. 2023, 278, 120315. [Google Scholar] [CrossRef]
- Van, L.P.; Chi, K.D.; Duc, T.N. Review of hydrogen technologies based microgrid: Energy management systems, challenges and future recommendations. Int. J. Hydrogen Energy 2023, in press. [Google Scholar] [CrossRef]
- Pang, K.Y.; Liew, P.Y.; Woon, K.S.; Ho, W.S.; Alwi, S.R.W.; Klemeš, J.J. Multi-period multi-objective optimisation model for multi-energy urban-industrial symbiosis with heat, cooling, power and hydrogen demands. Energy 2023, 262, 125201. [Google Scholar] [CrossRef]
- Sambhi, S.; Sharma, H.; Bhadoria, V.; Kumar, P.; Chaurasia, R.; Chaurasia, G.S.; Fotis, G.; Vita, V.; Ekonomou, L.; Pavlatos, C. Economic Feasibility of a Renewable Integrated Hybrid Power Generation System for a Rural Village of Ladakh. Energies 2022, 15, 9126. [Google Scholar] [CrossRef]
- Zafeiropoulou, M.; Mentis, I.; Sijakovic, N.; Terzic, A.; Fotis, G.; Maris, T.I.; Vita, V.; Zoulias, E.; Ristic, V.; Ekonomou, L. Forecasting Transmission and Distribution System Flexibility Needs for Severe Weather Condition Resilience and Outage Management. Appl. Sci. 2022, 12, 7334. [Google Scholar] [CrossRef]
- Marocco, P.; Ferrero, D.; Lanzini, A.; Santarelli, M. The role of hydrogen in the optimal design of off-grid hybrid renewable energy systems. J. Energy Storage 2022, 46, 103893. [Google Scholar] [CrossRef]
- Arevalo, P.; Benavides, D.; Lata-garcía, J.; Jurado, F. Energy control and size optimization of a hybrid system (photovoltaic-hidrokinetic) using various storage technologies. Sustain. Cities Soc. 2020, 52, 101773. [Google Scholar] [CrossRef]
- Xia, T.; Rezaei, M.; Dampage, U.; Alharbi, S.; Nasif, O.; Borowski, P.; Mohamed, M. Techno-Economic Assessment of a Grid-Independent Hybrid Power Plant for Co-Supplying a Remote Micro-Community with Electricity and Hydrogen. Processes 2021, 9, 1375. [Google Scholar] [CrossRef]
- Wu, Z.; Zhu, P.; Yao, J.; Tan, P.; Xu, H.; Chen, B.; Yang, F.; Zhang, Z.; Ni, M. Thermo-economic modeling and analysis of an NG-fueled SOFC-WGS-TSA-PEMFC hybrid energy conversion system for stationary electricity power generation. Energy 2020, 192, 116613. [Google Scholar] [CrossRef]
- Temiz, M.; Javani, N. Design and analysis of a combined floating photovoltaic system for electricity and hydrogen production. Int. J. Hydrogen Energy 2020, 45, 3457–3469. [Google Scholar] [CrossRef]
- Nasser, M.; Megahed, T.F.; Ookawara, S.; Hassan, H. Performance evaluation of PV panels/wind turbines hybrid system for green hydrogen generation and storage: Energy, exergy, economic, and enviroeconomic. Energy Convers. Manag. 2022, 267, 115870. [Google Scholar] [CrossRef]
- Kamel, A.A.; Rezk, H.; Abdelkareem, M.A. Enhancing the operation of fuel cell-photovoltaic-battery-supercapacitor renewable system through a hybrid energy management strategy. Int. J. Hydrogen Energy 2021, 46, 6061–6075. [Google Scholar] [CrossRef]
- Ghenai, C.; Salameh, T.; Merabet, A. Technico-economic analysis of off grid solar PV/Fuel cell energy system for residential community in desert region. Int. J. Hydrogen Energy 2020, 45, 11460–11470. [Google Scholar] [CrossRef]
- Jahangir, M.H.; Cheraghi, R. Economic and environmental assessment of solar-wind-biomass hybrid renewable energy system supplying rural settlement load. Sustain. Energy Technol. Assess. 2020, 42, 100895. [Google Scholar] [CrossRef]
- Rad, M.A.V.; Ghasempour, R.; Rahdan, P.; Mousavi, S.; Arastounia, M. Techno-economic analysis of a hybrid power system based on the cost-effective hydrogen production method for rural electrification, a case study in Iran. Energy 2020, 190, 116421. [Google Scholar] [CrossRef]
- Cao, Y.; Dhahad, H.A.; Togun, H.; Anqi, A.E.; Farouk, N.; Farhang, B. A novel hybrid biomass-solar driven triple combined power cycle integrated with hydrogen production: Multi-objective optimization based on power cost and CO2 emission. Energy Convers. Manag. 2021, 234, 113910. [Google Scholar] [CrossRef]
- Rezaei, M.; Naghdi-Khozani, N.; Jafari, N. Wind energy utilization for hydrogen production in an underdeveloped country: An economic investigation. Renew. Energy 2020, 147, 1044–1057. [Google Scholar] [CrossRef]
- Khosravi, A.; Sanna Syri, M.E.H.; Assad, M.M. Thermodynamic and economic analysis of a hybrid ocean thermal energy conversion/photovoltaic system with hydrogen-based energy storage system. Energy 2019, 172, 304–319. [Google Scholar] [CrossRef]
- Singh, S.; Chauhan, P.; Aftab, M.A.; Ali, I.; Hussain, S.M.S.; Ustun, T.S. Cost Optimization of a Stand-Alone Hybrid Energy System with Fuel Cell and PV. Energies 2020, 13, 1295. [Google Scholar] [CrossRef]
- Almutairi, K.; Dehshiri, S.S.H.; Mostafaeipour, A.; Jahangiri, M.; Techato, K. Technical, economic, carbon footprint assessment, and prioritizing stations for hydrogen production using wind energy: A case study. Energy Strat. Rev. 2021, 36, 100684. [Google Scholar] [CrossRef]
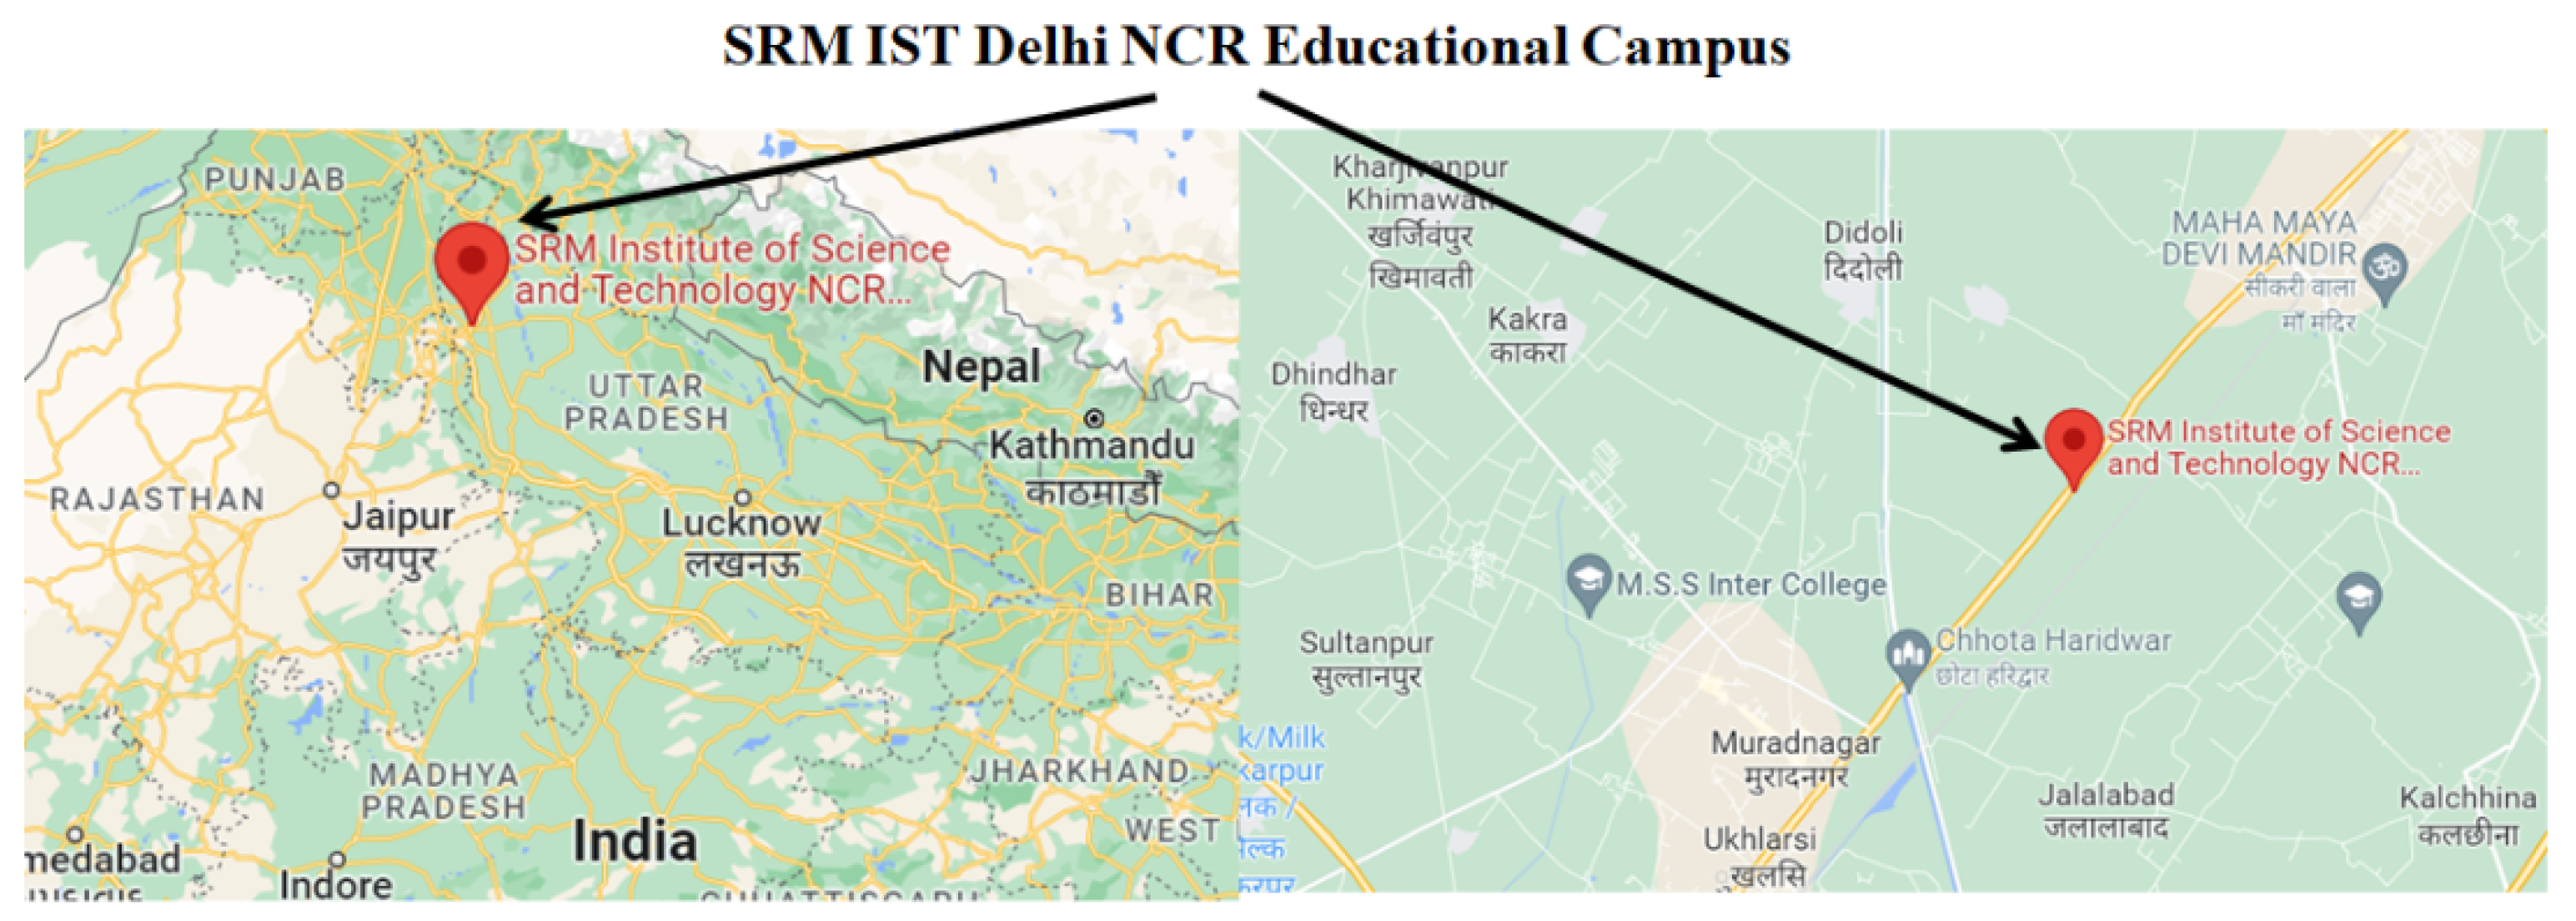
- Google Maps. Available online: http://maps.google.com/ (accessed on 10 December 2022).
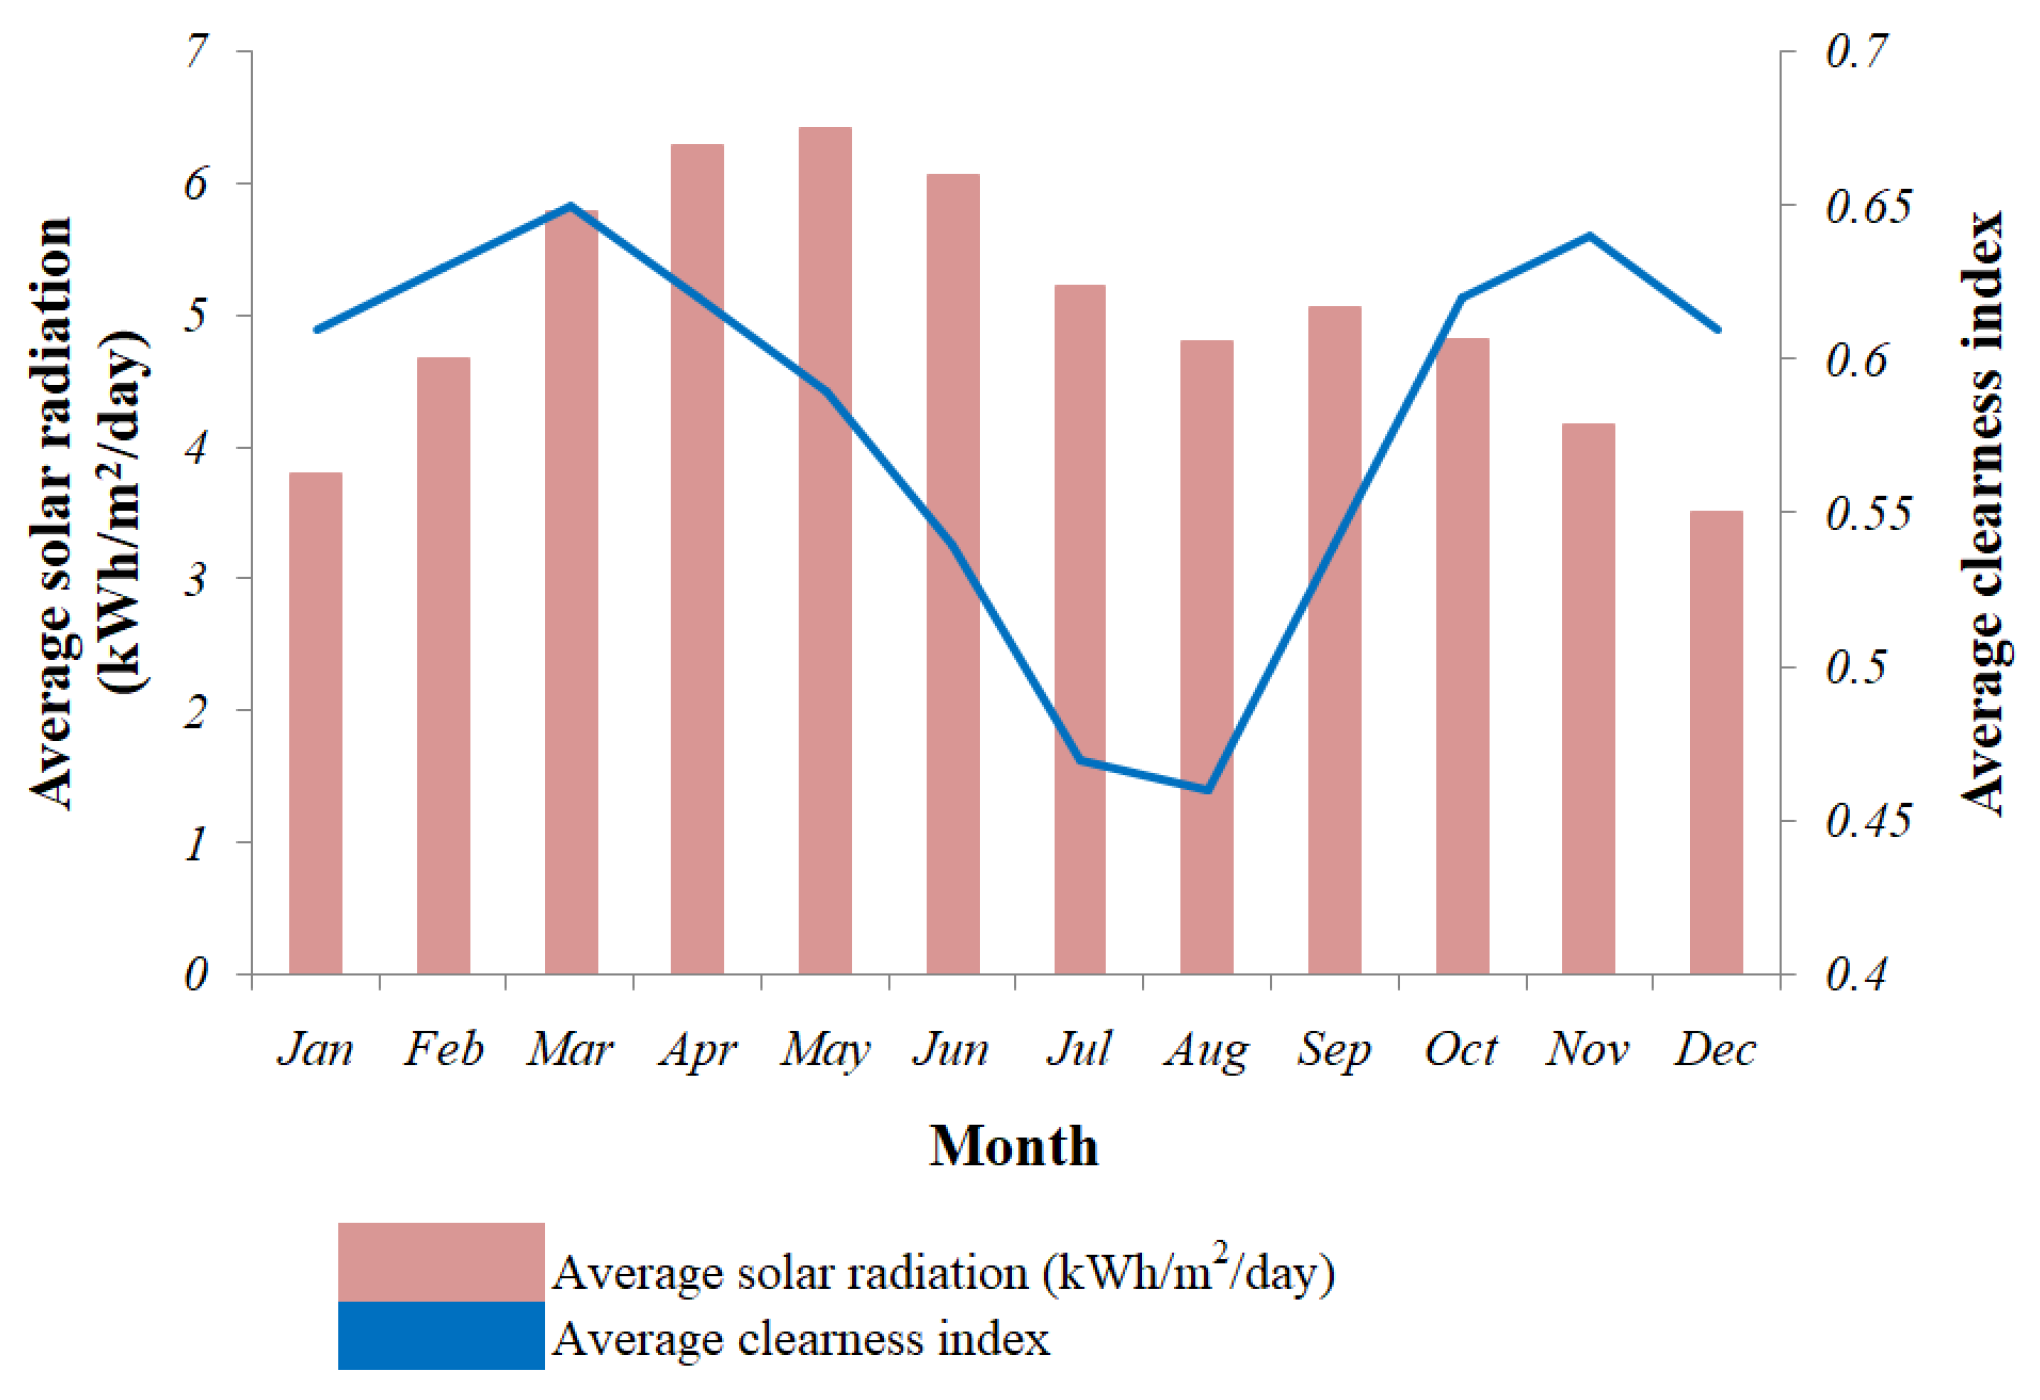
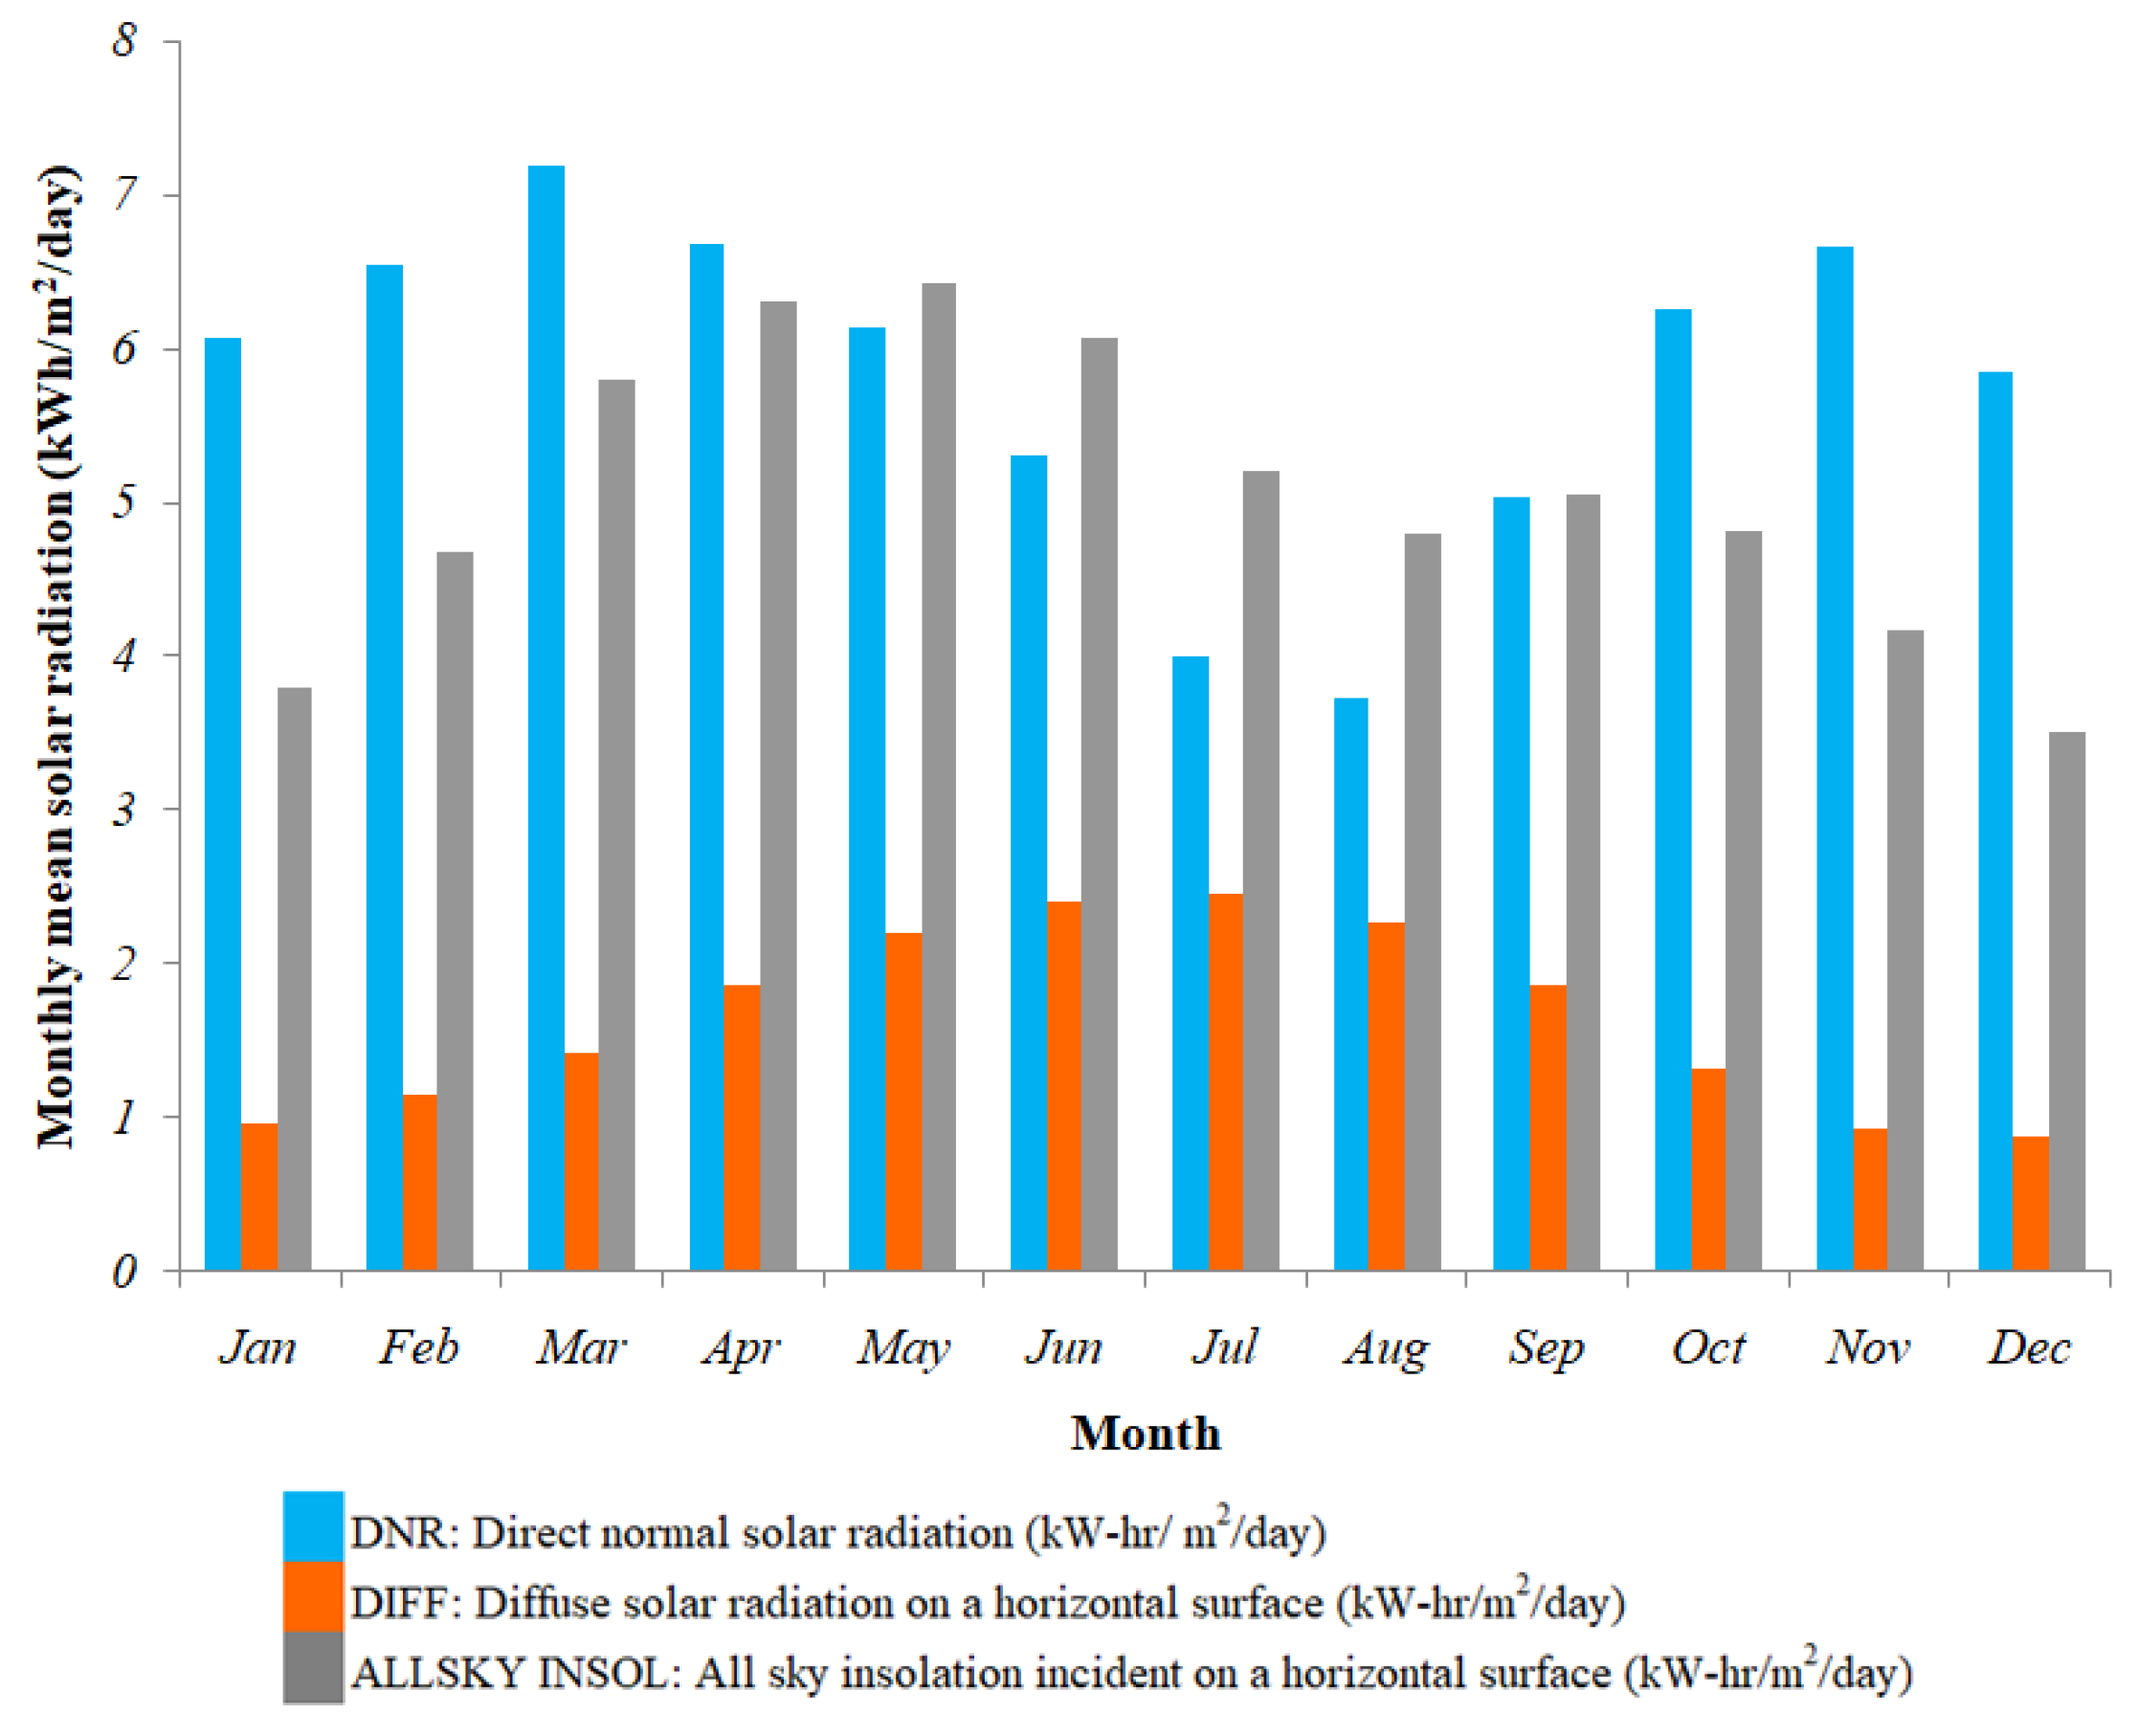
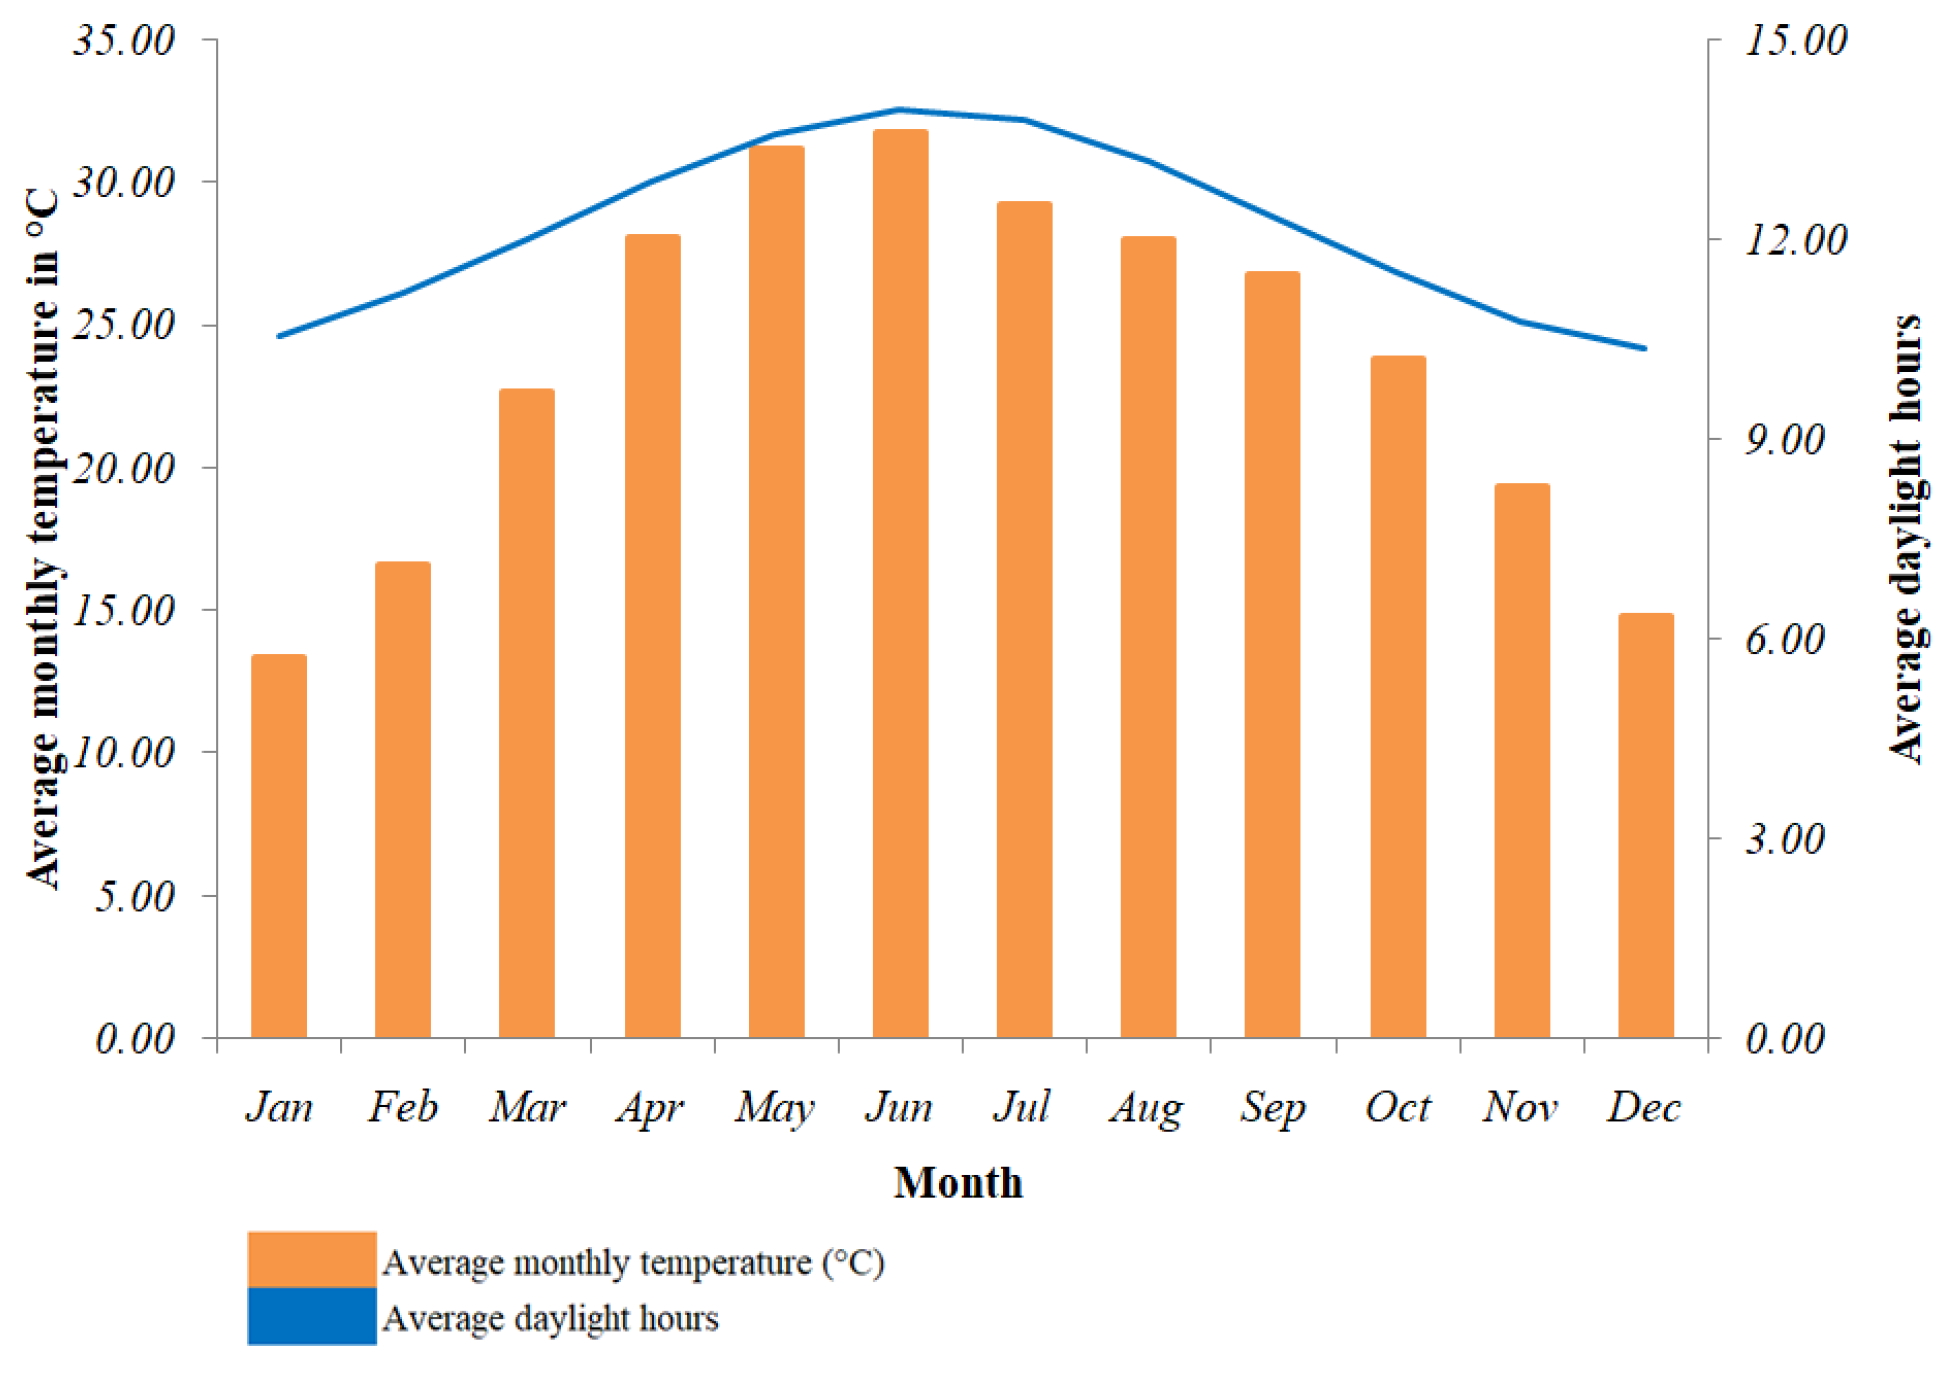
- NASA Power—Data Access Viewer. Available online: https://power.larc.nasa.gov/data-access-viewer/ (accessed on 10 December 2022).
- Solar Resource Glossary. Available online: https://www.nrel.gov/grid/solar-resource/solar-glossary.html (accessed on 10 December 2022).
- Direct Solar Irradiation. Available online: https://www.sciencedirect.com/topics/engineering/direct-normal-irradiation (accessed on 10 December 2022).
- Sharma, H.; Pal, N.; Kumar, P.; Yadav, A. A control strategy of hybrid solar-wind energy generation system. Arch. Electr. Eng. 2017, 66, 241–251. [Google Scholar] [CrossRef]
- Kumar, P.; Pal, N.; Sharma, H. Techno-economic analysis of solar photo-voltaic/diesel generator hybrid system using different energy storage technologies for isolated islands of India. J. Energy Storage 2021, 41, 102965. [Google Scholar] [CrossRef]
- Kumar, P.; Pal, N.; Sharma, H. Optimization and techno-economic analysis of a solar photo-voltaic/biomass/diesel/battery hybrid off-grid power generation system for rural remote electrification in eastern India. Energy 2022, 247, 123560. [Google Scholar] [CrossRef]
- Kumar, P.; Pal, N.; Sharma, H. Performance analysis and evaluation of 10 kWp solar photovoltaic array for remote islands of Andaman and Nicobar. Sustain. Energy Technol. Assess. 2020, 42, 100889. [Google Scholar] [CrossRef]
- Technology Brief: Analysis of Current-Day Commercial Electrolyzers. Available online: https://www.nrel.gov/docs/fy04osti/36705.pdf (accessed on 15 November 2022).
- Sorrenti, I.; Zheng, Y.; Singlitico, A.; You, S. Low-carbon and cost-efficient hydrogen optimisation through a grid-connected electrolyser: The case of GreenLab skive. Renew. Sustain. Energy Rev. 2023, 171, 113033. [Google Scholar] [CrossRef]
- Chen, Z.; Yiliang, X.; Hongxia, Z.; Yujie, G.; Xiongwen, Z. Optimal design and performance assessment for a solar powered electricity, heating and hydrogen integrated energy system. Energy 2023, 262, 125453. [Google Scholar] [CrossRef]
- Sijakovic, N.; Terzic, A.; Fotis, G.; Mentis, I.; Zafeiropoulou, M.; Maris, T.I.; Zoulias, E.; Elias, C.; Ristic, V.; Vita, V. Active System Management Approach for Flexibility Services to the Greek Transmission and Distribution System. Energies 2022, 15, 6134. [Google Scholar] [CrossRef]
- Sambhi, S.; Sharma, H.; Bhadoria, V.; Kumar, P.; Chaurasia, R.; Fotis, G.; Vita, V. Technical and Economic Analysis of Solar PV/Diesel Generator Smart Hybrid Power Plant Using Different Battery Storage Technologies for SRM IST, Delhi-NCR Campus. Sustainability 2023, 15, 3666. [Google Scholar] [CrossRef]
- Fotis, G.; Vita, V.; Maris, T.I. Risks in the European Transmission System and a Novel Restoration Strategy for a Power System after a Major Blackout. Appl. Sci. 2022, 13, 83. [Google Scholar] [CrossRef]
- Vita, V.; Fotis, G.; Pavlatos, C.; Mladenov, V. A New Restoration Strategy in Microgrids after a Blackout with Priority in Critical Loads. Sustainability 2023, 15, 1974. [Google Scholar] [CrossRef]
- Wang, Z.; Fang, G.; Wen, X.; Tan, Q.; Zhang, P.; Liu, Z. Coordinated operation of conventional hydropower plants as hybrid pumped storage hydropower with wind and photovoltaic plants. Energy Convers. Manag. 2023, 277, 116654. [Google Scholar] [CrossRef]


| Hybrid Plant Design | Study Location | On-Grid/ Off-Grid | COE ($/kWh) | Ref. |
|---|---|---|---|---|
| PV/HK/FC/Battery/HT/EL | Ecuadorian Amazon | Off-grid | 0.184 | [26] |
| PV/WT/HK | Iran | Off-grid | 0.1155 | [27] |
| SOFC-WGS-TSA-PEMFC | China | Off-grid | 0.0395 to 0.0405 | [28] |
| PV | Turkey | Off-grid | 0.6124 | [29] |
| PV/WT | Egypt | Off-grid | 0.137 to 0.219 | [30] |
| PV/FC | UAE | Off-grid | 0.145 | [31] |
| PV/FC | Iraq | Off-grid | 0.195 | [32] |
| PV/WT/BGG | Iran | Off-grid | 0.128 to 0.223 | [33] |
| PV/WT/BGG/FC | Iran | Off-grid | 0.164 to 0.233 | [34] |
| On-grid | 0.096 to 0.125 | |||
| PV/BM | China | Off-grid | 0.6137 | [35] |
| WT | Afghanistan | Off-grid | 0.063 to 0.079 | [36] |
| PV/WT/HK | Iran | Off-grid | 0.1155 | [37] |
| PV | Turkey | Off-grid | 0.6124 | [38] |
| WT | Afghanistan | Off-grid | 0.0529 to 0.1135 | [39] |
| PV/WT/battery/EL | USA | Off-grid | 0.5 | [1] |
| Battery Technology | Capital Cost ($ per kWh) | Replacement Cost ($ per kWh) | O&M Cost ($) | Life Span (Years) |
|---|---|---|---|---|
| LA battery | 135 | 108 | 1.33 per year | 5 |
| LI battery | 500 | 455 | 0 | 10 |
| VF battery | 535 | 465 | 0 | 25 |
| ZB battery | 800 | 735 | 0 | 25 |
| NI battery | 106 | 98 | 2.12 | 25 |
| Sr. No. | Load | Power (kW) | Quantity (Nos.) | Usage (h) | Total Load (kWh/Day) |
|---|---|---|---|---|---|
| 1 | LED light | 0.024 | 6 | 6 | 0.864 |
| 2 | Ceiling fans | 0.020 | 5 | 6 | 0.6 |
| 3 | Air conditioner (1.5 ton) | 1.5 | 2 | 6 | 18 |
| 4 | LCD Projector | 0.28 | 1 | 6 | 1.680 |
| 5 | PA system (microphone & speakers) | 0.8 | 1 | 6 | 4.800 |
| 6 | Computer system | 0.1 | 1 | 6 | 0.6 |
| 7 | Mobile charging point | 0.003 | 2 | 6 | 0.036 |
| The total load for one classroom | 26.58 | ||||
| The total load for 15 classrooms | 398.7 | ||||
| (~400) | |||||
| Components | Initial Cost ($) | Replacement Cost ($) | O&M Cost ($) | Life Span |
|---|---|---|---|---|
| PV | $470 per kW | $470 per kW | $2.66 per year | 25 years |
| DG | $665 per kW | $535 per kW | $0.027 per op. h | 15,000 h |
| Converter | $195 per kW | $195 per kW | $4 per year | 15 years |
| Battery | $800 per kWh | $735 per kWh | $10 per year | 30 years |
| Electrolyser | $1500 per kW | $1500 per kW | $0.05 per year | 20 years |
| Reformer | $3500 per kW | $3200 per kW | $200 per year | 25 years |
| Hydrogen tank | $600 per kg | $600 per kg | $10 per year | 25 years |
| Architecture | Financial Metrics | |||||||||||||||
|---|---|---|---|---|---|---|---|---|---|---|---|---|---|---|---|---|
| HEGS Combination | PV (kW) | DG (kW) | Battery (No. of Strings) | Battery Nominal Capacity (kWh) | Grid (kW) | Electrolyser (kW) | Reformer (kW) | Hydrogen Tank (kg) | Converter (kW) | Dispatch Strategy | COE ($/kWh) | NPC ($) | Operating Cost ($/Year) | Initial Cost ($) | O&M Cost ($/Year) | Fuel Cost ($/Year) |
| 1. | 200 | 3 | 3000 | 100 | 100 | 100 | 100 | 38 | CC | 0.395 | 1,285,037 | 27,903 | 663,890 | 22,015 | ||
| 2. | 200 | 82 | 1 | 1000 | 100 | 100 | 100 | 100 | 40 | LF | 0.402 | 1,306,485 | 26,475 | 717,116 | 21,990 | 107 |
| 3. | 200 | 82 | 7 | 7000 | 100 | 100 | 100 | 70 | CC | 0.408 | 1,327,521 | 26,942 | 727,756 | 21,955 | 107 | |
| 4. | 200 | 82 | 100 | 100 | 100 | 100 | 42 | CC | 0.444 | 1,442,017 | 32,584 | 716,655 | 28,692 | 2832 | ||
| Architecture | Renewable Fraction (%) | Electricity Generated (kWh/Year) | Excess Electricity Production (%) | Excess Electricity Production (kWh/Year) | Grid | ||||||||||||
|---|---|---|---|---|---|---|---|---|---|---|---|---|---|---|---|---|---|
| HEGS Combination | PV (kW) | DG (kW) | Battery (No. of Strings) | Battery Nominal Capacity (kWh) | Grid (kW) | Electrolyser (kW) | Reformer (kW) | Hydrogen Tank (kg) | Converter (kW) | Dispatch Strategy | DG | PV | Energy Purchased (kWh) | Energy Sold (kWh) | |||
| 1. | 200 | 3 | 3000 | 100 | 100 | 100 | 100 | 38 | CC | 97.7 | 0 | 296,363 | 3 | 9273 | 3285 | 0 | |
| 2. | 200 | 82 | 1 | 1000 | 100 | 100 | 100 | 100 | 40 | LF | 97.8 | 246 | 296,363 | 3 | 9255 | 2987 | 0 |
| 3. | 200 | 82 | 7 | 7000 | 100 | 100 | 100 | 70 | CC | 99.8 | 246 | 296,363 | 3 | 9016 | 0 | 0 | |
| 4. | 200 | 82 | 100 | 100 | 100 | 100 | 42 | CC | 44.2 | 6533 | 296,363 | 17 | 62,542 | 74,976 | 0 | ||
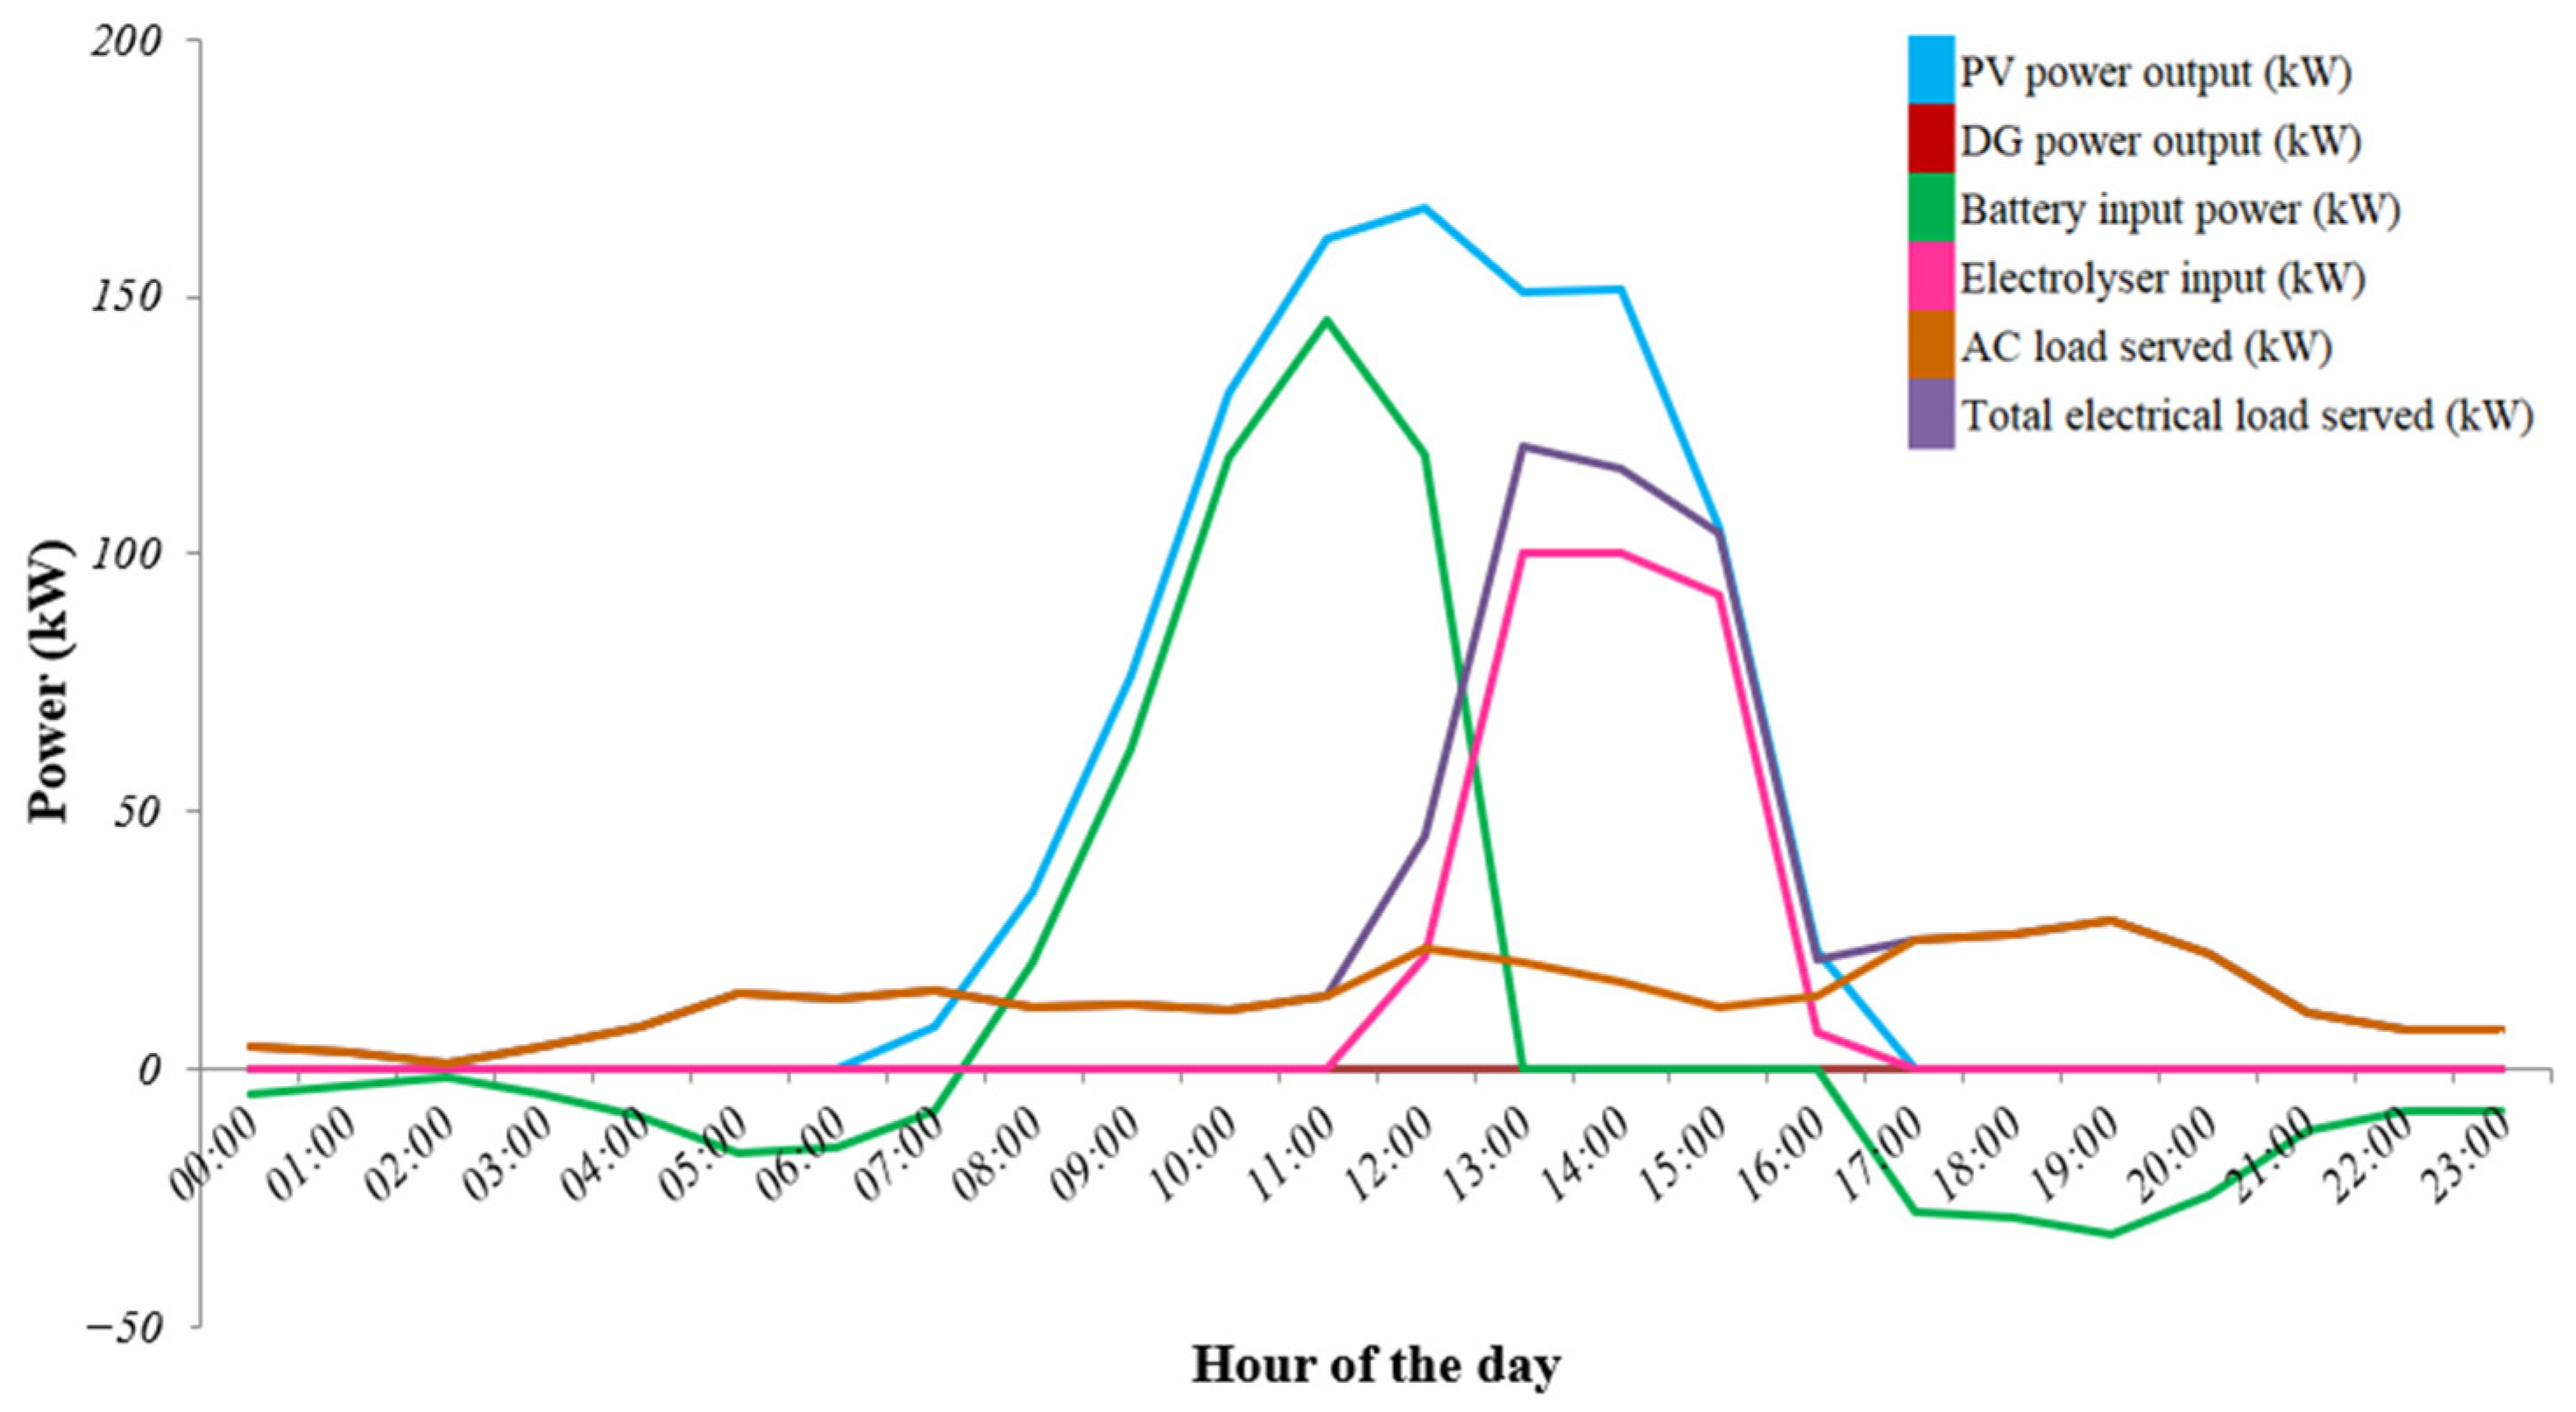
| Time Duration | HEGS Component Contribution |
|---|---|
| 0 to 6th hours |
|
| 6th to 17th hours |
|
| 17th to 23rd hours |
|
| HEGS Component | Power Generated/Consumed | |
|---|---|---|
| Electricity generated | Solar PV array | A = 167 kW |
| Diesel generator | B = 0 kW | |
| Electricity served to load | Battery bank | C = 119 kW |
| Electricity consumed | Electrolyser | D = 21.86 kW |
| Inverter operation | Input power to the inverter | E (=A + B − C − D) =26.14 kW |
| Output power to the inverter (Inverter efficiency = 90%) | F = 23.53 kW | |
| Electricity consumed | AC load served | G = 23.53 kW (this value is equal to F) |
| Total electrical load served | (=D + G) =45.39 kW |
| Architecture | Renewable Fraction (%) | Emissions | |||||||||||||||
|---|---|---|---|---|---|---|---|---|---|---|---|---|---|---|---|---|---|
| HEGS Combination | PV (kW) | DG (kW) | Battery (No. of Strings) | Battery Nominal Capacity (kWh) | Grid (kW) | Electrolyser (kW) | Reformer (kW) | Hydrogen Tank (kg) | Converter (kW) | Dispatch Strategy | CO2 (kg/Year) | CO (kg/Year) | UHC (kg/Year) | PM (kg/Year) | SO2 (kg/Year) | NOx (kg/Year) | |
| 1. | 200 | 3 | 3000 | 100 | 100 | 100 | 100 | 38 | CC | 97.7 | 2076 | 0 | 0 | 0 | 0 | 4.4 | |
| 2. | 200 | 82 | 1 | 1000 | 100 | 100 | 100 | 100 | 40 | LF | 97.8 | 2134 | 1.55 | 0.0678 | 0.00942 | 8.68 | 5.46 |
| 3. | 200 | 82 | 7 | 7000 | 100 | 100 | 100 | 70 | CC | 99.8 | 247 | 1.55 | 0.0678 | 0.00942 | 0.468 | 1.46 | |
| 4. | 200 | 82 | 100 | 100 | 100 | 100 | 42 | CC | 44.2 | 53,888 | 41 | 1.79 | 0.248 | 219 | 139 | ||
Disclaimer/Publisher’s Note: The statements, opinions and data contained in all publications are solely those of the individual author(s) and contributor(s) and not of MDPI and/or the editor(s). MDPI and/or the editor(s) disclaim responsibility for any injury to people or property resulting from any ideas, methods, instructions or products referred to in the content. |
© 2023 by the authors. Licensee MDPI, Basel, Switzerland. This article is an open access article distributed under the terms and conditions of the Creative Commons Attribution (CC BY) license (https://creativecommons.org/licenses/by/4.0/).
Share and Cite
Sambhi, S.; Sharma, H.; Bhadoria, V.; Kumar, P.; Fotis, G.; Ekonomou, L. Technical and 2E Analysis of Hybrid Energy Generating System with Hydrogen Production for SRM IST Delhi-NCR Campus. Designs 2023, 7, 55. https://doi.org/10.3390/designs7020055
Sambhi S, Sharma H, Bhadoria V, Kumar P, Fotis G, Ekonomou L. Technical and 2E Analysis of Hybrid Energy Generating System with Hydrogen Production for SRM IST Delhi-NCR Campus. Designs. 2023; 7(2):55. https://doi.org/10.3390/designs7020055
Chicago/Turabian StyleSambhi, Shilpa, Himanshu Sharma, Vikas Bhadoria, Pankaj Kumar, Georgios Fotis, and Lambros Ekonomou. 2023. "Technical and 2E Analysis of Hybrid Energy Generating System with Hydrogen Production for SRM IST Delhi-NCR Campus" Designs 7, no. 2: 55. https://doi.org/10.3390/designs7020055
APA StyleSambhi, S., Sharma, H., Bhadoria, V., Kumar, P., Fotis, G., & Ekonomou, L. (2023). Technical and 2E Analysis of Hybrid Energy Generating System with Hydrogen Production for SRM IST Delhi-NCR Campus. Designs, 7(2), 55. https://doi.org/10.3390/designs7020055