1. Introduction and Literature Review
The principal goal of busy airport infrastructures (e.g., runways), as complex transportation systems, is to satisfy the daily demands of freight/passenger transportation by ensuring the safety of operations and passengers’ comfort. In other words, guaranteeing the safety of operations should have the highest priority for any airport authority. Therefore, a risk assessment must be integrated into all airport construction and operation phases, which requires transversal skills in several areas due to the large number of involved parameters.
Among all phases of flight (e.g., takeoff, cruise, approach, etc.), landing an aircraft is one of the most critical maneuvers in the aeronautical field due to the high touchdown speeds and heavy aircraft weights involved. According to registered incidents/accidents databases, the most frequent runway-related accident is landing overrun [
1], which is directly related to the difference in landing distance available on the runway and the actual landing braking distance of each specific aircraft. In this regard, runway surface characteristics and its level of service play significant roles in aircraft braking potential.
The sufficient braking potential of aircraft can be guaranteed through the activation of aerodynamic brakes, reverse thrust of engines, mechanical brakes, and tire–pavement interaction (i.e., friction force). The surface conditions of the runway pavement, therefore, have a noticeable impact on aircraft landing braking distance.
A runway pavement during its useful life is subject to a series of deteriorations because of repeated load cycles and environmental conditions, and one of the most common deteriorations of bituminous pavements is the formation of rutting on the runway surface. Rutting appears as surface pavement depression in the wheel path, mainly due to the combined effects of airplane loads and high environmental temperatures during summer. Rutting evolution can be divided into two main steps: post-compaction of the wearing course and squeezing of the hot-mix asphalt on the surface of the wearing course. Rutting negatively affects aircraft performance, and it will perform even worse during precipitation or with the existence of fluid contaminations on the runway surface. Of course, other types of pavement distresses (such as crocodile cracking or potholes) can affect pavement drainage capacity; however, it is supposed that in an airport environment, such distresses are not common due to the high attention paid by airport authorities to runway surface characteristics for safety matters. Other examples of pavement distresses mentioned above are mainly common for road pavements; thus, they are not included in the research herein described.
The drainage capacity of a runway, which determines the accumulated water thickness on the surface, is dependent firstly on the precipitation intensity, runway transversal slope, and mean texture depth of the pavement and the rutting depth.
The main scopes of this research can be divided into, first, analyzing the interactions between the aircraft main gear wheel and the runway pavement in the case of heavy rain, since the existence of any contamination on the runway surface would compromise aircraft performance during landing, and second, evaluating the negative impacts of pavement distresses (i.e., rutting) on runway friction.
For this matter, an accurate analysis of the literature is performed to study the proposed methodologies by other researchers. Throughout the literature, many studies have focused on the effects of water contamination on friction, but sufficient attention has not been paid to the impacts of pavement distresses and how they can weaken aircraft braking potential.
In this regard, an analytical model is developed to simulate tire–fluid–pavement interactions to estimate the braking distance of aircraft during landing on wet-pavement runways affected by rutting. Intense precipitation, variable rutting depths for a 100 m length step, water film depths (e.g., 1 to 26 mm), and aircraft wheel loads (e.g., 10 to 140 kN) are considered as the boundary conditions of the developed model. The output is a model that can estimate aircraft braking distance as a function of rutting depth and can perform further assessment of the probability of the occurrence of landing overrun. After validating the model with existing methodologies and calibrating it according to the actual landing distance required for each type of aircraft, an Italian airport is simulated using a model with real data regarding the level of service of its pavement surface characteristics.
According to the available scientific literature, several studies have been carried out over the past years with the aim of evaluating the probability of the occurrence of runway-related accidents in different boundary conditions (aviation risk assessment).
In 2011, Valdés et al. [
2] developed an accident risk model using a probabilistic approach. The authors collected recorded incident data from different sources into a database and then correlated the data with traffic data. The analysis period chosen is 23 years from 1984 to 2007.
Table 1, which is extrapolated from this study, shows the percentages of accidents assigned to the different phases of flight.
According to this table, the most critical phase of flight is landing.
In 2003 and 2004, Kirkland et al. [
3,
4] gave an important contribution to airport risk analysis by developing a model that is based on a normalized and corrected database of accidents and various boundary conditions (e.g., pavement type, runway geometry, aircraft characteristics, etc.). The model, which mainly evaluates runway excursion accidents due to unsuccessful takeoffs and landings, has three components, comprising probability of occurrence, wreckage location, and severity of consequences. The results of the study confirm the applicability of the model to analyze the risk of runway excursions for limited boundary conditions. Therefore, it is not possible to introduce all desired boundary conditions (e.g., pavement level of service, weather, etc.) to the model.
In 2007 and 2008, Ong and Fwa [
5,
6] studied the influence that the presence of a film of water on the pavement can have on traffic safety, considering both motorways and runways. By investigating the phenomenon of hydroplaning and the reduction of the slip coefficient caused by the presence of water on the pavement, the authors developed a model to evaluate the pneumatic–water–pavement interaction, and it was validated using two reference empirical formulas for the calculation of hydroplaning proposed by Horne and Dreher in 1963 [
7] and Horne et al. in 1986 [
8]. Although the developed model offers many improvements with respect to the previous studies, it is functional with limited choices of water film thicknesses (WFTs) and aircraft wheel loads.
The presence of a water film on the runway pavement has significant consequences, even if the hydroplaning phenomenon does not occur, such as a decrease in skid resistance, which leads to an increase in aircraft braking distances. In 2011, Pasindu et al. [
9] analyzed aircraft braking distances in the presence of various water films on the runway surface by proposing a finite-element model that calculates dynamic skid numbers with the variation of aircraft speed. This model, which simulates the 3D footprint of the aircraft main gear wheel on a wet surface, is based on the pneumatic–water–pavement interaction model proposed by Ong and Fwa [
6]. As before, the developed model is still applicable to a limited choice of WFTs and wheel loads.
In 2018, Ketabdari et al. [
10] collected a comprehensive database of airport ground maneuver accidents/incidents. After that, precise sensitivity analyses based on this database were performed by the authors to discover the most influential parameters on the risk of aircraft operations. As a result of this study, meteorological conditions and runway geometry were selected as the two most impactful variables on the surface conditions of a pavement, respectively, with a consequent increase in the probability of the occurrence of excursion accidents, especially at high aircraft speeds. In 2019, the authors created a risk model based on the outputs of previously performed sensitivity analyses [
11] and the aircraft braking distance model proposed by Pasindu et al. [
9]. This risk model improved the previous restrictions related to the applicable ranges of WFTs and wheel loads, and it estimates aircraft braking distance during landing on a wet runway, but only for a flat runway surface.
In 2021, Ketabdari et al. [
12] analyzed the influences of the longitudinal and transverse slopes of a runway on drainage capacity under intense precipitation conditions and improved the previously proposed braking distance model. The results obtained show how the longitudinal slope has an insignificant effect on the water veil flow path on the pavement, while the runway transverse slope is a fundamental parameter for calculating the thickness of the water veil.
Due to the heavy loading cycles present on a runway, the formation of ruts is one of the main deteriorations that a runway is subject to. Ruts are caused by the accumulation of permanent deformations in the pavement layers that occur along the paths of the wheel passages through the formation of grooves on the surface. In 2016, Pasindu et al. [
13] analyzed the influence of rutting depths (5, 10, 15, and 20 mm) on the hydroplaning risk in the ground operations of aircraft (100, 125, and 150 kN wheel loads). The results demonstrate that the risk of hydroplaning due to the presence of ruts is present only in the early stages of the landing maneuver, where speeds are much higher.
The presence of ruts on a pavement and how it modifies the disposal of surface water has been studied over the years mainly in the road sector. In 2020, Alber et al. [
14] created a three-step model for assessing the drainage capability of a pavement that has ruts. In the first phase, the behavior of the pavement material is characterized, which then, in the second phase, is inserted into a finite-element model (pneumatic–pavement interaction) to evaluate its long-term behavior, predicting the inelastic deformations accumulated on the pavement surface. In the final phase, the deformations obtained in the previous step are used to calculate the thickness of the water film present on the pavement.
Keeping in mind that the ruts on a pavement always occur in pairs (on the passage paths of the wheels), it should be considered that the two ruts may not always be in the same conditions. In 2022, Zhang et al. [
15] investigated the risk associated with a situation in which one track is full of water and the other remains dry, considering the lateral stability of the vehicle resulting from this situation. In the study, a dynamic model of the vehicle was developed, which considers the difference between the coefficients of friction between the two tracks. The study shows that the width and length of a rut trail are the most significant influential parameters on the risk associated with rutting.
2. Model of the Aircraft Landing Braking Distance
The model proposed in this study, which calculates aircraft braking distance over a runway affected by the rutting phenomenon in intense precipitation, consists of four sub-models:
Calculative model of WFTs in various precipitations;
Calculative model of accumulated water thickness in ruts;
Interpolative model of dynamic skid resistance in different WFTs and speeds;
Simulative model of aircraft braking distance in wet/deteriorated pavement.
The braking potential of civil aircraft plays a significant role in total landing distance. It is highly dependent on the surface conditions of the runway pavement, especially during high-intensity precipitations. The runway surface condition, which depends on real-time weather conditions and pavement level of service, can modify the coefficient of friction between the aircraft wheel and the pavement, increasing or decreasing the distance needed to stop an aircraft [
16]. In general, the variables that can influence the braking distance of a landing aircraft can be grouped into three macro categories:
2.1. Calculative Model of WFTs in Various Precipitations
One of the most influential weather conditions on aircraft performance is rainfall. In this regard, the effect of intense precipitation (100 mm/h) considered in the model, compared to a previous study by the authors [
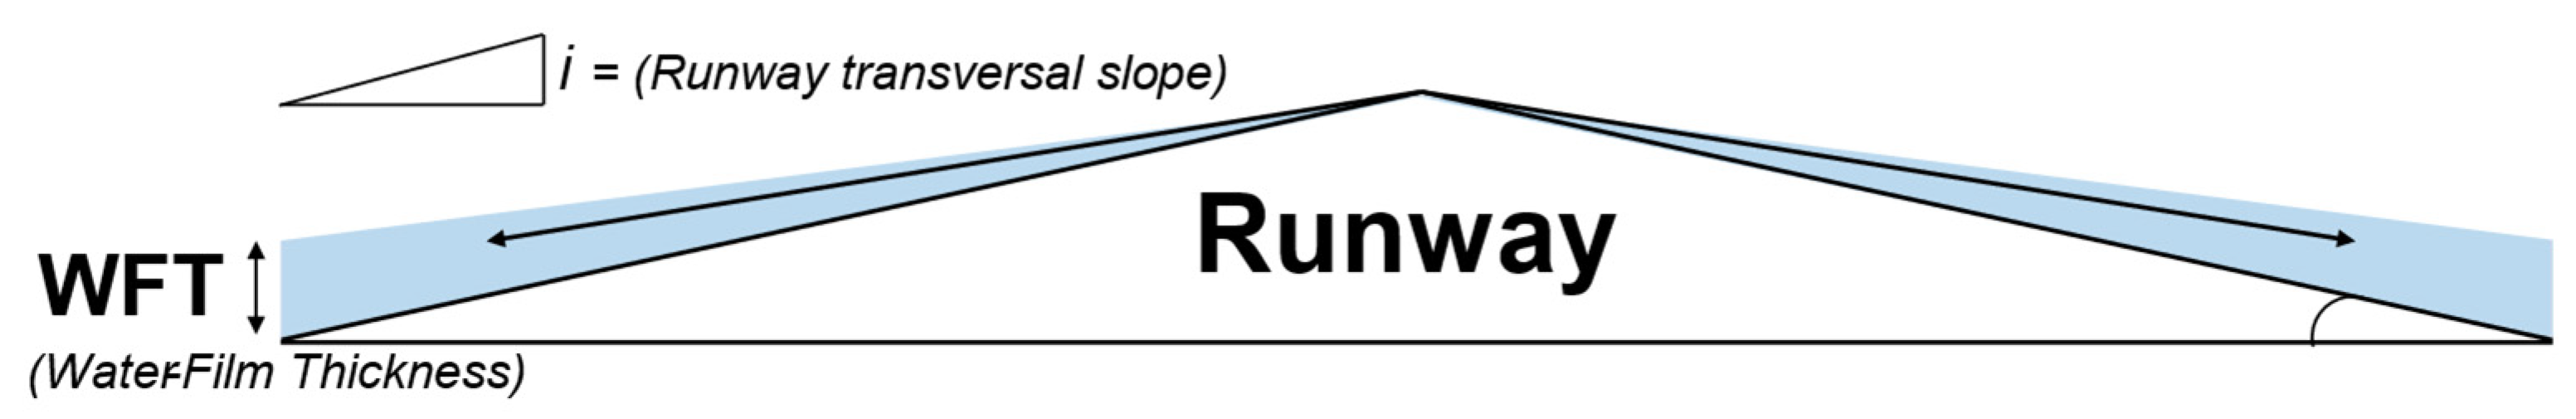
12], which was violent precipitation (65 mm/h), leads to upgrading the model to be compatible with worst-case scenarios. As a result of intense precipitation, the thickness of the water film accumulated on the surface depends on not only the intensity and duration of the rainfall, but also the pavement condition itself. Thanks to the transverse and longitudinal slopes, the flow paths of raindrops are toward the runway lateral borders, as depicted in
Figure 1 for a double-pitched even runway.
Several empirical and analytical formulas have been developed over the past years for calculating the thickness of the water film on a pavement surface following precipitation of a certain intensity. The formula developed by AASHTO in 1992 [
17] is adopted in Sub-Model (1) of this study, as follows:
where
WFT represents the thickness of the water film on the pavement (in),
Lf is the length of the flow path (ft),
I is the rain intensity (in/h),
Sf is the slope of the flow path (/), and
MTD is the mean texture depth (in).
The MTD, which can be measured by the volumetric sand patch method, is a measure of surface roughness and known, in good conditions, by values of just over a millimeter. The pavement texture guarantees the friction of vehicles’ tires at high sliding speeds and becomes essential, especially in wet surface conditions. As can be seen from Equation (1), deteriorations, such as the rutting phenomenon, to which a pavement may be subjected during its useful life have not been formulated in the equation.
2.2. Calculative Model of Accumulated Water Thickness in Ruts
As mentioned before, the pavement deterioration in question for this study is the rutting phenomenon, which manifests itself on the surface by forming a pair of grooves of varying depths along the tire passage paths due to the repeated transit of aircraft (especially during summer) and can modify the surface runoff of rainwater from the runway itself. A pavement that has ruts will therefore have a lower drainage capacity with respect to a non-deteriorated pavement. During rainfall, water gets stuck in the ruts and causes a consequent decrease in the coefficient of friction.
Flexible pavement, which consists of bituminous layers with different thicknesses, is in fact more vulnerable to rutting with respect to a rigid pavement (i.e., concrete slabs). In general, in an airport, the use of a flexible pavement is preferred for the runways, junctions, and taxiways, while a rigid pavement is mainly adopted for the aprons since the flexible pavement guarantees greater friction while making maintenance interventions easier. In other words, requalifying a flexible pavement mostly can be achieved by just repaving surface layers, while in a rigid pavement, the restoration often requires the complete replacement of the slab.
The runway disposal of rainwater can be strongly interrupted by the presence of ruts on the surface, as illustrated in
Figure 2. In the case of intense and long-duration rainfall, water accumulates within the ruts, leading to the formation of a WFT higher than that present on the rest of the pavement.
As confirmed by several studies [
13,
14,
19,
20], during intense rainfall, the pair of ruts will be entirely filled with water as the raindrops move toward runway lateral borders. Therefore, it is reasonable to assume in Sub-Model (2) that over the ruts, the accumulated thickness of water is equal to the depth of the rut, as presented in Equation (2):
where
RD represents the depth of the rut (mm).
Rutting depth and its location can vary transversely along the runway according to axle load, load cycle numbers, and outer main gear wheel span (OMGWS) of each operating aircraft. Moreover, the depth will not be constant along the longitudinal direction of the runway since, during the takeoff and landing maneuvers, not all sections of the pavement will be loaded in the same way. By generalizing the phenomenon in an airport with uneven traffic, ruts with different depths in the longitudinal direction and at various distances from the runway centerline will be formed. An aircraft normally lands with the nose gear positioned exactly on the runway centerline with the main gear wheels at the same transverse distances from the centerline. Therefore, by comparing the OMGWS of each operating aircraft and the exact location distribution of ruts, it is possible to evaluate whether the wheels pass through the ruts.
The WFT is dependent firstly on the precipitation intensity, runway transversal slope, and the mean texture depth of the pavement and the rutting depth. In other words, the possible volume of water that can accumulate in an existing rut over the runway surface depends on the drainage rate of the runway (based on the transversal slope) after rainfall. The water film thickness that is stock in the rutting is dependent on the RD and the mean texture depth of the pavement, as expressed by the above-mentioned equations. The ruts present on a runway can be measured via a profilometer bar, which is generally mounted on a vehicle that runs along the runway parallel to the runway centerline. The profilometer bar is equipped with a laser that, at a constant pitch, detects the transversal profile of the pavement. By processing the results of the measurement, the depth of the ruts and their distribution for the entire extension of the runway can be obtained. According to ASTM [
21], the severity thresholds for this type of deterioration in an airport are presented in
Table 2.
2.3. Interpolative Model of Dynamic Skid Resistance in Different WFTs and Speeds
After determining how intense rainfall fills the existing ruts over a runway, based on the longitudinal and transverse slopes, and forms different WFTs, the computation of dynamic skid number, affected by considered boundary conditions, should be investigated.
Skid number, which is linked to the pavement friction, depends on the aircraft speed and the WFT, as presented in Equation (3) [
9]:
where
Fx represents the horizontal forces acting on the aircraft (N), and
Fz is the vertical forces acting on the aircraft (N).
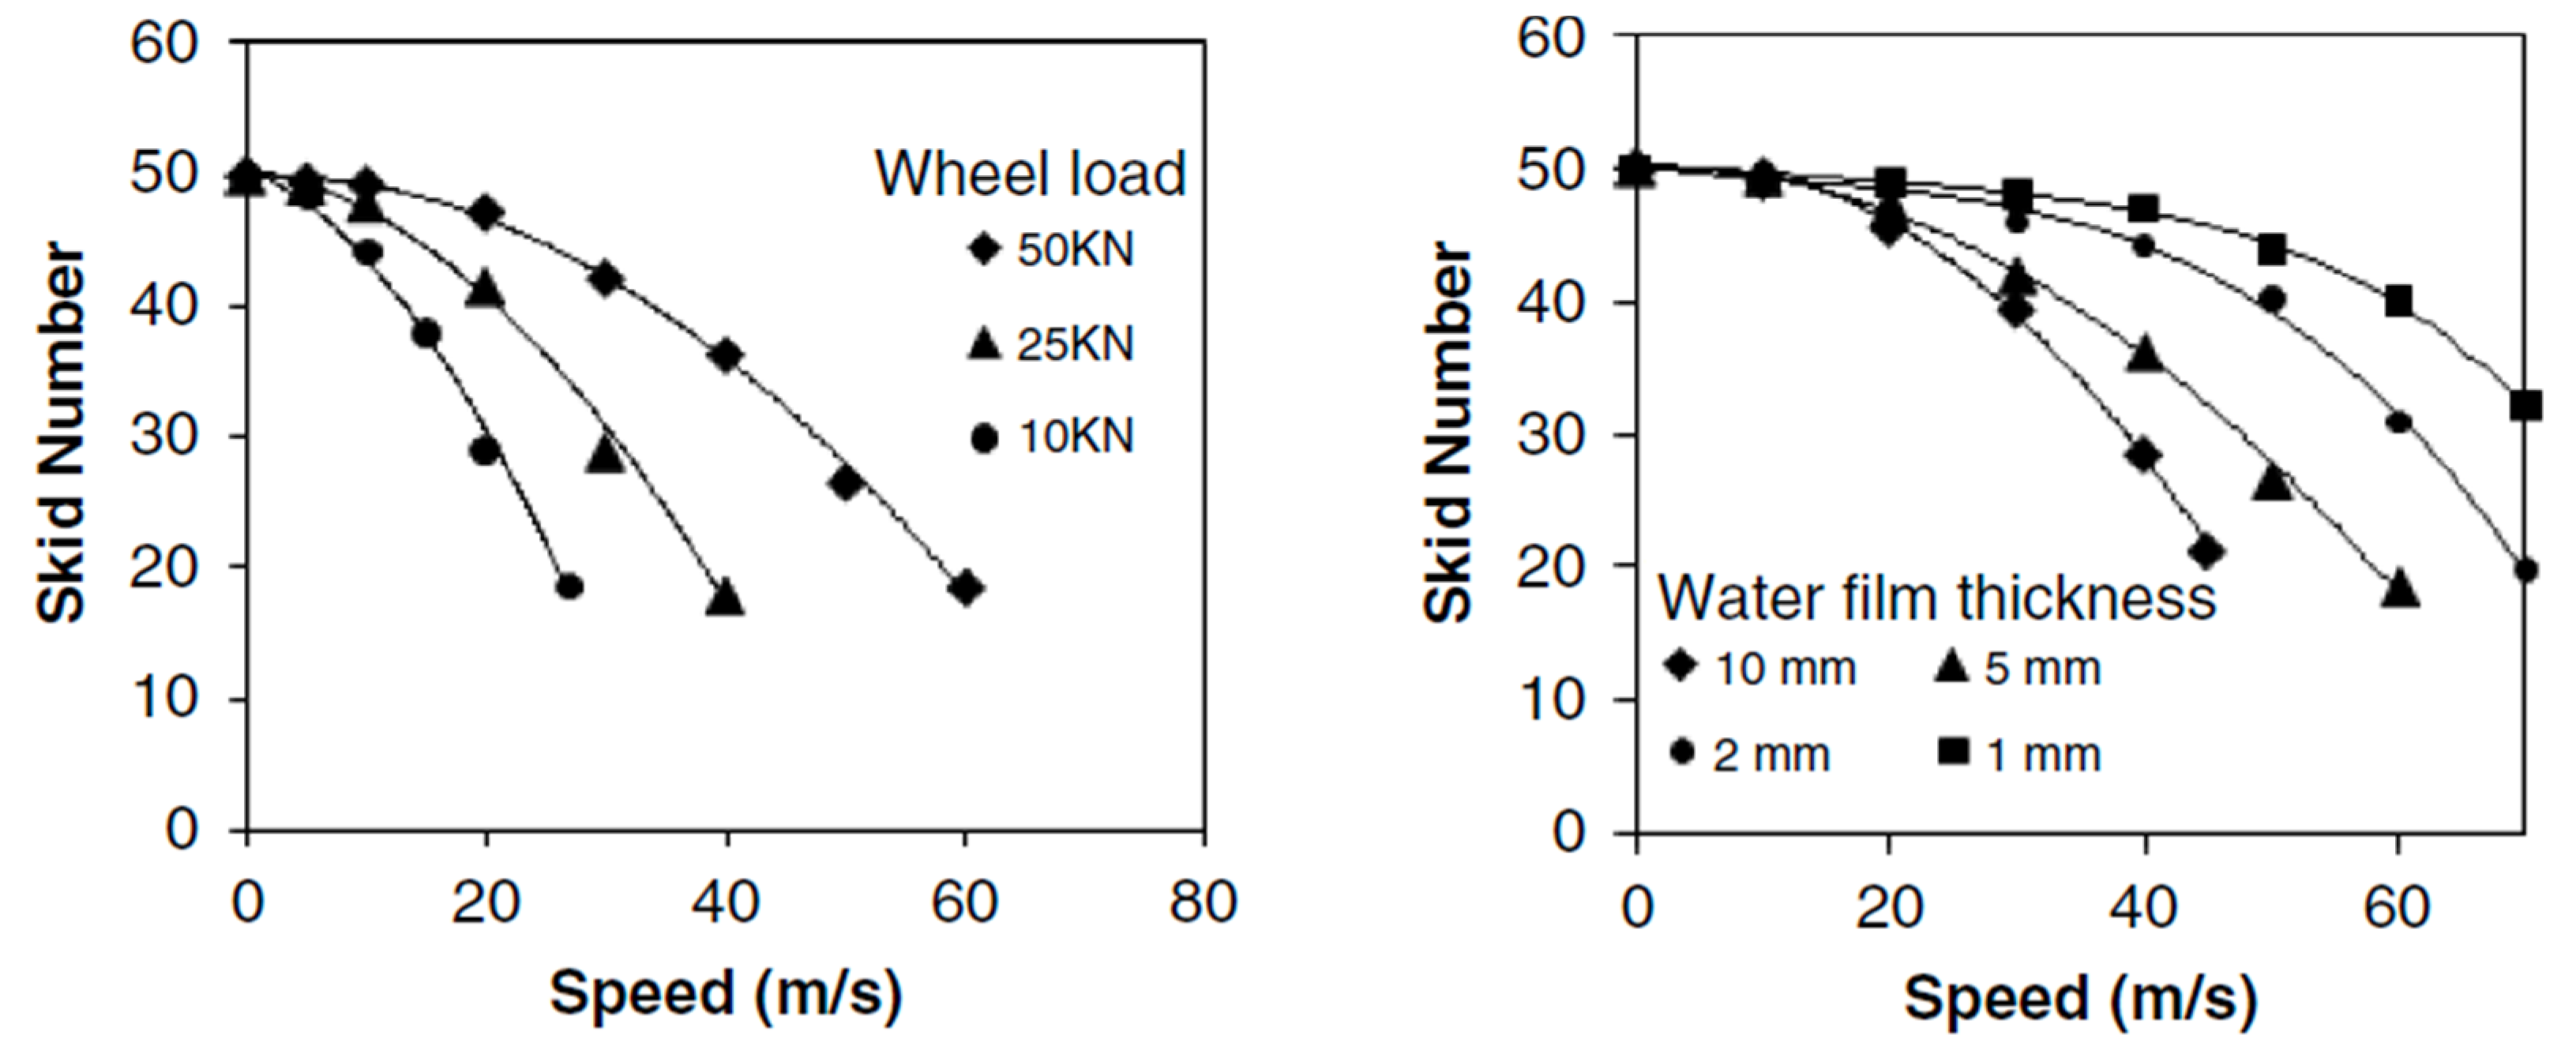
In the presence of water films over the surface, skid resistance between the tire and pavement has a dynamic nature, and it will be varied according to changes in speed and wheel load (W) of the vehicle. Pasindu et al. [
9] proposed the relationship between SN, WFT, and aircraft wheel load, as depicted in
Figure 3.
As can be interpreted from the figure above, these relationships are applicable only to limited ranges of WFTs and wheel loads. Therefore, to expand these limitations and make the relationships applicable for wider ranges, several interpolation algorithms have been tested in Sub-Model (3) to find the best-fitted one, as presented in
Table 3.
By selecting the best-fitted relationship (highlighted ones on the table), in which a, b, and c are the general coefficients, it is now possible to compute the relative skid numbers to speed values for WFTs (from 1 to 26 mm) and aircraft wheel loads (from 10 to 140 kN).
2.4. Simulative Model of Aircraft Braking Distance in Wet/Deteriorated Pavement
After achieving the objectives of the above-mentioned steps, thanks to Sub-Model (4), it is possible to calculate the aircraft braking distance during landing on a wet-pavement runway, which is affected by rutting. This step, which is formulated based on the law of motion, calculates the braking distance through the following principal Equation (4):
where
S represents the aircraft braking distance (m),
Vb is the speed of the aircraft at onset of braking (m/s),
g is the gravitational acceleration (m/s
2), ρ is the air density (kg/m
3),
v(t) is the aircraft speed at time t (m/s),
μ(v,x) is the dynamic coefficient of friction between tire and pavement,
A is the wing area (m
2),
CD is the drag coefficient, and
CL is the coefficient of lift.
It is assumed that the aircraft wheel stops rotating as the braking system is activated and the aircraft slides on the pavement due to the water film present on the runway. Therefore, the wheel in this condition has a zero angular speed and a sliding speed equal to that of the aircraft, which can be considered as the worst-case scenario.
Out of the entire duration of landing, only the time span from the moment of touchdown, with horizontal aircraft alignment, till the full stop is adopted in the computations. Moreover, in the model, the interaction of the aircraft main gear with the pavement is considered since the main gear carries approximately 95% of the weight of the aircraft [
9,
12]. Therefore, Equation (5) is adopted to calculate the weight acting on a single wheel of the aircraft main landing gear (
W):
where
MLW presents the maximum landing weight (kg),
n is the number of wheels in the main gear, and
L is the lift (kN), which can be calculated through Equation (6):
where
v presents the aircraft approach speed (m/s). Therefore, to calculate the aircraft braking distance through Equation (4),
MLW should be substituted with
W obtained from Equation (5).
In addition, it is assumed that an aircraft lands with the nose gear positioned exactly on the runway centerline. Consequently, the outer main gear wheel span (OMGWS) will be aligned symmetrically with respect to the runway centerline.
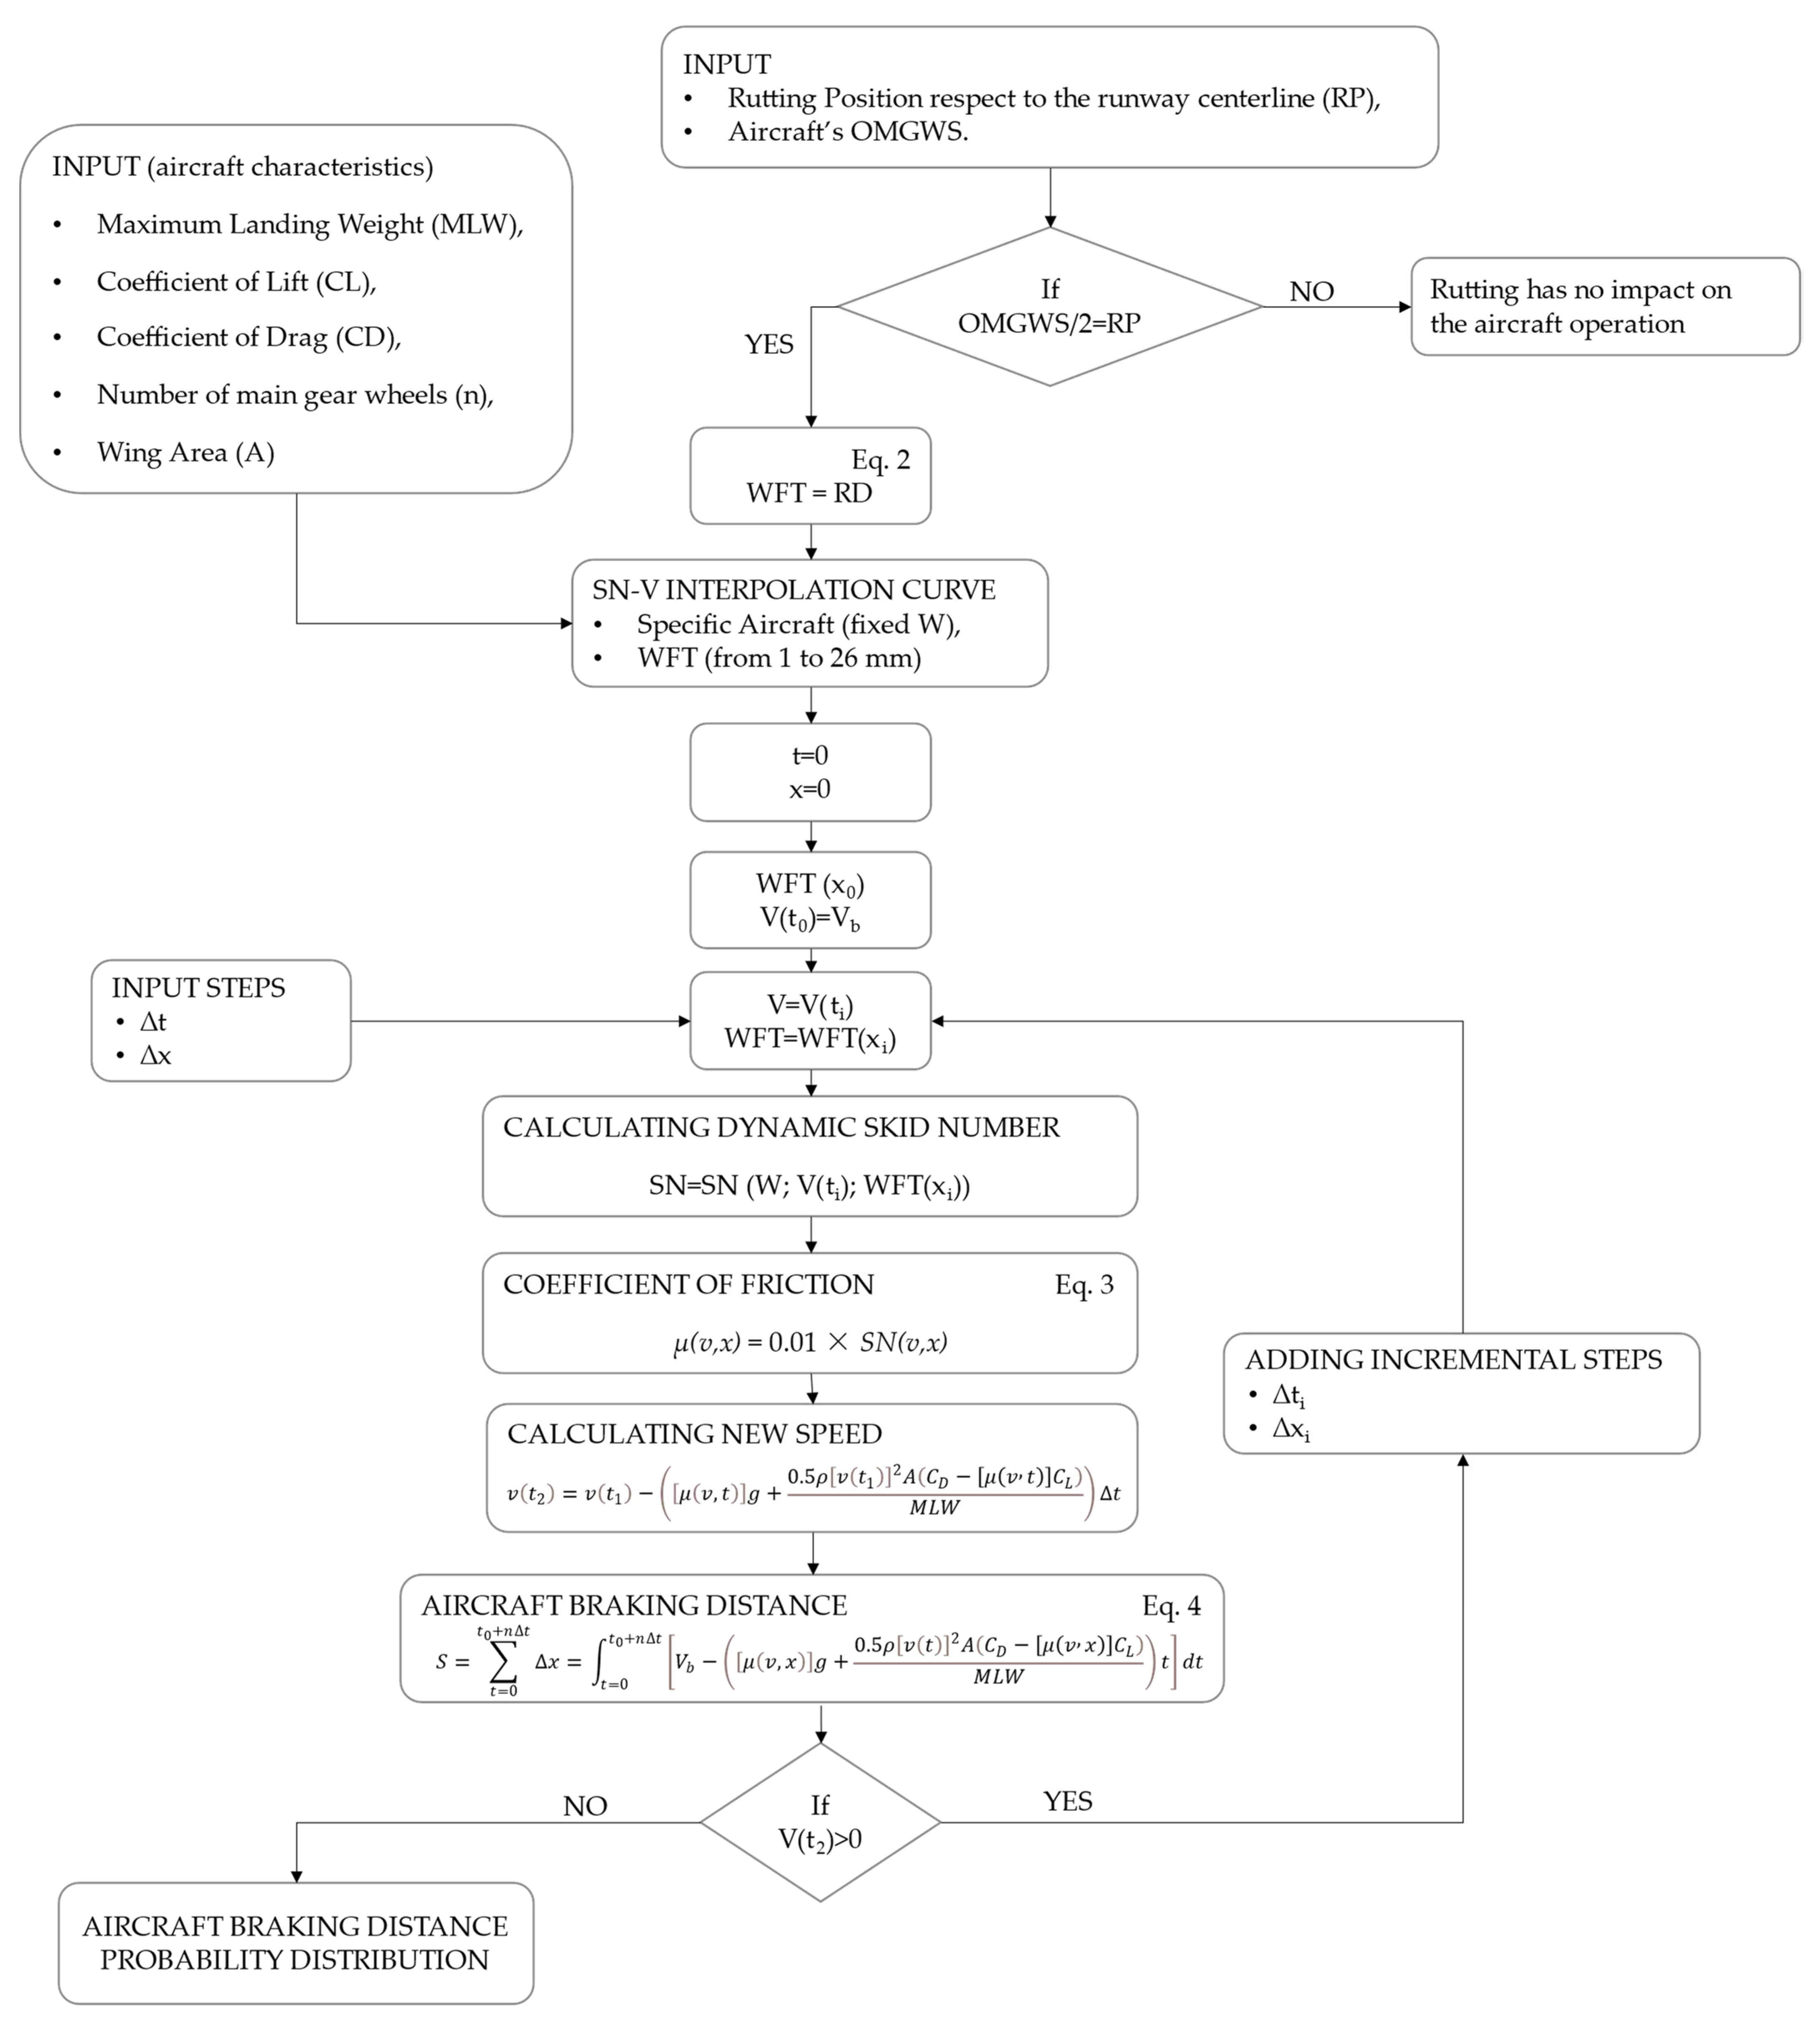
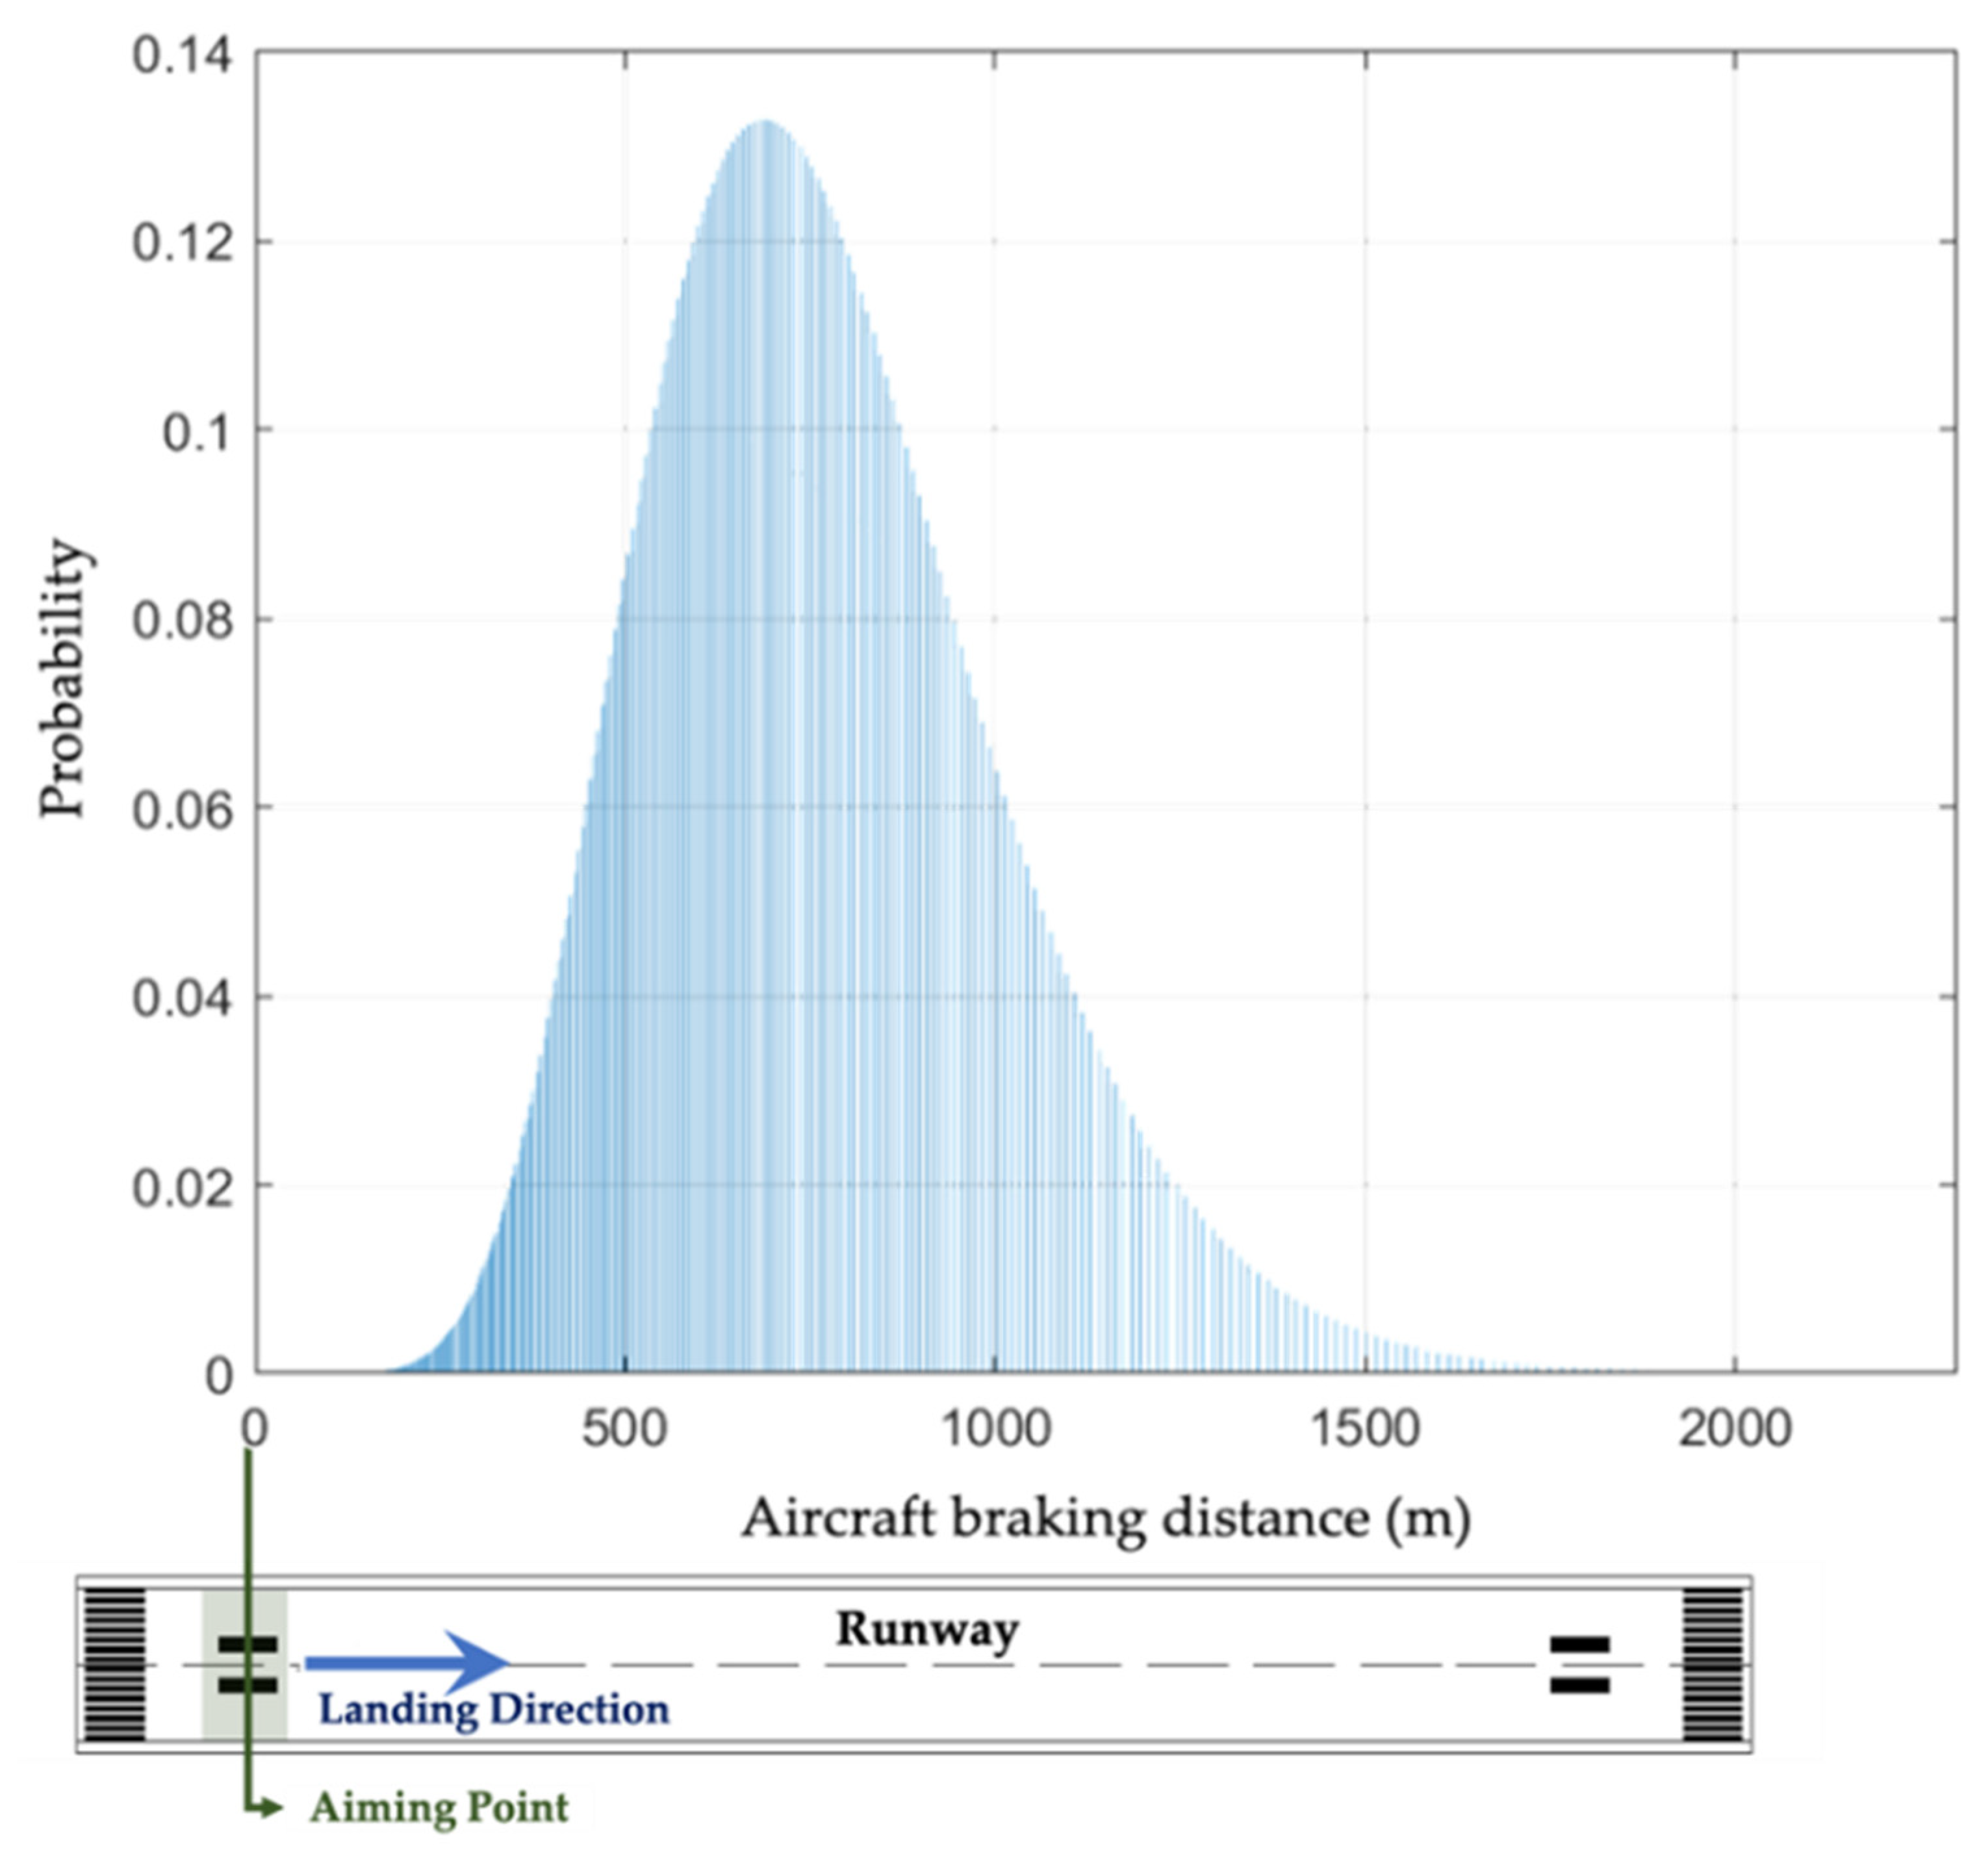
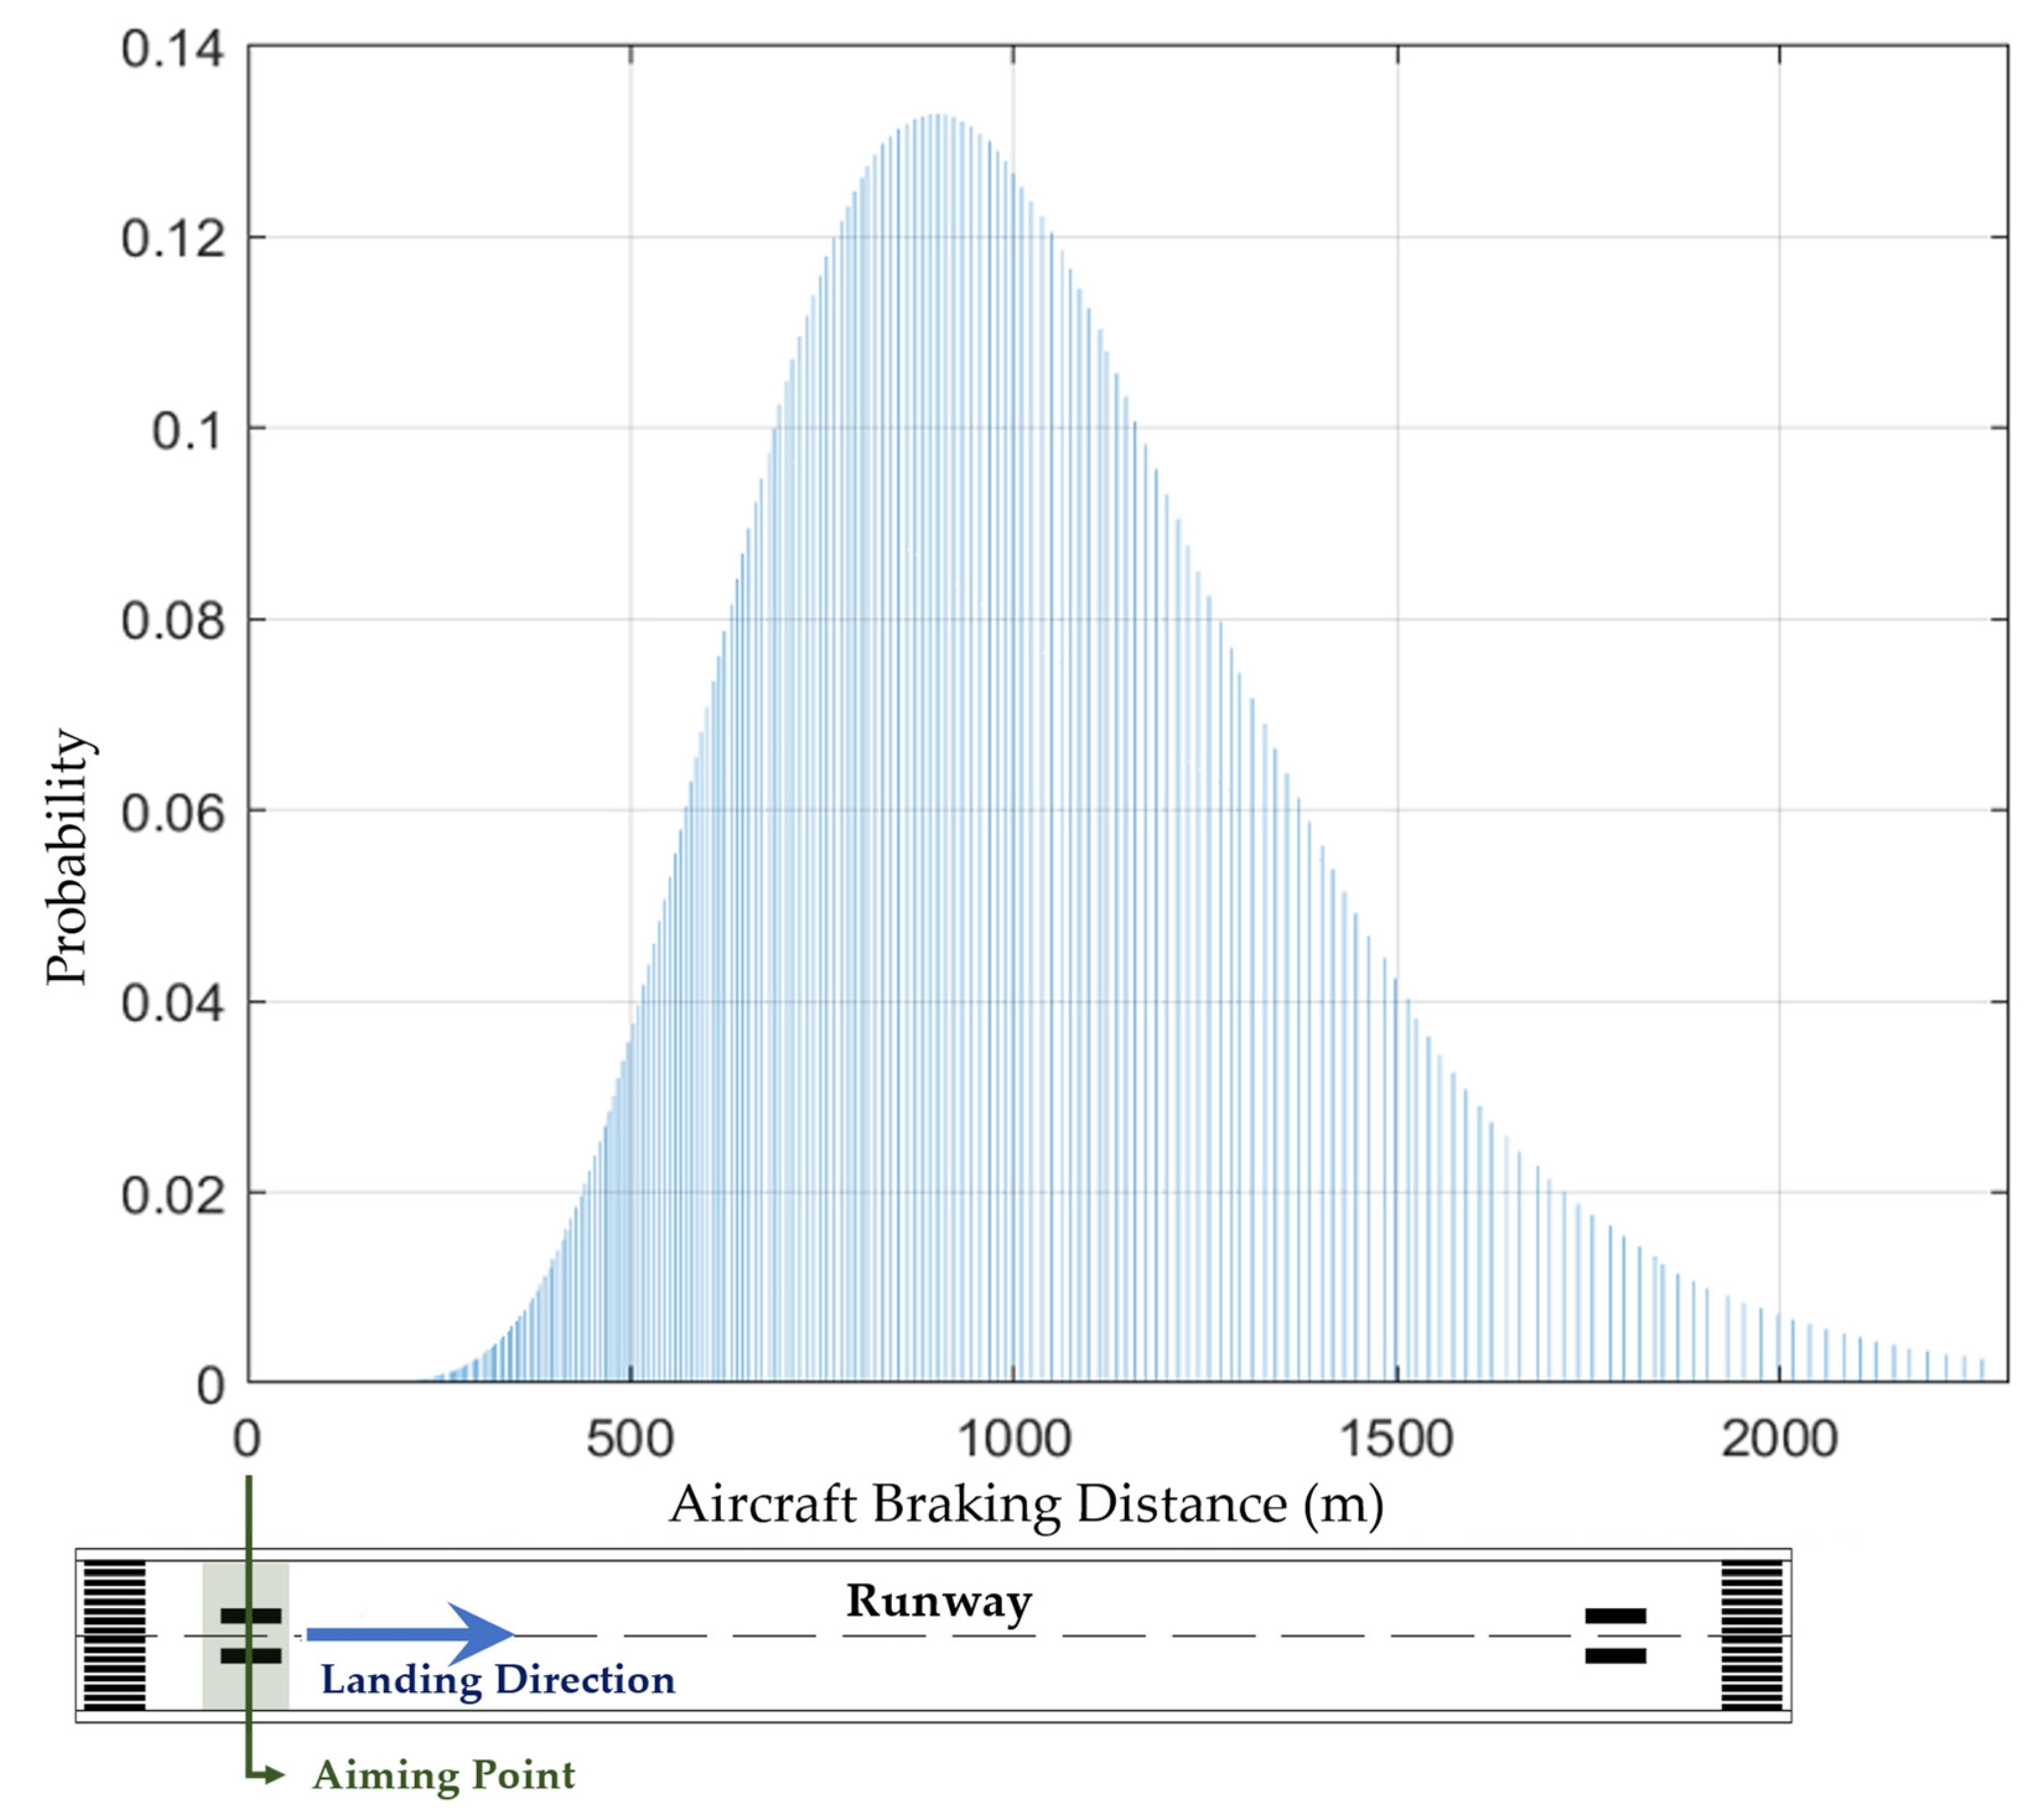
The actual simulation of aircraft braking distance is carried out through modeling codes conducted in the MATLAB environment. In other words, several scripts have been conducted, which by collecting the required input variables, return the Gaussian probability distribution of the braking distances of a specific aircraft landing on a pavement for different operation boundary conditions (e.g., different WFTs, MTDs, RDs, and various touchdown speed ranges, as fully described above).
The developed scripts solve Equation (4) for successive time intervals by means of a loop that stops when V(2) is equal to 0, which means the aircraft reaches a full stop. The coefficient of friction μ(v,x) present in the formula is updated at each time step Δt according to the changes in skid resistance.
The flow chart presented in
Figure 4 explains how the developed model works in all its parts, as well as which input data are required for each phase.
6. Conclusions
In this study, an analytical model for calculating the braking distance of landing aircraft on a wet and rutted runway is proposed. The model considers the depth of ruts present on the pavement surface through the hypothesis of adopting a water film thickness equal to the rutting depth.
Intense precipitation, variable rutting depths for a 100 m length step, water film depths (e.g., 1 to 26 mm), and aircraft wheel loads (e.g., 10 to 140 kN) are considered as the boundary conditions of the developed model.
The outputs are the probability distributions of braking distance, useful for performing a quantitative risk assessment of the ground operation of aircraft. In fact, by comparing the length of a given runway, with the braking distances obtained from the model, it is possible to calculate the probability of runway excursions (i.e., overruns) by a given aircraft. Furthermore, by defining the exact position of obstacles present in the runway surroundings, the probability that a certain aircraft will hit a specific obstacle can be obtained. Moreover, the development of this model aims to identify the acceptable threshold of the rutting depths for aircraft maneuvers in intense precipitation conditions on a particular runway by evaluating the possible consequences (e.g., an increase in aircraft braking distance during landing).
It should be noted that identical models that can evaluate the braking distance of aircraft during landing on a wet and rutted pavement do not exist in the literature, which emphasizes the innovative nature of this study. However, it is possible to find similar models that compute the braking distance of landing aircraft on wet pavements but with limited ranges of WFTs. Therefore, compared to the existing models, the proposed model is not only capable of considering a noticeably wider range of WFTs, but it can also apply the effect of rutting depth in the braking distance calculation.
Thanks to this model, it is also possible to evaluate the efficiency of runway junction locations by superimposing the obtained Gaussian probability distribution of aircraft braking distance on the runway plan to assess the most optimum area to exit from the runway. An analysis of this type can be useful both in the preliminary design phase of new airport infrastructures (i.e., runways) or in maintenance interventions of an existing airport.


