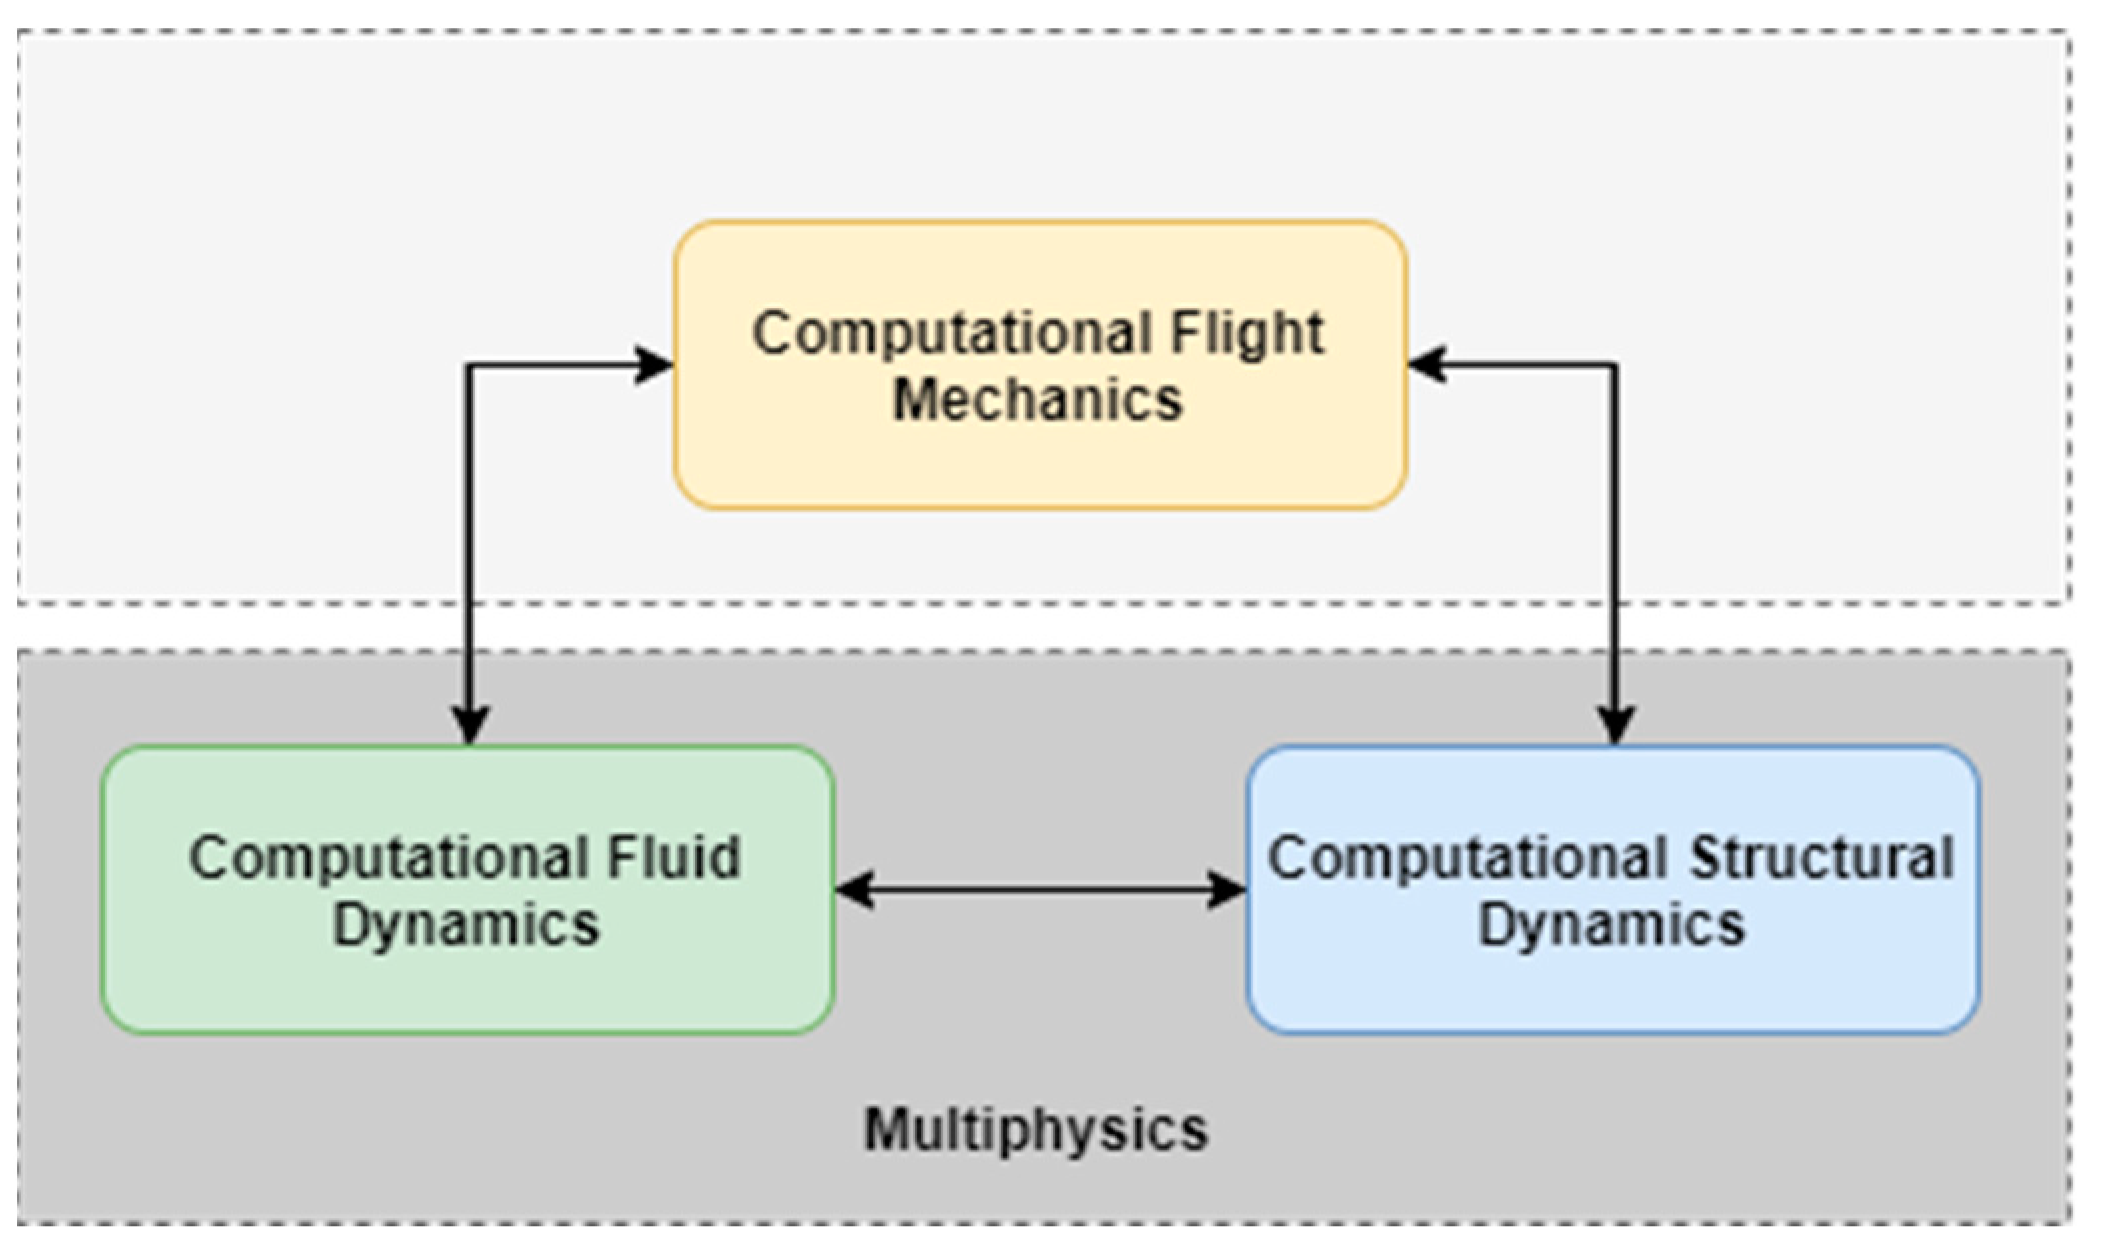
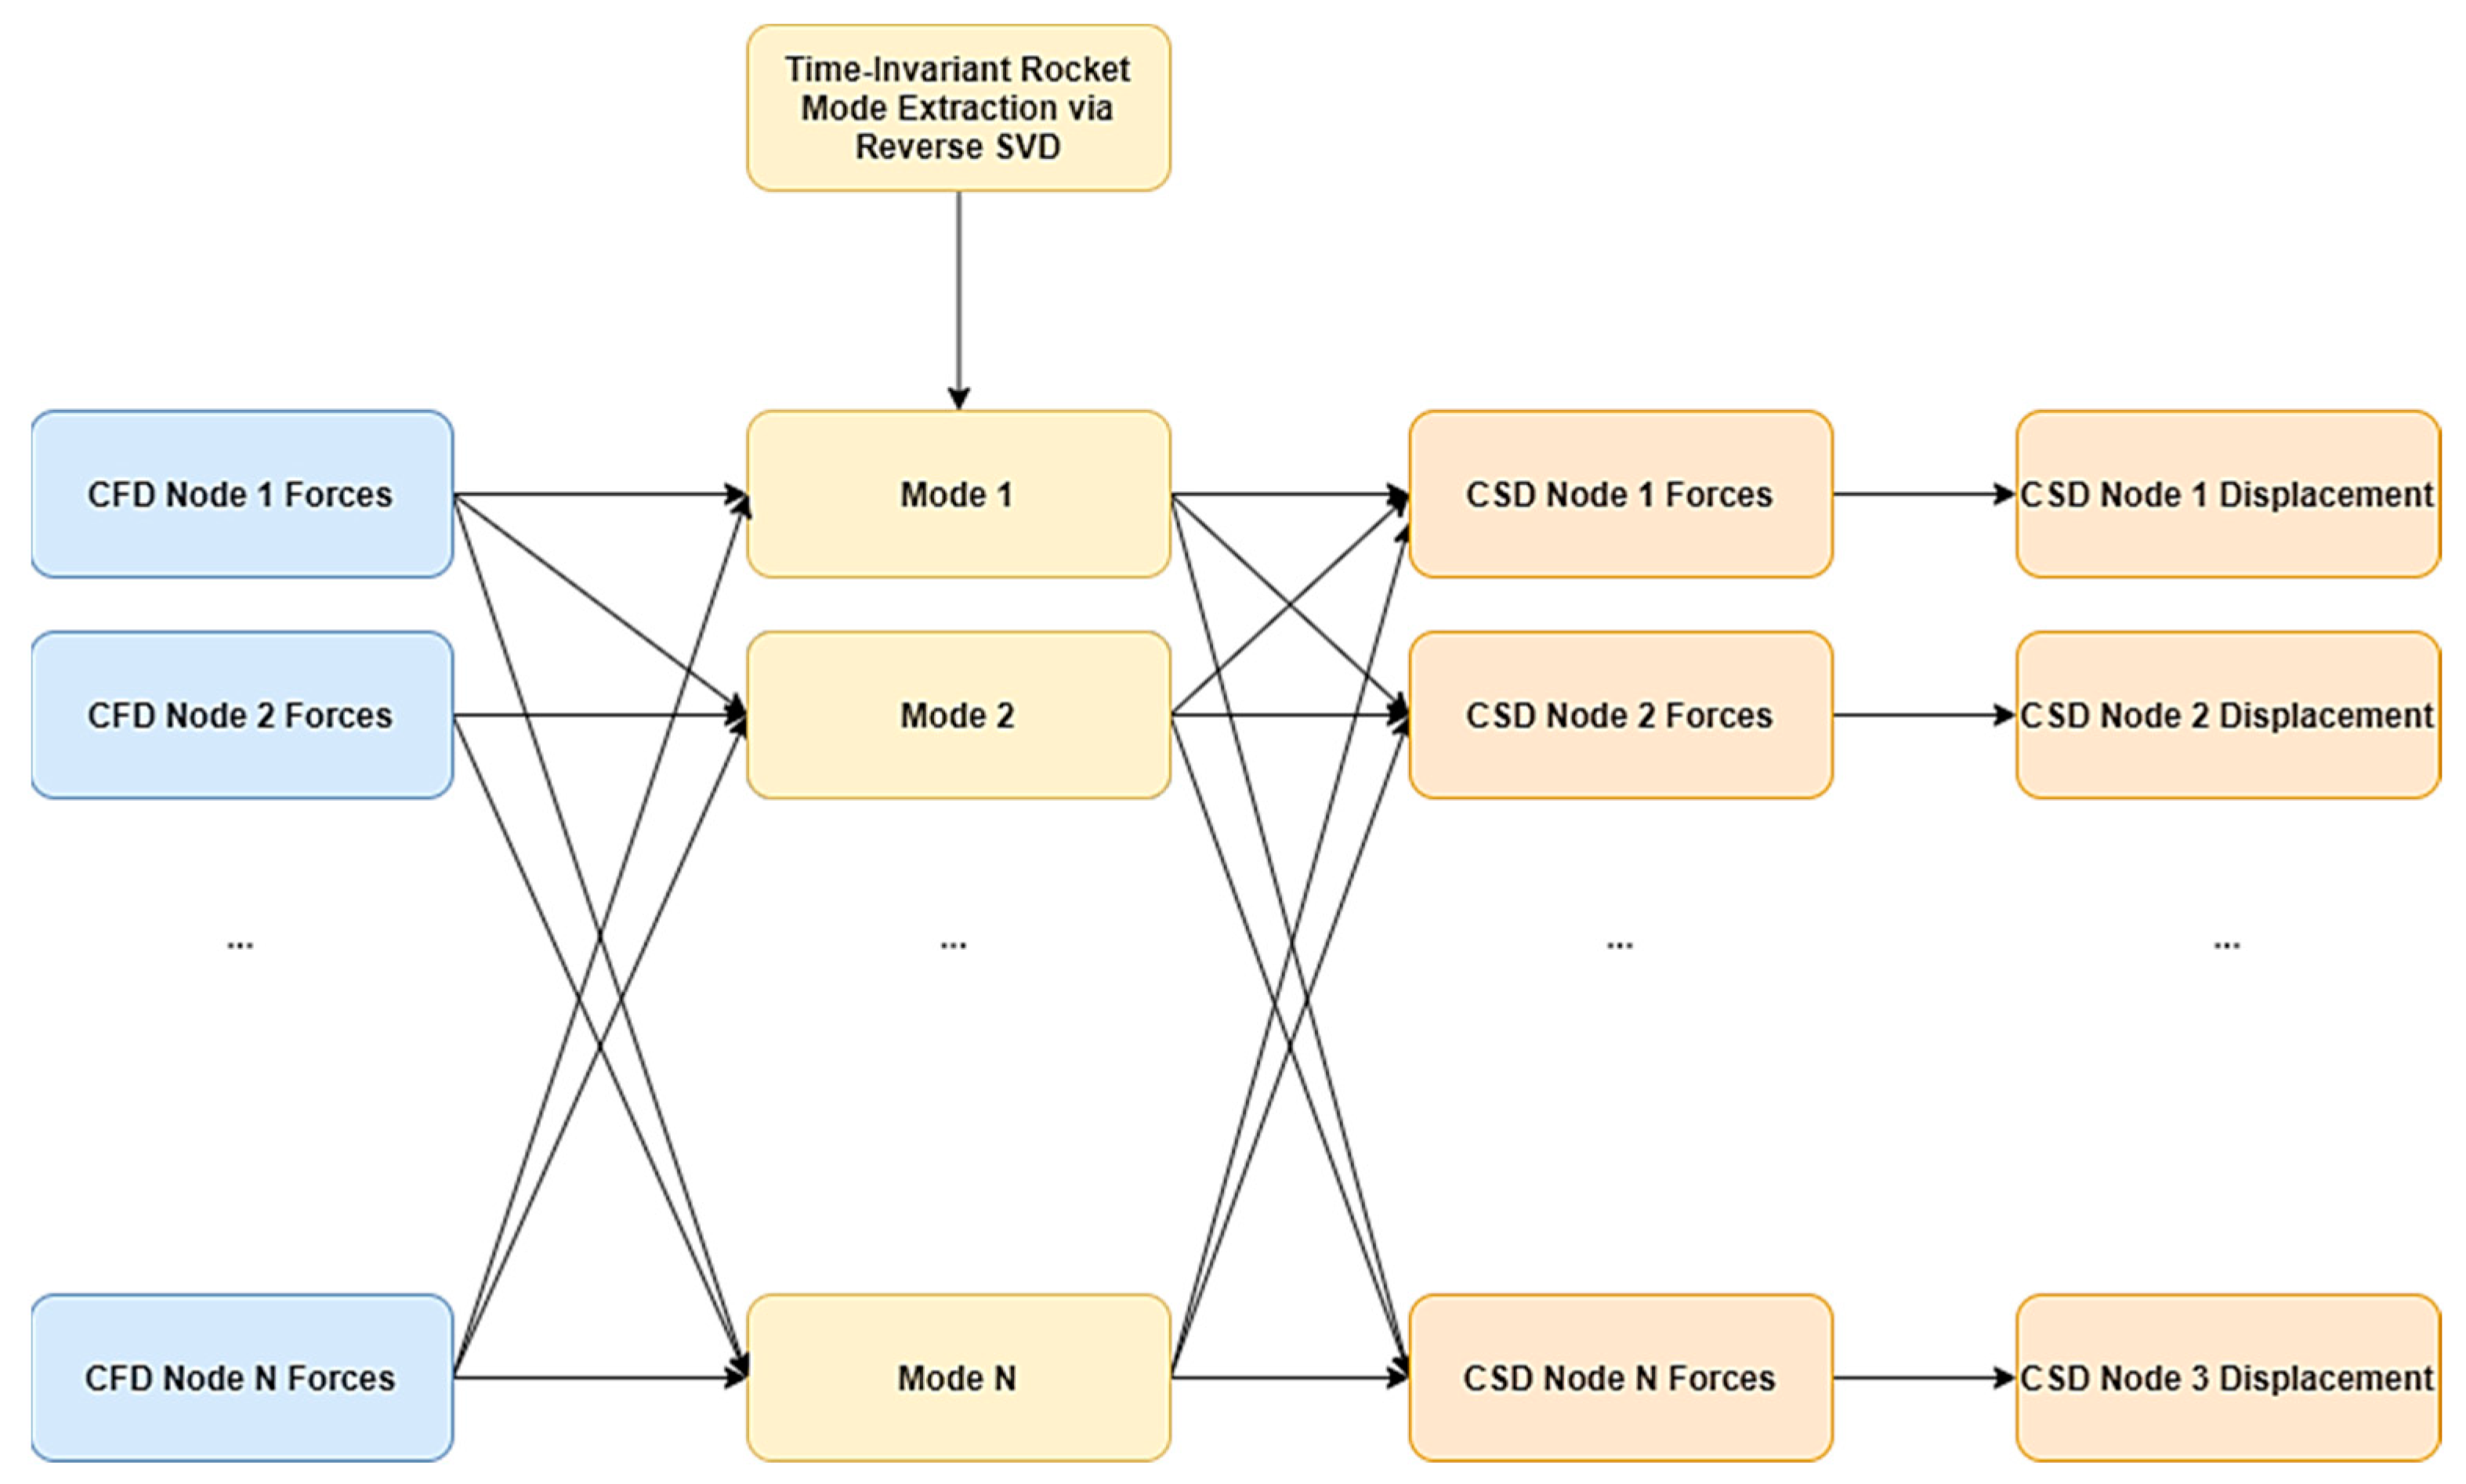
Figure 1.
Governing subsystem interactions.
Figure 1.
Governing subsystem interactions.
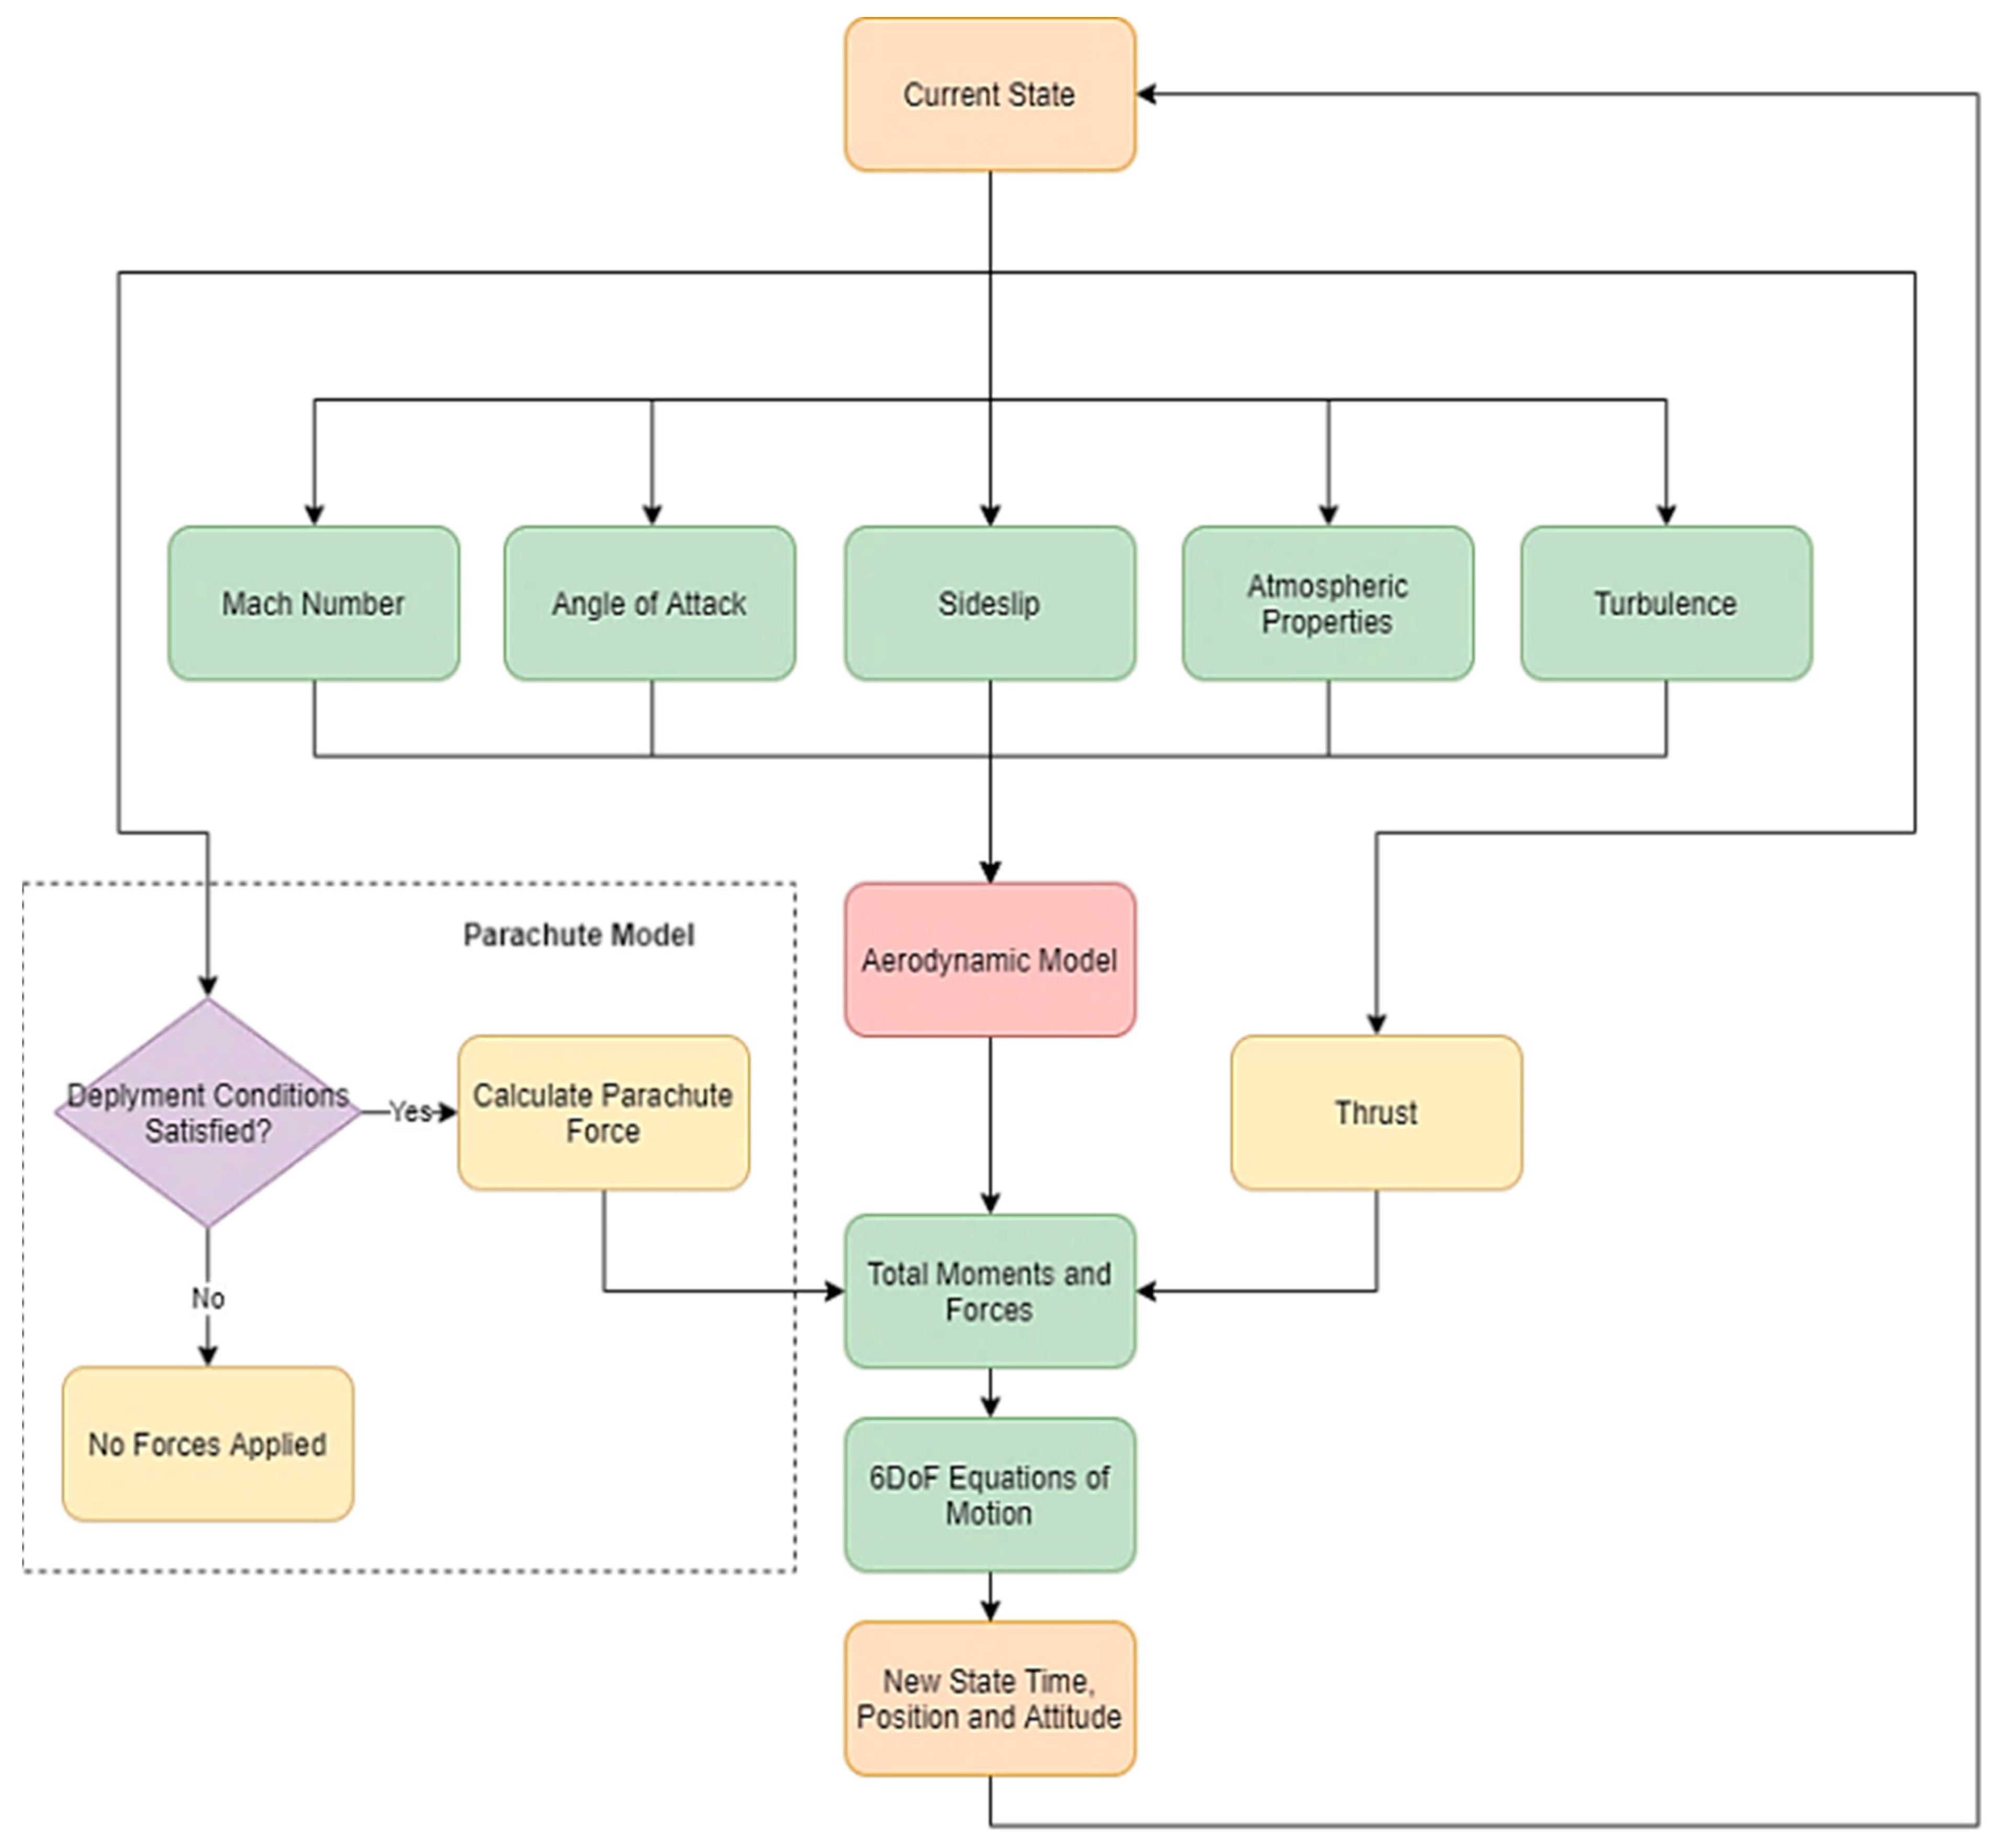
Figure 2.
Flowchart of the overall model determination process.
Figure 2.
Flowchart of the overall model determination process.
Figure 3.
Adopted rocket body axes reference frame.
Figure 3.
Adopted rocket body axes reference frame.
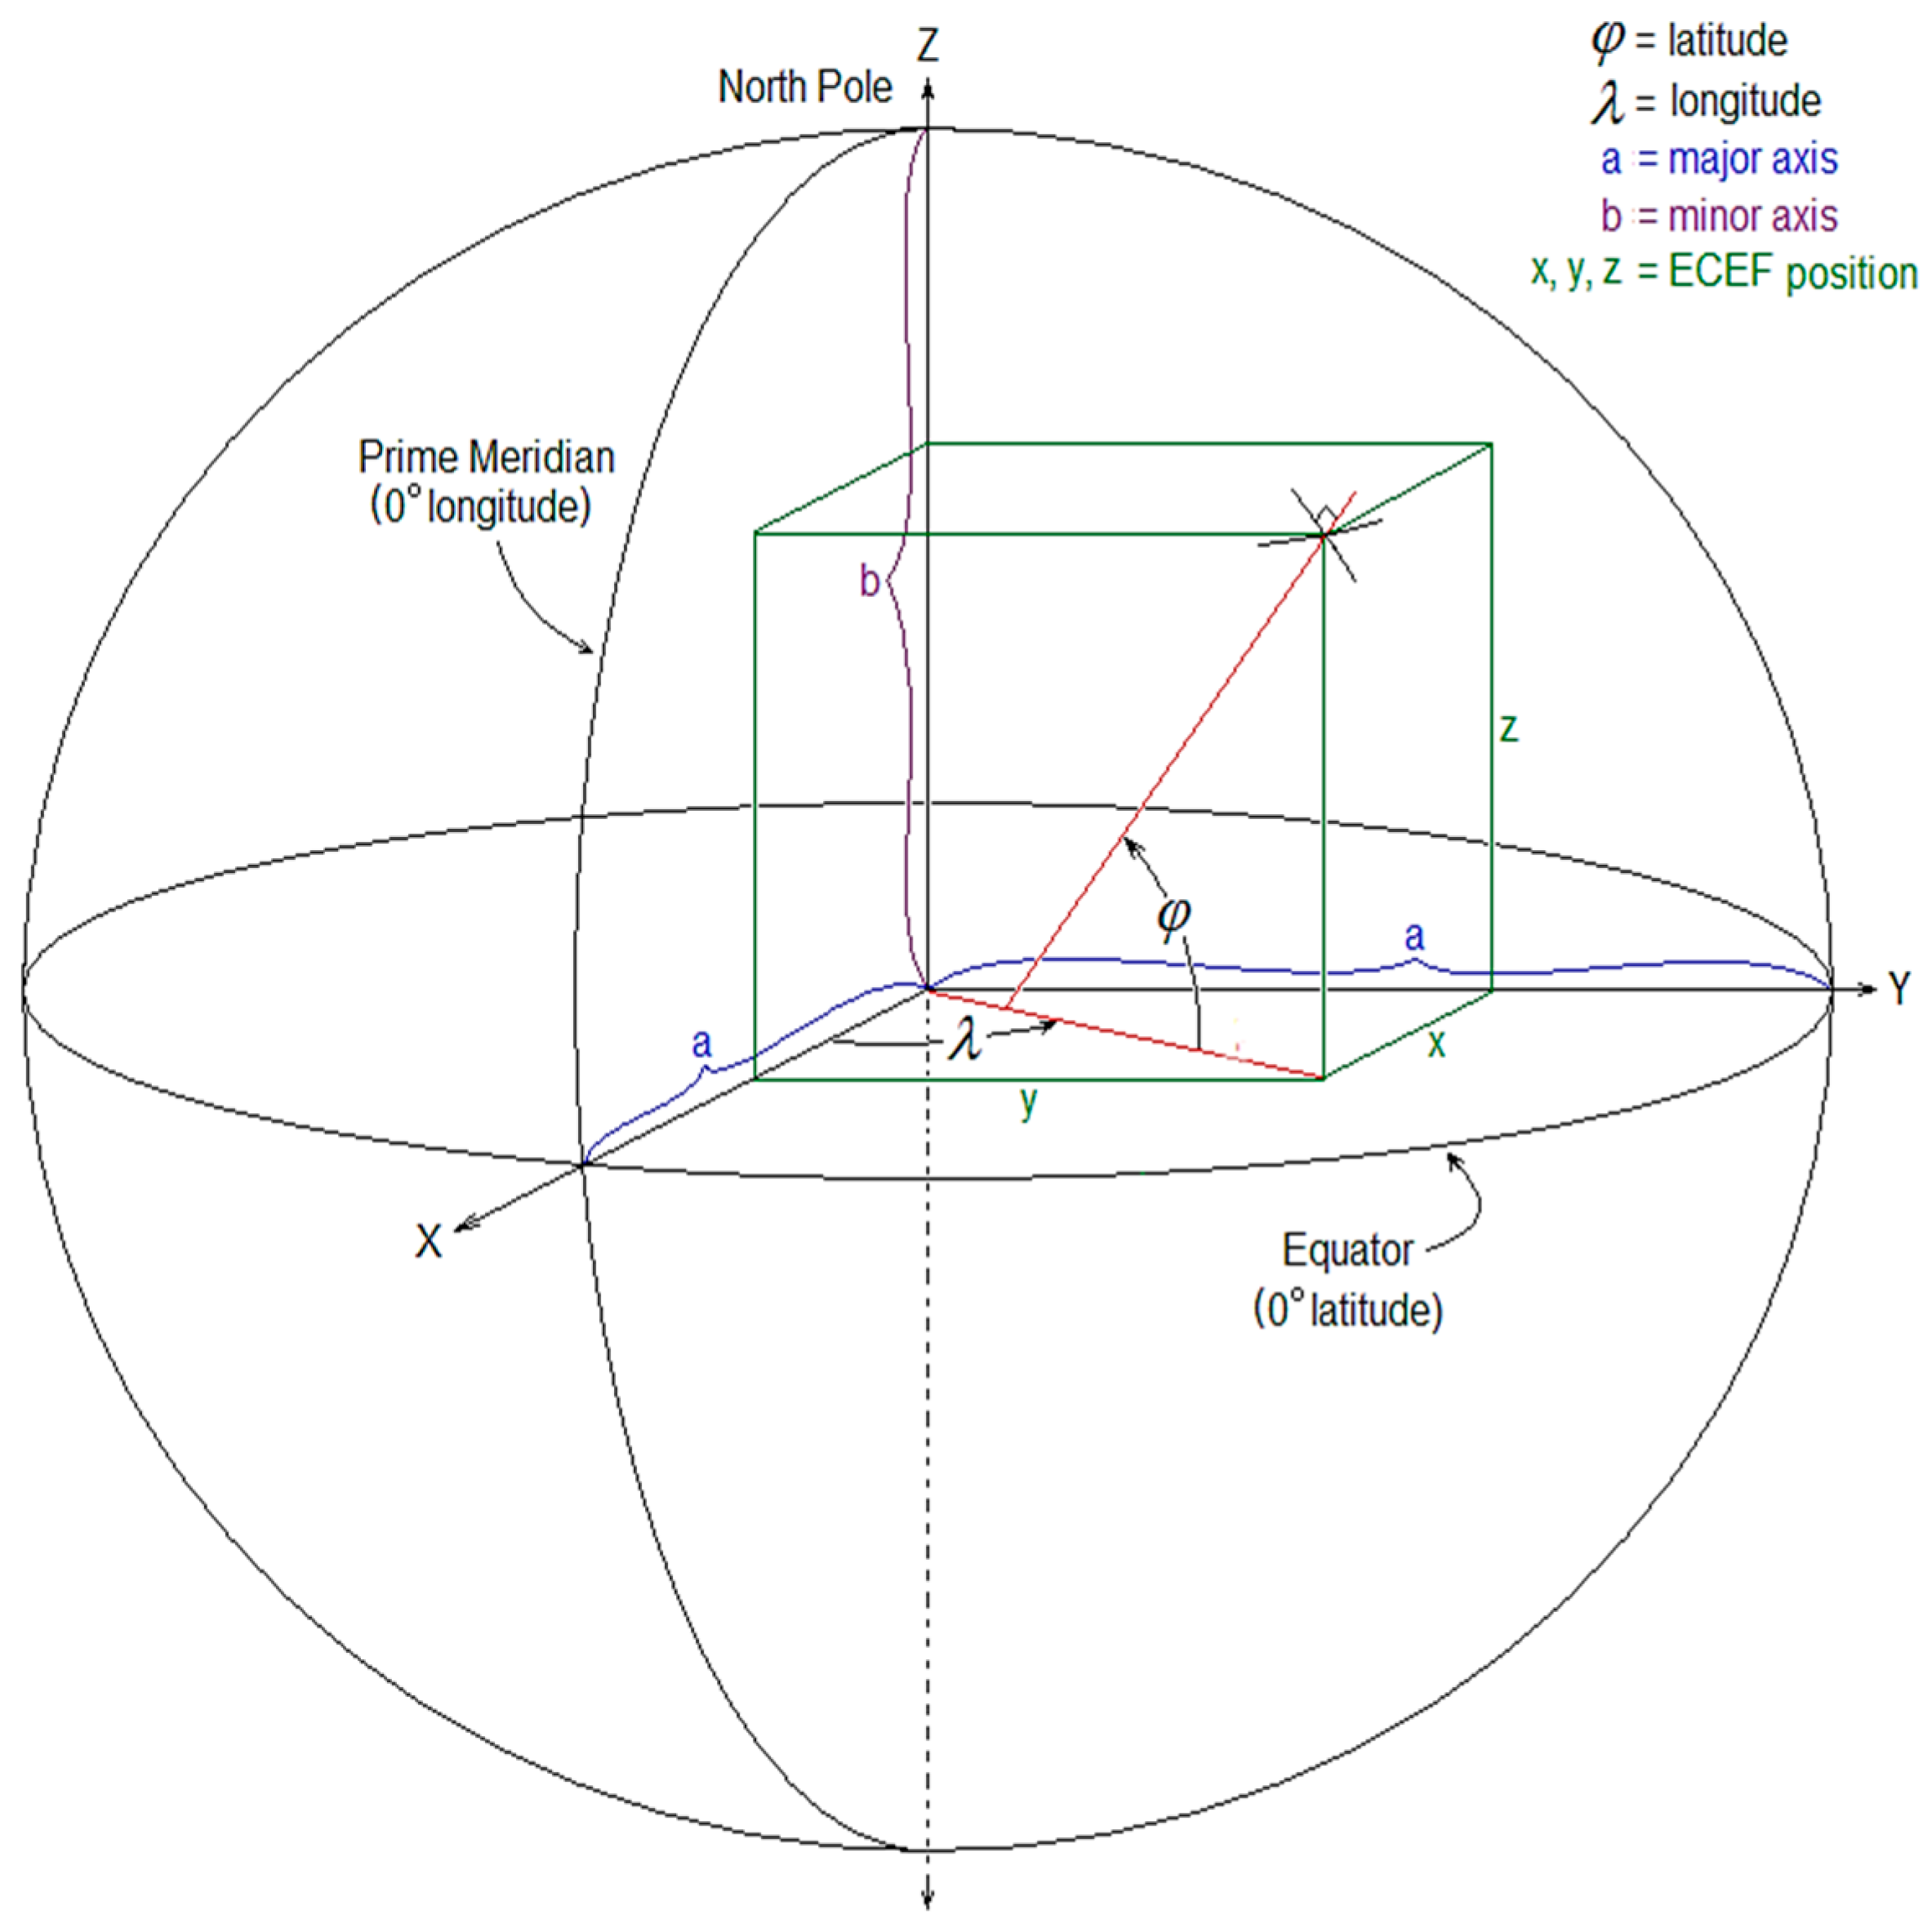
Figure 4.
Adopted ECEF coordinate system [
43].
Figure 4.
Adopted ECEF coordinate system [
43].
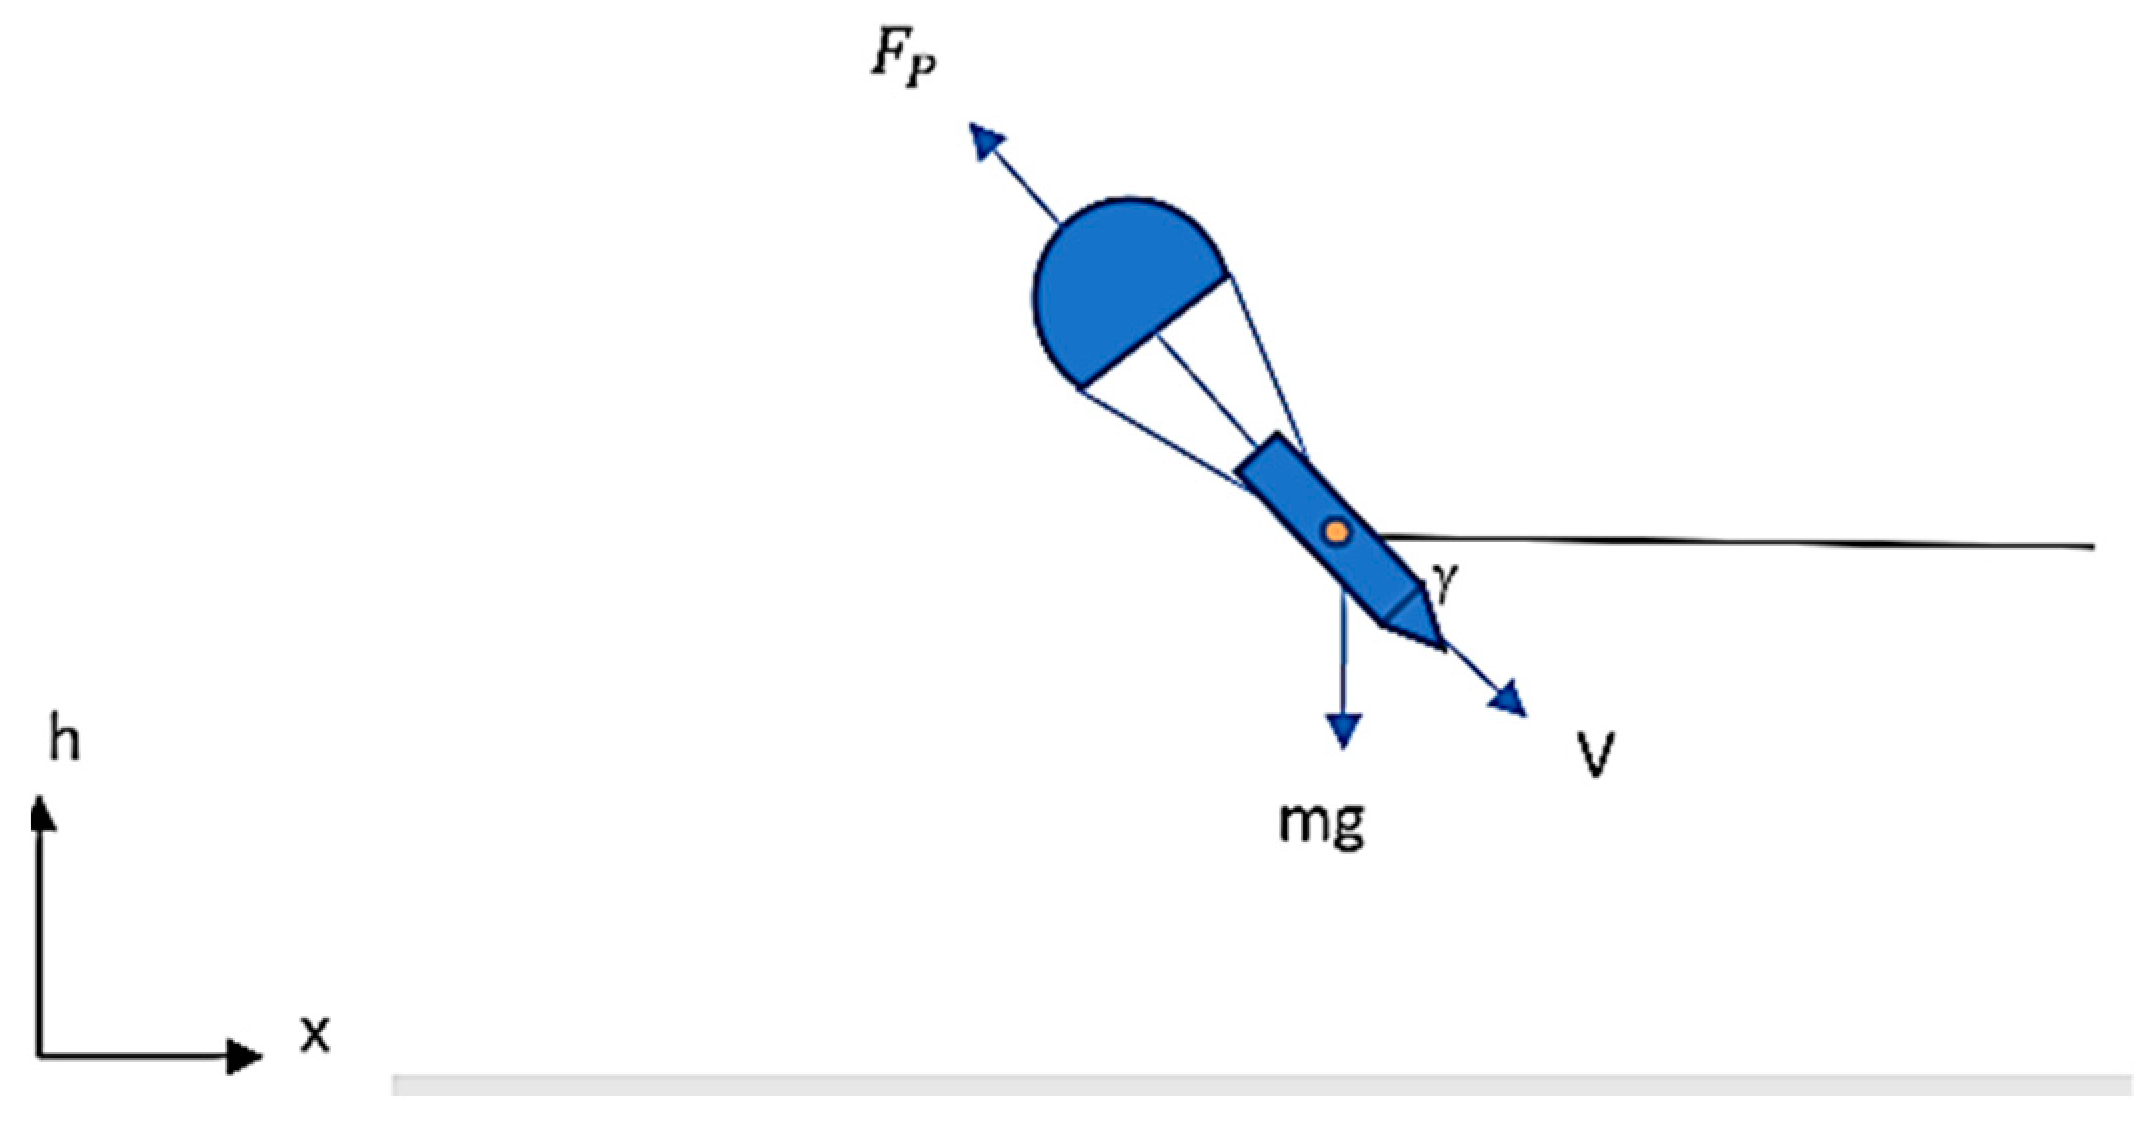
Figure 5.
Diagram of parachute model dynamics.
Figure 5.
Diagram of parachute model dynamics.
Figure 6.
Overview of the methodology for the determination of aeroelastic properties.
Figure 6.
Overview of the methodology for the determination of aeroelastic properties.
Figure 7.
Overview of the MPR method.
Figure 7.
Overview of the MPR method.
Figure 8.
Ad Astra II rocket [
48].
Figure 8.
Ad Astra II rocket [
48].
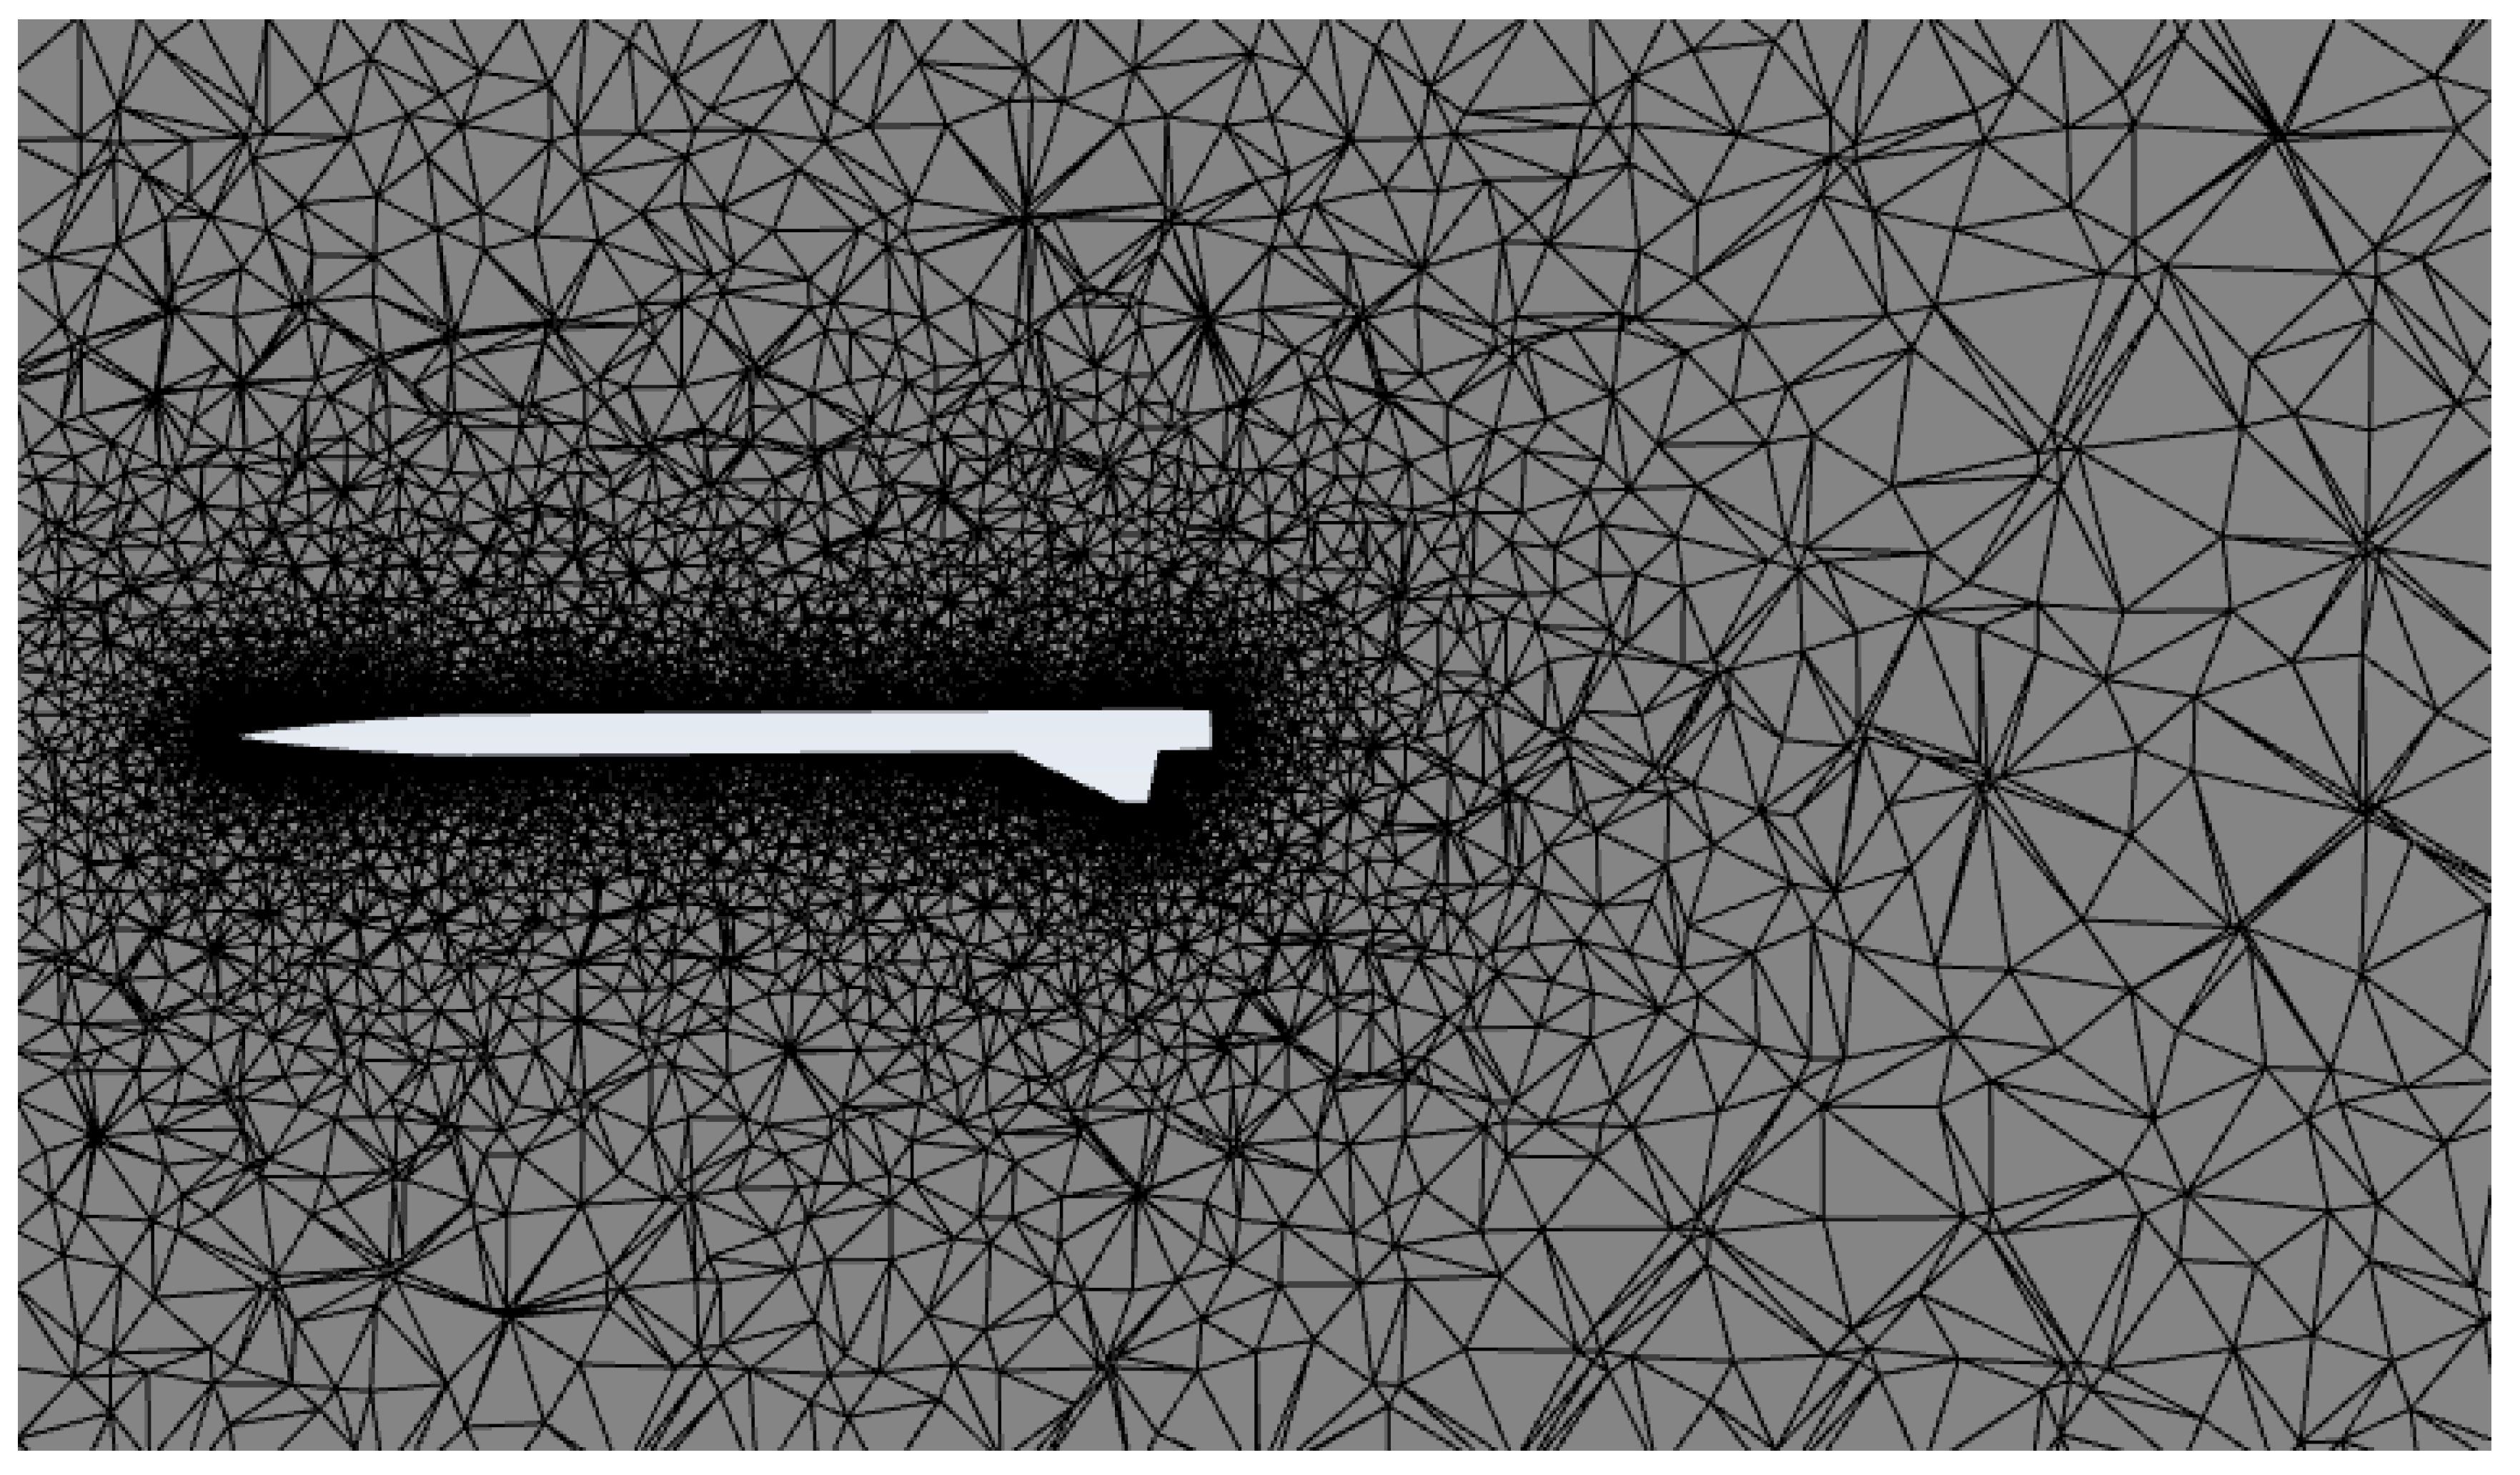
Figure 9.
Cross-section of FLUENT mesh.
Figure 9.
Cross-section of FLUENT mesh.
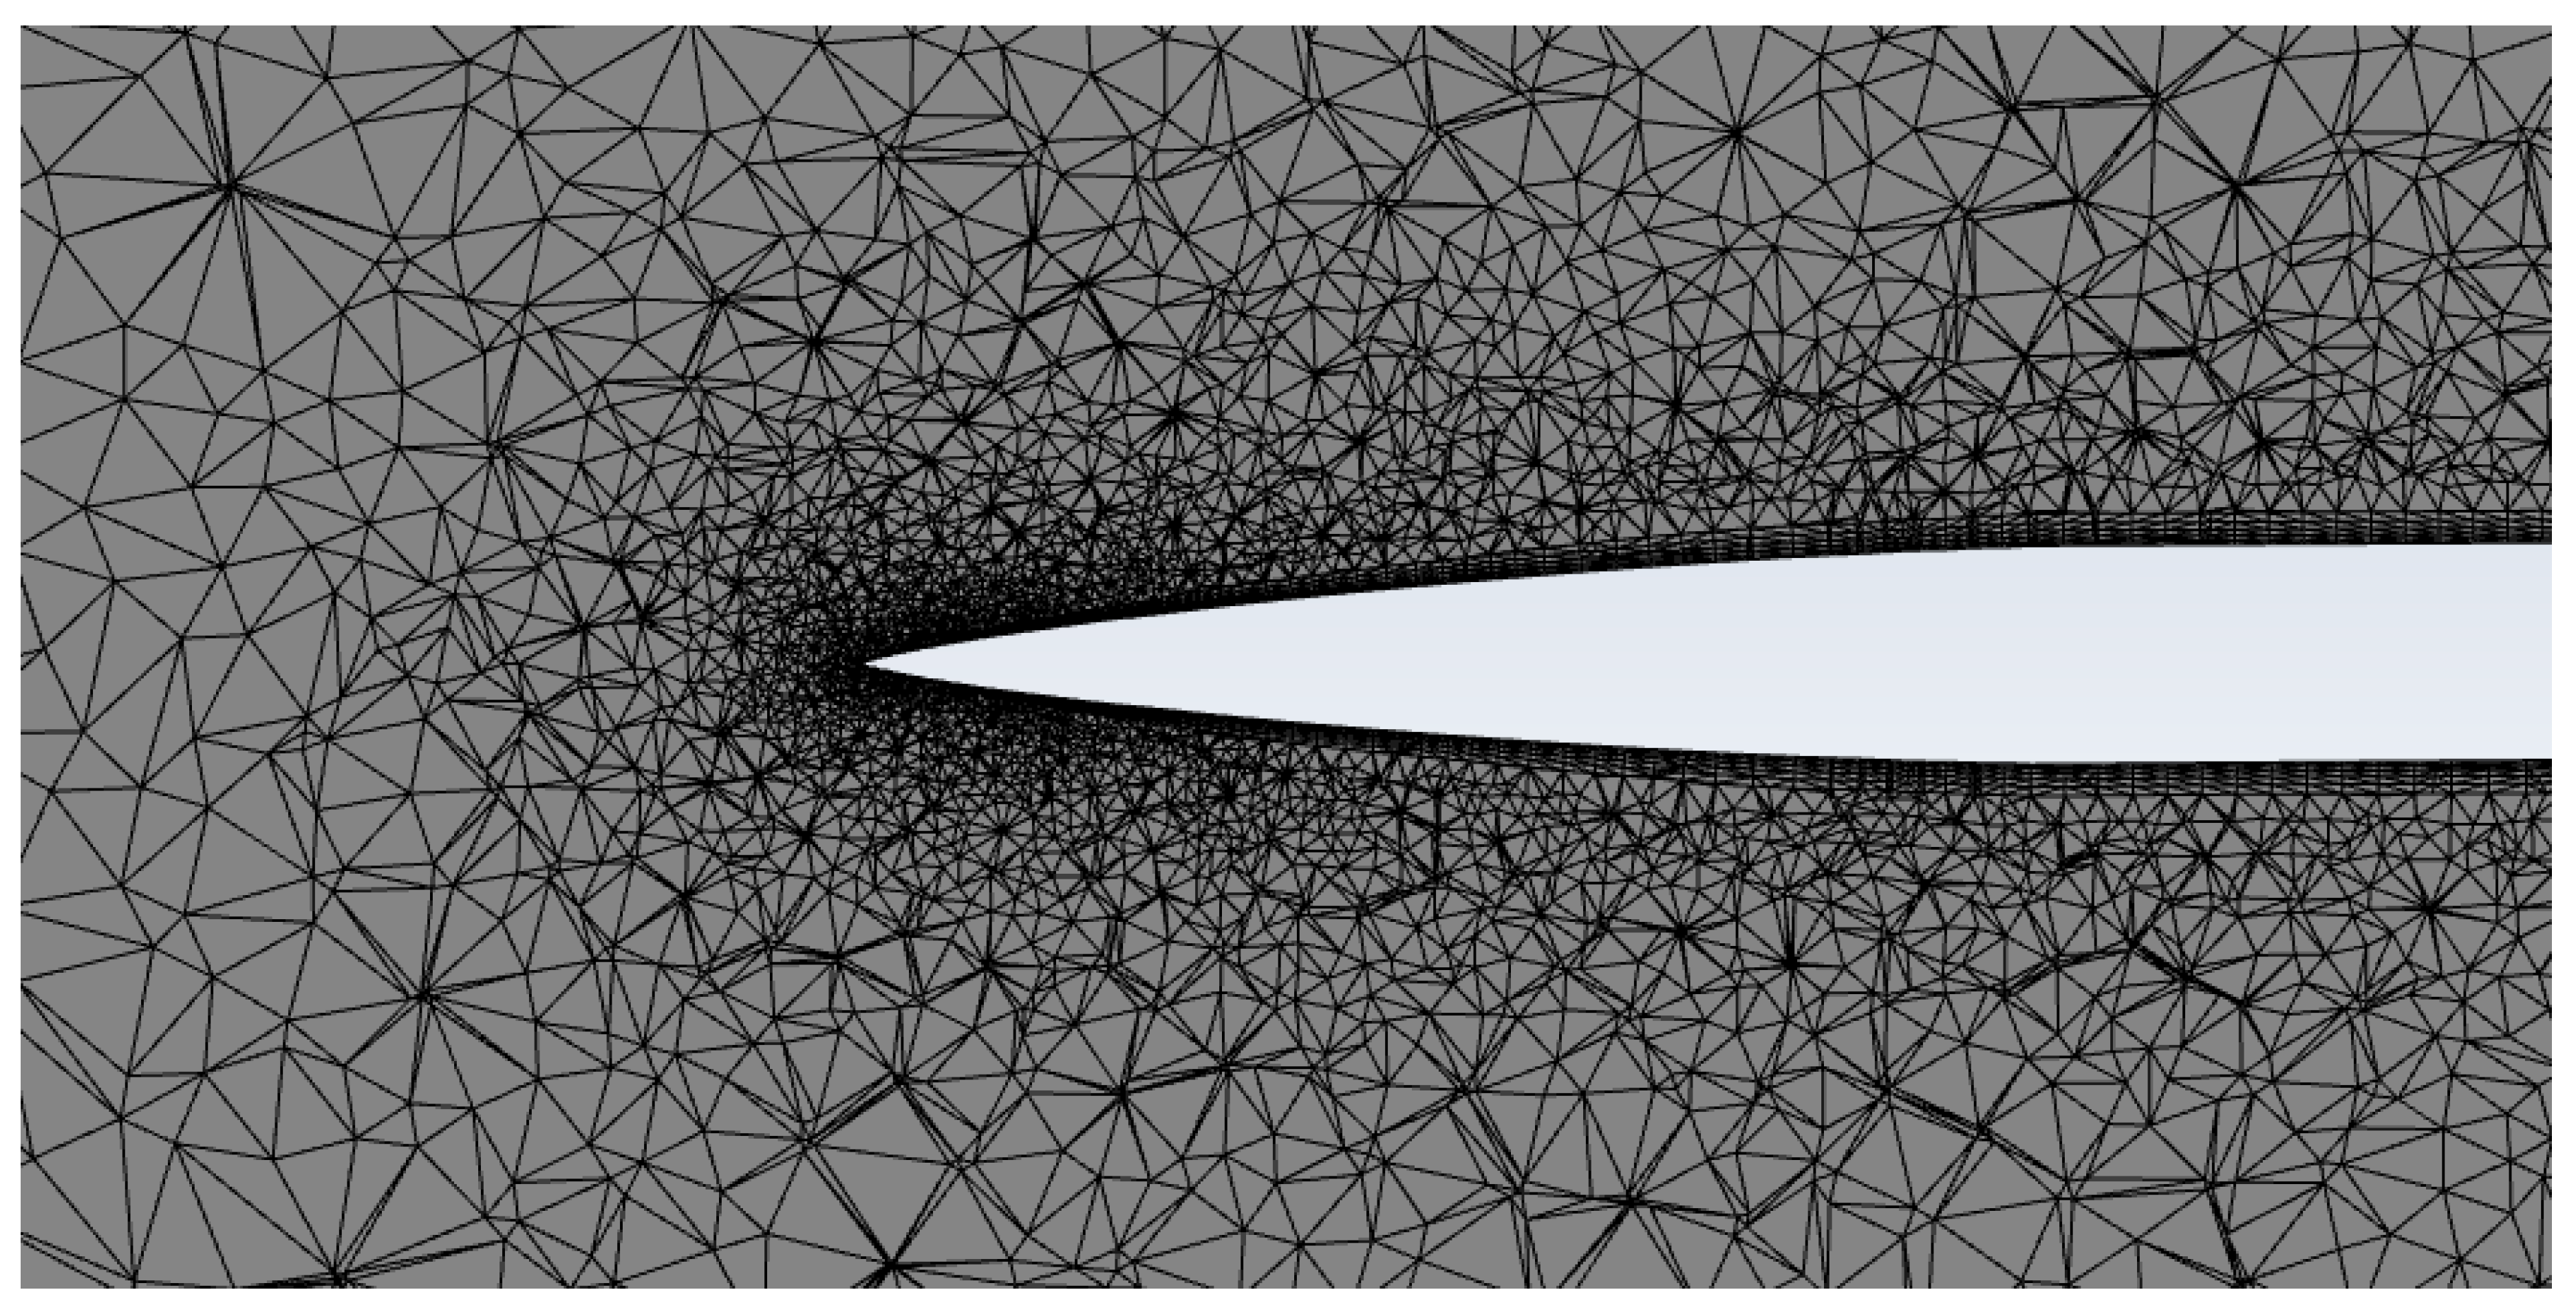
Figure 10.
FLUENT mesh at nosecone.
Figure 10.
FLUENT mesh at nosecone.
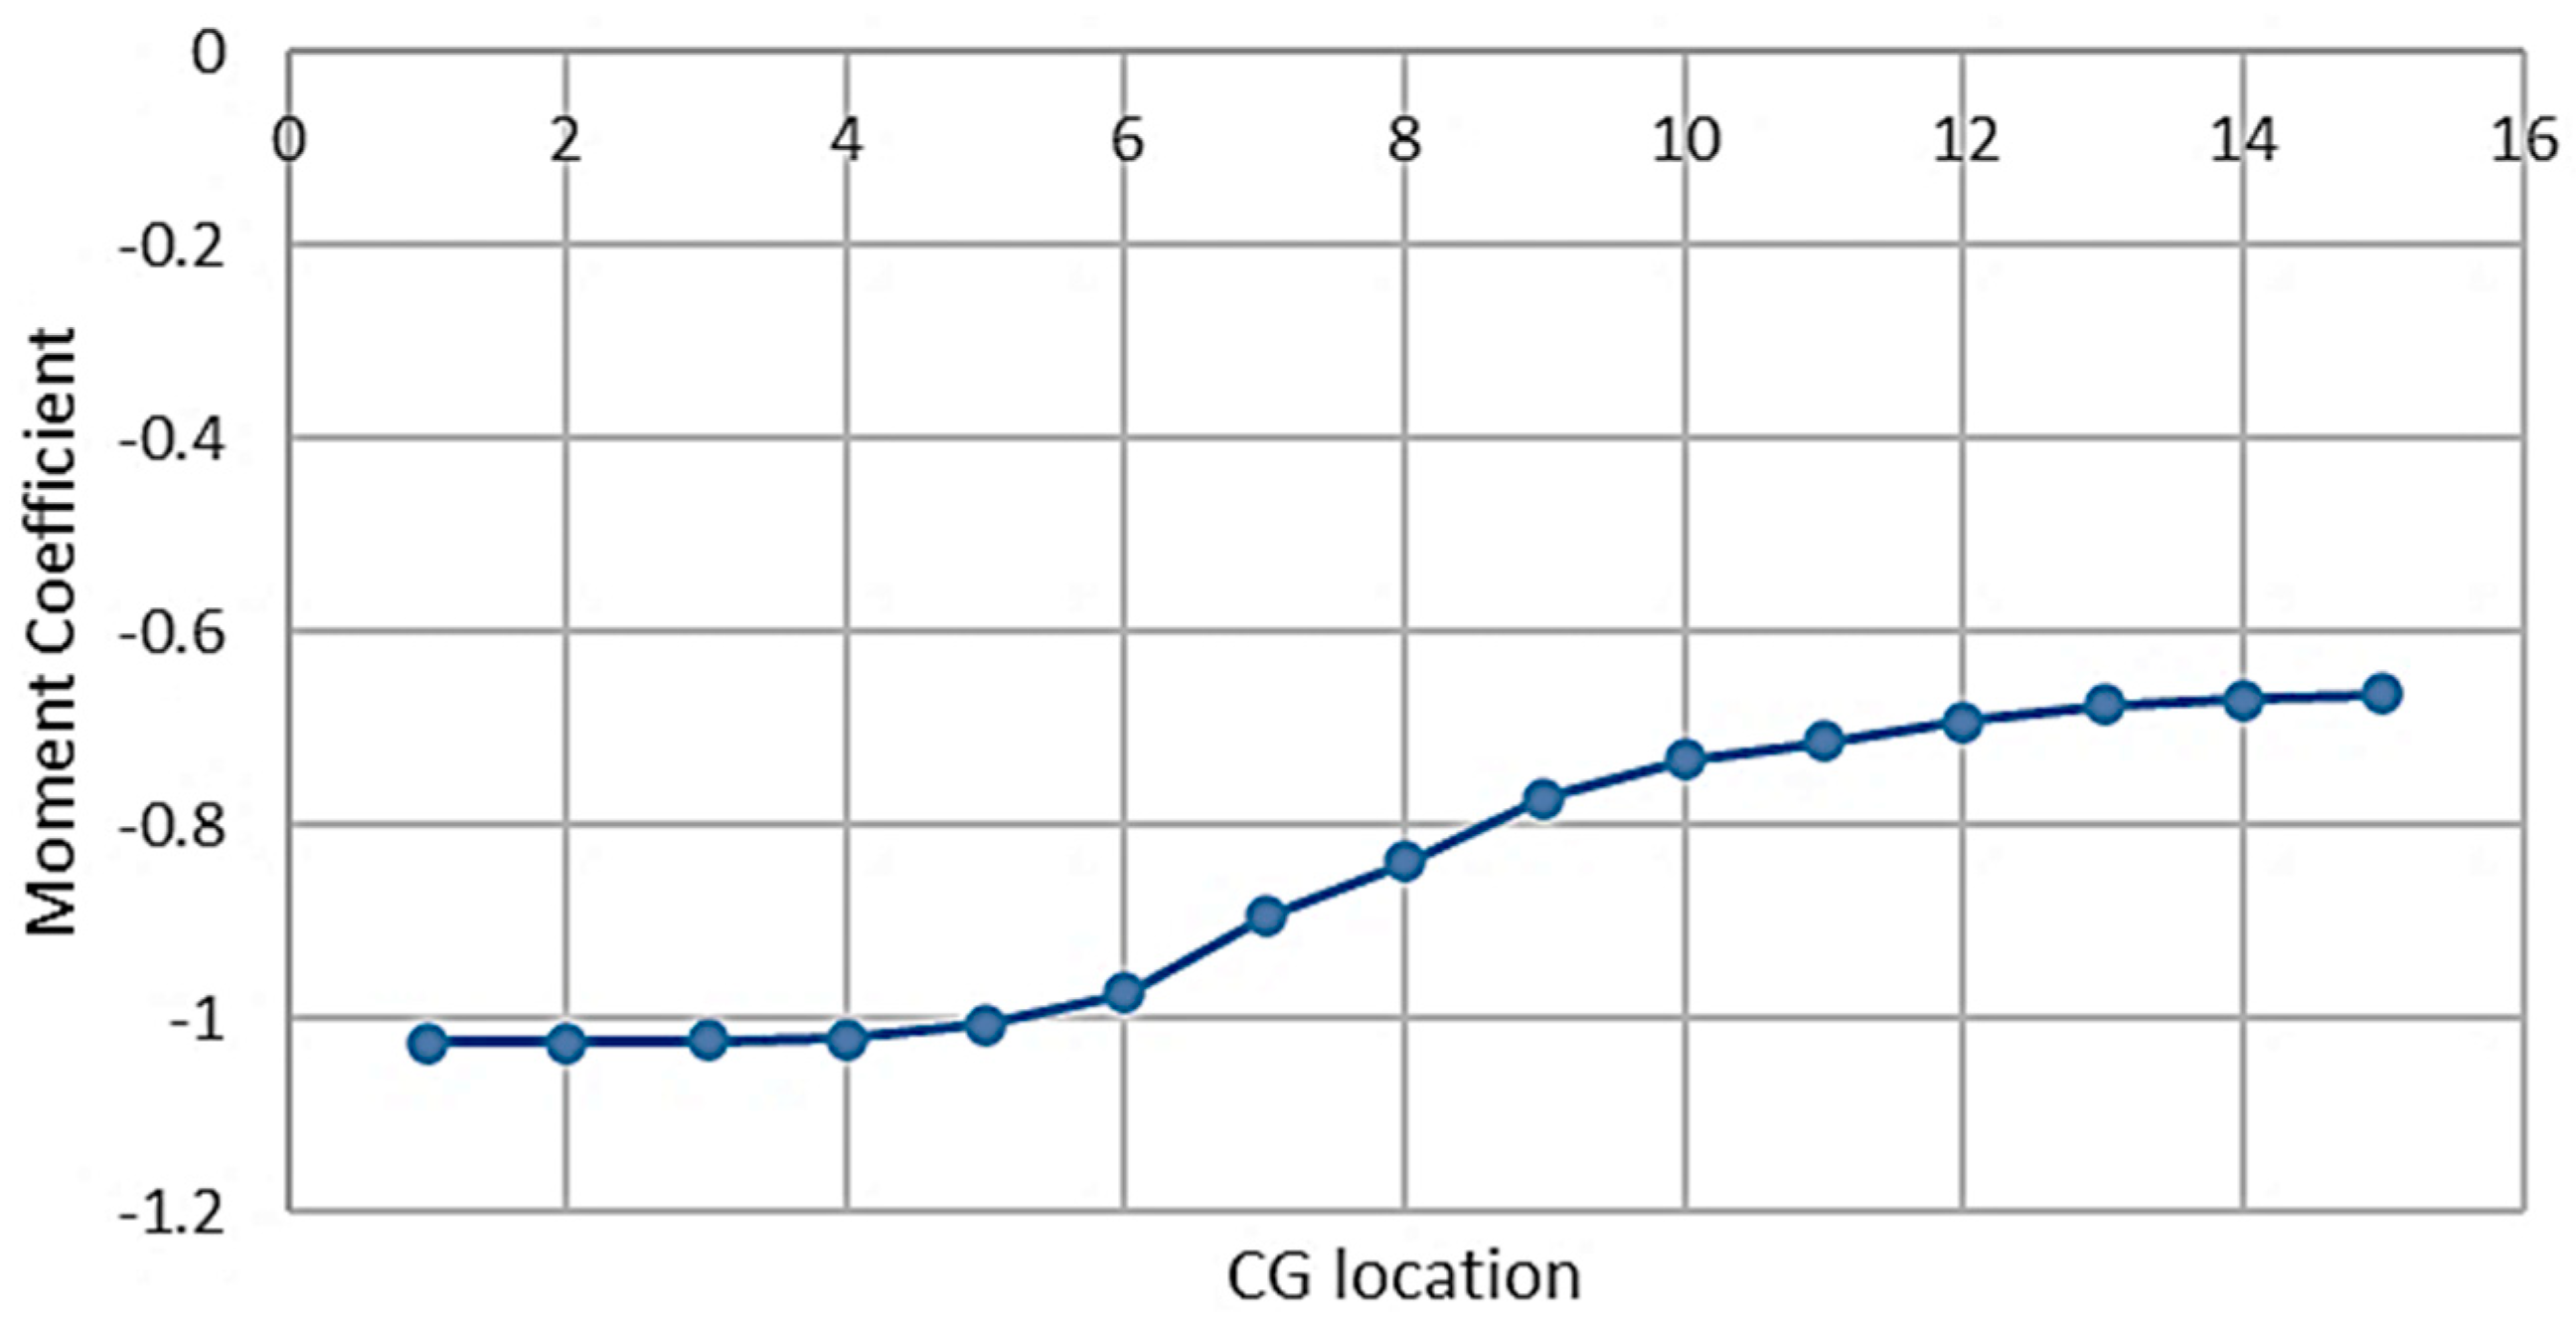
Figure 11.
CG location vs moment coefficient.
Figure 11.
CG location vs moment coefficient.
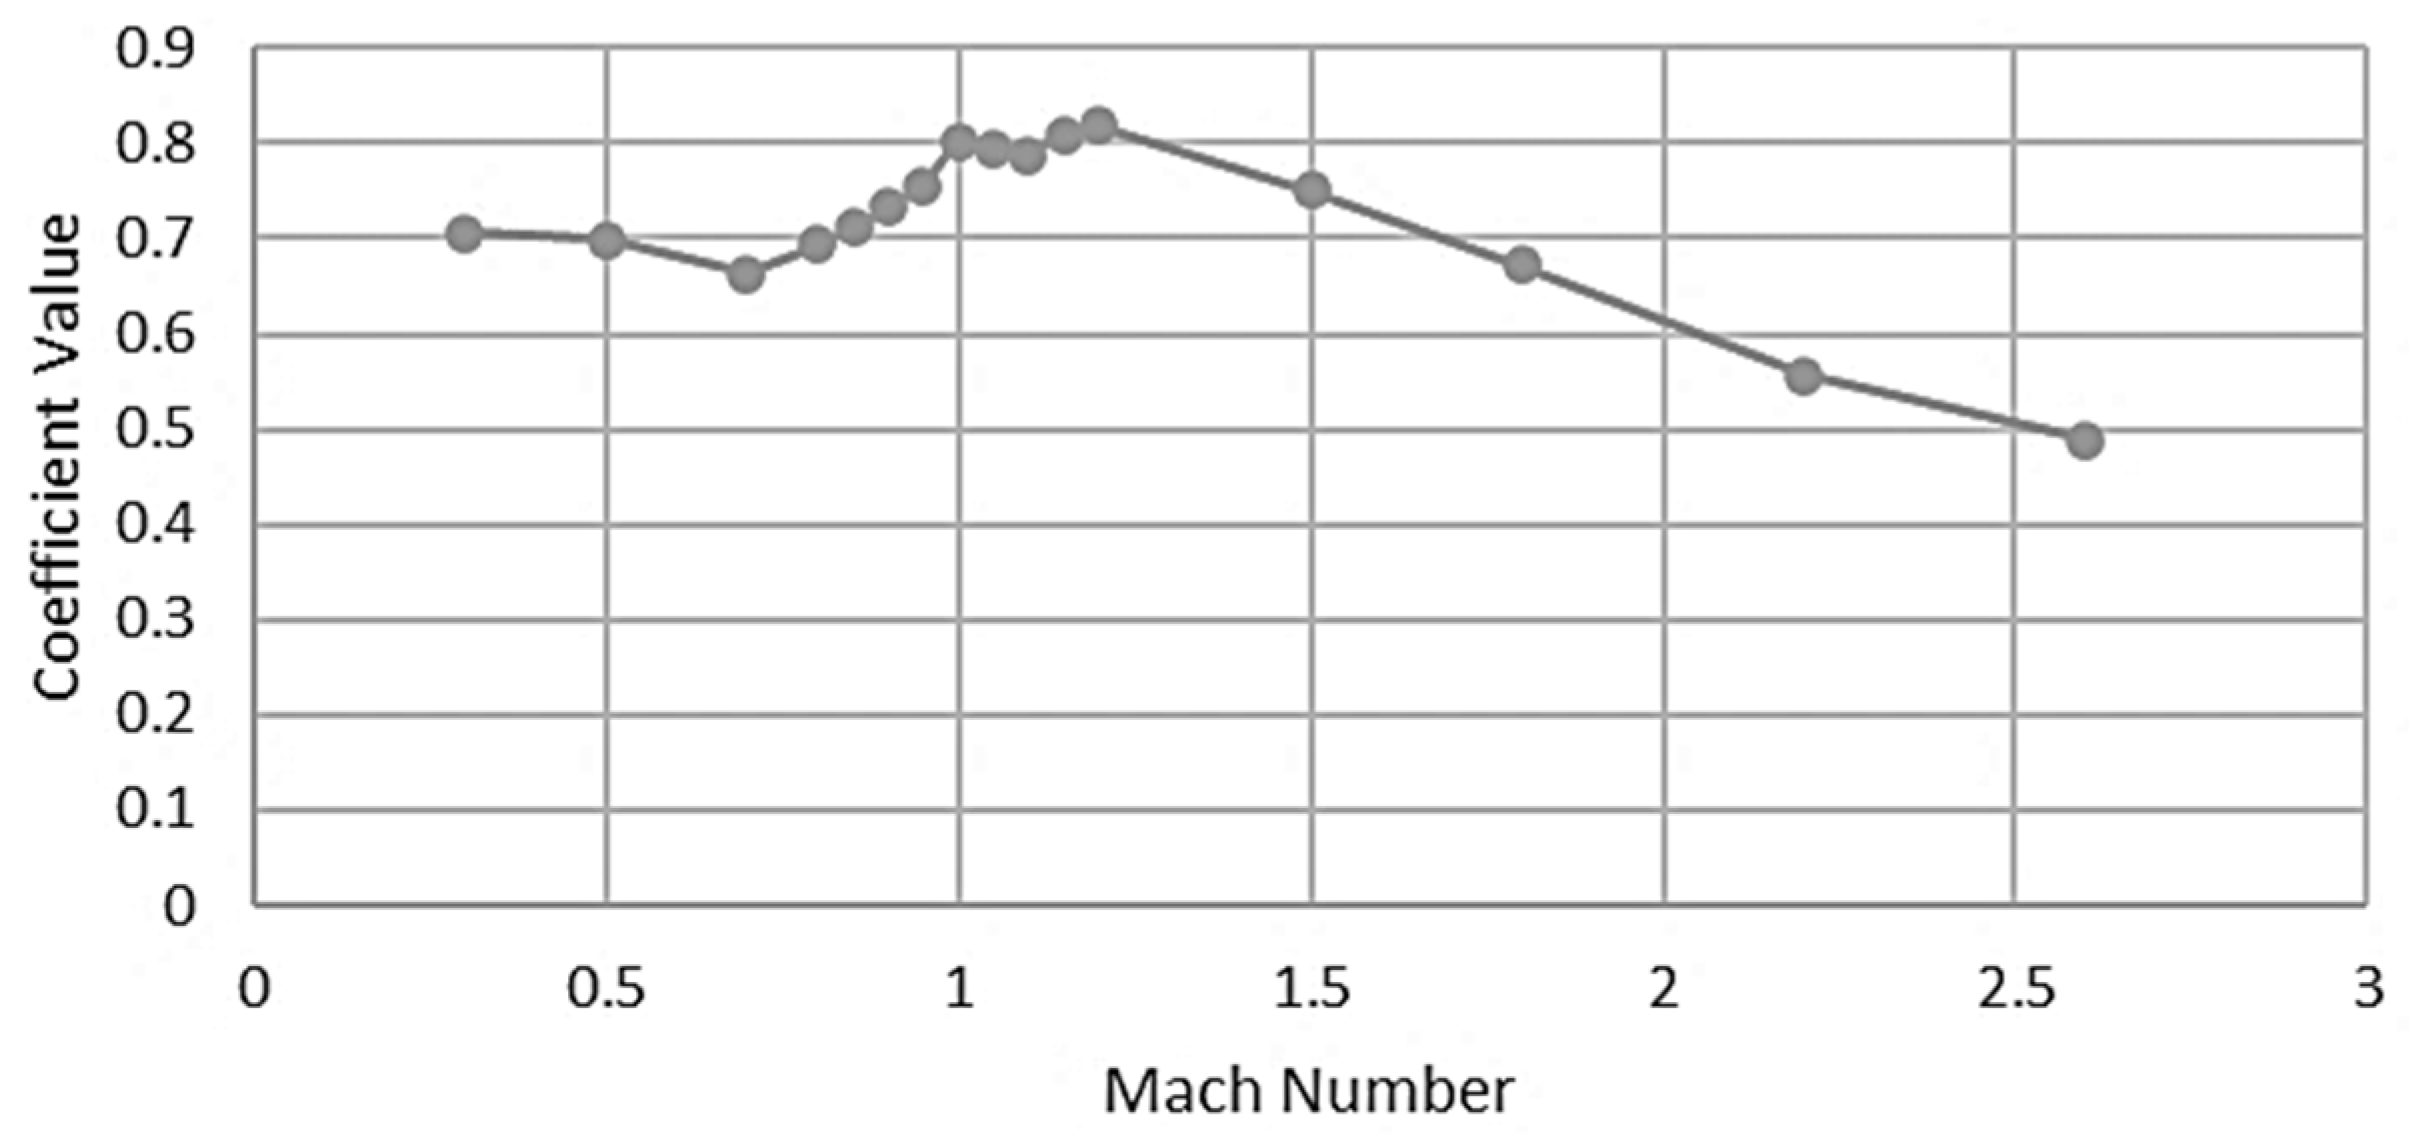
Figure 12.
Mach number vs lift coefficient for an angle of attack of 2.4 degrees.
Figure 12.
Mach number vs lift coefficient for an angle of attack of 2.4 degrees.
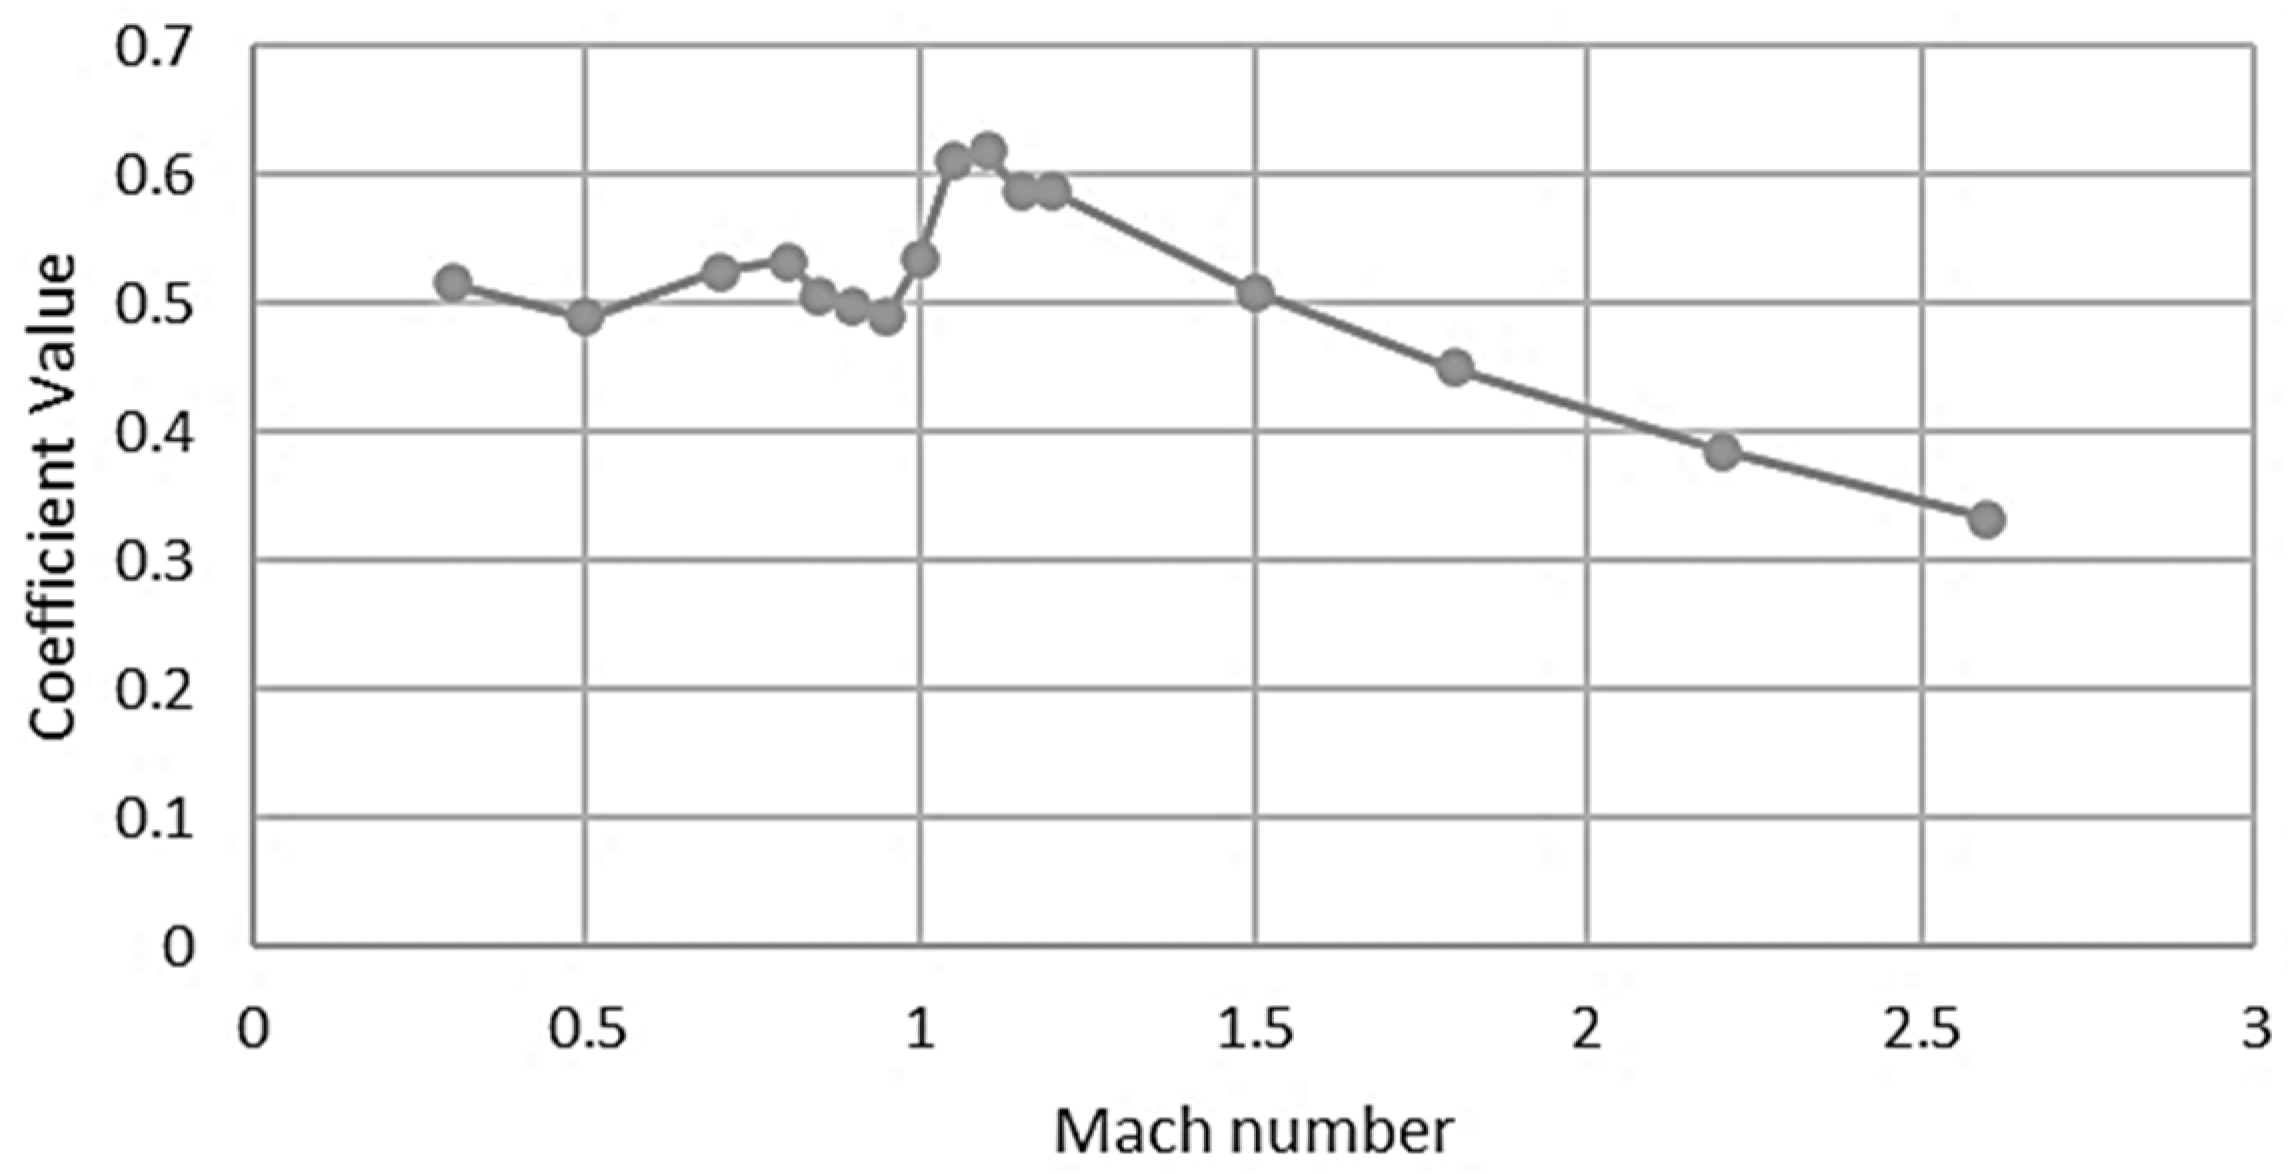
Figure 13.
Mach number vs drag coefficient for an angle of attack of 2.4 degrees.
Figure 13.
Mach number vs drag coefficient for an angle of attack of 2.4 degrees.
Figure 14.
Contours of the Mach number at 2.4-degree AoA and 2.2 Mach.
Figure 14.
Contours of the Mach number at 2.4-degree AoA and 2.2 Mach.
Figure 15.
Axial drag coefficient as derived from the angle of attack and Mach number.
Figure 15.
Axial drag coefficient as derived from the angle of attack and Mach number.
Figure 16.
Axial drag coefficient as derived from the sideslip angle and Mach number.
Figure 16.
Axial drag coefficient as derived from the sideslip angle and Mach number.
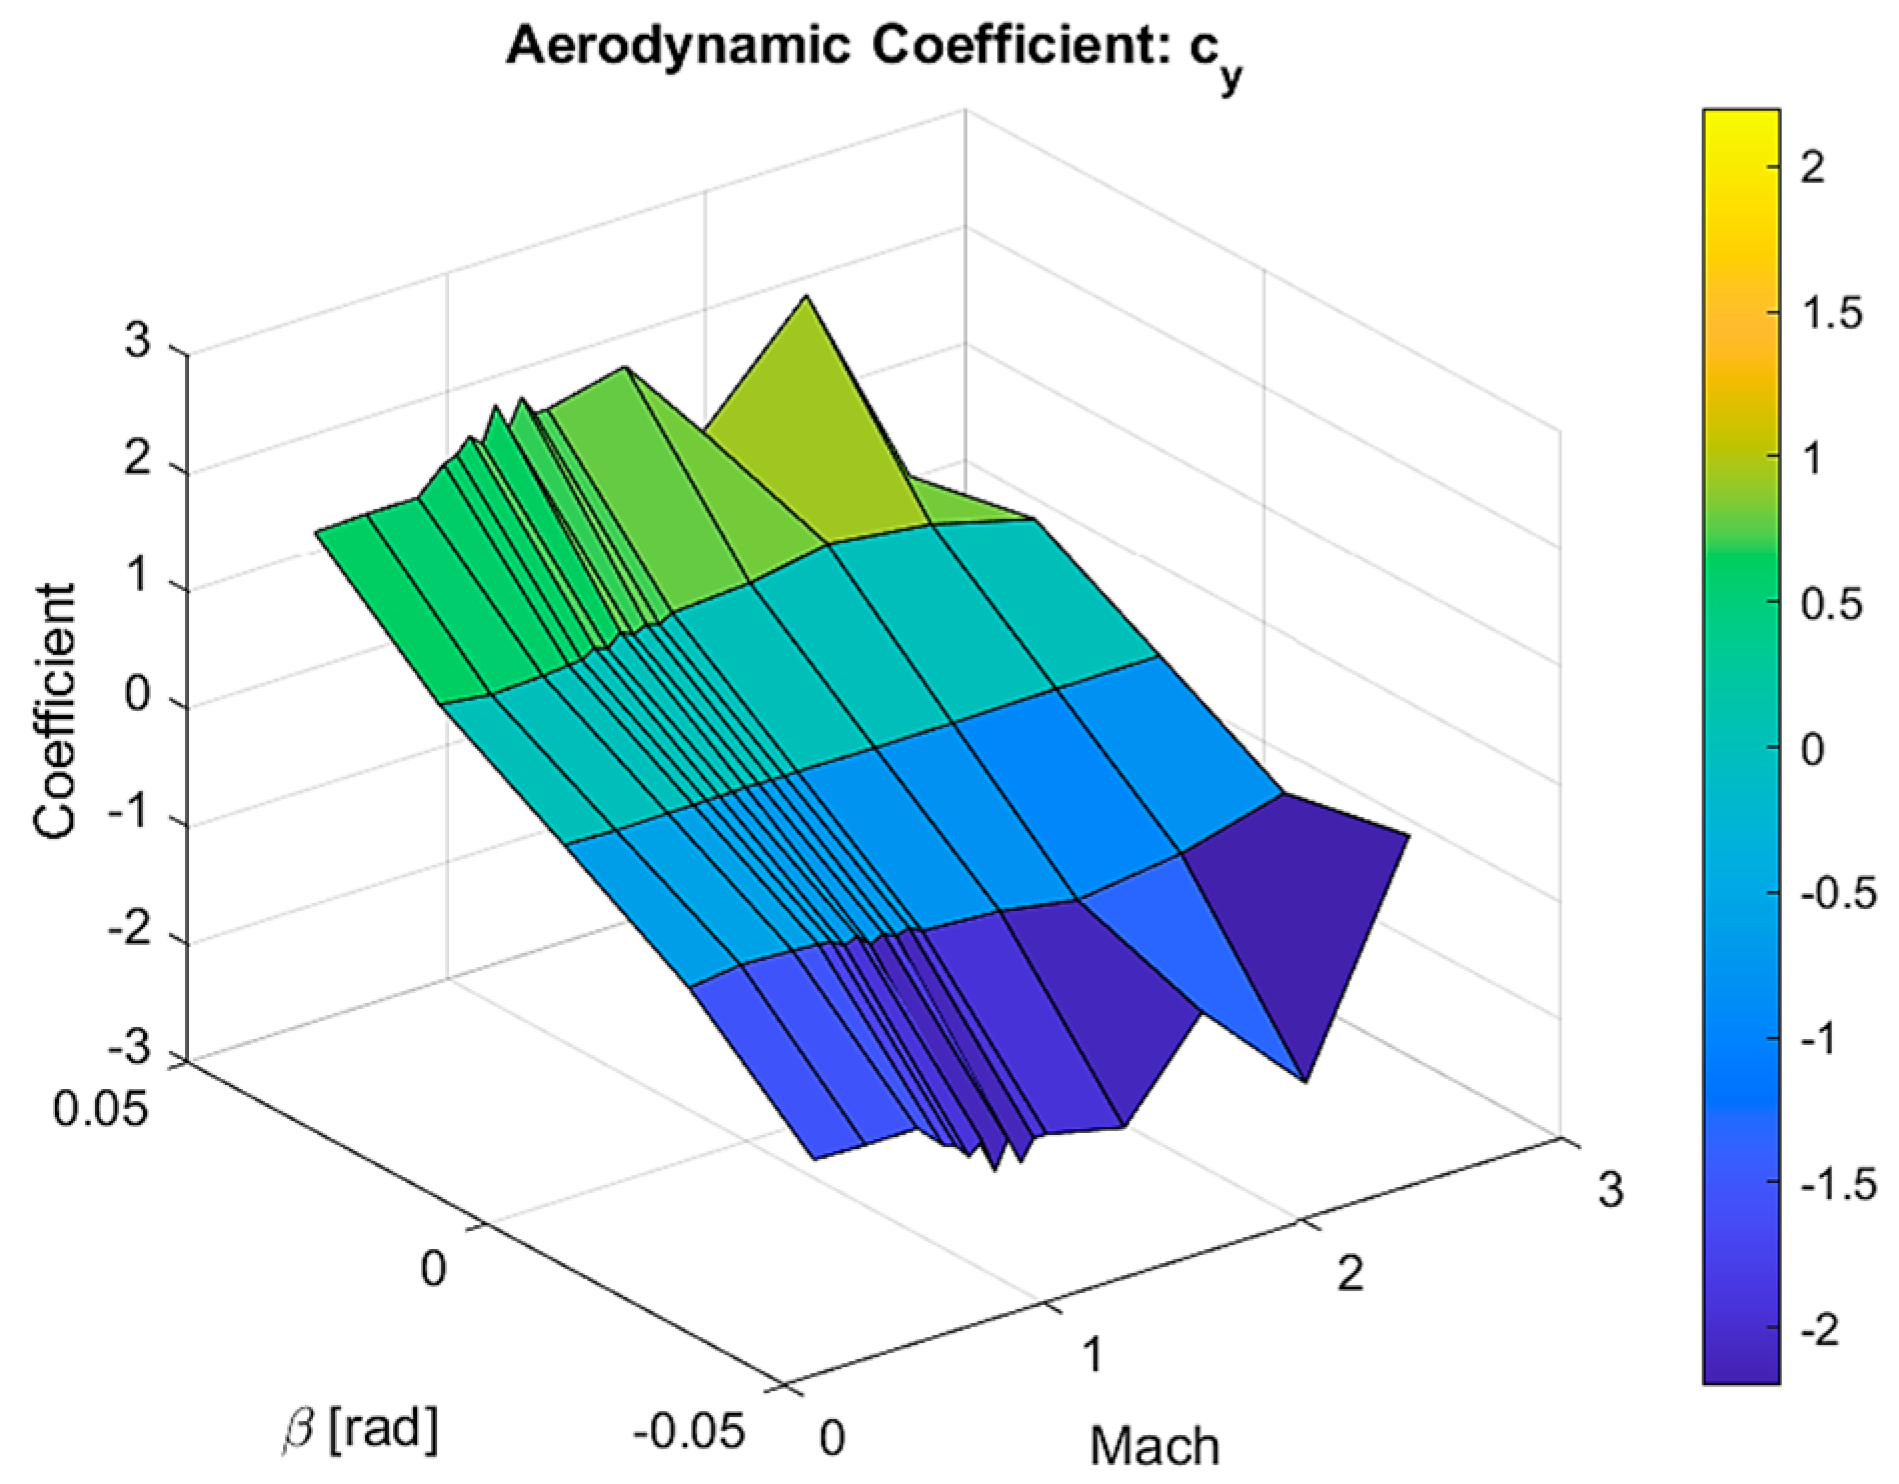
Figure 17.
Side force coefficient as derived from the sideslip angle and Mach number.
Figure 17.
Side force coefficient as derived from the sideslip angle and Mach number.
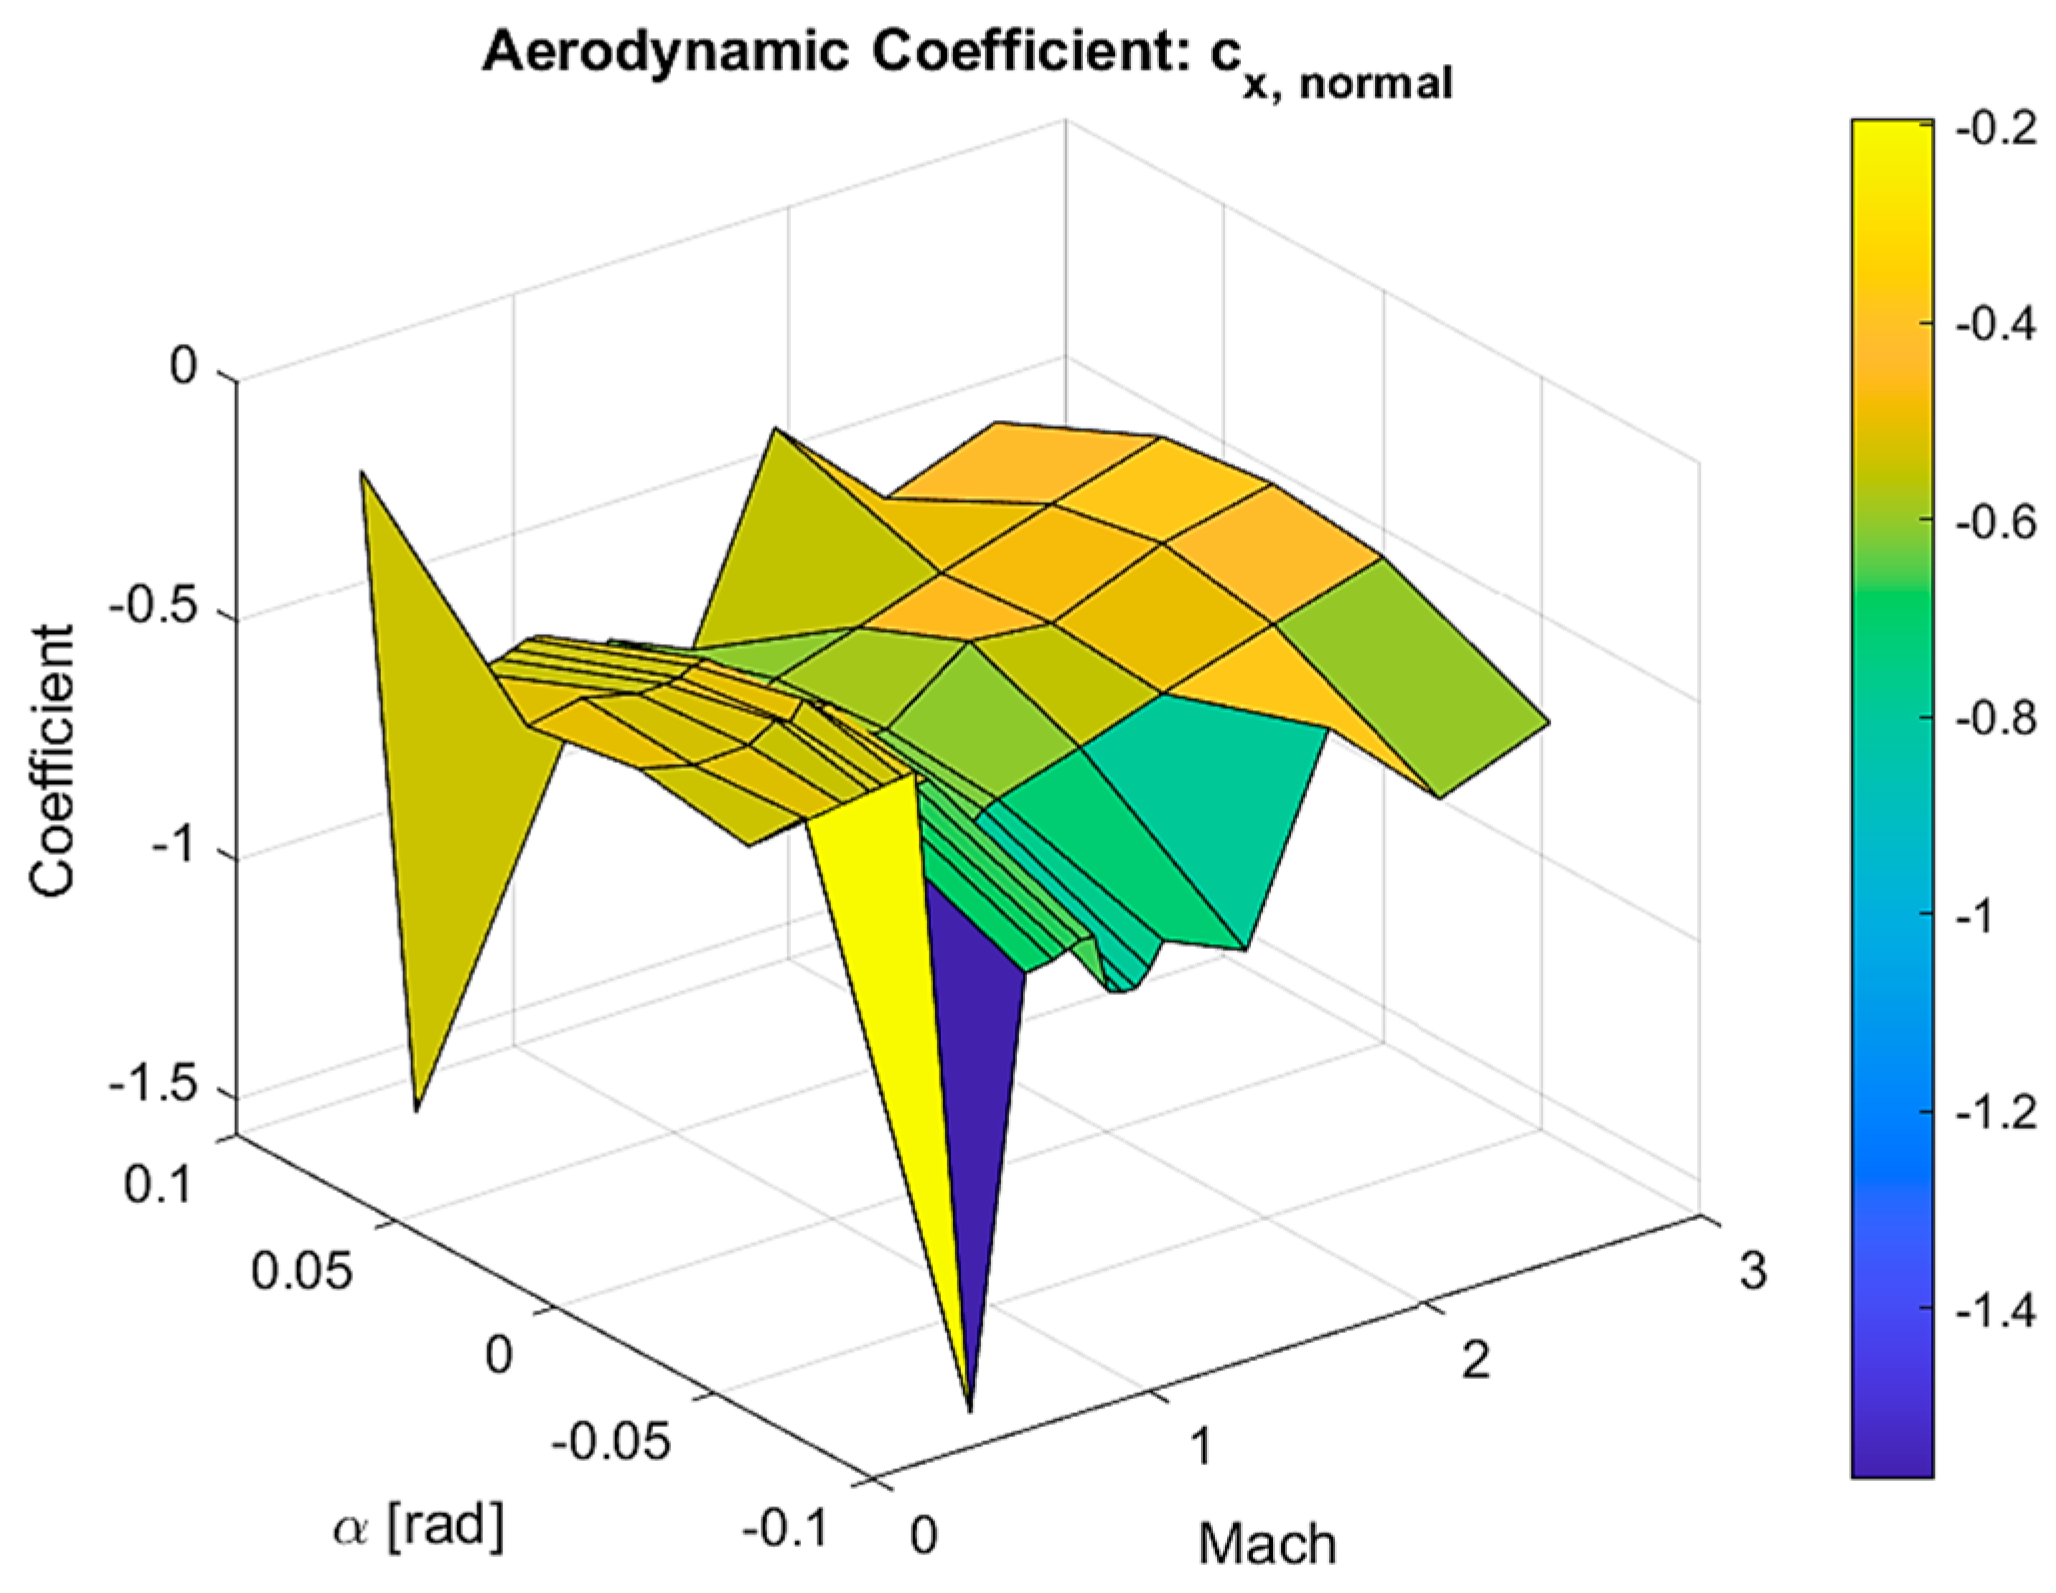
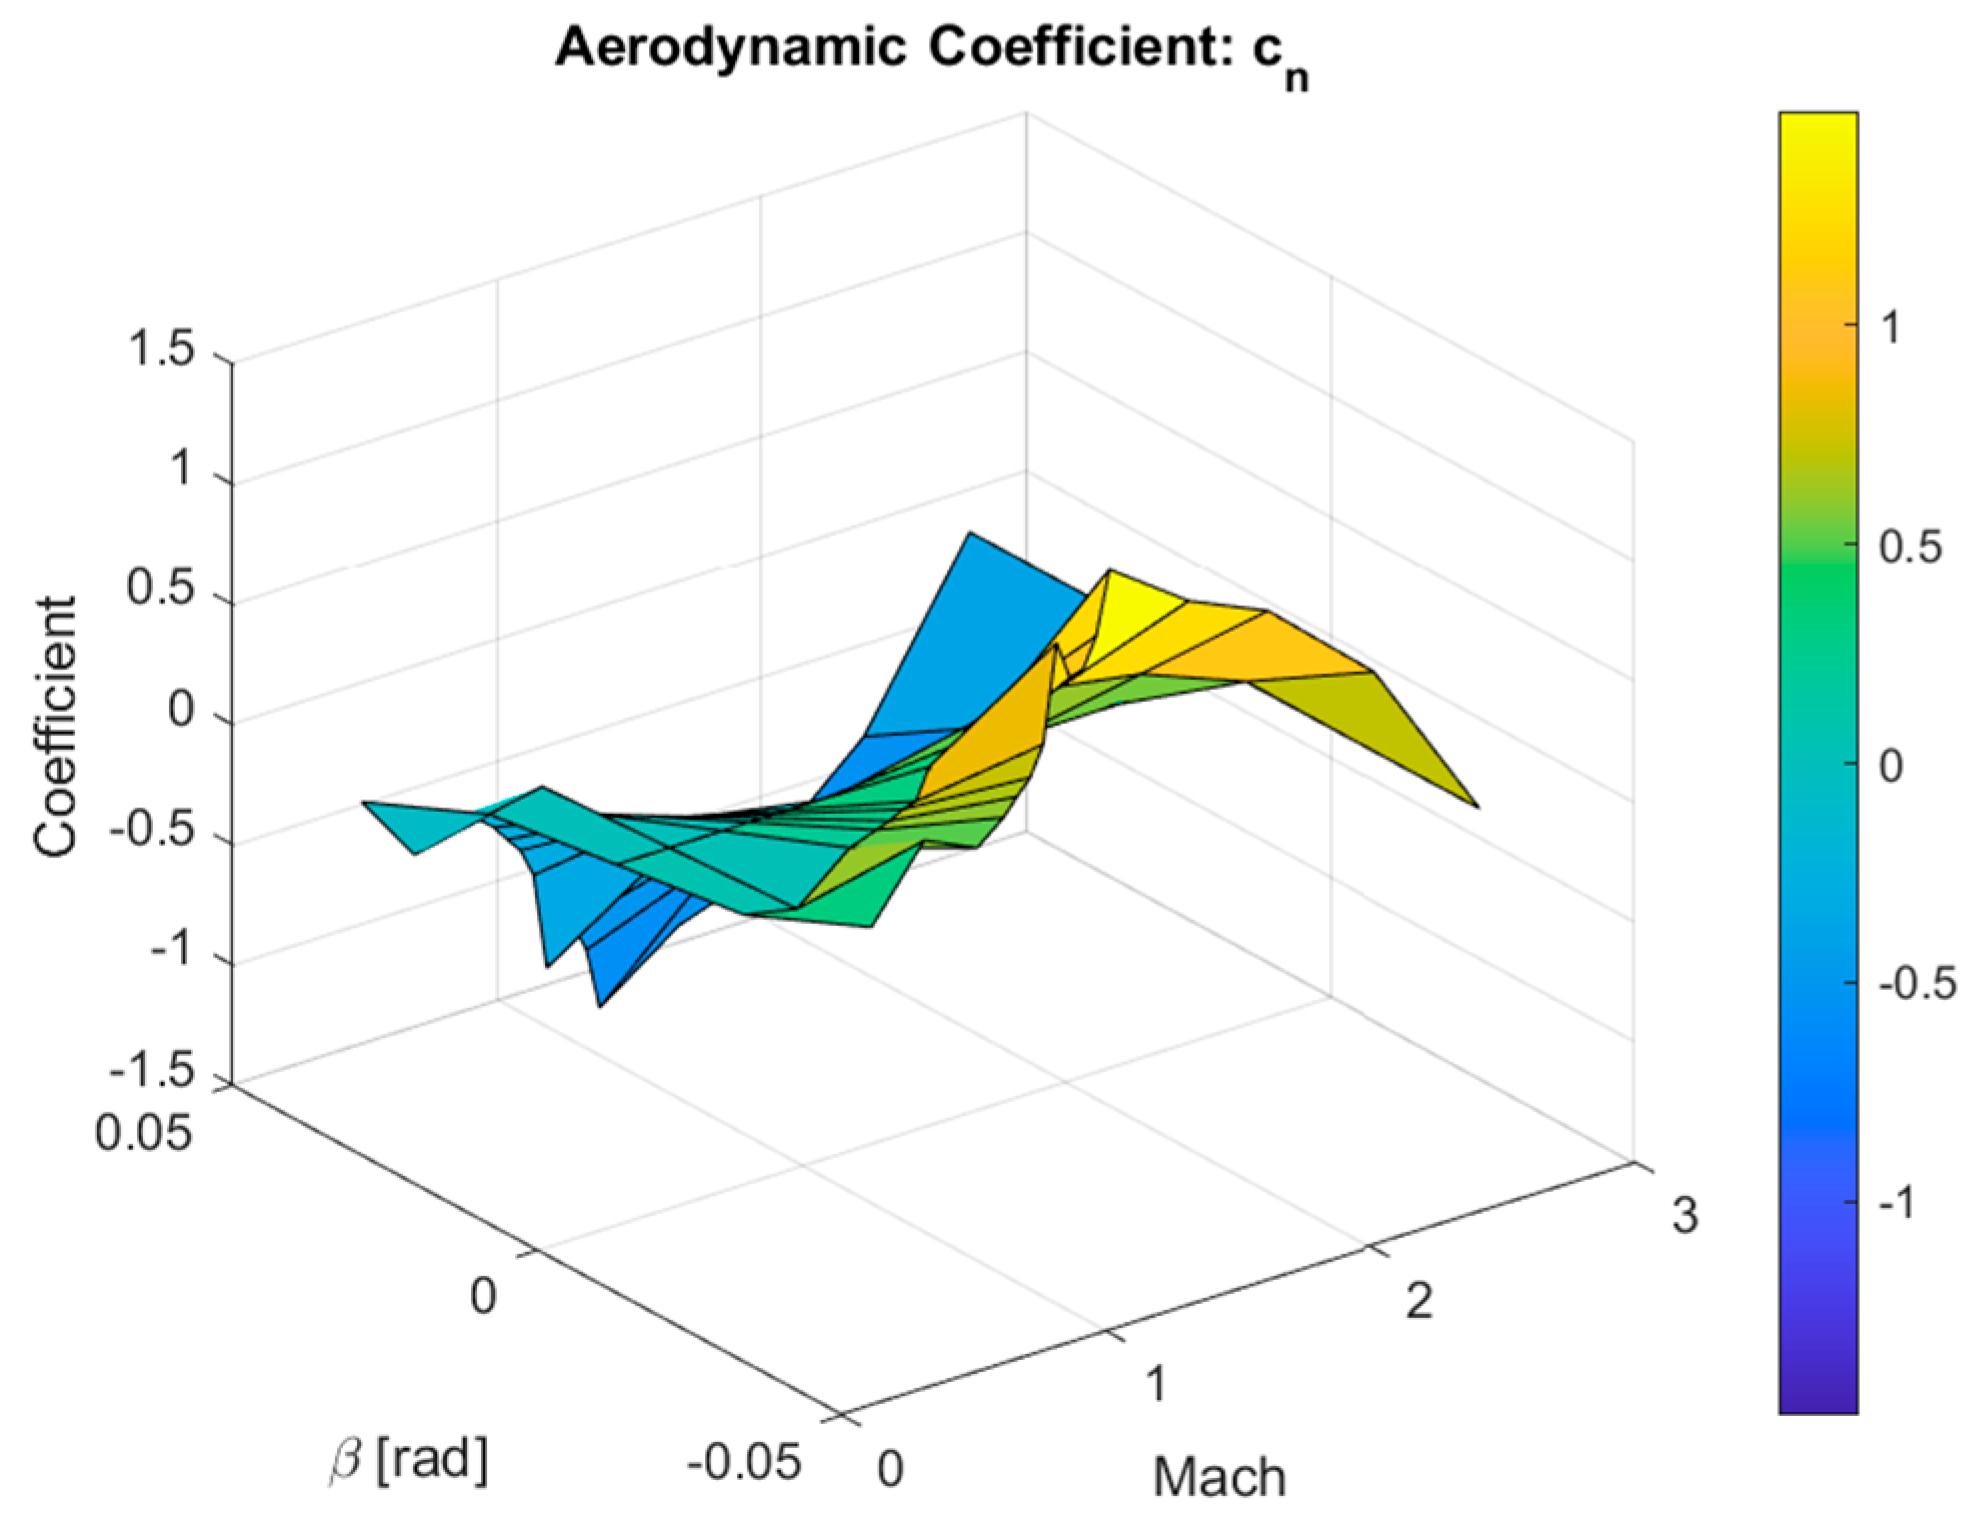
Figure 18.
Normal force coefficient as derived from the angle of attack and Mach number.
Figure 18.
Normal force coefficient as derived from the angle of attack and Mach number.
Figure 19.
Yaw (forcing) moment coefficient as derived from the sideslip angle and Mach number.
Figure 19.
Yaw (forcing) moment coefficient as derived from the sideslip angle and Mach number.
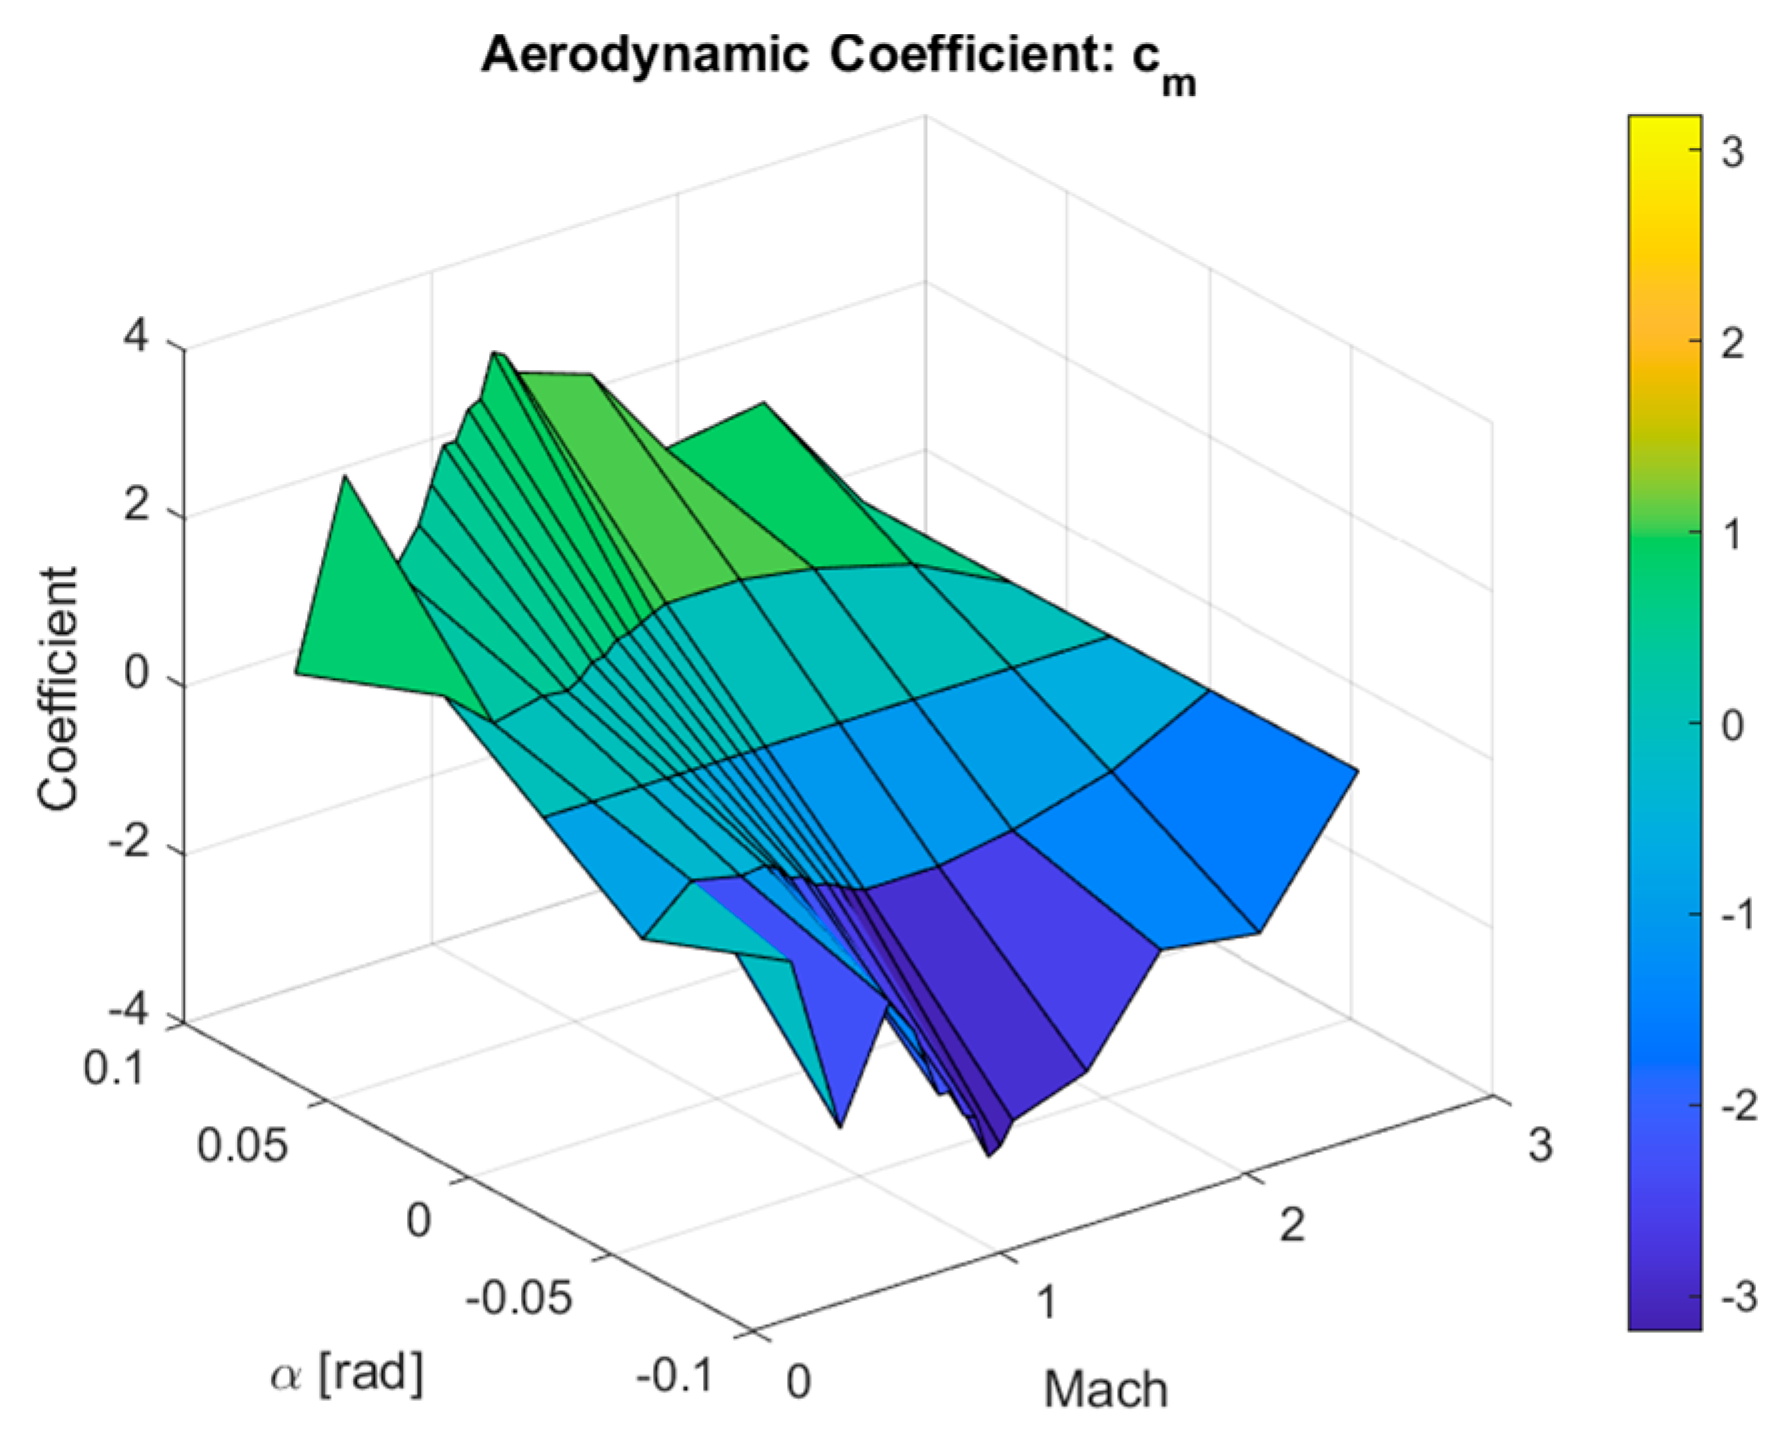
Figure 20.
Pitch (forcing) moment coefficient as derived from the angle of attack and Mach number.
Figure 20.
Pitch (forcing) moment coefficient as derived from the angle of attack and Mach number.
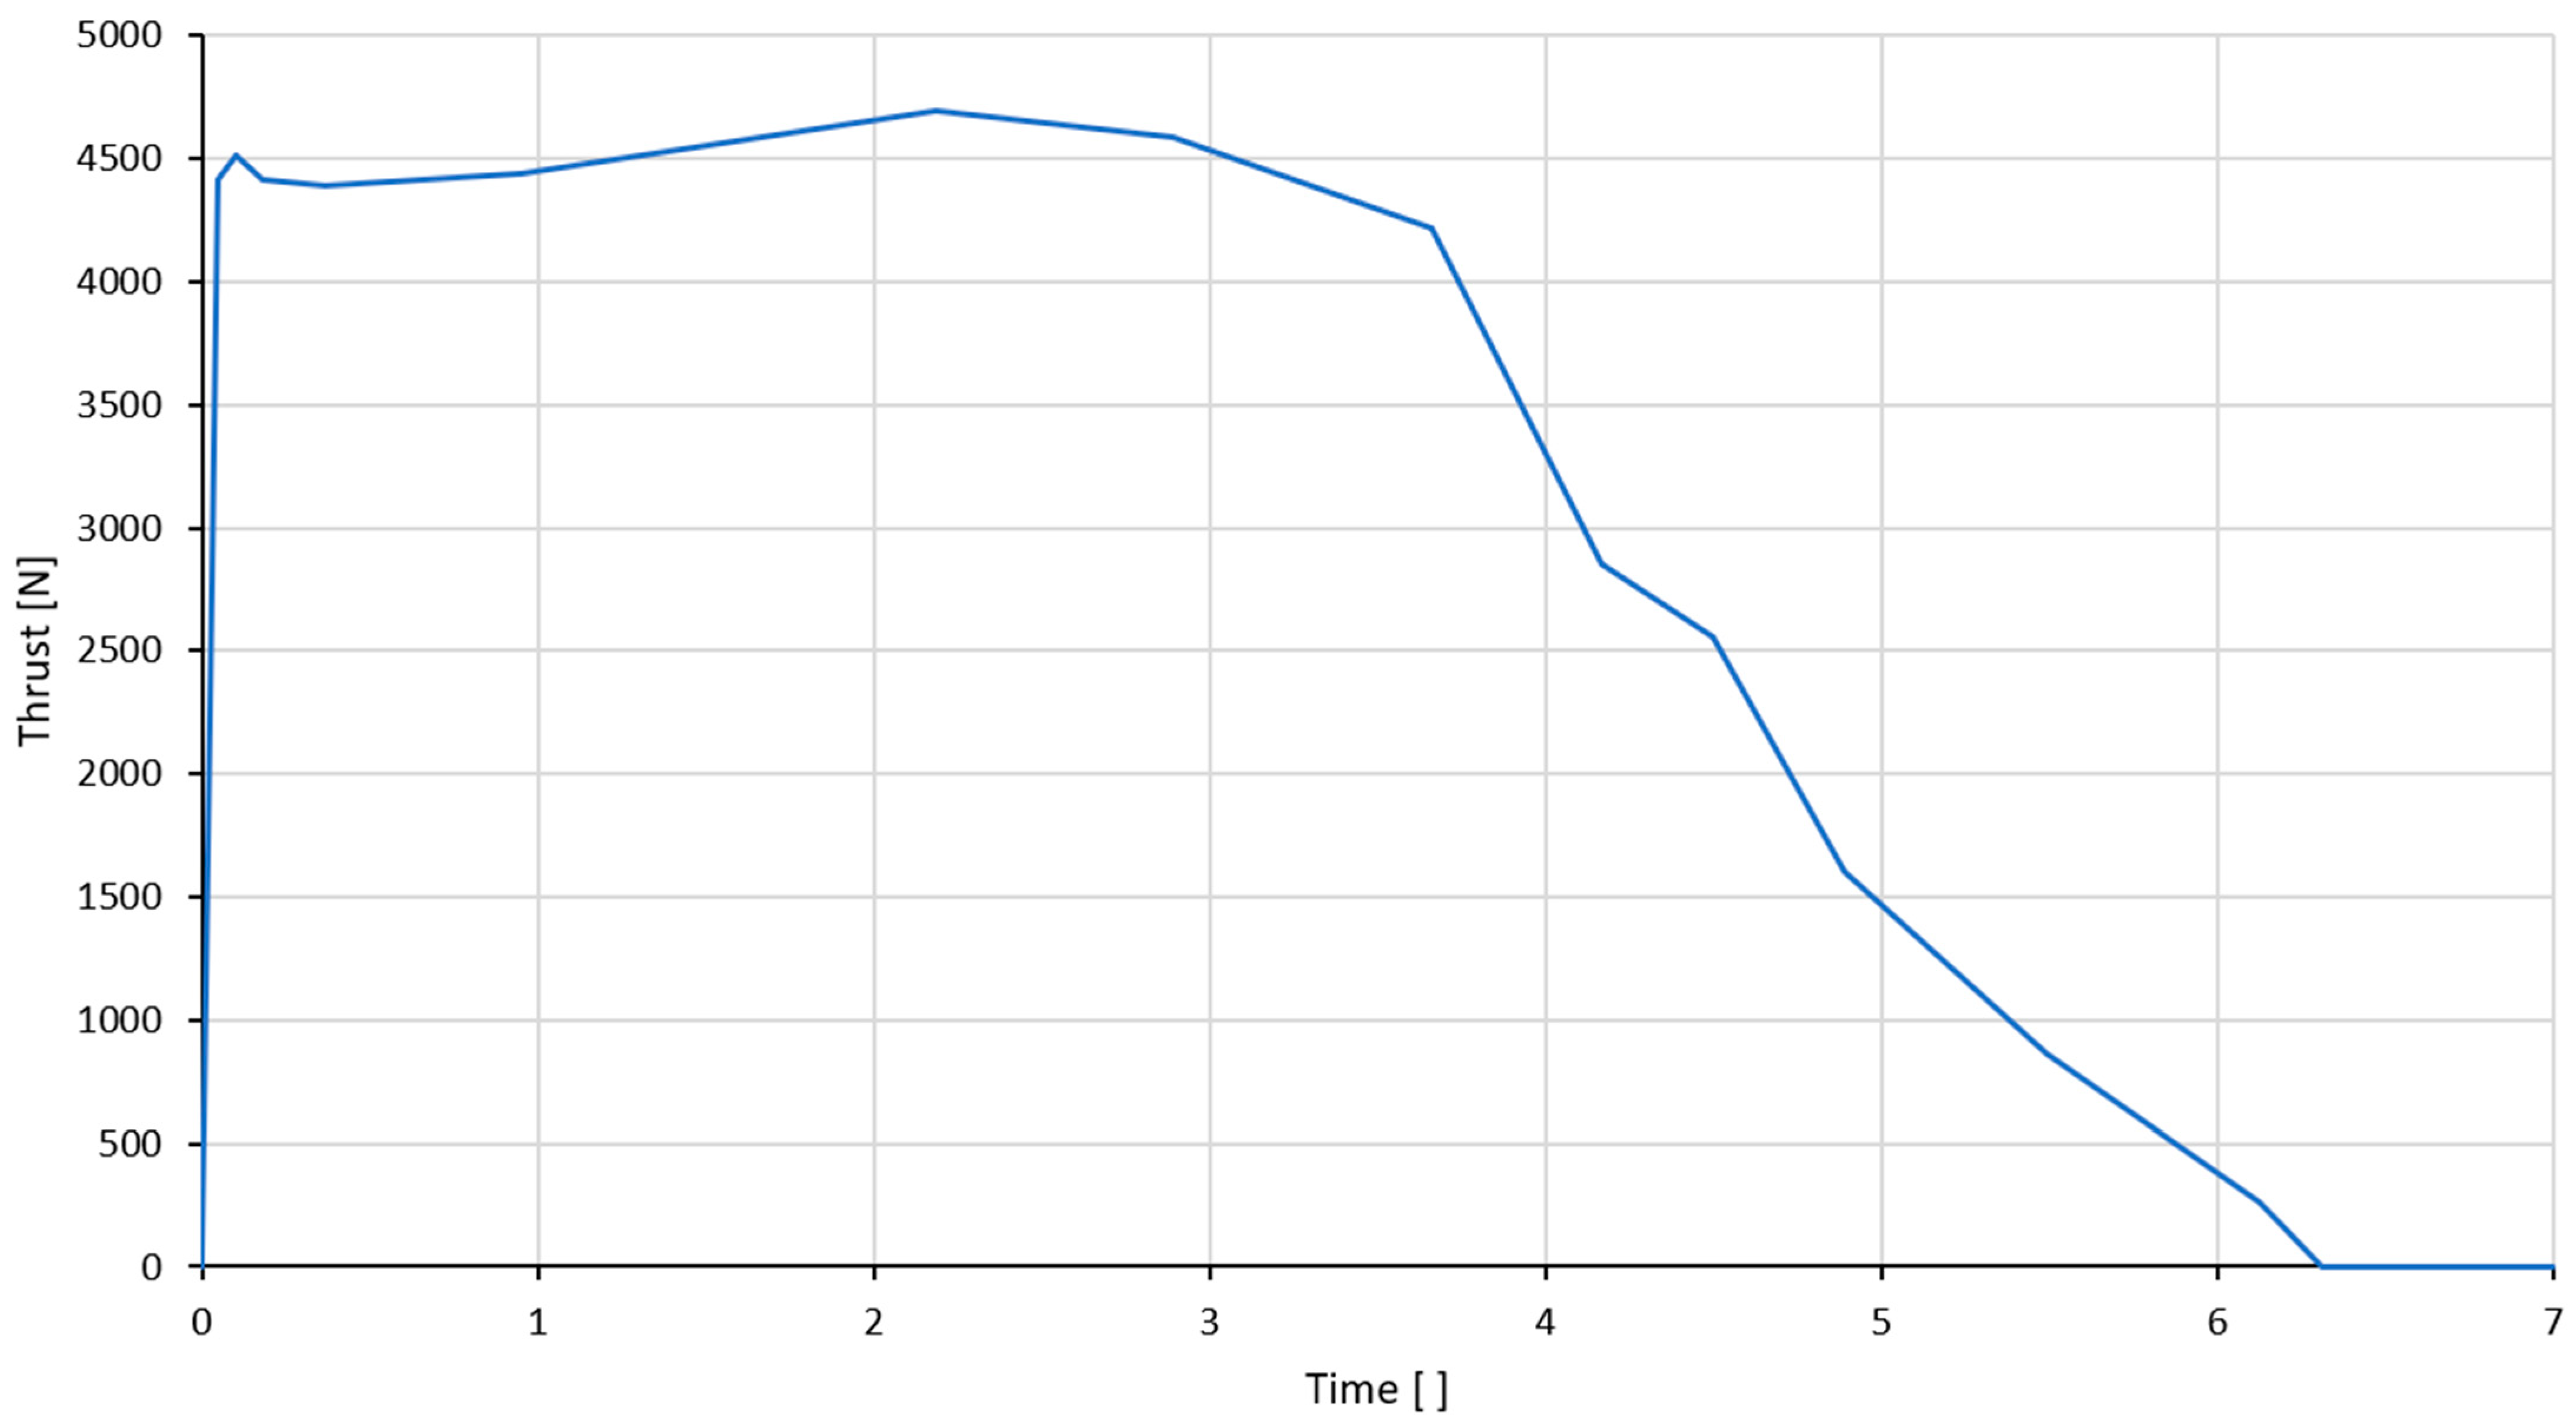
Figure 21.
Cesaroni O3400 “Imax” thrust curve.
Figure 21.
Cesaroni O3400 “Imax” thrust curve.
Figure 22.
Inertial axis results.
Figure 22.
Inertial axis results.
Figure 23.
Body axis results.
Figure 23.
Body axis results.
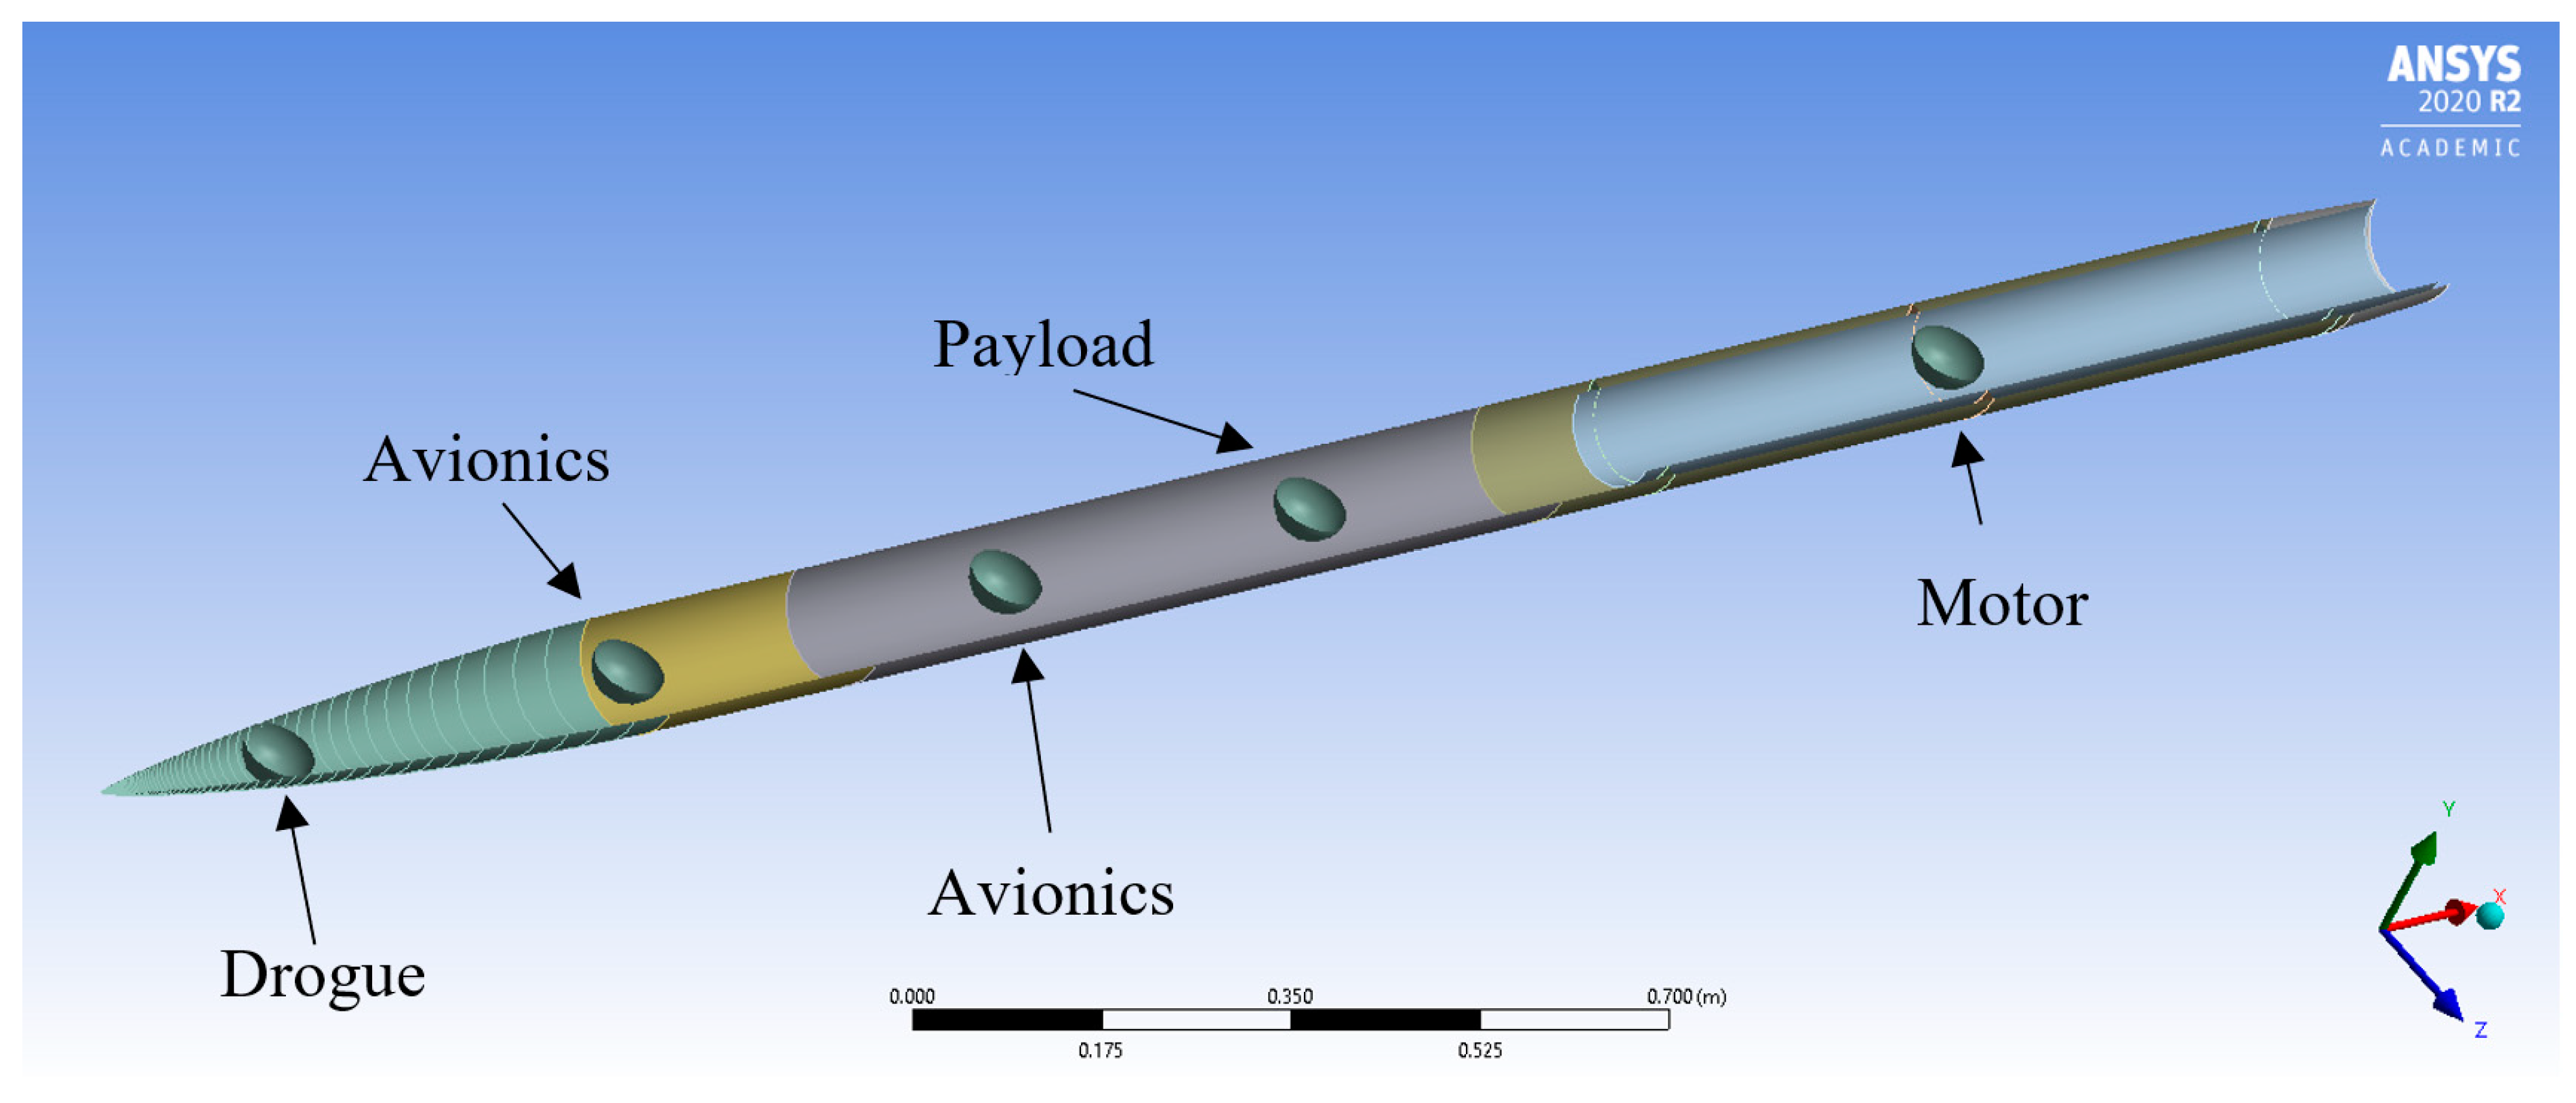
Figure 24.
Annotated point mass locations within the rocket cross-section.
Figure 24.
Annotated point mass locations within the rocket cross-section.
Figure 25.
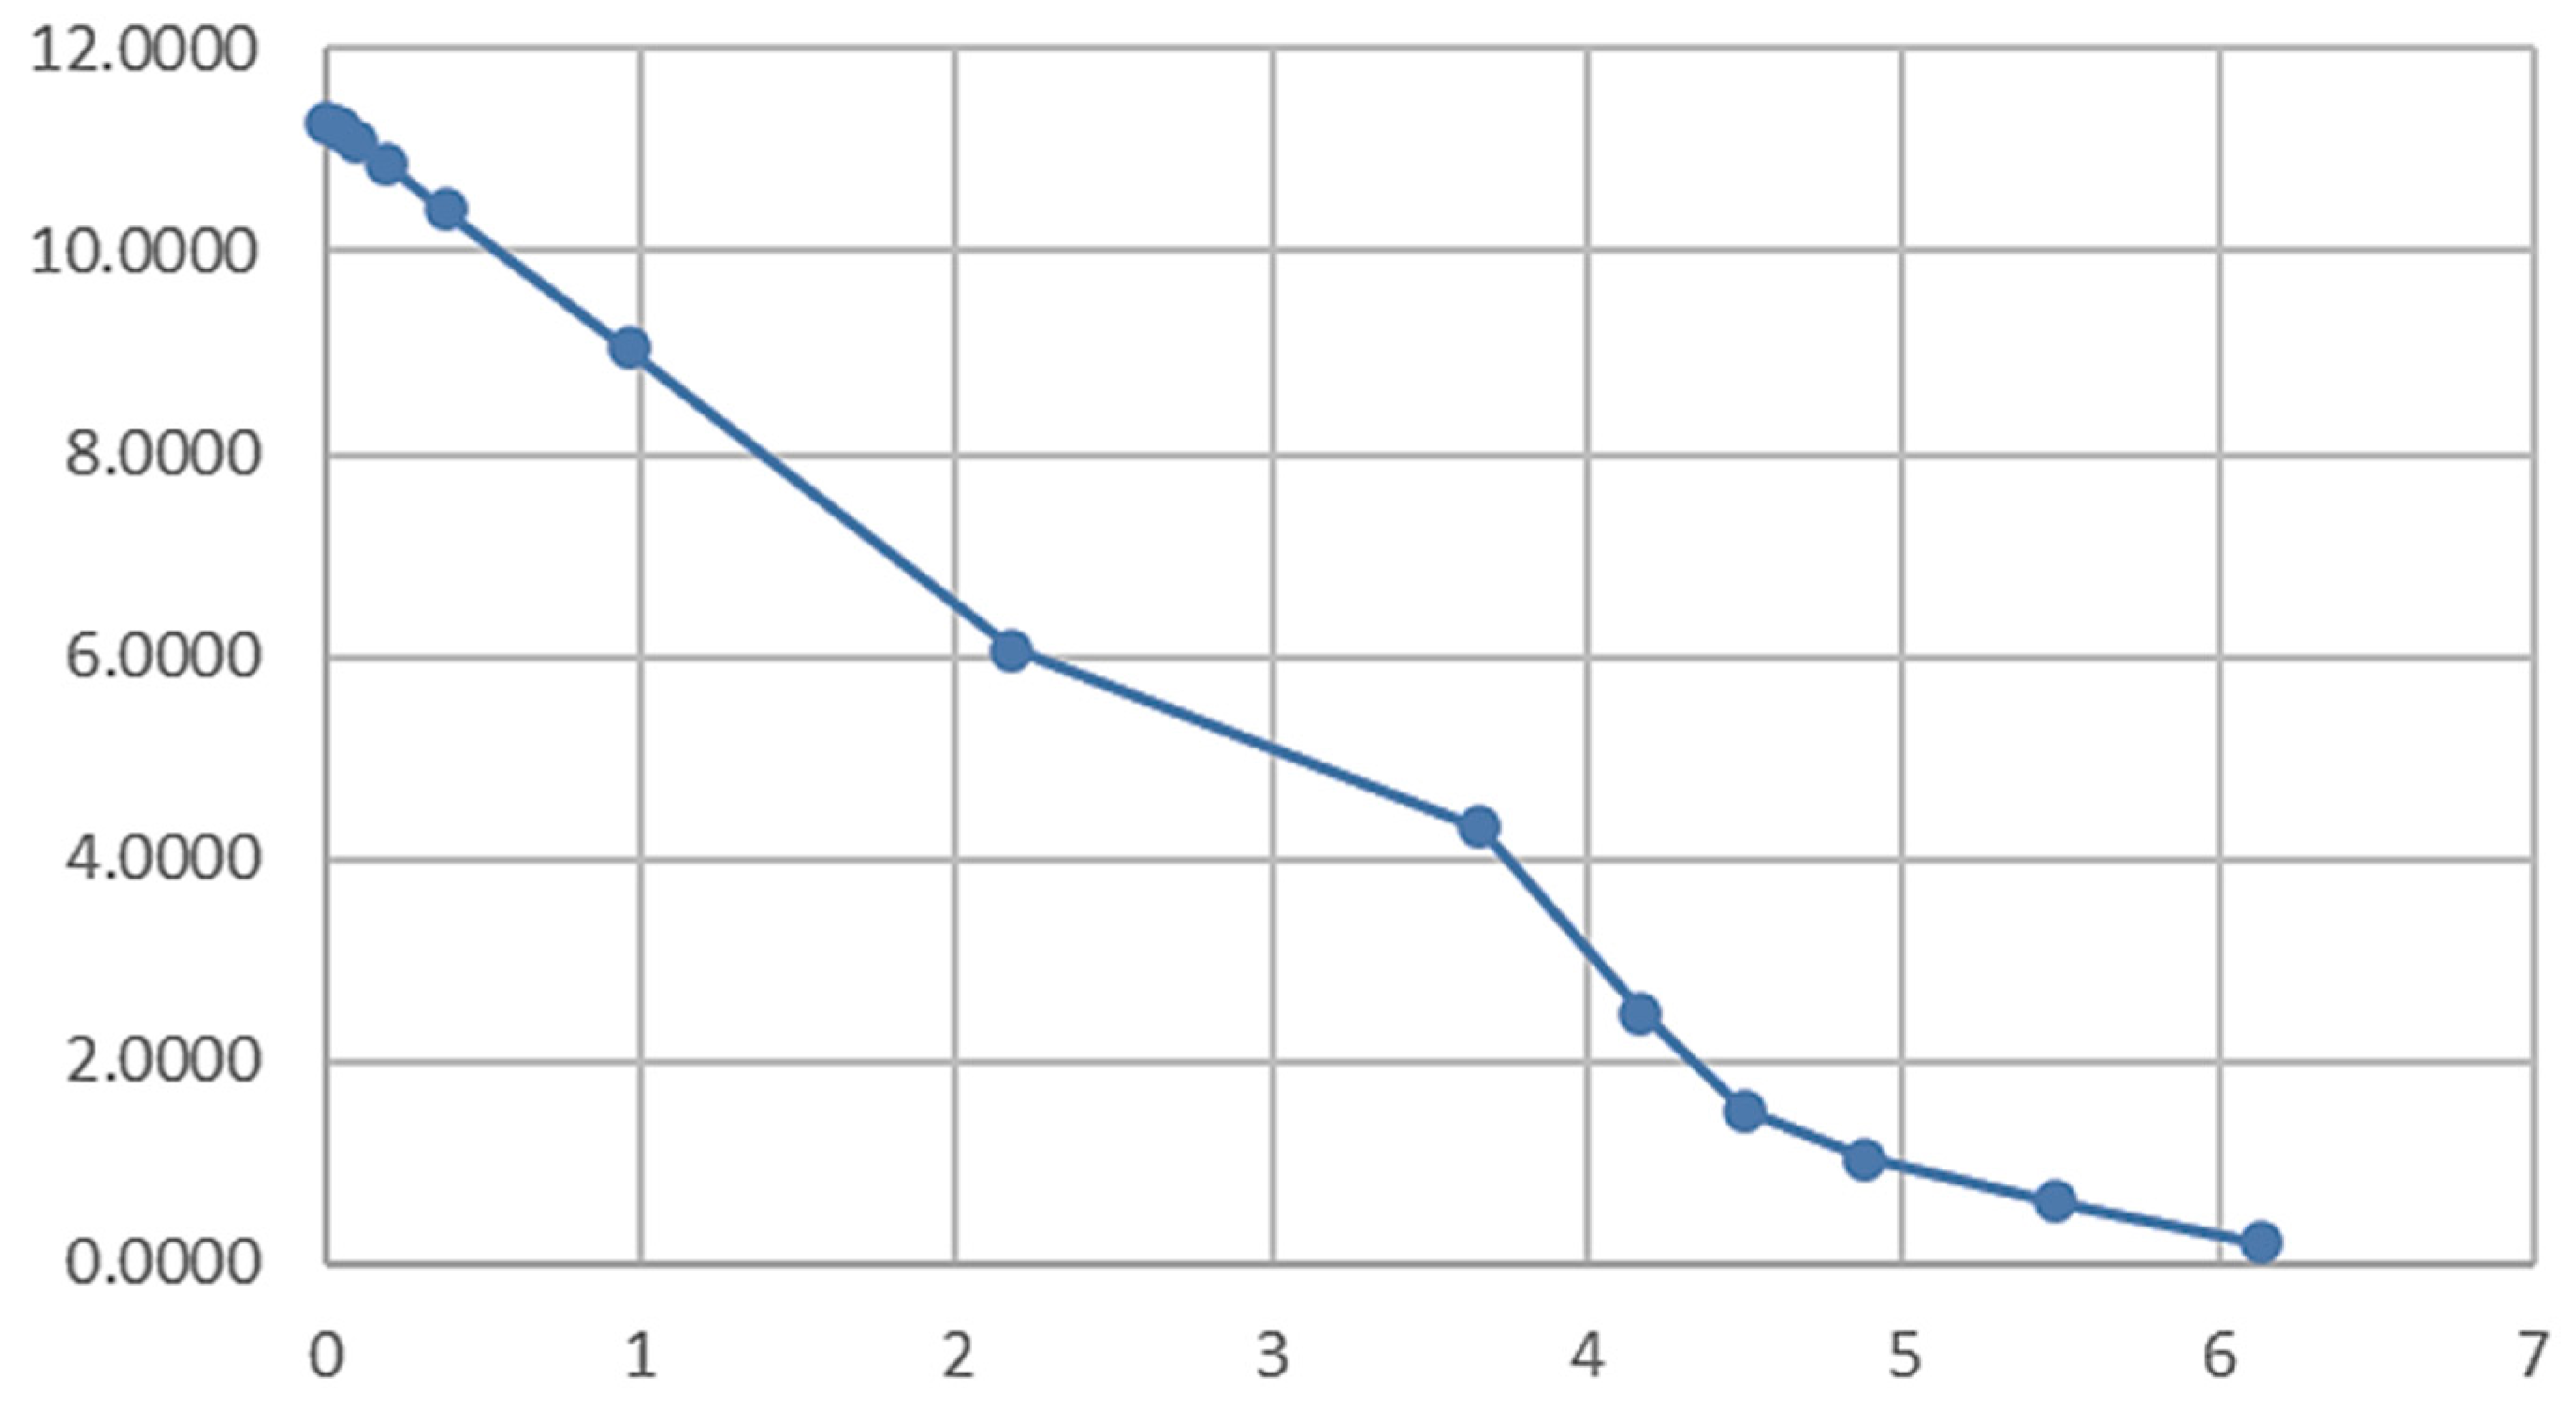
Motor mass over time.
Figure 25.
Motor mass over time.
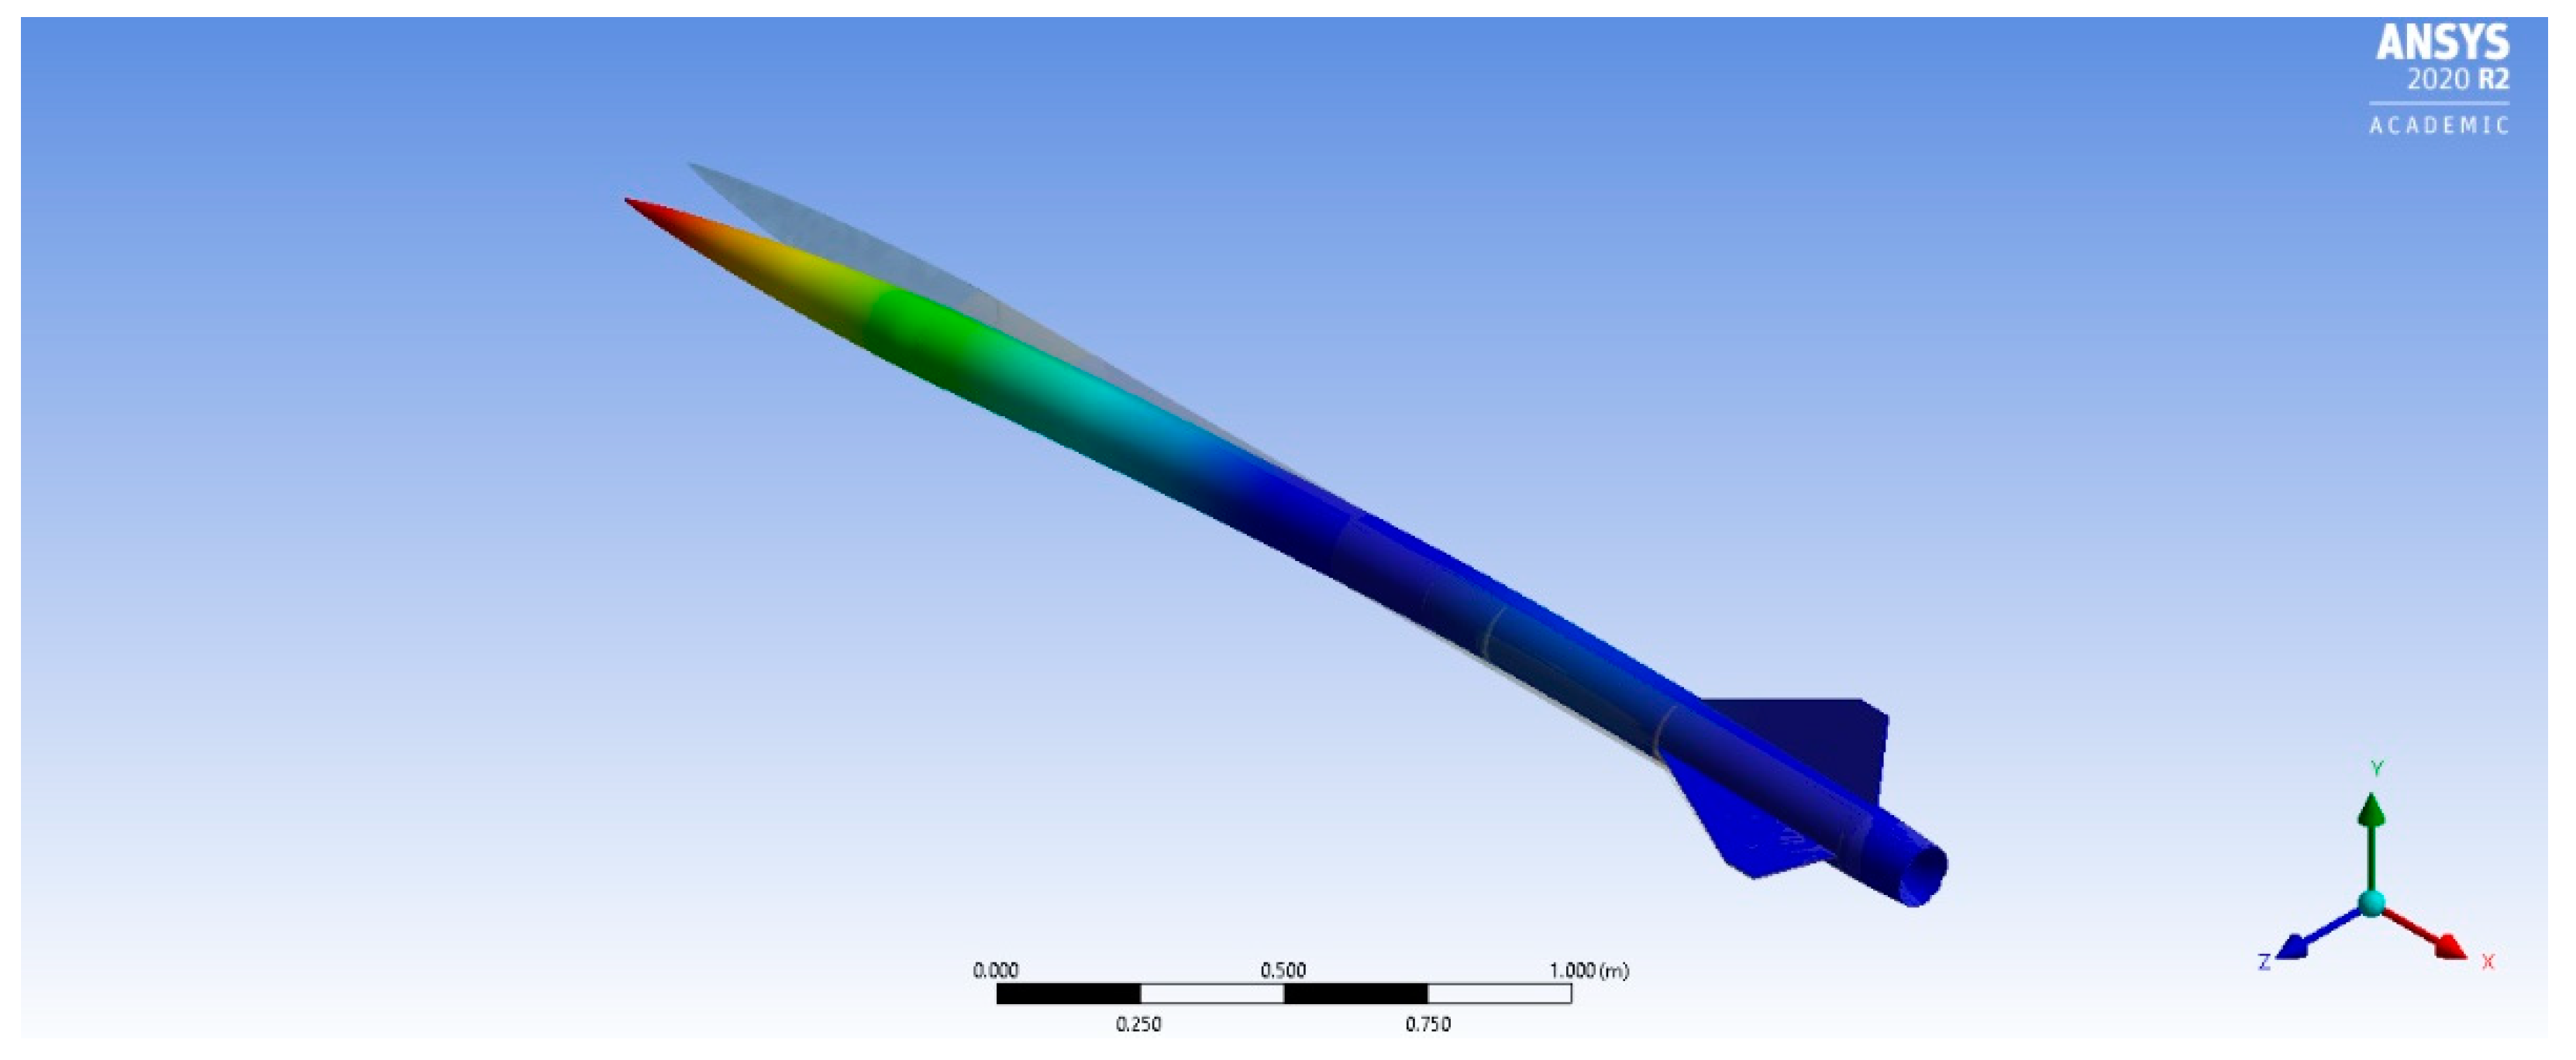
Figure 27.
First-Order Bending Mode Shape (X–Z Plane).
Figure 27.
First-Order Bending Mode Shape (X–Z Plane).
Figure 28.
First-Order Bending Mode Shape (X–Y Plane).
Figure 28.
First-Order Bending Mode Shape (X–Y Plane).
Figure 29.
Second-Order Bending Mode Shape (X–Z Plane).
Figure 29.
Second-Order Bending Mode Shape (X–Z Plane).
Figure 30.
Second-Order Bending Mode Shape (X–Y Plane).
Figure 30.
Second-Order Bending Mode Shape (X–Y Plane).
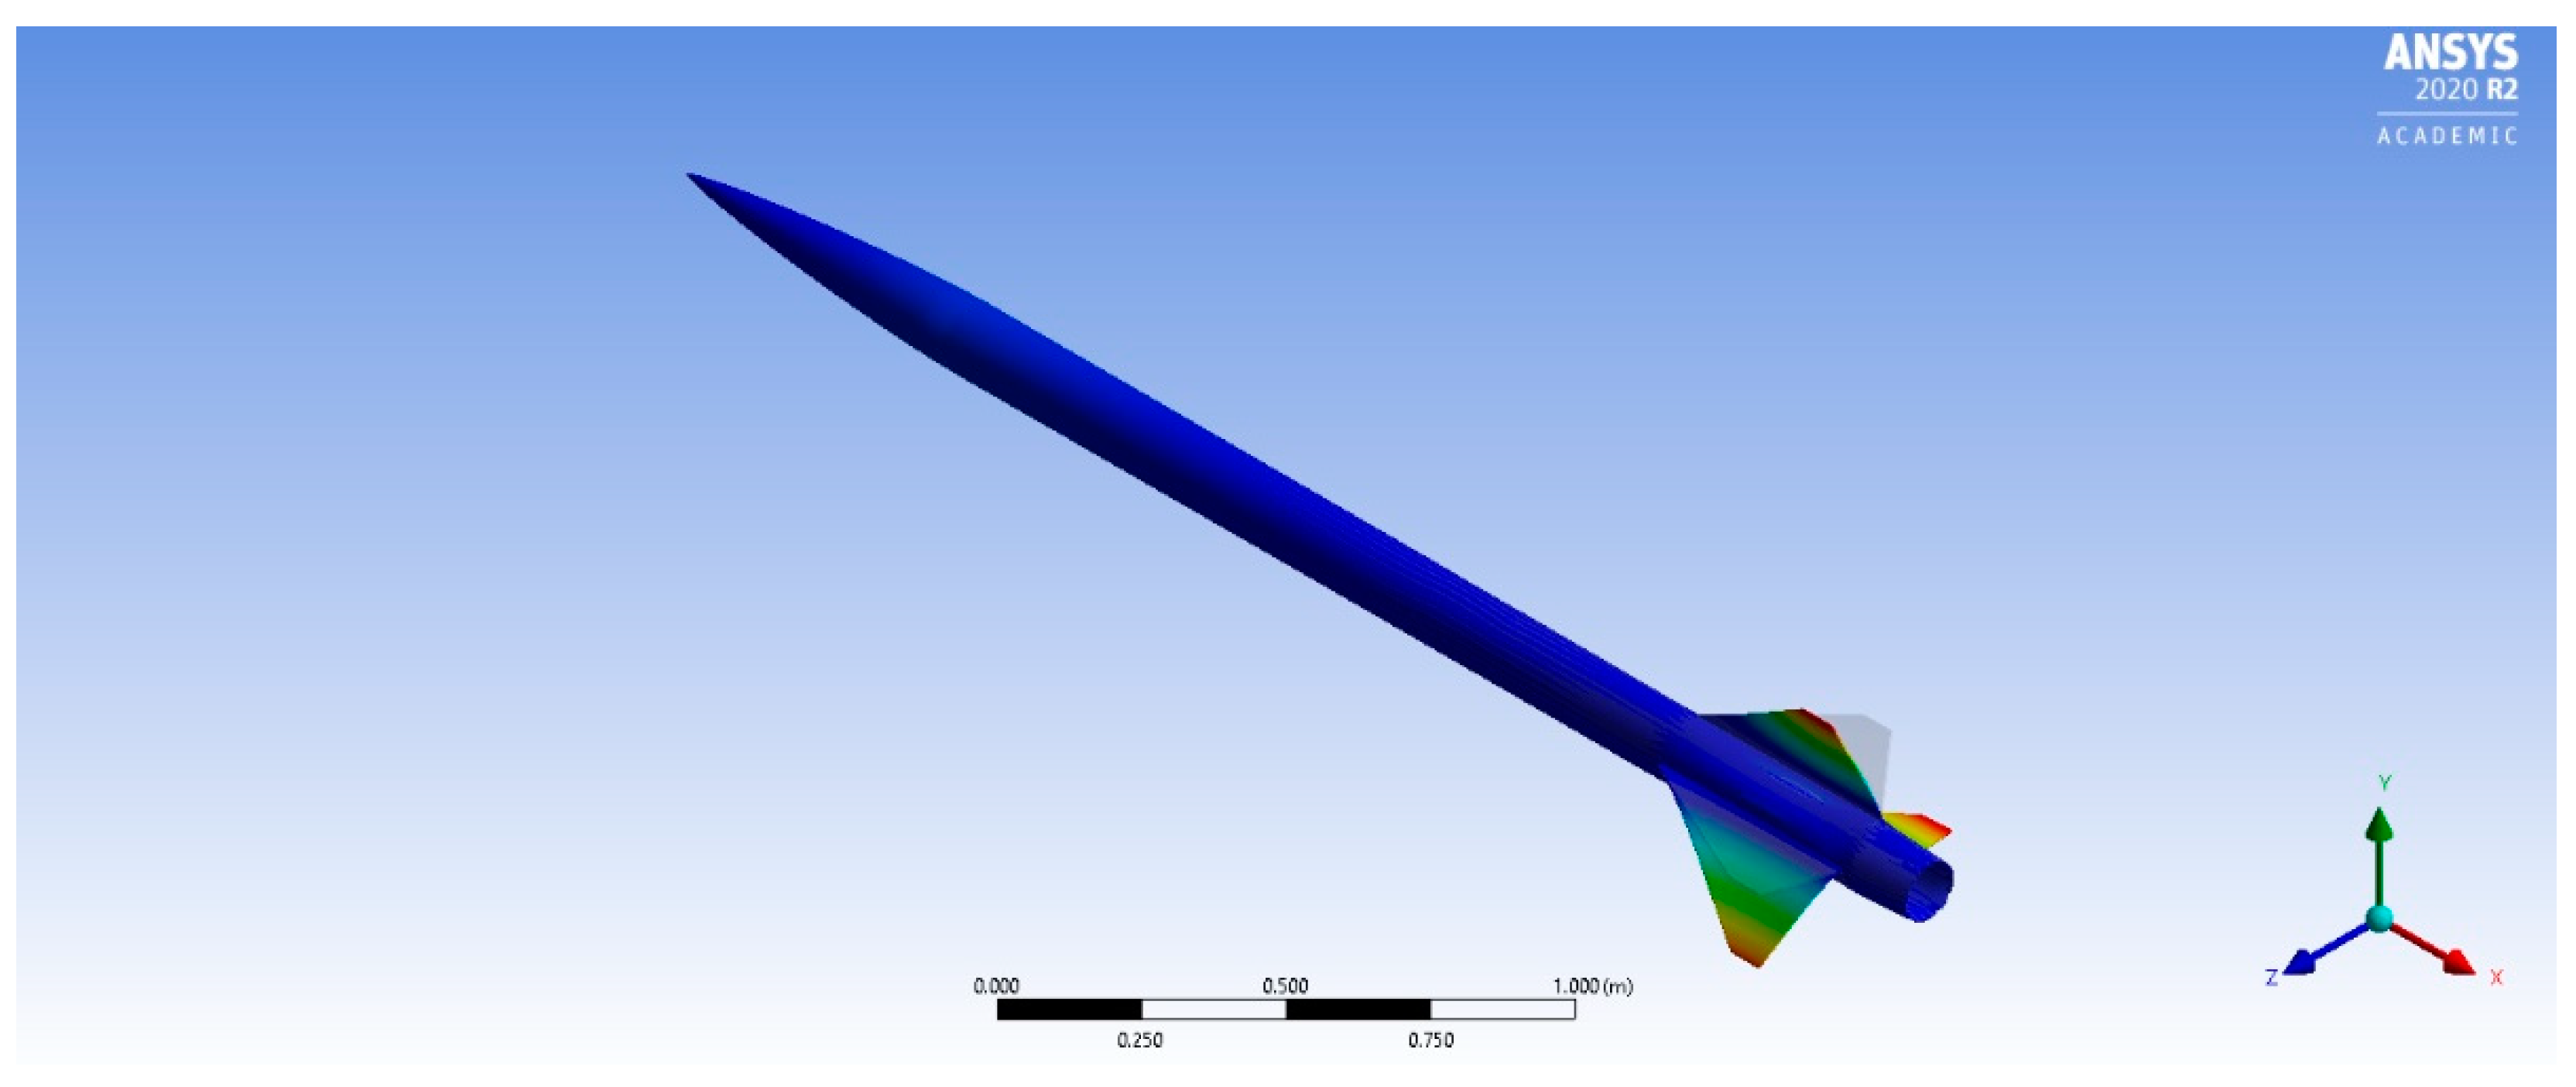
Figure 31.
Pure Radial Mode Shape (X–Z Plane).
Figure 31.
Pure Radial Mode Shape (X–Z Plane).
Figure 32.
Total rocket mass over first 7 s of flight.
Figure 32.
Total rocket mass over first 7 s of flight.
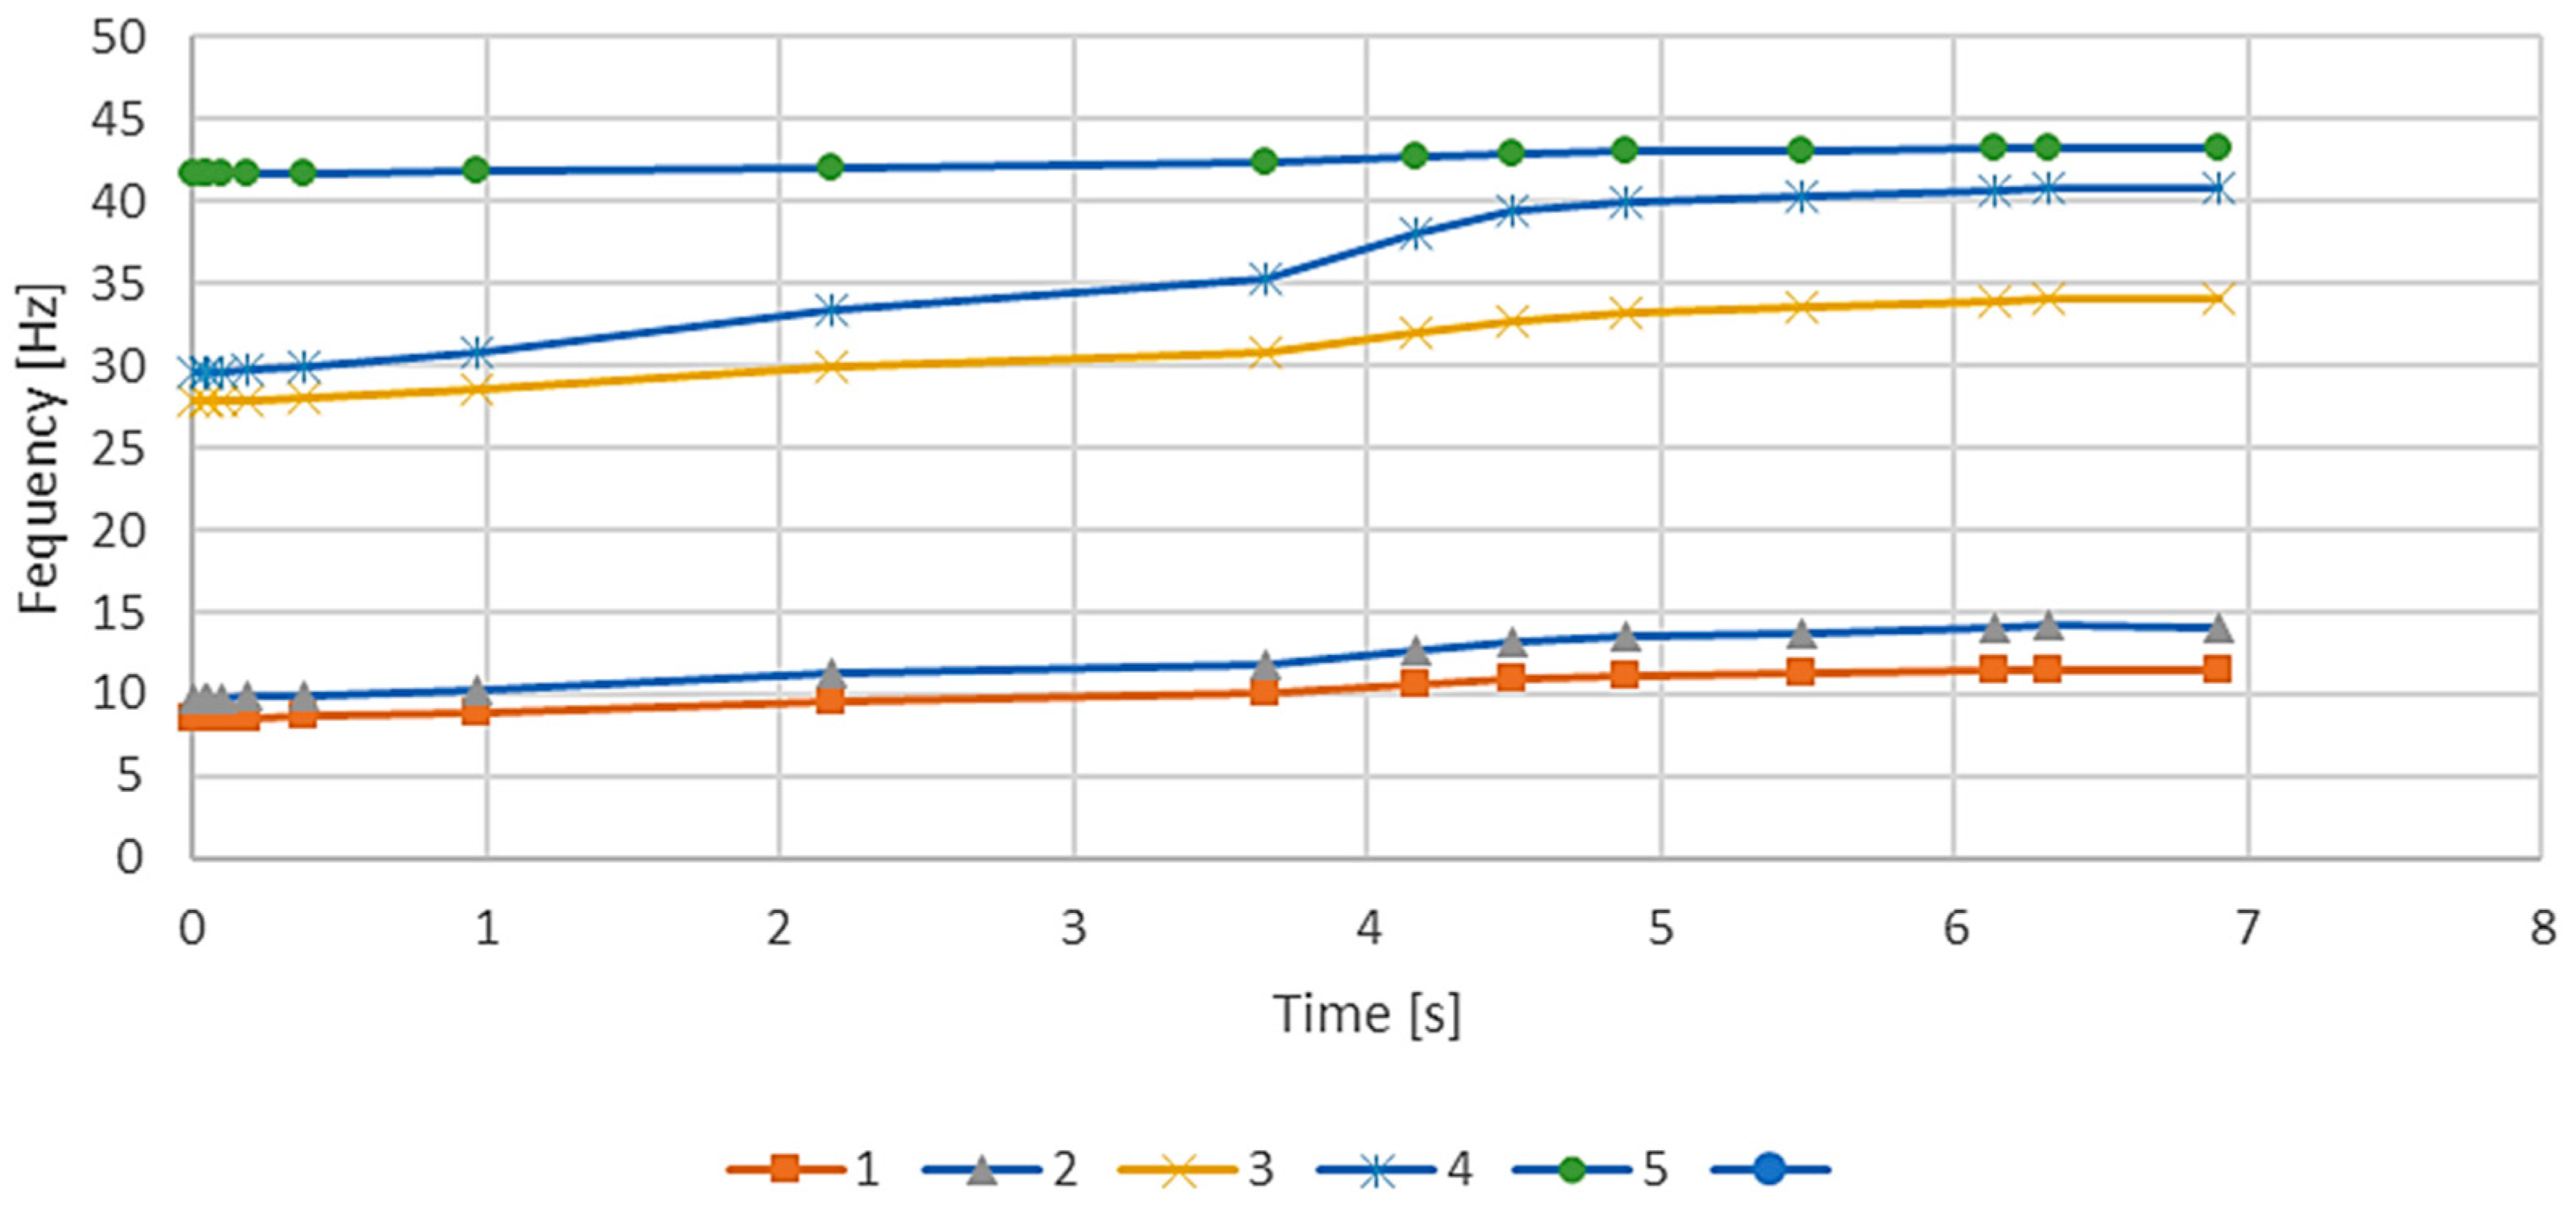
Figure 33.
Rocket time-frequency graph with varying mass.
Figure 33.
Rocket time-frequency graph with varying mass.
Figure 34.
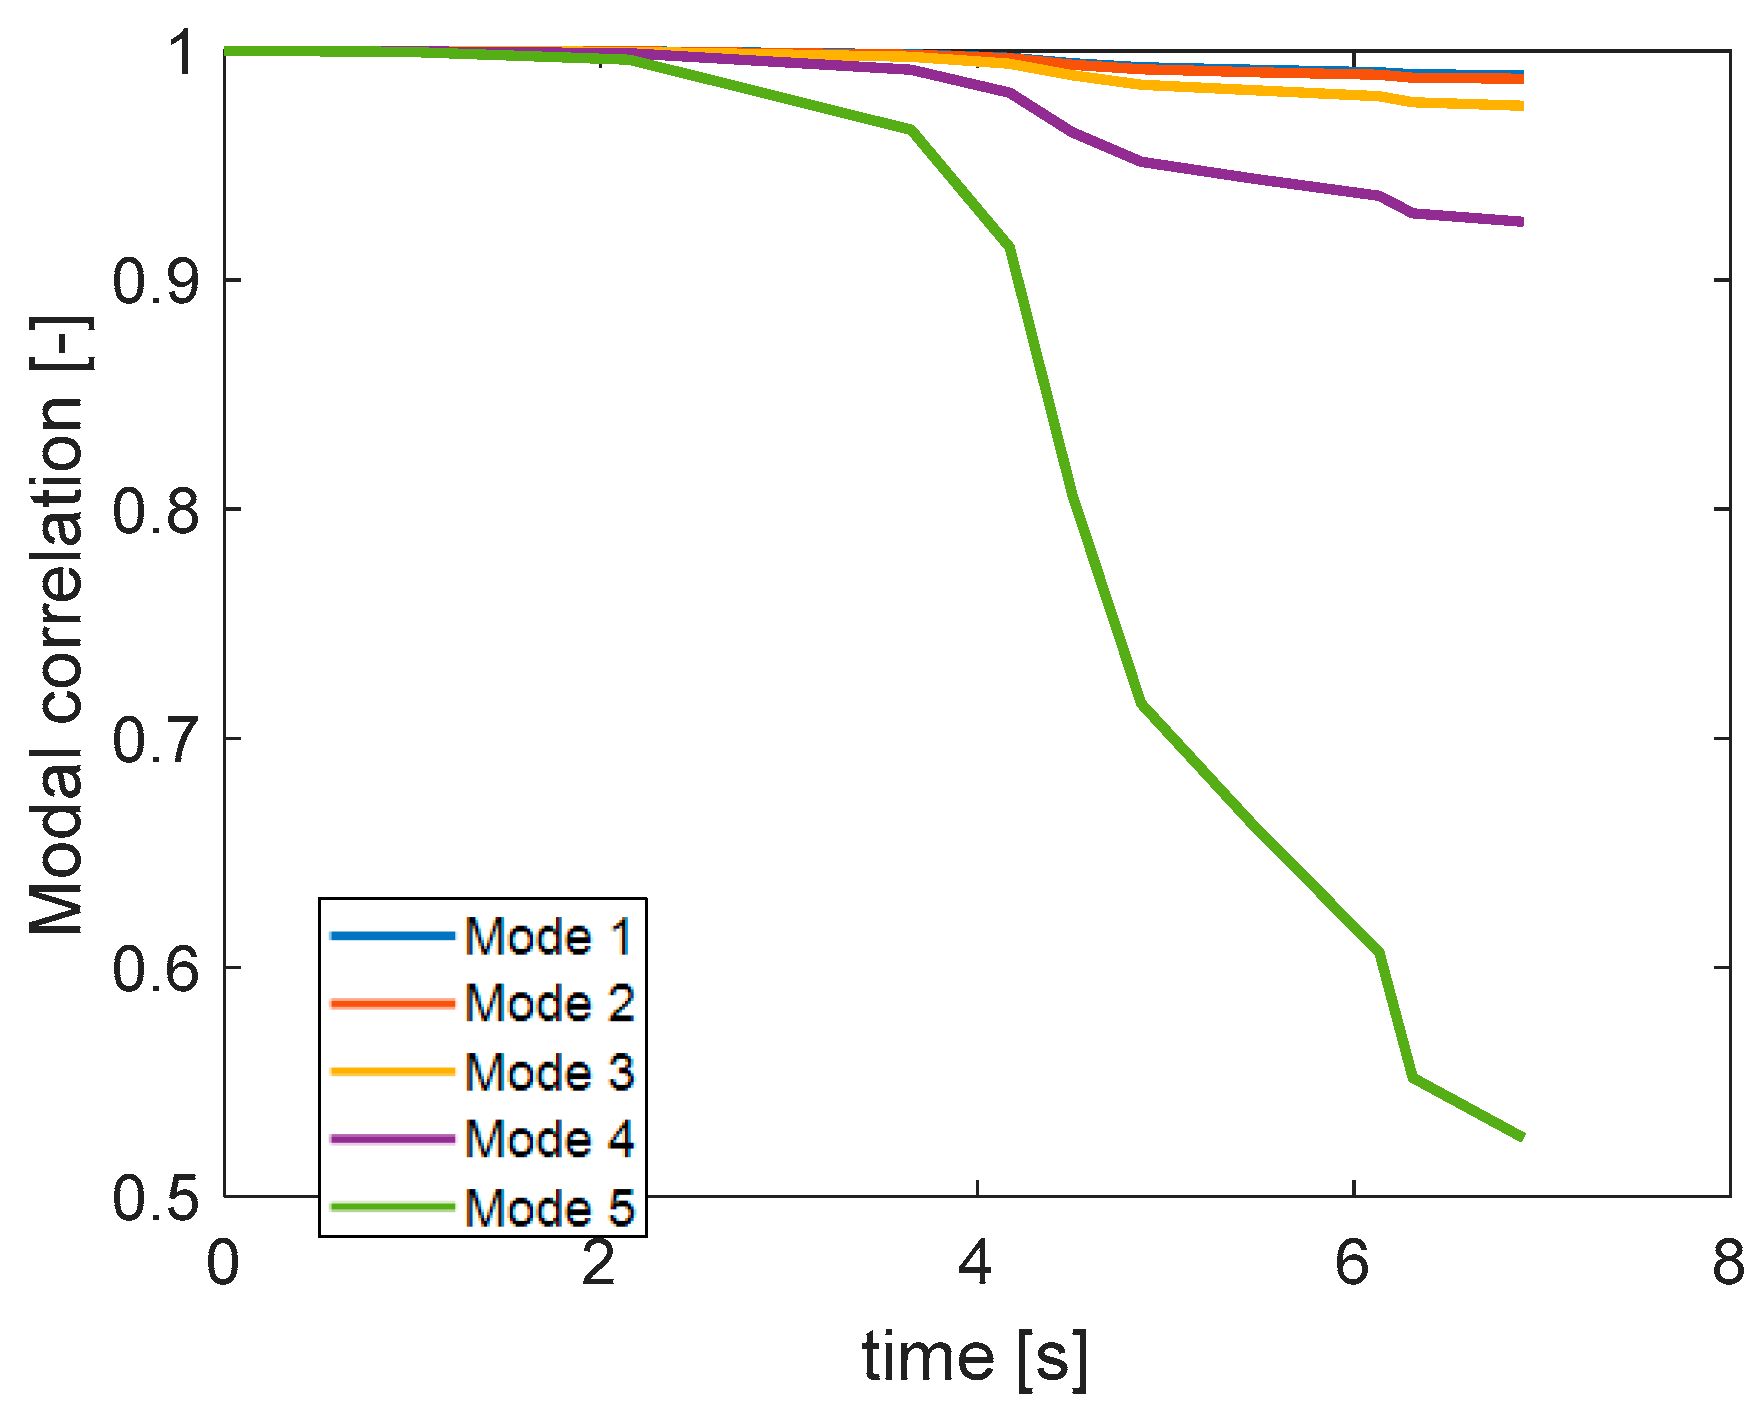
Modal correlation with burn time.
Figure 34.
Modal correlation with burn time.
Figure 35.
Modal correlation between time-varying SVD method and the eigenmodes (left) and the natural frequency error (right).
Figure 35.
Modal correlation between time-varying SVD method and the eigenmodes (left) and the natural frequency error (right).
Figure 36.
Representation of deflected rocket at a scale factor of 50.
Figure 36.
Representation of deflected rocket at a scale factor of 50.
Figure 37.
Nosecone deflection without loading.
Figure 37.
Nosecone deflection without loading.
Figure 38.
Deflection of nosecone under Mach 0.5 and pre-stress load.
Figure 38.
Deflection of nosecone under Mach 0.5 and pre-stress load.
Figure 39.
Nosecone deflection at Mach 0.5 with aeroelastic derivatives.
Figure 39.
Nosecone deflection at Mach 0.5 with aeroelastic derivatives.
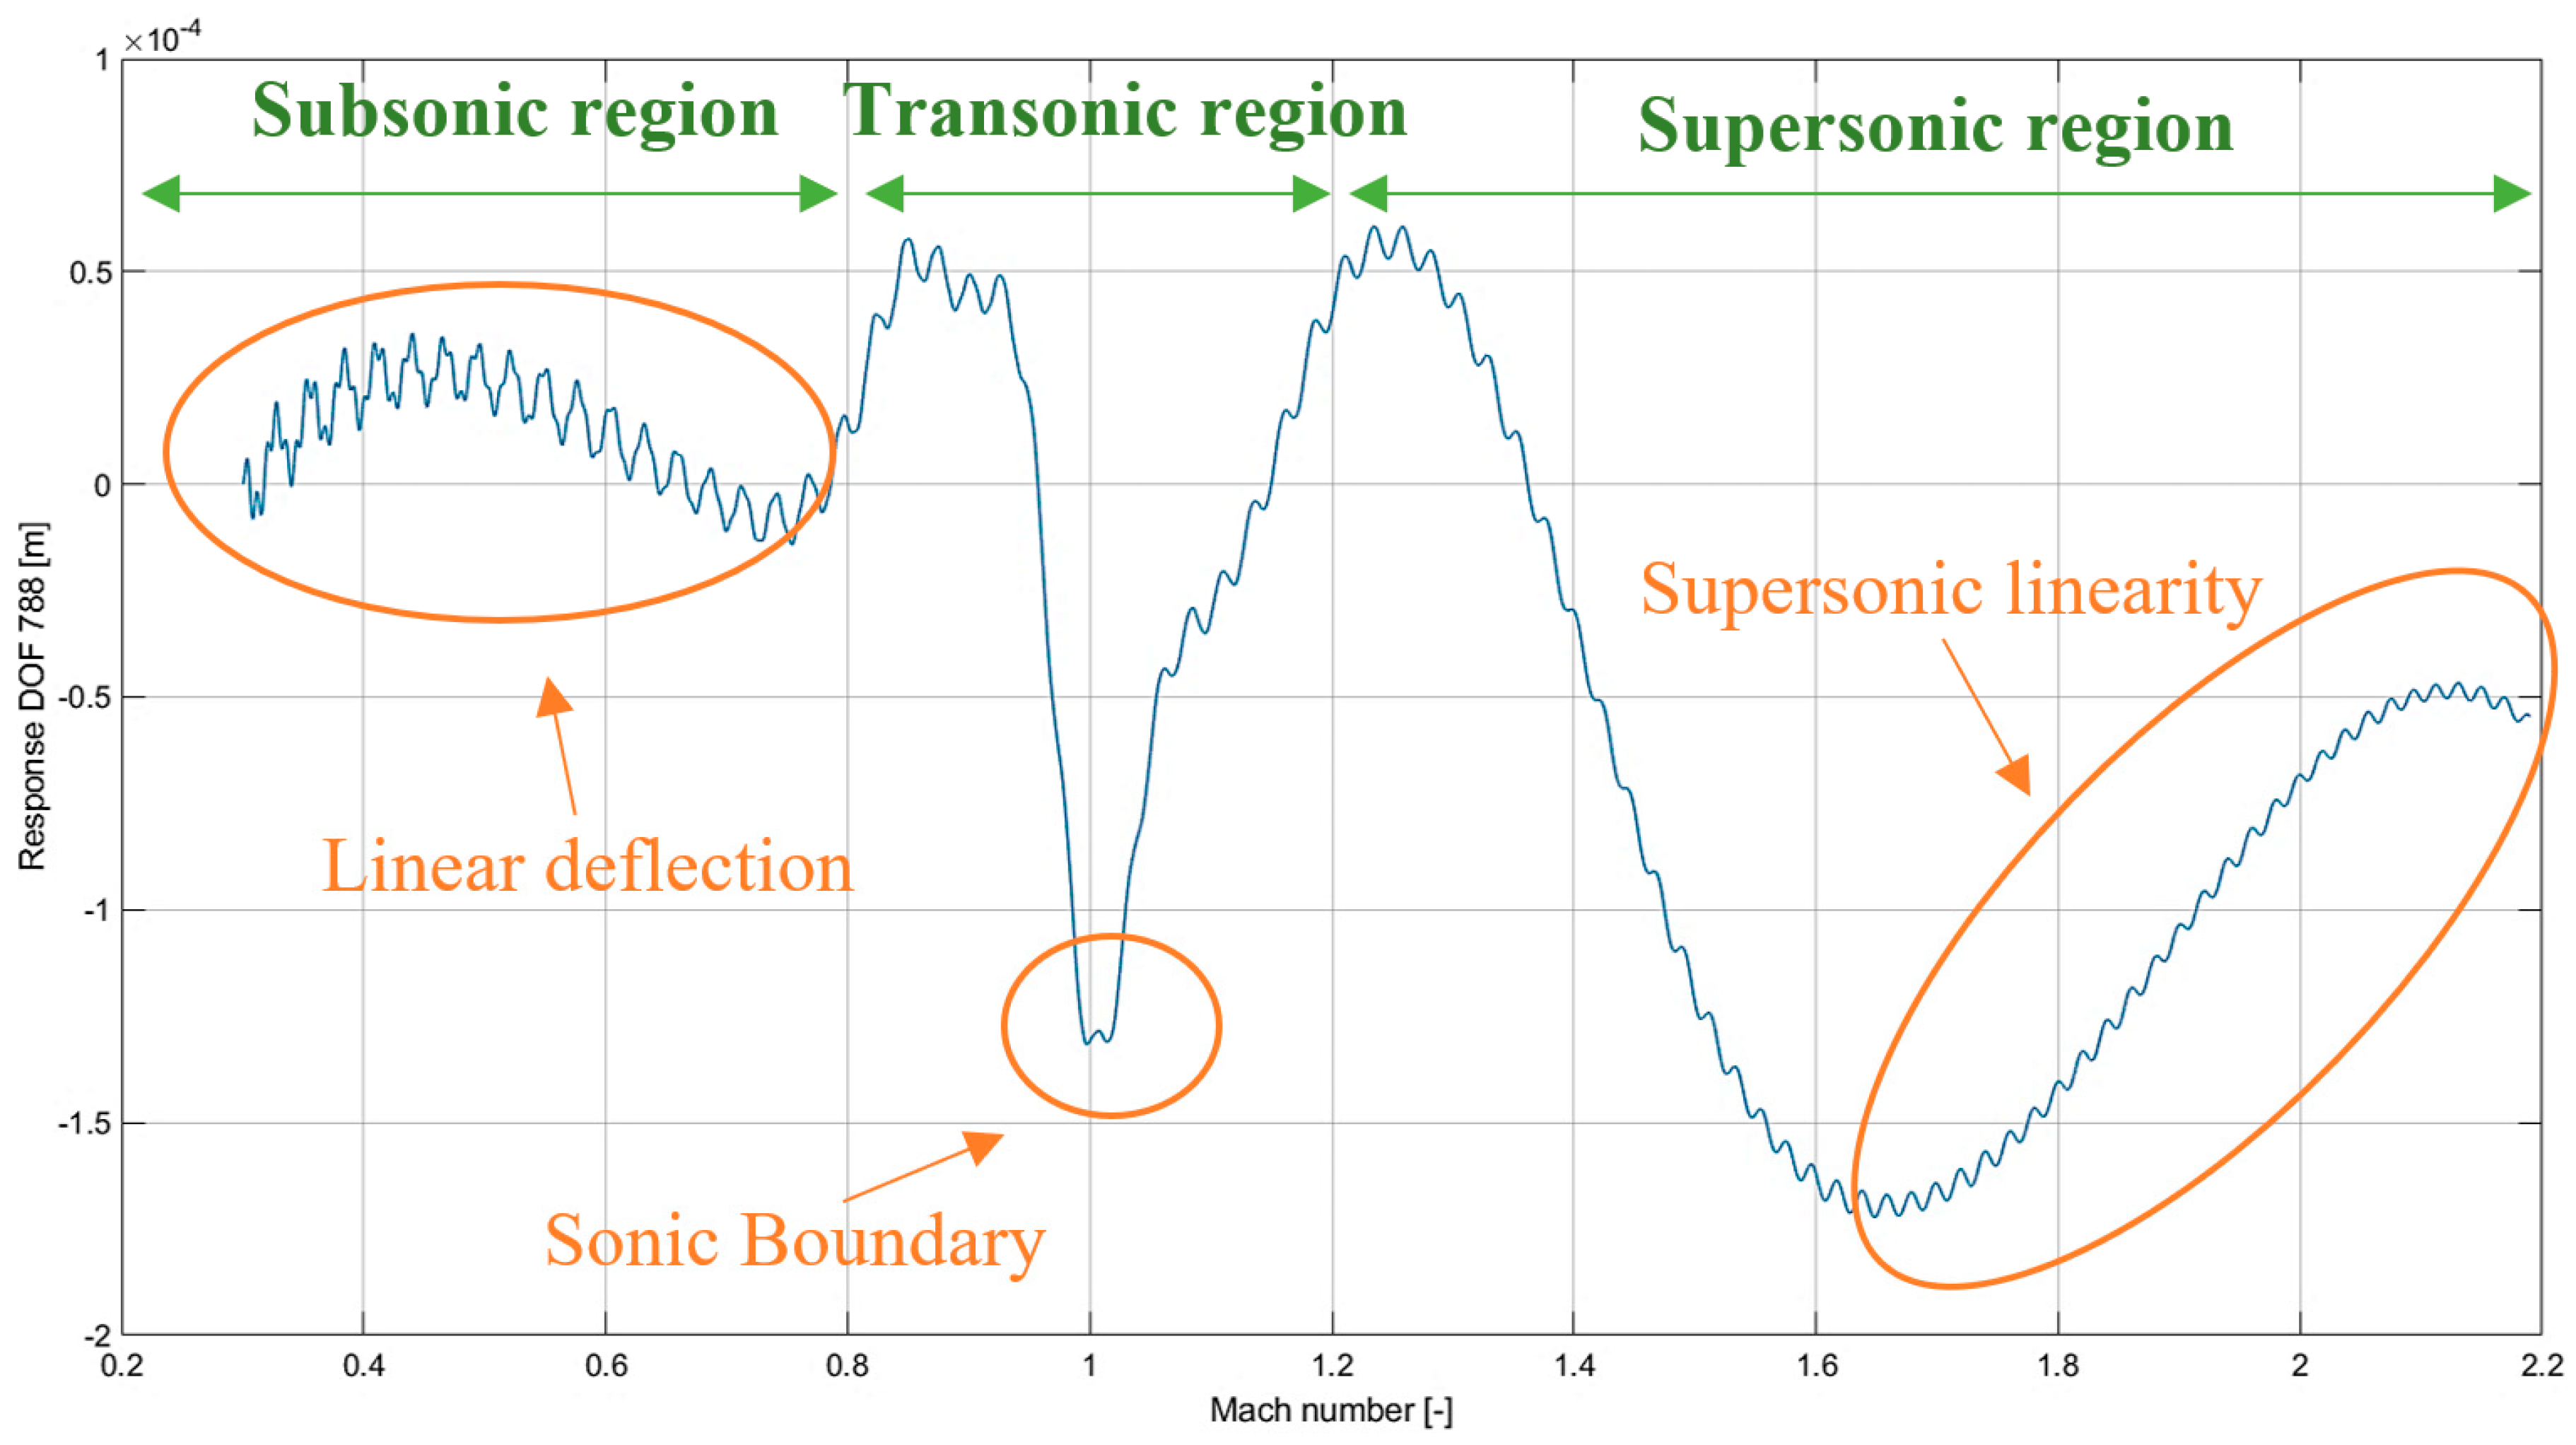
Figure 40.
Deflection of the nosecone with respect to the Mach number with annotated regions and specific regimes.
Figure 40.
Deflection of the nosecone with respect to the Mach number with annotated regions and specific regimes.
Table 1.
Comparison of rigid-body aerodynamic coefficient calculation methods.
Table 1.
Comparison of rigid-body aerodynamic coefficient calculation methods.
| Method | Pros | Cons |
|---|
| Direct CFD Calculation | - -
Any rocket configuration can be calculated.
| - -
High computational intensity prevents direct usage for real-time simulations.
|
| Look Up Table Development using CFD Calculation | - -
Any rocket configuration can be calculated. - -
After data are generated, it will enable the rapid interpolation of aerodynamic coefficients within the dynamics model.
| - -
Interpolation methods may not provide accurate enough information. - -
With a scope of trajectory simulation, parameters such as angle of attack, sideslip, Mach number and other flow characteristics would require alteration to enable an adequate data set.
|
| Semi-Empirical and Analytical Calculation | - -
Rapid calculation of coefficients and stability derivatives. - -
Geometrically defined characteristics allow for continuously updating calculations.
| - -
Without corrections, it only calculates characteristics for low angles-of-attack. - -
Cannot directly calculate in the transonic region. - -
Supersonic assumptions include a sharp nose and straight and tapered fins.
|
Table 2.
Parachute models and characteristics [
36].
Table 2.
Parachute models and characteristics [
36].
| Type | Constructed Shape DC/D0 | Inflated Shape DP/D0 | CD,0 | Average Angle
of Oscillation | General Applications |
|---|
| Flat circular ribbon | 1.0 | 0.67 | 0.45–0.50 | 0–3 | Pilot, drogue, deceleration, descent |
| Conical ribbon | 0.95–0.97 | 0.70 | 0.5–0.55 | 0–3 | Pilot, drogue, deceleration, descent |
| Hemisflo ribbon | 0.62 | 0.62 | 0.30–0.46 | 2 | Supersonic drogue |
| Ringslot | 1.0 | 0.67–0.70 | 0.56–0.65 | 5 | Extraction, deceleration, descent |
| Disk-gap-band | 0.73 | 0.65 | 0.52–0.58 | 10–15 | Supersonic drogue, descent |
| Ballute | 0.51 | 0.51 | 0.51–1.20 | <1 | Stabilisation, supersonic drogue |
Table 3.
Monte Carlo probability distributions application methods.
Table 3.
Monte Carlo probability distributions application methods.
| Variable | Application Method |
|---|
| Drag coefficient | Multiplication |
| Centre of pressure | Multiplication |
| Normal coefficient | Multiplication |
| Parachute drag coefficient | Multiplication |
| Thrust curve | Multiplication |
| Declination launch angle | Addition |
| Azimuth angle | Addition |
Table 4.
Rocket Dimensions.
Table 4.
Rocket Dimensions.
| Total length (m) | 2.941 |
| 0.695 |
| 2.115 |
| 0.131 |
| Diameter (m) | 0.131 |
| Airframe thickness (m) | 0.00191 |
| Centring ring thickness (m) | 0.00467 |
| Fin thickness (m) | 0.0051 |
| Exposed fin root chord (m) | 0.445 |
| Reference fin root chord (m) | 0.6044 |
| Fin tip chord (m) | 0.075 |
| Exposed fin surface area (m2) | 0.152 |
| Reference fin surface area (m2) | 0.0739 |
Table 5.
Mesh sensitivity study.
Table 5.
Mesh sensitivity study.
| Mesh | Number of Elements | Lift Coefficient | Drag Coefficient |
|---|
| Fine | 430 k | 1.066 | 0.57 |
| Medium | 370 k | 1.066 | 0.571 |
| Coarse | 248 k | 1.02 | 0.55 |
Table 6.
Monte Carlo Coefficient Distributions.
Table 6.
Monte Carlo Coefficient Distributions.
| Variable | Probability Distribution | Application |
|---|
| Drag coefficient | Ν (1, σ2), σ = 0.004 | Multiplication |
| Lift coefficient | Ν (1, σ2), σ = 0.0315 | Multiplication |
| Centre of gravity | Ν (1, σ2), σ = 0.00612 | Multiplication |
| Parachute drag coefficient | Ν (1, σ2), σ = 0.1 | Multiplication |
| Thrust curve | Ν (1, σ2), σ = 0.0011 | Multiplication |
| Declination launch angle | Ν (0, σ2), σ = 1 | Addition |
| Azimuth angle | Ν (0, σ2), σ = 1 | Addition |
Table 7.
Rocket Material Properties.
Table 7.
Rocket Material Properties.
| | S-Glass Composite [49] | Aluminium 6061-T6 [51] |
|---|
| Density (kgm−3) | 2480 | 2700 |
| Young’s Modulus (MPa) | 85,500 | 68,900 |
| Poisson’s Ratio | 0.22 | 0.33 |
Table 8.
Component centroid location relative to the nose cone.
Table 8.
Component centroid location relative to the nose cone.
| Component | Location (m) |
|---|
| Drogue Chute | 0.235 |
| Main Chute | 0.694 |
| Avionics | 1.19 |
| Payload | 1.59 |
| Motor | 2.4275 |
Table 9.
Component mass and mass moment of inertia values.
Table 9.
Component mass and mass moment of inertia values.
| Component | Mass (kg) | Length (m) | Radius (m) | I_x (kgm2) | I_y (kgm2) | I_z (kgm2) |
|---|
| Drogue Chute | 0.045 | 0.08 | 0.0225 | 1.13906 × 10⁻⁵ | 2.40029 × 10⁻⁵ | 2.40029 × 10⁻⁵ |
| Main Chute | 0.879 | 0.21 | 0.12 | 0.0063288 | 0.003275892 | 0.003275892 |
| Avionics | 1.4 | 0.4 | 0.124 | 0.0107632 | 0.018749414 | 0.018749414 |
| Payload | 4.4 | 0.65 | 0.109 | 29.7025 | 176.0418431 | 176.0418431 |
Table 10.
Motor mass and mass moment of inertia values.
Table 10.
Motor mass and mass moment of inertia values.
| Index | Time (s) | Mass (kg) | Inner Fuel Grain Radius (m) | Ix (kgm2) | Iy (kgm2) | Iz (kgm2) |
|---|
| 0 | 0 | 11.2720 | 0.0176 | 0.0104 | 17.3526 | 17.3526 |
| 1 | 0.04 | 11.2296 | 0.0177 | 0.0104 | 17.2874 | 17.2874 |
| 2 | 0.052 | 11.2026 | 0.0178 | 0.0104 | 17.2459 | 17.2459 |
| 3 | 0.101 | 11.0852 | 0.0180 | 0.0103 | 17.0654 | 17.0654 |
| 4 | 0.19 | 10.8721 | 0.0180 | 0.0101 | 16.7373 | 16.7373 |
| 5 | 0.38 | 10.4237 | 0.0191 | 0.0099 | 16.0483 | 16.0483 |
| 6 | 0.965 | 9.0391 | 0.0215 | 0.0090 | 13.9193 | 13.9193 |
| 7 | 2.176 | 6.0734 | 0.0267 | 0.0068 | 9.3568 | 9.3568 |
| 8 | 3.658 | 4.3040 | 0.0298 | 0.0052 | 6.6331 | 6.6331 |
| 9 | 4.17 | 2.4829 | 0.0329 | 0.0033 | 3.8280 | 3.8280 |
| 10 | 4.493 | 1.5119 | 0.0346 | 0.0021 | 2.3314 | 2.3314 |
| 11 | 4.881 | 1.0435 | 0.0354 | 0.0015 | 1.6093 | 1.6093 |
| 12 | 5.483 | 0.6092 | 0.0362 | 0.0009 | 0.9396 | 0.9396 |
| 13 | 6.137 | 0.2080 | 0.0369 | 0.0003 | 0.3208 | 0.3208 |
| 14 | 6.322 | 0.0123 | 0.0372 | 0.0000 | 0.0190 | 0.0190 |
Table 11.
Solid motor fuel grain geometry.
Table 11.
Solid motor fuel grain geometry.
| Motor Type | Star |
|---|
| Web Fraction | 0.45 |
| Outer Radius | 0.0392125 |
| Initial Inner Radius | 0.0176456 |
| Total Grain Length (6GXL) | 1.238504 |
Table 12.
Mesh information.
Table 12.
Mesh information.
| | Coarse | Medium | Fine |
|---|
| Element Size (mm) | 30 | 14.82 | 10 |
| Elements | 2284 | 9833 | 20713 |
| Average Aspect Ratio | 1.378 | 1.2282 | 1.216 |
| CP Time (s) | 5 | 30 | 4686 |
| Actual Time (s) | 41 | 106 | 4823 |
| Relative CP Time | 1 | 2.585366 | 117.6341 |
Table 13.
Nominal mesh sensitivity results (Fully Fuelled Rocket).
Table 13.
Nominal mesh sensitivity results (Fully Fuelled Rocket).
| Real Modes (Hz) | Coarse | Medium | Fine |
|---|
| 1 | 11.8330 | 11.952 | 12.913 |
| 2 | 14.5080 | 14.946 | 15.596 |
| 3 | 41.1250 | 41.452 | 41.917 |
| 4 | 43.3300 | 43.605 | 44.169 |
| 5 | 54.2420 | 55.274 | 56.549 |
Table 14.
Normalised sensitivity values relative to coarse mesh (Fully Fuelled Rocket).
Table 14.
Normalised sensitivity values relative to coarse mesh (Fully Fuelled Rocket).
| Mode (Hz) | Coarse | Medium | Fine |
|---|
| 1 | - | 1.010 | 1.091 |
| 2 | - | 1.030 | 1.075 |
| 3 | - | 1.007 | 1.025 |
| 4 | - | 1.008 | 1.019 |
| 5 | - | 1.006 | 1.019 |
| 6 | - | 1.019 | 1.043 |
| Average Difference | - | 0.013 | 0.045 |
