Abstract
In this paper, a model for a single stage plasma gasification system for marine vessels characterized by significant waste production is proposed. The main objective of the model is to investigate the effects of different feedstock compositions on key parameters, such as electrical power produced and heat recovered. The different types of waste generated onboard are described along with their environmental impacts. Specific attention is given to solid wastes, sewage sludge and plastic wastes as potential feedstock. Their average generation, proximate and ultimate analysis are defined, as input to the process model. The process assumptions used in the simulation model are illustrated. The system model is divided into five units: the pre-treatment unit; the gasification unit; the syngas cleaning unit; the energy conversion unit; and the heat recovery unit. Four operational scenarios are investigated to consider several variations of composition of the main feedstock. From the results of the simulations, the system model shows good feedstock flexibility, and the possibility of operating in net electricity gain conditions. The cold gas efficiency of the process is also assessed and its maximum value is obtained for the highest concentrations of sewage sludge (33.3%) and plastic (16.7%). Other parameters investigated are the combustion temperature, sorbent consumption in the cleaning process, feedstock and syngas lower heating value LHV.
1. Introduction and Motivation
Ships are complex systems, and their complexity varies depending on the purpose of the vessel, the itinerary they follow, their capacity in terms of number of passenger or transportable goods [1,2]. Marine vessels can be classified based on their purpose and types of ships [3]. In this study, the attention will be focused on large vessels which are typically producing significant and diversified quantities of wastes. This is usually the case for ships that transport a substantial number of people, such as cruise ships or military vessels like aircraft carriers [4]. Cruise ships have a high density of passengers (customers and the crew), and the intrinsic nature of cruising can affect strongly the waste generation on board [4]. This is especially true as starting from the 90′ cruise liners business model shifted more and more towards the “luxurious hotel” model [2,5], with the implementation of several innovations such as restaurants, buffets, bars, spas, fitness centers, casinos, etc. that strongly enhance the customer experience during cruising time, but that inevitably led to an increase and diversification of the wastes generated on board [2]. Similarly, to municipalities, solid wastes, such as paper, food waste, glass, metals and plastic, are produced, as well as liquid wastes typical of human activities, such as gray water and black water. However, ships must also manage oily bilge water, ballast water, ashes from the incinerators and, especially for cruise ships, hazardous wastes, which are often linked to typical cruise ships activities including photo processing and printing [4,5]. The proper management of these waste streams is a crucial challenge which requires well-defined procedures and coordination between the vessels and the destination ports [4,6,7]. A significant fraction of wastes is stored onboard to be discharged at land, but cases of illicit dumping of litter at sea are not unheard of [6,8] The issue of waste management is strictly linked to environmental issues, as improper disposal of litter, especially at sea, can be dangerous and harmful for the local ecosystems and in some cases even for the human health [6,9,10]. This is especially true when plastic wastes are considered as in depth investigated by Galloway [4,11]. For the scope of this work, only solid wastes (including plastic) and sewage are investigated as potential feedstock: solid wastes are a very heterogeneous collection of wastes, which are, according to the IMO (International Maritime Organization), further classified in domestic wastes (paper, glass, metals, cardboard, fabric, wood, etc.), food wastes, plastic wastes, operational wastes (ropes, cans, machineries, various scraps, etc.), incinerator ashes and kitchen oils/greases [12], while black waters, produced by the flushing of toilets and from medical facilities, are generally composed of water, urines, feces and other small human fluids and solids [13]. In particular, the scope of this work was to develop a relatively simple model for a process treating ship-generated waste directly on board, and to simulate some reasonable feedstock scenarios to investigate the flexibility of the system, how the gasification efficiency varies and if the system modeled can operate in conditions of electricity net gain. It is initially necessary to assess the average quantities of wastes generated onboard of cruise ships, and this was conducted by CE Delft in a report prepared for the European Maritime Safety Agency [14]. The data was collected through audits, interviews, literature analysis and online surveys, and the results are shown in Table 1. This information will be essential during the modeling phase, as the model will require as input the mass flow rate of the feedstock and its composition in terms of proximate and ultimate analysis. In this regard, in Table 2 the proximate and ultimate analysis of solid wastes, sewage sludge and plastic are shown based on the data from literature. In particular, in this work only Cl-free unrecyclable plastics are considered, as it is assumed that through an initial screening process recyclable plastic are removed [15]. While Polyvinyl Chloride (PVC) is quite common and Cl-rich, it is assumed as screened and removed for recycling, as dioxins production is not modeled [16]. Some averaging was performed, especially in the case of solid waste, as the different components of the stream (paper, food waste, wood, etc.) have very different elemental compositions [13,17,18,19]. In future works, a better characterization of the feedstock through audits and interviews should be performed. The mentioned process will be based on plasma gasification, which could potentially represent an alternative to similar waste treatment process with heat recovery, such as incineration, which is common practice on cruise ships; on this matter, LCA (Life Cycle Assessment) studies show that the environmental impacts linked to waste treatment processes could be reduced, compared to incineration, by employing plasma coupled gasification systems [20]. A very limited number of articles investigate the possibility of using plasma gasification on marine vessels; nevertheless, systems like PAWDS (Plasma Arc Waste Destruction System for Land), developed by Pyro Genesis Inc., provided some very useful insights and experimental data on the matter [21]. While the study focusses on waste streams which are in magnitude and composition typical of large marine vessels, it could be possible to use the presented model for a wider variety of applications, such as waste treatment for small communities. The scope of this research work is to lay the fundamental modeling basis for future works, expected to go further in detail on the design process of the system.

Table 1.
Amounts of wastes generated onboard of marine vessels [22,23].

Table 2.
Averaged proximate and ultimate analysis of the waste streams considered [4,17,18,19].
2. Theoretical Background
Below is the average composition of solid waste generated on cruise ships.
Compared to incineration, gasification shows some promising advantages, as the synthetic gas produced by biomasses is very flexible and can be employed in numerous applications, such as methanol, ethanol, hydrogen production and power generation [24]. In order to be employed, syngas must first be cleaned, as it may contain deleterious and harmful compounds, such as hydrogen sulfide (H2S), hydrochloric acid (HCl), ammonia (NH3) and carbonyl sulfide (COS); for this reason, the raw syngas leaving the gasifier is generally treated in a syngas cleaning unit, which is an advantage, as the fuel gas is cleaned before the combustion process and its volume is normally much smaller compared to the volume of the flue gases produced by the incineration, which must also be cleaned from pollutants. Furthermore, one of the main concerns related to incineration is the formation of dioxins, which are toxic chlorinated chemical compounds normally forming in the cold zones of the incinerators in presence of precursors and solid surfaces provided by fly ashes and catalysts like copper [25]. Indeed, the oxygen-starved environment and the higher temperatures linked to the employment of thermal plasmas may help hinder the formation of these compounds, which could be a significant advantage [26]. A significant difference between conventional gasification and thermal plasma gasification is the presence of an external source of heat, the plasma generator, which allows easier control of the reaction conditions thanks to the decoupling of oxidant concentration and the heat needed by the endothermic reaction. One of the main issues related to gasification is the formation of tars, which tend to condense at lower temperatures producing fouling and clogging piping, potentially blocking operations or even reducing the lifetime of components; the presence or reactive species and high temperature in thermal plasmas may help reduce the presence of tars in the raw syngas as in these conditions, the carbonaceous feedstock is strongly decomposed into its basic components [27]. On the other hand, the main disadvantage of plasma gasification is the potential high consumption of electric energy related to the plasma torches [28]. In the literature, several modeling efforts for the investigation of conventional gasification processes are present, while concerning plasma gasification this number is reduced. Mountouris et al. (2006) developed an equilibrium plasma gasification model based on thermodynamic databases, called GasifEq [29], capable of performing energy and exergy analysis to investigate the performances of plasma gasifiers; the results of their simulations show the importance of moisture content (up to 25%), as hydrogen formation is enhanced by steam and gasification temperature, as increasing the temperature from 1073 to 1473 K results in the CO concentration being increased, while H2 concentration is slightly reduced. Minutillo et al. (2009) developed a thermochemical model, EquiPlasmaJet [30], to study the syngas composition and energy balance of an integrated plasma gasification combined cycle (IPGCC) plant fueled by RDF (refuse derived fuel); in their work, air was used as plasma gas, heated to 4000°C by six plasma torches with high power consumptions (4.26–2.75 MW) to produce high lower heating value (LHV) syngas (10.10–9.20 MJ/kg) at high plasma gasification efficiencies (63.6–69.1). The EquiPlasmaJet model was further developed by Minutillo et al. (2011) and coupled to a solid oxide fuel cell (SOFC) electrochemical model to investigate the syngas composition produced in the plasma gasifier of an integrated plasma gasification fuel cell (IPGFC) plant fueled by RDF; the results obtained by the authors are similar to the results of their previous work [31]. Janajreh et al. (2012) compared two models based on conventional and plasma gasification for eight different fuels; the models, based on the minimization of Gibbs free energy, show higher average gasification efficiencies for conventional air gasification, around 72%, compared to plasma gasification, around 42% [32]. Ismail et al. (2019) produced a mathematical model for plasma gasification taking into account phenomena like species transport, continuity, heat transfer, turbulence and chemical reactions [33]; the results of their simulations, which consider forest residues as feedstock, show great agreement with the experimental results and the conclusions of the authors are that low equivalence ratios (ERs) favor H2 and CO concentrations and syngas LHV, high temperatures improve syngas LHV but reduce cold gas efficiency, while higher steam-to-biomass ratios have a positive effect on H2 and cold gas efficiencies but negative effects on CO and LHV. A 2D Euler–Euler multiphase plasma gasification melting (PGM) model for municipal solid waste was developed by Zhang et al. (2017) [34], employing air and steam as plasma gas; the results of the simulation show that high temperature injection of steam affects positively both syngas LHV and cold gas efficiency, higher ERs enhance char conversion and gasification temperature, and the optimum ER is around 0.6; furthermore, they found that plasma power weakly but positively affects syngas yield and LHV [33]. The effects of higher gasification temperatures on municipal solid waste plasma gasification were investigated by Indrawan et al. (2019) through a model developed on Aspen Plus: using air as plasma medium, temperatures from 1500 to 4000 °C were studied and the gasifier performances were compared; the main conclusions are that H2 and CO concentrations increase with temperature, and the same for the syngas LHV, while CO2 concentration and the plasma gas efficiency are negatively affected [35]. Supported by this reference framework, the scope of this study is to lay the basis for a new plasma gasification model, considering as domain not the gasifier itself, but the whole waste conversion process, starting from the preliminary treatment of the feedstock to the cleaning and conversion in electric energy and heat of the produced syngas.
3. Description of the Process
The description of the sub-processes considered is the objective of this section. In fact, the waste gasification by thermal plasma process can be considered the central part of the system. In particular, the main gasification reactions considered are summarized in Table 3. However, auxiliary units are required to enhance syngas yield and to extract useful products in terms of electricity and heat. Thus, the process is split in five units, according to the simplified process flow diagram (PFD) shown in Figure 1:

Table 3.
Gasification reactions and their reaction enthalpy in standard conditions (P = 1 atm, T = 25 °C) [36].
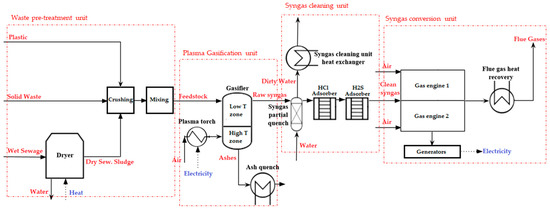
Figure 1.
Process flow diagram of the process model.
- Waste pre-treatment unit
- Plasma gasification unit
- Syngas cleaning unit
- Power production unit
- Heat recovery unit.
Each sub-unit performs a specific function and it is characterized by specific inputs and outputs. Each single unit process is shown in detail as Aspen Plus model diagrams in Figure 2, Figure 3, Figure 4, Figure 5 and Figure 6. The waste pre-treatment unit prepares the feedstock for the subsequent gasification step, by reducing its particle size distribution through shredders and crushers, enhancing this way syngas yield by increasing CO and H2 fractions [37]. Furthermore, aqueous feedstock, such as black waters, which are expected to be physically dewatered beforehand and reduced to a moisture content of 68%, are also treated with a drying step to reduce the moisture content in the feed. The various treated waste streams, which are the input to this unit, are therefore mixed and homogenized and ready to be sent to the gasification unit. The gasifier is the main component of the gasification unit, and in an updraft configuration, it is equipped with the plasma generators at the bottom of the chamber (DC or RF), whose function is to provide the heated plasma gas to the solid feedstock falling. The plasma plumes are expected to be released in proximity of the feedstock, in the high temperature zone, to further enhance the feedstock conversion process. The milled feedstock is rapidly dried and devolatilized upon receiving heat from the departing hot syngas and the plasma, rapidly increasing its temperature and allowing the initiation of gasification reactions in the high temperature zone of the chamber. The raw gas produced due to the reactions tends to ascend, interacting with the fresh feedstock in the low temperature zone. The raw syngas then leaves from the top of the gasifier. The remaining solid part is generally composed of bottom ashes which can be molten depending on the gasification temperature. As already mentioned, the raw syngas must be cleaned, and the methods vary depending on the size of the system and the gasification conditions. Cold syngas cleaning is usually performed in very large plants, where abundant streams of water can be used to quench the syngas to low temperatures to remove contaminants, such as H2S, HCl and NH3, by dissolution in water and by making use of wet towers, scrubbers and cyclones. While this approach is easier, efficiency penalties are linked to the cooling process, making it unfeasible for smaller plants [38]. In this study, hot syngas cleaning is considered, as the process is performed at higher temperatures by making use of sorbents and catalysts which must be regenerated or substituted after some time of operation. The advantage is of course the avoided necessity of totally cooling the gas and the reduction of wastewater produced, while some disadvantages are linked to the increased expected costs and possibility of catalyst deactivation [26]. In this study, the syngas cleaning unit will be composed by a partial quench for both partial cooling and particle matter removal, an HCl removal stage and an H2S removal stage. After cleaning, the gas is sent to the power generation unit comprising of two internal combustion engines, where it is mixed with air and readily combusted, converting its chemical energy into thermal energy and subsequently, thanks to the thermal expansion of the gas, into mechanical energy. Two coupled generators convert in turn the mechanical energy in electricity, while the flue gases are released to the atmosphere after recovering heat from them. In fact, this is the goal of the heat recovery unit, which recovers heat not only from the flue gases, but also from the syngas cleaning unit and the molten ash quench. While the electricity produced should be used to balance the energy requirements of the plasma generators, the heat recovered may be used to aid the heating, ventilation and air conditioning (HVAC) systems on the ship or to pre-heat the highly viscous HFOs heavy fuel oil (HFOs) employed in the main engines. The toxicity of the solidified molten ashes should be assessed, as the possibility of using them as construction materials could be a further benefit [39].
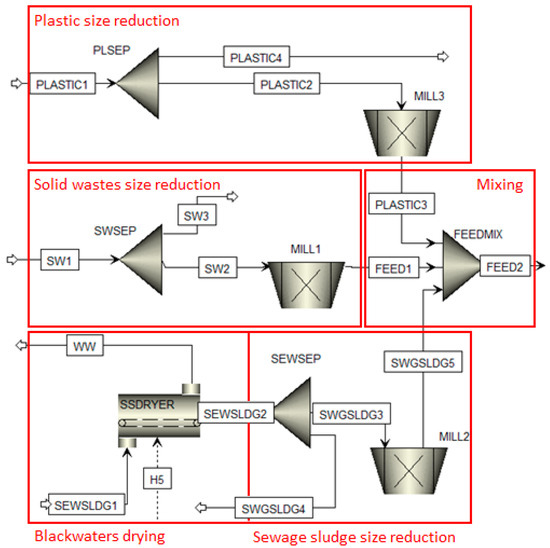
Figure 2.
Waste pre-treatment unit.
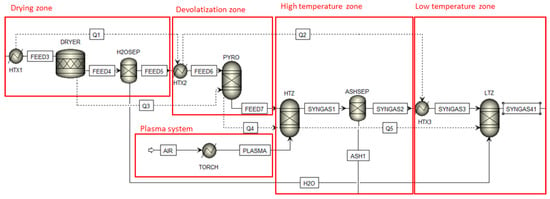
Figure 3.
Gasification unit.
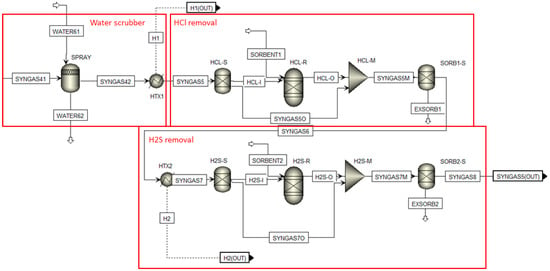
Figure 4.
Syngas cleaning unit.
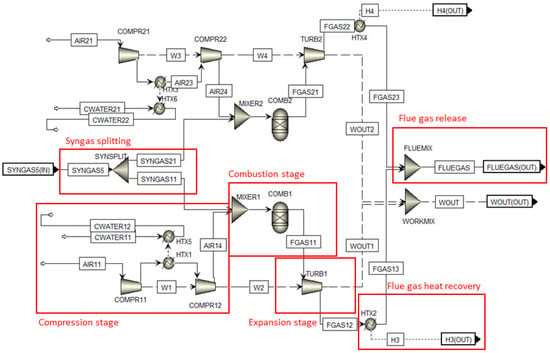
Figure 5.
Energy conversion unit.
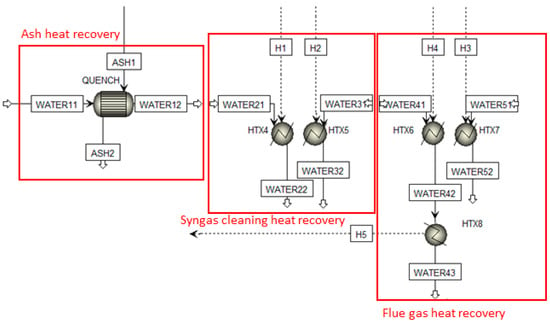
Figure 6.
Heat recovery unit.
4. Modeling and Simulation
Having described in the previous section the general process, its advantages compared to incineration and the sub-processes modeled, it is time now to describe the model itself and the simulations performed. The model was developed on the software Aspen Plus, while the results of the simulation were post-processed on MATLAB.
General Assumptions:
- The model is 0D thermodynamic and predicts thermodynamics for pyrolysis and gasification reactions;
- The gasification process occurs at steady state condition and atmospheric pressure;
- The gasification reaction is isothermal and at a constant volume;
- Gasifier feedstock has perfect mixing and uniform temperature distribution;
- Tar and char formation are negligible and ignored in the simulation;
- Dioxins, furans, tars and heavy metals were not modeled based on the limitations of the software, in future works their generation should be assessed through experimental efforts;
- Main final products for solid waste gasification takes place instantaneously and identified volatile products are H2, CO, CO2, CH4 and H2O;
- Ideal activity coefficient model for the liquid phase (activity coefficient = 1) and ideal mixing in liquids;
- Ideal gas equation of state is used for the vapor phase;
- The fixed parameters of the process, such as the drying and decomposition temperature, are based on literature typical values and were optimized to increase the efficiency of the system.
The fixed operational parameters are summarized in Table 4, average values are calculated over all the simulations although the variations are small.

Table 4.
Fixed process parameters.
Waste Pre-Treatment Assumptions:
- The feedstock is introduced at ambient conditions, 1 bar and 25°C;
- An initial particle size distribution (PSD) is assumed for the un-treated wastes, a medium particle width of 20 cm and a standard deviation of 15 cm;
- A final particle size distribution (PSD) is assumed for the treated waste, a medium particle width of 0.3 cm and a standard deviation of 0.05 cm;
- Moisture is partially removed (from 68% to 20%) from sewage sludge in the drying process and the resulting water is removed.
In the waste pre-treatment unit, three non-conventional solid streams were defined for plastics, sewage sludge and solid wastes. The assumed composition of the stream in terms of sewage sludge and plastic fraction is defined through the three FSplit blocks, which drive away the unused portions of the waste streams, in order to reach the target composition. Crusher blocks are used to reduce the particle size of the solid streams, while the Dryer block uses the heat recovered from the recovery system (H5) to dry the sewage sludge with high moisture content. The three treated streams are then mixed through a Mixer block, as shown in Figure 2.
For the next unit, the modeling efforts were inspired by the work of Janajreh, Raza and Valmundsson [39].
Gasification Reaction Assumptions:
- Gasification and combustion reactions, as well as the chemical removal of contaminants are modeled through Gibbs reactors, which minimize the Gibbs free energy;
- The gasifier is spit in two zones, the high temperature zone (bottom) and the low temperature zone (top), which are considered isothermal during the simulations;
- The ICP generators parameters and operation conditions were obtained from COMSOL simulations and not from any commercially available device, although some examples of high power ICP generators can be found [40];
- The air/fuel ratio is optimized to obtain the highest syngas LHV, as described process that is described in chapter 5.
The feedstock stream is sent to the gasification unit, and the gasification process is split in four separated steps. The thermal requirements for gasification (i.e., LHV from 5254 to 5976 kJ/kg). Therefore, 75 KW thermal plasma system can gasify 12–14 kg of solid waste. First, the feedstock is heated and dried by making use an RStoic reactor, then the non-conventional feed is further heated and fully decomposed to its basic components in a RYield reactor, according to the ultimate and proximate analysis of the waste. This decomposed stream is mixed with the air coming from the plasma torches into a high temperature RGibbs reactor. In this high temperature zone, the main gasification reactions take place, and heat is provided by the ICP torch, which is modeled as a heat exchanger block, with an imposed average plasma temperature of 4000 °C. In particular, a maximum of five plasma torches was considered, for a maximum of 270 kg/hr of gasification air. The air mass flow rate is varied as a function of the feedstock mass flow rate, as discussed in Section 5. The maximum power consumption of five plasma torches is 375 KW. The syngas produced, before leaving for the syngas cleaning unit, reacts with the steam released from the drying process in the low temperature zone of the chamber, which is modeled as a second RGibbs reactor, while the ashes are removed from the bottom of the chamber using a Sep block, as shown in Figure 3. As already mentioned, the ICP plasma generator (radio-frequency powered torch) was modeled on COMSOL, but the details of the model are not described as the scope of this work is focused on the overall waste treatment process; it must be noted that this is not a final design choice. ICP torches could be substituted by other plasma technologies, such as DC non-transferred torches, which are more readily available at higher powers compared to RF torches [41]. One of the main disadvantages of DC plasma torches is the short lifetime of the cathode due to erosion, which could be a critical issue impacting negatively the reliability of the system [42].
The hot raw syngas, leaving the chamber at around 800 °C, is initially cleaned by particulate matter and cooled through a water spraying tower, using a Flash2 block. After that, H2S and HCl removal is modeled using two RGibbs reactors in which the contaminants are made react with sorbent streams of ZnO and Na2CO3, according to the following reactions:
The use of RGibbs reactors implies the assumption of long enough time of residence of the gas in presence of sorbents. This ensures strong reduction of contaminants, while for increased loyalty of the model kinetics of the reactions should also be considered. HCl is removed at 450°C, temperature chosen according to the literature, while H2S, which is the last cleaning stage, is removed at 400°C according to the technical information of commercial ZnO absorbents. The syngas cleaning unit is shown in Figure 4.
The cleaned syngas is now fed to two internal combustion engines modeled following the technical specifics of the SGE-24HM (1800 rpm) gas engines by Siemens. The compression and expansion stages are modeled using the Compressor and Turbine blocks. The syngas is mixed with air before of the combustion step using a Mixer block, while the combustion is modeled using a RGibbs reactor block. The combustion temperature reaches around 1500 °C, depending on the equivalence ratio and the lower heating value of the syngas produced. The flue gases, after the heat recovery, are discharged to the atmosphere at 150 °C, as shown in Figure 5.
The heat recovery unit is mainly composed by Heat Exchanger blocks that simply retrieve heat from the gas engine flue gases, the cooling processes in the syngas cleaning unit and the ash quenching, as shown in Figure 6.
The model described so far has been used to simulate four scenarios of operation in which the fractions of the three waste streams has been changed in order to investigate the effects related to the variations of composition of the feedstock. As mentioned, solid wastes including unrecyclable plastics and sewage sludge are strictly considered, as these are the most significant waste streams in terms of quantity and volume occupied; however, the model could be potentially integrated to treat for example oily sludge and hazardous wastes too, supposing that their proximate and ultimate analysis is provided. The details of the four scenarios are summarized in Table 5.

Table 5.
Scenarios description.
5. Results and Discussions
In this chapter, the results obtained from the simulations, which were performed according to the four scenarios earlier described, are presented. The following results were optimized according to the data obtained from sensitivity analysis, which were performed on key parameters, such as syngas composition, mechanical power produced and combustion temperature as a function of the gasification air, sorbent consumption and combustion air. In fact, the approach followed was the following: since the results of the bottom processes (power generation) are influenced by the conditions of the top processes (gasification and syngas cleaning), for every feedstock composition investigated, four simulations were performed with the objective of optimizing the following quantities, in order: gasification air mass flowrate, sorbents mass flowrates and combustion air mass flowrate. The optimized values of gasification air and combustion air mass flowrates, averaged over all the simulations of each scenario, are shown in Table 6.

Table 6.
Plasma air mass flow rate and operational parameters.
With the final optimized results, it was possible to estimate key quantities such as the cold gas efficiency, which gives an indication of the gasification efficiency, defined as
where LHV indicates the lower heating value of the syngas or the feedstock, m the mass flowrates, Pel the electrical power provided to the excitation coils of the ICP generator and ηel is the average electric power plant efficiency, assumed as 31.55% [32]. This process was performed for each of the four scenarios. The results are presented as figures showing the trends of some parameters of practical importance, as a function of the equivalence ratio or the feedstock composition. The equivalence ratio is defined as
where the value A/F indicates the air-to-fuel ratio in actual and stoichiometric conditions. The results presented to the readers are the following: the syngas composition, mainly in terms of CO and H2, to show in which conditions the highest syngas yield is obtained; the mechanical power (and thus the electrical power) produced by the gas engine, which is crucial for the energy balance of the system; the combustion temperature, which can be important to investigate thermal stresses on the engine components; the LHV, calculated on the basis of the chemical composition of the stream, is useful to give further characterization to the feedstock and the syngas, which is also needed to calculate the cold gas efficiency [41,42]; the sorbent consumption is linked to the costs for cleaning the syngas, as higher sorbent consumption rates would imply larger expenses; the heat recovered is also a potential useful product of the process.
The results of scenario 1 show that, for the model described, there is an optimal gasification equivalence ratio in the region where the molar fractions of H2 and CO are the highest, around ER = 0.21 as shown in Figure 7a. The molar concentrations in these conditions are, respectively, 34.7% for H2 and 28.6% for CO. Figure 7b shows instead the mechanical power produced (with negative sign) as a function of the combustion equivalence ratio, and in this case too there is an optimum condition; however, the combustion temperatures should also be taken into account as high temperatures could induce damages to the components of the engine. The cold gas efficiency does not show appreciable differences (Figure 8a), as values vary around the mean 49.45%, while an important result is the one displayed in Figure 8b, in which the electric power produced by the system, as a function of the feedstock mass flow rate, is plotted against a curve representing the electrical power demand of the plasma generators (red curve). According to this model, by increasing the feedstock mass flow rate, the excess electrical power increases as well, and two operational limits are identified: the maximum feedstock flowrate (425 kg/hr) corresponds to the maximum plasma gas flowrate (270 kg/hr) available to the system, while the minimum feedstock mass flowrate corresponds to the condition of electric balance, which is around 30 kg/hr, but considering only the torches as consumers; this limit will probably shrink when considering a potential real system due to the presence of auxiliary consumers such as pumps and control systems. The electrical power was evaluated from the mechanical power produced based on the technical information provided by Siemens on the electric efficiency of the generator, which is equal to 0.966.
The results of scenario 2 show the effects related to the introduction of sewage sludge into the feedstock. In particular, Figure 9a displays an increase to the CO molar fraction with increasing sewage percentage, while H2 remains relatively the same. At 33.3% of sewage sludge, the molar fraction of CO reaches 31.7%. This is mainly reflected into the slight increase in syngas LHV, while the biomass LHV is reduced (Figure 10a), and as consequence, according to the definition presented earlier, the cold gas efficiency sharply increases (Figure 10b), to a maximum of 54.6%. Due to the higher sulfur content in sewage, the increased ZnO consumption is expected, with the highest value being 4.3kg/hr, as shown in Figure 11a, while the Na2CO3 consumption remains relatively constant (~0.7 kg/hr). As last consideration, the mechanical power produced does not change strongly with the sewage fraction increase, as shown in Figure 9b, while the heat recovered sensibly drops, as part of this heat is redirected for the sewage sludge drying process, which is more demanding for higher sewage sludge mass flowrates (Figure 11b).
With scenario 3, similarly, the effects of plastic integration into the main feedstock stream are investigated. The higher content of C and H in the plastic feedstock not only sharply increases the LHV of the waste stream, but it also increases the LHV of the syngas (Figure 12a), as both the molar concentrations of H2 and CO increase with increasing plastic fraction, as shown in Figure 13a; indeed, at 16.7% of plastic content the molar concentrations of H2 and CO are, respectively, 36.8% and 34.1%, while the feedstock LHV reaches 21.25 MJ/kg and the syngas LHV 9.44 MJ/kg. As consequence the cold gas efficiency is increased, to a maximum of 52.21%, while the ZnO consumption is slightly reduced, as less sulfur is present in the feedstock: 1.2 kg/hr against the 1.4 kg/hr of scenario 1 (Figure 12b and Figure 14a). Compared to scenario 2 the production of heat is enhanced due to the increased syngas LHV, and this is also the case for the mechanical power, which shows a strong dependence on the plastic content: at 16.7% plastic content the mechanical power is affected by a +33.21% increase compared to the solid waste only scenario (Figure 13b), while the heat recovered is affected by a +36.21% increase (Figure 14b).
The effects observed in the previous two scenarios are also observed in scenario 4, as the disadvantages observed due to the introduction of sewage sludge are compensated by the integration of plastics. This is especially evident in Figure 15b, as the heat used for the sewage sludge drying process is compensated by the higher syngas LHV (Figure 16a). In fact, compared to scenario 1, at 16.7% of plastic and 33.3% of sewage sludge, the mechanical power is increased by +32.19%, while the heat recovered by +23.66%. The mechanical power trend can be observed in Figure 17a,b too, as the maximum reached is 535.4 kW. This is also the scenario that reaches the higher value of cold gas efficiency (equal to 58.65%), as shown in Figure 16b, corresponding to the minimum content of solid waste in the feedstock, equal to 50% (or 150 kg/hr). The sorbent consumption behavior is very similar to scenario 2, with an increasing consumption of ZnO and a relatively constant Na2CO3 consumption (Figure 15a): the ZnO consumption rate is equal to 4.3 kg/hr. Naturally, the enhanced LHV is a consequence of the increased H2 and CO molar fraction, effects already observed in the previous scenarios, which are also evident in Figure 18a,b; corresponding to 16.7% of plastic and 33.3% of sewage sludge, for ER = 0.21, the molar compositions of H2 and CO are 36.9% and 37%.
Overall, the results demonstrate theoretical high feedstock flexibility for the system modeled, and the possibility of self-sustaining the process by feeding part of the electrical power produced to the plasma generators systems. The surplus electric power could be used to power auxiliary components, which were not considered in the model, or it can be transferred to the grid; the system may benefit working with higher feedstock flow rates. The heat recovered could be used to cover the thermal needs of other applications, such as the fuel pre-heating systems which are usually present on big marine vessels. Possible improvements to the system could be the implementation of a two-stage process, in which plasma technologies are employed for the post-treatment of the gas, potentially increasing conversion efficiencies [43].
Scenario 1
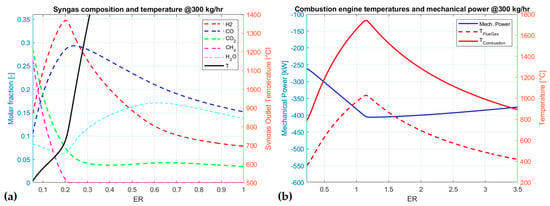
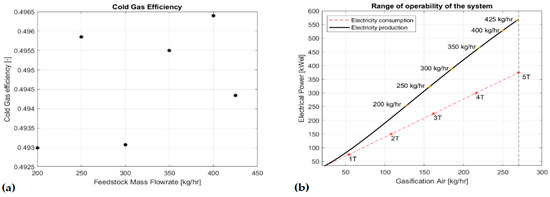

Figure 7.
(a) Syngas composition and temperature as a function of the gasification ER; (b) mechanical power and gas engine temperatures as a function of the combustion equivalence ration (ER) (@ 300 kg/hr of solid wastes).

Figure 8.
(a) Cold gas efficiency as a function of the feedstock mass flow rate; (b) Electrical power as a function of.
Scenario 2
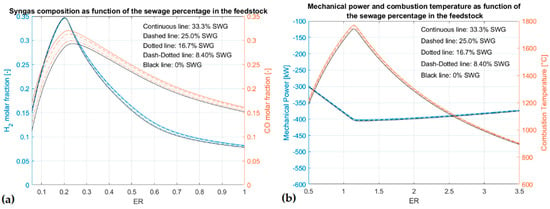
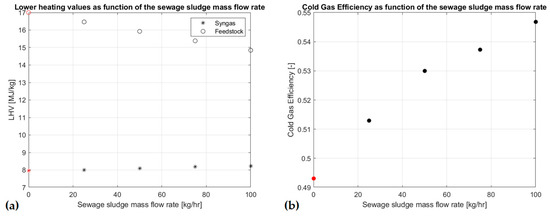
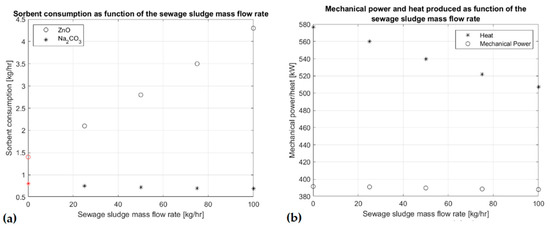

Figure 9.
(a) H2 and CO molar fractions as a function of sewage fraction and gasification ER; (b) Mechanical power and combustion temperature as a function of the sewage fraction and combustion ER.

Figure 10.
(a) Syngas and feedstock lower heating value (LHV) as a function of sewage fraction; (b) cold gas efficiency as a function of the sewage fraction.

Figure 11.
(a) Sorbent consumption as a function of sewage fraction; (b) mechanical power and heat recovered as a function of sewage fraction.
Scenario 3
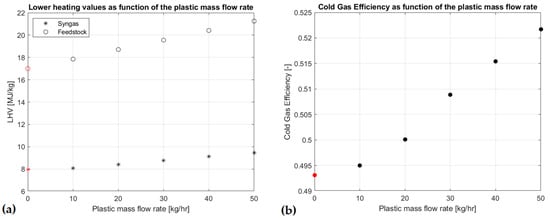
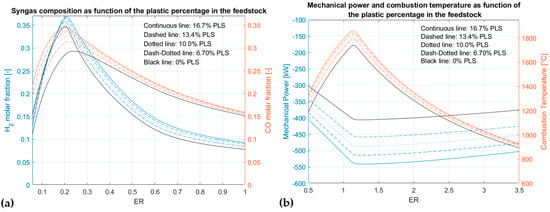
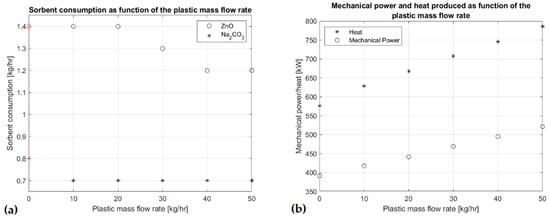

Figure 12.
(a) Syngas and feedstock LHV as a function of plastic fraction; (b) cold gas efficiency as a function of the plastic fraction.

Figure 13.
(a) H2 and CO molar fractions as a function of plastic fraction and gasification ER; (b) Mechanical power and combustion temperature as a function of the plastic fraction and combustion ER.

Figure 14.
(a) Sorbent consumption as a function of plastic fraction; (b) mechanical power and heat recovered as a function of plastic fraction.
Scenario 4
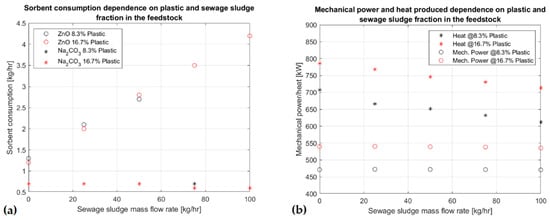
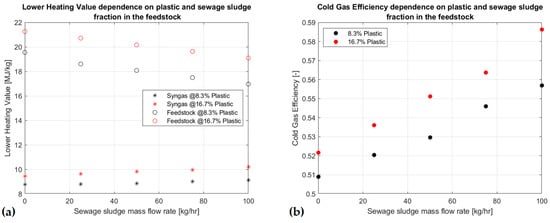
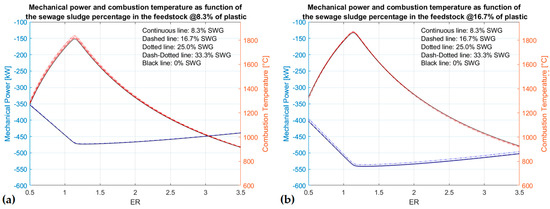
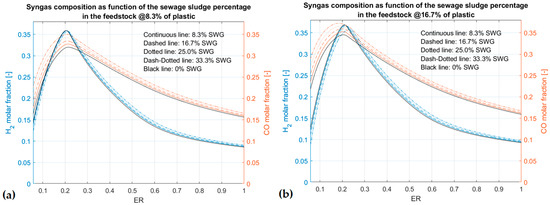

Figure 15.
(a) Sorbent consumption as a function of plastic and sewage fraction; (b) mechanical power and heat recovered as a function of plastic and sewage fraction.

Figure 16.
(a) Syngas and feedstock LHV as a function of plastic and sewage fraction; (b) cold gas efficiency as a function of plastic fraction and sewage fraction.

Figure 17.
Mechanical power and combustion temperature as a function of the sewage fraction and combustion ER at (a) 8.3% of plastic and (b) 16.7% of plastic.

Figure 18.
H2 and CO molar fractions as a function of sewage fraction and gasification ER at (a) 8.3% of plastic and (b) 16.7% of plastic.
6. Conclusions
In conclusion, in this study some of the waste streams generated on large marine vessels, especially cruise ships, were investigated in order to collect the necessary data to be fed to the developed plasma gasification model described in the subsequent sections. Main environmental impacts related to the improper management of the waste streams were discussed, while the main attention was given to solid wastes, plastics and sewage sludge as feedstock for the plasma gasification unit. The principles and the possible advantages of plasma gasification were also briefly discussed. The plasma gasification process was described in its five fundamental sub-units: waste pre-treatment unit, gasification unit, syngas cleaning unit, power generation and heat recovery units. The entire process was modeled using the software Aspen Plus, and four scenarios of interest were investigated, corresponding to the different compositions of the feedstock. The first scenario, concerning a pure stream of solid wastes, was used to obtain information on the range of operability of the system in conditions of net gain of electric power: the value obtained for the feedstock mass flow rate were 30 kg/h as lower limit and 425 kg/h as higher limit, defined by the capability of the plasma generators ensemble to provide the needed gasification air. Scenario 2 and 3 investigated the effects of the integration of, respectively, sewage sludge and plastic into the main stream. The consequences observed were the following: sewage sludge tends to reduce the heat recovered from the system, while maintaining around the same production of electric power. The costs related to the sorbents consumption for the H2S removal are expected to be increased; however, the gasification efficiency is effectively increased. Plastic integration appears more promising, as it clearly enhances heat recovery, electricity generation and gasification efficiency while maintaining the expected costs relative to sorbent consumption around equal to the one of scenario 1. The objective of scenario 4 was to compensate the negative effects of sewage sludge introduction with plastics, and this was effectively achieved as the heat recovered was increased, while the sorbent consumption rate remained relatively equal to scenario 2. Another important result of scenario 4 was the sharply increased cold gasification efficiency, which reached the highest value among all the simulations at 33.3% of sewage sludge, 16.7% of plastic and 50% of solid wastes, equal to 58.65%. Overall, while the model obtained interesting results through the simulations performed in terms of feedstock flexibility and operational conditions, there is still room for improvement. In particular, future works are expected to include spatial and time dependence on the processes considered to allow the sizing of the components and even economic considerations; furthermore, the syngas cleaning model should be improved to take into account the kinetics of the chemical reactions and dedicated models for the analysis of the tars production and conversion could be envisioned. It is expected that future research work will use the described model to perform comparisons between different waste-to-energy (WTE) technologies and process configurations, such as incineration, which is the standard waste volume minimization approach on large marine vessels. This model and future improvements would need to be validated through an experimental apparatus, which could allow to investigate complex issues, such as dioxin generation, heavy metal transport, molten ashes toxicity and the effect of free radicals on the efficiency of the gasification process.
Author Contributions
H.A.G. and D.L. have designed simulation model and wrote the paper. M.A., V.D. and I.H. have done simulation work and revised the paper. All authors have read and agreed to the published version of the manuscript.
Funding
This research was funded by Proflange Ltd., a leading Canadian stainless manufacturing company for industrial applications.
Acknowledgments
The authors would like to thank ProFlange and OCE for the support of this research work. Also, authors would like to thank members of Advanced Plasma Engineering Lab (APEL) at Ontario Tech University for their support.
Conflicts of Interest
The authors declare no conflict of interest.
Abbreviations
| ER | Equivalence Ratios |
| ICP | Inductively Coupled Plasma |
| IMO | International Maritime Organization |
| LHV | Lower Heating Value (kJ/mol) |
| PAWDS | Plasma Arc Waste Destruction System for Land |
| PFD | Process Flow Diagram |
| Pel | Electrical Power Provided to the Excitation Coils of the ICP Generator |
| ηel | Average Electric Power Plant Efficiency |
| WTE | Waste to Energy |
| ZnO | Zinc Oxide |
References
- Parks, M.; Ahmasuk, A.; Compagnoni, B.; Norris, A.; Rufe, R. Quantifying and mitigating three major vessel waste streams in the northern Bering Sea. Mar. Policy 2019, 106, 103530. [Google Scholar] [CrossRef]
- Kwortnik, R.J. Shipscape influence on the leisure cruise experience. Int. J. Cult. Tour. Hosp. Res. 2008, 2, 2289–2311. [Google Scholar] [CrossRef]
- Argüello, G. Environmentally sound Management of Ship Wastes: Challenges and opportunities for European ports. J. Shipp. Trade 2020, 5, 1–21. [Google Scholar] [CrossRef]
- Agamuthu, P.; Mehran, S.B.; Norkhairah, A.; Norkhairiyah, A. Marine debris: A review of impacts and global initiatives. Waste Manag. Res. 2019, 37, 987–1002. [Google Scholar] [CrossRef]
- Sweeting, J.E.N.; Wayne, S.L. A shifting tide: Environmental challenges and cruise industry responses. In Cruise Ship Tourism; CABI: Wallingford, UK, 2006; ISBN 1845930487. [Google Scholar]
- To, N.T.; Kato, T. Solid waste generated from ships: A case study on ship-waste composition and garbage delivery attitudes at Haiphong ports, Vietnam. J. Mater. Cycles Waste Manag. 2017, 19, 988–998. [Google Scholar] [CrossRef]
- Sanches, V.M.L.; da Aguiar, M.R.C.M.; de Freitas, M.A.V.; Pacheco, E.B.A.V. Management of cruise ship-generated solid waste: A review. Mar. Pollut. Bull. 2020, 151, 110785. [Google Scholar] [CrossRef]
- Cerveny, L.K.; Miller, A.; Gende, S. Sustainable cruise tourism in marine world heritage sites. Sustainability 2020, 12, 611. [Google Scholar] [CrossRef]
- Klein, R.A. Responsible cruise tourism: Issues of cruise tourism and sustainability. J. Hosp. Tour. Manag. 2011, 18, 107–116. [Google Scholar] [CrossRef]
- Carić, H.; Mackelworth, P. Cruise tourism environmental impacts—The perspective from the Adriatic Sea. Ocean Coast. Manag. 2014, 102, 350–363. [Google Scholar] [CrossRef]
- Galloway, T.S. Micro- and nano-plastics and human health. In Marine Anthropogenic Litter; Springer Nature: London, UK, 2015; ISBN 9783319165103. [Google Scholar]
- International Maritime Organization. Guidelines for Formal Safety Assessment (FSA) for Use in the IMO Rule-making Process; International Maritime Organization: London, UK, 2002. [Google Scholar]
- Wilhelmsson, D.; Thompson, R.C.; Holmström, K.; Lindén, O.; Eriksson-Hägg, H. Marine Pollution. In Managing Ocean Environments in a Changing Climate: Sustainability and Economic Perspectives; Elsevier: San Diego, CA, USA, 2013; ISBN 9780124076686. [Google Scholar]
- Faber, J.; Markowska, A.; Nelissen, D.; Davidson, M.; Eyring, V.; Cionni, I.; Selstad, E.; Kågeson, P.; Lee, D.; Buhaug, Ø.; et al. Technical Support for European Action to Reducing Greenhouse Gas Emissions from International Maritime Transport; CE Delft: Delft, The Netherlands, December 2009. [Google Scholar]
- Bungay, V.C. Kinetic study on the pyrolysis and gasification of plastic waste. Chem. Eng. Trans. 2017, 56, 193–198. [Google Scholar]
- Suhrhoff, T.J.; Scholz-Böttcher, B.M. Qualitative impact of salinity, UV radiation and turbulence on leaching of organic plastic additives from four common plastics—A lab experiment. Mar. Pollut. Bull. 2016, 102, 84–94. [Google Scholar] [CrossRef]
- Zhou, H.; Meng, A.; Long, Y.; Li, Q.; Zhang, Y. Classification and comparison of municipal solid waste based on thermochemical characteristics. J. Air Waste Manag. Assoc. 2014, 64, 597–616. [Google Scholar] [CrossRef]
- Sever Akdağ, A.; Atak, O.; Atimtay, A.T.; Sanin, F.D. Co-combustion of sewage sludge from different treatment processes and a lignite coal in a laboratory scale combustor. Energy 2018, 158, 417–426. [Google Scholar] [CrossRef]
- Zhou, H.; Meng, A.; Long, Y.; Li, Q.; Zhang, Y. An overview of characteristics of municipal solid waste fuel in China: Physical, chemical composition and heating value. Renew. Sustain. Energy Rev. 2014, 36, 107–122. [Google Scholar] [CrossRef]
- Ramos, A.; Teixeira, C.A.; Rouboa, A. Environmental assessment of municipal solid waste by two-stage plasma gasification. Energies 2019, 12, 137. [Google Scholar] [CrossRef]
- Rao, L.; Rivard, F.; Carabin, P. Thermal plasma torches for metallurgical applications. In Proceedings of the 4th International Symposium on High-Temperature Metallurgical Processing, TMS 2013 Annual Meeting and Exhibition, San Antonio, TX, USA, 3–7 March 2013. [Google Scholar]
- Vaneeckhaute, C.; Fazli, A. Management of ship-generated food waste and sewage on the Baltic Sea: A review. Waste Manag. 2020, 102, 12–20. [Google Scholar] [CrossRef]
- Iannello, A.; Bertagna, S.; Pozzetto, D.; Toneatti, L.; Zamarini, R.; Bucci, V. Technical and economic and environmental feasibility of an innovative integrated system of management and treatment of waste on board. In Proceedings of the 19th International Conference on Ship & Maritime Research-NAV, Trieste, Italy, 20–22 June 2018. [Google Scholar]
- Ruj, B.; Ghosh, S. Technological aspects for thermal plasma treatment of municipal solid waste—A review. Fuel Process. Technol. 2014, 126, 298–308. [Google Scholar] [CrossRef]
- Mohareb, A.K.; Warith, M.A.; Diaz, R. Modelling greenhouse gas emissions for municipal solid waste management strategies in Ottawa, Ontario, Canada. Resour. Conserv. Recycl. 2008, 52, 1241–1251. [Google Scholar] [CrossRef]
- Lombardi, L.; Carnevale, E.; Corti, A. A review of technologies and performances of thermal treatment systems for energy recovery from waste. Waste Manag. 2015, 37, 26–44. [Google Scholar] [CrossRef]
- Li, J.; Liu, K.; Yan, S.; Li, Y.; Han, D. Application of thermal plasma technology for the treatment of solid wastes in China: An overview. Waste Manag. 2016, 58, 260–269. [Google Scholar] [CrossRef]
- Heberlein, J.; Murphy, A.B. Thermal plasma waste treatment. J. Phys. D Appl. Phys. 2008, 41, 053001. [Google Scholar] [CrossRef]
- Mountouris, A.; Voutsas, E.; Tassios, D. Solid waste plasma gasification: Equilibrium model development and exergy analysis. Energy Convers. Manag. 2006, 47, 1723–1737. [Google Scholar] [CrossRef]
- Minutillo, M.; Perna, A.; Di Bona, D. Modelling and performance analysis of an integrated plasma gasification combined cycle (IPGCC) power plant. Energy Convers. Manag. 2009, 50, 2837–2842. [Google Scholar] [CrossRef]
- Jannelli, E.; Minutillo, M.; Perna, A. Experimental characterization and numerical modeling of PEMFC stacks designed for different application fields. Fuel Cells 2011, 11, 838–849. [Google Scholar] [CrossRef]
- Janajreh, I.; Raza, S.S.; Valmundsson, A.S. Plasma gasification process: Modeling, simulation and comparison with conventional air gasification. Energy Convers. Manag. 2013, 65, 801–809. [Google Scholar] [CrossRef]
- Ismail, T.M.; Monteiro, E.; Ramos, A.; El-Salam, M.A.; Rouboa, A. An Eulerian model for forest residues gasification in a plasma gasifier. Energy 2019, 182, 1069–1083. [Google Scholar] [CrossRef]
- Zhang, Q.; Dor, L.; Biswas, A.K.; Yang, W.; Blasiak, W. Modeling of steam plasma gasification for municipal solid waste. Fuel Process. Technol. 2013, 106, 546–554. [Google Scholar] [CrossRef]
- Indrawan, N.; Mohammad, S.; Kumar, A.; Huhnke, R.L. Modeling low temperature plasma gasification of municipal solid waste. Environ. Technol. Innov. 2019, 15, 100412. [Google Scholar] [CrossRef]
- Gabbar, H.A.; Aboughaly, M.; Ayoub, N. Comparative study of MSW heat treatment processes and electricity generation. J. Energy Inst. 2017, 91, 481–488. [Google Scholar] [CrossRef]
- Tan, S.T.; Ho, W.S.; Hashim, H.; Lee, C.T.; Taib, M.R.; Ho, C.S. Energy, economic and environmental (3E) analysis of waste-to-energy (WTE) strategies for municipal solid waste (MSW) management in Malaysia. Energy Convers. Manag. 2015, 102, 111–120. [Google Scholar] [CrossRef]
- Abdoulmoumine, N.; Adhikari, S.; Kulkarni, A.; Chattanathan, S. A review on biomass gasification syngas cleanup. Appl. Energy 2015, 155, 294–307. [Google Scholar] [CrossRef]
- Young, G.C. Municipal Solid Waste to Energy Conversion Processes: Economic, Technical, and Renewable Comparisons; Wiley: Hoboken, NJ, USA, 2010; ISBN 978-0-470-53967-5. [Google Scholar]
- Gabbar, H.A.; Aboughaly, M.; Damideh, V.; Hassen, I. RF-ICP thermal plasma for thermoplastic waste pyrolysis process with high conversion yield and tar elimination. Processes 2020, 8, 281. [Google Scholar]
- Gabbar, H.A.; Aboughaly, M.; Stoute, C.A.B. DC thermal plasma design and utilization for the low density polyethylene to diesel oil pyrolysis reaction. Energies 2017, 10, 784. [Google Scholar] [CrossRef]
- Arena, U. Process and technological aspects of municipal solid waste gasification. A review. Waste Manag. 2012, 32, 625–639. [Google Scholar] [CrossRef]
- Taylor, N.; Cortes, P. Lessons learnt from ITER safety & licensing for DEMO and future nuclear fusion facilities. Fusion Eng. Des. 2014, 89, 1995–2000. [Google Scholar]
© 2020 by the authors. Licensee MDPI, Basel, Switzerland. This article is an open access article distributed under the terms and conditions of the Creative Commons Attribution (CC BY) license (http://creativecommons.org/licenses/by/4.0/).