Article

Determination of Modules in Pleasurable Design to Fulfil Customer Requirements and Provide a Customized Product in the Food Industry

by
Endang Retno Wedowati
1,2,
Moses Laksono Singgih
1,* and
I Ketut Gunarta
1
1
Department of Industrial and Systems Engineering, Institut Teknologi Sepuluh Nopember (ITS), Surabaya 60111, Indonesia
2
Department of Agroindustrial Technology, Universitas Wijaya Kusuma Surabaya, Surabaya 60225, Indonesia
*
Author to whom correspondence should be addressed.
Submission received: 18 December 2019 / Revised: 21 February 2020 / Accepted: 23 February 2020 / Published: 1 March 2020

Abstract

:
Customers’ needs and wants with regard to dairy products are increasingly diverse, and companies must be able to produce a variety of products. This study aimed to obtain alternative product configurations in accordance with customer requirements and to determine the types of modules required to realize the product by synergizing conjoint analysis and the decision-making trial and evaluation laboratory (DEMATEL) method. The product configuration was based on pleasurable design consisting of three aspects, namely functionality, usability, and pleasure. Pleasurable design was chosen because it involves the human in the product design as a product user so that the product design is in accordance with customer expectations. The research used the survey method with consumers of ice cream. Descriptive analysis was used to describe the product attributes desired by consumers. Orthogonal design was used to construct alternative product configurations, while the product configuration rank was determined using conjoint analysis. Based on the results of the research, the selected attributes for the functionality aspects were taste and texture, the selected attributes for the usability aspects were shape and packaging materials, and the selected attributes for the pleasure aspects were health benefits and appearance. The orthogonal design results led to 25 alternative product configurations, followed by determination of the ranking of alternative product configurations. Then the DEMATEL method was applied to analyse the relationship between the product configuration attributes to determine the types of modules that must be provided.

1. Introduction

Customers’ needs and wants change over time and tend to become more diverse in terms of design, quality, and delivery process [1,2,3]. As the needs and wants of customers are increasingly diverse, companies must be able to produce a variety of products.
This is in line with production patterns in the food processing industry, which is characterized by different product structures, where a number of raw materials are used to produce different types of end products according to customer demand [2]. Therefore, it becomes inefficient to produce various types of end products separately. A common way to reduce the effects of different types of products on the operational performance of food-processing production systems is to produce some or all of the end products by combining selected intermediate products [4,5]. The patterns of production in the food industry allow the production of a variety of products. A variety of products can be realized by applying the concept of mass customization (MC). Therefore, the industry needs to realize efficient manufacturing network configurations to deal with the combination of the MC paradigm and the volatility of globalized heterogeneous markets [6].
The concept of MC was first introduced by [7]. MC is defined as the ability to provide products and services that are individually tailored to each customer through high process agility, flexibility, and integration [8]. According to [9], MC is a production system that uses cost and speed as well as mass production to meet customers’ needs for products or services individually, or it can be described as a production system that combines mass production with individual demand.
Production systems are driven by changes in the environment in which a manufacturing process operates, change character, and grow in a pattern at all times. The most commonly used production systems are craft production, American production, mass production, lean production, mass customization and global manufacturing [10]. This paradigm still operates in various industrial sectors. However, today’s research focus on strategies and methods for dealing with the development of products, processes, and production systems to support lean production, mass customization and product personalization systems [11].
The success of MC depends on several things, namely: consumer demand for variation and customization, support for market conditions, supply chain readiness, availability of technology, customizability of products, and knowledge sharing [12]. Therefore, the MC implementation must consider various factors and conditions of the company. In general, MC has eight levels, namely standardization, usage, packaging and distribution, additional services, additional custom work, assembly, fabrication, and design [12]. At the assembly level, the MC stage entails modular production and types of customization that assemble standard components into unique configurations. Various things need to be considered by the company before determining which MC level will be applied.
In general, companies face the problem of how to understand customers’ needs and wants and how to interpret those needs by providing a product configuration that can achieve the maximum customer demand at minimum cost [13]. Product configuration design can be used to realize product variation efficiently and effectively. Product configuration aims to produce customized products at the lowest cost while providing maximum customer satisfaction.
The design of production systems related to the application of MC has been studied by researchers, among others in the textile and clothing industries [14], and in the garment industry [15]. Research related to the application of MC in the food industry has been undertaken by some researchers but has not reviewed design related to production systems. Among the studies related to the possibility of applying the MC concept in the food industry, Matthews et al. [16] examined the flexibility of food processing, Boland [17] discussed the idea of MC in the food industry for health, Boland [18] discussed the potential of MC in the food industry to meet the different nutritional needs of each individual, McIntosh et al. [3] discussed the growing issues related to the implementation of MC in the food industry, and Matthews et al. [19] discussed the possibility of MC applications in the food industry with opportunities and constraints that exist with the modularization approach.
Modularization has become a common approach in the field of production and operation management since the 1990s. The concept of modularity can be implemented through partitioning of products into semi-independent or interrelated elements and, therefore, it is possible to design and produce modules individually [20]. Implementation of the modularity concept will impact on the manufacturing system due to the modular design. The number of modules to be provided and the cost of production may vary depending on the type of module selected [21,22]. Modular design involves the creation of independent modules for building varied products. By combining multiple modules, a product can be varied, and potentially producing varied end products [23]. Modularization is expected when the product and related processes are characterized by low customization but high complexity [24]. According to [25], component modularity accentuate various aspects of modularity at the component level, namely degree modularity, distance modularity, and bridge modularity. Furthermore, [26] introduce modular design thinking to developed the product service system customization framework.
Problems arising from the increase of product variation include how to satisfy the wants and needs of customers through the appropriate product design. An important aspect of MC is the engagement of the end consumer in product design before it is produced [17]. The essential MC philosophy involves the customer in the pre-manufacturing design of a product; the customer is not really involved in the design but simply states his or her preferences [18]. According to [17,18], there are two aspects of product design in MC, namely sensory performance and functional performance. Sensory performance is associated with appearance (fashion, design, color), sound (programming on an iPod), or the taste and aroma of food. Functional performance is related to various aspects of performance, such as speed, power, and handling of cars, screen size, and computer memory capacity. Product design in the food industry is related to not only sensory but also functional performance, so it will involve very diverse consumer preferences related to not only taste and aroma but also color, texture, and even the nutritional value of the food product, which is a functional performance.
In MC, consumers simply choose the optional design offered by the manufacturer based on the modules available. Therefore, in the design of products in the food industry, it is necessary to consider the shelf life of the modules offered, which is related to the nature of perishable food products. In addition, the product design also considers the quality aspect. Based on customer ratings of quality perception, the concept of quality of food products can generally be divided into two groups of factors, namely intrinsic and extrinsic attributes. Intrinsic attributes are those that measure the quality of a product based on its function and physical properties. The intrinsic attributes are specific to each product. These attributes will disappear when the product is consumed and cannot be changed without changing the nature of the product itself. Extrinsic attributes are aspects that are related to the product but not physically part of the product itself, such as the name or brand image and price. These attributes are known as image variables and should be considered in the evaluation of the product’s characteristic.
Researchers have conducted several previous studies on product quality attributes in the food industry, both intrinsic and extrinsic, as shown in Table 1. In the present study, the concept of pleasurable design was used, where the product attributes are based on aspects of functionality, usability, and pleasure [27]. By using pleasurable design, the expected attributes that do not appear as intrinsic and extrinsic attributes will be exposed. In addition, the application of pleasurable design involves humans, so that the product design will be able to meet the expectations of consumers as users of the product.
The functionality aspect is the most basic aspect demanded by consumers, namely, the ability of the product to fulfil its function. To fulfil the function, food products must have certain attributes to satisfy the wants and basic needs of consumers. The usability aspect is the aspect that the consumer wants after the functionality aspect is met. Once the consumer is familiar with the right function, then he or she wants a product that is easy to use or, in the context of food products, easy to consume. The pleasure aspect is the aspect that consumers want after the functionality and usability aspects have been satisfied. When the product can provide the functional benefits and is easy to use, then the consumer will want something more (extra). In other words, the aspect of pleasure is the aspect whereby consumers want extra attributes possessed by the product which not only provide functional benefits but are also related to the emotional aspect of the consumer.
Based on three aspects of pleasurable design (functionality, usability, and pleasure), a product configuration will be developed that fulfils those three aspects. It is expected that by involving these three aspects, the design of the product will be able to meet consumer expectations, which will increase customer satisfaction. Customer satisfaction will contribute to creating consumer loyalty [28,37]. Loyal customers will be a benefit for the company, among them they will promote the products or services produces by the company.
Product configuration development uses the conjoint analysis method. Conjoint analysis is a multivariate analysis technique used to determine consumer preferences regarding a product in the form of either goods or services. By applying the conjoint analysis method, a product configuration that involves many factors forming the product will be found.
Conjoint analysis is one of the most popular techniques for assessing customer preferences among product alternatives with multiple attributes [38,39]. There are two types of information that can be obtained from conjoint analysis: first, the consumer preferences regarding the attributes studied, and second, the utility value of each level of each attribute.
Conjoint analysis has been applied in a number of studies to evaluate the attributes of food products: Hailu et al. [40] discussed consumer valuation of functional food products, Annunziata and Vecchio [41] discussed consumer perception of functional foods, Endrizzi et al. [42] discussed apple acceptability, and Shan et al. [43] discussed consumer evaluation of reformulated meat products, while this paper discusses a dairy industry product, namely ice cream. A dairy product is chosen because the demand for variation in dairy products is tending to increase. Besides that, dairy farmers need immediate solutions to maintain their competitiveness and access to global markets, for which innovation is required, and it is important that the industry maintains a unified approach and adapts to the changing nature of the people involved [44].
Product customization can be realized by providing a number of modules. Based on the attributes that build the product configuration, an analysis of the relationship between attributes is carried out to determine the types of modules that must be provided. The assessment of the relationship between attributes can be undertaken using the DEMATEL (decision-making trial and evaluation laboratory) method. DEMATEL is an MCDM (multi-criteria decision making) method that can be used to determine the relationship between criteria to capture and analyse dominant criteria in a system [45]. The synergy between conjoint analysis and DEMATEL was expected to be used to determine the types of modules that must be provided to realize the chosen product configuration. Conjoint analysis is used to determine the combination of attributes to form a product configuration. In contrast, DEMATEL is used to determine the relationship between attributes. After the relationship between attributes can be determined, it will be the basis for determining the module, where the module variants are formed based on the product configuration that has been formed based on conjoint analysis. A comparison of the present study with other published articles can be seen in Table 2.

2. Materials and Methods

In this section, issues related to data collection and data analysis will be discussed.

2.1. Data Collection

Data were collected during one month through an online questionnaire. The target respondents were consumers of ice cream. Within a month of questionnaire distribution, responses from 225 respondents were obtained. The product attributes reviewed in this study included the functionality, usability, and pleasure aspects.
In the present study, attributes based on the functionality aspects reviewed include taste, colour, aroma, texture, and nutritional content. Attributes based on the usability aspects reviewed include shape, size, and materials packaging, and attributes based on the pleasure aspects reviewed include brand/image, health benefits, and product appearance.

2.2. Data Analysis

2.2.1. Descriptive Analysis

The collected data were analysed using descriptive analysis. Descriptive analysis provides a summary of data so as to provide a clear description of the collected data. The analysis results can be presented in numerical or graphical form [48].
A descriptive analysis was conducted to determine how many respondents (%) chose specific product attributes or variants of these attributes. Product attributes and variants for each attribute that receive a high percentage value will be selected for use as the basis for development of product configuration alternatives.

2.2.2. Conjoint Analysis

Alternative product configurations were developed using orthogonal design. Each aspect of the pleasurable design was represented by two attributes, and each attribute had at least two variants. Furthermore, a process of ranking alternative product configurations was carried out. Conjoint analysis was used to determine the ranking of product configurations that were formed.
The product configuration was built based on consumer preferences for product attributes that consumers wanted. The ranking of the product configuration formed was based on the total utility value of the alternatives generated. The utility value of each variant on each attribute based on conjoint analysis output, where the orthogonal design and consumer preferences for each product configuration was the input for conjoint analysis. The mathematical model formulation of conjoint analysis is shown in Equation (1) [39].
U k = β 0 + i = 1 m j = 1 n u i j k
where:
  • U k = total utility of each product configuration alternative
  • β 0 = a constant
  • u i j k = utility of product configuration alternative k for attribute i and level j
  • m = number of attributes
  • n = number of levels

2.2.3. Decision-Making Trial and Evaluation Laboratory (DEMATEL)

The DEMATEL method was used to analyse the relationship between product attributes. According to Lee et al. [49], DEMATEL consists of six steps, namely construction of an evaluation scale, construction of a direct-influence matrix, construction of the normalized direct-relation matrix, construction of a total-influence matrix, analysis of the prominence and relationships, and drawing of the network relation map (NRM).
Step 1: Construction of an evaluation scale.
The evaluation scale of DEMATEL takes values of 0 to 4, where 0 indicates that one attribute has no influence on another attribute, 1 indicates that one attribute has a small influence on another attribute, 2 indicates that one attribute has a medium influence on another attribute, 3 indicates that one attribute has a large influence on another attribute, and 4 indicates that one attribute has an extremely large influence on another attribute.
Step 2: Construction of a direct-influence matrix.
The direct-influence matrix is a matrix that directly observes the relations between attributes. The direct influence between attributes is in the form of a matrix called the matrix Z; then zij is the level of influence of attribute i on attribute j, and the diagonal line variable zij is set at 0, as shown in Equation (2).
Z = ( 0 z 12 z 1 n z 21 0 z 2 n 0 z n 1 z n 2 0 )
Step 3: Construction of the normalized direct-relation matrix.
Matrix Z, which contains values from the relationship between attributes, is then normalized into matrix X using Equations (3) and (4). The diagonal line remains 0 and the maximum number of lines and columns is 1.
X = k Z
k = min [ 1 max j = 1 n [ z i j ] , 1 max i = 1 n [ z i j ] ] , j = 1 , 2 , , n
Step 4: Construction of a total-influence matrix.
Matrix X, which contains values from matrix Z normalized, is then construct into the Tc matrix, using Equation (5).
Tc = X (I − X)−1 with I = identity matrix
Step 5: Analysis of prominence and relationships.
Based on the Tc matrix, an analysis of the prominence and relationships between attributes was carried out using the sum of each row and column in the Tc matrix. This step was undertaken to obtain the D value (sum of lines) and R value (sum of column), using Equations (6) and (7).
D i = [ j = 1 n t i j ] , j = 1 , 2 , , n
R j = [ i = 1 n t i j ] , i = 1 , 2 , , n
Step 6: Drawing of the NRM.
The NRM uses (D + R) as a transverse line and (D − R) as the longitudinal axis as well as a symbol matrix.

3. Results and Discussion

3.1. Descriptive Analysis

Descriptive analysis was used to describe the attributes that consumers want in ice-cream products. The results of the complete analysis can be seen in Table 3 and Table 4.

3.1.1. Functionality Aspect

The functionality aspect is the most basic aspect demanded by consumers; it is the ability of the product to fulfil its functions [27]. Attributes of the functionality aspect include taste, aroma, colour, texture, and others. When considered on the basis of intrinsic and extrinsic attributes, these attributes are intrinsic attributes of the product. In Indonesia, assurance that a food product is halal is essential for consumer demand. Therefore, the halal attribute is not given as an option but has become compulsory for food products.
In the present study, consumers’ needs and wants regarding attributes of ice-cream products based on the functionality aspect relate to taste, texture, nutritional content, aroma, colour, and shelf life. In addition, other attributes can be revealed, namely the speed of melting. The survey results, as shown in Table 3, show that the selected attributes were taste (97.78%) and texture (86.67%). These two attributes of the functionality aspect will be used to build the product configuration.
With regard to the taste attribute, the taste variants offered to consumers include chocolate, strawberry, vanilla, blueberry, durian, apple, grape, and caramel. However, based on the survey results, the taste variants desired by the consumer are very diverse, and, in addition to the previously mentioned taste variants, can include avocado, tiramisu, taro, cappuccino, raisin, mocha, orange, soursop, jackfruit, coconut, sweet corn, watermelon, mint, green tea, melon, mango, banana, and green beans. The most widely chosen variants were chocolate (94.22%), vanilla (79.56%), strawberry (76.00%), and durian (41.33%), as shown in Table 4. The texture attribute concerns the desired level of softness of ice cream. Three levels were offered, namely slightly soft, soft, and very soft. To construct the product configuration, the functionality aspect was represented by two attributes, namely taste with four variants (chocolate, vanilla, strawberry, and durian) and texture with three variants (slightly soft, soft, and very soft).

3.1.2. Usability Aspect

The usability aspect is the aspect that the consumer wants after the functionality aspect has been fulfilled [27]. Once consumers have grown accustomed to the proper function, they want a product that is easy to use, or, in the context of food products, easy to consume. The attributes of the usability aspect revealed in this research include the shape, size, packaging materials, labels, information about the expiration period, information on storage, and information about benefits. When considered on the basis of intrinsic and extrinsic attributes, these attributes are extrinsic attributes of the product. The attribute of information about the expiry period is an attribute that every food product must have and, therefore, this attribute will not be selected as an attribute to build the product configuration.
Based on the survey results (Table 3), the two attributes that were most frequently selected by consumers were selected: the packaging material attribute (84.44%) and the shape attribute (70.67%). Therefore, with regard to the usability aspect, the attributes selected to build the product configuration were the packaging materials attribute and the ice-cream shape attribute.
The packaging materials attribute includes two options, namely edible and non-edible materials. The shape attribute includes five variants, namely stick, cup, cone, sandwich, and pack. The most preferred variants of the shape attribute were the cup (75.56%), cone (69.33%), and stick (68.89%), as shown in Table 4. Therefore, to build the product configuration, the usability aspect was represented by two attributes, namely the packaging materials attribute with two variants (edible and non-edible) and the shape attribute with three variants (cup, cone, and stick).

3.1.3. Pleasure Aspect

The pleasure aspect is the aspect that consumers’ need extra attributes of the product, not only functional benefits but also attributes related to the emotional aspect of the consumer. Thus the hidden attributes based on reviews of intrinsic and extrinsic attribute are expected to be revealed by exploring the pleasure aspect of the product. When viewed on the basis of intrinsic and extrinsic aspects, the pleasure aspect can include both intrinsic and extrinsic aspects of the product. Although the pleasure aspect is an extra attribute of a product, along with the increasing consumer requirements, the pleasure aspect can become an aspect that must exist in a product. Attributes studied based on aspects of pleasure in this study include brand attributes/image, health benefits, appearance, and packaging design. The survey results revealed one attribute, namely innovation.
Based on the survey results (Table 3), two attributes were chosen by most consumers, namely health benefits (73.33%) and appearance (73.33%). With regard to the health benefits attribute, the variants studied include low calorie, low fat, low sugar, high protein, no preservatives, derived from organic ingredients, use of natural dyes, and use of natural flavorings. The variants preferred most by consumers were no preservatives (74.67%), low sugar content (71.56%), and low fat content (69.33%), as shown in Table 3. With regard to appearance attributes, variants studied include coated with chocolate sauce, coated with chocolate and nuts, with topping, with pieces of various fruits, and with grains of chocolate. The most popular variants chosen by consumers were with topping (61.33%), coated with chocolate sauce (60.44%), and with pieces of various fruits (46.67%), as shown in Table 4. To build the product configuration, the pleasure aspect was represented by two attributes, namely the health benefits attribute with three variants (no preservatives, low sugar, and low fat) and the appearance attribute with three variants (with topping, coated with chocolate sauce, and with pieces of various fruits).
With the different variants for each of these attributes, a variety of product configurations can be built to produce products that vary according to consumer demand. Thus, the concept of MC can be applied by providing a variety of intermediate product modules which can then be combined to perform product customization according to consumer requirements. In this research, conjoint analysis was used to build the product variation that consumers want.

3.2. Product Configuration with Conjoint Analysis

The fundamental idea of the conjoint analysis method is that in considering a product, the consumer will assess a product as a collection of attributes where one attribute is traded off against another [50]. A complete set of products is explained by a group of attributes (product features). Conjoint analysis can reveal consumers’ essential trade-offs when assessing and purchasing products.
The product attributes and variants used to develop the product configuration were the product attributes selected on the basis of descriptive analysis; that is, the attributes that received the most votes based on consumer opinion were selected. In this section, the development of the product configuration is discussed and the determination of the ranking of the product configuration is carried out.

3.2.1. Product Configuration

A conceptual model of the product configuration can be seen in Figure 1. Orthogonal design was used to build the alternative product configurations. The product configuration was based on the selected attributes and their variants. With regard to the functionality aspect, two attributes were selected, namely taste and texture. There were four variants of the taste attribute, namely chocolate, vanilla, strawberry, and durian, and three variants of the texture attribute, namely slightly soft, soft, and very soft. With regard to the usability aspect, two attributes were selected, namely packaging materials and shape. There were two variants of the packaging materials attribute, namely edible and non-edible, and three variants of the shape attribute, namely cup, cone, and stick. With regard to the pleasure aspect, two attributes were selected, namely health benefits and appearance. There were three variants of the health benefits attribute, namely no preservatives, low sugar, and low fat, and three variants of the appearance attribute, namely with topping, coated with chocolate sauce, and with pieces of various fruits.
The attributes and variants used to construct the product configuration are shown in Table 5. There were six factors, comprised of one factor (packaging materials) with two levels; four factors (texture, shape, health benefit, and appearance) with three levels each; and one factor (taste) with four levels. Based on the attributes and variants of each of these attributes, if we use factorial design we will obtain (4)(3)(2)(3)(3)(3) = 648 product configurations. Because the number of combinations is too large and it is not possible to obtain respondents’ ratings to compare 648 configurations, in the present study we do not use factorial design to build alternative product configurations but instead use orthogonal design.
Based on the orthogonal design results, 25 product configurations were obtained, as shown in Table 6.

3.2.2. Ranking of Product Configuration

Based on the product configuration formed in the previous stage, the ranking process was performed for that product configuration. This ranking process was based on the utility value of each product configuration. The utility value was the result of conjoint analysis. A survey of respondents was conducted related to their preferences for the 25 product configurations ranging from the most preferred to the least preferred. Based on the orthogonal design and the respondents’ preferences, the utility value for each variant in each attribute was obtained. The estimated utility value of each attribute and its variants is shown in Table 7. Besides the total utility value, the importance values of each attribute were also obtained.
Model validation uses correlation analysis between estimated preferences and actual preferences. Correlation values are used to determine whether the model results can predict consumer preferences validly. Based on Kendall’s Tau correlation measurement of 0.859, this indicates a strong relationship between estimation preferences and actual preferences, or it can show that there was high predictive accuracy in the conjoint process.
With regard to the importance values of each attribute, the taste attribute had the highest importance value, equal to 42.899, followed by the attributes of appearance, shape, texture, health benefits, and packaging materials. The taste attribute was the most important attribute for ice-cream products, which is in line with the opinion of [51], who stated that the taste attribute is the key driver for consumer preferences. Similarly, [52] agreed that for the food and beverage industry, the attributes of flavors (taste) and fragrances are especially important.
A larger positive value of the utility estimate indicates that there is more demand for the product variant, whereas a negative value of the utility estimate indicates that the product variant is less desirable. Based on the estimated utility value of each attribute and its variants (Table 7), with regard to the taste attribute, the taste variant in which consumers were most interested was chocolate (2.659), followed by strawberry (0.363), vanilla (−0.942), and durian (−2.080) variants. With regard to the shape attribute, the shape variant in which consumers were most interested was the cup shape (0.524), followed by the cone shape (−0.134) and the stick (0.390). In terms of health benefits, consumers showed the highest demand for no preservatives in the product (0.491) in addition to relatively low sugar and fat contents (−0.040 and −0.451). The appearance most favoured by ice-cream consumers was with topping (0.403). With regard to the texture attribute, ice-cream products with softer texture were preferred. With regard to packaging materials, consumers preferred edible packaging materials (−1.843) over non-edible ones (−3.687).
Therefore, based on the utility value of each variant of the particular attribute as shown in Table 7, the total utility value can be calculated for each product configuration. A higher value of total utility showed that the configuration of the product was of greater interest to consumers; for example, based on Equation (8), the total utility value of product configuration 1, consisting of a combination of durian taste, very soft texture, non-edible packaging material, cup shape, low fat, and with topping is:
U1 = 15.508 + (−2.080) + (−0.423) + (−3.687) + 0.524 + (−0.451) + 0.403 = 10.791
Similarly, the value of total utility can be calculated for each product configuration alternative. Then the ranking for each product configuration is determined on the basis of its total utility value. The calculated results of total utility and ranking of product configuration are shown in Table 8.
Table 8 shows that product configuration 5 (chocolate, very soft, edible, cup, no preservatives, and with topping) was the product configuration that most consumers demanded (first ranking with a total utility value of 17.319). This was followed by product configuration 14 (chocolate, very soft, edible, cup, low sugar, and coated with chocolate sauce) and product configuration 19 (chocolate, very soft, edible, cone, no preservatives, and coated with chocolate sauce). Based on these three product configurations, the taste variant most preferred by consumers was chocolate, which can also be seen from the estimated utility value of 2.659, which is the largest value estimated for the taste variant.

3.3. Determination of Modules with DEMATEL

Based on the result of the product configuration selection, the modules needed to build the product configuration can be identified. To determine the types of modules that must be provided, it is necessary to analyse the relationship between attributes because food products have a unique structure in the application of modularity. Each type of module does not always represent one attribute but can be a combination of several attributes, so one type of module can represent several attributes that have been defined.

3.3.1. Relationship between Attributes

The relationship between attributes of the ice-cream product was analysed by the DEMATEL method. The attributes analysed included taste, texture, packaging materials, shape, health benefits, and appearance. This method used a questionnaire for data collection based on the opinion of experts in food technology.
Step 1: Construction of an evaluation scale.
Experts were asked to determine the relationship between attributes by giving a value of 0 to 4. A value of 0 was given if one attribute was not related to or had no effect on the other attribute, while a value of 4 was given if one attribute was extremely highly related to or had a very large influence on the other attributes.
Further data processing was carried out through several stages of DEMATEL. These stages were the construction of a direct-influence matrix, the construction of a normalized direct-relation matrix, the construction of a total-influence matrix, an analysis of prominence and relationships, and drawing of an NRM.
Step 2: Construction of a direct-influence matrix.
Based on the judgements of experts in food technology, matrix Z was constructed based on Equation (2), and the result showed in Equation (9).
Z = ( 030023 400023 000334 003004 431102 002120 )
Step 3: Contraction of the normalized direct-relation matrix.
The matrix Z which contained the values of the relationships between attributes was then normalized to form matrix X with Equations (3) and (4). The diagonal of the matrix remains 0 and the maximum number of rows and columns was 1. Using Microsoft Excel, the value of k = 0.0625 was obtained. The results of the normalization process showed in Equation (10).
X = ( 0.00000   0.18750   0.00000   0.00000   0.12500   0.18750 0.25000   0.00000   0.00000   0.00000   0.12500   0.18750 0.00000   0.00000   0.00000   0.18750   0.18750   0.25000 0.25000   0.18750   0.06250   0.06250   0.00000   0.12500 0.00000   0.00000   0.12500   0.06250   0.12500   0.00000 )
Step 4: Construction of a total-influence matrix.
The matrix X that had been constructed was then built into the matrix Tc, using Equation (5). Matrix operations were performed using the = MINVERSE function in Microsoft Excel. The results of the total relationship matrix showed in Equation (11).
T c = ( 1.11817   0.25118   0.06109   0.04473   0.22149   0.31089 0.33491   1.10651   0.06431   0.04708   0.23314   0.32726 0.08701   0.06869   1.11545   0.25198   0.27936   0.40597 0.03067   0.02421   0.25214   1.07559   0.09845   0.35453 0.35687   0.28174   0.13430   0.11715   1.14573   0.32582 0.05740   0.04532   0.17198   0.11337   0.18429   1.11363 )
Step 5: Analysis of prominence and relationships.
Based on the total relationship matrix, an analysis of the prominence and relationships between attributes was carried out by summing each row and column in the Tc matrix to get the D and R values using Equations (6) and (7).
The D and R values were then processed by the reduction process between the D and R values (D − R) and the summing process between the D and R values (D + R). If the value (D − R) was positive, it indicated that the attribute had a greater influence than other attributes and was assumed to be the top priority, commonly referred to as a dispatcher. When the attribute had a negative (D − R) value, it indicated that the attribute had a smaller influence and was assumed to be the last priority, commonly referred to as the receiver. The value (D + R) indicates the strength of the relationship between attributes, so an attribute with a larger (D + R) value has a stronger relationship. The calculation results at this stage can be seen in Table 9.
The next step was the calculated threshold value to determine whether there is a relationship between attributes. The threshold value was obtained by calculating the average value of all cells in the Tc matrix. Then the threshold value was compared with the value in each cell in the Tc matrix. If the value in a cell is higher than the threshold value, then there is a relationship between attributes. Conversely, if the value in a cell in the Tc matrix is smaller than the threshold value, then there is no relationship between attributes. For example, based on the Tc matrix with a threshold value of 0.1726, there is a relationship between the taste and texture attributes, because the cell has a value of 0.33491 which is greater than the threshold value. Meanwhile, there is no relationship between the taste and shape attributes because the cell has a value of 0.03067 which is smaller than the threshold value. The complete results for the relationships between attributes are shown in Table 10.
Based on the results of analysis of relationships between attributes (Table 10), it can be explained that the attributes of taste, texture, and health benefits are interrelated attributes. Other attributes that are interrelated are the attributes of shape and packaging materials. The appearance attribute is the only attribute that is related to all attributes. The relationships between attributes are shown in Figure 2.

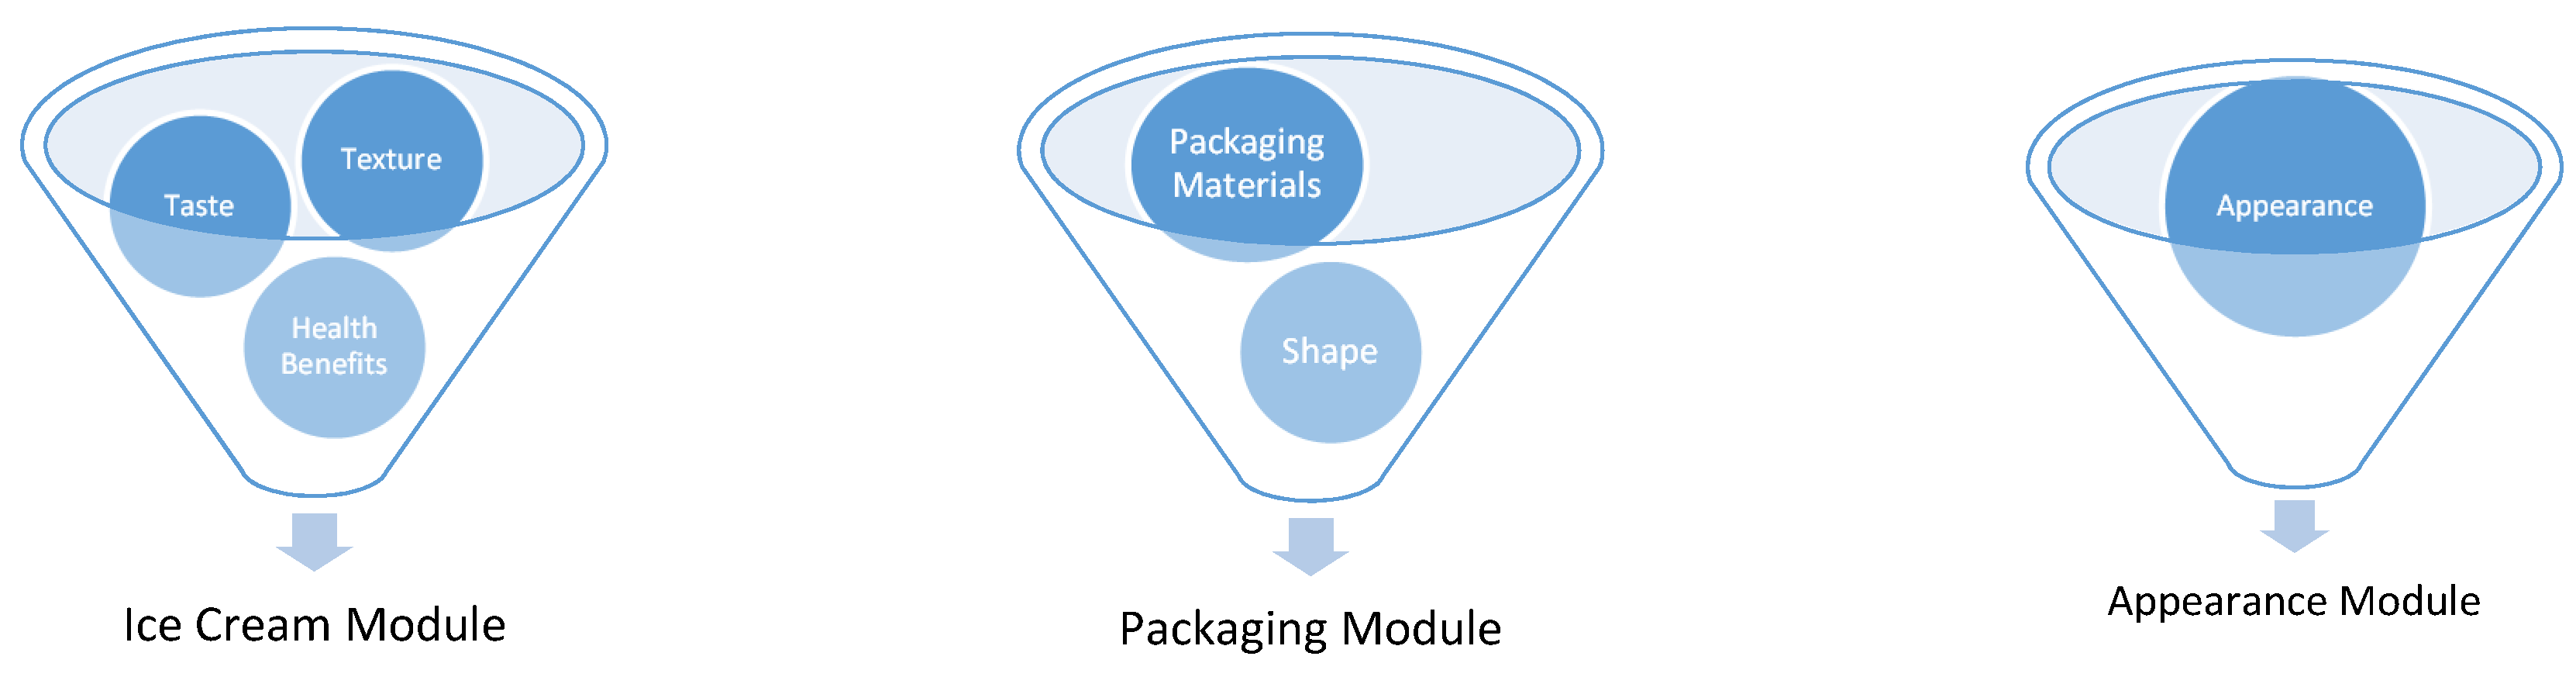
3.3.2. Types of Modules

Based on the results of the analysis of the relationships between attributes, the types of modules that must be provided can be determined, as shown in Figure 3. The attributes of taste, texture, and health benefits are interrelated attributes, so to realize the attributes of taste, texture, and health benefits, an ice-cream module is needed. The attributes of shape and packaging materials are interrelated, so to realize the packaging materials and shape attributes, a packaging module is needed. The appearance attribute appears individually and is built by the appearance module.

Ice-Cream Module

With regard to the taste attribute, the modules that must be provided include chocolate, strawberry, vanilla, and durian, with three types of textures, which are slightly soft, soft, and very soft. With regard to the health benefits attribute, ice cream with three types is required, namely no preservatives, low sugar, and low fat. From the results of ranking the configuration of the product (Table 8), then the configuration of the product is formed (Table 6) to determine the module variants. For example, the first rank was product configuration 5 (Table 8), with the taste, texture, and health benefits attributes are chocolate taste, very soft textured, and no preservatives (Table 6). The second rank was product configuration 14 (Table 8) with chocolate taste, very soft textured, and low sugar attributes (Table 6), and so on for 25 product configurations., and so on for 25 product configurations. This also showed the relationship between the results of a conjoint analysis with DEMATEL. Based on the taste attribute, texture attribute, and health benefits attribute, ice-cream modules are needed with variants as shown in Table 11.

Packaging Module

There are two variants of the packaging materials attribute, namely edible and non-edible, while the shape attribute has three variants: cup, cone, and stick. The combination of the packaging materials’ attribute and the shape attribute is used to construct the packaging module. The variants of the packaging module can be seen in Table 12.

Appearance Module

With regard to the appearance attributes, there are three variants: with topping, coated in chocolate sauce, and with various pieces of fruits. This attribute individually builds the appearance module. Therefore, three variants of the appearance module must be provided, as shown in Table 13.
Using the various types of modules with different variants, various product configurations can be realized according to consumers’ needs and wants. In addition, the availability of various types of modules can be used to provide customized product. The perceived benefits related to product customization are not just to meet consumer requirements, but can provide something greater. According to [53], the perceived benefits associated with customized products can lead to greater emotional attachment to the product, a more positive attitude towards the customization, and ultimately high loyalty intention. The benefit of the synergy approach between conjoint analysis and DEMATEL proposed in this paper is to increase the level of customization. According to [12], MC has eight levels, namely standardization, usage, packaging and distribution, additional services, additional custom work, assembly, fabrication, and design. At assembly level (6th level), the formation of modules with various variants, it can be used to form product configurations according to the needs and wants of consumers.

4. Conclusions

To be able to meet increasingly diverse consumer demands, companies need to provide more diverse products as well. A strategy that can be used by companies is to apply the concept of MC. The first step in implementing this strategy is to capture the attributes that customers need and want in a product.
The research results showed that the attributes of ice-cream products that are considered important by customers are the taste and texture attributes (functionality aspect), packaging-material and shape attributes (usability aspect), and health-benefit and appearance attributes (pleasure aspect). Based on the values of the importance of each attribute, they were ranked in the following order of decreasing importance: taste, appearance, shape, texture, health benefits, and packaging materials.
To realize the product configuration that has been determined, several types of modules are required. Based on the analysis of the linkages between product attributes, the types of modules that must be provided include ice-cream modules, packaging modules, and appearance modules. By providing various types of modules, various product configurations can be built in accordance with consumer requirements and used to realize customized products.
The novelty of this research is that it combines pleasurable design with conjoint analysis and DEMATEL, where product design was developed by considering three aspects: functionality, usability, and pleasure. By using pleasurable design, not only the product function but also the customers’ emotional aspect can be fulfilled. Thus, the unrevealed attributes based on reviews of intrinsic and extrinsic attribute are expected to be revealed by pleasurable design, so that the resulting product will be able to meet consumer expectations and ultimately increase customer satisfaction.
The approach proposed in this paper can also be applied to non-dairy food industries, for example, the meat industry. However, adjustments on the attributes based on the pleasurable design are needed. Almost all attributes of food products should be the same, such as ‘taste’. The difference will be significant when the ‘taste’ attribute is derived from the variants of attributes. Variants in the ‘taste’ attribute can be derived differently according to the type of product being studied. Moreover, this approach can also be applied to other manufacturing industries, such as the automotive industry or fashion industry. The functionality, usability, and pleasure aspects can still be used, but the attributes with their variants will be different. A further study to uncover them is needed.
This study has not involved the idea of market segmentation. Thereby, this is considered as the limitation of this research. It will be preferable in future research to involve the market segmentation in product and process design. Incorporating other attributes, such as product nutrition attributes (functionality aspect) and product size attributes (usability aspect), can be the possible extension of this study. Besides that, a further study related to reviewing the utility value of each module variant is needed. The utility value of the module variant can be used to determine the priority of the module variant that must be provided. These are links to production costs and the limited availability of resources.

Author Contributions

Conceptualization, E.R.W., M.L.S. and I.K.G.; methodology, E.R.W., M.L.S. and I.K.G.; validation, M.L.S.; formal analysis, E.R.W. and M.L.S.; investigation, E.R.W.; data curation, E.R.W.; writing—original draft preparation, E.R.W. and M.L.S.; writing—review and editing, E.R.W., M.L.S. and I.K.G. All authors have read and agreed to the published version of the manuscript.

Funding

This research was funded by the Ministry of Research, Technology and Higher Education of the Republic of Indonesia through a Doctoral Dissertation Research Grant with contract number 008/SP2H/LT/K7/KM/2018.

Conflicts of Interest

The authors declare no conflict of interest.

References

  1. Frutos, J.D.; Borenstein, D. A framework to support customer-company interaction in mass customization environments. Comput. Ind. 2004, 54, 115–135. [Google Scholar] [CrossRef]
  2. Akkerman, R.; van Donk, D.P. Product mix variability with correlated demand in two-stage food manufacturing with intermediate storage. Int. J. Prod. Econ. 2009, 121, 313–322. [Google Scholar] [CrossRef]
  3. McIntosh, R.I.; Matthews, J.; Mullineux, G.; Medland, A.J. Late customisation: Issues of mass customisation in the food industry. Int. J. Prod. Res. 2010, 48, 1557–1574. [Google Scholar] [CrossRef] [Green Version]
  4. van Donk, D.P. Make to stock or make to order: The decoupling point in the food processing industries. Int. J. Prod. Econ. 2001, 69, 297–306. [Google Scholar] [CrossRef]
  5. Soman, C.A.; van Donk, D.P.; Gaalman, G. Combined make-to-order and make-to-stock in a food production system. Int. J. Prod. Econ. 2004, 90, 223–235. [Google Scholar] [CrossRef] [Green Version]
  6. Mourtzis, D.; Doukas, M.; Psarommatis, F. Design and operation of manufacturing networks for mass customisation. CIRP Ann. Manuf. Technol. 2013, 62, 467–470. [Google Scholar] [CrossRef]
  7. Davis, S.M. Future Perfect; Addison-Wesley Publishing Company, Inc.: Toronto, ON, Canada, 1987. [Google Scholar]
  8. Pine, B.J.; Victor, B.; Boynton, A.C. Making mass customization work. Harvard Bus. Rev. 1993, 71, 108–111. [Google Scholar]
  9. Xu, X. Position of customer order decoupling point in mass customization. In Proceedings of the Sixth International Conference on Machine Learning and Cybernetics, Hong Kong, China, 19–22 August 2007; pp. 302–307. [Google Scholar]
  10. Mourtzis, D.; Doukas, M. The Evolution of manufacturing systems: From craftsmanship to the era of customisation. In Handbook of Research on Design and Management of Lean Production Systems; IGI Global: Hershey, PA, USA, 2014; pp. 1–29. [Google Scholar]
  11. Mourtzis, D.; Doukas, M. Design and planning of manufacturing networks for mass customisation and personalisation: Challenges and Outlook. Procedia CIRP 2014, 19, 1–13. [Google Scholar] [CrossRef] [Green Version]
  12. da Silveira, G.; Borenstein, D.; Fogliatto, H.S. Mass customization: Literature review and research directions. Int. J. Prod. Econ. 2001, 72, 1–13. [Google Scholar] [CrossRef]
  13. Gangurde, S.R.; Akarte, M.M. Customer preference oriented product design using AHP-modified TOPSIS approach. Benchmarking Int. J. 2013, 20, 549–564. [Google Scholar] [CrossRef]
  14. Watcharapanyawong, K.; Sirisoponsilp, S.; Sophatsathit, P. A Model of mass customization for engineering production system development in textile and apparel industries in Thailand. Syst. Eng. Procedia 2011, 2, 382–397. [Google Scholar] [CrossRef] [Green Version]
  15. Dong, B.; Jia, H.; Li, Z.; Dong, K. Implementing mass customization in garment industry. Syst. Eng. Procedia 2012, 3, 372–380. [Google Scholar] [CrossRef] [Green Version]
  16. Matthews, J.; Singh, B.; Mullineux, G.; Medland, T. Constraint-based approach to investigate the process flexibility of food processing equipment. Comput. Ind. Eng. 2006, 51, 809–820. [Google Scholar] [CrossRef] [Green Version]
  17. Boland, M. Perspective: Mass customisation of food. J. Sci. Food Agric. 2006, 86, 7–9. [Google Scholar] [CrossRef]
  18. Boland, M. Innovation in the food industry: Personalised nutrition and mass customization. Innov. Manag. Policy Pract. 2008, 10, 53–60. [Google Scholar] [CrossRef]
  19. Matthews, J.; McIntosh, R.I.; Mullineux, G. Contrasting opportunities for mass customization in food manufacture and food process. In Mass Customization: Engineering and Managing Global Operations; Fogliatto, F.S., da Silveira, G.J.C., Eds.; Springer: London, UK, 2011; pp. 353–374. [Google Scholar]
  20. Kusiak, A.; Huang, C.C. Development of modular products. IEEE Trans. Compon. Packag. Manuf. Technol. Part A 1996, 19, 523–538. [Google Scholar] [CrossRef]
  21. Agard, B.; Kusiak, A. Data Mining for Subassembly Selection. J. Manuf. Sci. Eng. 2004, 126, 627–631. [Google Scholar] [CrossRef]
  22. Da Cunha, C.; Agard, B.; Kusiak, A. Design for Cost: Module-Based Mass Customization. IEEE Trans. Autom. Sci. Eng. 2007, 4, 350–359. [Google Scholar] [CrossRef] [Green Version]
  23. Agard, B.; Bassetto, S. Modular design of product families for quality and cost. Int. J. Prod. Res. 2013, 51, 1648–1667. [Google Scholar] [CrossRef]
  24. Brun, A.; Zorzini, M. Evaluation of product customization strategies through modularization and postponement. Int. J. Prod. Econ. 2009, 120, 205–220. [Google Scholar] [CrossRef]
  25. Sosa, M.E.; Eppinger, S.D.; Rowles, C.M. A network approach to define modularity of components in complex products. J. Mech. Des. 2007, 129, 1118–1129. [Google Scholar] [CrossRef]
  26. Song, W.; Sakao, T. A customization-oriented framework for design of sustainable product/service system. J. Clean. Prod. 2017, 140, 1672–1685. [Google Scholar] [CrossRef]
  27. Jordan, P.W. Designing Pleasurable Products; E-Library; Taylor & Francis: London, UK, 2000. [Google Scholar]
  28. Fandos, C.; Flavián, C. Intrinsic and extrinsic quality attributes, loyalty and buying intention: An analysis for a PDO product. Br. Food J. 2006, 108, 646–662. [Google Scholar] [CrossRef]
  29. Iop, S.C.F.; Teixeira, E.; Deliza, R. Consumer research: Extrinsic variables in food studies. Br. Food J. 2006, 108, 894–903. [Google Scholar] [CrossRef]
  30. Espejel, J.; Fandos, C.; Flavián, C. The role of intrinsic and extrinsic quality attributes on consumer behaviour for traditional food products. Manag. Serv. Qual. 2007, 17, 681–701. [Google Scholar] [CrossRef]
  31. Hersleth, M.; Monteleone, E.; Segtnan, A.; Næs, T. Effects of evoked meal contexts on consumers’ responses to intrinsic and extrinsic product attributes in dry-cured ham. Food Qual. Prefer. 2015, 40, 191–198. [Google Scholar] [CrossRef]
  32. Lee, P.Y.; Lusk, K.; Mirosa, M.; Oey, I. An attribute prioritization-based segmentation of the Chinese consumer market for fruit juice. Food Qual. Prefer. 2015, 46, 1–8. [Google Scholar] [CrossRef]
  33. Ma, L.; Li, B.; Han, F.; Yan, S.; Wang, L.; Sun, J. Evaluation of the chemical quality traits of soybean seeds, as related to sensory attributes of soymilk. Food Chem. 2015, 173, 694–701. [Google Scholar] [CrossRef] [Green Version]
  34. Verain, M.C.D.; Sijtsema, S.J.; Antonides, G. Consumer segmentation based on food-category attribute importance: The relation with healthiness and sustainability perceptions. Food Qual. Prefer. 2016, 48, 99–106. [Google Scholar] [CrossRef]
  35. Massaglia, S.; Borra, D.; Peano, C.; Sottile, F.; Merlino, V.M. Consumer preference heterogeneity evaluation in fruit and vegetable purchasing decisions using the best—Worst approach. Foods 2019, 8, 266. [Google Scholar] [CrossRef] [Green Version]
  36. Wedowati, E.R.; Singgih, M.L.; Gunarta, I.K. Design For Mass Customization In Food Industry: Literature Review And Research Agenda. In Proceedings of the 7th International Conference on Operations and Supply Chain Management (OSCM), Phuket, Thailand, 18–21 December 2016; pp. 726–737. [Google Scholar]
  37. Stan, V.; Caemmerer, B.; Cattan-jallet, R. Customer loyalty development: The role of switching costs. J. Appl. Bus. Res. 2013, 29, 1541–1554. [Google Scholar] [CrossRef]
  38. Fogliatto, F.S.; da Silveira, G.J.C. Mass customization: A method for market segmentation and choice menu design. Int. J. Prod. Econ. 2008, 111, 606–622. [Google Scholar] [CrossRef]
  39. Wang, C.H. Integrating Kansei engineering with conjoint analysis to fulfil market segmentation and product customisation for digital cameras. Int. J. Prod. Res. 2015, 53, 2427–2438. [Google Scholar] [CrossRef]
  40. Hailu, G.; Boecker, A.; Henson, S.; Cranfield, J. Consumer valuation of functional foods and nutraceuticals in Canada. A conjoint study using probiotics. Appetite 2009, 52, 257–265. [Google Scholar] [CrossRef] [PubMed]
  41. Annunziata, A.; Vecchio, R. Consumer perception of functional foods: A conjoint analysis with probiotics. Food Qual. Prefer. 2013, 28, 348–355. [Google Scholar] [CrossRef]
  42. Endrizzi, I. A conjoint study on apple acceptability: Sensory characteristics and nutritional information. Food Qual. Prefer. 2015, 40, 39–48. [Google Scholar] [CrossRef]
  43. Shan, L.C. Consumer evaluations of processed meat products reformulated to be healthier—A conjoint analysis study. Meat Sci. 2017, 131, 82–89. [Google Scholar] [CrossRef] [Green Version]
  44. Imam, A.; Zadeh, M.N.; Dubey, L.R. Dairy Marketing Strategies in the Context of Globalization: Issues and Challenges. Int. J. Trade Econ. Financ. 2011, 2, 138–143. [Google Scholar] [CrossRef] [Green Version]
  45. Si, S.; You, X.; Liu, H.; Zhang, P. DEMATEL Technique: A Systematic Review of the State-of-the-Art Literature on Methodologies and Applications. Hindawi Math. Probl. Eng. 2018, 2018, 3696457. [Google Scholar] [CrossRef] [Green Version]
  46. Wang, C.H.; Wang, J. Combining fuzzy AHP and fuzzy Kano to optimize product varieties for smart cameras: A zero-one integer programming perspective. Appl. Soft Comput. J. 2014, 22, 410–416. [Google Scholar] [CrossRef]
  47. Calegari, L.P.; Barbosa, J.; Marodin, G.A.; Fettermann, D.C. A conjoint analysis to consumer choice in Brazil: Defining device attributes for recognizing customized foods characteristics. Food Res. Int. 2018, 109, 1–13. [Google Scholar] [CrossRef] [PubMed]
  48. Jaggi, S. Descriptive Statistics and Exploratory Data Analysis. Indian Agric. Stat. Res. Inst. 2003, 1, 1–18. [Google Scholar]
  49. Lee, W.S.; Huang, A.Y.; Chang, Y.Y.; Cheng, C.M. Analysis of decision making factors for equity investment by DEMATEL and Analytic Network Process. Expert Syst. Appl. 2011, 38, 8375–8383. [Google Scholar] [CrossRef]
  50. McCullough, P.R. A User’s Guide to Conjoint Analysis. Mark. Res. 2002, 14, 18–23. [Google Scholar]
  51. De Pelsmaeker, S.; Schouteten, J.J.; Lagast, S.; Dewettinck, K.; Gellynck, X. Is taste the key driver for consumer preference? A conjoint analysis study. Food Qual. Prefer. 2017, 62, 323–331. [Google Scholar] [CrossRef]
  52. Vilela, A.; Bacelar, E.; Pinto, T.; Anjos, R.; Correia, E.; Gonçalves, B.; Cosme, F. Beverage and food fragrance biotechnology, novel applications, sensory and sensor techniques: An overview. Foods 2019, 8, 643. [Google Scholar] [CrossRef] [Green Version]
  53. Park, M.; Yoo, J. Benefits of mass customized products: Moderating role of product involvement and fashion innovativeness. Heliyon 2018, 4, e00537. [Google Scholar] [CrossRef] [Green Version]
Figure 1. Product configurations.
Designs 04 00007 g001
Figure 2. Relationships between attributes.
Designs 04 00007 g002
Figure 3. Types of modules.
Designs 04 00007 g003
Table 1. Product attributes in the food industry.
No.AuthorsProductsProduct Attributes
1.Fandos and Flavian [28]Meat: hamIntrinsic: fine, flavor, delicate, aroma, appearance, and color
Extrinsic: shapely, elongated and rounded form of the ham, brand
2.Iop et al. [29]Food productsIntrinsic: color, aroma, flavor, and texture
Extrinsic: brand, price, and context
3.Espejel et al. [30]Traditional foodIntrinsic: color, flavor, smell, and appearance
Extrinsic: brand, denomination of origin, and traditional product image
4.Hersleth et al. [31]dry-cured hamIntrinsic: sensory quality (appearance, aroma, flavor, and texture)
Extrinsic: price, nutritional value, and processing conditions
5.Lee et al. [32]Fruit juiceExtrinsic: brand, nutrient content, ingredient labels, shelf life, price, and manufacturing country
6.Ma et al. [33]Soy milkIntrinsic: sensory attribute (soymilk aroma, smoothness in the mouth, thickness in the mouth, sweetness, color, appearance, and overall acceptability), oil and protein content, fatty acids, soluble solid
7.Verain et al. [34]Milk, meat, fruit and vegetable, and fishAttributes: sustainability, health, taste, and price
8.Massaglia et al. [35]Fruit and vegetableAttributes: brand, organic label, quality certifications, origin, price, offer, appearance, local, geographical indication label, seasonality, variety, freshness
9.The present paperIce creamFunctionality: taste, color, aroma, texture, and nutritional content
Usability: shape, size, and materials packagingPleasure: brand/image, health benefits, appearance, and packaging design
Note: Adapted from Wedowati et al. [36].
Table 2. Comparison of the present study with other published articles.
No.AuthorsProductsStrengthsWeaknesses
1.Fogliatto and Silveira [38]Laptop, natural gasDesigning choice menus for MC with CA to balance the trade-off between flexibility and complexity.Implications for modularity and bundled choice have not been considered.
2.Wang and Wang [46]Smart camerasUsing a combination of fuzzy AHP, fuzzy Kano, and ZOIP to analyse customer preferences, customer perceptions and optimal product varieties for distinct segments.Market segmentation has not considered customer demographic profiles.
3.Wang [39]Digital camerasIntegrating KE, CA, RST, and GRA to effectively perform market segmentation and efficiently conduct product customization.Product configuration has not considered customer need, affordable prices and consumer demographics.
4.Verain et al. [34]Food productsThis study has considered market segmentation, and the product attributes synergize healthiness and sustainability.This study has not reviewed the product configuration according to market segments.
5.Calegari et al. [47]Food productsUsing the CBCA method to define device attributes to recognize the characteristics of customized foods.The sample dispersion for product development focuses on specific population profiles.
6.The present paperIce creamUsing a combination of conjoint analysis and DEMATEL to determine the type of module.
Review of product design attributes using pleasurable design (functionality, usability, and pleasure)
The product design has not considered market segmentation.
Note: MC: Mass Customization, CA: Conjoint Analysis, AHP: Analytical Hierarchy Process, ZOIP: Zero-One Integer Programming, KE: Kansei Engineering, RST: Rough Set Theory, GRA: Grey Relational Analysis, CBCA: Choice-Based Conjoint Analysis, DEMATEL: Decision-Making Trial and Evaluation Laboratory.
Table 3. Consumer preferences for each attribute of each aspect.
Aspects
FunctionalityUsabilityPleasure
AttributesPercentage Who ChooseAttributesPercentage Who ChooseAttributesPercentage Who Choose
Taste97.78Packaging materials84.44Health benefits73.33
Texture86.67Expiry date72.89Appearance73.33
Nutrition68.00Shape70.67Brand/Image65.33
Aroma47.56Size68.89Packaging design56.89
Colour43.11
Storability35.56
Table 4. Consumer Preferences for each variant in the attributes.
Attributes
TastePercent Age Who ChooseShapePercent Age Who ChooseHealth BenefitsPercent Age Who ChooseAppearancePercent Age Who Choose
Chocolate94.22Cup75.56No preservatives74.67With topping61.33
Vanilla79.56Cone69.33Low sugar71.56Coated with chocolate sauce60.44
Strawberry76.00Stick68.89Low fat69.33With pieces of various fruits46.67
Durian41.33Pack49.78Natural dye68.00Coated with chocolate and nuts45.78
Blueberry24.22Sandwich23.56Natural flavourings63.56
Caramel20.00 Low calorie50.67
Grape24.22 High protein48.44
Apple8.00 Organics ingredients38.22
Table 5. Attributes and variants of product configuration.
FunctionalityUsabilityPleasure
TasteTexturePackaging MaterialsShapeHealth BenefitsAppearance
ChocolateVery softEdibleCupNo preservativesWith topping
VanillaSoftNon-edibleConeLow sugarCoated with chocolate sauce
StrawberrySlightly soft StickLow fatWith pieces of various fruits
Durian
Table 6. Alternative product configurations.
Product ConfigurationsFunctionalityUsabilityPleasure
TasteTexturePackaging MaterialsShapeHealth BenefitsAppearance
1DurianVery softNon-edibleCupLow fatWith topping
2StrawberrySlightly softEdibleCupNo preservativesWith pieces of various fruits
3ChocolateSlightly softEdibleCupLow fatWith topping
4StrawberryVery softNon-edibleCupLow sugarWith topping
5ChocolateVery softEdibleCupNo preservativesWith topping
6ChocolateSlightly softNon-edibleStickLow sugarCoated with chocolate sauce
7ChocolateSoftNon-edibleCupLow sugarCoated with chocolate sauce
8VanillaSlightly softEdibleConeLow sugarWith topping
9DurianSoftEdibleCupNo preservativesCoated with chocolate sauce
10VanillaVery softEdibleConeLow fatWith topping
11StrawberryVery softEdibleConeNo preservativesCoated with chocolate sauce
12DurianSoftEdibleConeLow sugarWith topping
13ChocolateSoftNon-edibleStickNo preservativesWith topping
14ChocolateVery softEdibleCupLow sugarCoated with chocolate sauce
15StrawberrySoftNon-edibleConeLow sugarWith topping
16VanillaSoftNon-edibleCupNo preservativesWith pieces of various fruits
17VanillaVery softNon-edibleStickNo preservativesCoated with chocolate sauce
18StrawberrySoftNon-edibleStickLow fatCoated with chocolate sauce
19ChocolateVery softEdibleConeNo preservativesCoated with chocolate sauce
20DurianSlightly softEdibleConeNo preservativesCoated with chocolate sauce
21ChocolateSoftEdibleConeNo preservativesWith topping
22ChocolateVery softEdibleConeLow sugarWith pieces of various fruits
23ChocolateSoftEdibleConeLow fatWith pieces of various fruits
24DurianVery softNon-edibleStickLow sugarCoated with chocolate sauce
25VanillaSoftEdibleCupLow sugarWith pieces of various fruits
Table 7. Utility estimate of each attribute.
Attribute
(Importance Values)
VariantUtility Estimate
Taste
(42.899)
Chocolate2.659
Vanilla−0.942
Strawberry0.363
Durian−2.080
Shape
(13.678)
Cup0.524
Cone−0.134
Stick−0.390
Health
(9.133)
No preservatives0.491
Low sugar−0.040
Low fat−0.451
Appearance
(14.813)
With topping0.403
Coated with chocolate sauce0.270
With pieces of various fruits−0.674
Texture
(11.168)
Very soft−0.423
Soft−0.847
Slightly soft−1.270
Packaging
(8.309)
Edible−1.843
Non-edible−3.687
(Constant)15.508
Table 8. Total utility and ranking for each product configuration.
Product ConfigurationTotal UtilityRankingProduct ConfigurationTotal UtilityRanking
110.791221416.6552
212.102141511.56618
315.53051610.37324
412.648121710.82721
517.31911810.76623
613.050111916.5283
714.38772010.94220
811.682172116.2374
912.023152215.0536
1012.118132314.2189
1114.2328249.15825
1210.967192511.68616
1314.13710
Table 9. Values of attributes’ relationships.
AttributesDijRijD − RD + R
Taste1.0075520.9850290.0225221.992581
Texture1.1132120.7776550.3355581.890867
Packaging materials1.2084720.7992730.4091992.007745
Shape0.8355850.6498990.1856861.485484
Health benefits1.3616171.1624620.1991552.524079
Appearance0.6859851.838104−1.1521192.524089
Table 10. Relationships between attributes.
AttributesTasteTexturePackaging MaterialsShapeHealth BenefitsAppearance
Taste
Texture
Packaging materials
Shape
Health benefits
Appearance
Note: √ = There is a relationship.
Table 11. Ice-cream module.
ModulesVariants
1Chocolate taste, very soft textured, no preservatives
2Chocolate taste, very soft textured, low sugar
3Chocolate taste, soft textured, no preservatives
4Chocolate taste, slightly soft textured, low fat
5Chocolate taste, soft textured, low sugar
6Strawberry taste, very soft textured, no preservatives
7Chocolate taste, soft textured, low fat
8Chocolate taste, slightly soft textured, low sugar
9Strawberry taste, very soft textured, low sugar
10Vanilla taste, very soft textured, low fat
11Strawberry taste, slightly soft textured, no preservatives
12Durian taste, soft textured, no preservatives
13Vanilla taste, soft textured, low sugar
14Vanilla taste, slightly soft textured, low sugar
15Strawberry taste, soft textured, low sugar
16Durian taste, soft textured, low sugar
17Durian taste, slightly soft textured, no preservatives
18Vanilla taste, very soft textured, no preservatives
19Durian taste, very soft textured, low fat
20Strawberry taste, soft textured, low fat
21Vanilla taste, soft textured, no preservatives
22Durian taste, very soft textured, low sugar
Table 12. Packaging module.
ModulesVariants
1Edible cup
2Edible cone
3Non-edible cup
4Non-edible stick
5Non-edible cone
Table 13. Appearance module.
ModulesVariants
1Topping
2Chocolate sauce
3Pieces of various fruits

