Article

Financial and Energetic Optimization of Greek Buildings Insulation

by
Georgios Mitsopoulos
,
Evangelos Bellos
* and
Christos Tzivanidis
Thermal Department, School of Mechanical Engineering, National Technical University of Athens, 15780 Athens, Greece
*
Author to whom correspondence should be addressed.
Designs 2018, 2(3), 34; https://doi.org/10.3390/designs2030034
Submission received: 30 August 2018 / Revised: 12 September 2018 / Accepted: 14 September 2018 / Published: 17 September 2018

Abstract

:
The most important parameter in the design of the building envelope is the insulation thickness, because it dramatically influences the heating and cooling loads. The objective of this study is the investigation of different insulation scenarios for the four climate zones of Greece and, more specifically, the cities Heraklion, Athens, Thessaloniki, and Florina. The insulation thickness is examined up to 8 cm and the optimum thickness is determined by the minimization of the simple payback period in order to design a cost-effective system. Moreover, the primary energy consumption, the heating/cooling loads, and the equivalent CO2 emissions are calculated. Furthermore, a multi-objective evaluation procedure of the various insulated scenarios is conducted in order to show the relationship between the energetic and the financial optimization. Generally, it is found that the optimum insulation thickness is around 4 cm for all the climate zones using financial criteria, while the energy criteria indicate higher thicknesses. These results can be applied to the suitable design of Greek residential buildings.

1. Introduction

Building consumes large amounts of energy, which is approximately the 30–40% of the worldwide energy consumption [1]. More specifically, this percentage is variable among the countries and it is 41% for the United States, 28% for China, and 37% for Europe [2,3]. The energy consumption for covering the heating and the cooling needs is about the 2/3 of the total energy needs in the buildings [4]. Thus, it is obvious that there is a need for reducing these energy amounts in order to achieve lower energy consumption worldwide [
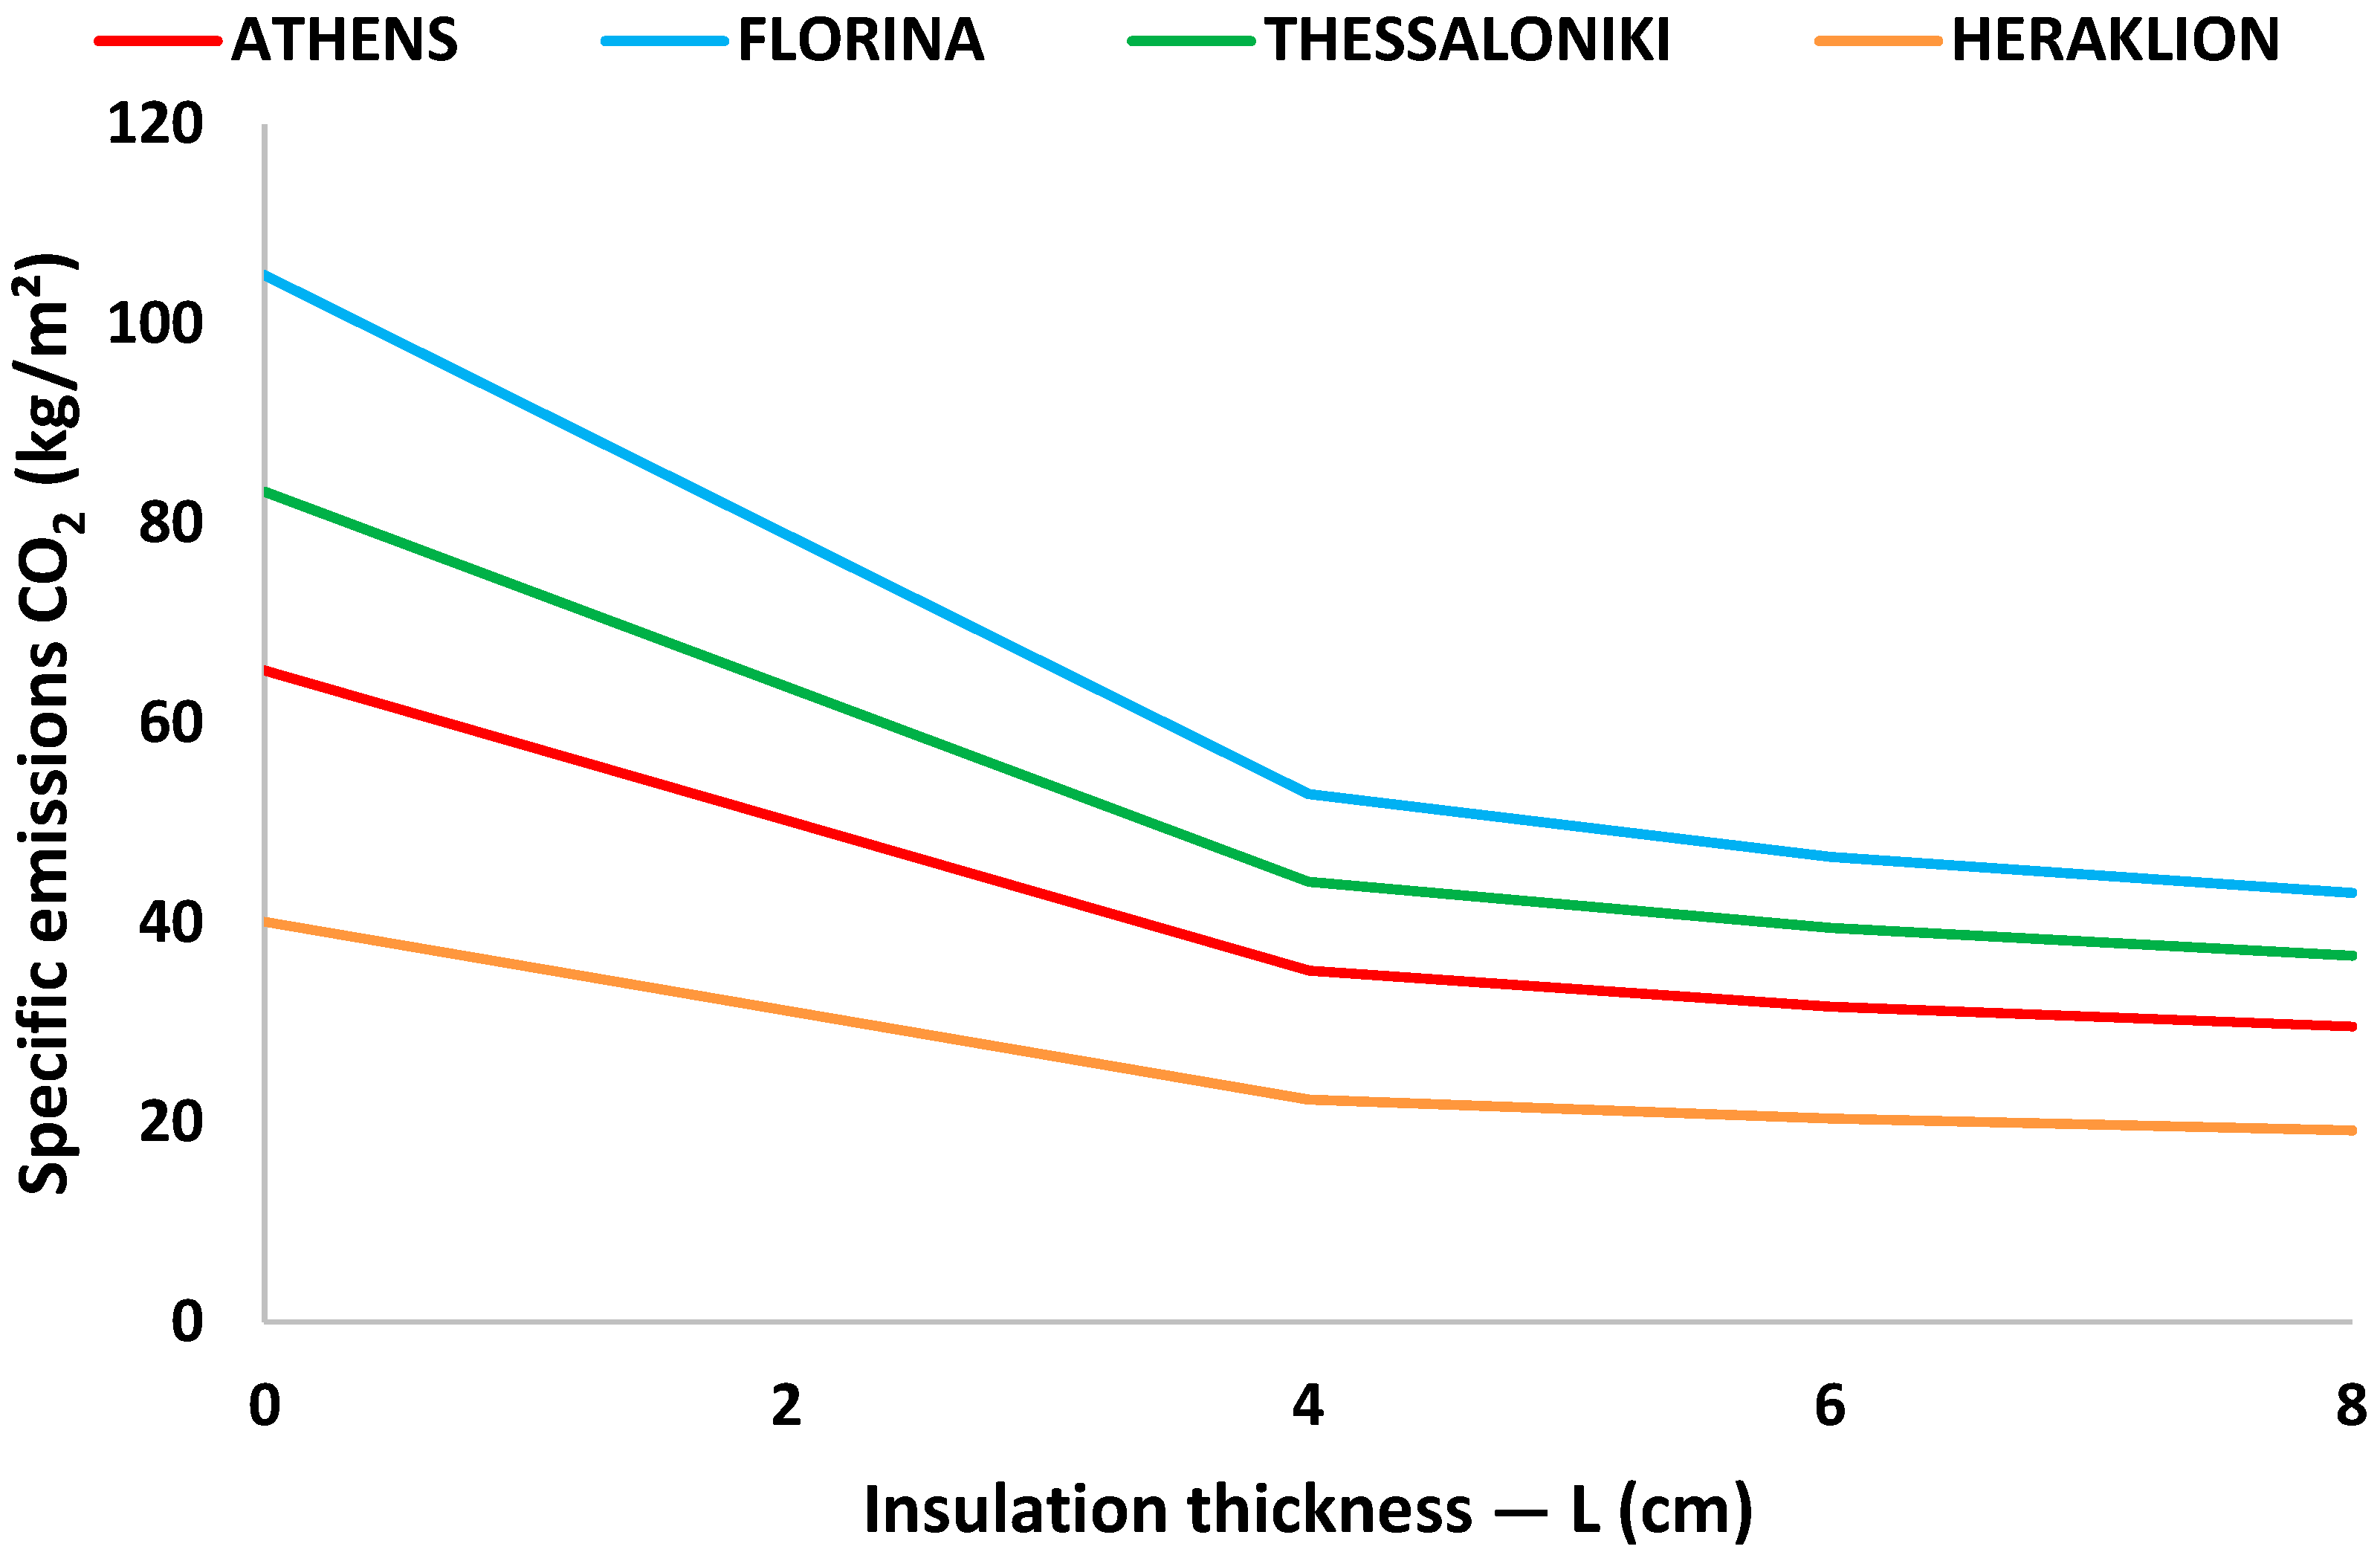
5]. Reducing the energy consumption in the building is beneficial for the total society because of the reduction in the CO2 emissions and the reduction in the operational cost of the buildings [6].
One of the most effective ways of reducing the energy consumption in buildings is the use of insulation in the building envelope [7,
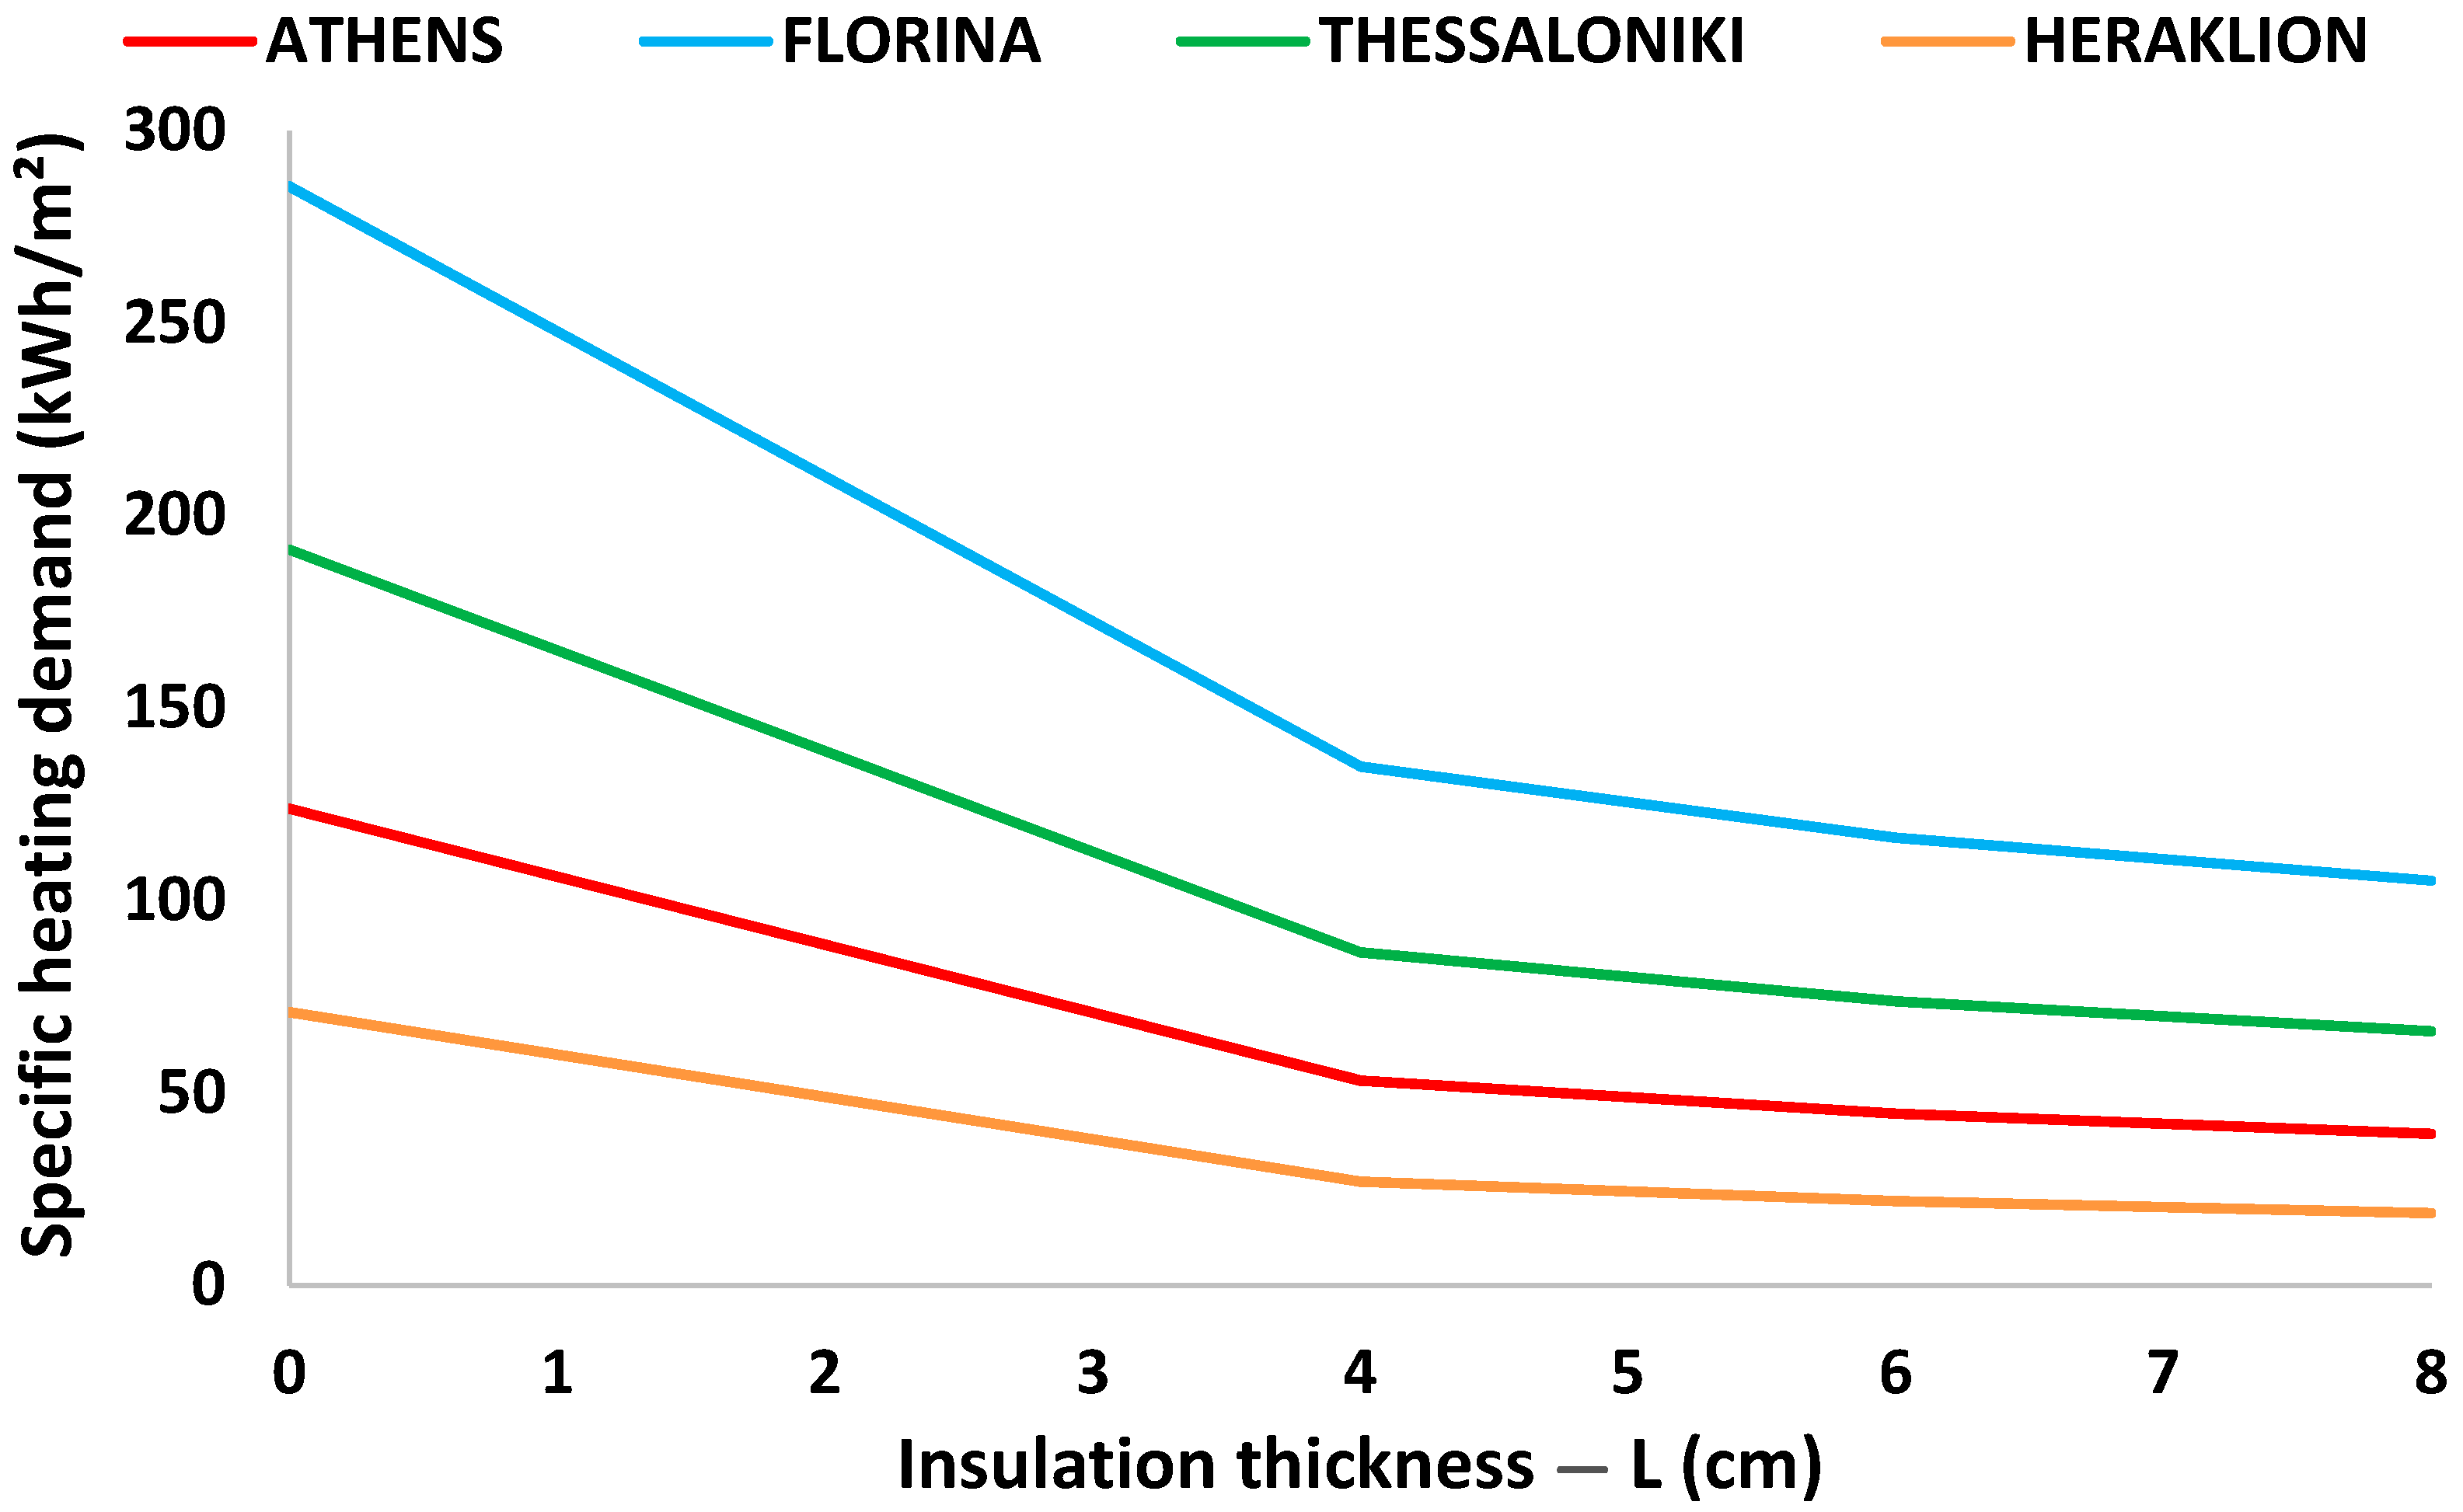
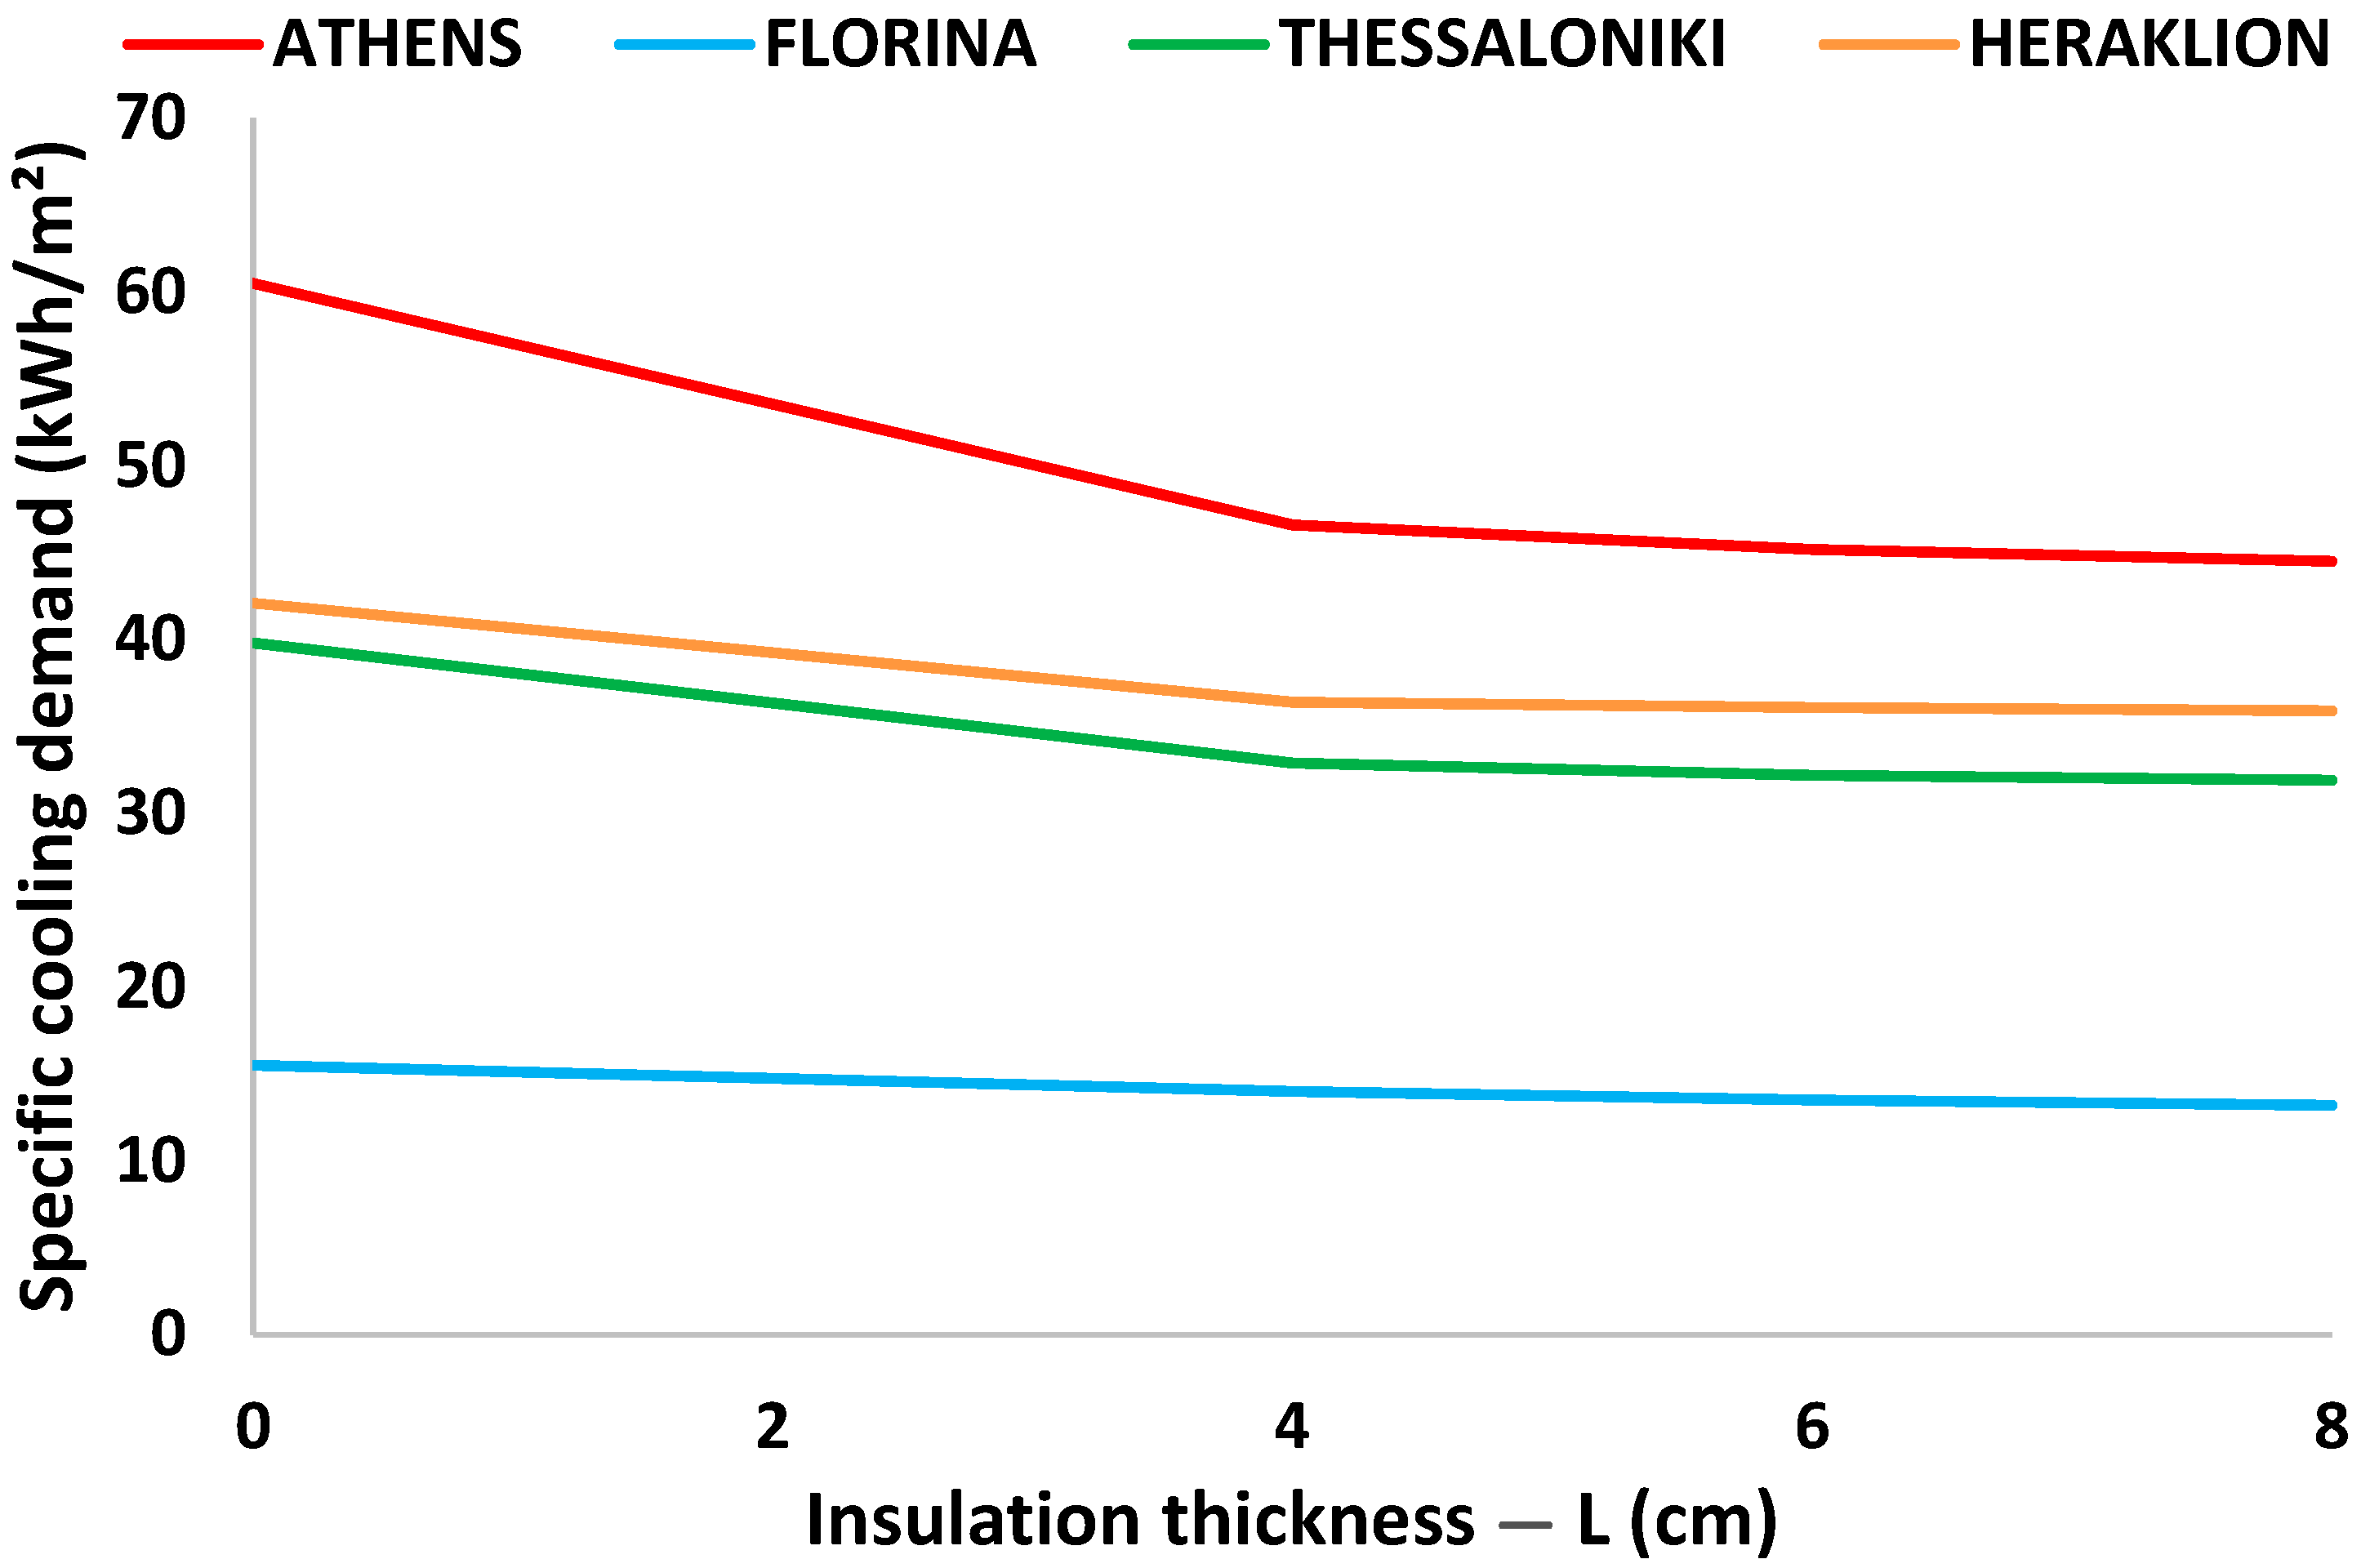
8]. The thickness of the insulation layer is a critical factor that determines the energetic and financial sustainability of every building. The insulation layer is extremely important for the reduction of both the heating and cooling loads, but especially for the heating loads, which can be varied from 15 up to 100 kWh/m2 [9,10]. Moreover, the use of insulation is able to increase the thermal comfort inside the buildings and so the productivity of the workers can be increased [11], and the sleeping or living conditions can also be enhanced [
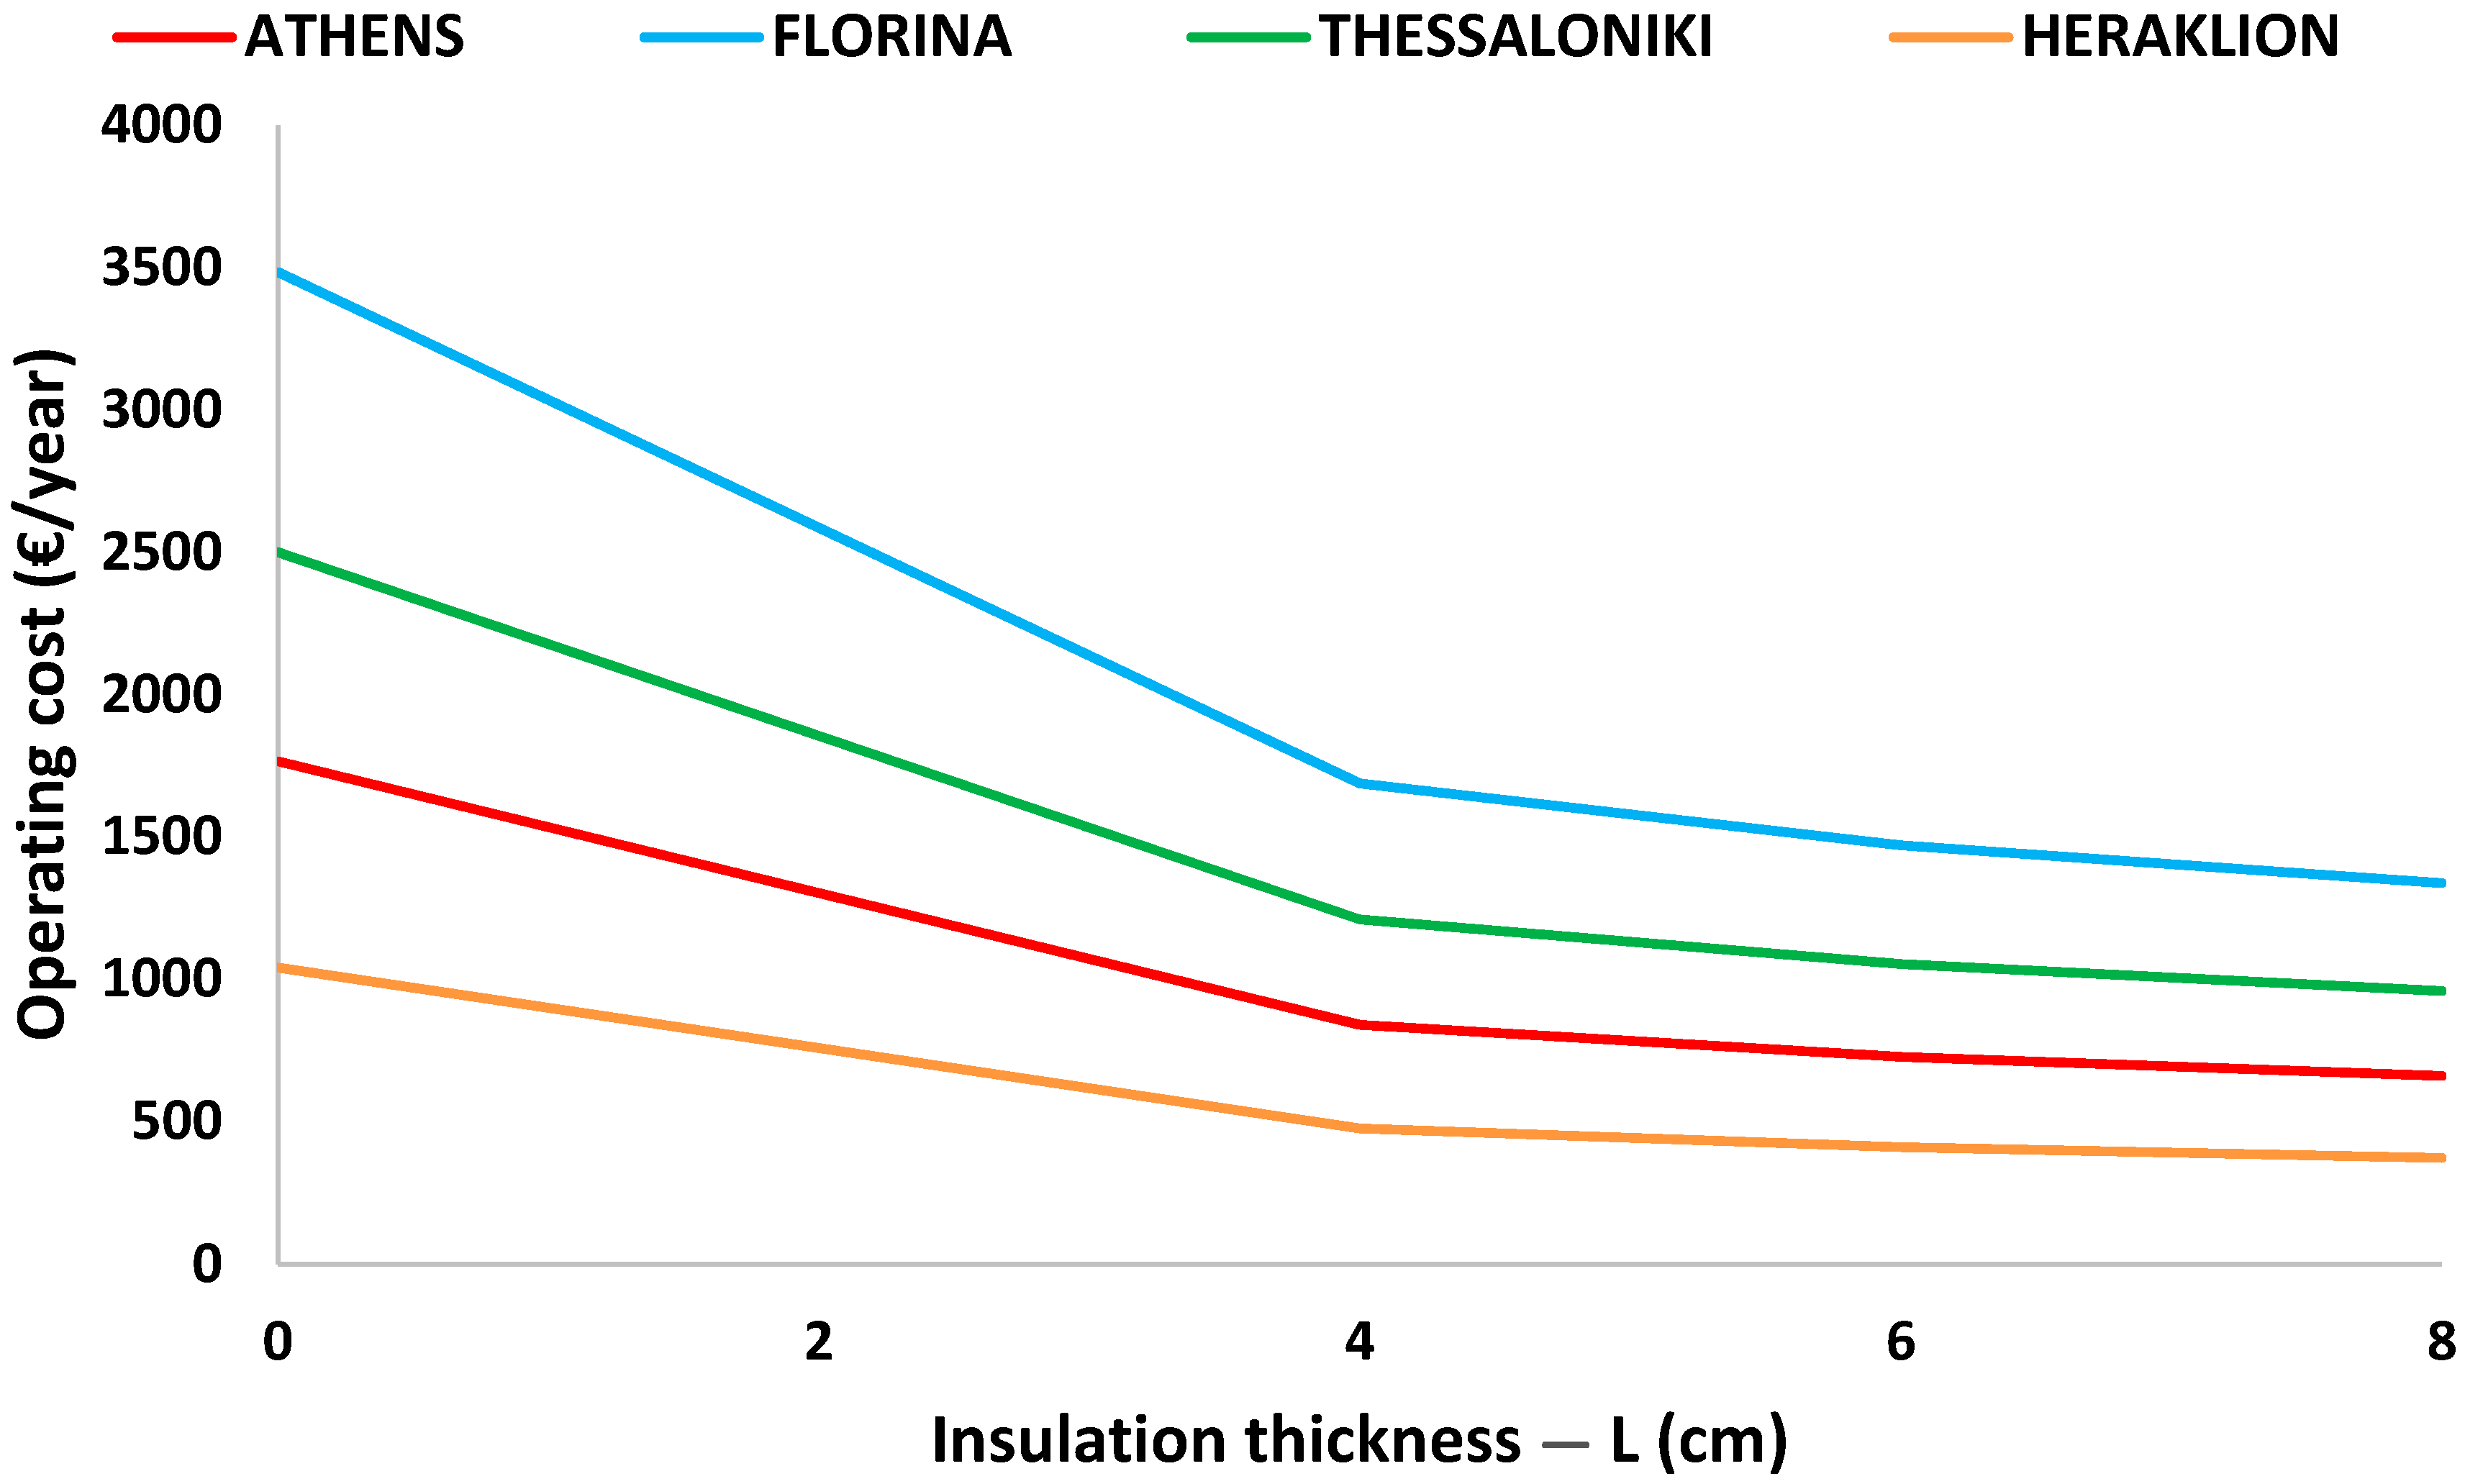
12]. However, the use of insulated and especially well-insulated envelopes increases a lot of the construction cost of the building. However, this higher investment cost can be balanced by the reduction in the energy consumption, which reduces the operational cost of the building [13]. In every case, it is important to take into consideration the life cycle of the building and investigate its energy consumption during its operation, as well as the energy consumption for the production of the utilized materials [14,15].
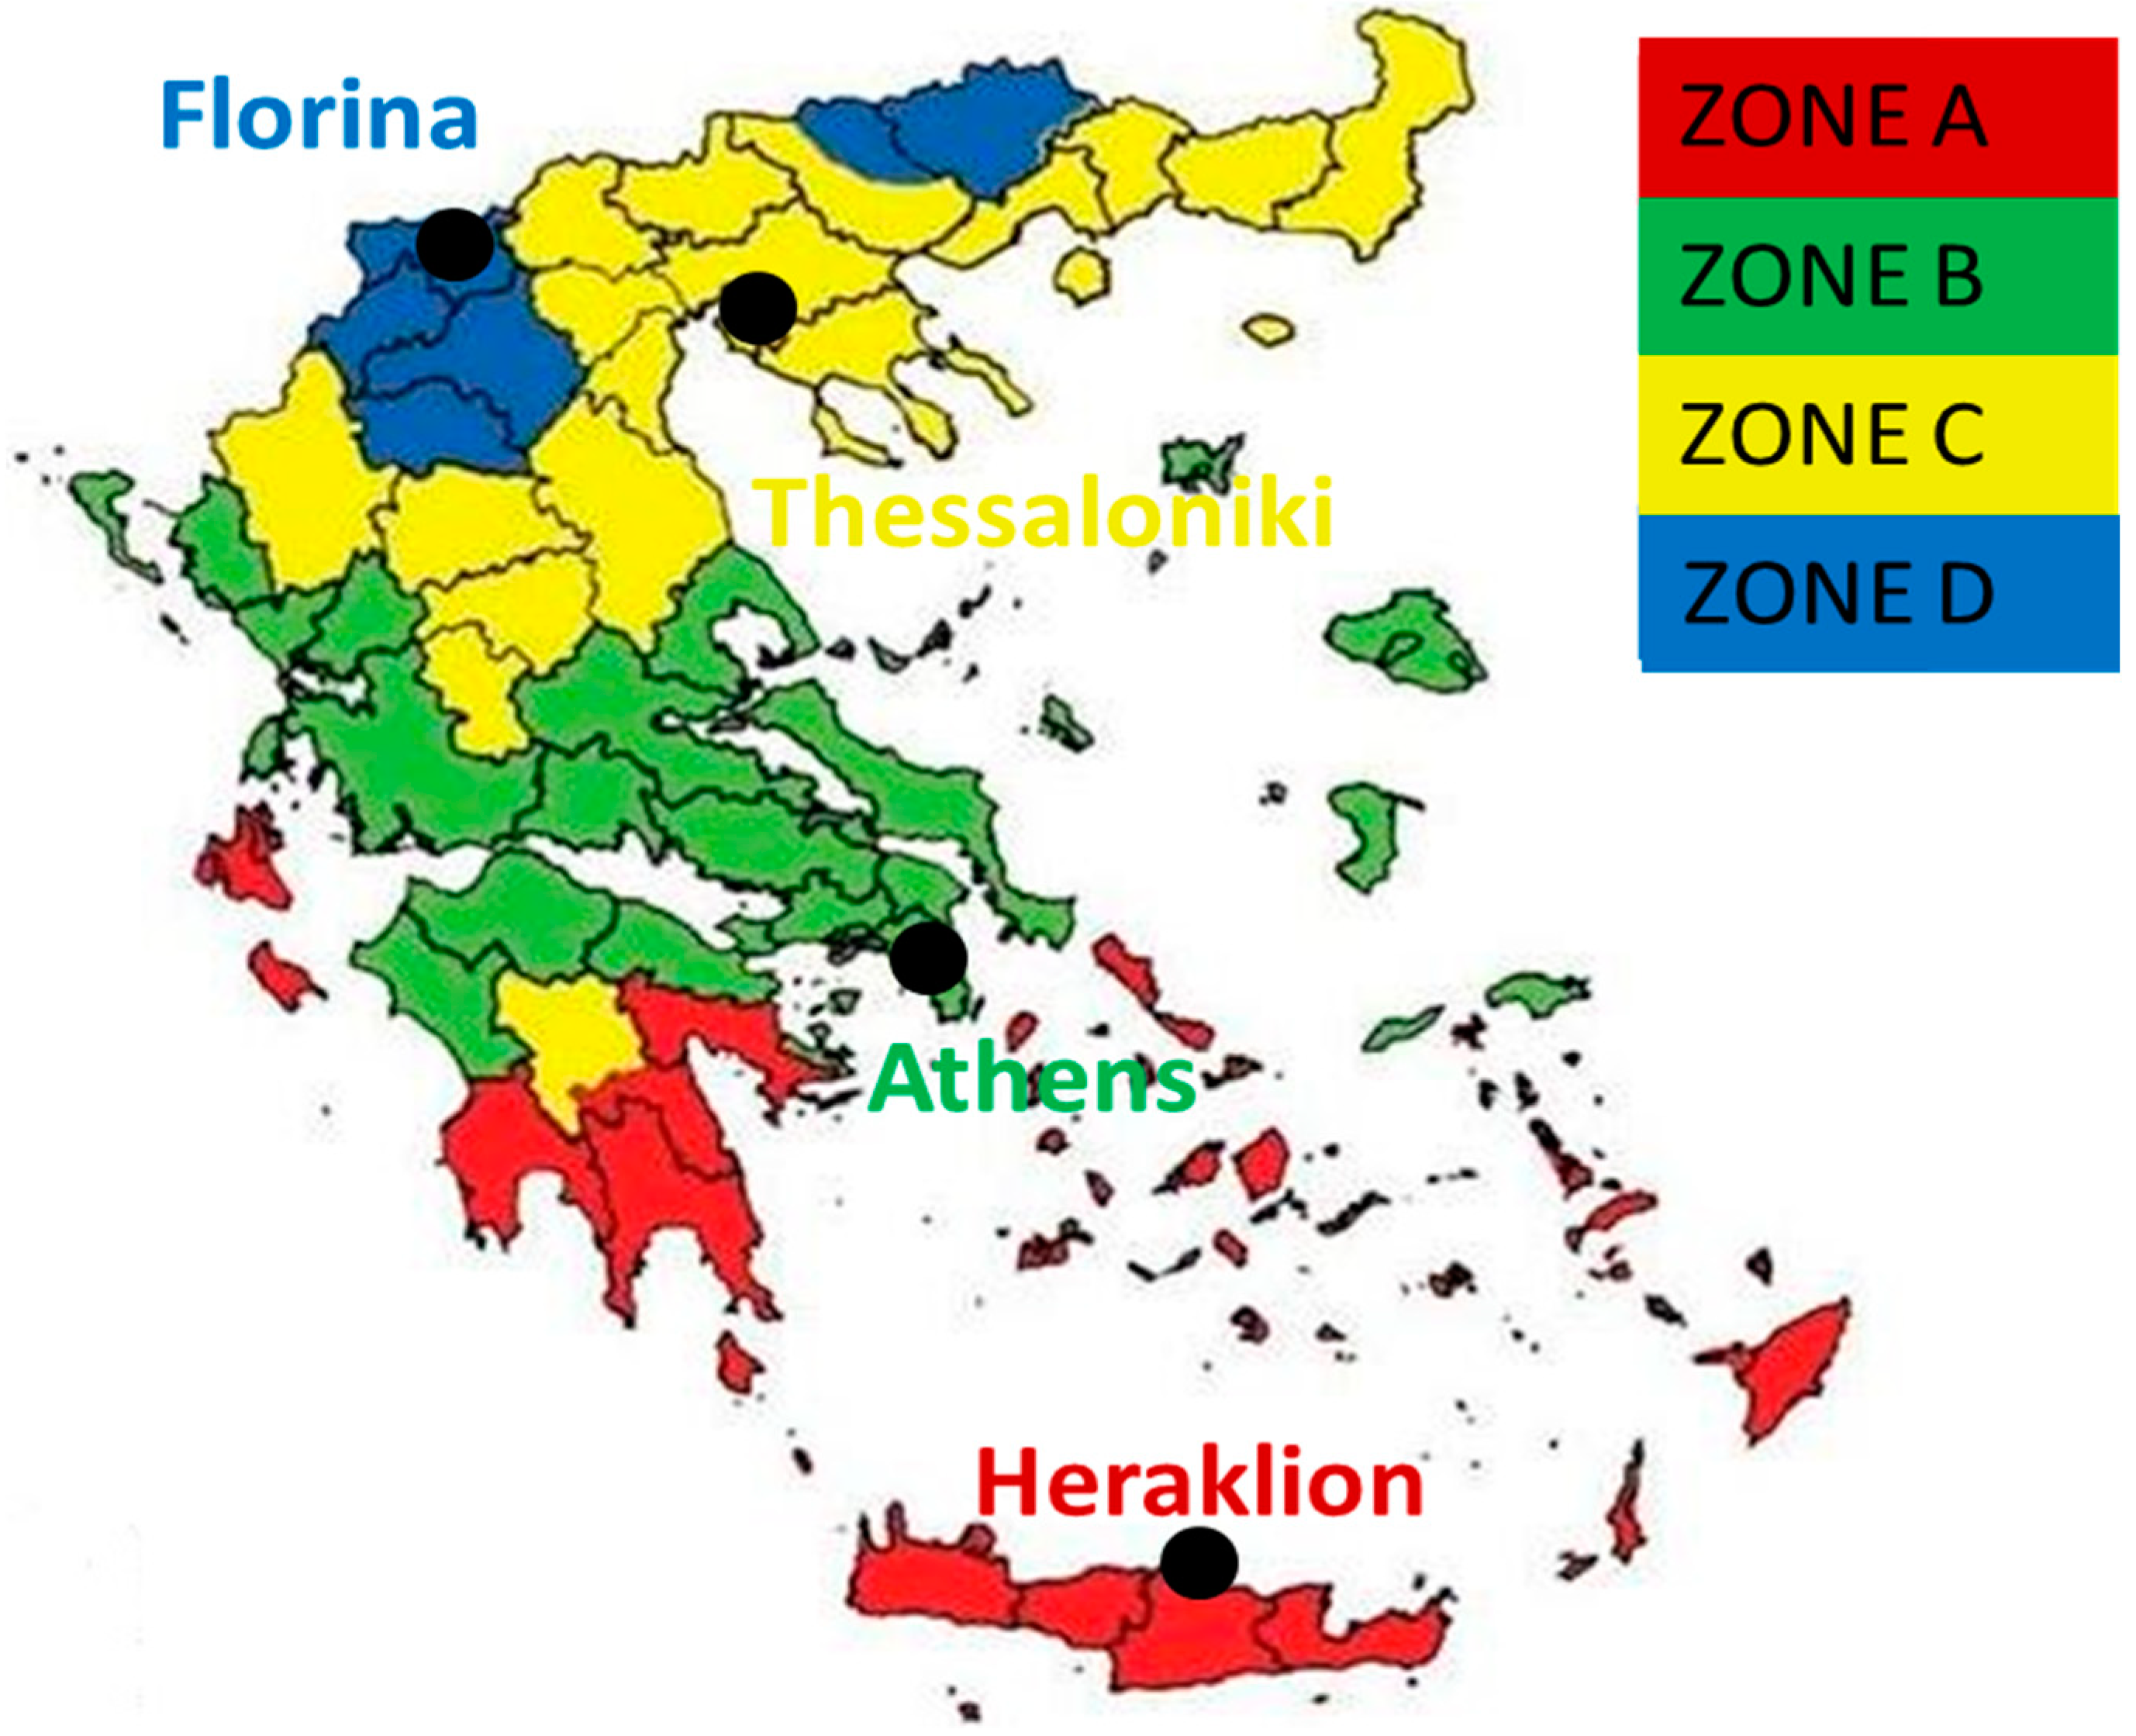
Greece is a country with significant heating and cooling loads, which creates high energy consumption in the buildings. Generally, the countries are separated into different climate zones in order to group regions with similar weather conditions [16]. Greece is separated into four climate zones (A to D), with zone A being the warmest and zone D being the coldest. The deviations of the leads between the zones are important and so there are special regulations for the insulation design for every zone and for every envelope type [17]. In the literature, there are studies that have investigated loads of the buildings for the Greek climate, as well as different technologies for covering these loads. Bellos et al. [18] examined a typical building envelope in Athens (Greece) parametrically and found that the ventilation is the most important parameter for the determination of the loads in a building. Papakostas et al. [19] examined different building envelopes with and without insulation for three climate zones of Greece (A, B, and C). They evaluated various scenarios financially and found that the use of excessive insulation is not favorable for zone C. Michopoulos et al. [20] studied a typical building in Thessaloniki and found that the use of renewable energy sources is able to enhance the total building performance by 54%. Martinopoulos et al. [21] examined different heating systems in Greek climate conditions and found that the use of natural gas is the most cost-effective choice, followed by heat pumps and biomass boilers, respectively. Tzivanidis et al. [22] studied different solar heating system with and without heat pumps. They found that the use of 25 m2 flat pale collectors coupled with a heat pump led to the minimum electricity consumption. Moreover, Tzivanidis et al. [23] examined different solar heating systems for different insulation scenarios in buildings and found the optimum insulation thickness to be around 6 cm for Athens. In another important study, Dascalaki et al. [24] stated that the addition of insulation in the old Greek buildings (built before 1980) can lead to the proper energy consumption reduction that is demanded in Greece. Lastly, Droutsa et al. [25] performed a mapping of the Greek building energy performance and found numerous buildings in low categories. Moreover, they stated that the most usual retrofitting techniques are the use of improved windows and the use of solar collectors for domestic hot water production or space-heating.
Besides the Greek climate, there are other literature studies about the impact of insulation thickness and other parameters in the building thermal behavior. Marion et al. [26] found that the windows to wall ratio is a useful parameter concerning building energy consumption in Italy. They stated that the optimum value of this parameter is close to 30%, but it is not the same for all locations. Jain and Pathak [27] found that utilization of the proper insulation in the external wall can reduce the indoor temperature levels by about 4 K for the hot climate zones of India. Khoukhi [28] found that the increased moisture is able to reduce the effectiveness of the insulation and leads to cooling loads increase in Oman. Torres-Rivas et al. [29] found that the use of a 24 cm cotton insulation layer is able to reduce the cost of the system by 28% compared with the optimum scenario with polyurethane. Shekar and Krarti [30] performed a study about the USA and they found 17% lower energy consumption using dynamic insulation materials. Moreover, the dynamic insulation has been examined by Koenders et al. [31]. They found a reduction in the heating demand of up to 22% for the central European climate conditions. The previous studies indicate that in the literature for locations out of Greece, interesting ideas have been examined (e.g., dynamic insulation materials).
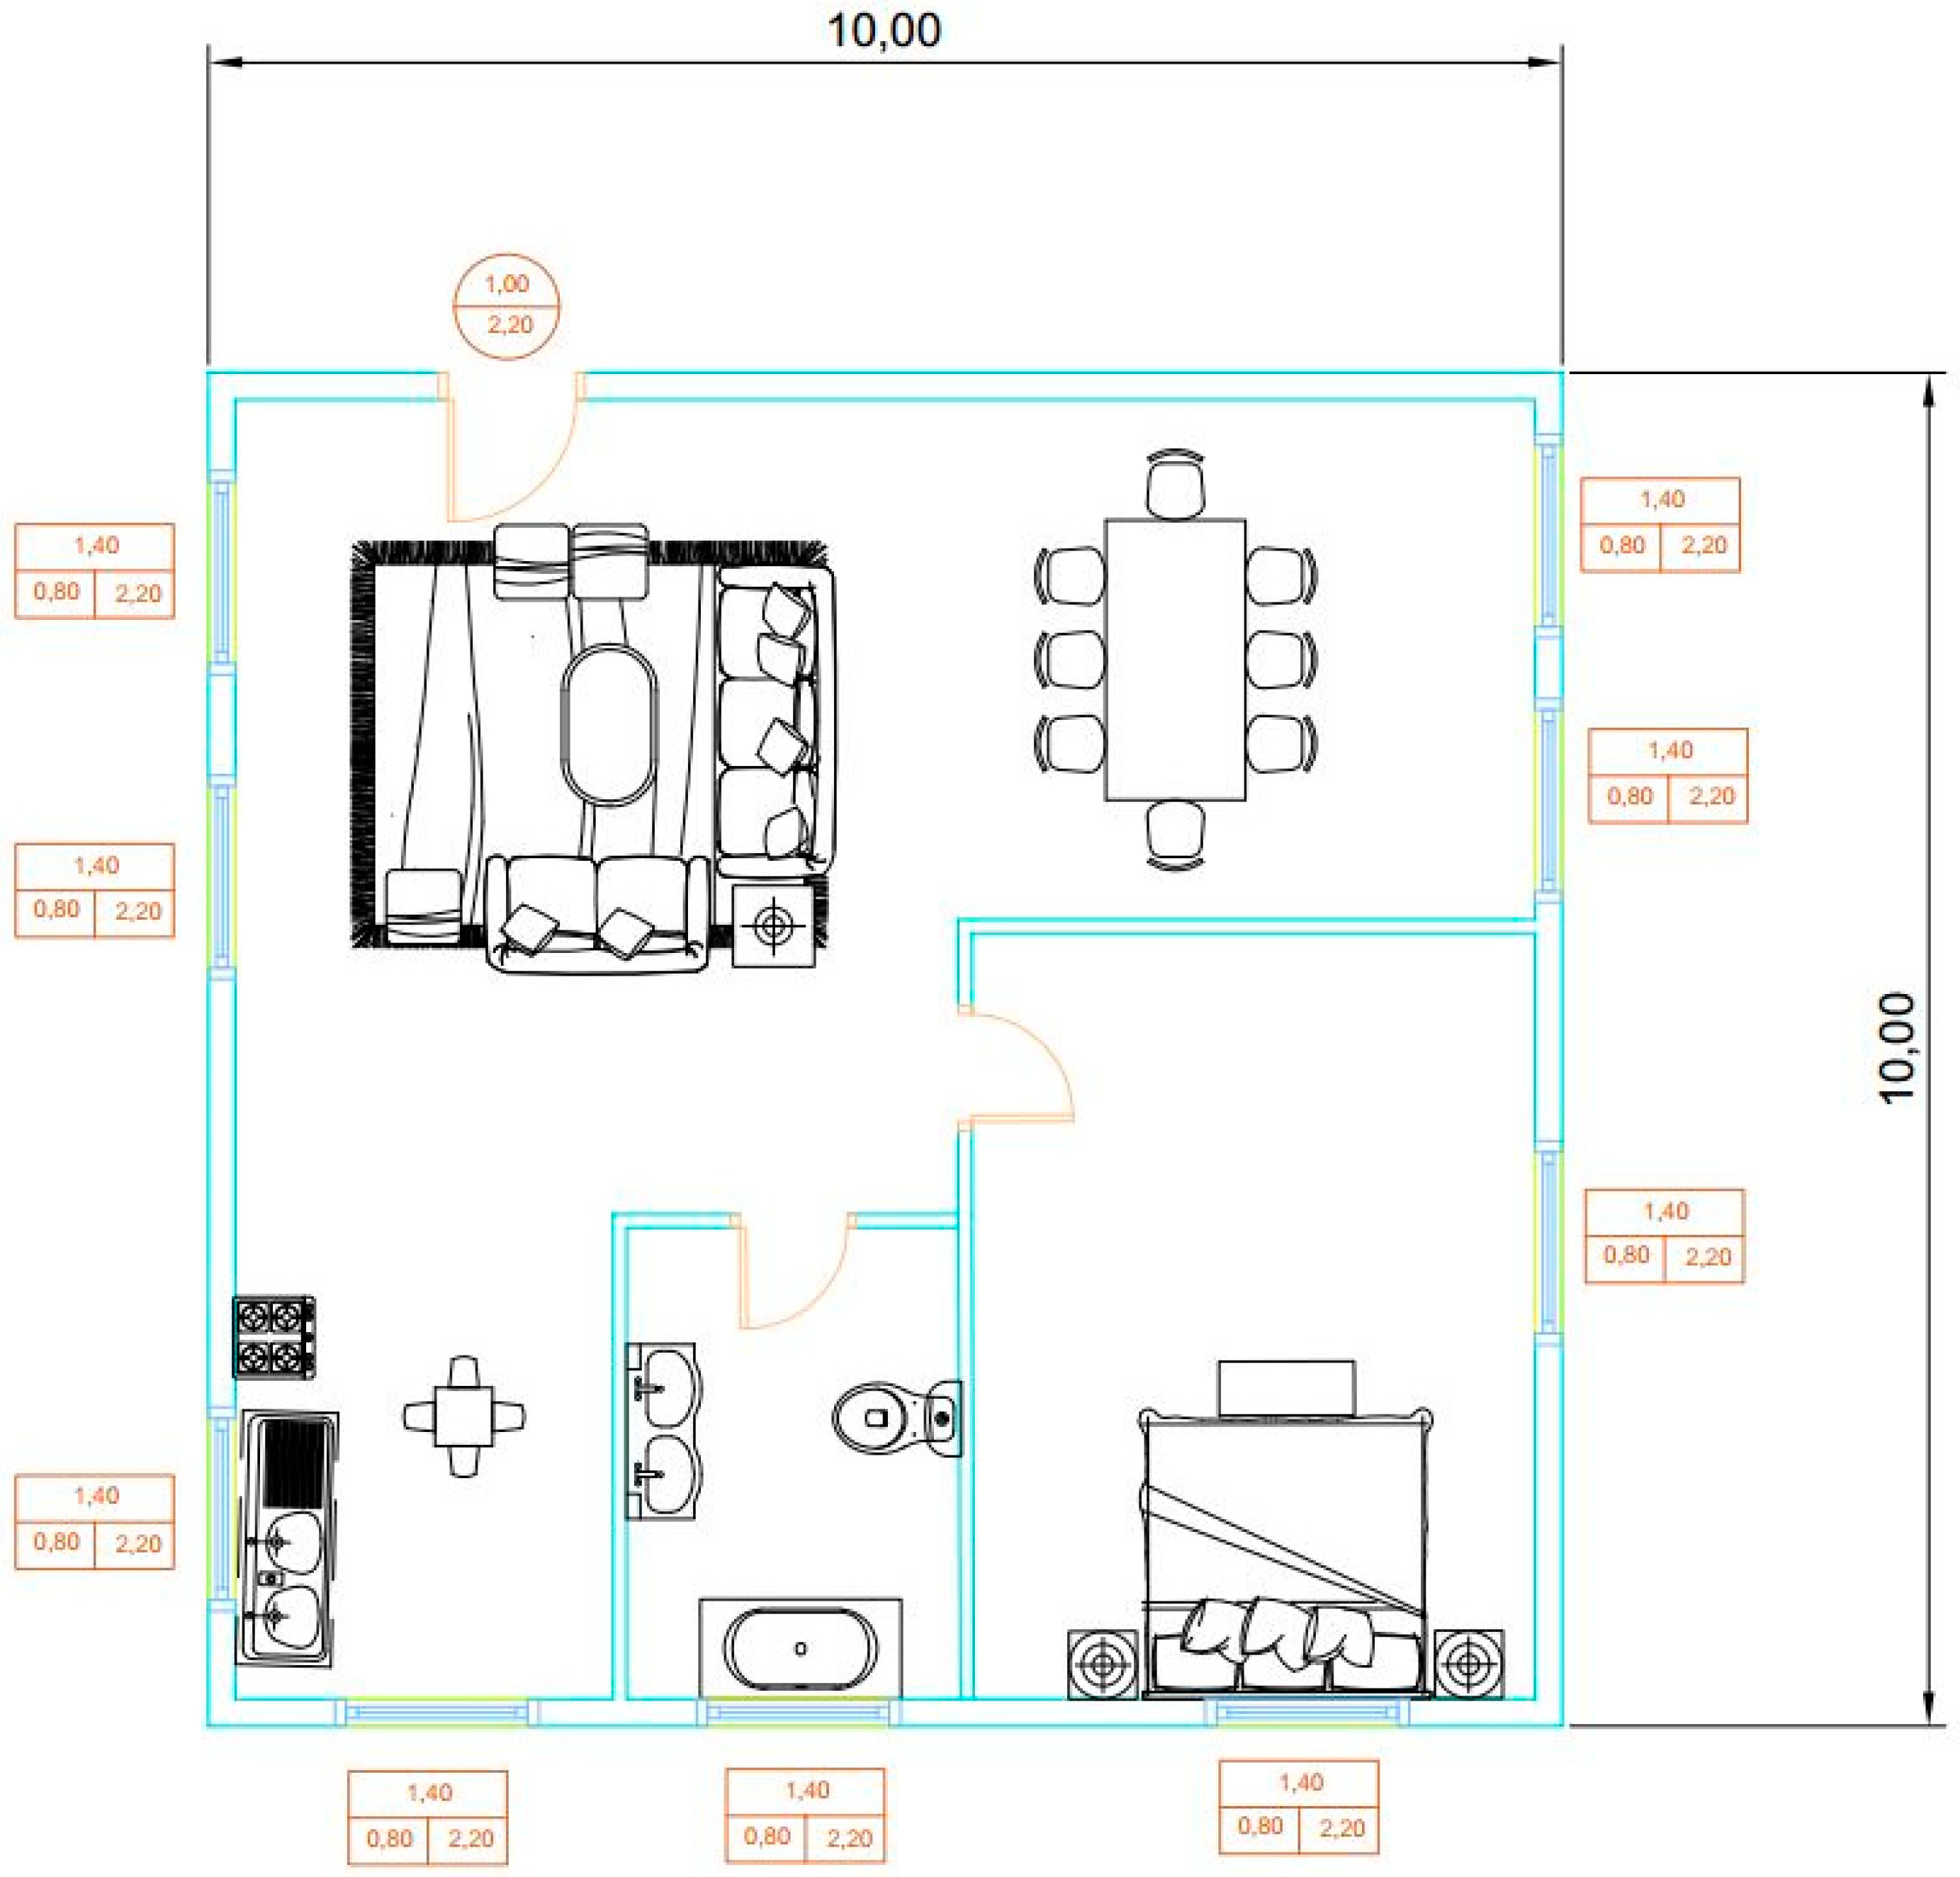
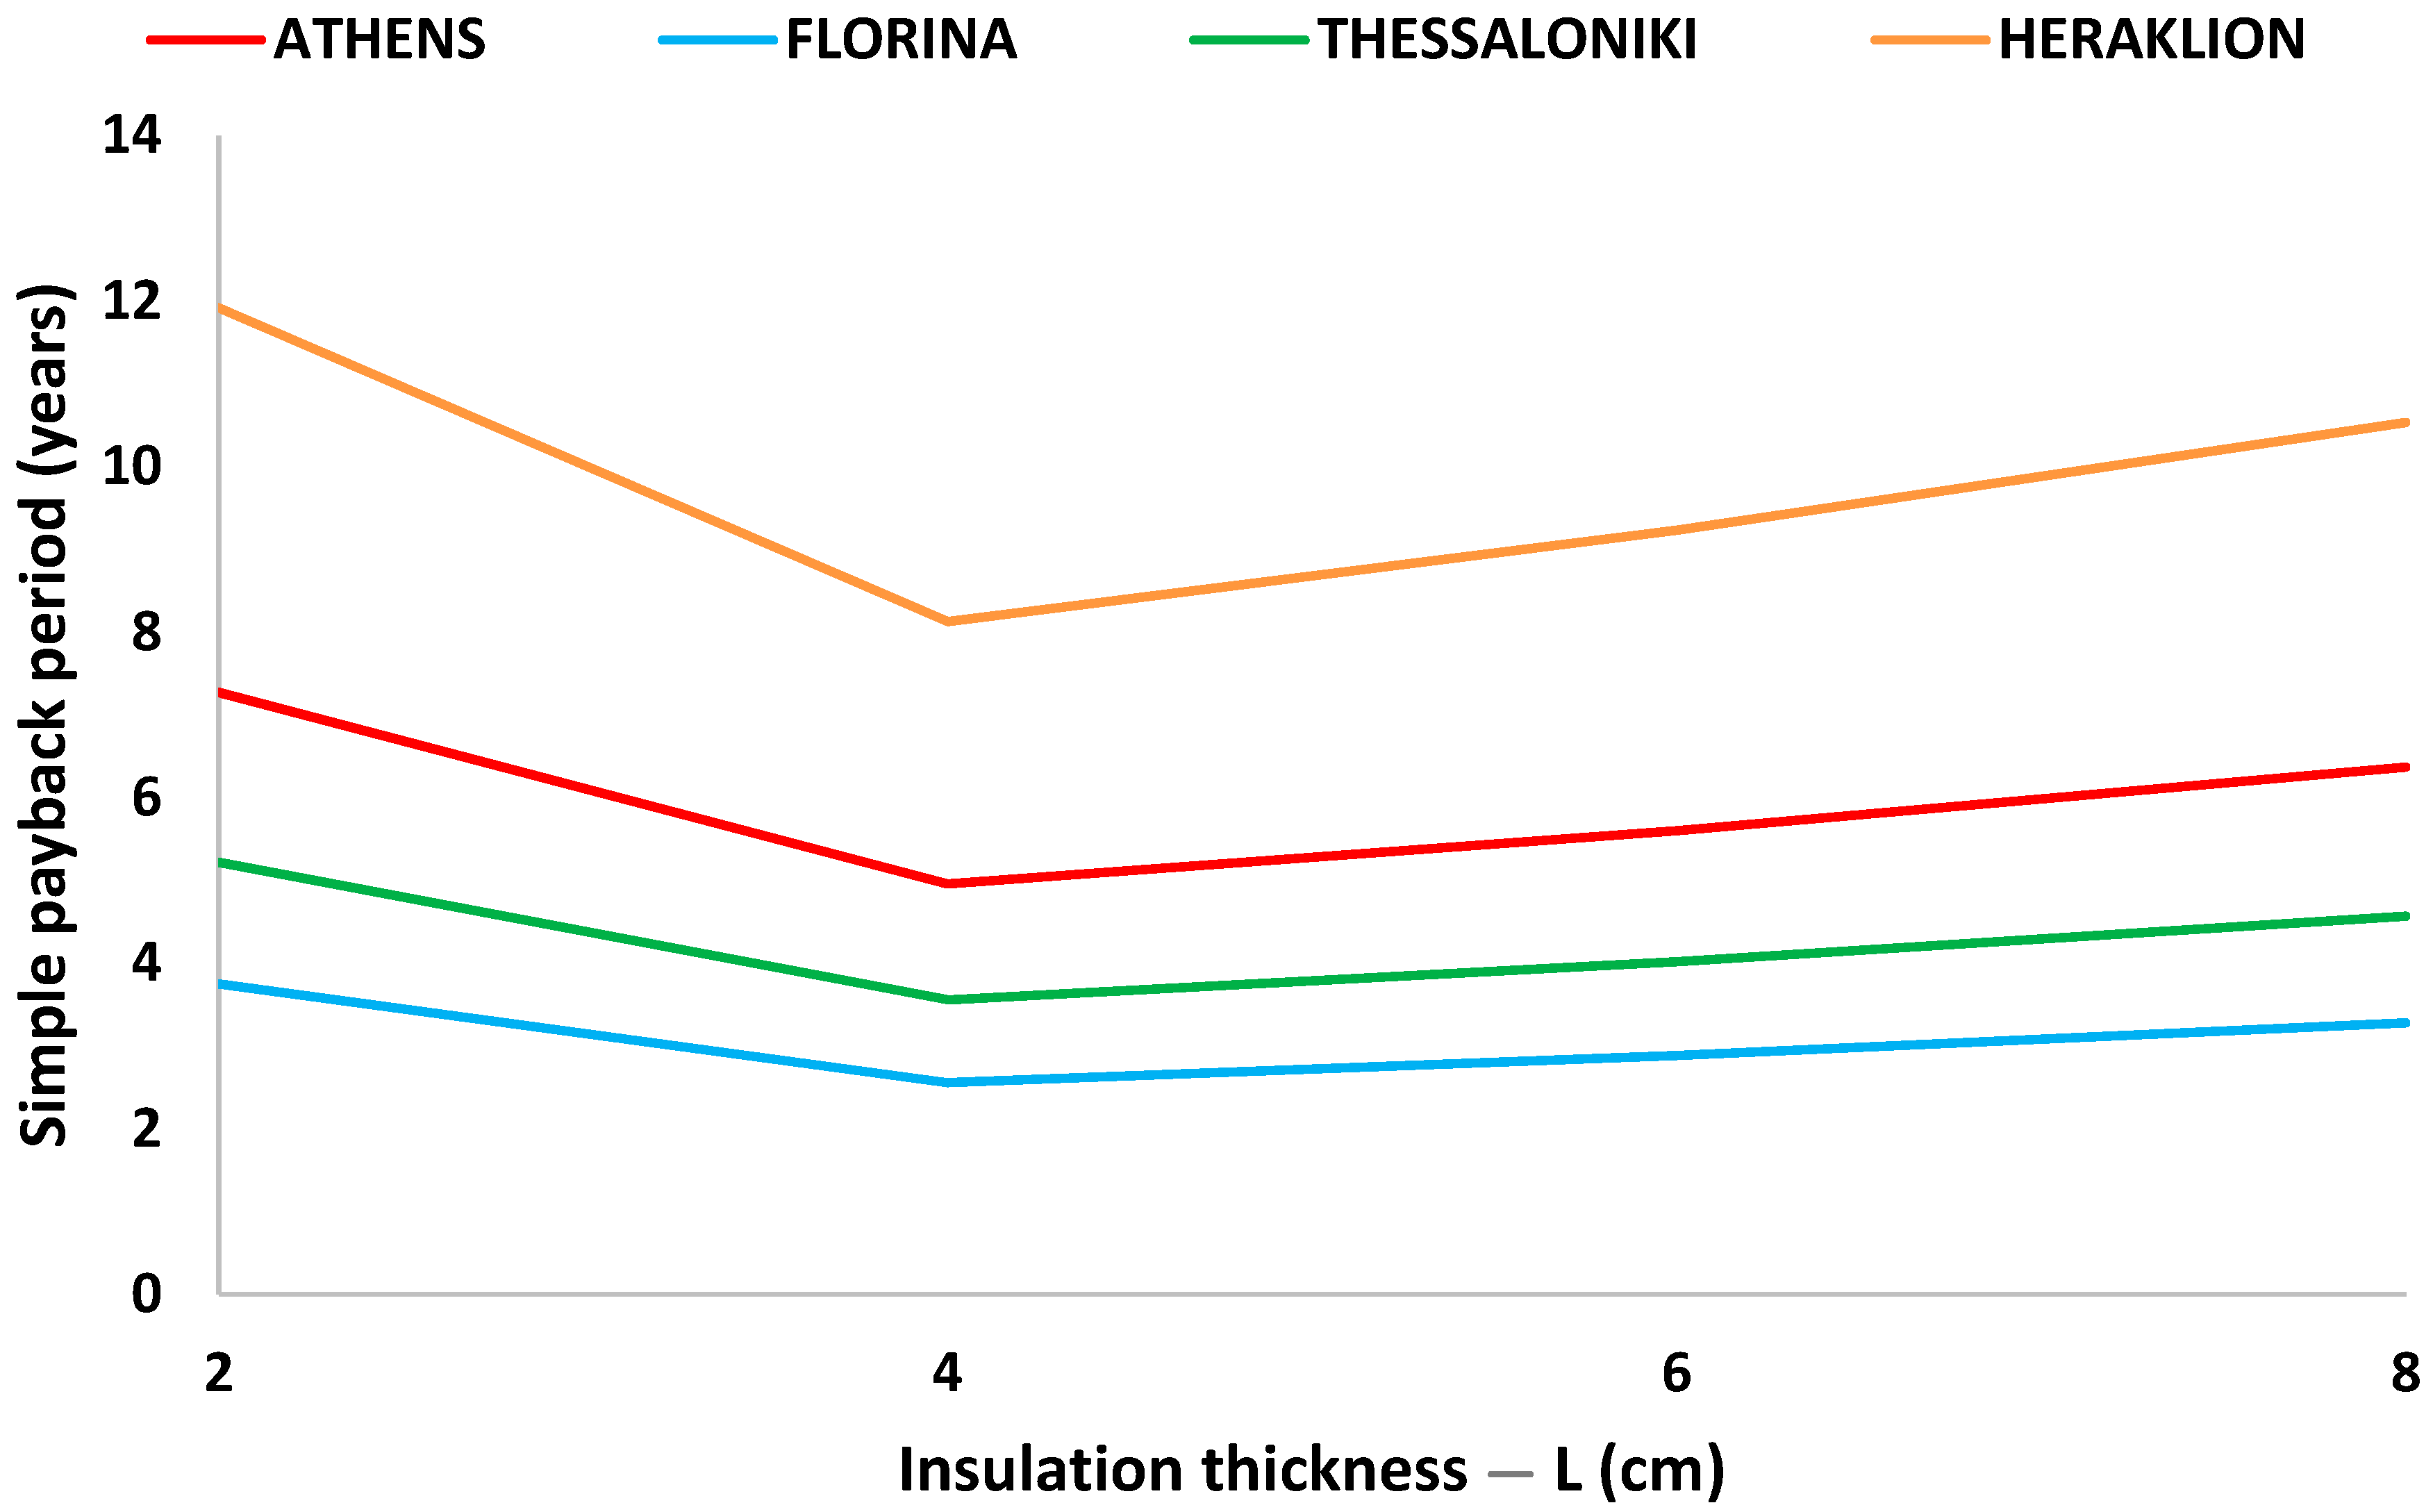
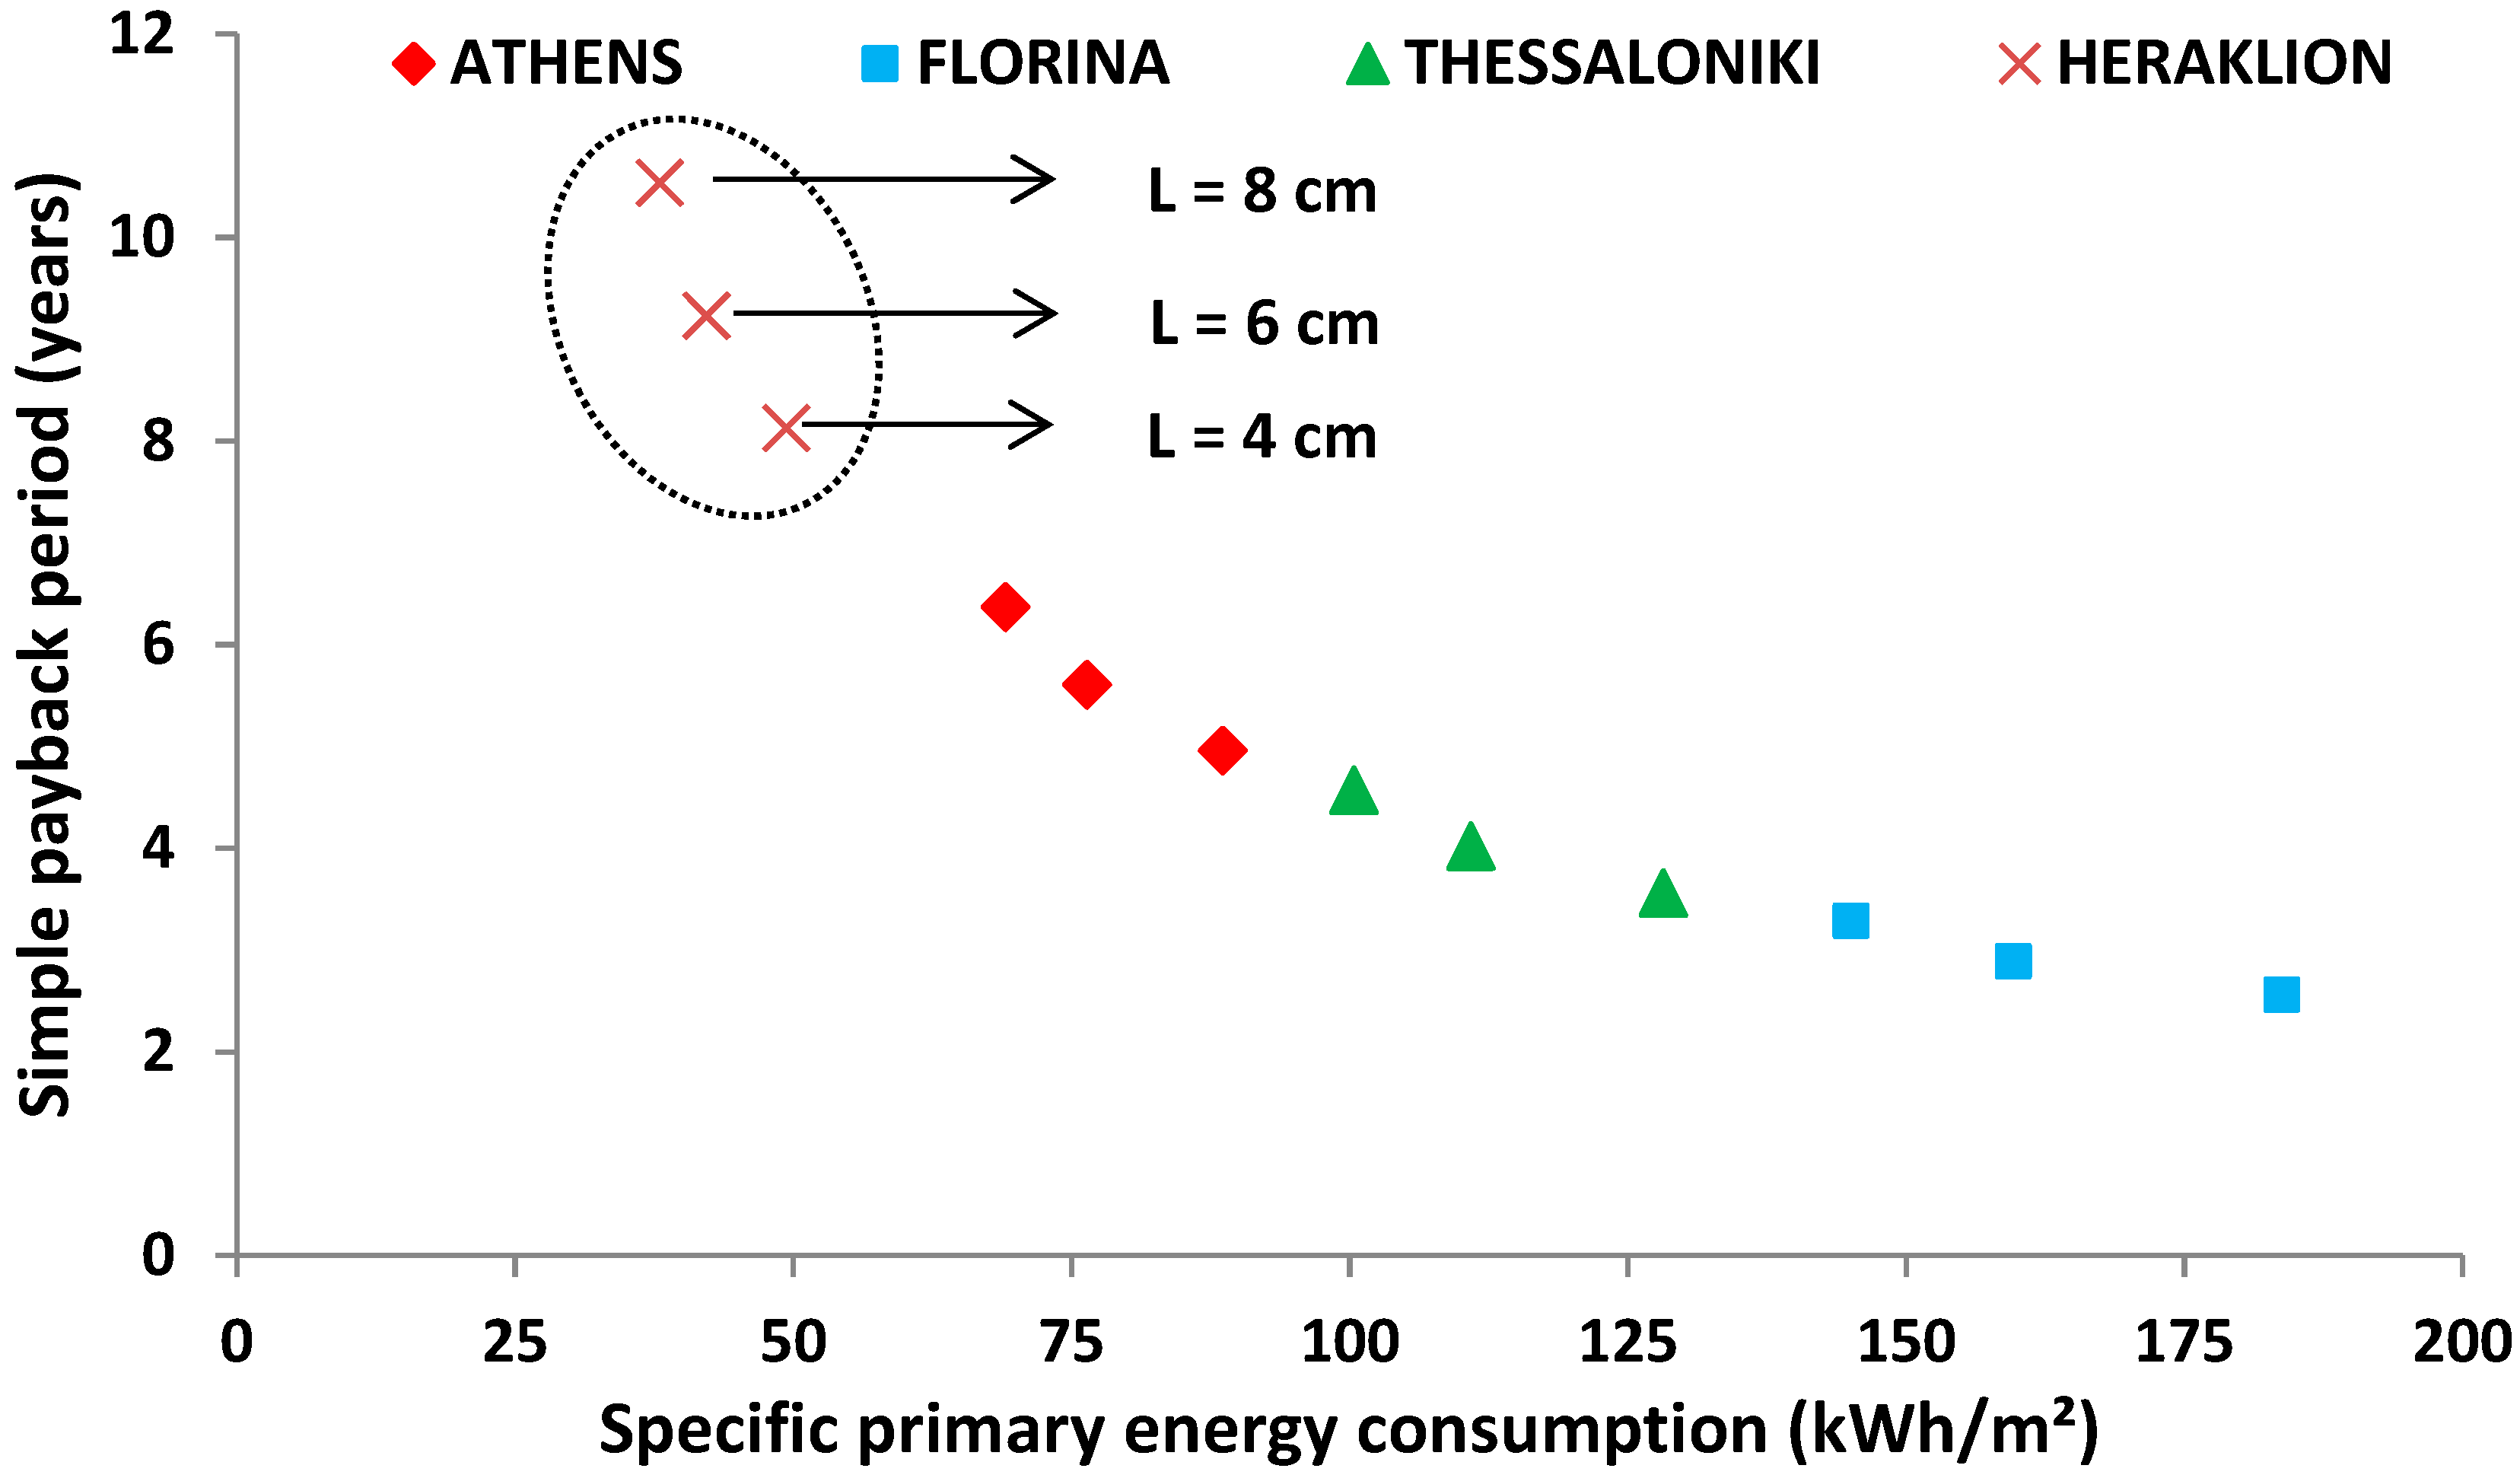
The previous brief literature review shows that there is a lot of research about the energy systems and the envelope insulation in the Greek climate conditions. Moreover, the climate deviations among the Greek climate zones make the situation complex, with a different optimum scenario to be found among the different zones. In this direction, this study comes to examine energetically and financially different insulation scenarios for all the Greek climate zones in a systematic way. The analysis is conducted for insulation thickness up to 8 cm, for a usual building envelope. The heating loads are covered with a usual system with a boiler, while there is a heat pump for covering the cooling loads. The analysis is conducted with the TEE-KENAK software, which is official software according to the Greek legislation by the Technical Chamber of Greece (Athens, Greece). It is important to state that this work does not examine the acoustic point of view of the different insulation scenarios. The results of this work regard the heating loads, cooling loads, primary energy consumption, CO2 emissions, operational cost, and simple payback period of all the examined cases. The insulation cost is taken into consideration, which is something important for these studies but is seldom taken into account. The final results of this work indicate the optimum financial scenario for every case, as well as the relationship between the energetic and financially optimum choices. These results can be used for the future design of a Greek residential building in all the climate zones. The novel part of this work is associated with the separate investigation of the energy and cost analysis, as well as the investigation of the insulation cost. Furthermore, the advantages/disadvantages of the great insulation thickness can be found by the multi-objective evaluation procedure.

2. Materials and Methods

2.1. Greek Climate Zones

Greece is a country with important climate variations because of the high percentage of mountainous land and the great coastline. Thus, it has been separated into four climate zones in order to be studied with higher accuracy. In this work, four representative cities, one for every climate zone, are investigated. They are Heraklion (zone A), Athens (zone B), Thessaloniki (zone C), and Florina (zone D). Figure 1 [32] illustrates the climate zones and the examined cities. Florina and Thessaloniki are the coldest cities, while Athens and Heraklion are the warmest cities. Practically, the climate zone A regards the warmest regions of Greece and generally covers the southwest regions, while climate zone D includes the coldest regions in the north part of Greece. Table 1 includes more details about the examined locations [33]. More specifically, the given information is the following: longitude, latitude, altitude, mean yearly temperature, yearly solar potential on the horizontal surface, as well as the heating degree days (HDD) and the cooling degree days (CDD). The relatively high CCD for Athens and Thessaloniki is explained by the fact that these are urban areas. The Heraklion is an island urban area that presents a lower number of CCD because the island climate plays a significant role on the cooling demand.

2.2. The Examined Building

In this work, a simple building envelope is examined with 100 m2 floor area and two sides of 10 m each (10 m × 10 m), while the height of the cell is 3 m. The only variable parameter is the insulation thickness, which ranges from 0 cm (uninsulated case) to 8 cm (well-insulated case) with 2 cm steps. This upper limit has been selected as one reasonable choice because greater thickness leads to an extremely low reduction in heating loads. The external walls are located in the four directions (south, west, north, and east) and windows have been placed in all the walls except for the north wall, where there is the building door. The examined case is a domestic building and it follows the operation program according to KENAK. Figure 2 depicts the top view of the examined building.
More details about the investigated building are included in Table 2 [22,23]. Generally, typical values have been selected for the various parameters in order for the conclusions of this work to be general and not specific.
It is important to state that there are double windows in order to reduce the thermal losses. More specifically, they have thermal transmittance (or U-value) of about 1.57 W/m2K, a value that includes the peripheral frame. All the external walls (except the roof) have five layers, as follows: 1.5 cm plaster (outer layer), 12 cm brick, 0–8 cm insulation, 12 cm brick, and 1.5 cm plaster (inner layer). The outer layer of the roof is a cement layer of 20 cm, the second is an insulation layer (if exists) of up to 8 cm and the inner layer is 1.5 cm of plaster. The ground has a typical composition and is a well-insulated structure. Table 3 gives the thermal properties of the used materials, which are in accordance with the TOTEE values 20701-2/2010 (technical guidelines) [34]. The most important parameter in Table 3 is the thermal conductivity of the insulation layer, which is 0.04 W/mK and has a high impact on the thermal transmittance.
By taking into consideration the TOTEE KENAK regulations for Greek buildings, the equivalent building thermal transmittance has a maximum acceptable value. These values have been calculated from TOTTE KENAK and are given in proper tables [34,35]. The ratio of external building area to the building volume is 1.07 m2/m3 and this value determines the maximum possible thermal transmittances according to regulations (KENAK tables) [35]. More specifically, for zones A to D, the maximum thermal transmittances limits are the following: 0.81, 0.73, 0.66, and 0.60 W/m2K for the climate zones, respectively. Table 4 gives the thermal transmittance of all the examined structural components and of the total building cell, for all the examined cases. Comparing the TEE-KENAK limits and the values of Table 4, an insulation layer of 4 cm is adequate for being in accordance with the regulations. However, it is important to state that this value is possibly more ideal for colder locations as opposed to the warmest locations in Greece.
In this work, the simulation tool used is TEE-KENAK [34,35]. In this tool, the thermal comfort conditions are defined as below:
 
The daily temperature should be 20 °C and 40% humidity in the winter.
 
The daily temperature should be 26 °C and 45% humidity in the summer.
A control system is used by the simulation tool in order to achieve these goals.

2.3. Mathematical Background and Methodology

The basic equations that have been used in the present work are included in this section. These equations are associated with the system energy balances, the building thermal behavior, and the financial investigation.

2.3.1. Equations about the Building Envelope

The structure of every building is an important factor for its heating and cooling loads. Specifically, the thermal resistance of the structural components (walls, roof, and ground) determines the heat exchange between the building and the outdoor environment.
The thermal resistance of a structural component (R) is a summary of many other thermal resistances. Each layer has its own thermal resistance and futher, the thermal resistances of the indoor and outdoor heat convections are taken into consideration. Equation (1) is the general formula for calculating the thermal resistance for a usual structural component:
R = 1 h i n + j = 1 N [ L j k j ] + 1 h o u t
It is useful to state that the indoor heat convection coefficient (hin) and outdoor heat convection coefficient (hout), as well as the thickness (Lj) and thermal conductivity (kj) of every layer, are taken into consideration in the thermal resistance (R) calculation.
Usually, in building applications, the thermal transmittance (U) or the (U-value) is used for the evaluation of the structural components, which is given by Equation (2).
U = 1 R
The thermal resistance and transmittance are influenced by the material thermal properties and their dimensions (especially the thickness). The most important thermal resistance is for the insulation layer and especially the insulation thermal conductivity is the key factor among the material thermal properties. Lower values of the thermal conductivity lead to a well-insulated scenario. Moreover, the other way to reduce the thermal transmittance and to create a more insulated envelope is to use a higher insulation thickness. Thus, this work investigates whether the impact of the insulation layer thickness on the heating loads has a significant value for the thermal behavior of the building.
The overall thermal transmittance of the building envelope (Utot) is calculated using the following formula:
U t o t = i = 1 P ( A i U i ) i = 1 P ( A i )

2.3.2. Equations about the Equipment

The examined heating system includes a boiler and radiators. The efficiency of the heating system (ηheating) is calculated as the product of boiler efficiency (ηboiler) and heat exchange system efficiency (ηhex).
η h e a t i n g = η b o i l e r × η h e x
Moreover, the heating system efficiency can be written as the ratio of the heating load (Eheating) to the energy consumption in the boiler (EB):
η h e a t i n g = E h e a t i n g E B
The energy of the fuel (EB) is calculated as the product of the fuel mass rate (MB) and the lower heating value of the fuel (Hu):
E B = M B × H u
The cooling load (Ecooling) is covered using a heat pump, which consumes electricity (Pel). The mean coefficient of performance (COP) of the heat pump is equal to 3.4 [34,35], and is defined as follows:
C O P = E c o o l i n g P e l

2.3.3. Equations about the Environmental Indexes

The primary energy consumption (PE) is the equivalent energy utilization of the examined systems and is calculated according to Equation (8). It is important to state that the proper coefficients are used in order to convert the electricity and the fuel energy into the property energy for Greece [34,35]. The (EB) and the (Eel) are the yearly consumptions in fuel and electricity, respectively.
P E = 1.1 × E B + 2.9 × E e l
The mass of CO2 that is produced from the consumption of the primary energy (MCO2) is calculated as below, using the proper coefficients for Greece [34,35]:
M C O 2 = 0.204 × E B + 0.989 × E e l

2.3.4. Equations for the Financial Analysis

The financial analysis is performed in order to determine if the cost of the extra insulation thickness can be counterbalanced by the reduction in the operation cost due to the reduction in the consumption of electricity and fuel.
The simple payback period (SPP) is the selected evaluation index and it practically takes into account the investment for the insulation installation (CCins), as well as the reduction of the operation cost (OC)L compared with the uninsulated wall (OC)L=0cm.
S P P = C C i n s ( O C ) L = 0 c m ( O C ) L
The total cost of the insulation (CCins) is calculated according to Equation (11):
C C i n s = A i n × ( 7 + 2 × L i n )
The above equation shows that there is a constant part of the insulation installation at 7 €/m2 (of insulation area) and a varying cost of 2 €/m2cm (of the insulation layer and insulation thickness), according to the literature [23] for Greek climate conditions.
The operating cost (OC) is calculated using the electrical energy consumption (Eel), the fuel energy consumption (EB), and their costs. The cost of the electricity (Kel) is selected close to 0.15 €/kWhel and the fuel heat cost to 0.12 €/kWhth.
( O C ) L = K B × E B + K e l × E e l

2.4. Followed Methodology

In this paper, the impact of the insulation thickness in heating and cooling loads is analyzed parametrically. The simulation tool is the TEE-KENAK program, which is the official program for energy certificates in Greece. This tool provides information about the dynamics of the thermal behavior, the individual building element, the total building envelope, and the energy systems used. Furthermore, this tool is based on detailed simulation models and allows the assessment of the overall energy performance of a building and its indoor climate conditions. These models calculate the values of a series of variables such as the inside temperature, humidity, temperature of the surfaces, air flow, energy consumption, thermal comfort, and air consumption, solving differential equations describing mass transport and heat in buildings. It is important to state that the used tool follows the standard EN ISO 13790 and has been also used in many literature studies [21]. Moreover, the performance of the examined installation is variable during the year period according to the climate conditions, and thus the various devices are modeled seasonally in their partial load. Lastly, it is useful to state that the boiler nominal heating power is 8 kW and that of the air to air heat pump is 6 kW. It is also important to state that the present calculations, which are according to EN ISO 13790, are more accurate for the heating loads than the cooling loads because the methodology followed is based on the average monthly values. However, the obtained results regard yearly energy consumptions and thus are acceptable. For more accurate studies with daily and hourly results, more detailed tools are needed.
The insulation thickness varies up to 8 cm in order to cover all the usual cases, from uninsulated to very well insulated building cells. It is important to state that the insulation layers of the external walls, roof, and ground are changing together in the parametric analysis. Greece is a country with a very variable local climate and for this reason, four different cities, one for every climate zone, are examined. The heating load, cooling loads, primary energy consumption, carbon dioxide emissions, and yearly operation cost are calculated for every examined case. The heating load is covered by a central heating system with a boiler, while the cooling is covered by local heat pumps. Finally, the optimum insulation layer for every city is determined energetically and financially. More specifically, the financial evaluation is based on the simple payback period calculation of the insulation investment for every case. The final results are also evaluated using a multi-objective procedure. Table 5 includes useful parameters that are input in this work. It is useful to state that the heat exchanger efficiency takes into account various losses of the heating circuit from the boiler to the indoor space, which leads to energy loss.

3. Results

3.1. Energetic Analysis

The first step in this work is the energetic evaluation of the examined insulation scenario for the four examined locations. It is important to remember that every city corresponds to a different climate zone of Greece. Moreover, the results are presented per collecting area in order for the given values to be easily generalized and compared with other studies. Also, the results regard the yearly operation.
Figure 3 depicts the heating loads of the examined cases. The zero insulation indicates the case of the uninsulated building envelope. It is obvious that higher insulation thickness leads to lower heating loads. The reduction between the insulated and the uninsulated building is high and this fact shows that a small insulation layer leads to an important reduction in the heating loads. According to the results of Figure 3, the city with the greater heating loads is Florina, followed by Thessaloniki, Athens, and Heraklion, respectively. It is also obvious from this figure that the insulation thickness after 6 cm has no important impact on the heating loads, which proves that there is no need for huge insulation thicknesses in the Greek climate conditions. Only for Florina, the higher insulation thickness seems to be a noteworthy idea because of the significant reduction of the heating loads.
Figure 4 illustrates the cooling loads of the examined cases. Athens is the city with the highest cooling loads, followed by Heraklion, Thessaloniki, and Florina, respectively. It can be said that the insulation leads to lower cooling loads compared with the uninsulated case, but the reduction is not as high as in the heating loads (see Figure 3). Thus, it can be said that the use of insulation is more important for the reduction of the heating loads than of the cooling loads. Florina is a city that has too low cooling loads, and thus the use of insulation is not so important for the reduction of the cooling loads. Athens is the city with the highest cooling loads, while the Heraklion is the southwest city among those examined. This result can be explained by the warm climate conditions in Athens, which is an overpopulated city with the urban heat island effect. Moreover, it is useful to comment that this work indicates that higher insulation thickness reduces the cooling loads, but there are also other studies in the literature with the opposing result (e.g., [18]). Thus, it is important to state that the impact of the insulation on the cooling loads has not always followed the same trends and depends on the ambient temperature, set temperature, building operating schedule, and various parameters of the building envelope.
Figure 5 shows the specific primary energy consumption of the examined cases. Higher insulation thickness leads to lower primary energy consumption. Florina is the city with the highest primary energy consumption, followed by Thessaloniki, Athens, and Heraklion, respectively. It is obvious that the trends of the primary energy consumption (Figure 5) are similar to the trends of the heating loads (Figure 3). This result is mainly based on the high values of the heating loads compared with the cooling loads. Figure 6 depicts the specific CO2 emissions of all the system on a yearly basis. The trends of Figure 6 are similar to the trends of Figure 5. Generally, it can be said that the use of insulation leads to lower primary energy consumption and to lower CO2 emissions, especially up to 2 cm thickness. This is a very important result, which proves that the higher insulation thickness makes the building friendlier to the environment.

3.2. Financial Analysis and Evaluation

The next step in this work is the financial evaluation of the obtained results. The simple payback period is used as the suitable index for evaluating the investment of insulation placement in the envelope. Figure 7 shows the yearly operating cost of the building for covering the heating and cooling needs for all cases. The operating costs are reduced with each use of insulation and it is obvious that the difference between the uninsulated case and the insulated case of 4 cm is huge. Moreover, higher insulation thickness reduces the operation cost, but not at a great rate because the curves tend towards the horizontal for high insulation thicknesses.
The simple payback period takes into consideration both the investment and the operation cost of every case. Figure 8 depicts the results of all the examined scenarios. It is found that the 4 cm insulation layer thickness minimizes the simple payback period. Thus, this is the optimum insulation thickness for all the cities and consequently the climate zones. These results are in accordance with the general rule of using 4 cm insulation in buildings, as has been found in Section 2.2 using the results of Table 4. At this point, it is useful to comment that greater insulation thickness increases the investment cost, but leads to lower operating cost. Thus, this financial analysis examined which is the optimum insulation thickness that leads to easier depreciation of the initial investment through the reduced operating cost.
The lowest simple payback period is 2.56 years and it is found for the Florina, which is the city with the highest heating load. The second city is Thessaloniki with 3.56 years, the third is Athens with 4.96 years, and the forth is the Heraklion with 8.13 years. This sequence is the inverse compared with the heating loads sequence (see Figure 3). Thus, it is found that the use of insulation is more important for the locations with high heating loads. The previous numerical values correspond to the optimum case with 4 cm. Table 6 includes the results for the optimum cases. The most useful information in this table regards the gains in the heating and the cooling loads of the optimum case compared to the insinuated scenario. This reduction in the heating load is ranged from 52.8% up to 62% with a mean value of 56.7%. The cooling load reduction is ranged from 5.5% up to 23.0% with a mean value of 12.0%. It is obvious that the reduction in the heating loads is about 4.73 times greater than the cooling loads.
In the end, it is essential to state that the optimum insulation thickness could be different from location to location. Moreover, the deviations of the heat/electricity cost are able to change the optimum insulation design. For example, higher cost of energy leads to greater cost for heating/cooling and so the optimum insulation can be greater in these cases.

3.3. Discussion

The last step in this work is the multi-objective evaluation of the insulated cases. Figure 9 depicts the insulation scenarios of 4, 6, and 8 cm for the four cities. The cases with 2 cm are not depicted because they do not belong in the Pareto Front. Practically, this figure shows the relationship between the simple payback period and the specific primary energy consumption. The general idea is that higher insulation thickness than the optimum case of 4 cm leads to lower primary energy consumption. Thus, there is a difference between the financial and the energetic optimization.
Figure 9 shows that after the limit of the 4 cm insulation layer, the payback period is increased while the primary energy consumption is decreased. Practically, the decrease of the primary energy consumption (due to the loads reduction) is not sufficient for covering the extra cost of the extra insulation thickness. Thus, the energetic optimum case is not the same as the financially optimal choice. This analysis proves that there is a need for deeper analysis in every case with many criteria in order to have a multi-lateral optimal choice. Moreover, it is important in every case to define the most appreciated criteria. For instance, for a nearly zero energy building, the energy criteria are more important than the financial criteria, while for a typical building, the financial criteria usually have to be selected. Moreover, when there is a need for high-quality thermal comfort conditions, then the increase of the insulation is possibly a good idea.
Furthermore, it is essential to state that the use of greater insulation thickness leads to buildings with lower environmental impact due to the reduced CO2 emissions. This is an extra point that has to be taken into consideration for adopting the use of well-insulated buildings in the future. The use of the CO2 emissions as an extra optimization criterion in the future studies is something critical for designing more environmentally friendly buildings.
It has also to be stated that the optimum insulation thickness in this work has been found at 4 cm, while in a previous work, it had been found at 6 cm [23]. These values are close to each other but the reason for this difference is based on the different examined installations between this work and the work [23] with solar assisted heating systems. More specifically, the installation cost of the solar system is taken into consideration in the literature [23], and this fact is very important for the financial optimization of the system.
As future work, the present methodology can be extended in more locations in Greece and is able to take into consideration more parameters such as the glazing, building operating schedule, indoor equipment loads, and lighting type. Lastly, it has to be said that the acoustic insulation is also something critical that can be studied [36,37].

4. Conclusions

This paper investigates the impact of the insulation layer thickness on the energy and financial performance of Greek residential buildings. Four different climates zones are examined by simulating the same building in four different cities in Greece. For every city, different insulation scenarios up to 8 cm, as well as the uninsulated case, are studied. This work is conducted using the TEE-KENAK software and the most important conclusions of this work are listed below:
 
The sequence of the heating loads from the highest to the lowest is as follows: Florina (zone D), Thessaloniki (zone C), Athens (zone B), Heraklion (zone A).
 
The sequence of the cooling loads from the higher to the lower is as follows: Athens (zone B), Heraklion (zone A), Thessaloniki (zone C), Florina (zone D).
 
The energetic analysis proved that the higher insulation leads to an important reduction in the heating loads and to a smaller reduction in the cooling loads. Generally, insulation thickness over 6 cm has an extremely low impact on the results.
 
It is found that the heating loads influence the primary energy consumption, the CO2 emissions, and the operational cost compared with the cooling loads.
 
The financial analysis proved that the insulation thickness of 4 cm leads to the minimization of the simple payback period of the insulation placement investment. More specifically, it is found that the payback periods are 2.56 years for Florina, 3.56 years for Thessaloniki, 4.96 years for Athens, and 8.13 years for Heraklion.
 
The multi-objective evaluation of the various insulation scenarios proved that after the financially optimum thickness of 4 cm, higher thickness leads to lower primary energy consumption. However, this reduction in the primary energy consumptions is not able to eliminate the extra cost for the extra insulation material.
The results of this work can be used for the proper design of buildings in various climate zones of Greece. The specific values of various parameters (loads, primary energy consumption, etc.) are given so the results can be extended to different buildings with various floor areas. Lastly, the need for conducting multi-objective procedure in order to evaluate the results with a deeper and more critical way was highlighted.

Author Contributions

G.M. has performed the calculations, E.B. was responsible for the paper organization and C.T. had the overview of all the paper process.

Funding

E.B. would like to thank “Bodossaki Foundation” for its financial support.

Conflicts of Interest

The authors declare no conflict of interest.

Nomenclature

AArea, m2
COPCoefficient of performance, -
CCCapital cost, €
CDDCooling degree, Degree-days
cpSpecific thermal capacity, kJ/kgK
EEnergy, kWh
hHeat convection coefficient, W/m2K
HDDHeating degree, Degree-days
jSum counter, -
HuFuel lower heating value, kJ/kg
kThermal conductivity, W/mK
LInsulation thickness, cm
MMass, kg
NNumber of layers, -
OCOperational cost, €
PNumber of structural components (e.g., walls, roofs), -
PEPrimary energy consumption, kWh
PelElectrical energy, kWh
RThermal resistance, m2K/W
SPPSimple payback period, years
UThermal transmittance of the structural component, W/m2K
UtotTotal thermal transmittance of the building, W/m2K

Greek letters

ηEfficiency, -
ρDensity, kg/m3

Subscripts

Bfuel
Boilerboiler
coolingcooling
CO2carbon dioxide
elelectrical
heatingheating
hexheat exchange in the heating system
inindoor
insinsulation
optoptimum
outoutdoor
setset to control system

References

  1. European Union. Directive 2010/31/EU of the European Parliament and of the Council of 19 May 2010 on the Energy Performance of Buildings (Recast); Official Journal of the European Union: Brussels, Belgium, 2010. [Google Scholar]
  2. Ma, H.; Du, N.; Yu, S.; Lu, W.; Zhang, Z.; Deng, N.; Li, C. Analysis of typical public building energy consumption in northern China. Energy Build. 2017, 136, 139–150. [Google Scholar] [CrossRef]
  3. Masoso, O.T.; Grobler, L.J. The dark side of occupants’ behaviour on building energy use. Energy Build. 2010, 42, 173–177. [Google Scholar] [CrossRef]
  4. European Environment Agency. Consumption and the Environment—State and Outlook; European Environment Agency: Copenhagen, Denmark, 2010. [Google Scholar]
  5. Bellos, E.; Daniil, I.; Tzivanidis, T. Energetic and financial optimization of solar heat industry process with parabolic trough collectors. Designs 2018, 2, 24. [Google Scholar] [CrossRef]
  6. Sierra-Pérez, J.; Rodríguez-Soria, B.; Boschmonart-Rives, J.; Gabarrell, X. Integrated life cycle assessment and thermodynamic simulation of a public building’s envelope renovation: Conventional vs. passivhaus proposal. Appl. Energy 2018, 212, 1510–1521. [Google Scholar] [CrossRef]
  7. Kaynakli, O. Parametric investigation of optimum thermal insulation thickness for external walls. Energies 2011, 4, 913–927. [Google Scholar] [CrossRef]
  8. Touloupaki, E.; Theodosiou, T. Optimization of external envelope insulation thickness: A parametric study. Energies 2017, 10, 270. [Google Scholar] [CrossRef]
  9. Dascalaki, E.G.; Droutsa, K.; Gaglia, A.G.; Kontoyiannidis, S.; Balaras, C.A. Data collection and analysis of the building stock and its energy performance—an example for Hellenic buildings. Energy Build. 2010, 42, 1231–1237. [Google Scholar] [CrossRef]
  10. Bellos, E.; Tzivanidis, C. Energetic and financial sustainability of solar assisted heat pump heating systems in Europe. Sustain. Cities Soc. 2017, 33, 70–84. [Google Scholar] [CrossRef]
  11. American Society of Heating, Refrigerating, & Air-Conditioning Engineers. Thermal Environment Conditions for Human Occupancy; American Society of Heating, Refrigerating, & Air-Conditioning Engineers: Atlanta, GA, USA, 2004. [Google Scholar]
  12. Taylor, P.; Fuller, R.J.; Luther, M.B. Energy and thermal comfort in a rammed earth office building. Energy Build. 2008, 40, 793–800. [Google Scholar] [CrossRef]
  13. International Energy Agency. Mobilizing Investment in Energy Efficiency: Case Studies in the Residential Sector; International Energy Agency: Paris, France, 2012. [Google Scholar]
  14. Asdrubali, F.; Baldassarri, C.; Fthenakis, V. Life cycle analysis in the construction sector: Guiding the optimization of conventional Italian buildings. Energy Build. 2013, 64, 73–89. [Google Scholar] [CrossRef]
  15. Sierra-Pérez, J.; Boschmonart-Rives, J.; Gabarrell, X. Environmental assessment of façade-building systems and thermal insulation materials for different climatic conditions. J. Clean. Prod. 2016, 113, 102–113. [Google Scholar] [CrossRef]
  16. Tsikaloudaki, K.; Laskos, K.; Bikas, D. On the establishment of climatic zones in Europe with regard to the energy performance of buildings. Energies 2012, 5, 32–44. [Google Scholar] [CrossRef]
  17. Kolaitis, D.I.; Malliotakis, E.; Kontogeorgos, D.A.; Mandilaras, I.; Katsourinis, D.I.; Founti, M.A. Comparative assessment of internal and external thermal insulation systems for energy efficient retrofitting of residential buildings. Energy Build. 2013, 64, 123–131. [Google Scholar] [CrossRef]
  18. Bellos, E.; Tzivanidis, C.; Kouvari, A.; Antonopoulos, K.A. Comparison of heating and cooling loads of a typical building with TRNSYS and eQUEST. In Energy, Transportation and Global Warming; Springer: Berlin, Germany, 2016; pp. 327–338. [Google Scholar]
  19. Papakostas, K.T.; Papadopoulos, A.M.; Vlahakis, I.G. Optimisation of thermal protection in residential buildings using the variable base degree-days method. Int. J. Sustain. Energy 2005, 24, 19–31. [Google Scholar] [CrossRef] [Green Version]
  20. Michopoulos, A.; Martinopoulos, G.; Papakostas, K.; Kyriakis, N. Energy consumption of a residential building: Comparison of conventional and RES-based systems. Int. J. Sustain. Energy 2009, 28, 19–27. [Google Scholar] [CrossRef]
  21. Martinopoulos, G.; Papakostas, K.T.; Papadopoulos, A.M. Comparative analysis of various heating systems for residential buildings in Mediterranean climate. Energy Build. 2016, 124, 79–87. [Google Scholar] [CrossRef]
  22. Tzivanidis, C.; Bellos, E.; Mitsopoulos, G.; Antonopoulos, K.A.; Delis, A. Energetic and financial evaluation of a solar assisted heat pump heating system with other usual heating systems in Athens. Appl. Therm. Eng. 2016, 106, 87–97. [Google Scholar] [CrossRef]
  23. Tzivanidis, C.; Bellos, E.; Mitsopoulos, G.; Alexopoulos, I.; Antonopoulos, K.A. The impact of insulation layer in various solar heating systems: An energetic and financial evaluation. Int. J. Mech. Syst. Eng. 2015, 1, 110. [Google Scholar] [CrossRef] [PubMed]
  24. Dascalaki, E.G.; Droutsa, K.G.; Balaras, C.A.; Kontoyiannidis, S. Building typologies as a tool for assessing the energy performance of residential buildings—A case study for the Hellenic building stock. Energy Build. 2011, 43, 3400–3409. [Google Scholar] [CrossRef]
  25. Droutsa, K.G.; Kontoyiannidis, S.; Dascalaki, E.G.; Balaras, C.A. Mapping the energy performance of hellenic residential buildings from EPC (energy performance certificate) data. Energy 2016, 98, 284–295. [Google Scholar] [CrossRef]
  26. Marino, C.; Nucara, A.; Pietrafesa, M. Does window-to-wall ratio have a significant effect on the energy consumption of buildings? A parametric analysis in Italian climate conditions. J. Build. Eng. 2017, 13, 169–183. [Google Scholar] [CrossRef]
  27. Jain, M.; Pathak, K.K. Thermal modelling of insulator for energy saving in existing residential building. J. Build. Eng. 2018, 19, 62–68. [Google Scholar] [CrossRef]
  28. Khoukhi, M. The combined effect of heat and moisture transfer dependent thermal conductivity of polystyrene insulation material: Impact on building energy performance. Energy Build. 2018, 169, 228–235. [Google Scholar] [CrossRef]
  29. Torres-Rivas, A.; Palumbo, M.; Haddad, A.; Cabeza, L.F.; Jiménez, L.; Boer, D. Multi-objective optimisation of bio-based thermal insulation materials in building envelopes considering condensation risk. Appl. Energy 2018, 224, 602–614. [Google Scholar] [CrossRef]
  30. Shekar, V.; Krarti, M. Control strategies for dynamic insulation materials applied to commercial buildings. Energy Build. 2017, 154, 305–320. [Google Scholar] [CrossRef]
  31. Koenders, J.M.; Loonen, R.C.G.M.; Hensen, J.L.M. Investigating the potential of a closed-loop dynamic insulation system for opaque building elements. Energy Build. 2018, 173, 409–427. [Google Scholar] [CrossRef]
  32. Maps of Europe. Available online: http://www.maps-of-europe.net/maps-of-greece/ (accessed on 2 May 2018).
  33. YPEKA. EK407/B/9.4.2010, Climate Data of Greece—KENAK; YPEKA: Athens, Greece, 2010.
  34. YPEKA. EK407/B/9.4.2010, Regulation on Energy Performance in the Building Sector (20701-2/2010)—KENAK; YPEKA: Athens, Greece, 2010. (In Greek)
  35. YPEKA. EK407/B/9.4.2010, Regulation on Energy Performance in the Building Sector (20701-1/2010)—KENAK; YPEKA: Athens, Greece, 2010. (In Greek)
  36. Caniato, M.; Bettarello, F.; Fausti, P.; Ferluga, A.; Marsich, L.; Schmid, C. Impact sound of timber floors in sustainable buildings. Build. Environ. 2017, 120, 110–122. [Google Scholar] [CrossRef]
  37. Caniato, M.; Bettarello, F.; Ferluga, A.; Marsich, L.; Schmid, C.; Fausti, P. Acoustic of lightweight timber buildings: A review. Renew. Sustain. Energy Rev. 2017, 80, 585–596. [Google Scholar] [CrossRef]
Figure 1. The Greek climate zones and the examined cities in this work [32].
Designs 02 00034 g001
Figure 2. The examined building case (dimensions in meters).
Designs 02 00034 g002
Figure 3. Specific heating demand for the examined cases.
Designs 02 00034 g003
Figure 4. Specific cooling demand for the examined cases.
Designs 02 00034 g004
Figure 5. Specific primary energy consumption for the examined cases.
Designs 02 00034 g005
Figure 6. Specific carbon dioxide emissions for the examined cases.
Designs 02 00034 g006
Figure 7. Total yearly operating cost for the examined cases.
Designs 02 00034 g007
Figure 8. Simple payback period for the examined cases with insulation.
Designs 02 00034 g008
Figure 9. Multi-objective evaluation of the results for insulations cases of 4, 6, and 8 cm.
Designs 02 00034 g009
Table 1. Data about the examined climate zones. HHD—heating degree days; CCD—cooling degree days.
LocationZoneLatitudeLongitudeAltitudeMean TemperatureSolar Potential on Horizontal PlaneHDDCDD
HeraklionA35°20′25°11′39 m18.78 °C1753 kWh/m27021334
AthensB37°54′23°45′15 m18.56 °C1637 kWh/m29474830
ThessalonikiC40°31′22°58′5 m15.80 °C1469 kWh/m216772795
FlorinaD40°48′21°26′617 m12.09 °C1493 kWh/m225370
Table 2. Building parameters.
ParametersValues
Building floor Area100 m2
Length of the building10 m
Width of the building10 m
Height of the building3 m
East window area3 m2
West window area3 m2
South window area6 m2
U-value of windows1.57 W/m2K
Door area1.98 m2
U-value of the door2.95 W/m2K
Shading coefficient of the windows75%
Occupants density0.05 person/m2
Specific lighting load6.4 W/m2
Infiltration rate1 change per hour
Indoor heat convection coefficient (hin)8 W/m2K
Outdoor heat convection coefficient (hout)16 W/m2K
Total insulation area306 m2
Table 3. Properties of structural materials.
Materialk (W/m K)cp (kJ/kg K)ρ (kg/m3)
Brick0.891.01800
Plaster1.391.02000
Insulation0.040.840
Concrete2.100.82400
Table 4. Thermal transmittance (U) of structural components.
Structural ComponentsA (m2)U (W/m2K)
L = 0 cmL = 2 cmL = 4 cmL = 6 cmL = 8 cm
Walls1062.5371.1200.7170.5280.418
Roof1001.3251.3250.5700.4440.363
Ground1000.5890.5890.3710.3130.270
Windows121.5701.5701.5701.5701.570
Door22.9502.9502.9502.9502.950
Building3201.5161.0460.6090.4890.414
Table 5. Parameters of the examined systems [22,23,34,35]. COP—coefficient of performance.
ParametersValues
Fuel lower heating value (Hu)42,000 kJ/kg
Heat exchanger efficiency (ηhex)75%
Boiler efficiency (ηboiler)87%
Boiler nominal power8 kW
Heat pump nominal power6 kW
COP of the cooling system3.4
Set temperature in the summer26 °C
Set temperature in the winter20 °C
Summer design humidity45%
Winter design humidity40%
Dead band of the thermostat1 °C
Constant insulation cost per area7 €/m2
Variable insulation cost per are and thickness2 €/m2 cm
Electricity cost (Kel)0.15 €/kWhel
Fuel heating cost (KB)0.12 €/kWhth
Table 6. Final results for the optimum insulation thickness. PE—primary energy consumption.
LocationZoneLopt (cm)SPP (Years)Qheating (kWh/m2)Qcooling (kWh/m2)PE (kWh/m2)Heating ReductionCooling Reduction
HeraklionA48.1326.936.488.662.0%13.5%
AthensB44.9653.246.6183.857.0%23.0%
ThessalonikiC43.5686.532.9128.254.7%17.3%
FlorinaD42.56134.713.449.452.8%5.5%
Greece-44.8075.3332.33112.556.7%12.0%

