1. Introduction
A road accident is commonly the result of many factors, circumstances and conditions which must be simultaneously present to create that specific event. For accident reconstruction and analysis purpose, each accident datum must be collected, calculated and processed to obtain the information related to the factors which determine it and the environment in which it took place. Data collected from in-depth road accident investigations are very informative and contain many variables for a single investigated case. These data can be used to get a more detailed knowledge on accidents and injury causation associated with a specific accident scenario.
Accident database information allows to make different analysis in terms of vehicles, occupants or infrastructure, and their results can provide fundamental input to the operators for the increase in road safety. Accidents analysis allows to highlight the most frequent road contexts and scenarios where accidents take place, to give suggestions regarding behaviors of driver and pedestrians and also vehicles active/passive safety systems’ performance [
1]. Correlations between the severity of the impact and the injuries suffered by the occupants are very useful for vehicles’ rating; therefore, many correlations are in use in road accident analysis [
2,
3,
4,
5,
6,
7,
8,
9,
10]. In addition, a comparison can be carried out for each vehicle model between real accidents outcomes and crash tests [
11,
12,
13] performed by organizations like the European New Car Assessment Programme (EuroNCAP) [
14], National Automotive Sampling System (NASS) [
15], etc.
As of today, many European programs aim at road safety improvement, the reason for why accidents data collection and classification are gaining unprecedented importance. Project LIVE (tooLs to Injury preVEntion) [
16] consists in the creation of a data system resulting from the linkage of medical information and police accident report, to define measures embracing the road environment, particularly their influence on pedestrian accidents. RASIF (Road Accident Serious Injuries in Florence) [
17] has been created with the intent of studying accident data, merging together dynamics, injuries and follow up information, to create a network for sharing best practice in the field. One of the tasks of PENDANT (Pan-European co-ordinated Accident and Injury Database) [
18] is called “Accident reconstruction and collision severity assessment guidelines”. In this task, a database has been developed which includes the main information about available public domain crash tests (Euro-NCAP for example) and provides information about the acceleration characteristics of the vehicles, occupants and injury criteria, as well as intrusion data with well documented photographs for deformation assessment. In project DACOTA (DAta COllection Transfer & Analysis) [
19] data are collected and structured by means of a road safety data warehouse, as a comprehensive and integrated system with aggregate data and information. STAIRS (Standardization of Accident and Injury Registration Systems) [
20] involves the standardization of in-depth road accident data collection and methodologies that would provide the core data and basic framework for crash injury studies.
Data collection methods and procedures are some strategic points of the above-mentioned programs, and they allow to obtain harmonization of in-depth road accident databases, in which accidents typology and occupants’ injury type/entity are collected: significant examples of data collection are the German In-Depth Accident Study (GIDAS) [
21], IGLAD [
22] and the National Highway Traffic Safety Administration (NHTSA). Generally, an in-depth accident database contains all types of real road accidents. Many information is, thus, available to researchers:
accident description—day, hour, place, brief description, type of collision, first cause factor, meteorological, road and lighting conditions;
participants data, in terms of vehicles involved in the accident—manufacturer, model, mass, crash configuration, pulse direction and kinematic parameters (as impact speed, speed variation, vehicles deformations and so on);
occupants’ characteristics—description of the occupants’ aspects, as gender, age, height, weight, injury severity;
safety systems—safety devices installed on the vehicles, such as airbags, safety belts, Automatic Braking System (ABS) and Electronic Stability Program (ESP), etc.
Information contained in an accident database are divided in records, consisting of several fields depending on the specific database.
An accident will be thus characterized by a set of variables which can be divided in different groups:
objective parameters: airbags activation, seatbelts use/misuse, injuries, road conformation, etc.;
measurable parameters: skid marks, distances, vehicles deformations, etc.;
calculable parameters: pre-impact and post-impact velocities, energy loss, Energy Equivalent Speed (EES), velocity change due to the impact (ΔV), etc.
Objective parameters can be considered as known in most of cases, expressed as categorical indicators (i.e., YES/NO response or grouping in categories); instead, measurable parameters are subject to uncertainties [
23] and are thus indicated through a value inside a possible range (determined by measurement instruments, conditions, etc.). The calculable parameters are affected by uncertainties on the first available data, which propagate during the calculation process [
24,
25]. They also change based on the adopted physical model approximation that necessarily simplifies the phenomenon [
26,
27]. For all these reasons, calculated results can be characterized by a high uncertainty degree, making correlations between kinematic parameters ineffective and misleading.
It is possible to evaluate consistency of the single parameters carrying out coherence analysis (cross check) between calculated data, considering that different physical laws and mathematical expressions relate one parameter to the others. Cross check allows to evaluate the overall quality of data at disposal, to verify their correctness inside defined acceptability limits.
A procedure for the implementation of cross check of kinematic data is proposed. The procedure allows to verify step by step the consistency/plausibility of the kinematic data, mainly to improve road safety by the enhancements in data collection and classification process. Referring to accidents between two vehicles in a simplified approach, the procedure will take on correctness verification for parameters like ΔV, energy loss and post-impact velocity (considering also the geometrical closing in the velocity triangle); the procedure applies identically in case of impacts between multiple vehicles (i.e., multiple events). Some application examples are reported, based on data collected in IGLAD database.
2. Materials and Methods
Considering a set of parameters generally available inside an in-depth accident database (as masses of the vehicles, pre-impact and post-impact velocities, ΔV, EES), the analysis has been carried out to evaluate the plausibility of collected data. The proposed procedure can be applied to any database for a data consistency assessment.
The method for cross examination is based on conservation of momentum (check 1), the velocity triangles (check 2) and the energy loss (check 3); here, a system composed by two vehicles (vehicle A and vehicle B) is considered.
2.1. Check 1: Conservation of Momentum
For all impacts where the road/wheel forces can be considered as negligible, the variation of momentum for vehicle A is equal but opposite to that of vehicle B [
28]. So, a primary check can be made considering the momentum relationship:
This relationship shows that the velocity change of the vehicles, during the impact, are inversely proportional to their respective masses. Thus, a heavier vehicle will experience a lower speed variation: this applies to any type of impact, centred or oblique. Considering the mass value as a correct input data, an evaluation procedure can be made recalculating a ΔV value for each vehicle, assuming that at least one ΔV is correct. Only the two momenta modulus are considered for simplicity, since they act along the same direction.
ΔV is a plausible datum if:
The threshold value is set as 10 km/h for the present analysis, but other values can be used. As emerges from a preliminary analysis, this is the uncertainty which depends on masses not reported in the database, i.e., missing information regarding occupants’ number, their mass or mass of the cargo/baggage. In fact, occupants’ masses and transported goods must be added to the mass of the related vehicle, because databases commonly report the curb weight only; if the occupants/goods are not considered, check 1 can lead to a false negative result and the removal of a correct case.
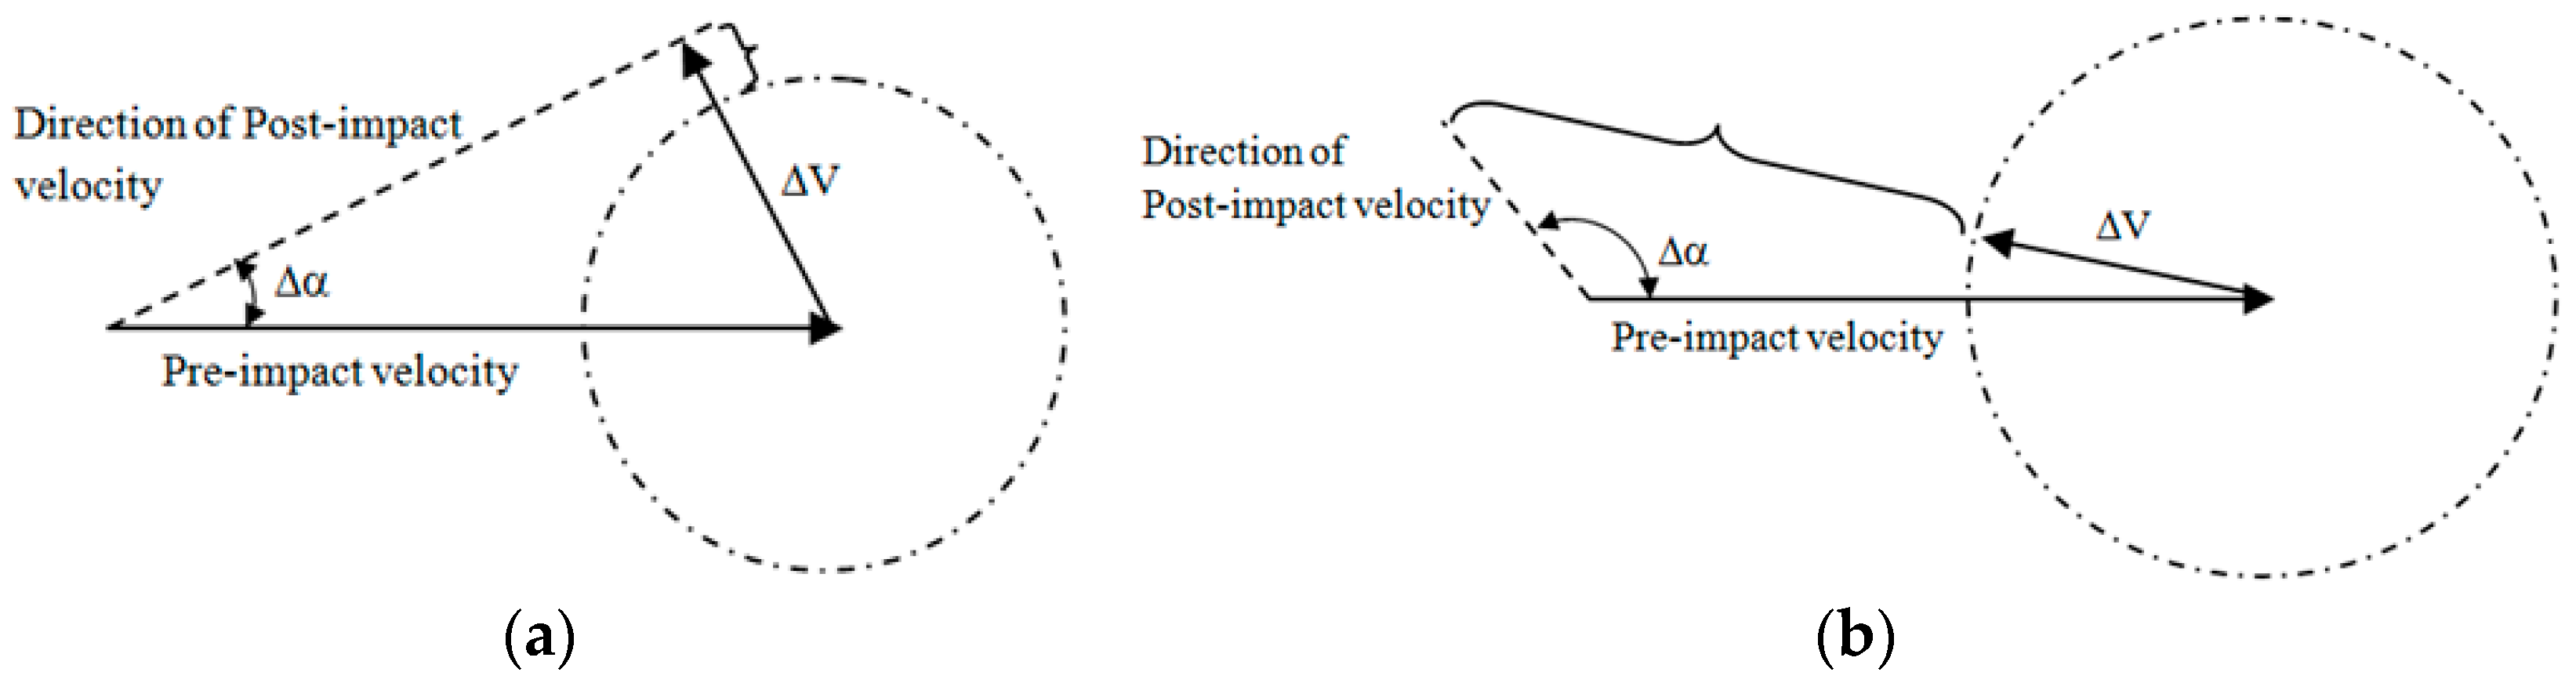
2.2. Check 2: Velocity Triangles
If the law of momentum conservation is satisfied (check 1), a subsequently check on data can be made considering the velocity triangles. The vector sum of initial (or collision) velocity
and
must equal the final (or post-impact) velocity
, i.e., the three vectors form a triangle. Post-impact velocities are often not reported in accident databases like IGLAD. However, it is possible to verify data plausibility through, for example, the velocity triangle closure (
Figure 1); in fact, angle difference Δα between V
collision and V
post-impact directions is known. If a threshold of ΔV which allows to close the velocity triangle exists, two conditions related to ΔV can be derived, as reported in Equations (5) and (6):
Based on Equations (5) and (6), two equations—Equations (7) and (8)—can be deduced expressing the correctness of velocity triangles:
From now on, the threshold value for Check 2 will be assumed as 2 km/h. As already said for Check 1, the threshold value mostly depends on unconsidered masses. If the difference is negative, the configuration allows the triangle to be closed, while a positive value under the threshold value can depend on calculation approximations. The same applies for .
2.3. Check 3: Energy Loss
If the momentum conservation and the velocity triangles criteria are fulfilled (checks 1 and 2), another test can be carried out regarding the kinetic energy loss which can be estimated using the law of energy conservation—Equation (9)—or by the related expression with Energy Equivalent Speed (EES)—Equation (10). Subscripts A or B indicate the quantities corresponding to vehicles A and B respectively. Differing from EES, V
post-impact is not always directly coded as mentioned above; it should be calculated first to use Equation (9) [
23]. Knowing V
collision, ΔV and the V
post-impact direction for each vehicle, it is possible to calculate the V
post-impact modulus. Two different approaches can be used: a graphical approach, based on the velocity triangles re-construction, and an analytical approach which allows to automate the process without considering sketches of the accident.
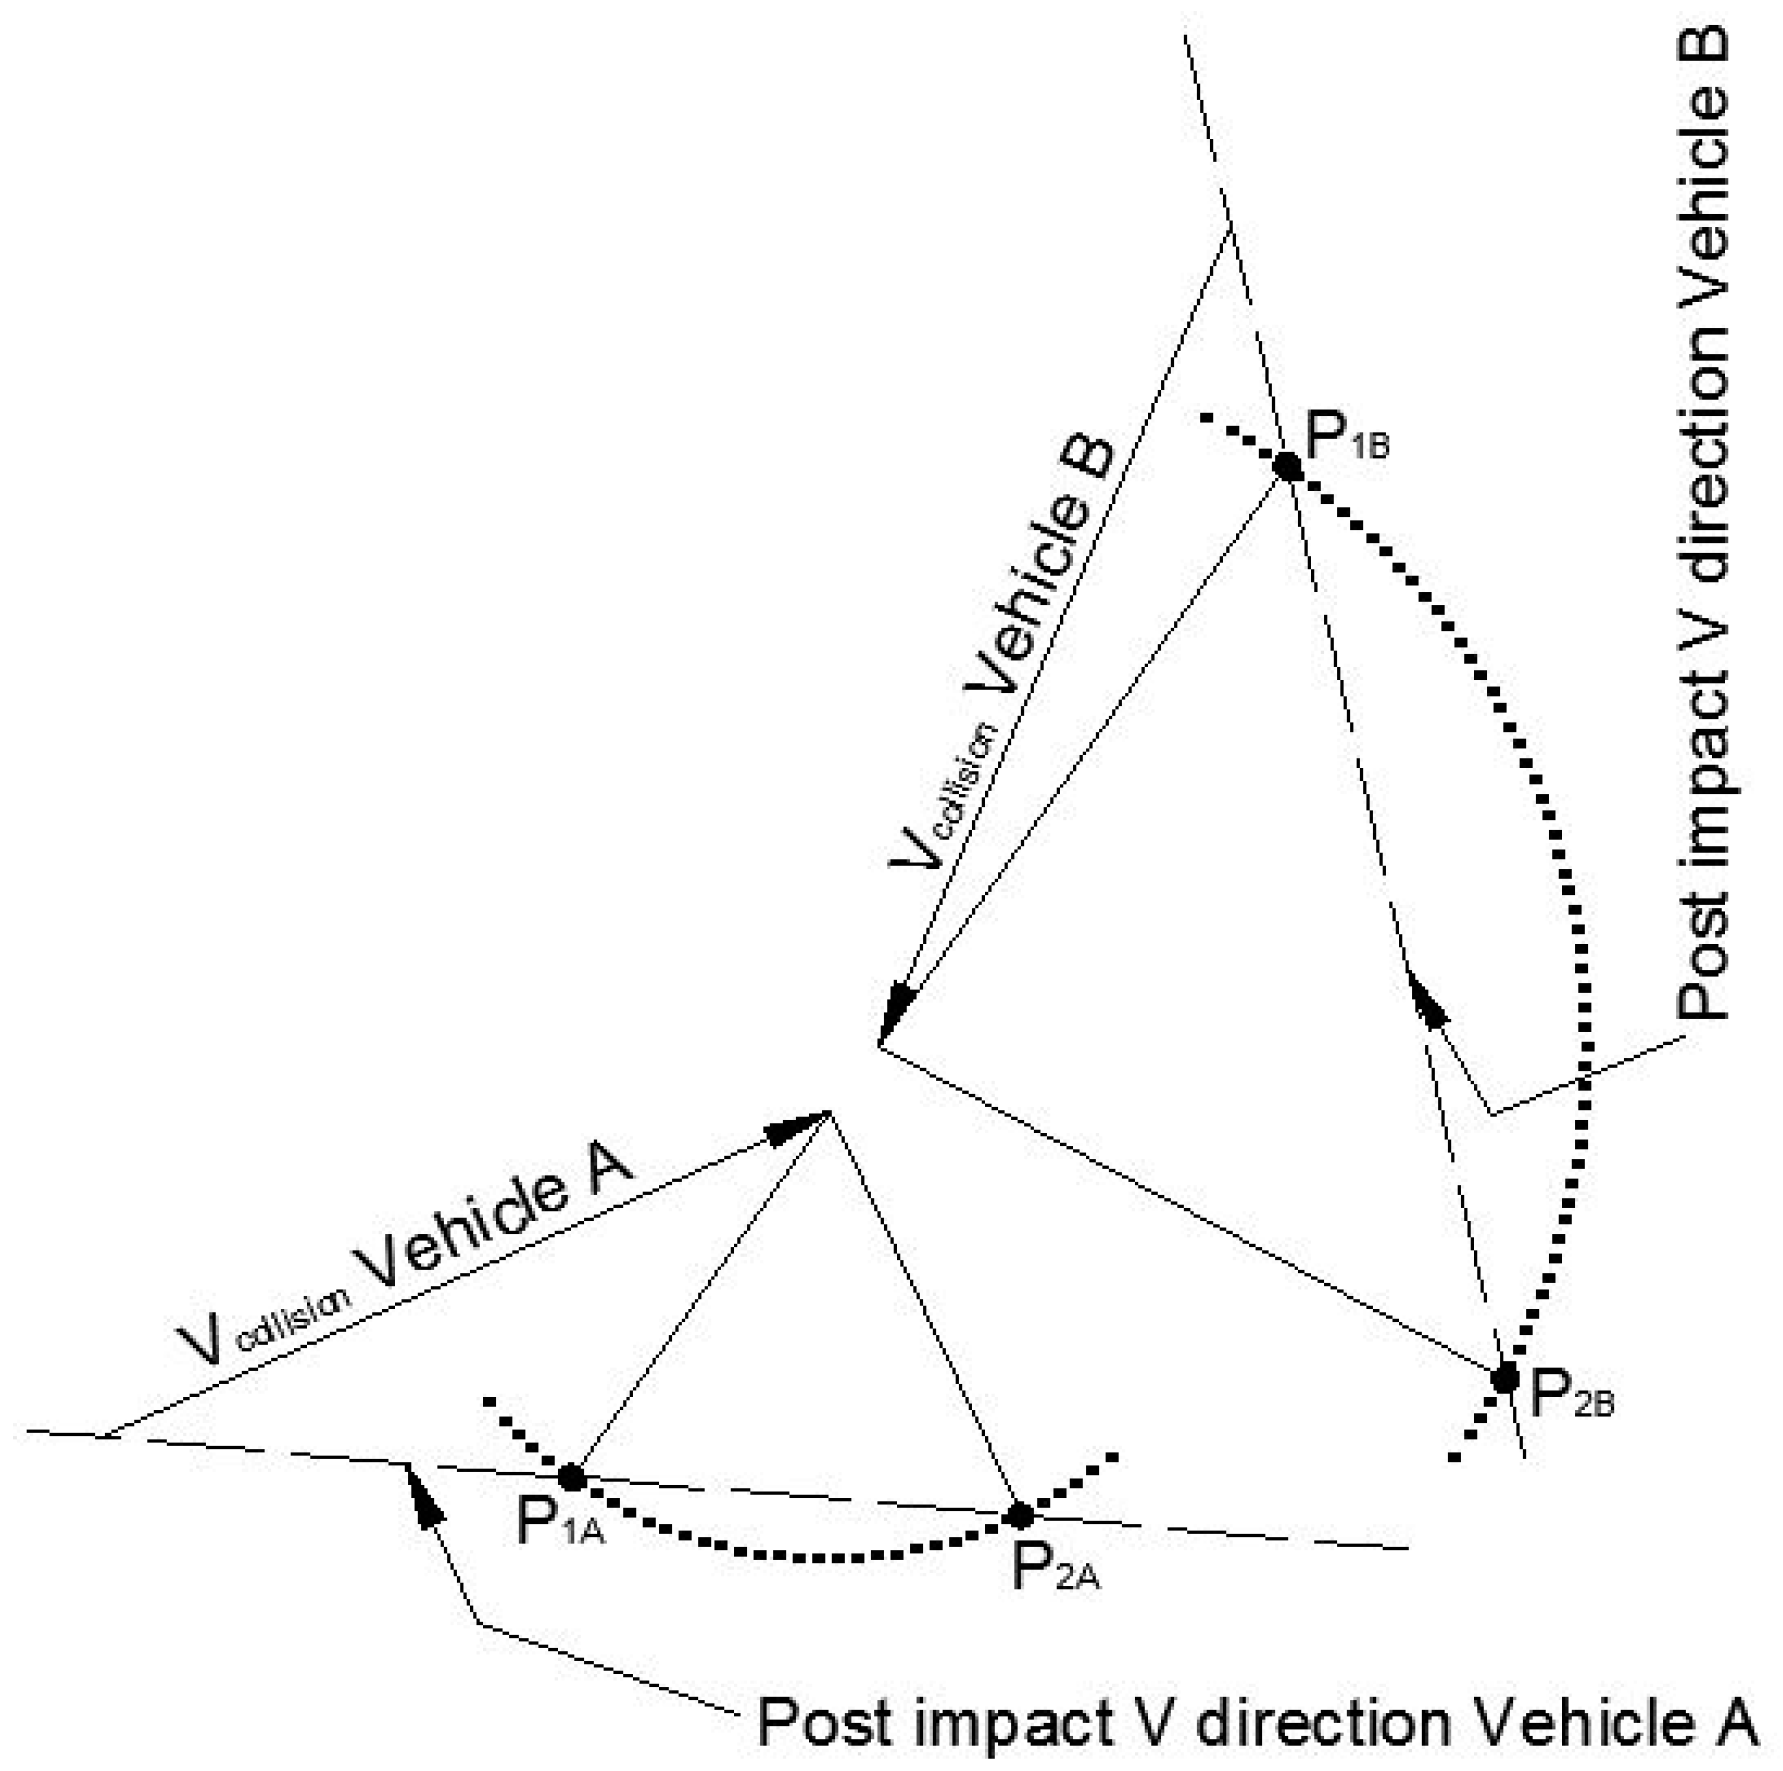
2.3.1. Graphical Approach
Starting from the angle between and (Δα) it is necessary to draw the vector (completely known) and the post-impact velocity direction.
From the final point of the collision velocity vector, an arc of a circle with radius equal to
can be drawn, which identifies two different intersections in points P
1 and P
2 on the post-impact velocity direction, as outlined in
Figure 2. The choice between the two possible solutions could be carried out considering that
direction must be (approximately) the same for both vehicles involved in the accident. The graphical check consists in the comparison between the two triangles, evaluating if it is possible to highlight this
: if so,
for the vehicles can be obtained, otherwise velocity triangles are inconsistent. In
Figure 2, it can be seen that point P
1 represents the correct solution for both vehicles.
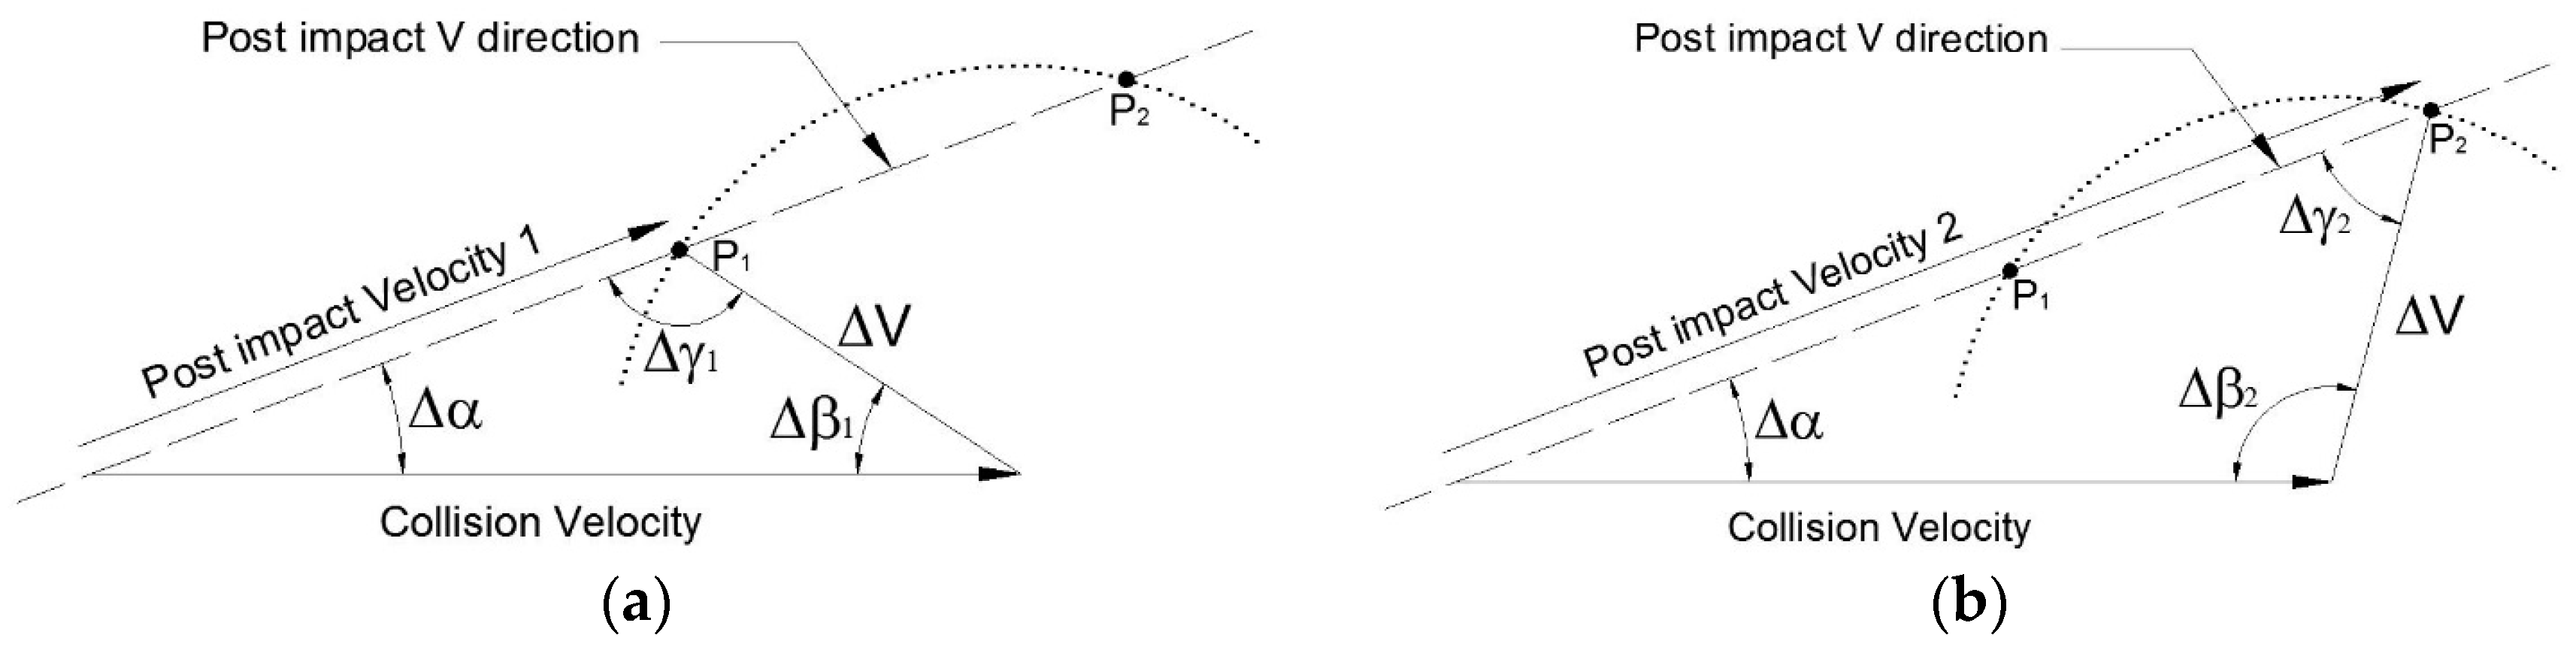
2.3.2. Analytical Approach
Let us consider one vehicle only. By a completely analytical approach consisting in the use of trigonometric rules (law of sines) applied to the triangles defined by
, Δα and
(Equation (11)), it is possible to evaluate the
(Equation (12)).
Figure 3a,b show the possible solution of the post-impact velocity: the subscript i indicates that the equation applies for the case in
Figure 3a (i = 1) and in
Figure 3b (i = 2). Since
, Δα and ΔV are known, Δγ
1 = π − Δγ
2.
Negative values of post-impact velocities have no physical meaning. Through Equation (12), using Δγ
1 and Δβ
1 or Δγ
2 and Δβ
2 it is possible to obtain two values of post-impact velocity for both vehicles. Indicating these velocities as
and
for vehicle A,
and
for vehicle B, it is possible to evaluate 4 different energy losses:
with i = 1,2 and j = 1,2. A negative value of
is not acceptable, so the check is considered as failed in these cases. Energy loss due to angular velocity change is neglected, because it is not reported in IGLAD. The choice of the correct combination of the post-impact velocities is identified comparing the value from Equation (10) with the four possible values derived from Equation (13). The EES values are generally estimated by comparison with documented crash tests on identical vehicle models: the EES reported in IGLAD are thus considered as good quality data and used as reference. The last check can be thus expressed as in Equation (14):
The threshold value is assumed as 20% from now on. Possible errors deriving from neglecting angular velocity change in the energy loss calculation are also considered imposing this tolerance. In the following, an application of the proposed procedure is reported, referring to real accidents collected in IGLAD database.
3. Guidelines Application for Data Consistency Assessment
The proposed procedure has been applied as an example to the in-depth accident dataset IGLAD. IGLAD consortium was created in 2010 by European car manufacturers with the objective of improving road and vehicle safety. The database contains accidents data according to a standardized scheme, which enables comparison between datasets from different countries. Each accident is described by 93 variables regarding the characteristics of the crash, roads, participants (vehicles or VRUs), occupants and safety systems.
Accidents between two passenger cars have been considered, for which are known: mass, velocity of collision, ΔV, post-impact velocity direction and EES for each vehicle. Inside IGLAD database, only the curb weight is reported for each vehicle, without considering the occupants’ weight. For this reason, the passenger number for each vehicle at the crash moment has been considered. If the weight of the occupants is available in IGLAD, it is added to the vehicle curb weight; if not, an average value is applied in relation to the gender and age of each occupant. The considered average weights are 80 kg for males and 65 kg for females.
In the following, the proposed procedure is applied to a completely correct case and to three incorrect cases, with error respectively in check 1, check 2 and check 3.
3.1. Correct Case
Considering a frontal impact between two passenger cars where the vehicle B collides with vehicle A, which was traveling in the opposite direction.
Table 1 shows the data related to mass, kinematic parameters, Δα and EES for each vehicle.
and values re-calculated from Equations (2) and (3) are 69 km/h and 68 km/h respectively. Check 1, according to Equation (4) and considering a threshold value of 10 km/h, is verified:
Check 2, which regards the velocity triangles, is verified:
vehicle A—Being , the condition which needs to be respected is Equation (7): which is under the chosen threshold value.
vehicle B—Being , the condition which needs to be respected is Equation (8): which is under the chosen threshold value.
Check 3 is based on the energy calculated with the EES collected inside the database (Equation (10)), which must be similar to one of the 4 possible solutions obtained through Equation (9). For the 4 solutions:
N/A because is negative;
N/A because is negative;
below the imposed threshold value;
N/A because is negative.
All checks are positive, thus the parameters values reported for this case can be used for subsequent analysis.
3.2. Incorrect Case: Error in Check 1
A frontal impact is considered between two passenger cars, mainly caused by speed limit exceed. Vehicle A collided with vehicle B which was travelling in the opposite direction.
Table 2 shows the data related to mass, kinematic parameters and EES for each vehicle. Δα is missing for this case.
and values re-calculated from Equations (2) and (3) are 119 km/h and 53 km/h respectively.
Check 1, referring to Equation (4), is not verified for the two vehicles:
3.3. Incorrect Case: Error in Check 2
A frontal-side impact between two passenger cars is considered, due to a loss of control by vehicle A driver.
Table 3 shows the data related to mass, kinematic parameters, Δα and EES for each vehicle.
Using Equations (2) and (3) to re-calculate ΔV, values equal to 56 km/h for the vehicle A and 37 km/h for the vehicle B are obtained. Check 1, according to Equation (4), is verified:
Check 2, for what regards the velocity triangles is not verified:
vehicle A—Being 90° < |Δα| < 270°, the condition which needs to be respected is Equation (8): highly above the chosen threshold value.
vehicle B—Being |Δα| < 90°, the condition which needs to be respected is Equation (7): which is highly above the chosen threshold value.
3.4. Incorrect Case: Error in Check 3
Table 4 shows the data related to mass, kinematic parameters, Δα and EES for each vehicle (a passenger car and a heavy-weight vehicle).
Using Equations (2) and (3) to re-calculate and , values equal to 32 km/h for the vehicle A and 16 km/h for the vehicle B are obtained.
Check 1, according to Equation (4), is verified:
Check 2, for what regards the velocity triangles is verified:
vehicle A—Being |Δα| < 90°, the condition which needs to be respected is Equation (7): under the chosen threshold value.
vehicle B—Being |Δα| < 90°, the condition which needs to be respected is Equation (7): which is under the chosen threshold value.
Check 3 is not respected by any of the 4 possible energy loss solutions:
N/A because is negative;
, which is highly above the chosen threshold value;
N/A because is negative;
N/A because is negative.
4. Discussion
Application of the proposed procedure highlights that calculation uncertainty represents only a portion of the possible errors included in databases: the most important ones derive, in fact, from non-plausibility and incorrectness of calculated data. Technicians who can insert data inside databases have different expertise backgrounds, spacing from engineers to doctors and policemen; checks can be thus used by anyone as a confirmation of calculated parameters and their application is desirable in every circumstance. The procedure can also help researchers in drawing conclusions regarding particular accidents, independently from its personal expertise.
While the method has been applied to IGLAD database, the proposed method can be applied also to more in-depth databases (like GIDAS or NASS): a higher number of parameters reported can give also rise to additional checks, eventually based on other physical laws. For example, if angular velocities, or variations of angular velocity, are reported for vehicle A and B, an additional check can be carried out: adapting the pulse general equation [
29], angular velocity change is equal to
, where J
i is the vehicle’s moment of inertia and h
i is the orthogonal distance between the centre of gravity and the Principal Direction of Force (PDOF). Although, the described check cannot be automated: h
i must be retrieved from accident sketches and pictures of the deformed vehicles, implying an important charge of additional work for the user.
Multiple impacts involving more than two vehicles can also be treated by the proposed procedure. However, the kinematic parameters of interest must be reported singularly for every event composing the accident (i.e., every crash between two vehicles): verification by checks 1–3 is applied for the single event. Additional checks can be carried out in this case, too: for example, considering a 3 vehicles collision (vehicles A, B and C), it is possible to use a correlation (Equations (15) and (16) [
30]) between V
collision and V
post-impact to assess compatibility of pre-crash and post-crash conditions inside the multi-vehicle system. In this case, the coefficient of restitution ε must be derived from experimental relationships for each crash (ε’ and ε’’ respectively), e.g., based on velocity change of vehicles (
and
, Equations (17) and (18) [
31]):
5. Conclusions
In this paper, a procedure for the assessment of accident data correctness collected inside in-depth databases was proposed. The method allows to verify step by step the consistency/plausibility of the kinematic data, mainly to better road safety by the enhancements in data collection and classification process. Three different possible checks were devised and implemented for 2 vehicles crashes regarding:
Momentum conservation, for the evaluation of ;
Velocity triangles, for the consistency of , and ;
Kinetic energy loss, to verify if the energy loss estimated through EES is similar to the one obtained by the use of and .
The proposed methodology aims at making the analysis and correlation reliable, typically carried out using the kinematic parameters collected in an in-depth database. For example, is commonly used as a crash-severity descriptor and injury predictor: errors in its evaluation can lead to changes in the correlation with injury-risk associated to a specific accident. As an example, the procedure was applied to 4 different cases retrieved from IGLAD database, highlighting its ease of application and usefulness.
The proposed checks are applicable to every database because few input variables were used. Increased effectiveness can be reached when the procedure is applied to databases with a higher amount of data, but also adding checks to the ones described in this paper. The paper in fact addresses not only technicians who operate directly in databases creation, but also directly the users, to allow the efficiency maximization in data manipulation operations.


