Stronger Short-Term Memory, Larger Hippocampi and Area V1 in People with High VVIQ Scores


Abstract

1. Introduction
2. Materials and Methods
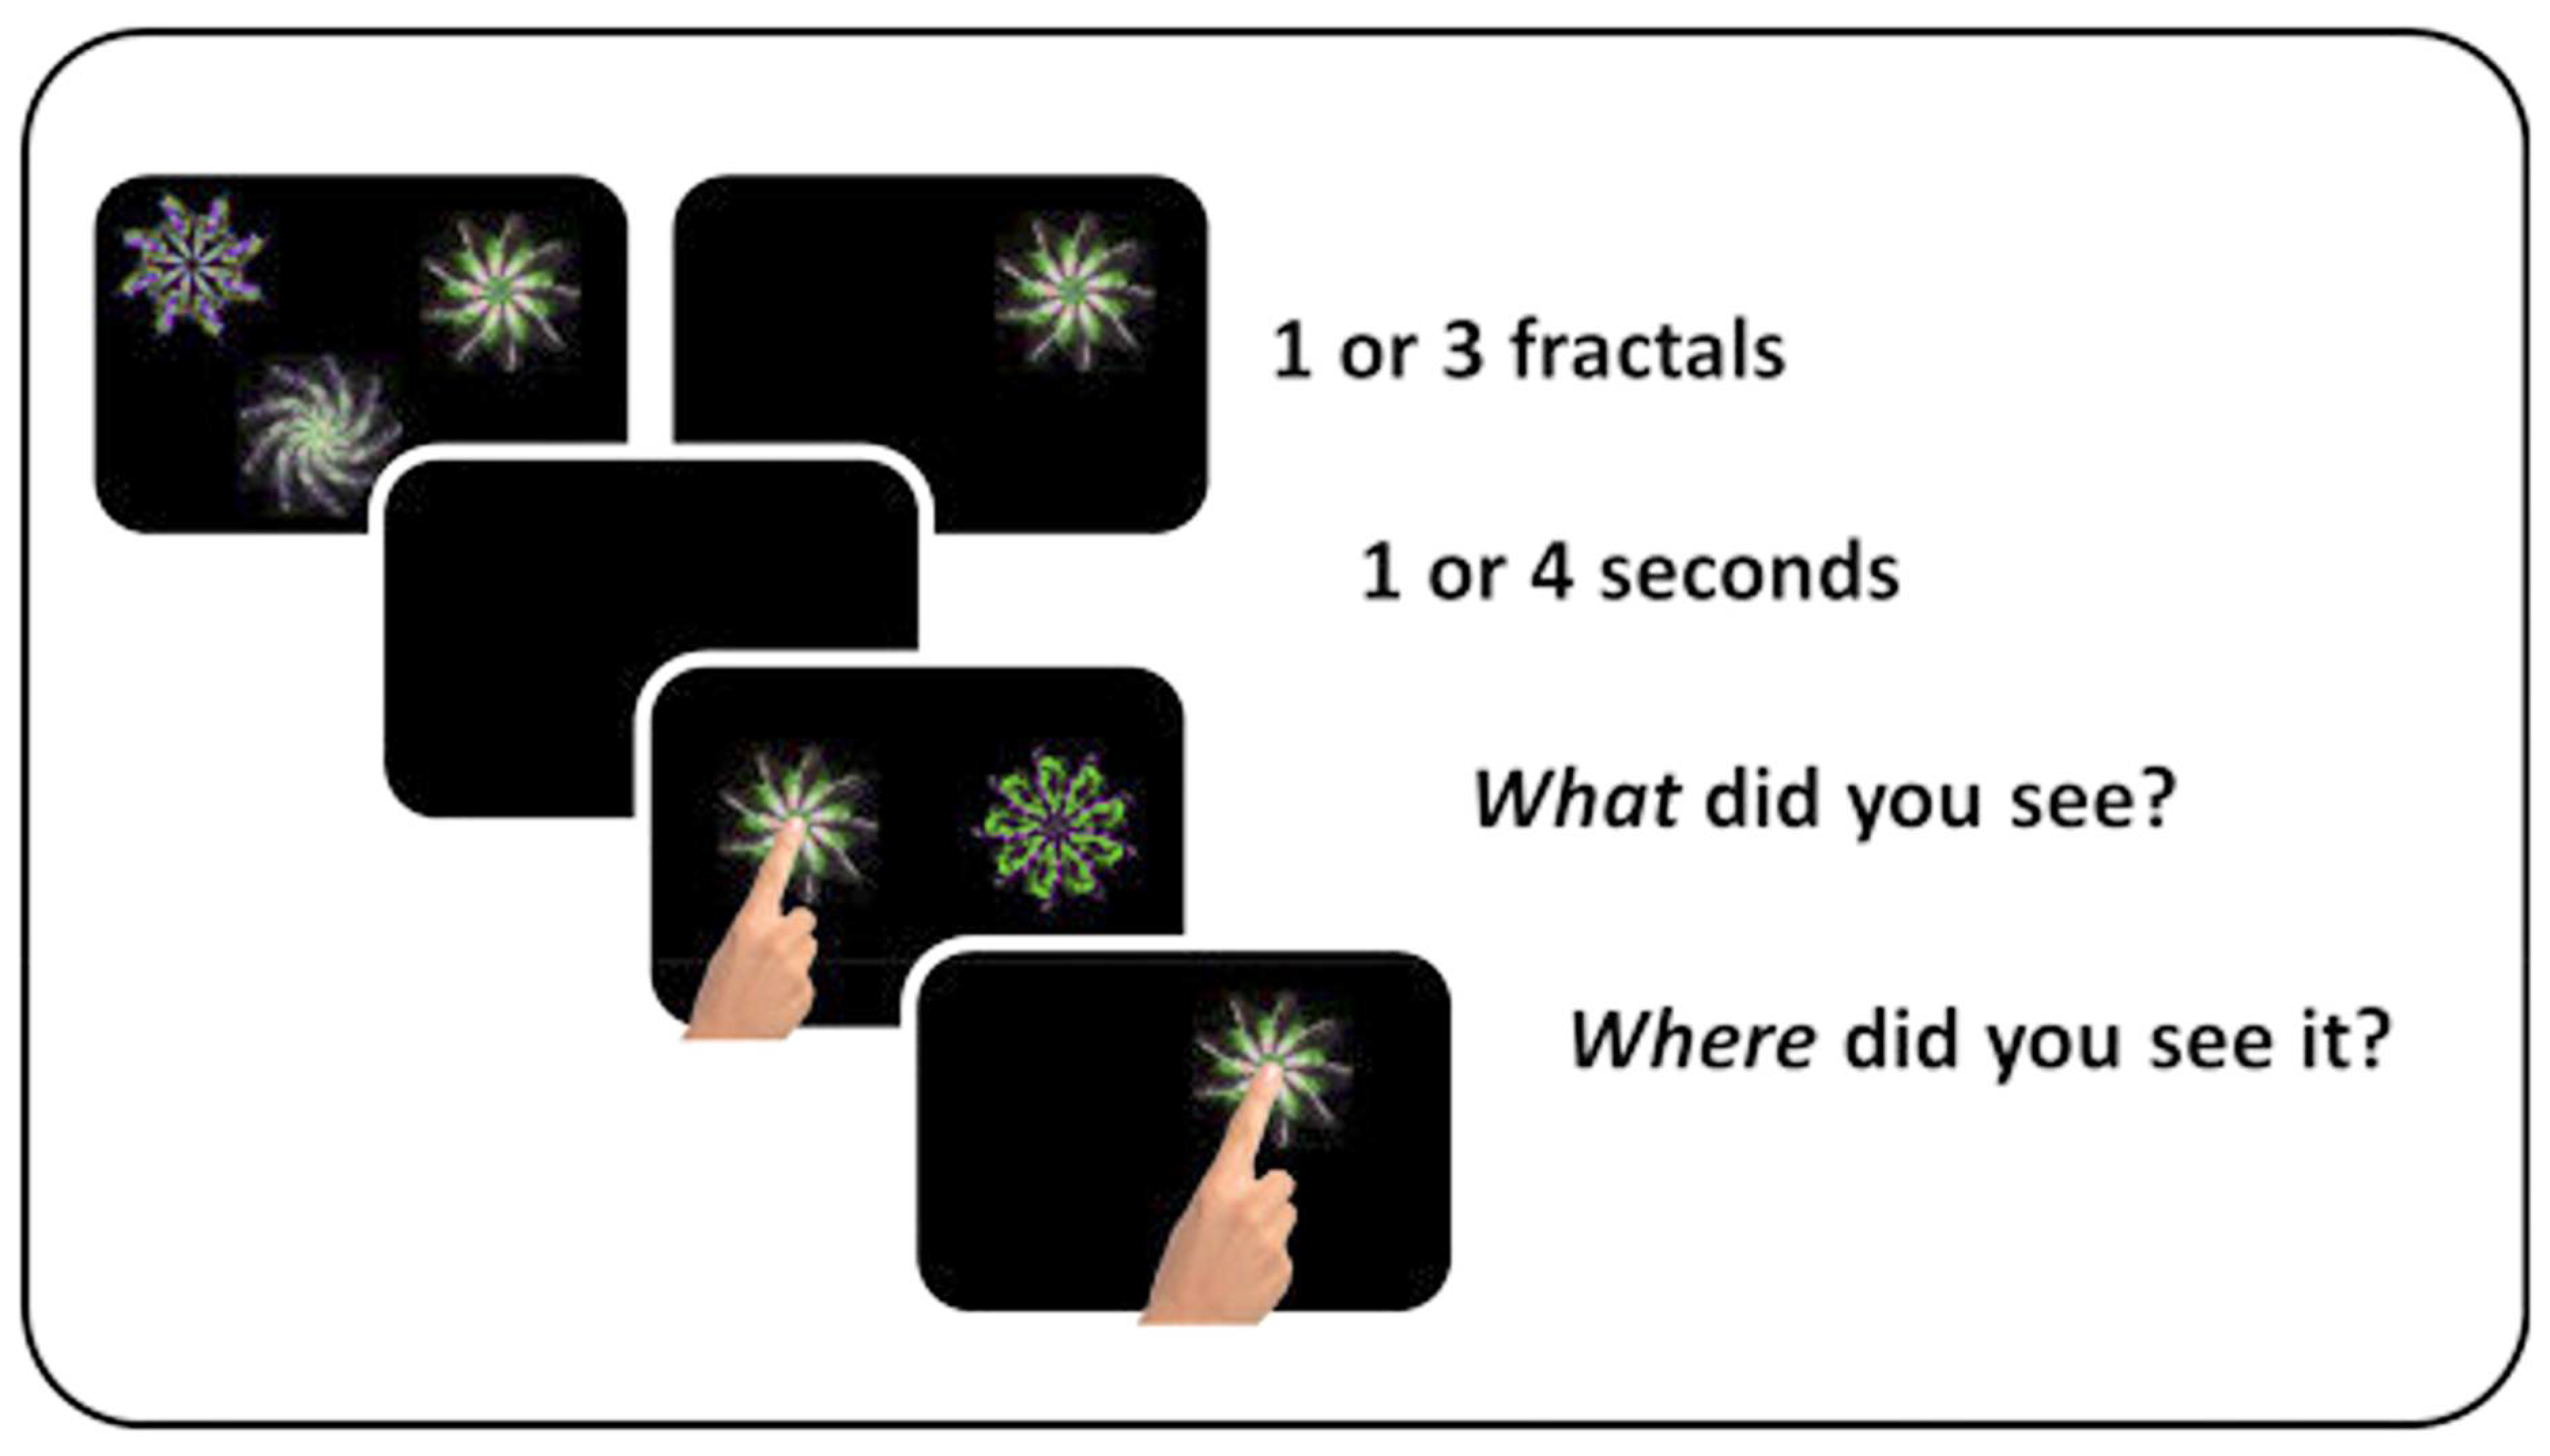
2.1. Short-Term Memory Task
- Identification Accuracy: Trials in which the correct shape was identified out of two divided by the total number of trials of each condition. Trials in which participants did not identify the correct item were excluded from further analysis.
- Response Time: Time taken to point to the correct shape.
- Localisation Performance: Distance between the response and the original target’s location.
- Misbinding; The probability that a participant can correctly remember the appearances and locations of the shapes at test but confuses or “misbinds” these locations and appearances, resulting in the report of another shape’s location for a correctly identified shape.
- Guessing, Guessing indicates a random response likely given when the viewer has forgotten any precise information about the target.
2.2. Vividness of Visual Imagery Questionnaire
2.3. MRI Analysis
2.4. Availability of Data
2.5. Participants
2.6. Ethical Approval
3. Results
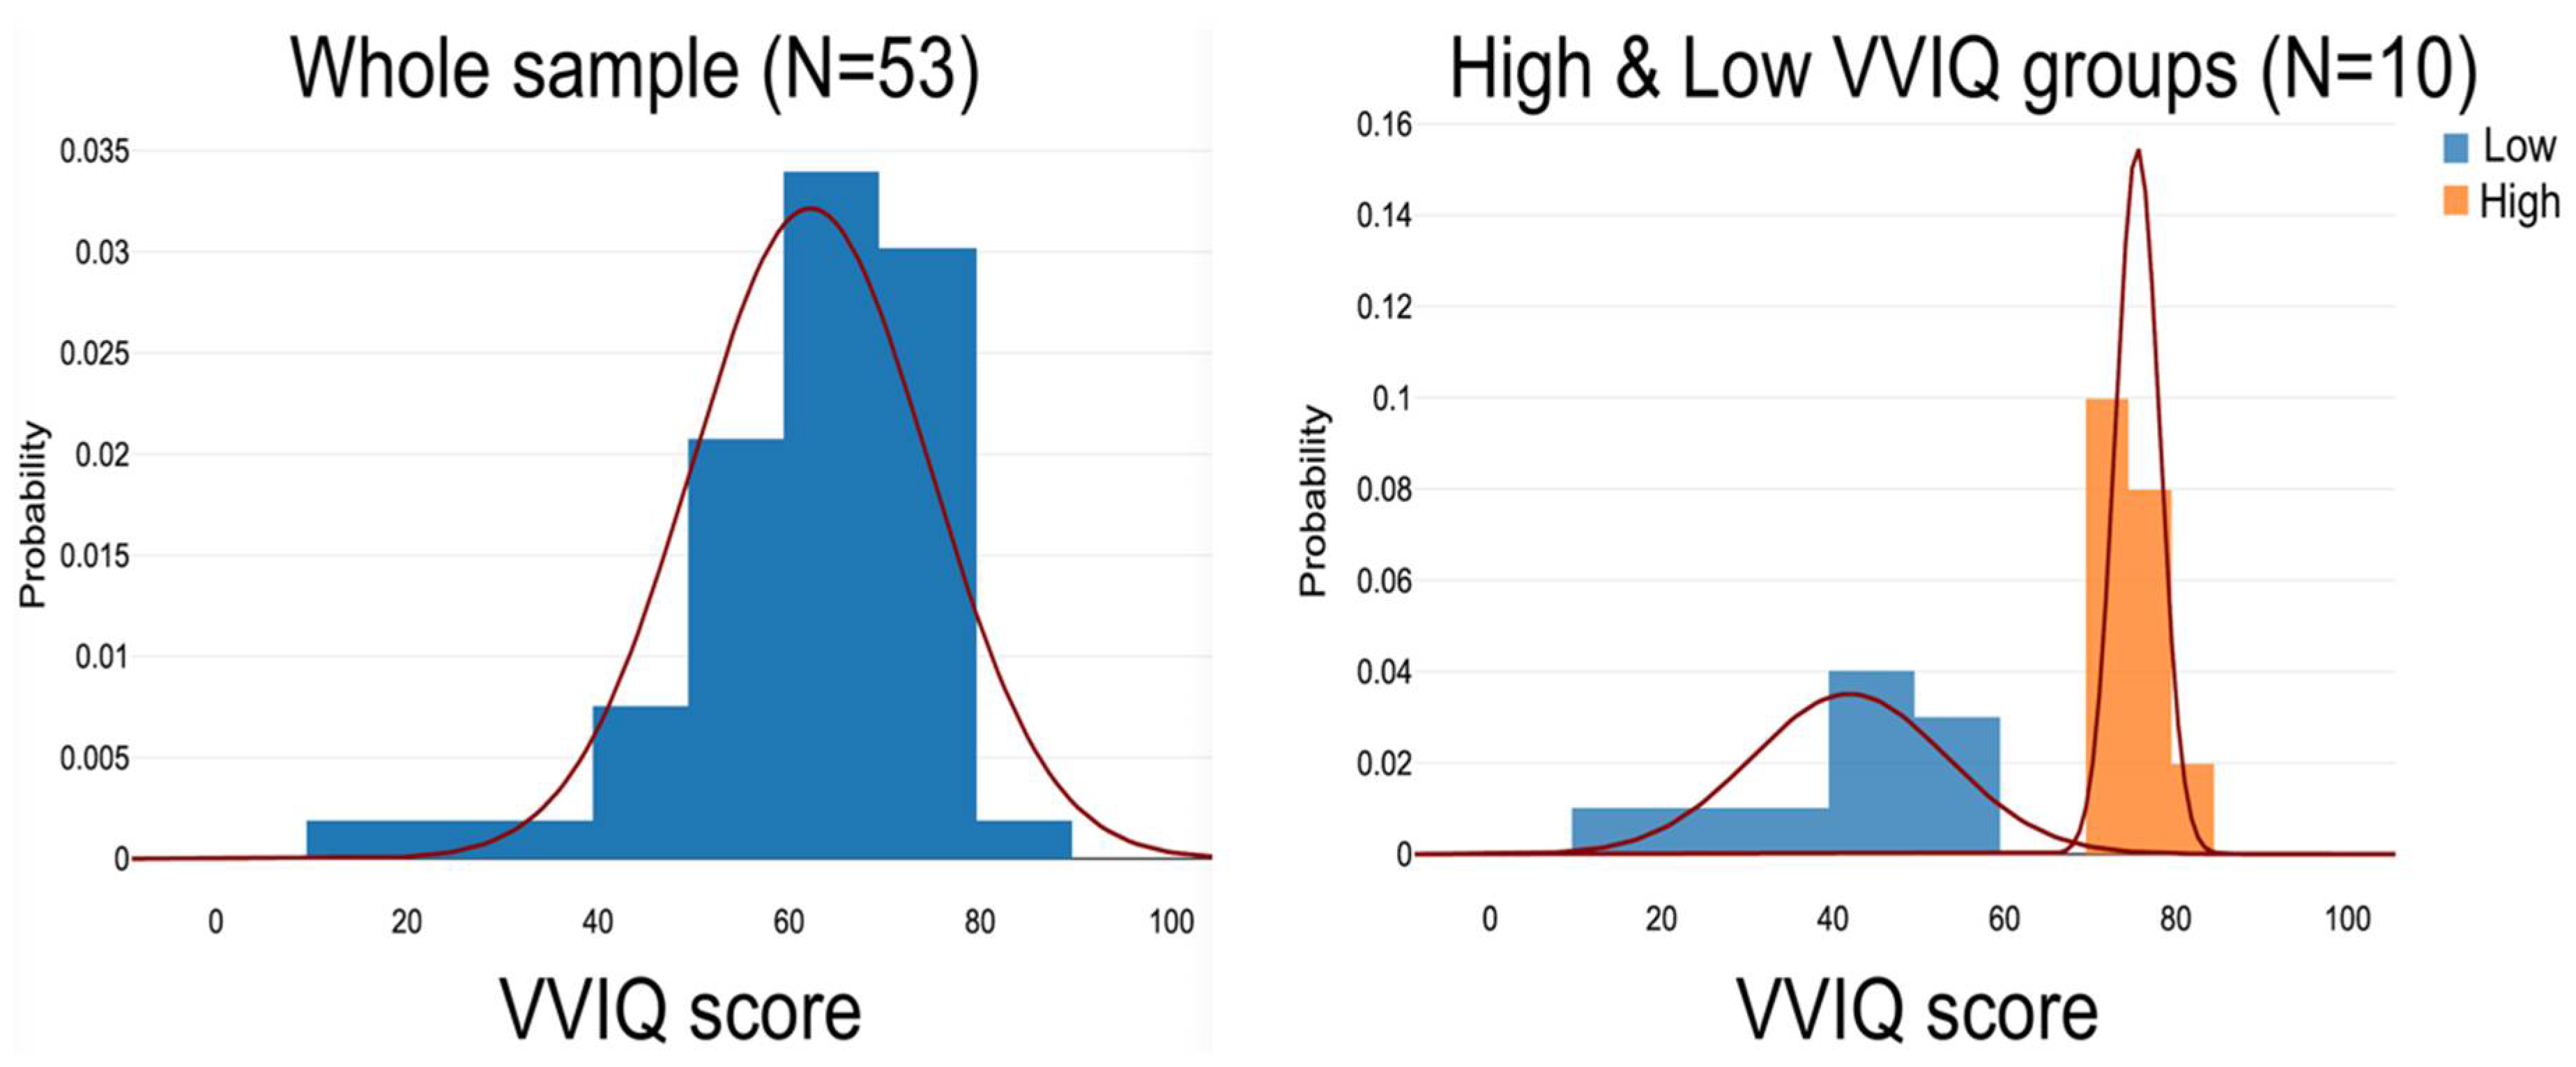
3.1. VVIQ Scores
3.2. Visual Short-Term Visual Memory (VSTM)
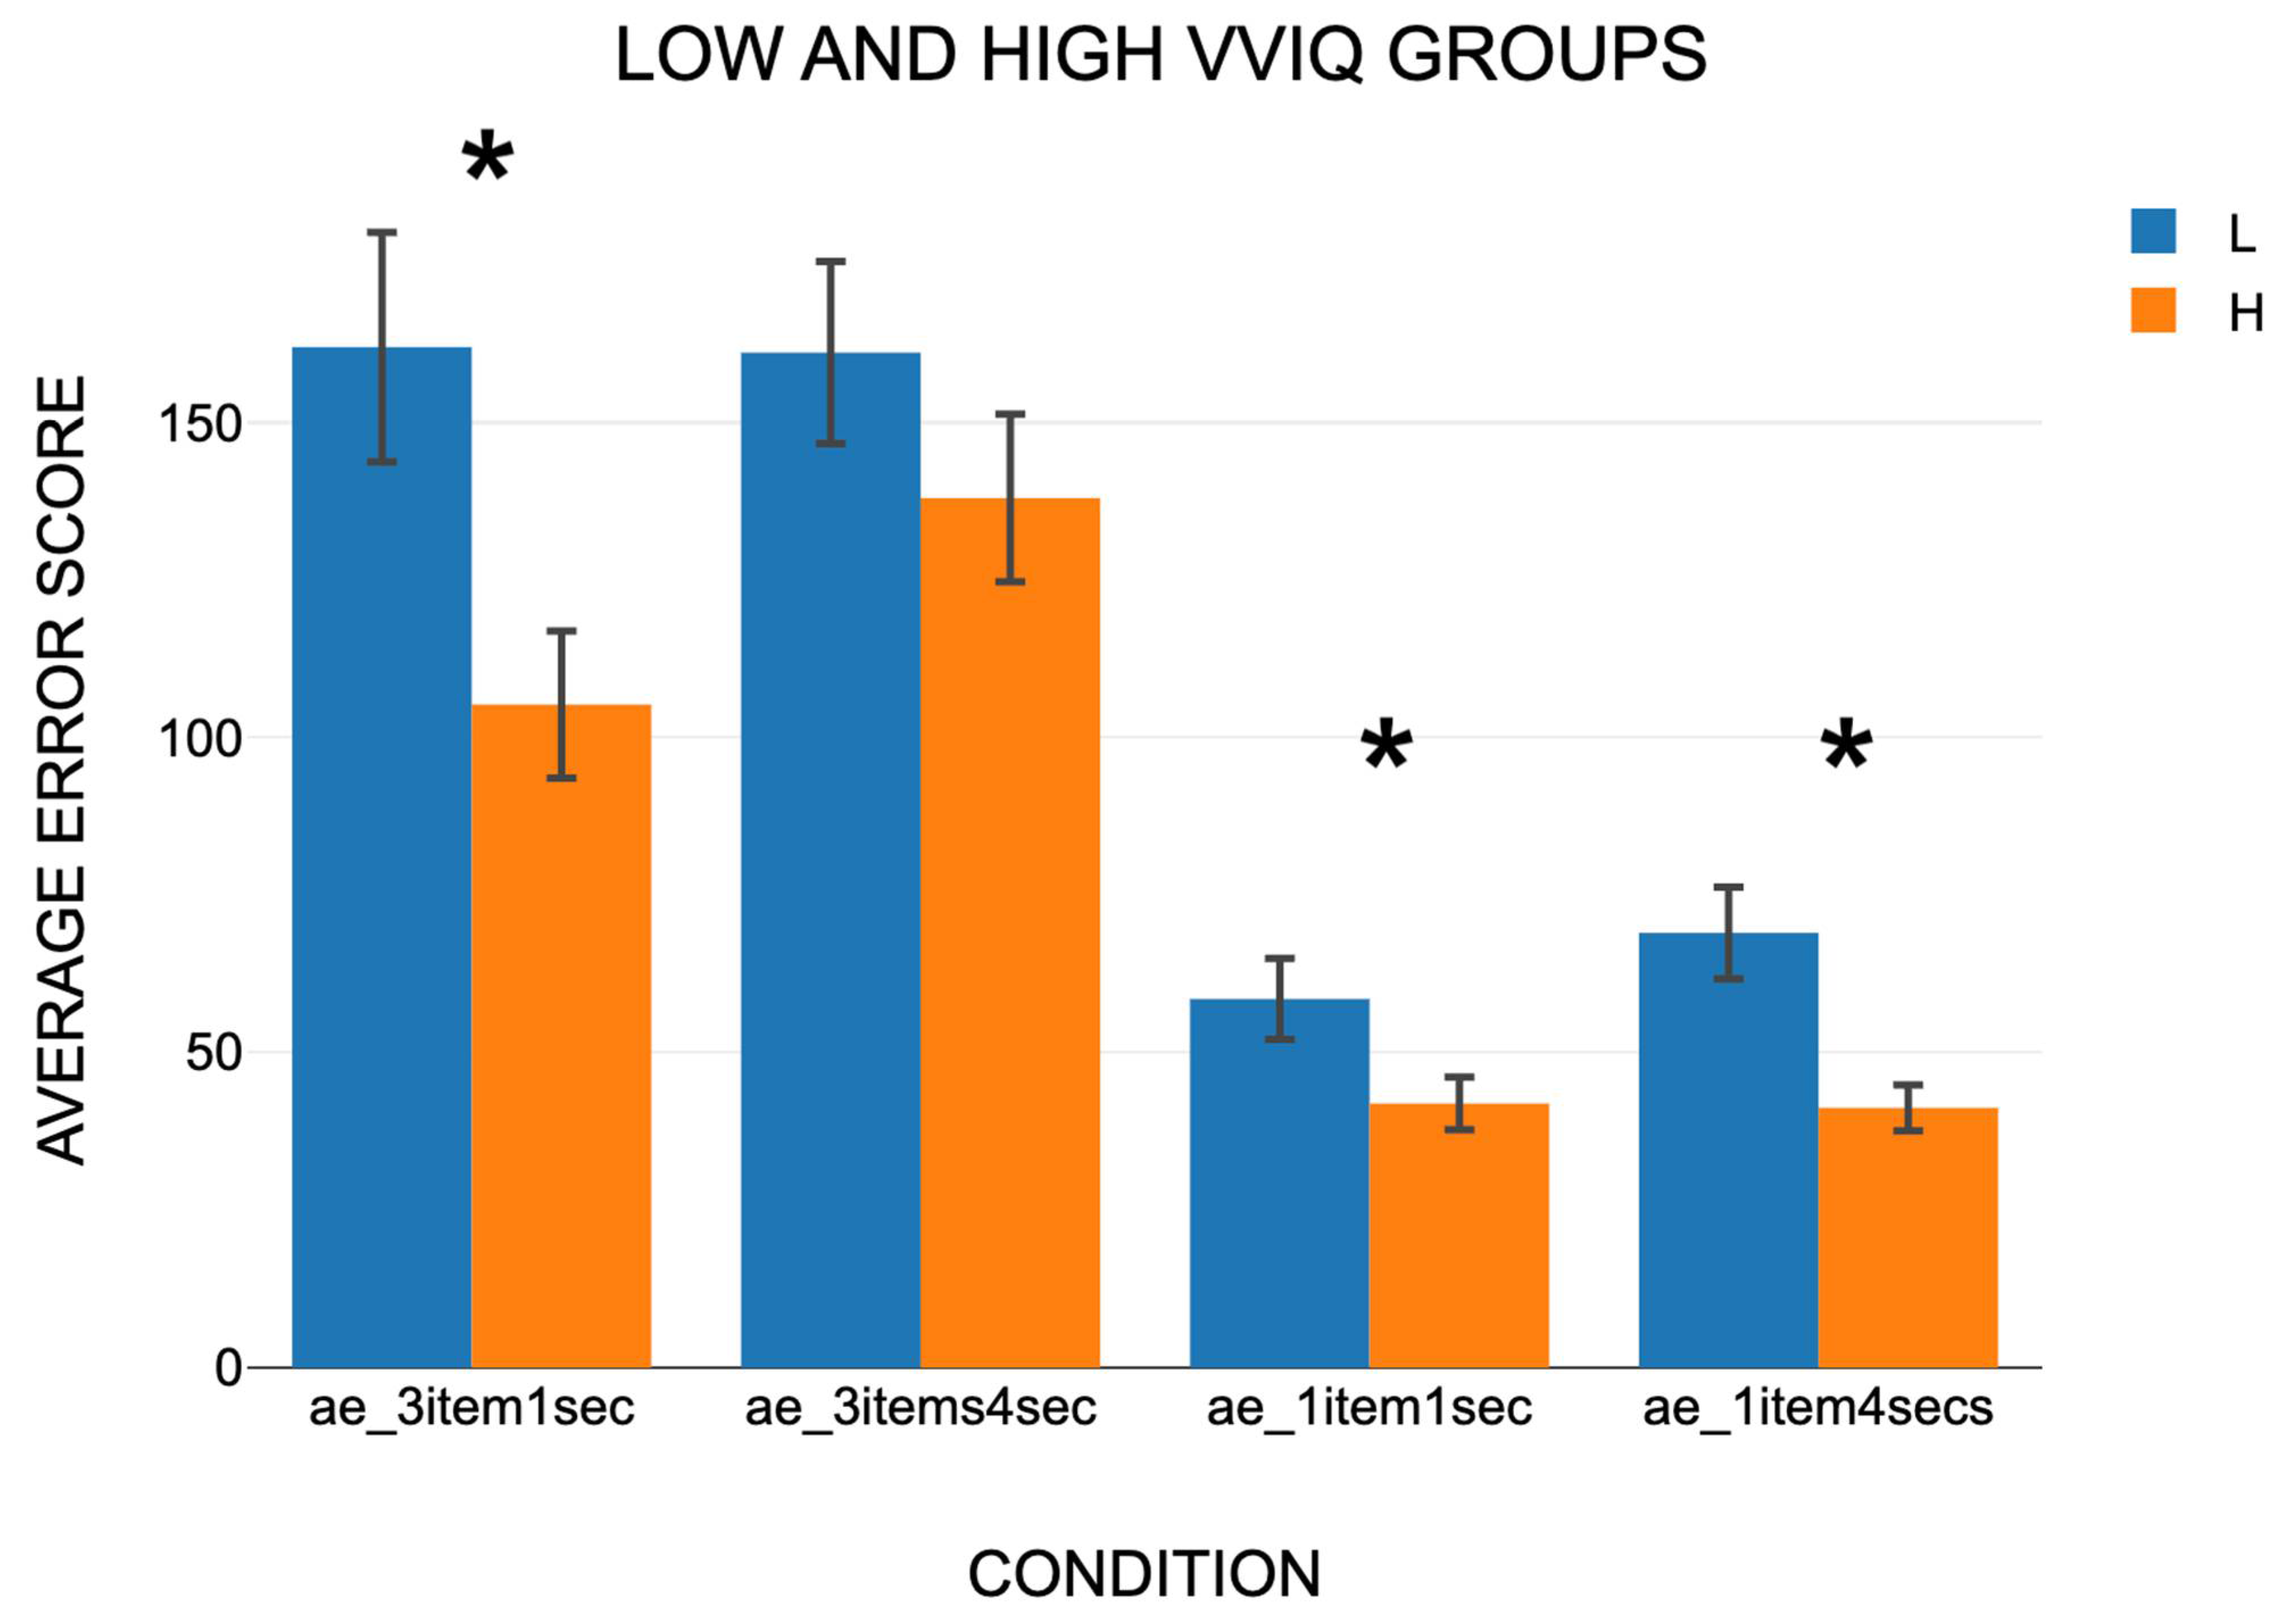
3.2.1. Absolute Error Scores
3.2.2. Mean Guessing Rates
3.2.3. Mean Misbinding Rates
3.2.4. Correct Mean Response Times and Proportions
3.2.5. Aphant and Hphant VSTM Results
3.3. MRI Volume Scores
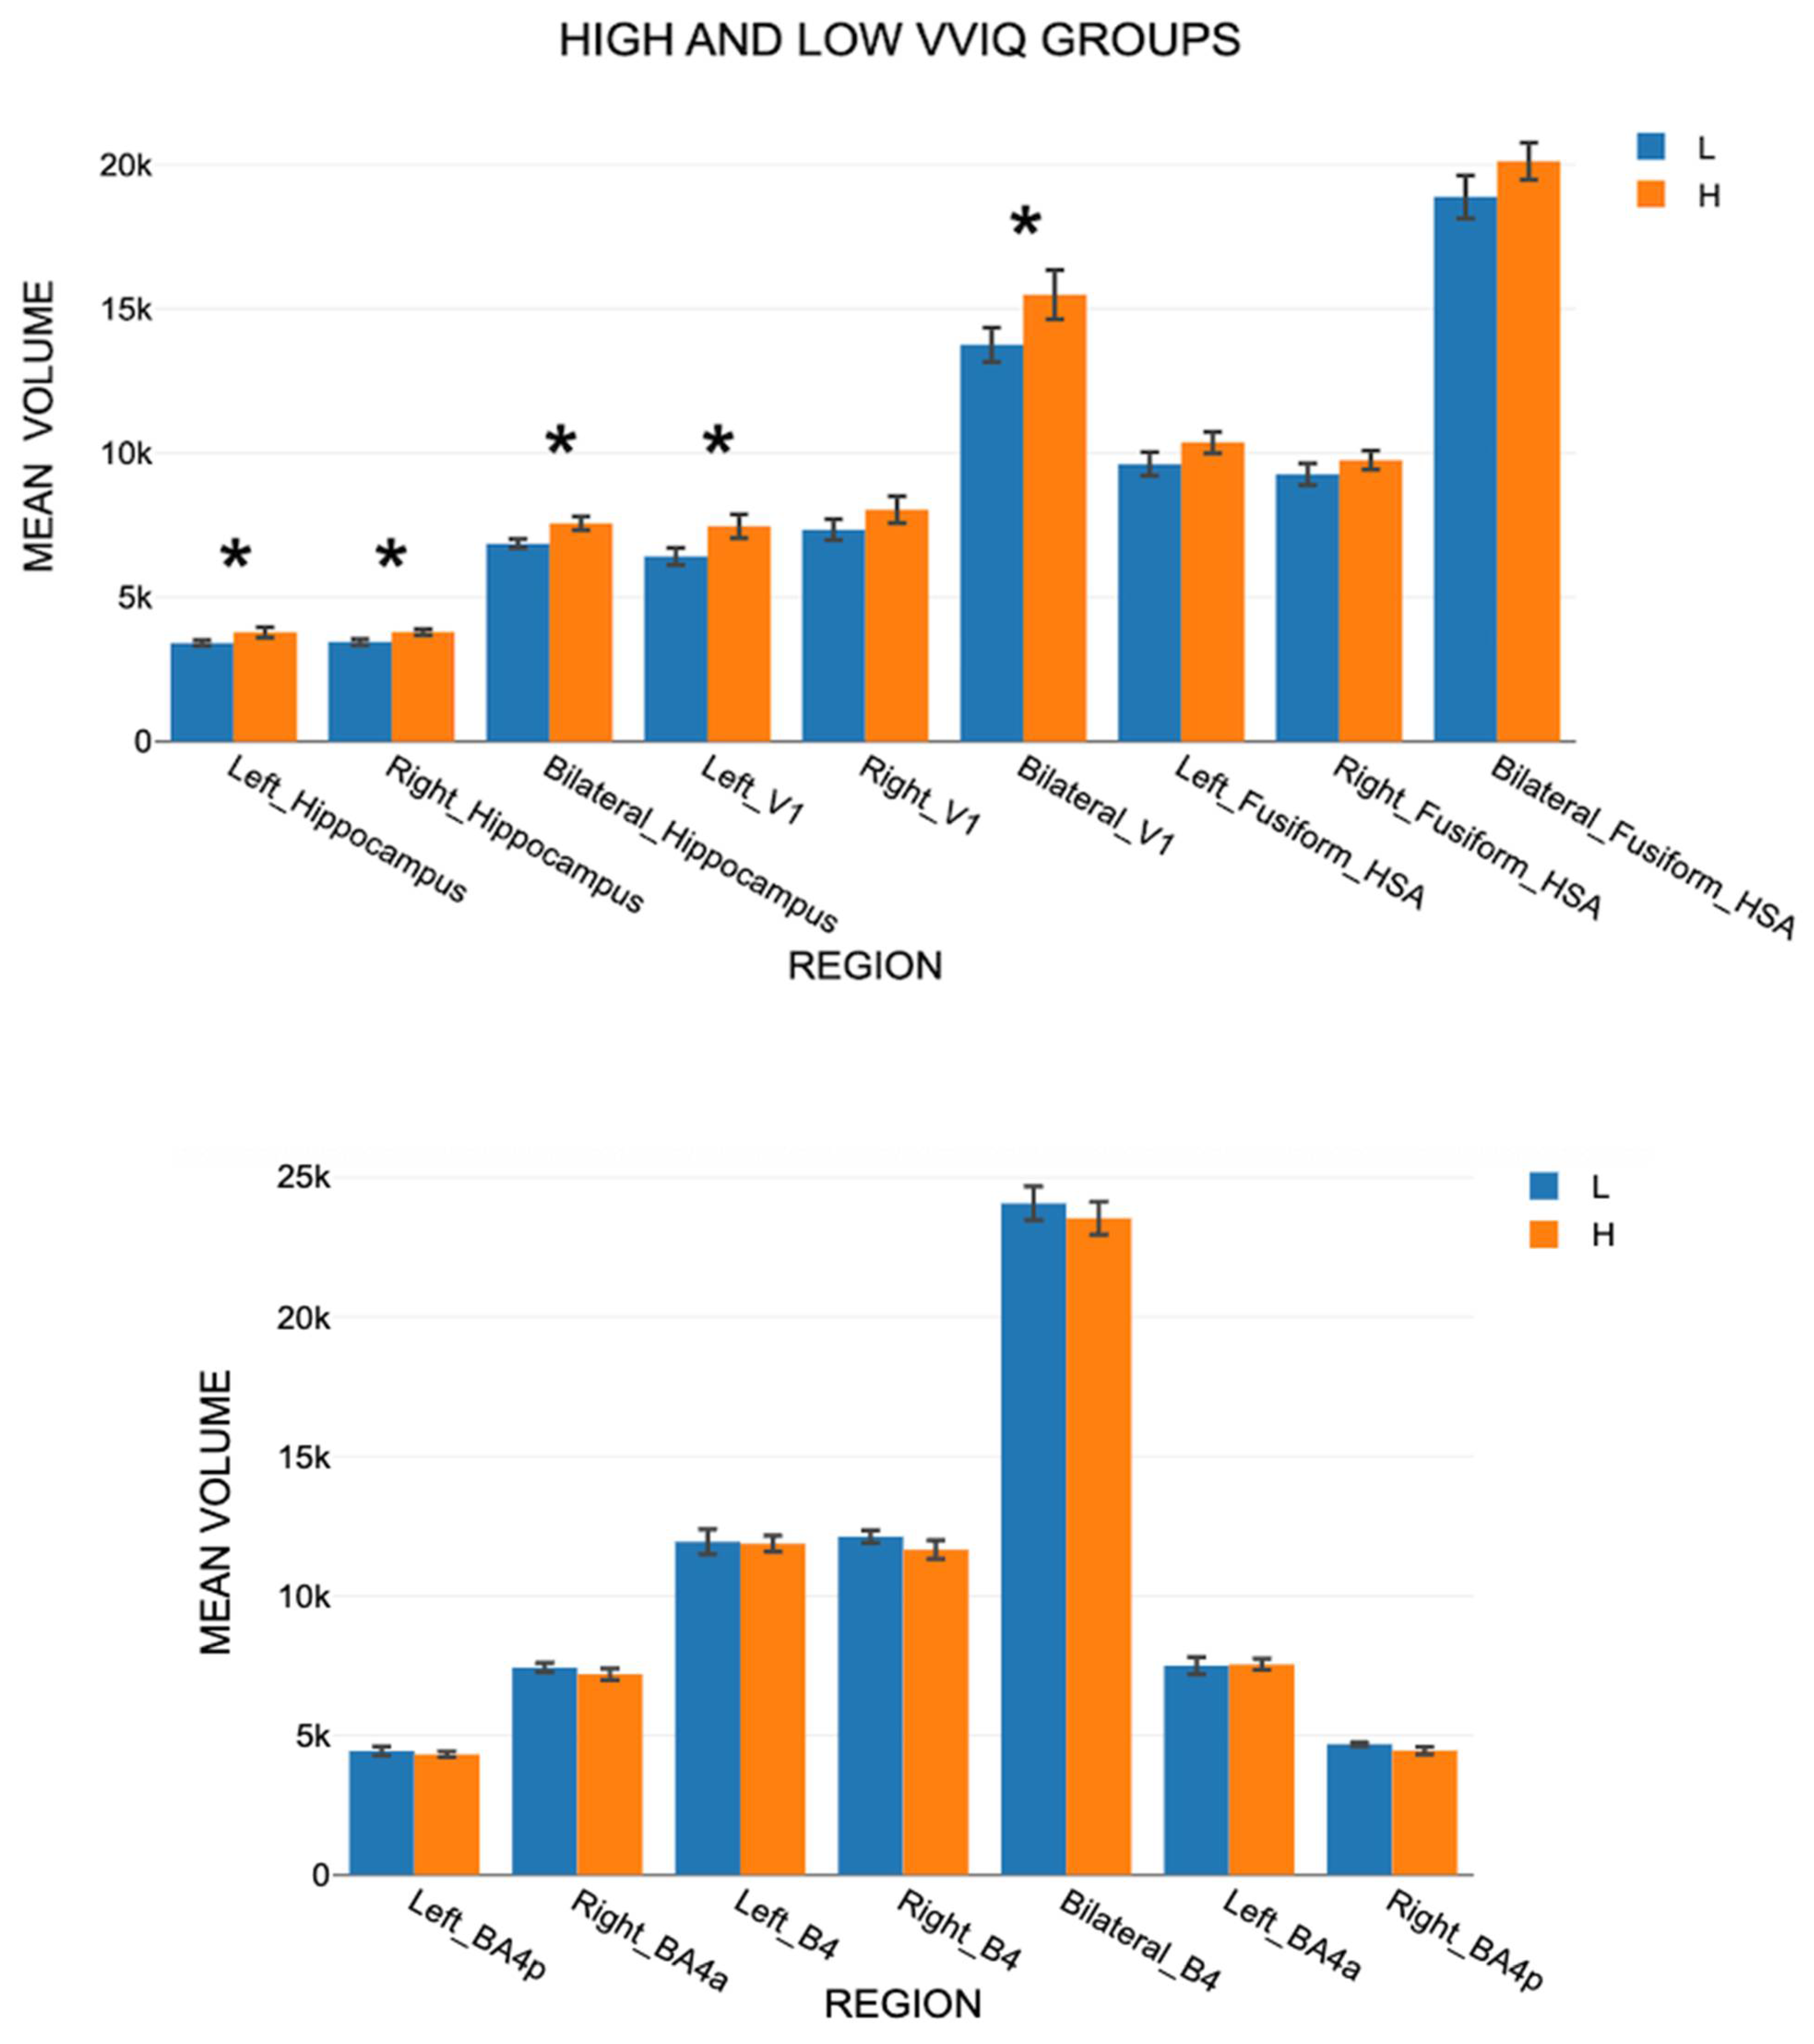
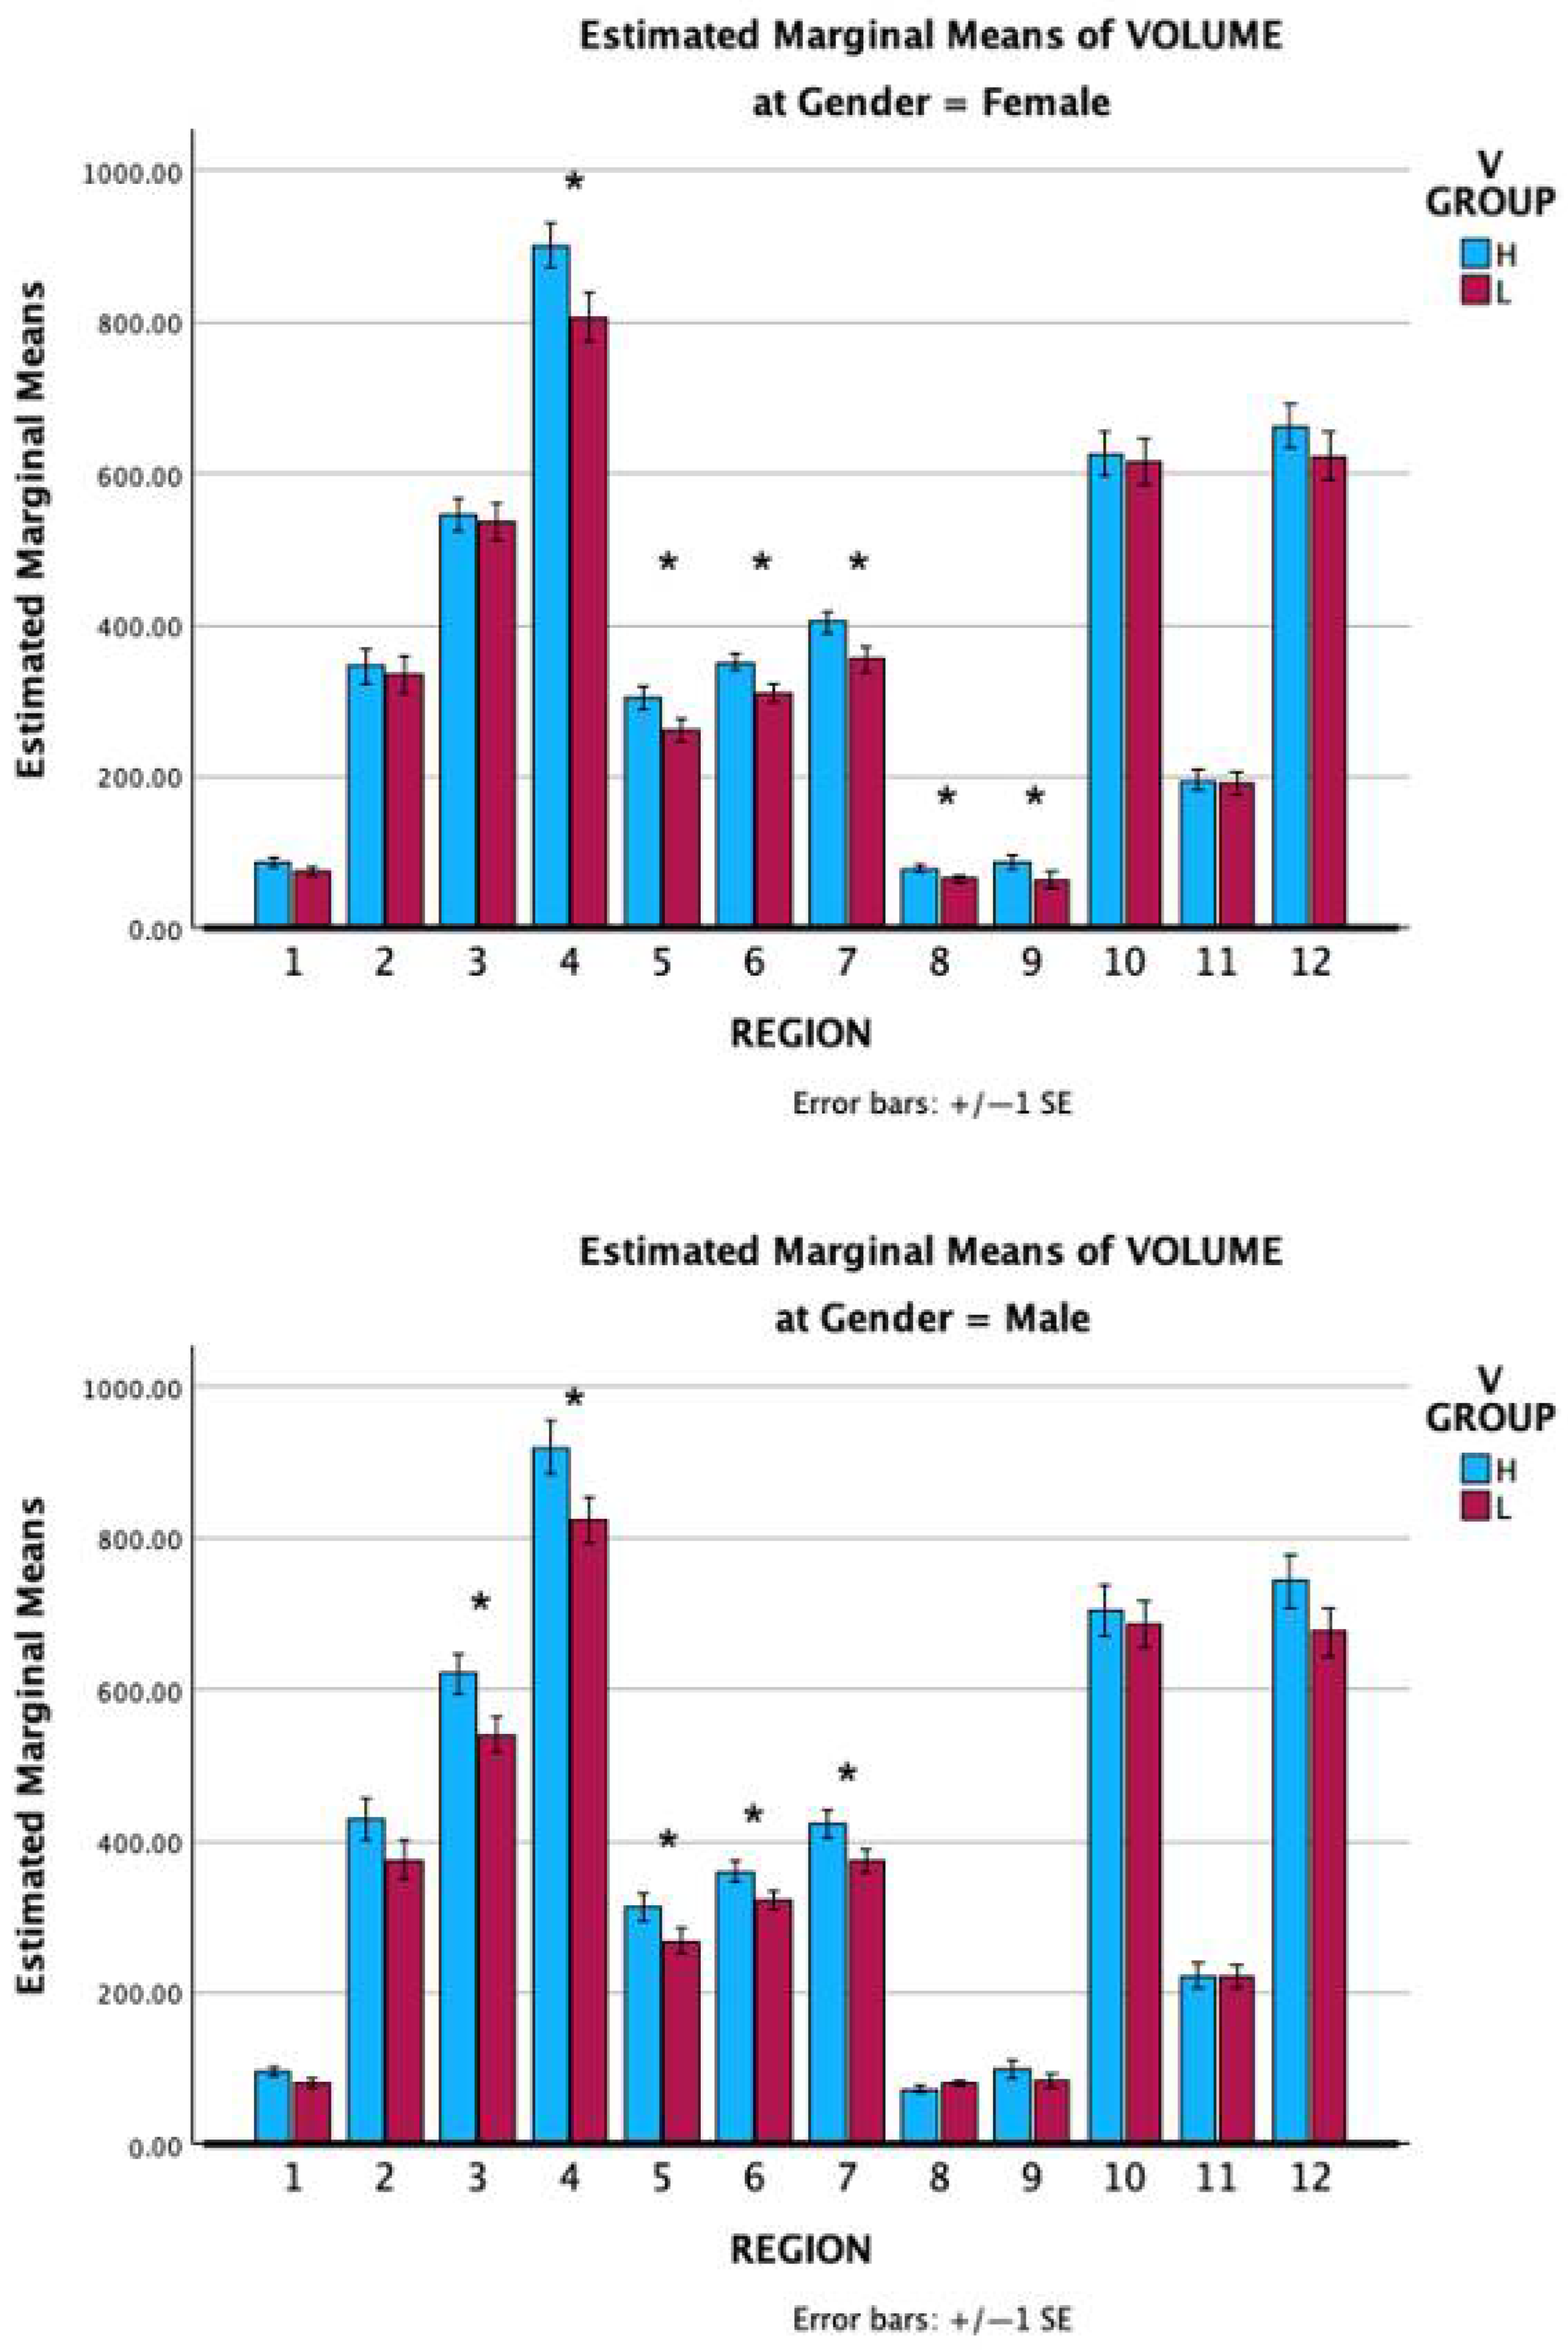
3.3.1. Findings for Set A Areas
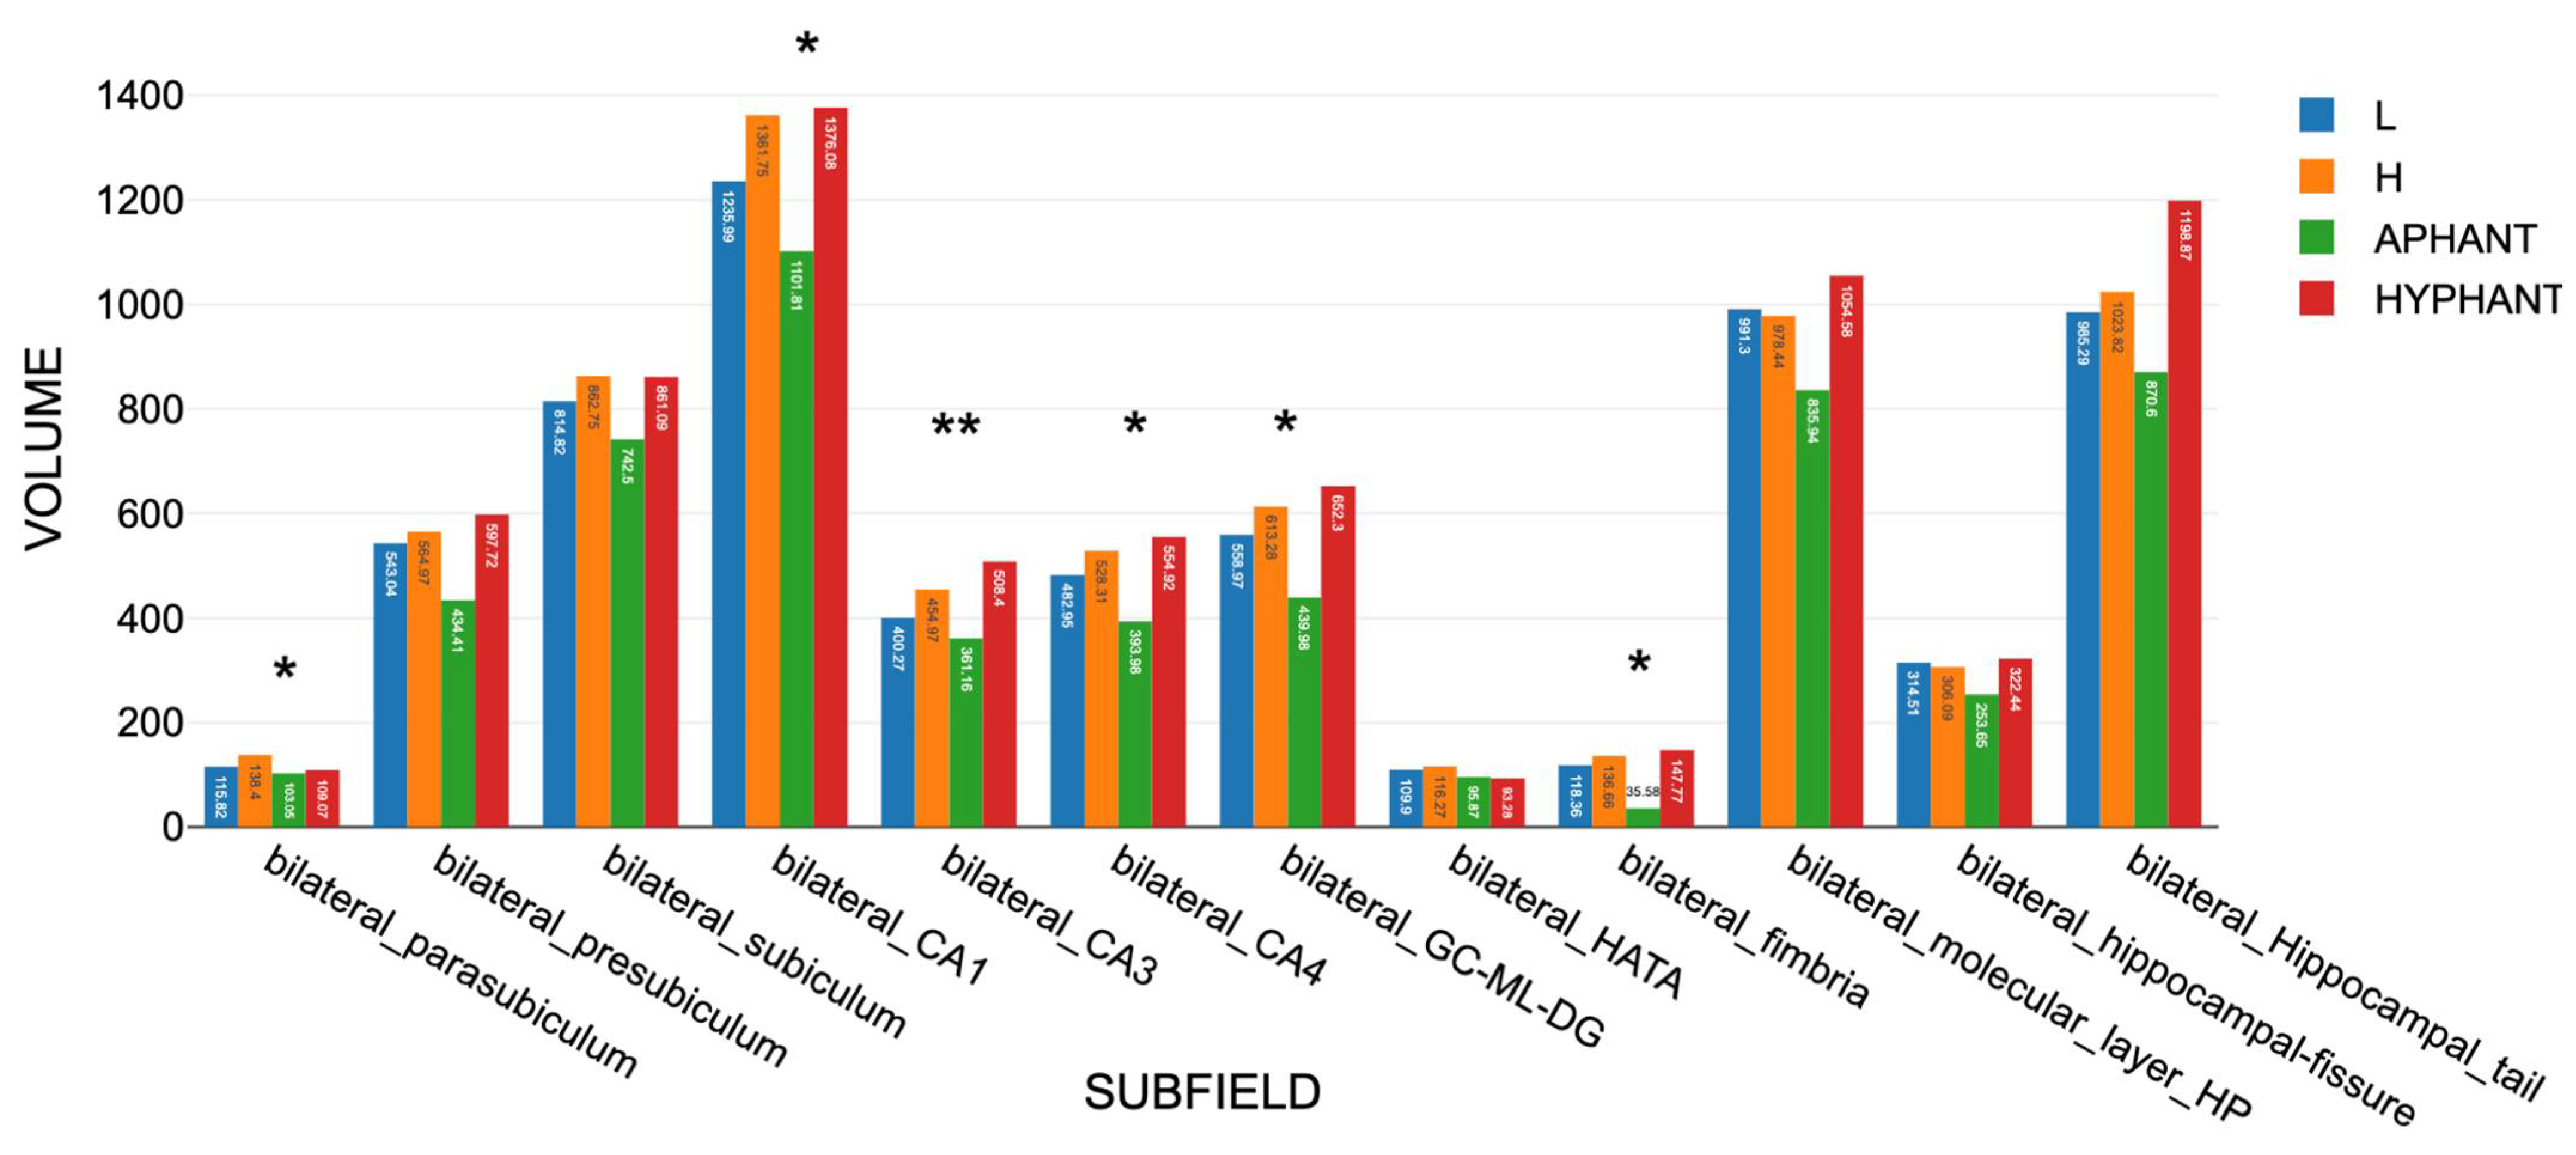
3.3.2. Findings for Set B Subfields
3.3.3. Findings for the Amygdala
3.3.4. Findings for Set D Subfields
3.3.5. Comparing VMI Active and Control Regions
3.3.6. Findings for Aphant and Hphant
3.3.7. Other Analyses and Observations
4. Discussion
4.1. Summary of Findings
4.2. General Significance of Findings
4.2.1. VSTM
4.2.2. Brain Regional Differences
4.2.3. The Aphant Profile
4.2.4. The Hphant Profile
4.2.5. Consistency with Earlier EEG Findings
4.2.6. Relationship Between Hippocampus and Area V1
4.3. Strengths and Limitations
4.3.1. Independence and Transparency
4.3.2. Measures Used
4.3.3. Small Group Sizes
5. Conclusions
- (1)
- Are VMI-vividness differences measured with the VVIQ actually measuring anything? If we are enabled to make rich, precise, falsifiable predictions using VVIQ measures, then the answer is affirmative. VVIQ differences are measuring genuine VMI differences, and, in this study as in many others, they have produced a set of highly significant and meaningful findings.
- (2)
- What functions do the vividness differences serve? High VMI-vividness serves three primary functions: (A) remembering recent and distant-past stimuli, scenarios, episodes, and events; (B) anticipating, foreseeing, and simulating near and distant future stimuli, scenarios, episodes, and events; and, (C) constructing phantasy for dreams, imaginary stimuli, scenarios, episodes, and events. Low or absent VMI require alternative, non-imagistic mnemonic strategies, such as scaffolding, tagging, and listing, to perform tasks but, in some cases, less efficiently.
- (3)
- What is their neurological foundation? VMI-vividness differences are founded, at least in part, on a highly varied set of regional brain volumes which show significant, systematic associations with VVIQ scores.
Supplementary Materials
Funding
Institutional Review Board Statement
Informed Consent Statement
Data Availability Statement
Conflicts of Interest
References
- Marks, D.F. The action cycle theory of perception and mental imagery. Vision 2023, 7, 12. [Google Scholar] [CrossRef] [PubMed]
- Marks, D.F. Individual Differences in the Vividness of Visual Imagery and Their Effect on Function. In The Function and Nature of Imagery; Sheehan, P.W., Ed.; Academic Press: New York, NY, USA, 1972; pp. 83–108. [Google Scholar]
- Marks, D.F. Phenomenological Studies of Visual Mental Imagery: A Review and Synthesis of Historical Datasets. Vision 2023, 7, 67. [Google Scholar] [CrossRef]
- Bilzer, M.; Monzel, M. The Phenomenology of Offline Perception: Multisensory Profiles of Voluntary Mental Imagery and Dream Imagery. Vision 2025, 9, 37. [Google Scholar] [CrossRef]
- Belfi, A.M. Emotional valence and vividness of imagery predict aesthetic appeal in music. Psychomusicol. Music. Mind Brain 2019, 29, 128. [Google Scholar] [CrossRef]
- Marks, D.F. The General Theory of Behaviour: A Sourcebook; Cambridge Scholars Publishing: Newcastle upon Tyne, UK, 2025; Available online: https://www.cambridgescholars.com/product/978-1-0364-4245-3 (accessed on 3 July 2025).
- Marks, D.F. Visual imagery differences in the recall of pictures. Br. J. Psychol. 1973, 64, 17–24. [Google Scholar] [CrossRef] [PubMed]
- Baddeley, A.D.; Andrade, J. Working memory and the vividness of imagery. J. Exp. Psychol. Gen. 2000, 129, 126–145. [Google Scholar] [CrossRef] [PubMed]
- Chkhaidze, A.; Coulson, S.; Kiyonaga, A. Individual Differences in Preferred Thought Formats Predict Features of Narrative Recall. Proc. Annu. Meet. Cogn. Sci. Soc. 2023, 45. Available online: https://escholarship.org/uc/item/0jm2d2rm (accessed on 3 July 2025).
- Keogh, R.; Pearson, J. Mental imagery and visual working memory. PLoS ONE 2011, 6, e29221. [Google Scholar] [CrossRef]
- Keogh, R.; Pearson, J. The sensory strength of voluntary visual imagery predicts visual working memory capacity. J. Vis. 2014, 14, 1427–1431. [Google Scholar] [CrossRef]
- Gur, R.C.; Hilgard, E.R. Visual imagery and the discrimination of differences between altered pictures simultaneously and successively presented. Br. J. Psychol. 1975, 66, 341–345. [Google Scholar] [CrossRef]
- McKelvie, S.J.; Demers, E.G. Individual differences in reported visual imagery and memory performance. Br. J. Psychol. 1979, 70, 51–57. [Google Scholar] [CrossRef] [PubMed]
- Berger, G.H.; Gaunitz, S.C. Self-rated imagery and encoding strategies in visual memory. Br. J. Psychol. 1979, 70, 21–24. [Google Scholar] [CrossRef]
- Slee, J.A. Individual differences in visual imagery ability and the retrieval of visual appearances. J. Ment. Imag. 1980, 4, 93–113. [Google Scholar]
- McKelvie, S.J. The VVIQ as a psychometric test of individual differences in visual imagery vividness: A critical quantitative review and plea for direction. J. Ment. Imag. 1995, 19, 1–106. [Google Scholar]
- Rodway, P.; Gillies, K.; Schepman, A. Vivid imagers are better at detecting salient changes. J. Individ. Differ. 2006, 27, 218–228. [Google Scholar] [CrossRef]
- Jacobs, C.; Schwarzkopf, D.S.; Silvanto, J. Visual working memory performance in aphantasia. Cortex 2018, 105, 61–73. [Google Scholar] [CrossRef] [PubMed]
- Heuer, F.; Fischman, D.; Reisberg, D. Why does vivid imagery hurt colour memory? Can. J. Psychol./Rev. Can. De Psychol. 1986, 40, 161–175. [Google Scholar] [CrossRef]
- Reisberg, D.; Culver, L.C.; Heuer, F.; Fischman, D. Visual memory: When imagery vividness makes a difference. J. Ment. Imag. 1986, 10, 51–74. [Google Scholar]
- Reisberg, D.; Leak, S. Visual imagery and memory for appearance: Does Clark Gable or George C. Scott have bushier eyebrows? Can. J. Psychol./Rev. Can. De Psychol. 1987, 41, 521–526. [Google Scholar] [CrossRef]
- Zhang, Z.; Liu, Y.; Yang, J.; Li, C.; Marks, D.F.; Sala, S.D.; Zhao, B. The Establishment of the Chinese Version of the Vviq (Vviq-C) and the Effects of Age and Gender on the Vividness of Visual Imagery. J. Psychiatry Psychiatr. Disord. 2025, 9, 163–171. [Google Scholar] [CrossRef]
- Zeman, A.; Dewar, M.; Della Sala, S. Lives without imagery—Congenital aphantasia. Cortex 2015, 73, 378–380. [Google Scholar] [CrossRef] [PubMed]
- Zeman, A.; Milton, F.; Della Sala, S.; Dewar, M.; Frayling, T.; Gaddum, J.; Hattersley, A.; Heuerman-Williamson, B.; Jones, K.; MacKisack, M.; et al. Phantasia–The psychological significance of lifelong visual imagery vividness extremes. Cortex 2020, 130, 426–440. [Google Scholar] [CrossRef] [PubMed]
- Blomkvist, A.; Marks, D.F. Defining and ‘diagnosing’ aphantasia: Condition or individual difference? Cortex 2023, 169, 220–234. [Google Scholar] [CrossRef] [PubMed]
- Jin, F.; Hsu, S.-M.; Li, Y. A Systematic Review of Aphantasia: Concept, Measurement, Neural Basis, and Theory Development. Vision 2024, 8, 56. [Google Scholar] [CrossRef]
- Geschwind, N. Disconnexion syndromes in animals and man. I. Brain 1965, 88, 237–294. [Google Scholar] [CrossRef]
- Farah, M.J.; Levine, D.N.; Calvanio, R. A case study of mental imagery deficit. Brain Cogn. 1988, 8, 147–164. [Google Scholar] [CrossRef]
- Marks, D.F. On the relationship between imagery, body and mind. In Imagery: Current Developments; Hampson, P.J., Marks, D.F., Richardson, J.T.E., Eds.; Routledge: London, UK, 1990; pp. 1–38. [Google Scholar]
- Marks, D.F.; Uemura, K.; Tatsuno, J.; Imamura, Y.; Ashida, H. Topographical analysis of alpha attenuation in mental imagery and calculation. Electroencephalogr. Clin. Neurophysiol. 1985, 61, S142. [Google Scholar] [CrossRef]
- Marks, D.; Uemura, K.; Tatsuno, J.; Imamura, Y. EEG topographical analysis of imagery. In Contemporary Psychology: Biological Processes and Theoretical Issues; Elsevier: Amsterdam, The Netherlands, 1985; pp. 211–223. [Google Scholar]
- Marks, D.F.; Isaac, A.R. Topographical distribution of EEG activity accompanying visual and motor imagery in vivid and non-vivid imagers. Br. J. Psychol. 1995, 86, 271–282. [Google Scholar] [CrossRef]
- Farah, M.J. The neurological basis of mental imagery: A componential analysis. Cognition 1984, 18, 245–272. [Google Scholar] [CrossRef]
- Kosslyn, S.M.; Thompson, W.L. When is early visual cortex activated during visual mental imagery? Psychol. Bull. 2003, 129, 723. [Google Scholar] [CrossRef]
- Amedi, A.; Malach, R.; Pascual-Leone, A. Negative BOLD differentiates visual imagery and perception. Neuron 2005, 48, 859–872. [Google Scholar] [CrossRef] [PubMed]
- Cui, X.; Jeter, C.B.; Yang, D.; Montague, P.R.; Eagleman, D.M. Vividness of mental imagery: Individual variability can be measured objectively. Vis. Res. 2007, 47, 474–478. [Google Scholar] [CrossRef] [PubMed]
- Dijkstra, N.; Bosch, S.E.; van Gerven, M.A. Shared neural mechanisms of visual perception and imagery. Trends Cogn. Sci. 2019, 23, 423–434. [Google Scholar] [CrossRef]
- Pearson, J. The human imagination: The cognitive neuroscience of visual mental imagery. Nat. Rev. Neurosci. 2019, 20, 624–634. [Google Scholar] [CrossRef] [PubMed]
- Spagna, A.; Hajhajate, D.; Liu, J.; Bartolomeo, P. Visual mental imagery engages the left fusiform gyrus, but not the early visual cortex: A meta-analysis of neuroimaging evidence. Neurosci. Biobehav. Rev. 2021, 122, 201–217. [Google Scholar] [CrossRef]
- Dijkstra, N. Uncovering the Role of the Early Visual Cortex in Visual Mental Imagery. Vision 2024, 8, 29. [Google Scholar] [CrossRef]
- Genç, E.; Bergmann, J.; Singer, W.; Kohler, A. Surface Area of Early Visual Cortex Predicts Individual Speed of Traveling Waves During Binocular Rivalry. Cereb. Cortex 2015, 25, 1499–1508. [Google Scholar] [CrossRef]
- Fulford, J.; Milton, F.; Salas, D.; Smith, A.; Simler, A.; Winlove, C.; Zeman, A. The neural correlates of visual imagery vividness–An fMRI study and literature review. Cortex 2018, 105, 26–40. [Google Scholar] [CrossRef]
- Duan, S.; Li, Q.; Yang, J.; Yang, Q.; Li, E.; Liu, Y.; Jiang, L.; Li, C.; Zhao, B. Precuneus activation correlates with the vividness of dynamic and static imagery: An fMRI study. Front. Hum. Neurosci. 2025, 19, 1516058. [Google Scholar] [CrossRef]
- Tullo, M.G.; Almgren, H.; Van de Steen, F.; Sulpizio, V.; Marinazzo, D.; Galati, G. Individual differences in mental imagery modulate effective connectivity of scene-selective regions during resting state. Brain Struct. Funct. 2022, 227, 1831–1842. [Google Scholar] [CrossRef]
- Kvamme, T.L.; Lumaca, M.; Zana, B.; Paunovic, D.; Silvanto, J.; Sandberg, K. Vividness of Visual Imagery Supported by Intrinsic Structural-Functional Brain Network Dynamics. bioRxiv 2024. [Google Scholar] [CrossRef]
- Blomkvist, A. Shaping the Space: A Role for the Hippocampus in Mental Imagery Formation. Vision 2025, 9, 2. [Google Scholar] [CrossRef]
- Ellis, H. Man and Woman: A Study of Secondary Sexual Characters; Walter Scott, Ltd.: London, UK, 1894. [Google Scholar]
- Horgan, T.G.; Mast, M.S.; Hall, J.A.; Carter, J.D. Gender Differences in Memory for the Appearance of Others. Personal. Soc. Psychol. Bull. 2004, 30, 185–196. [Google Scholar] [CrossRef]
- McBurney, D.H.; Gaulin, S.J.; Devineni, T.; Adams, C. Superior spatial memory of women: Stronger evidence for the gathering hypothesis. Evol. Hum. Behav. 1997, 18, 165–174. [Google Scholar] [CrossRef]
- Choi, J.; Silverman, I. Sexual dimorphism in spatial behaviors: Applications to route learning. Evol. Cogn. 1996, 2, 165–171. [Google Scholar]
- James, T.W.; Kimura, D. Sex differences in remembering the locations of objects in an array: Location-shifts versus location-exchanges. Evol. Hum. Behav. 1997, 18, 155–163. [Google Scholar] [CrossRef]
- McGivern, R.F.; Huston, J.P.; Byrd, D.; King, T.; Siegle, G.J.; Reilly, J. Sex differences in visual recognition memory: Support for a sex-related difference in attention in adults and children. Brain Cogn. 1997, 34, 323–336. [Google Scholar] [CrossRef]
- Levy, L.J.; Astur, R.S.; Frick, K.M. Men and women differ in object memory but not performance of a virtual radial maze. Behav. Neurosci. 2005, 119, 853. [Google Scholar] [CrossRef]
- Silverman, I.; Choi, J.; Peters, M. The hunter-gatherer theory of sex differences in spatial abilities: Data from 40 countries. Arch. Sex. Behav. 2007, 36, 261–268. [Google Scholar] [CrossRef]
- Russell, E.M.; Longstaff, M.G.; Winskel, H. Sex differences in eyewitness memory: A scoping review. Psychon. Bull. Rev. 2024, 31, 985–999. [Google Scholar] [CrossRef] [PubMed]
- Herlitz, A.; Rehnman, J. Sex differences in episodic memory. Curr. Dir. Psychol. Sci. 2008, 17, 52–56. [Google Scholar] [CrossRef]
- Asperholm, M.; Hogman, N.; Rafi, J.; Herlitz, A. What did you do yesterday? A metaanalysis of sex differences in episodic memory. Psychol. Bull. 2019, 145, 785–821. [Google Scholar] [CrossRef]
- Voyer, D.; Voyer, S.D.; Saint-Aubin, J. Sex differences in visual-spatial working memory: A meta-analysis. Psychon. Bull. Rev. 2017, 24, 307–334. [Google Scholar] [CrossRef]
- Filipek, P.A.; Richelme, C.; Kennedy, D.N.; Caviness, V.S., Jr. The young adult human brain: An MRI-based morphometric analysis. Cereb. Cortex 1994, 4, 344–360. [Google Scholar] [CrossRef]
- Filipek, P.A.; Semrud-Clikeman, M.; Steingard, R.J.; Renshaw, P.F.; Kennedy, D.N.; Biederman, J. Volumetric MRI analysis comparing subjects having attention-deficit hyperactivity disorder with normal controls. Neurology 1997, 48, 589–601. [Google Scholar] [CrossRef]
- Murphy, D.G.M.; DeCarli, C.; Mclntosh, A.R.; Daly, E.; Mentis, M.J.; Pietrini, P.; Szczepanik, J.; Schapiro, M.B.; Grady, C.L.; Horwitz, B.; et al. Sex differences in human brain morphometry and metabolism: An in vivo quantitative magnetic resonance imaging and positron emission tomography study on the effect of aging. Arch. Gen. Psychiatry 1996, 53, 585–594. [Google Scholar] [CrossRef]
- Paus, T.; Otaky, N.; Caramanos, Z.; Macdonald, D.; Zijdenbos, A.; D’Avirro, D.; Gutmans, D.; Holmes, C.; Tomaiuolo, F.; Evans, A.C. In vivo morphometry of the intrasulcal gray matter in the human cingulate, paracingulate, and superior-rostral sulci: Hemispheric asymmetries, gender differences and probability maps. J. Comp. Neurol. 1996, 376, 664–673. [Google Scholar] [CrossRef]
- Schlaepfer, T.E.; Harris, G.J.; Tien, A.Y.; Peng, L.; Lee, S.; Pearlson, G.D. Structural differences in the cerebral cortex of healthy female and male subjects: A magnetic resonance imaging study. Psychiatry Res. Neuroimaging 1995, 61, 129–135. [Google Scholar] [CrossRef]
- Guadalupe, T.; Zwiers, M.P.; Wittfeld, K.; Teumer, A.; Vasquez, A.A.; Hoogman, M.; Hagoort, P.; Fernandez, G.; Buitelaar, J.; van Bokhoven, H.; et al. Asymmetry within and around the human planum temporale is sexually dimorphic and influenced by genes involved in steroid hormone receptor activity. Cortex 2015, 62, 41–55. [Google Scholar] [CrossRef]
- Witelson, S.F.; Glezer, I.I.; Kigar, D.L. Women have greater density of neurons in posterior temporal cortex. J. Neurosci. 1995, 15, 3418–3428. [Google Scholar] [CrossRef] [PubMed]
- Giedd, J.N.; Snell, J.W.; Lange, N.; Rajapakse, J.C.; Casey, B.J.; Kozuch, P.L.; Vaituzis, A.C.; Vauss, Y.C.; Hamburger, S.D.; Kaysen, D.; et al. Quantitative magnetic resonance imaging of human brain development: Ages 4–18. Cereb. Cortex 1996, 6, 551–560. [Google Scholar] [CrossRef]
- Persson, J.; Spreng, R.N.; Turner, G.; Herlitz, A.; Morell, A.; Stening, E.; Wahlund, L.O.; Wikström, J.; Söderlund, H. Sex differences in volume and structural covariance of the anterior and posterior hippocampus. Neuroimage 2014, 99, 215–225. [Google Scholar] [CrossRef]
- Dalton, M.A.; Zeidman, P.; McCormick, C.; Maguire, E.A. Differentiable processing of objects, associations, and scenes within the hippocampus. J. Neurosci. 2018, 38, 8146–8159. [Google Scholar] [CrossRef]
- Fjell, A.M.; Sneve, M.H.; Amlien, I.K.; Grydeland, H.; Mowinckel, A.M.; Vidal-Piñeiro, D.; Sørensen, Ø.; Walhovd, K.B. Stable hippocampal correlates of high episodic memory function across adulthood. Sci. Rep. 2025, 15, 8816. [Google Scholar] [CrossRef]
- Harrison, T.M.; Weintraub, S.; Mesulam, M.M.; Rogalski, E. Superior memory and higher cortical volumes in unusually successful cognitive aging. J. Int. Neuropsychol. Soc. 2012, 18, 1081–1085. [Google Scholar] [CrossRef]
- Dawes, A.J.; Keogh, R.; Robuck, S.; Pearson, J. Memories with a blind mind: Remembering the past and imagining the future with aphantasia. Cognition 2022, 227, 105192. [Google Scholar] [CrossRef]
- Monzel, M.; Leelaarporn, P.; Lutz, T.; Schultz, J.; Brunheim, S.; Reuter, M.; McCormick, C. Hippocampal-occipital connectivity reflects autobiographical memory deficits in aphantasia. Elife 2024, 13, RP94916. [Google Scholar] [CrossRef]
- Blomkvist, A. Aphantasia: In search of a theory. Mind Lang. 2023, 38, 866–888. [Google Scholar] [CrossRef]
- Tabi, Y.A.; Maio, M.R.; Attaallah, B.; Dickson, S.; Drew, D.; Idris, M.I.; Kienast, A.; Klar, V.; Nobis, L.; Plant, O.; et al. Vividness of visual imagery questionnaire scores and their relationship to visual short-term memory performance. Cortex 2022, 146, 186–199. [Google Scholar] [CrossRef]
- Pertzov, Y.; Miller, T.D.; Gorgoraptis, N.; Caine, D.; Schott, J.M.; Butler, C.; Husain, M. Binding deficits in memory following medial temporal lobe damage in patients with voltage-gated potassium channel complex antibody-associated limbic encephalitis. Brain 2013, 136, 2474–2485. [Google Scholar] [CrossRef]
- Patenaude, B.; Smith, S.M.; Kennedy, D.N.; Jenkinson, M.A. Bayesian model of shape and appearance for subcortical brain segmentation. Neuroimage 2011, 56, 907–922. [Google Scholar] [CrossRef] [PubMed]
- Crawford, J.R.; Garthwaite, P.H. Comparison of a single case to a control or normative sample in neuropsychology: Development of a Bayesian approach. Cogn. Neuropsychol. 2007, 24, 343–372. [Google Scholar] [CrossRef] [PubMed]
- Perlaki, G.; Orsi, G.; Plozer, E.; Altbacker, A.; Darnai, G.; Nagy, S.A.; Horvath, R.; Toth, A.; Doczi, T.; Kovacs, N.; et al. Are there any gender differences in the hippocampus volume after head-size correction? A volumetric and voxel-based morphometric study. Neurosci. Lett. 2014, 570, 119–123. [Google Scholar] [CrossRef] [PubMed]
- Dahmani, L.; Courcot, B.; Near, J.; Patel, R.; Amaral, R.S.C.; Chakravarty, M.M.; Bohbot, V.D. Fimbria-Fornix Volume Is Associated with Spatial Memory and Olfactory Identification in Humans. Frontiers Systematic Neuroscience 2020, 13, 87. [Google Scholar] [CrossRef] [PubMed]
- Bainbridge, W.A.; Pounder, Z.; Eardley, A.F.; Baker, C.I. Quantifying aphantasia through drawing: Those without visual imagery show deficits in object but not spatial memory. Cortex 2021, 135, 159–172. [Google Scholar] [CrossRef]
- Thorudottir, S.; Sigurdardottir, H.M.; Rice, G.E.; Kerry, S.J.; Robotham, R.J.; Leff, A.P.; Starrfelt, R. The architect who lost the ability to imagine: The cerebral basis of visual imagery. Brain Sci. 2020, 10, 59. [Google Scholar] [CrossRef]
- Liu, J.; Spagna, A.; Bartolomeo, P. Hemispheric asymmetries in visual mental imagery. Brain Struct. Funct. 2022, 227, 697–708. [Google Scholar] [CrossRef]
- Dalton, M.A.; D’Souza, A.; Lv, J.; Calamante, F. New insights into anatomical connectivity along the anterior–posterior axis of the human hippocampus using in vivo quantitative fibre tracking. eLife 2022, 11, e76143. [Google Scholar] [CrossRef]

| Sample | N | Female: Male | Age Mean (SD) | VVIQ Mean (SD) |
|---|---|---|---|---|
| Whole sample | 53 | 29:24 | 68.00 (7.20) | 62.23 (12.53) |
| High VVIQ group | 10 | 6:4 | 67.40 (7.83) | 72.90 (9.46) |
| Low VVIQ group | 10 | 5:5 | 68.70 (6.77) | 44.50 (15.51) |
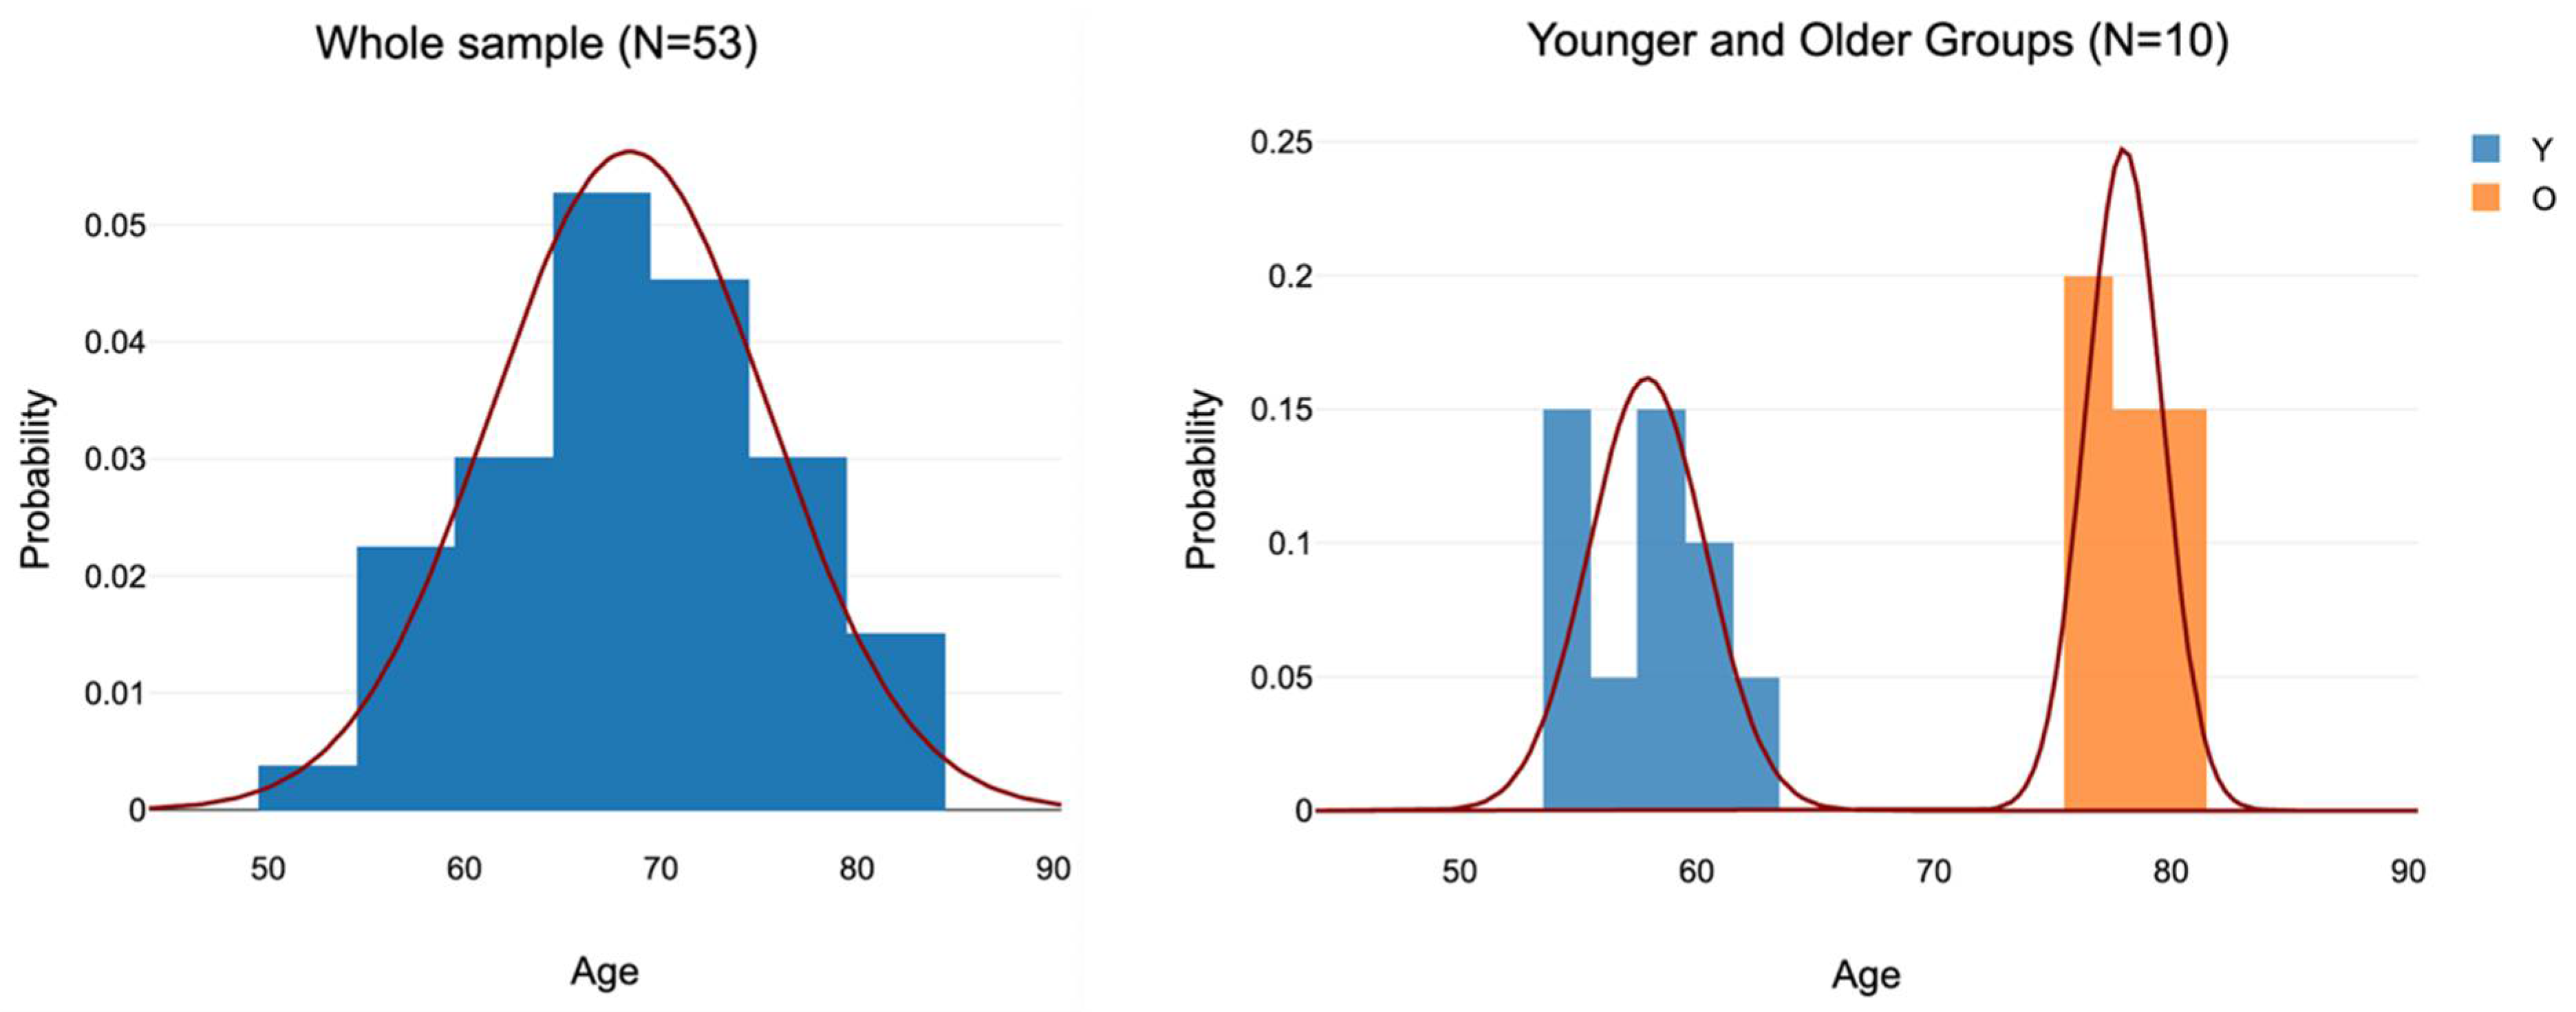
| Younger group (54–62 years) | 10 | 3:7 | 57.9 (2.60) | 58.80 (14.93) |
| Older group (76–80 years) | 11 | 4:7 | 78.0 (1.70) | 65.45 (10.55) |
| Set | Left | Right | Bilateral |
|---|---|---|---|
| A: 11 volumes | Hippocampus | Hippocampus | Hippocampus |
| Whole hippocampus | Whole hippocampus | - | |
| Area V1 | Area V1 | Area V1 | |
| Fusiform gyrus | Fusiform gyrus | Fusiform gyrus | |
| B: 36 volumes | Parasubiculum | Parasubiculum | Parasubiculum |
| Presubiculum | Presubiculum | Presubiculum | |
| Subiculum | Subiculum | Subiculum | |
| CA1 | CA1 | CA1 | |
| CA3 | CA3 | CA3 | |
| CA4 | CA4 | CA4 | |
| GC-ML-DG | GC-ML-DG | GC-ML-DG | |
| HATA | HATA | HATA | |
| Fimbria | Fimbria | Fimbria | |
| Molecular layer | Molecular layer | Molecular layer | |
| Hippocampal fissure | Hippocampal fissure | Hippocampal fissure | |
| Hippocampal tail | Hippocampal tail | Hippocampal tail | |
| C: 3 volumes | Amygdala | Amygdala | Amygdala |
| D: 7 volumes | BA4a | BA4a | - |
| BA4p | BA4p | - | |
| B4 | B4 | B4 |
| Sets A and B VMI Active | Sets C and D VMI Inactive | Totals | |
|---|---|---|---|
| Significant VVIQ Group difference | 24 | 0 | 24 |
| Non-significant VVIQ Group difference | 23 | 10 | 33 |
| Totals | 47 | 10 | 57 |
| Label | Hypothesis | Outcome |
|---|---|---|
| H1 | People with vivid visual imagery have greater visual short-term memory capacity than people with non-vivid visual imagery. | Strongly supported p < 0.001 |
| H2 | Females have greater visual short-term memory capacity than males. | Supported p = 0.025 |
| H3 | Younger people have greater visual short-term memory than older people. | Supported p = 0.01 |
| H4 | In VMIF brain regions, the High VVIQ group have larger volumes than the Low VVIQ group. | Strongly supported p = 0.012, p = 0.011, p = 0 (rank order correct for 46/47 areas in Sets A and B) |
| H5 | In VMI functioning (VMIF) brain regions, females have larger volumes than males. | Unsupported |
| H6 | In VMIF brain areas, younger people have larger volumes than older people. | Unsupported |
| H7 | In non-VMIF brain areas, High and Low VVIQ groups have no volume differences. | Supported |
| H8 | In non-VMIF brain areas, females and males have no volume differences. | Supported |
| H9 | In non-VMIF brain areas, younger and older people have no volume differences. | Supported |
| H10 | Aphant has weaker than average VSTM. | NS |
| H11 | Hphant has stronger than average VSTM. | NS |
| H12 | Hphant has stronger VSTM than aphant. | NS |
| H13 | Aphant has smaller than average VMIF volumes. | Supported in 10 regions |
| H14 | Hphant has larger than average VMIF volumes. | Supported in 2 regions |
| H15 | Hphant has larger VMIF volumes than aphant. | Supported p < 0.001 |
| H16 | Volume sizes will follow a predictable sequence: hphant, High VVIQ group, entire sample mean, Low VVIQ group, aphant. | Predicted order correct 30/57 times: p < 0.001 |
Disclaimer/Publisher’s Note: The statements, opinions and data contained in all publications are solely those of the individual author(s) and contributor(s) and not of MDPI and/or the editor(s). MDPI and/or the editor(s) disclaim responsibility for any injury to people or property resulting from any ideas, methods, instructions or products referred to in the content. |
© 2025 by the author. Licensee MDPI, Basel, Switzerland. This article is an open access article distributed under the terms and conditions of the Creative Commons Attribution (CC BY) license (https://creativecommons.org/licenses/by/4.0/).
Share and Cite
Marks, D.F. Stronger Short-Term Memory, Larger Hippocampi and Area V1 in People with High VVIQ Scores. Vision 2025, 9, 53. https://doi.org/10.3390/vision9030053
Marks DF. Stronger Short-Term Memory, Larger Hippocampi and Area V1 in People with High VVIQ Scores. Vision. 2025; 9(3):53. https://doi.org/10.3390/vision9030053
Chicago/Turabian StyleMarks, David F. 2025. "Stronger Short-Term Memory, Larger Hippocampi and Area V1 in People with High VVIQ Scores" Vision 9, no. 3: 53. https://doi.org/10.3390/vision9030053
APA StyleMarks, D. F. (2025). Stronger Short-Term Memory, Larger Hippocampi and Area V1 in People with High VVIQ Scores. Vision, 9(3), 53. https://doi.org/10.3390/vision9030053