Training Improves Avoidance of Natural Sick Faces: Changes in Visual Attention and Approach Decisions

 , ,
, ,
Abstract
1. Introduction
1.1. Sensitivity to Facial Cues of Sickness
1.2. Visual Attentional Biases to Sick Faces
1.3. Current Study
2. Materials and Methods
2.1. Participants
2.2. Materials
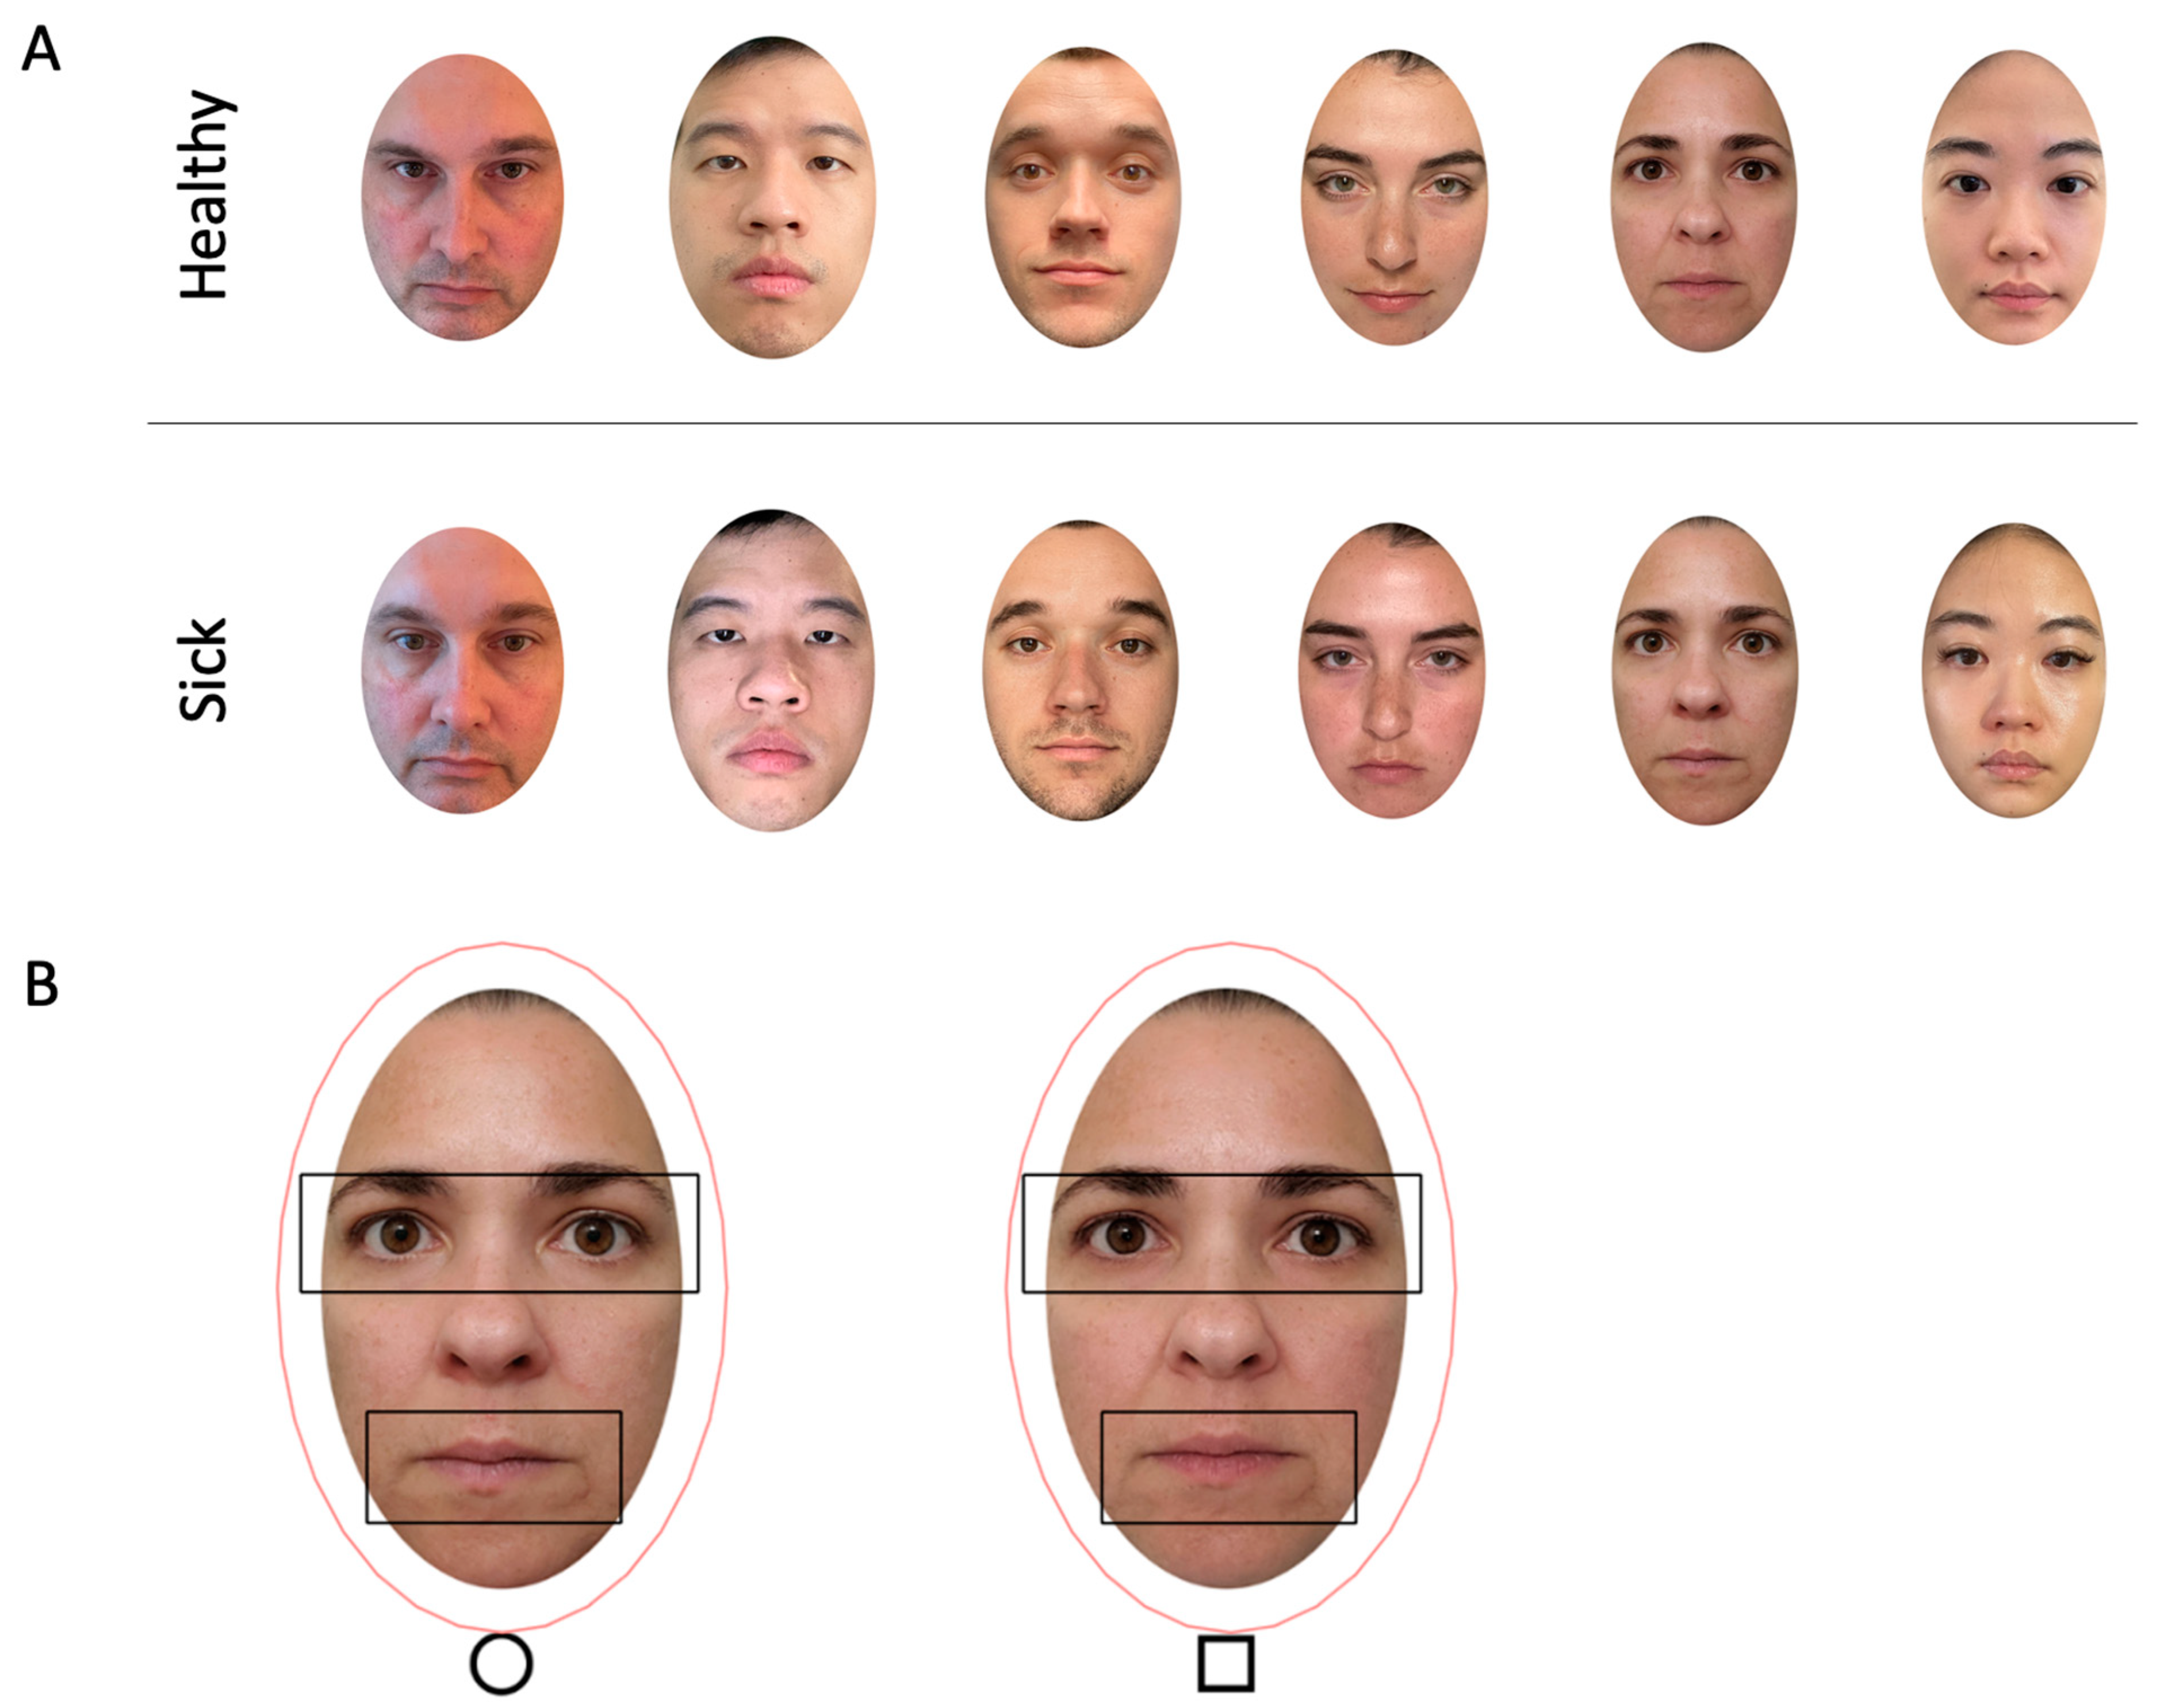
2.2.1. Face Stimuli
2.2.2. Avoidance Task Materials
2.2.3. Recognition Task Materials
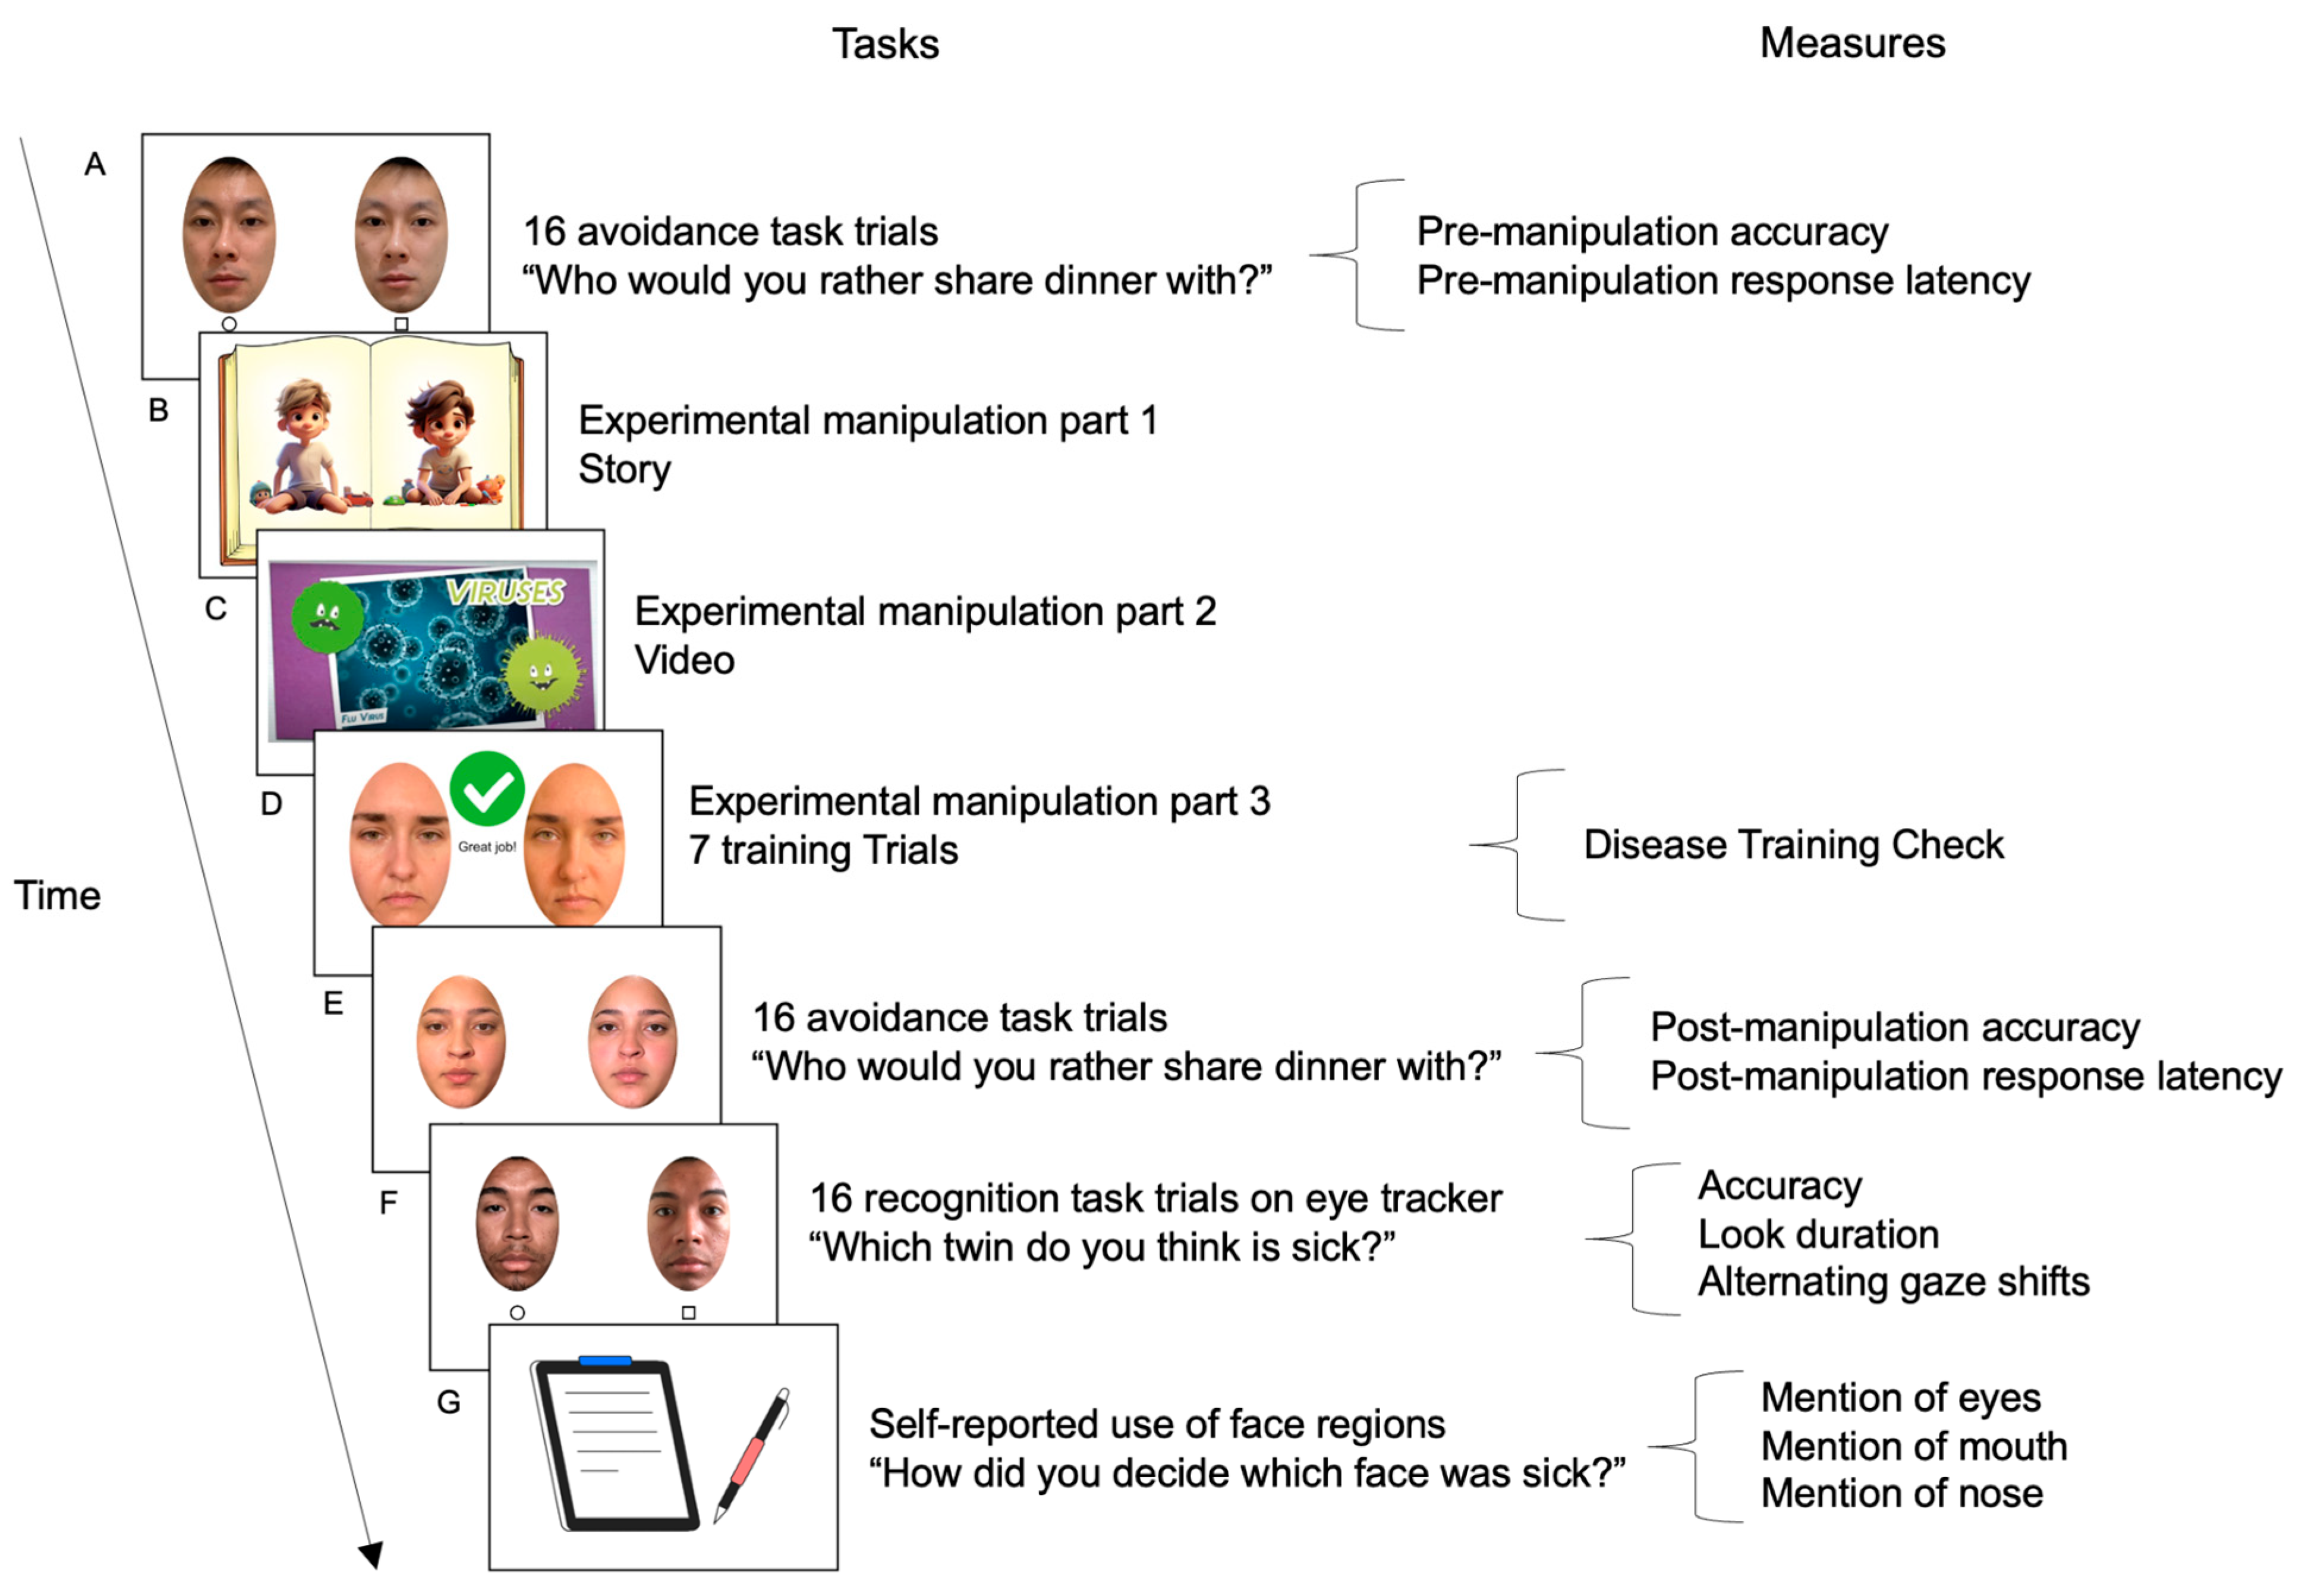
2.3. Procedure
2.3.1. Sick Face Avoidance Pre-Manipulation Baseline
2.3.2. Disease Training Experimental Manipulation
2.3.3. Sick Face Avoidance Post-Manipulation
2.3.4. Sick Face Recognition (Eye Tracking)
2.4. Measures
2.4.1. Sickness Avoidance and Recognition Accuracy Scores
2.4.2. Sickness Avoidance Speed—Manual Response Latency
2.4.3. Visual Attention Holding to Sickness—Look Duration Difference Scores
2.4.4. Visual Comparison of Sickness—Number of Alternating Gaze Shifts
2.4.5. Report of Facial Sickness Cues
2.5. Analytic Approach
2.5.1. Preliminary Analyses
2.5.2. Primary Analysis 1 (Prediction 1) Sickness Avoidance: Accuracy and Speed Before and After Disease Training
2.5.3. Primary Analysis 2 (Prediction 2): Sickness Recognition: Accuracy and Visual Attention
2.5.4. Primary Analysis 3 (Prediction 3): Facial Sickness Cues
3. Results
3.1. Preliminary Results
3.1.1. Data Inclusion
3.1.2. Baseline (Pre-Experimental Manipulation) Check
3.1.3. Experimental Manipulation Disease Training Check
3.1.4. Post-Experimental Manipulation Avoidance Replication Check
3.2. Sickness Avoidance: Accuracy and Speed Before and After Disease Training (Prediction 1)
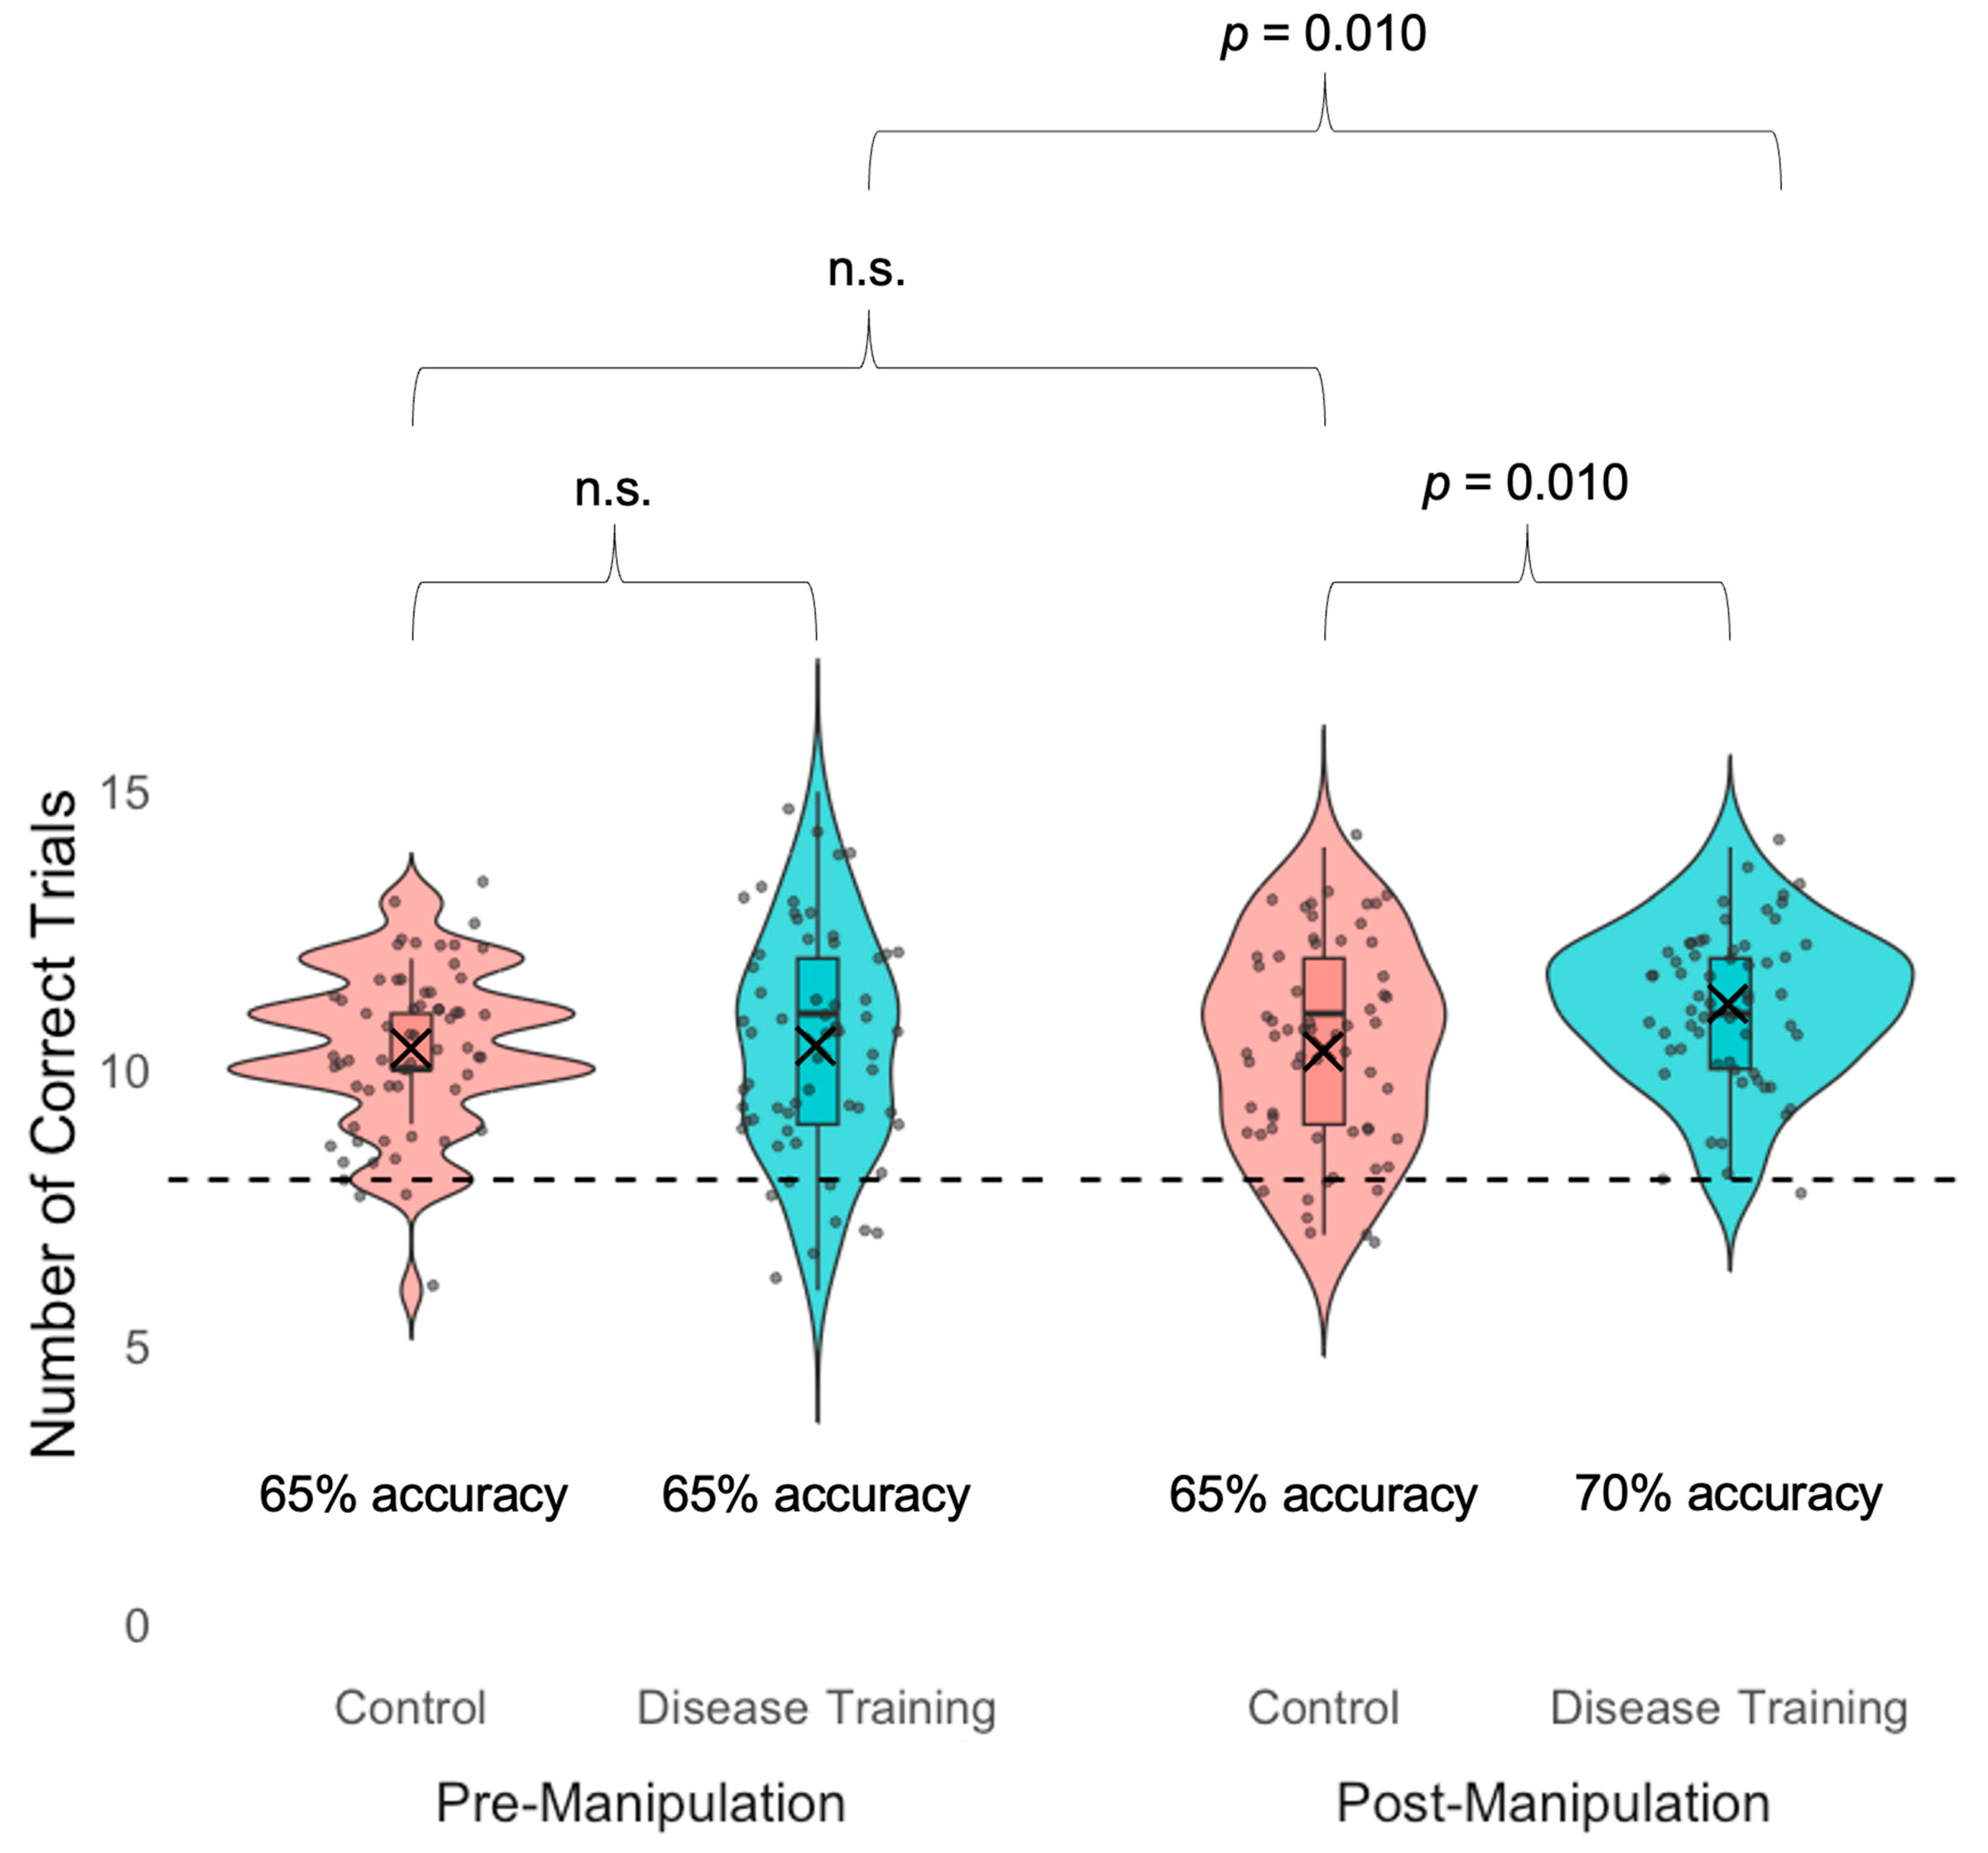
3.2.1. Sickness Avoidance Accuracy
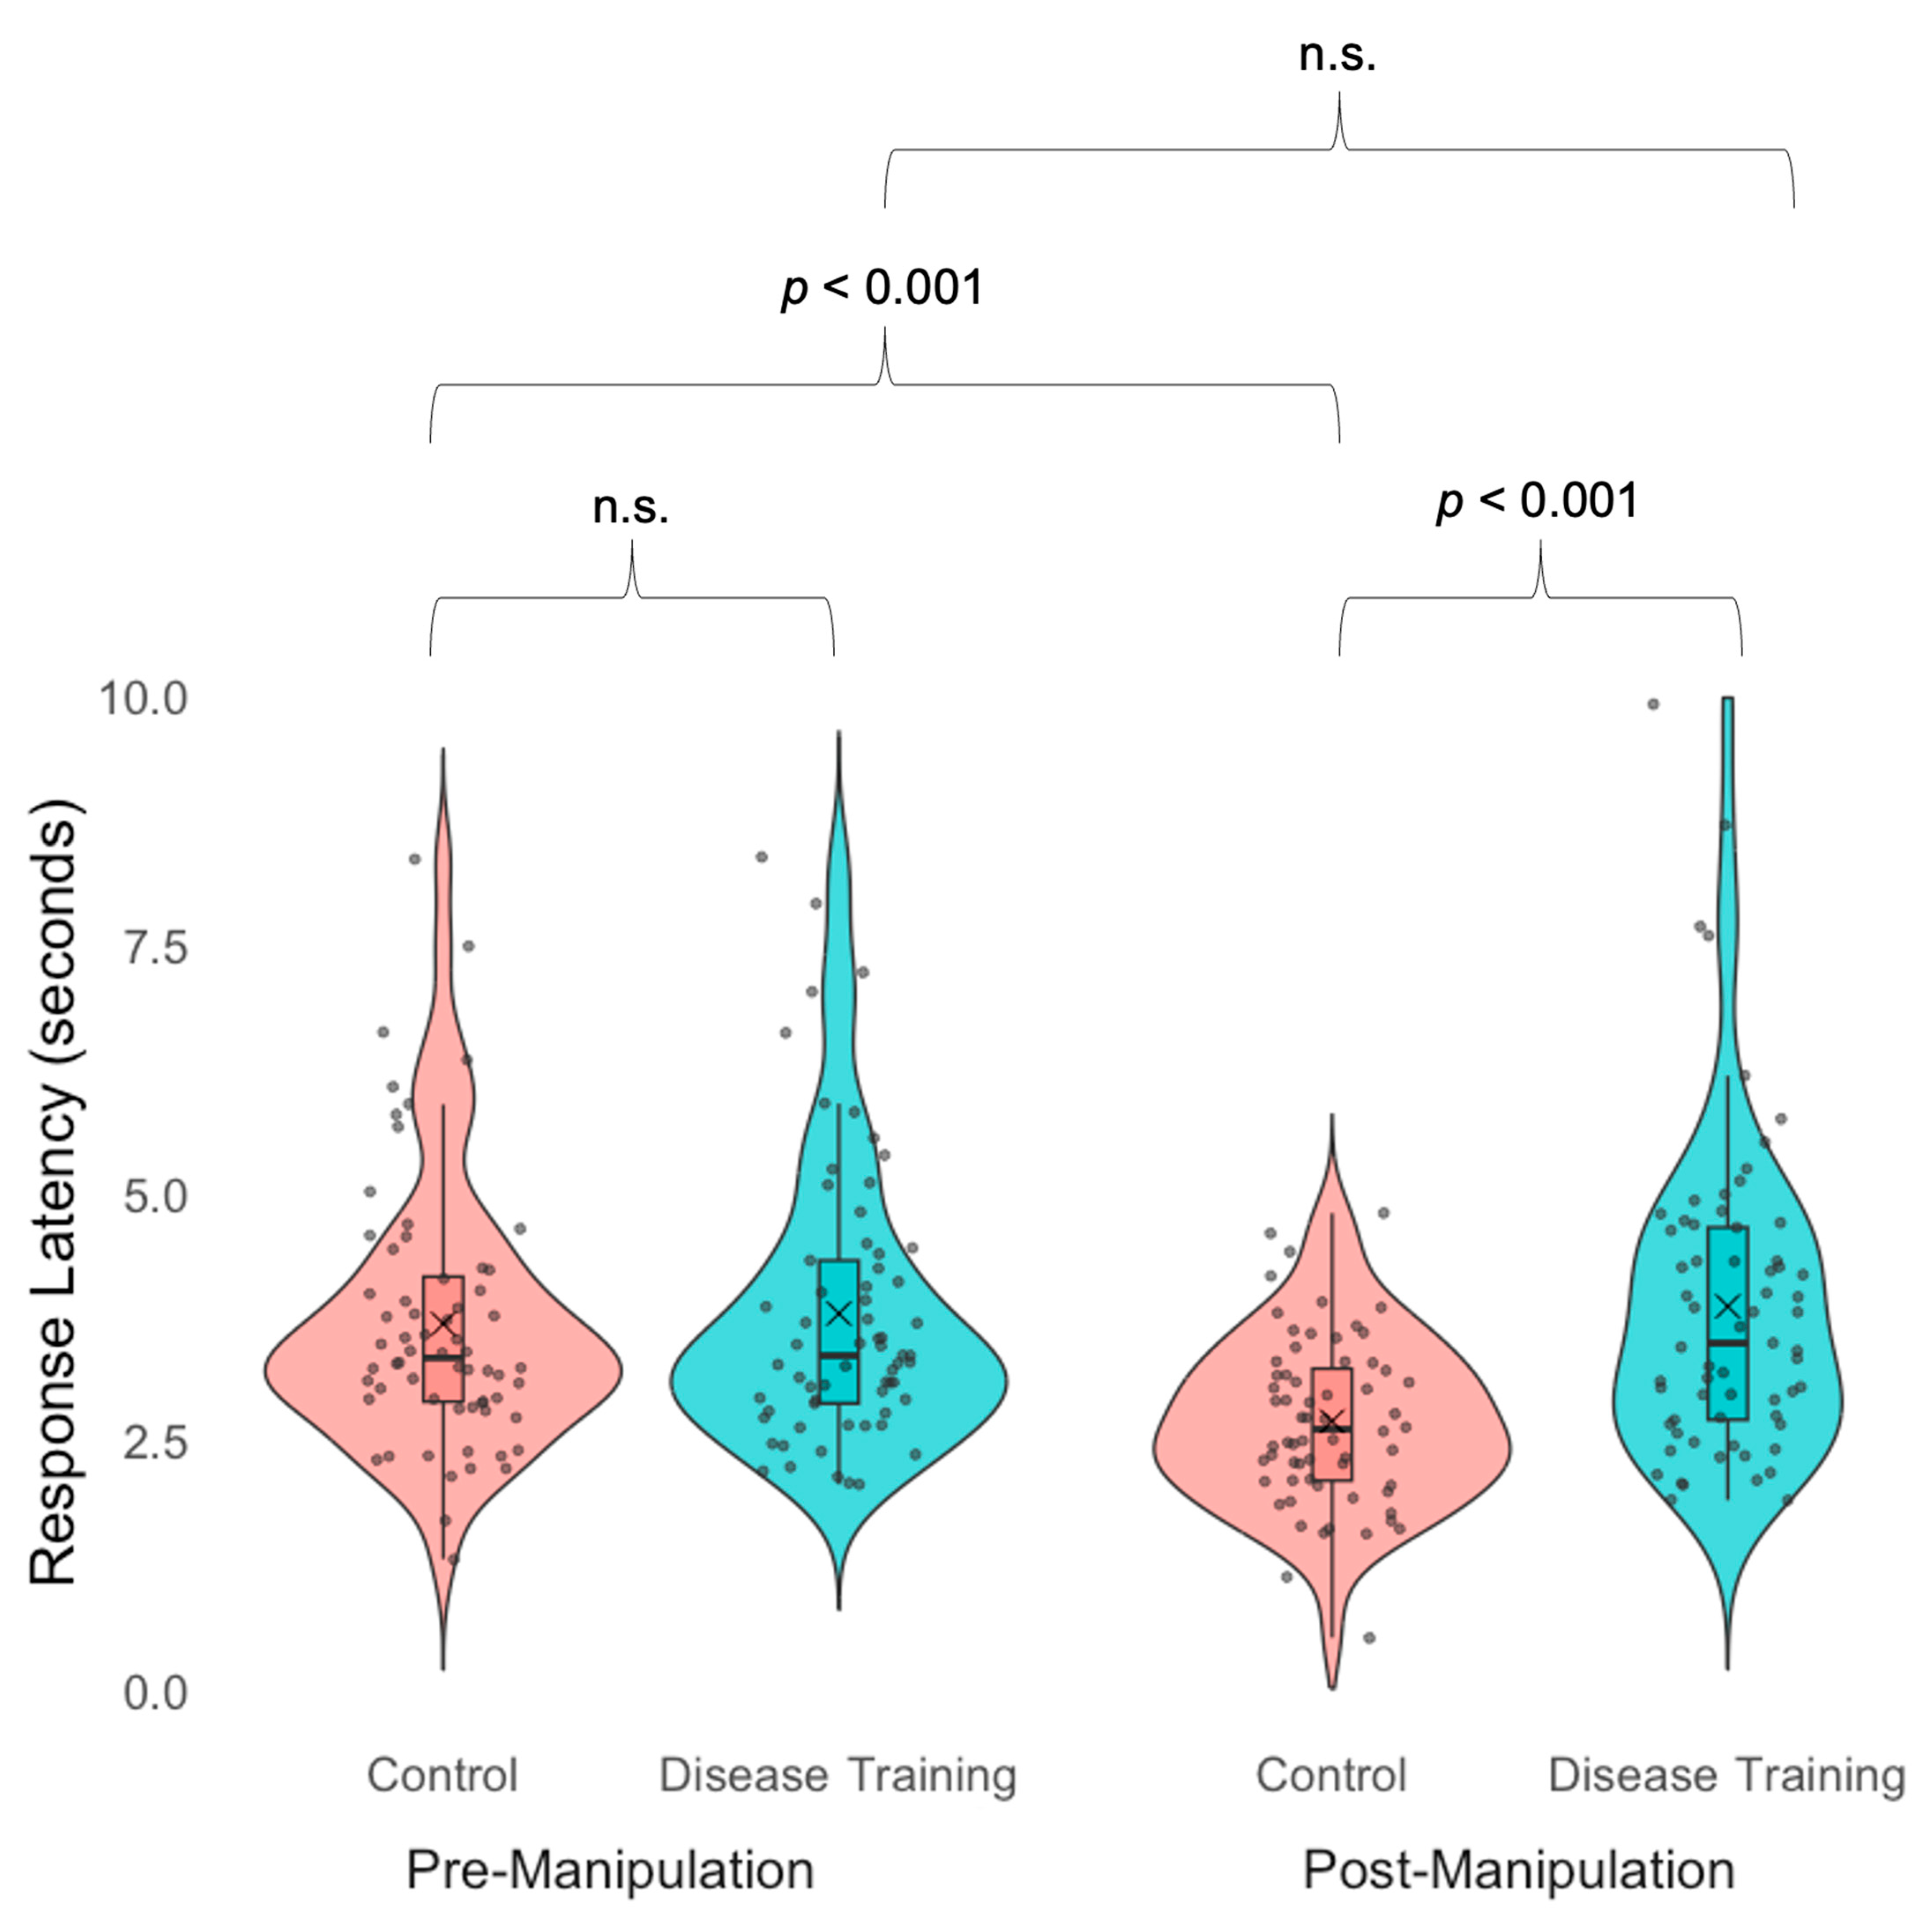
3.2.2. Sickness Avoidance Speed
3.3. Sickness Recognition: Accuracy, Visual Attention, and Report of Facial Sickness Cues (Prediction 2)
3.3.1. Sickness Recognition Accuracy
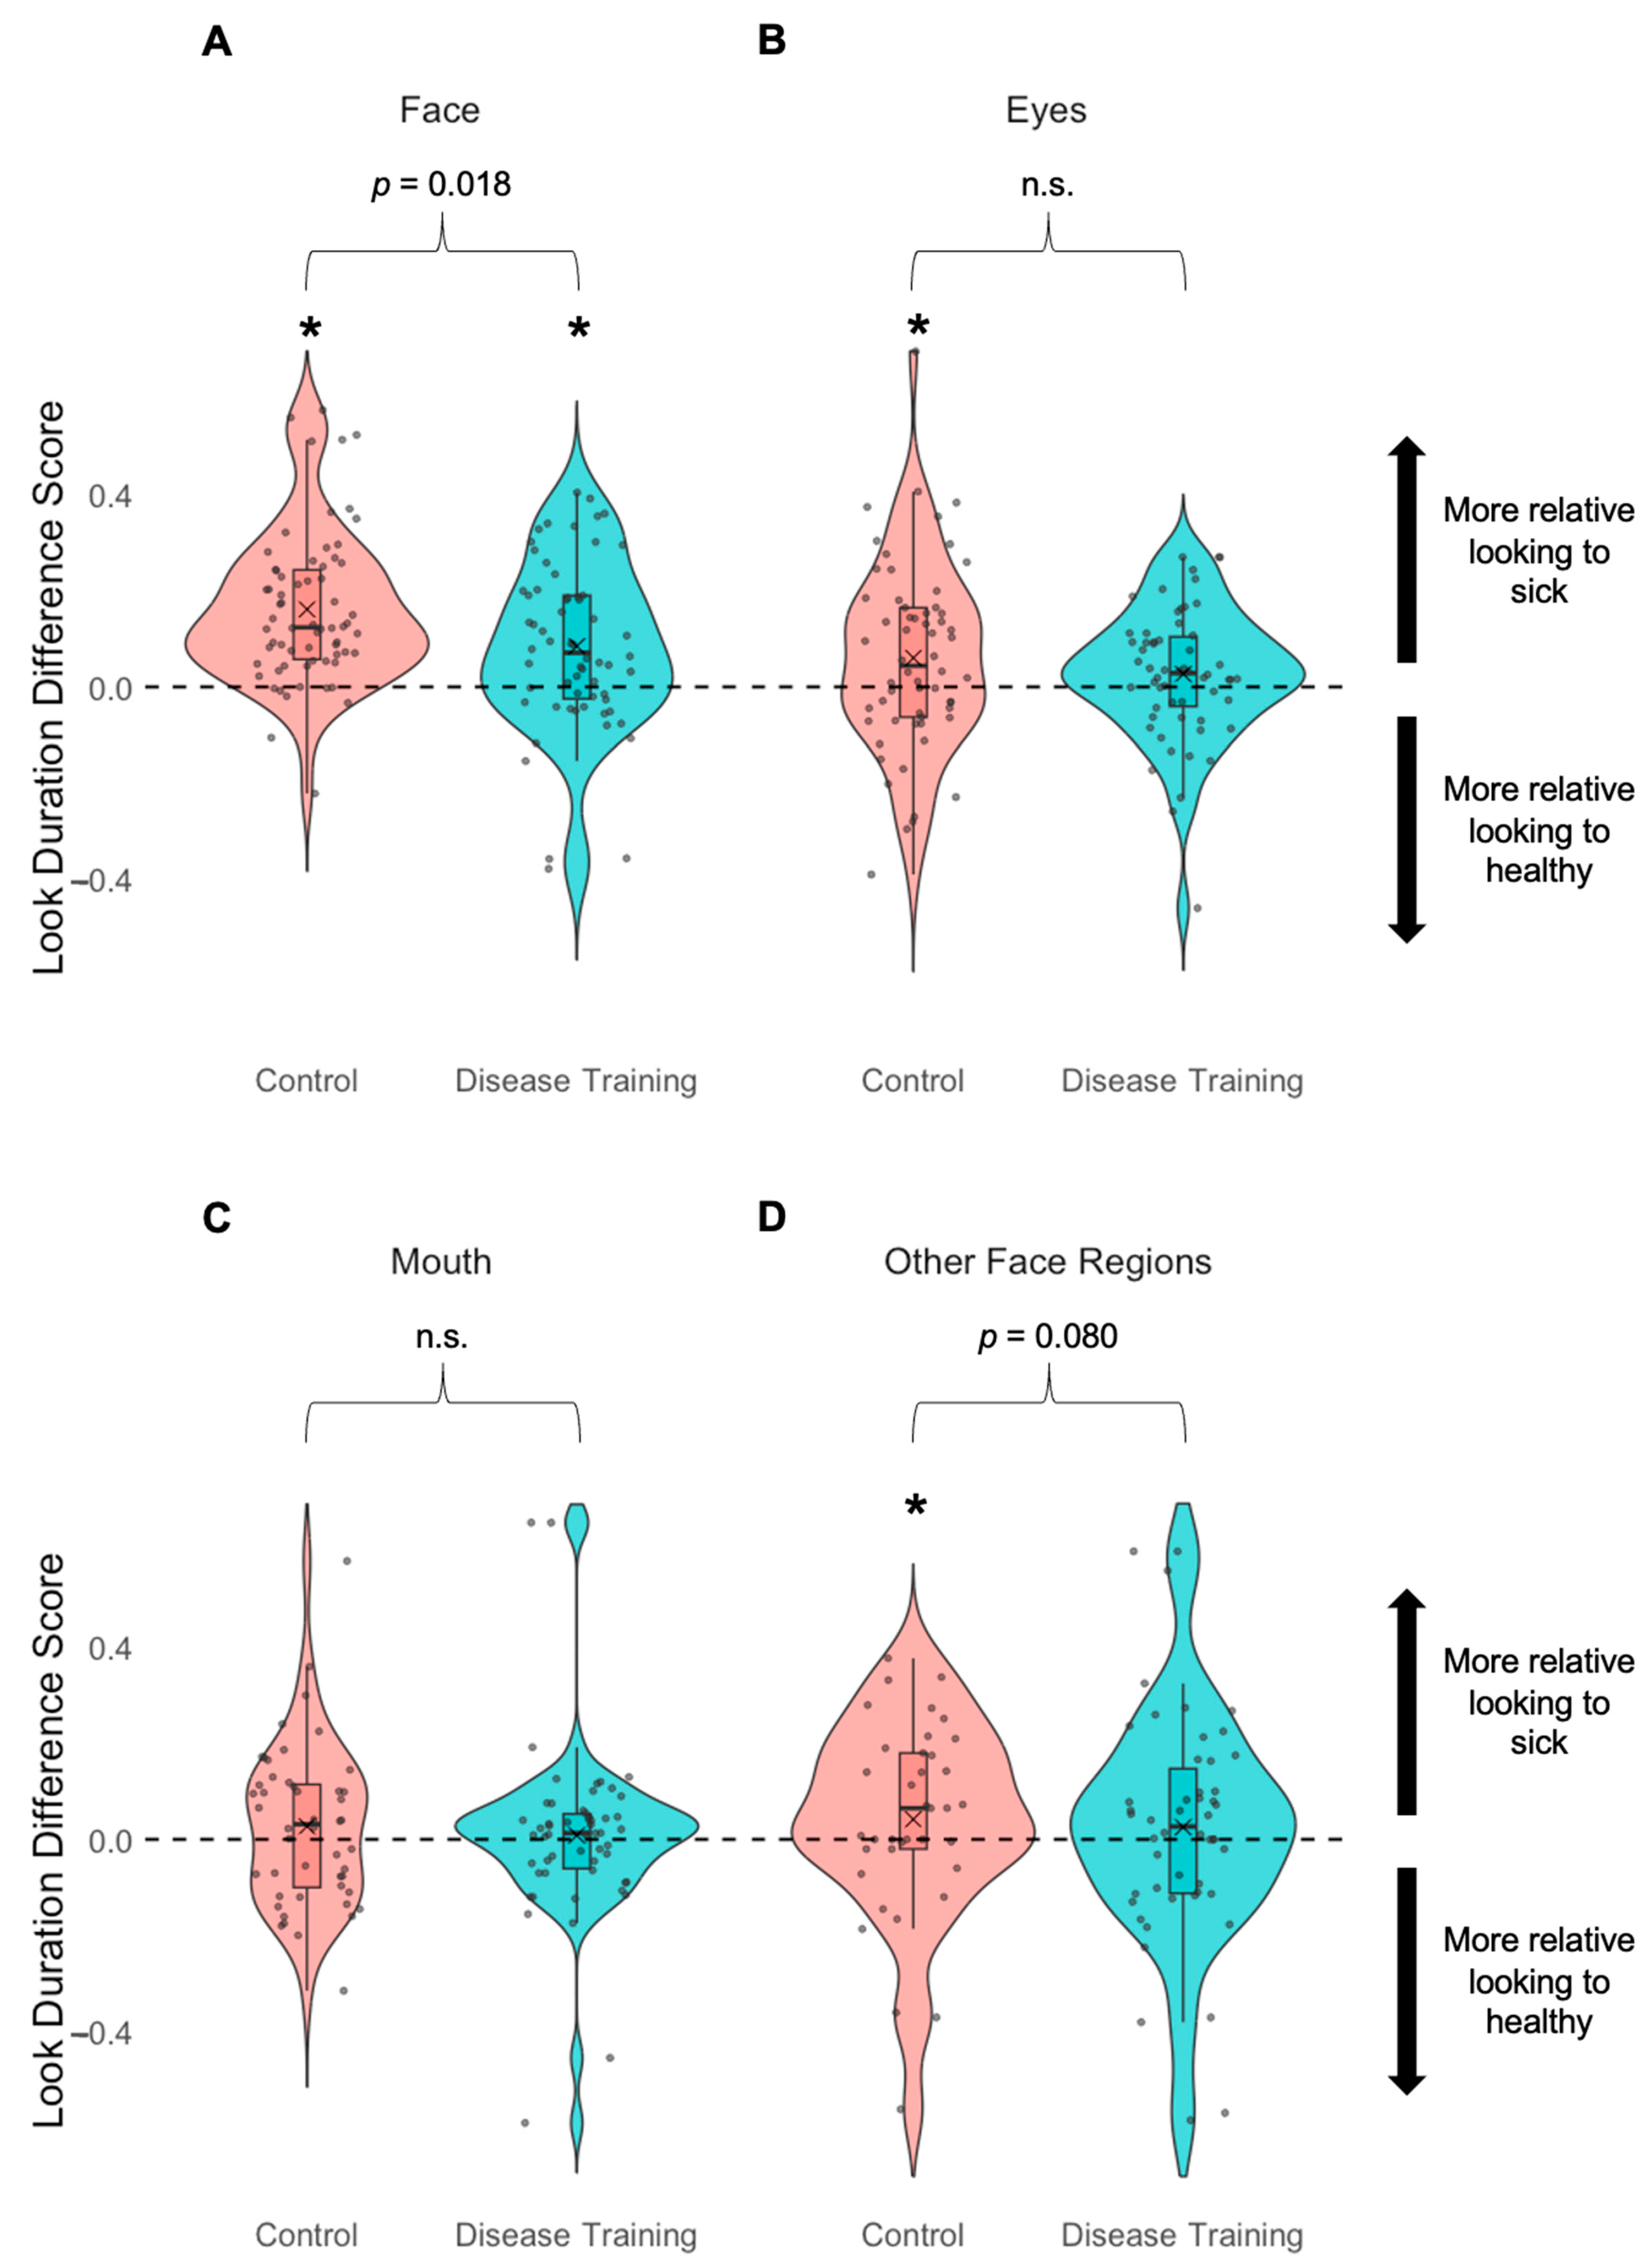
3.3.2. Look Duration to Faces and Face Regions
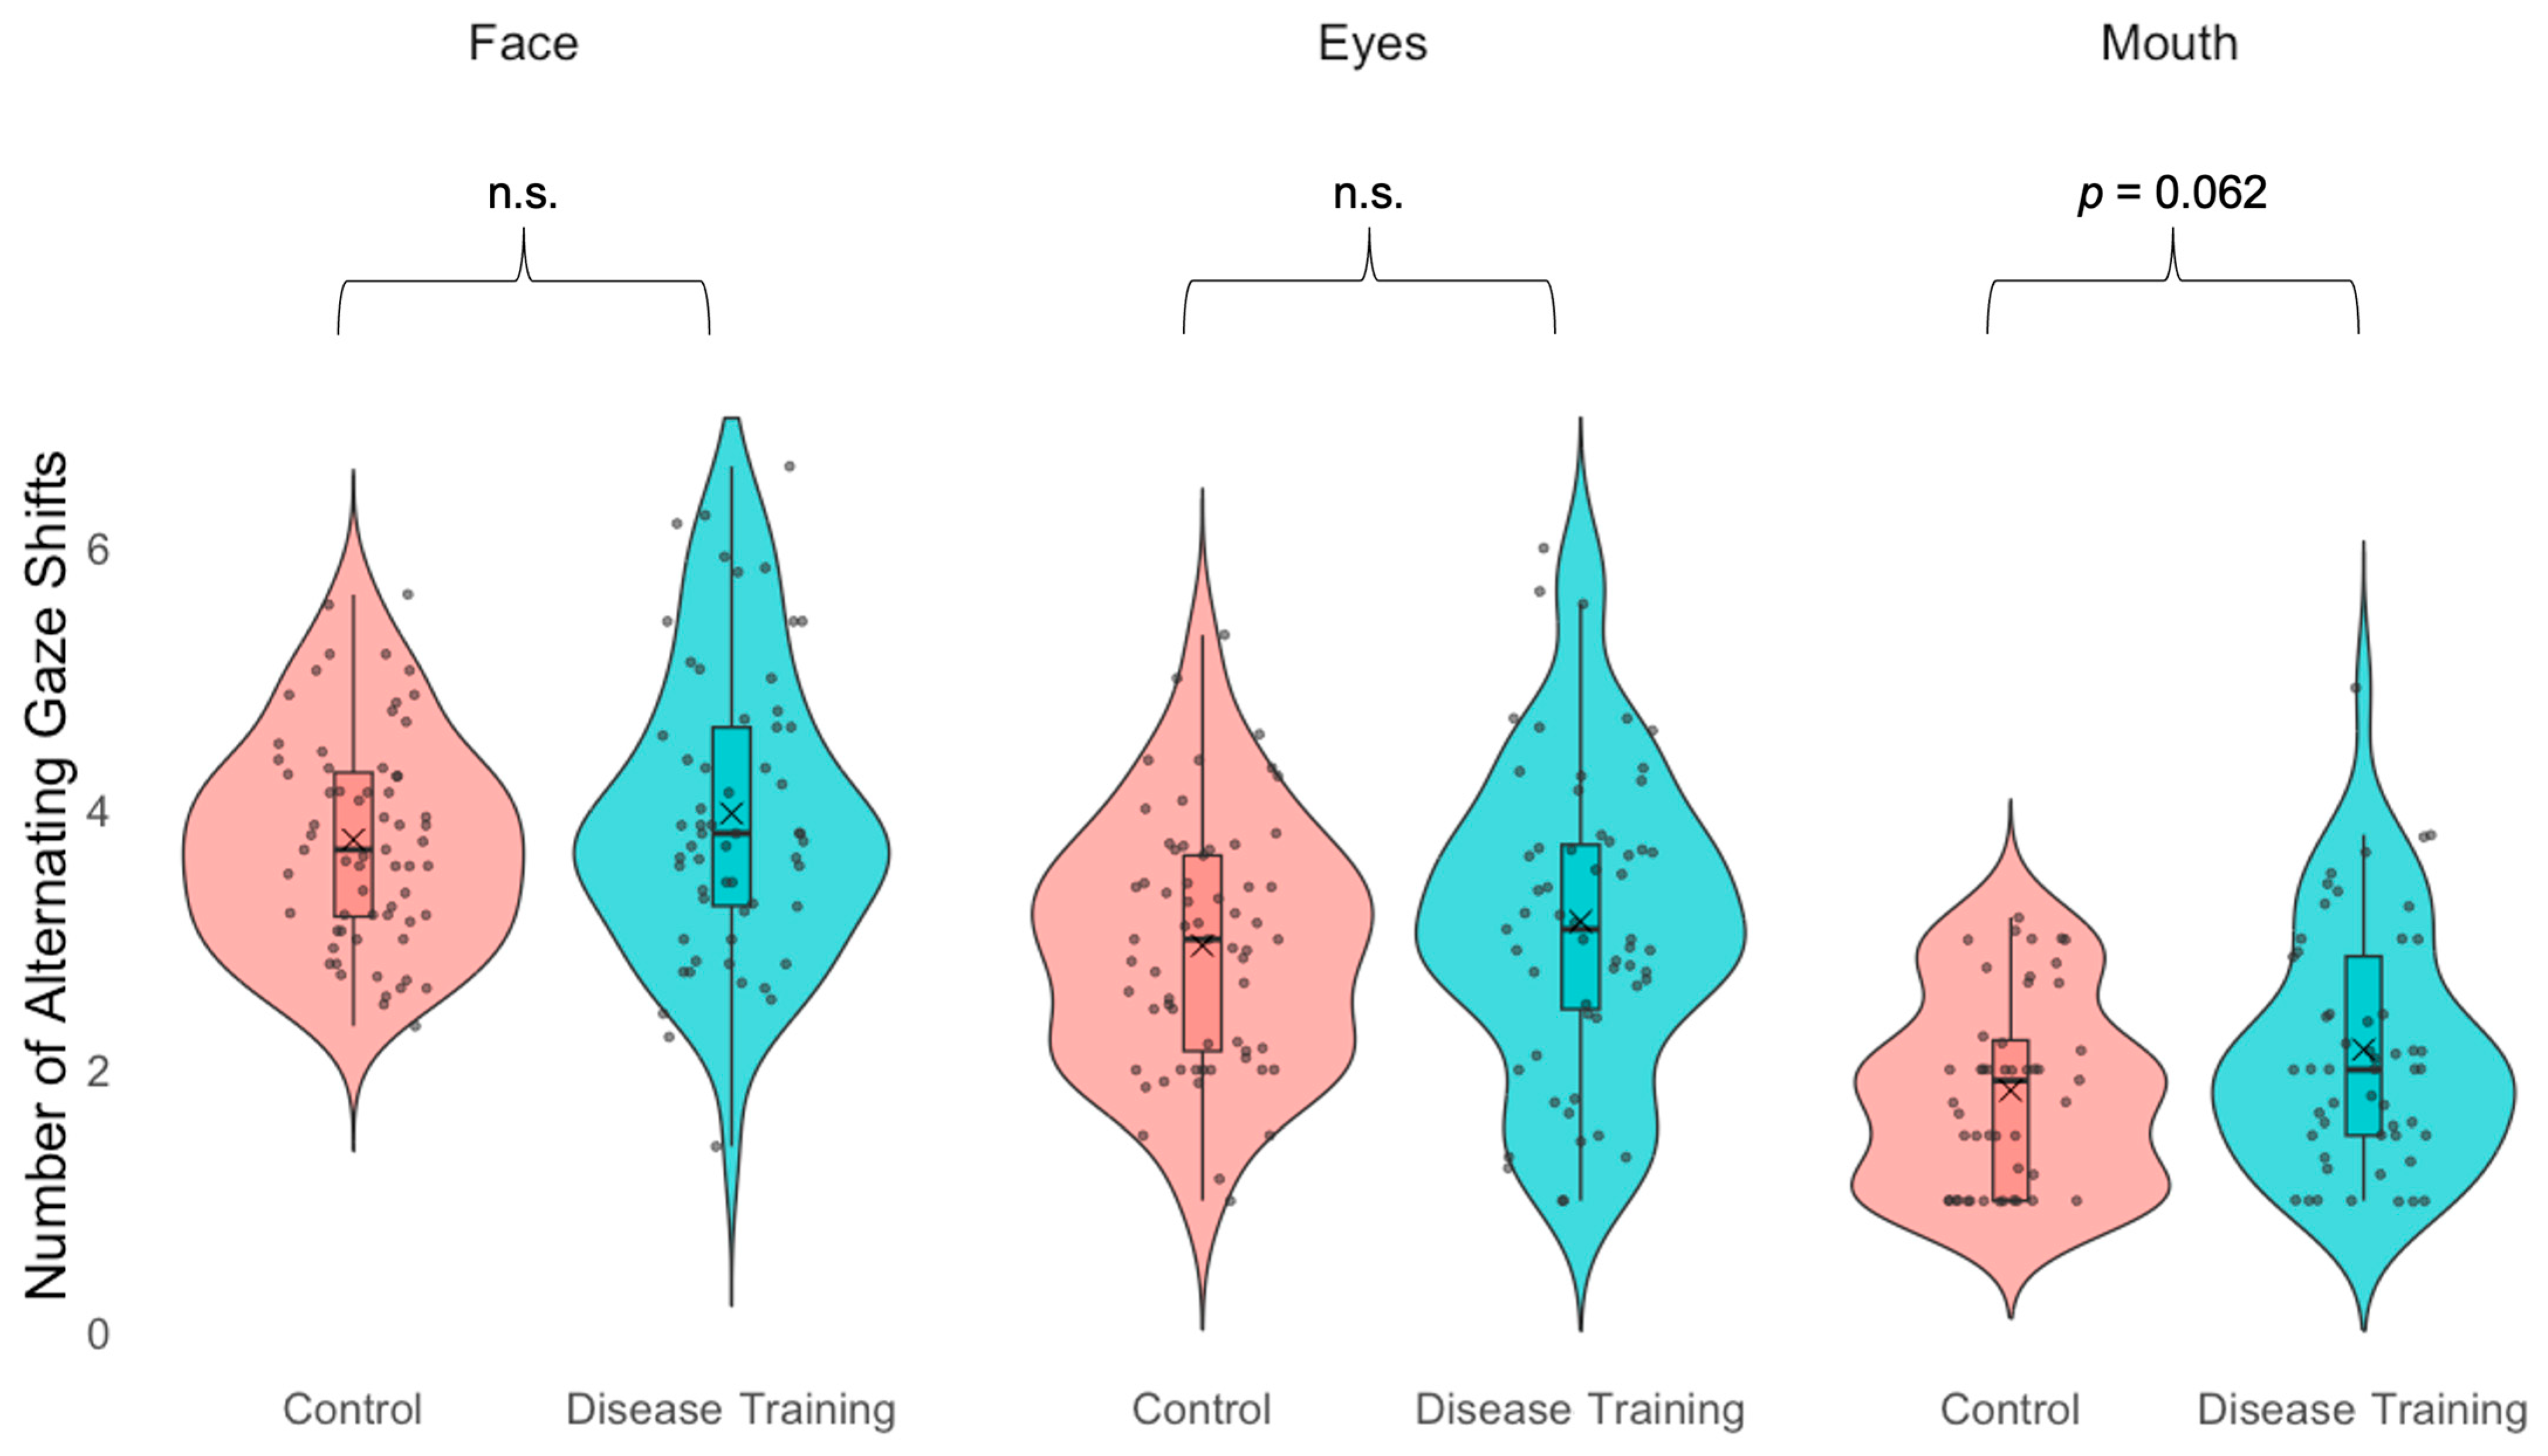
3.3.3. Gaze Alternations
3.3.4. Report of Facial Sickness Cues (Prediction 3)
4. Discussion
4.1. Disease Training Improves Sickness Avoidance (Prediction 1)
4.2. Disease Training Alters Visual Attention During Sickness Recognition (Predictions 2 and 3)
5. Conclusions
Supplementary Materials
Author Contributions
Funding
Institutional Review Board Statement
Informed Consent Statement
Data Availability Statement
Acknowledgments
Conflicts of Interest
References
- Schaller, M. The behavioural immune system and the psychology of human sociality. Philos. Trans. R. Soc. B Biol. Sci. 2011, 366, 3418–3426. [Google Scholar] [CrossRef]
- Murray, D.R.; Schaller, M. Chapter Two-The Behavioral Immune System: Implications for Social Cognition, Social Interaction and Social Influence. Adv. Exp. Soc. Psychol. 2016, 53, 75–129. [Google Scholar] [CrossRef]
- Schaller, M.; Park, J.H.; Kenrick, D. Human evolution and social cognition. In Oxford Handbook of Evolutionary Psychology; Oxford University Press: New York, NY, USA, 2012. [Google Scholar] [CrossRef]
- Ainsworth, S.E.; Maner, J.K. Pathogen avoidance mechanisms affect women’s preference for symmetrical male faces. Evol. Behav. Sci. 2019, 13, 265–271. [Google Scholar] [CrossRef]
- Brown, M.; Sacco, D.F. How and when crowd salience activates pathogen-avoidant motives. Evol. Behav. Sci. 2022, 16, 23–37. [Google Scholar] [CrossRef]
- Brown, M.; Tracy, R.E.; Young, S.G.; Sacco, D.F. Crowd salience heightens tolerance to healthy facial features. Adapt. Hum. Behav. Physiol. 2021, 7, 432–446. [Google Scholar] [CrossRef]
- Duncan, L.A.; Schaller, M. Prejudicial Attitudes Toward Older Adults May Be Exaggerated When People Feel Vulnerable to Infectious Disease: Evidence and Implications. Anal. Soc. Issues Public Policy 2009, 9, 97–115. [Google Scholar] [CrossRef]
- Millar, M.; Fink-Armold, A.; Lovitt, A. Disease salience effects on desire for affiliation with in-group and out-group members: Cognitive and affective mediators. Evol. Psychol. 2020, 18, 1474704920930700. [Google Scholar] [CrossRef]
- Rengiiyiler, S.; Teközel, M. Visual attention is not attuned to non-human animal targets’ pathogenicity: An evolutionary mismatch perspective. J. Gen. Psychol. 2025, 152, 36–57. [Google Scholar] [CrossRef]
- Tybur, J.M.; Bryan, A.D.; Magnan, R.E.; Hooper, A.E.C. Smells like safe sex: Olfactory pathogen primes increase intentions to use condoms. Psychol. Sci. 2011, 22, 478–480. [Google Scholar] [CrossRef]
- White, A.E.; Kenrick, D.T.; Neuberg, S.L. Beauty at the ballot box: Disease threats predict preferences for physically attractive leaders. Psychol. Sci. 2013, 24, 2429–2436. [Google Scholar] [CrossRef]
- Bouayed, J. Sorry, I am sneezing and coughing but I do not have COVID-19. Brain Behav. Immun. 2022, 101, 57–58. [Google Scholar] [CrossRef] [PubMed]
- Lee, S.W.; Schwarz, N.; Taubman, D.; Hou, M. Sneezing in times of a flu pandemic: Public sneezing increases perception of unrelated risks and shifts preferences for federal spending. Psychol. Sci. 2010, 21, 375–377. [Google Scholar] [CrossRef] [PubMed]
- Tskhay, K.O.; Wilson, J.P.; Rule, N.O. People use psychological cues to detect physical disease from faces. Personal. Soc. Psychol. Bull. 2016, 42, 1309–1320. [Google Scholar] [CrossRef]
- Young, S.G.; Sacco, D.F.; Hugenberg, K. Vulnerability to disease is associated with a domain-specific preference for symmetrical faces relative to symmetrical non-face stimuli. Eur. J. Soc. Psychol. 2011, 41, 558–563. [Google Scholar] [CrossRef]
- Schmid, C.; Büchel, C.; Rose, M. The neural basis of visual dominance in the context of audio-visual object processing. NeuroImage 2011, 55, 304–311. [Google Scholar] [CrossRef]
- Schrock, J.M.; Snodgrass, J.J.; Sugiyama, L.S. Lassitude: The emotion of being sick. Evol. Hum. Behav. 2020, 41, 44–57. [Google Scholar] [CrossRef]
- Axelsson, J.; Sundelin, T.; Olsson, M.J.; Sorjonen, K.; Axelsson, C.; Lasselin, J.; Lekander, M. Identification of acutely sick people and facial cues of sickness. Proc. R. Soc. B Biol. Sci. 2018, 285, 20172430. [Google Scholar] [CrossRef]
- Leung, T.S.; Maylott, S.E.; Zeng, G.; Nascimben, D.N.; Jakobsen, K.V.; Simpson, E.A. Behavioral and physiological sensitivity to natural sick faces. Brain Behav. Immun. 2023, 110, 195–211. [Google Scholar] [CrossRef] [PubMed]
- Leung, T.S.; Zeng, G.; Maylott, S.E.; Martinez, S.N.; Jakobsen, K.V.; Simpson, E.A. Infection detection in faces: Children’s development of pathogen avoidance. Child Dev. 2024, 95, e35–e46. [Google Scholar] [CrossRef]
- Berdica, E.; Gerdes, A.B.; Bublatzky, F.; White, A.J.; Alpers, G.W. Threat vs. threat: Attention to fear-related animals and threatening faces. Front. Psychol. 2018, 9, 1154. [Google Scholar] [CrossRef]
- Feldmann-Wüstefeld, T.; Schmidt-Daffy, M.; Schubö, A. Neural evidence for the threat detection advantage: Differential attention allocation to angry and happy faces. Psychophysiology 2011, 48, 697–707. [Google Scholar] [CrossRef] [PubMed]
- Zhang, R.; Zhang, M.; Sima, J.; Liu, F.; Zou, F.; Luo, Y. Self-reference processing of fat-face and sick-face in individuals with different disgust sensitivity: Evidence from behavioral and neuroelectrophysiology. Neuropsychologia 2022, 175, 108368. [Google Scholar] [CrossRef]
- Miller, S.L.; Maner, J.K. Sick body, vigilant mind: The biological immune system activates the behavioral immune system. Psychol. Sci. 2011, 22, 1467–1471. [Google Scholar] [CrossRef]
- Tybur, J.M.; Jones, B.C.; DeBruine, L.M.; Ackerman, J.M.; Fasolt, V. Preregistered direct replication of “Sick body, vigilant mind: The biological immune system activates the behavioral immune system”. Psychol. Sci. 2020, 31, 1461–1469. [Google Scholar] [CrossRef] [PubMed]
- Bressan, P. First impressions of a new face are shaped by infection concerns. Evol. Med. Public Health 2023, 11, 309–315. [Google Scholar] [CrossRef]
- Erdfelder, E.; Faul, F.; Buchner, A. GPOWER: A general power analysis program. Behav. Res. Methods Instrum. Comput. 1996, 28, 1–11. [Google Scholar] [CrossRef]
- SciShow Kids (Director). Colds, the Flu, and You. [Video Recording]. 29 December 2016. Available online: https://www.youtube.com/watch?v=4uzNnKm41W8 (accessed on 25 April 2025).
- SciShow Kids (Director). Birds That Talk! [Video Recording]. 3 July 2018. Available online: https://www.youtube.com/watch?v=g9Gj8JE72O4 (accessed on 25 April 2025).
- Brown, W. The study of the face and of the facial expression of the sick child. Edinb. Med. J. 1937, 44, T141–T172. [Google Scholar]
- Armann, R.; Bülthoff, I. Gaze behavior in face comparison: The roles of sex, task, and symmetry. Atten. Percept. Psychophys. 2009, 71, 1107–1126. [Google Scholar] [CrossRef]
- Faulkner, J.; Schaller, M.; Park, J.H.; Duncan, L.A. Evolved disease-avoidance mechanisms and contemporary xenophobic attitudes. Group Process. Intergroup Relat. 2004, 7, 333–353. [Google Scholar] [CrossRef]
- Park, J.H.; Schaller, M.; Crandall, C.S. Pathogen-avoidance mechanisms and the stigmatization of obese people. Evol. Hum. Behav. 2007, 28, 410–414. [Google Scholar] [CrossRef]
- Crouzet, S.M.; Kirchner, H.; Thorpe, S.J. Fast saccades toward faces: Face detection in just 100 ms. J. Vis. 2010, 10, 16. [Google Scholar] [CrossRef] [PubMed]
- Jack, R.E.; Schyns, P.G. The human face as a dynamic tool for social communication. Curr. Biol. 2015, 25, R621–R634. [Google Scholar] [CrossRef] [PubMed]
- Wardle, S.G.; Taubert, J.; Teichmann, L.; Baker, C.I. Rapid and dynamic processing of face pareidolia in the human brain. Nat. Commun. 2020, 11, 4518. [Google Scholar] [CrossRef]
- Heitz, R.P. The speed-accuracy tradeoff: History, physiology, methodology, and behavior. Front. Neurosci. 2014, 8, 150. [Google Scholar] [CrossRef] [PubMed]

| Control Group | Disease Training Group | |
|---|---|---|
| Age in Years | ||
| Mean (SD) | 19 (1) | 19 (3) |
| Range | 18–23 | 18–44 |
| Gender | ||
| Man | 23 | 23 |
| Nonbinary | 1 | 1 |
| Woman | 42 | 43 |
| Ethnicity | ||
| Hispanic or Latino | 18 | 12 |
| Not Hispanic or Latino | 46 | 54 |
| Unknown or Other | 5 | 2 |
| Race | ||
| American Indian or Alaska Native and White | 0 | 1 |
| Arab, Middle Eastern, or North African | 1 | 1 |
| Arab, Middle Eastern, or North African and Jewish | 0 | 1 |
| Arab, Middle Eastern, or North African and White | 1 | 1 |
| Asian | 5 | 2 |
| Asian and Native Hawaiian or Other Pacific Islander | 1 | 0 |
| Asian and Native Hawaiian or Other Pacific Islander and White | 0 | 2 |
| Asian and White | 3 | 2 |
| Black or African American | 5 | 7 |
| Black or African American and Native Hawaiian or Other Pacific Islander | 1 | 0 |
| Black or African American and White | 2 | 1 |
| Mixed (wrote-in) | 0 | 1 |
| Native Hawaiian or Other Pacific Islander | 0 | 1 |
| Unknown or prefer not to say | 4 | 2 |
| White | 46 | 44 |
| White and Unknown or prefer not to say | 0 | 1 |
| Measure | Result |
|---|---|
| Avoidance Task (Primary Analysis 1) | |
| Accuracy | The disease training group was more accurate than the control group in the post-manipulation avoidance task; the disease training group was more accurate in the post-manipulation avoidance task than the pre-manipulation avoidance task. |
| Response latency | The disease training group was slower than the control group in the post-manipulation avoidance task; the control group was faster in the post-manipulation avoidance task than in the pre-manipulation avoidance task. |
| Recognition Task (Primary Analysis 2) | |
| Accuracy | n.s. |
| Look duration—Face | The disease training group showed more even looking at sick and healthy faces than the control group who looked more at the sick faces than the healthy faces. |
| Look duration—Eyes | n.s. |
| Look duration—Mouth | n.s. |
| Alternating gazes—Face | n.s. |
| Alternating gazes—Eyes | n.s. |
| Alternating gazes—Mouth | The disease training group showed marginally # more alternating gaze shifts than the control group. |
| Self-Report (Primary Analysis 3) | |
| Use of eyes | The disease training group was more likely to report using the eyes. |
| Use of mouth | The disease training group was more likely to report using the mouth. |
Disclaimer/Publisher’s Note: The statements, opinions and data contained in all publications are solely those of the individual author(s) and contributor(s) and not of MDPI and/or the editor(s). MDPI and/or the editor(s) disclaim responsibility for any injury to people or property resulting from any ideas, methods, instructions or products referred to in the content. |
© 2025 by the authors. Licensee MDPI, Basel, Switzerland. This article is an open access article distributed under the terms and conditions of the Creative Commons Attribution (CC BY) license (https://creativecommons.org/licenses/by/4.0/).
Share and Cite
Leung, T.S.; Jakobsen, K.V.; Maylott, S.E.; Malik, A.; Zhang, S.; Simpson, E.A. Training Improves Avoidance of Natural Sick Faces: Changes in Visual Attention and Approach Decisions. Vision 2025, 9, 39. https://doi.org/10.3390/vision9020039
Leung TS, Jakobsen KV, Maylott SE, Malik A, Zhang S, Simpson EA. Training Improves Avoidance of Natural Sick Faces: Changes in Visual Attention and Approach Decisions. Vision. 2025; 9(2):39. https://doi.org/10.3390/vision9020039
Chicago/Turabian StyleLeung, Tiffany S., Krisztina V. Jakobsen, Sarah E. Maylott, Arushi Malik, Shuo Zhang, and Elizabeth A. Simpson. 2025. "Training Improves Avoidance of Natural Sick Faces: Changes in Visual Attention and Approach Decisions" Vision 9, no. 2: 39. https://doi.org/10.3390/vision9020039
APA StyleLeung, T. S., Jakobsen, K. V., Maylott, S. E., Malik, A., Zhang, S., & Simpson, E. A. (2025). Training Improves Avoidance of Natural Sick Faces: Changes in Visual Attention and Approach Decisions. Vision, 9(2), 39. https://doi.org/10.3390/vision9020039