4.1.1. Injury Incidence
This study focused on the first three steps of van Mechelen et al.’s sequence of prevention and retrospectively analysed injury data from SailGP’s third season (April 2022 to May 2023). When comparing SailGP’s overall injury incidence per 1000 h to other sailing venues, incidence was similar at 4.65 (95% CI 3.21–6.09) (
Table A2). Indeed, Nathanson et al., reported that injury rates per 1000 h were 9 for an amateur around-the-world race, 2.2 for the 2003 America’s Cup and 0.59 for an international 2014 Olympic-class regatta [
14].
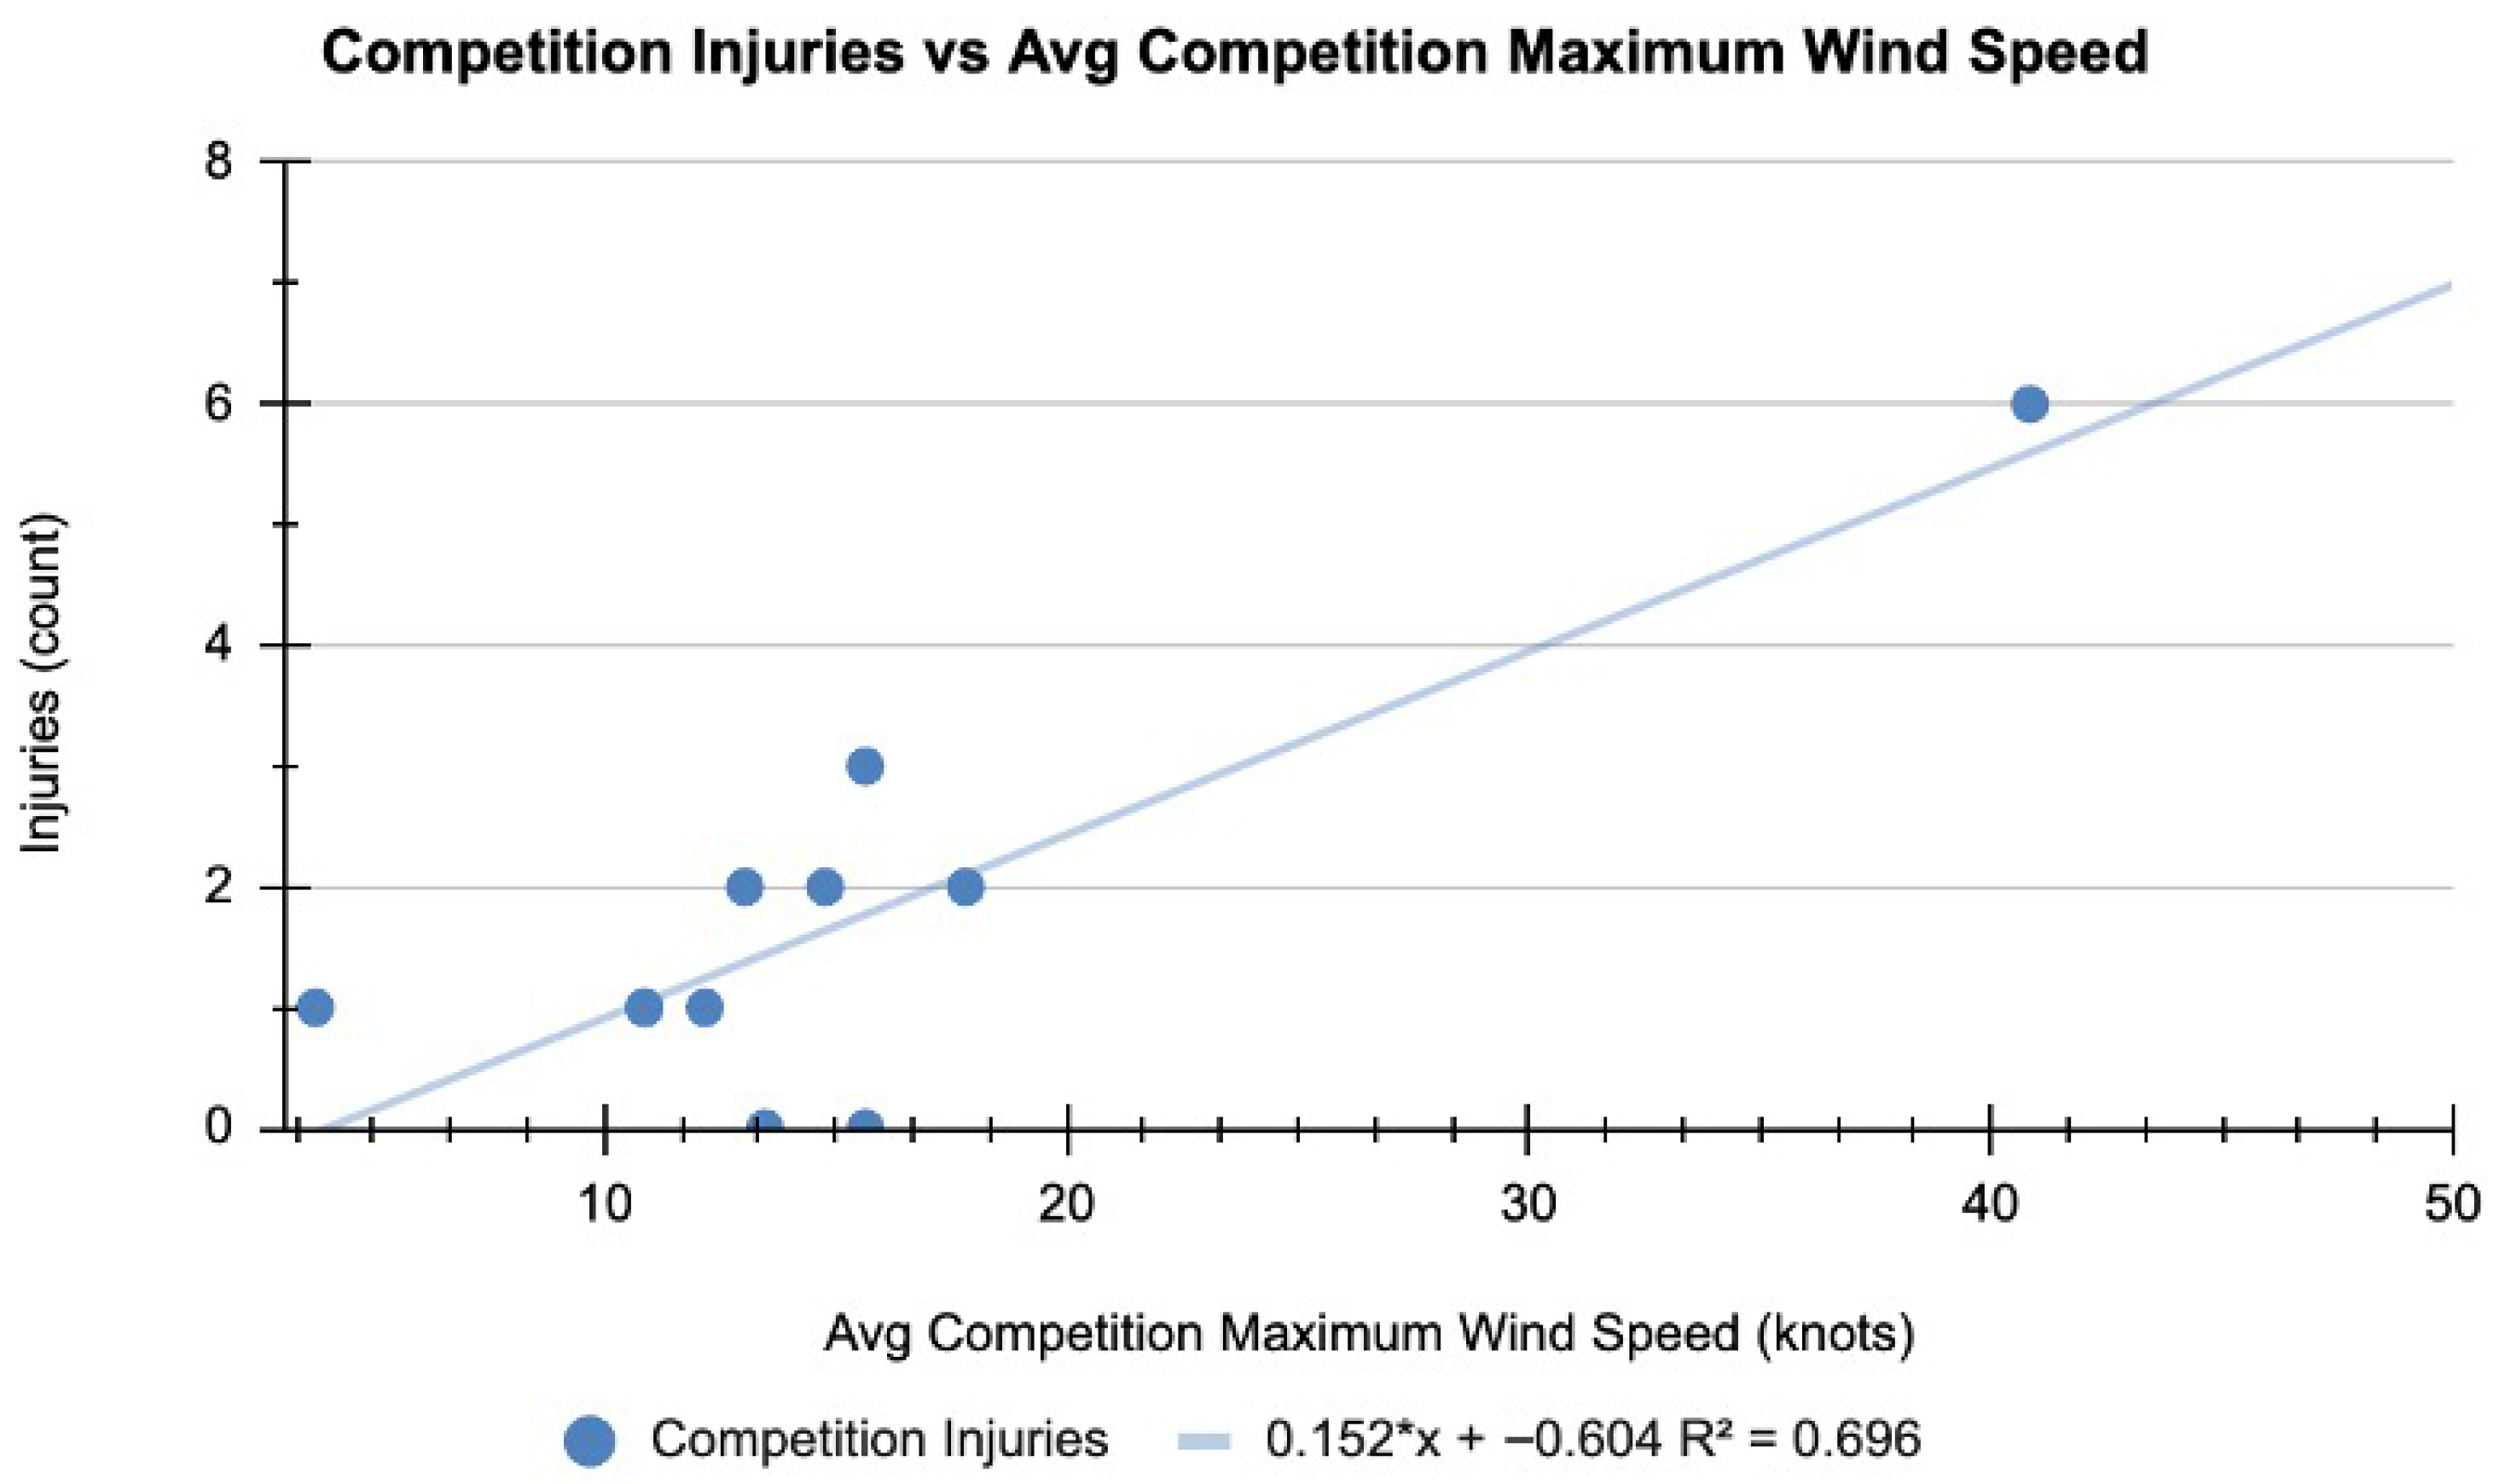
When comparing SailGP’s competition and training injury incidence per 1000 h to other sailing venues, competition incidence was markedly higher at 32.6 (95% CI 17.9–47.2), whereas training incidence was similar at 2.62 (95% CI 1.5–3.74) (
Table A2). SailGP’s increased competition injury incidence is likely due to improvements in hydrofoil technology, which allow F50’s to operate at higher speeds [
15]. Additionally, many SailGP sailors compete in multiple sailing circuits outside SailGP throughout the season, resulting in higher cumulative load compared to sailors specializing in a single format of competition.
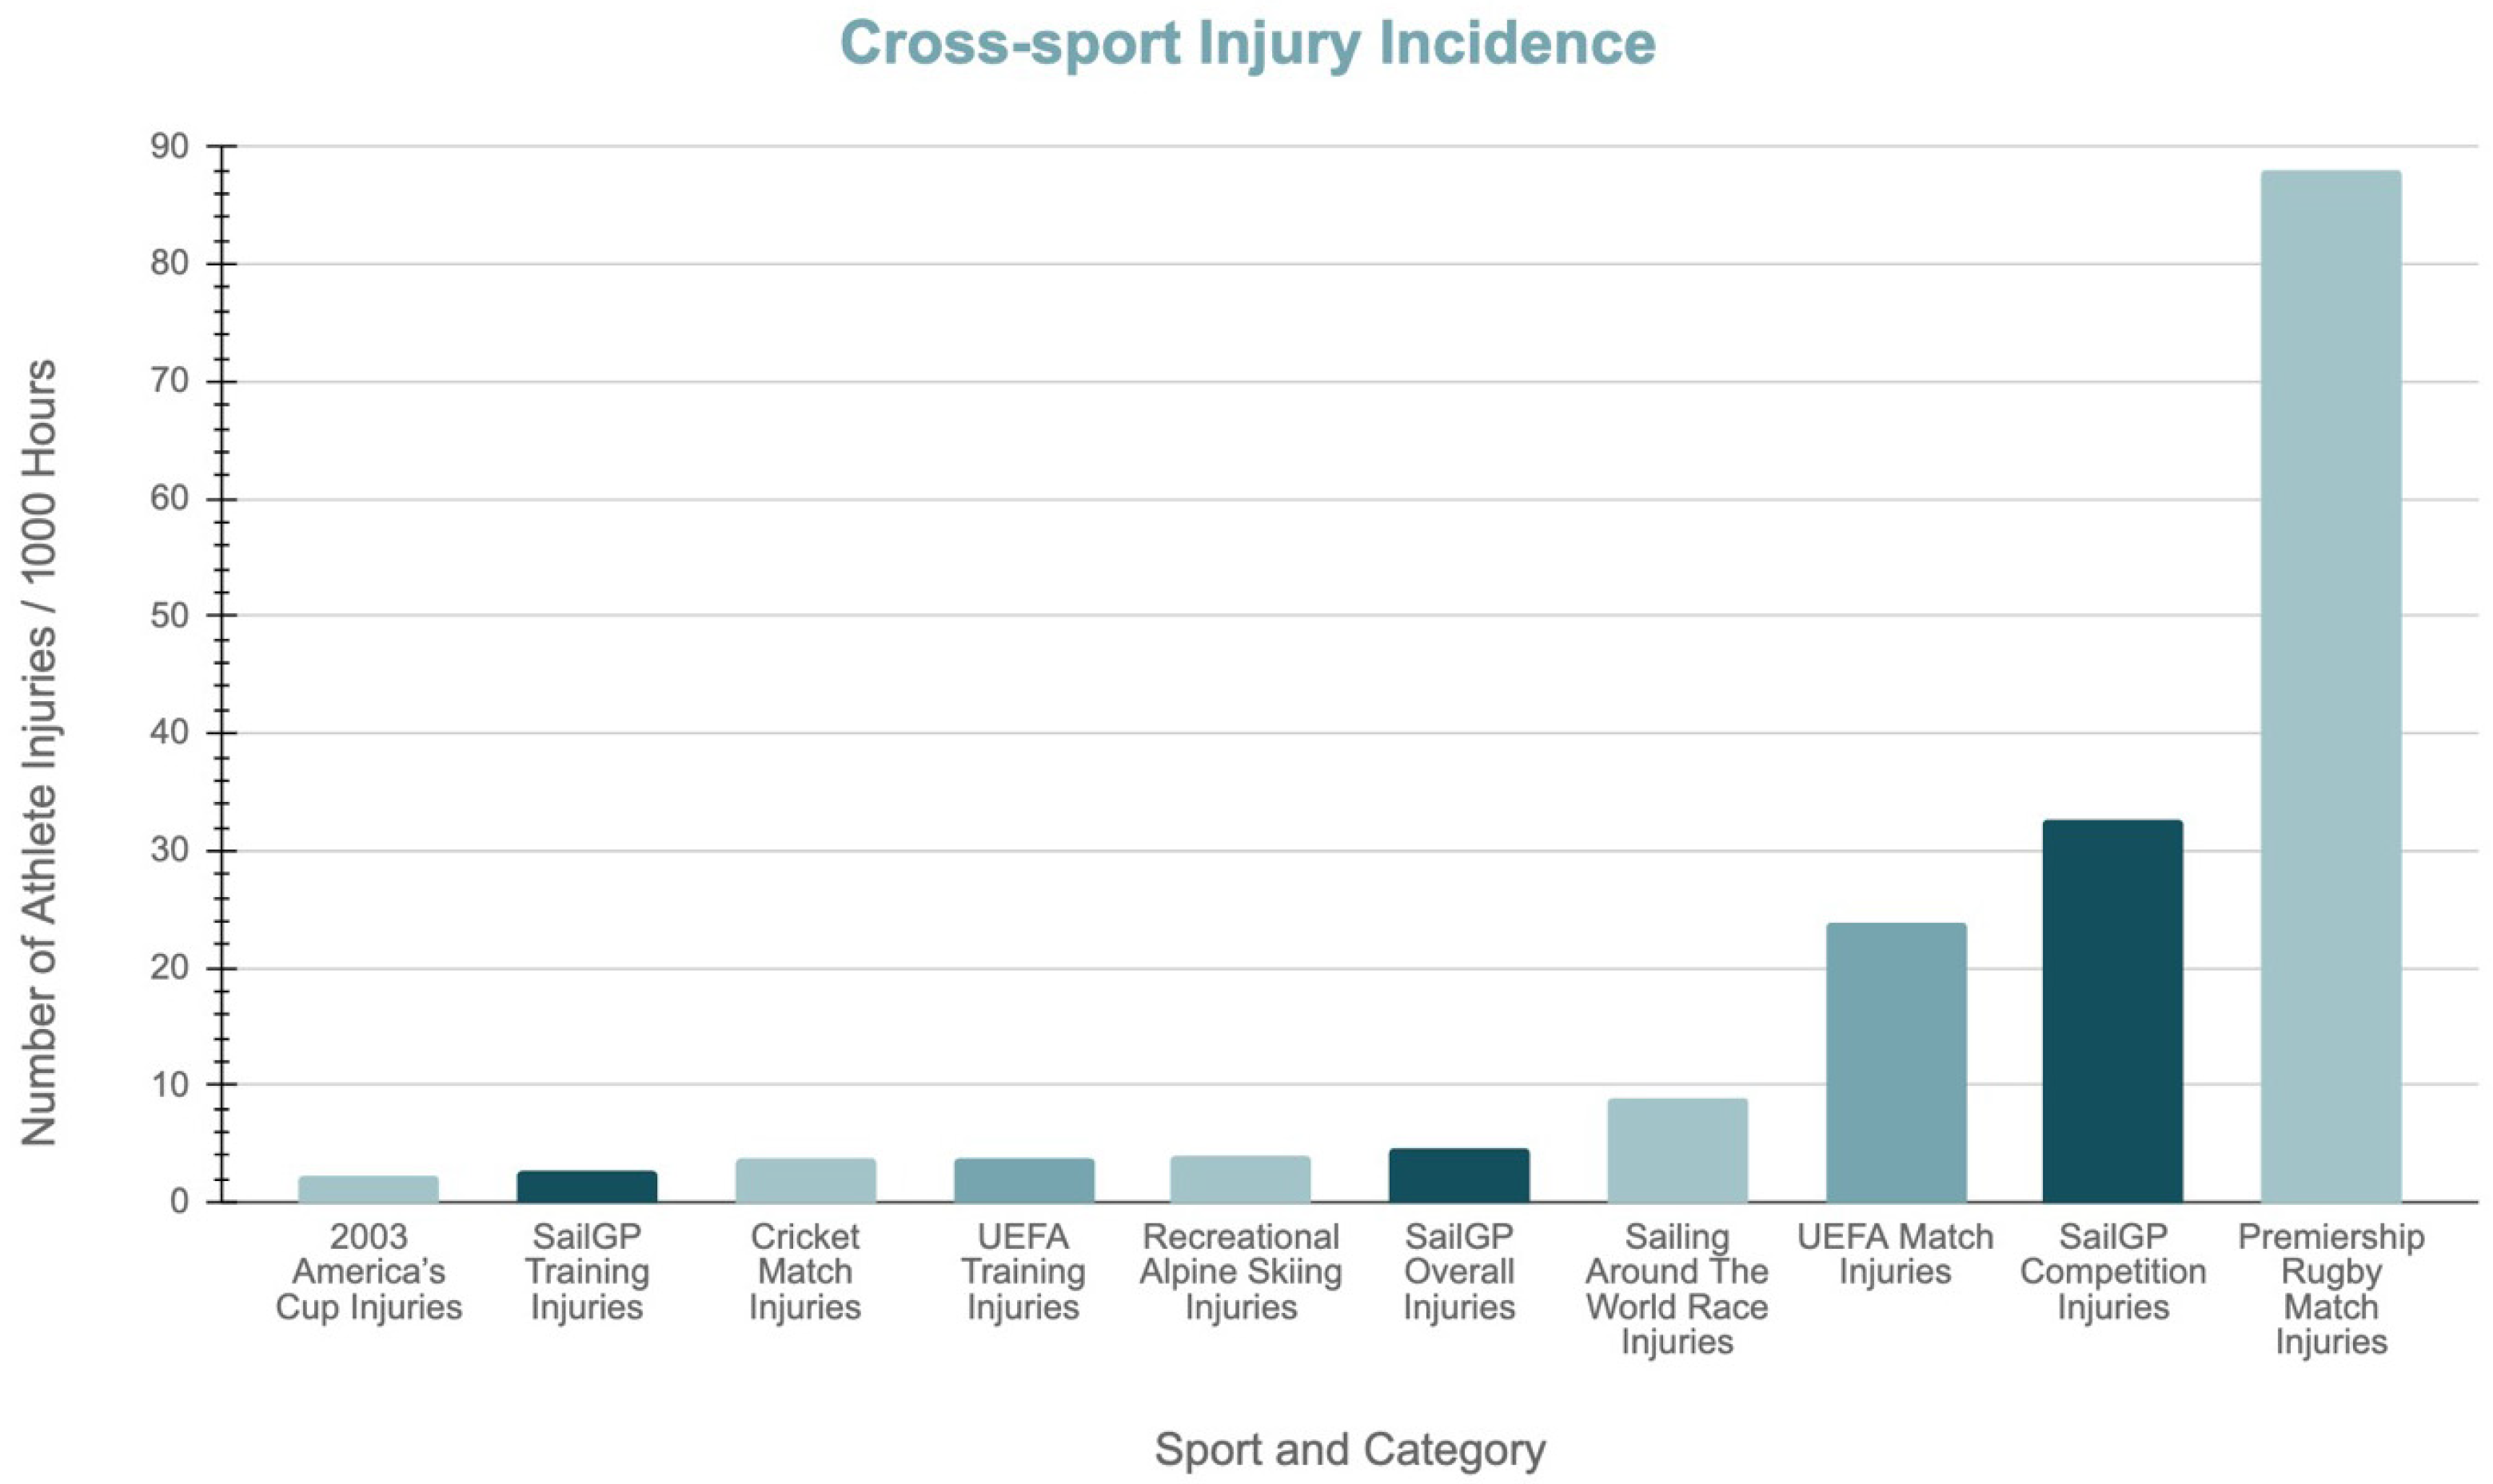
Compared to a selection of year-round, high-performance sports, SailGP’s competition injury incidence remains high, second only to UK Premiership rugby (
Figure 5). Indeed, SailGP has a larger competition/match injury incidence (per 1000 h) than the Union of European Football Associations/UEFA, 32.6 (95% CI 17.9–47.2) compared to 23.8. In contrast, SailGP’s training injury incidence is slightly lower (2.62, 95% CI 1.5–3.74) compared to 3.4 [
16]. SailGP’s higher competition injury incidence compared to other professional sports may also reflect limited pre-competition training. While some sailors attended a multi-week pre-season training, many had only one to two days to familiarize themselves with the F50, resulting in a much lower training to competition time ratio than most other professional sports. While SailGP and UEFA have higher injury rates during competitions, some sports have higher injury rates during trainings. For example, downhill mountain bikers may have increased training injury rates due to the bikers experiencing the track for the first time [
17].
Injury incidence per 1000 h across multiple sailing events and a selection of high-performance sports [
14,
16,
18,
19].
4.1.3. Mechanism of Injury
During training and competition, the most common injury mechanisms were direct impacts (
n = 15, 38%) and falls during manoeuvres (
n = 11, 28%), (
Table 1). These results align with research done by Tan et al., who found that the most common mechanisms of injury during the 2014 Sailing World Championships were hitting a part of the boat (42%) and tripping/falling (39%) [
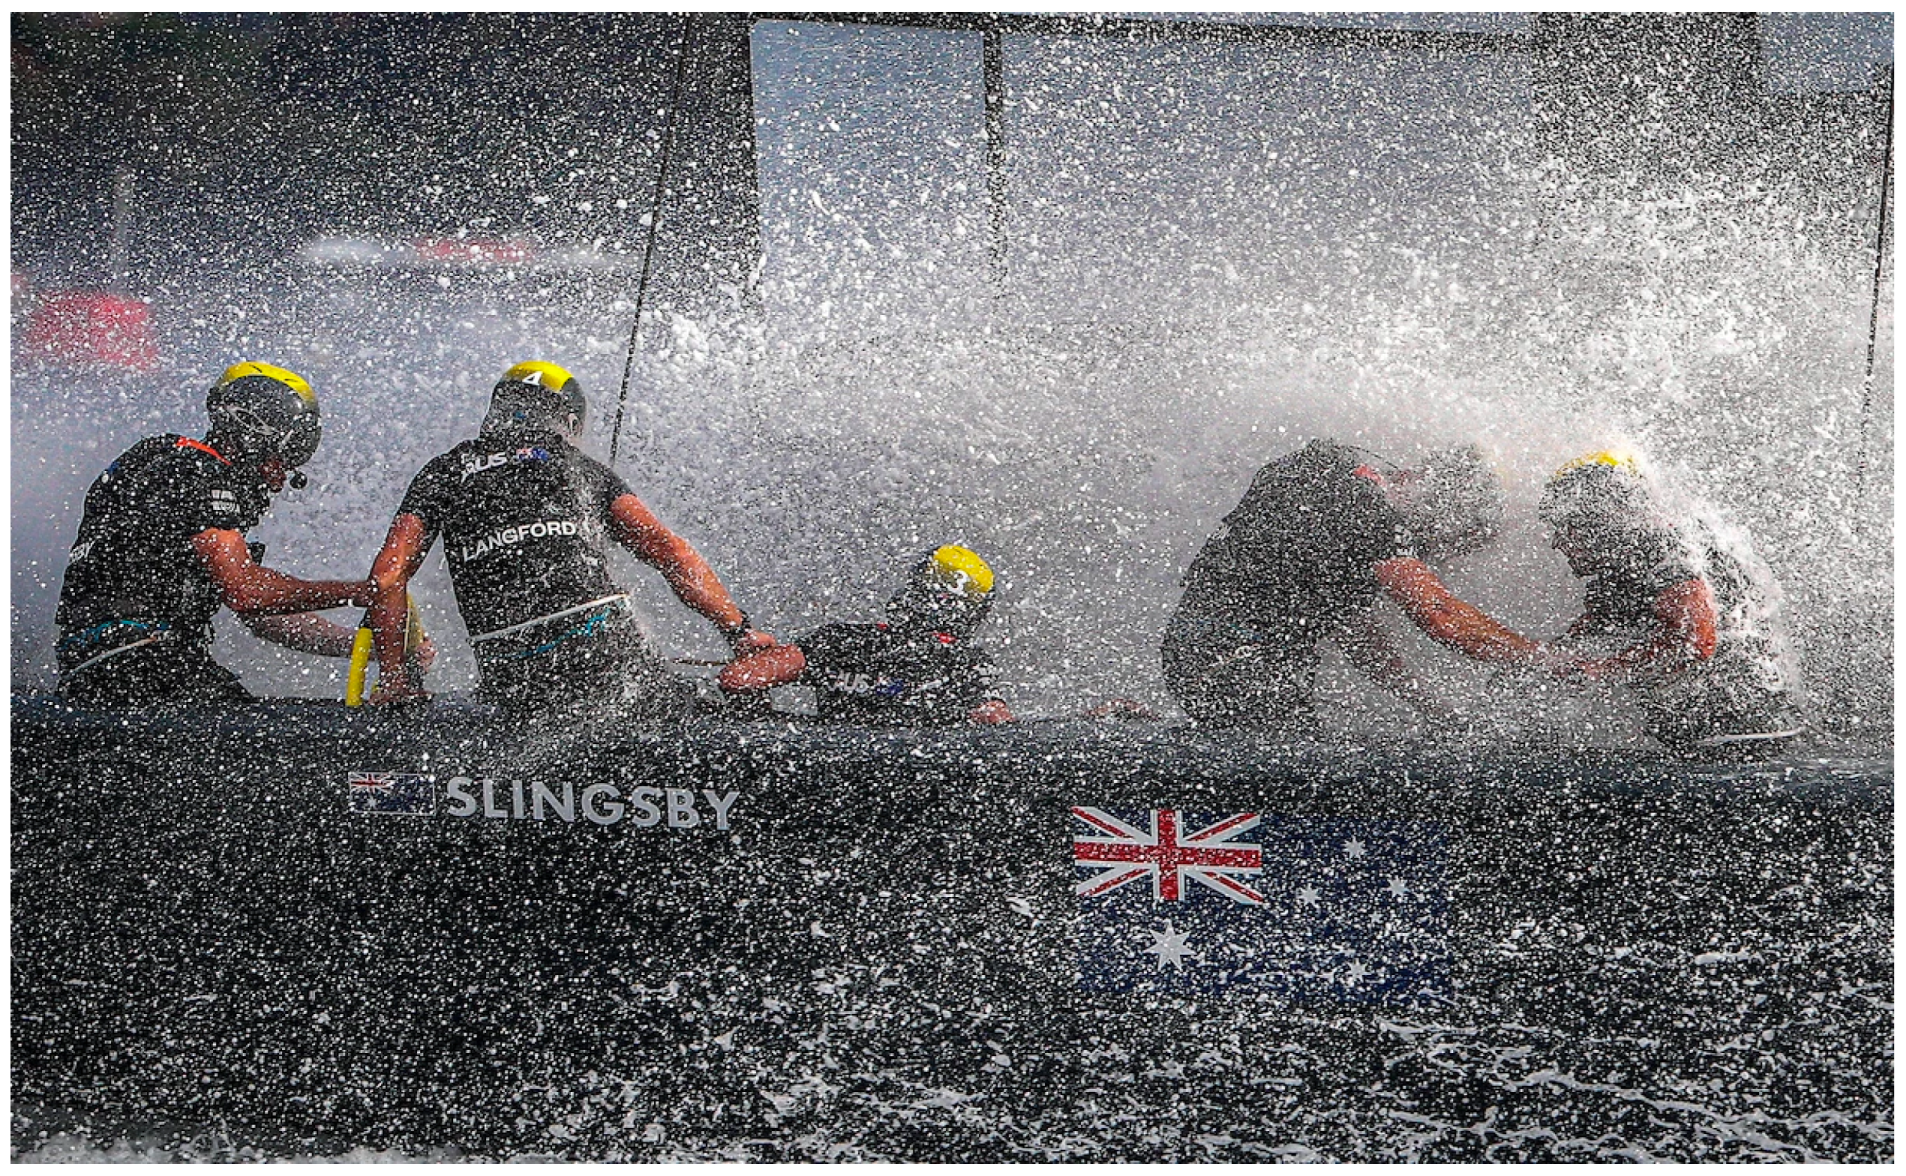
2]. Direct impacts are likely due to the unstable nature of an F50 which can lead to rapid and unexpected decelerations when an F50 crashes into the water (
Figure A1). Furthermore, falls during manoeuvres are likely caused by frequent changes in boat direction (tacking and gybing), during which sailors must transition across the two hulls of the boat on an unsteady trampoline surface at high speeds (
Figure A2). One additional injury mechanism, not reported in
Table 1, was a lightning strike that occurred after a race when a boat was returning to port. To prevent similar incidents in the future, SailGP has implemented a new protocol for adverse weather conditions.
4.1.4. Injury Location
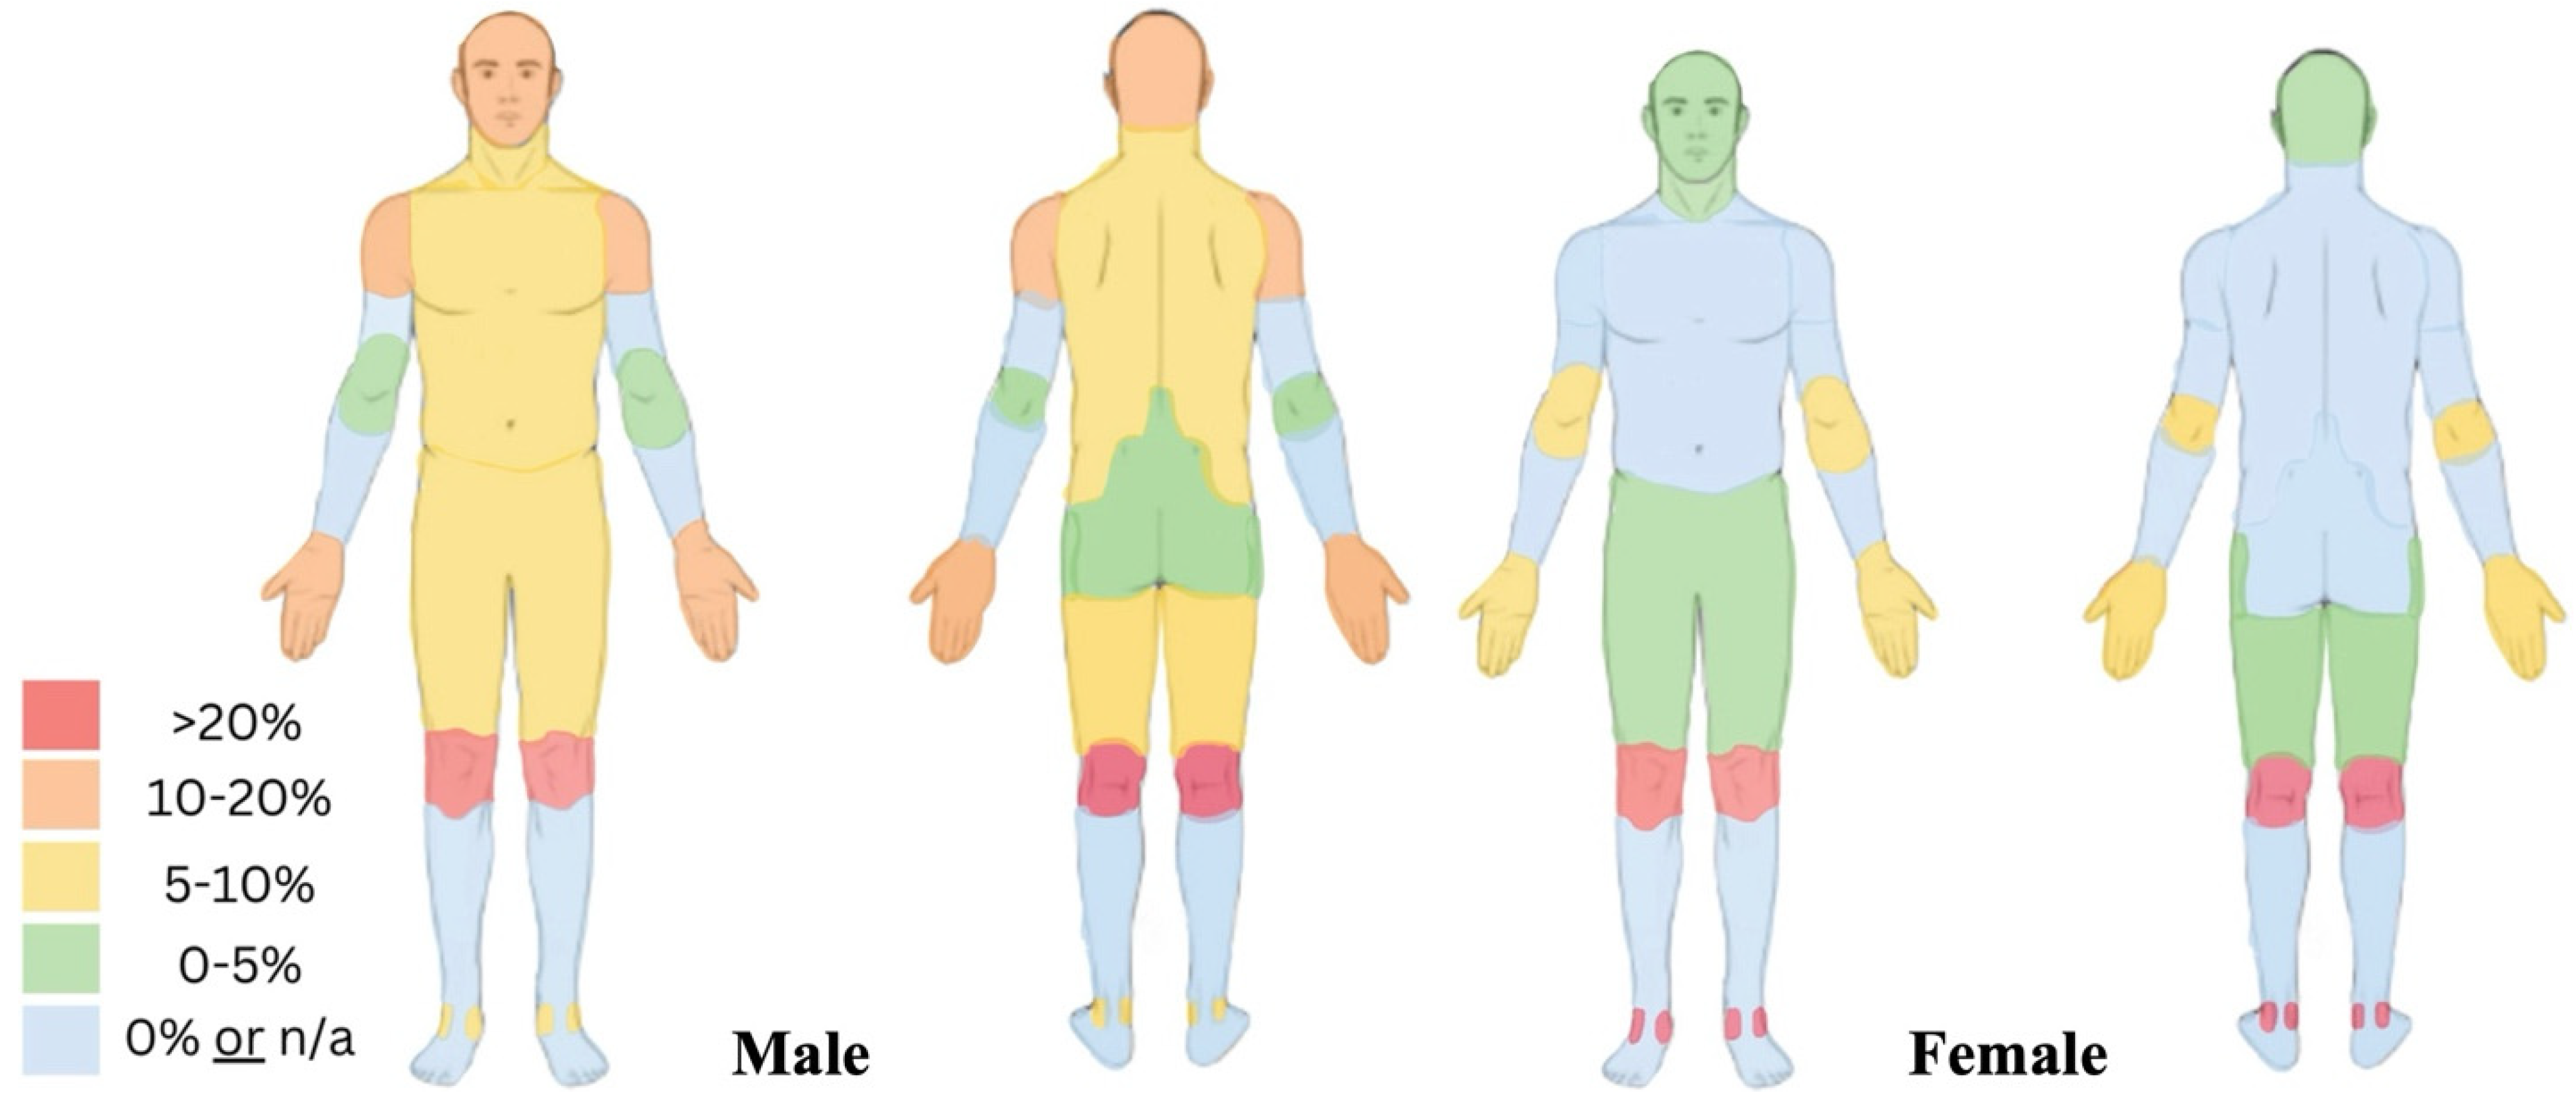
When assessing injury location, the knee was the most frequently injured site (
n = 9, 23%)
Table A3. These results contrast with a review of sailing injuries done by Nathanson et al., who examined non-foiling boats and found that upper extremity injuries were most prevalent, followed by lower extremity and chest injuries [
14]. SailGP’s increased proportion of lower extremity injuries is likely due to the dynamic nature of sailing a foiling catamaran, which requires multiple transitions across the two hulls. Additional common injuries included head (10%,
n = 4) and neck (7.5%,
n = 3) injuries. The increased prevalence of head and neck injuries may be attributed to rapid and unexpected decelerations when an F50 crashes into the water (
Figure A1).
Because foiling catamarans present a heightened risk of head injuries, including concussions, SailGP has developed the first bespoke sailing concussion assessment. This protocol was developed internally using the SCAT6 and the sailing medical expertise of the team [
20]. The protocol is currently in the process of being submitted for publication in a peer-reviewed journal.
4.1.5. Male vs. Female Sailors
Compared to men, females had a higher overall injury incidence (IRR female vs. male = 2.69, 95% CI 1.41–5.16). Likewise, female athletes had a higher RR of training injuries (RR = 3.75, 95% CI 1.59–8.83, p = 0.001), competition injuries (RR = 1.79, 95% CI 0.65–4.90, p = 0.25) and overall concussion risk (RR = 10.04, 95% CI 0.91–110.46, p = 0.02), although RR for competition injuries was not statistically significant (p > 0.05).
These trends mirror findings by Tan et al., who reported that females had roughly twice the injury prevalence of males in the mixed pair class Narca 17, where one male and female sailor must be on board [
2]. Females’ increased injury incidence may be due to several factors. First, female sailors may have an increased risk for knee injuries due to anatomical and physiological differences (e.g., reduced neuromuscular-control, imbalance of muscle agonists and antagonists and fluctuations in hormone status) [
7]. Females may also have an increased risk for ankle injuries due to changes in hormonal status and neuromuscular control, although further research is needed [
21]. These factors may explain why the most common injury locations for female sailors were the knee (
n = 3, 21%) and ankle (
n = 3, 21%), compared to males, who most frequently injured the knee (
n = 6, 23%), head (
n = 3, 11.5%), shoulder (
n = 3, 11.5%) and hand (
n = 3, 11.5%) (
Table A3).
Lastly, female sailors’ increased risk of concussions may be due to a reduced head-neck segment mass, which can increase the angular acceleration of the head during impact, or hormonal effects of oestrogen on cerebral blood flow [
22]. However, additional research is needed to clarify the relationship between sailor sex and concussion risk, as the sample size in this paper was small.
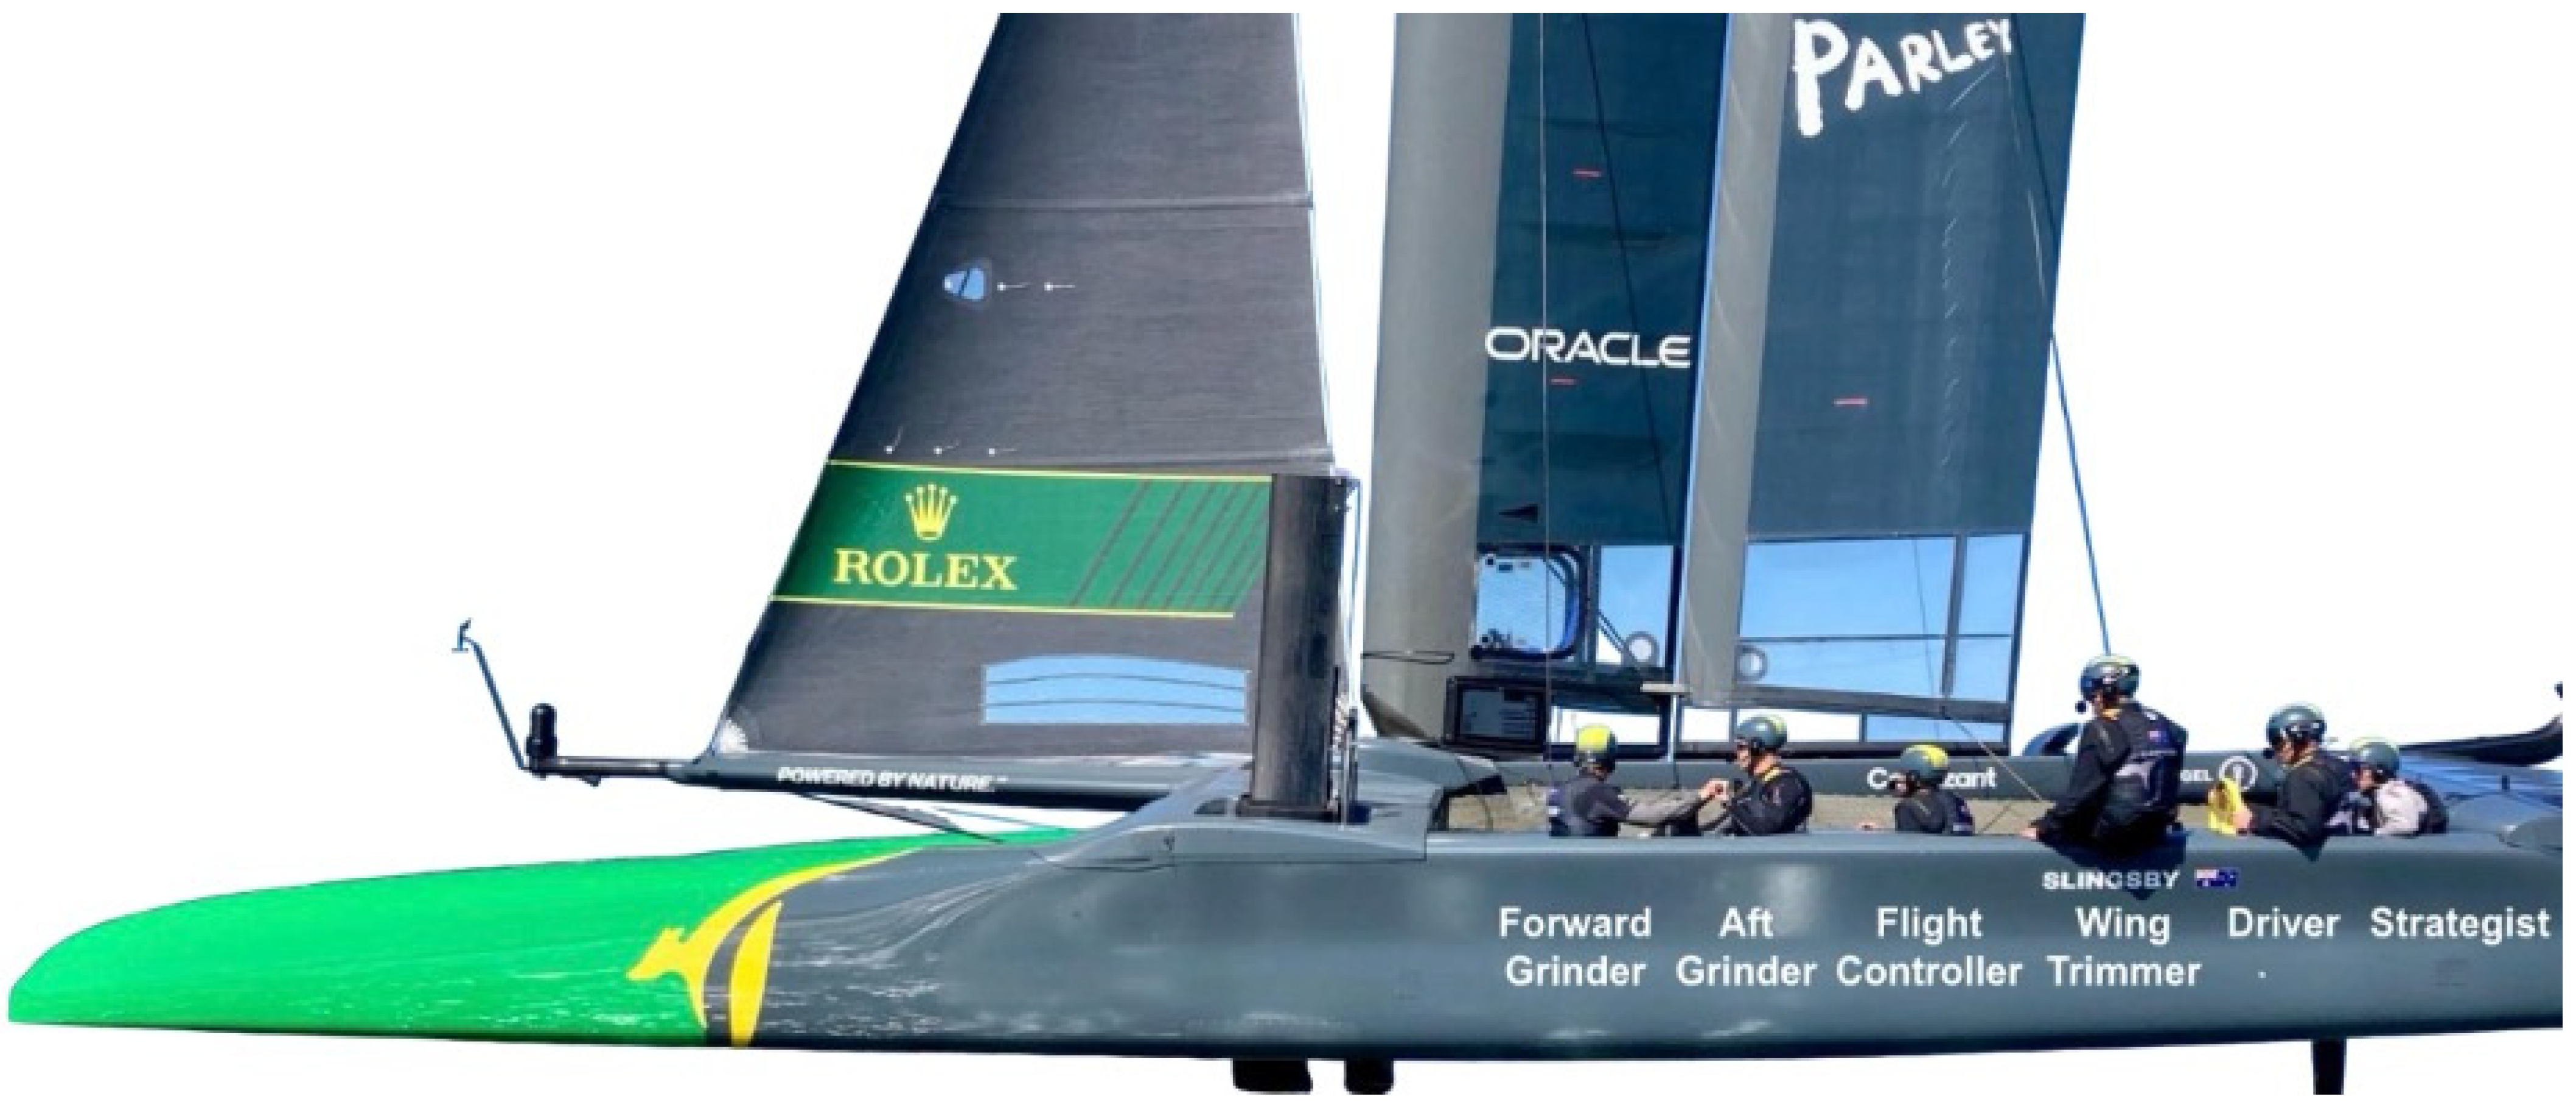
When assessing upper extremity injuries in males, the higher prevalence of shoulder and hand injuries is likely positional. During SailGP’s third season, most grinders, wing trimmers and drivers were male. These positions place increased demands on the upper limbs through manually powering the F50 with a hand-crank (grinding pedestal), trimming the sails of the F50 and driving the boat.
In addition to physiological factors, equipment design may also contribute to increased injury risk for female sailors. Because SailGP sailing equipment was originally designed for male sailors, female sailors may experience poorly fitting gear, or poorly tailored equipment. For example, at the beginning of season three, several female sailors had greater difficulty exiting the boat’s cockpit due to shorter stature. This hindered their ability to achieve a safe position during potential crashes and rapid changes in boat direction.
Finally, female sailors’ increased injury risk may be related to reduced F50 exposure during SailGP’s third season. At the start of the season teams were required to rotate female sailors on their roster. Because each team only had one active female sailor, their total F50 exposure time was significantly lower than that of male sailors. This resulted in reduced familiarity with SailGP equipment and procedures. Near the end of season three, this rotation rule was removed.
In addition to an increased injury incidence, female sailors also had a higher overall illness incidence (IRR female vs. male = 3.33, 95% CI 0.94–11.81). These findings align with research done by Crunkhorn et al., who reported that females in an Australian Olympic class and State Sailing Pathway Program (SSPP) experienced a 3.6-fold increase in illnesses compared to males (IRR = 3.6, 95% CI 2.0–6.8) [
23]. This result warrants further investigation to determine the underlying factors contributing to the increased rate of reported illnesses in female sailors.
4.1.6. Positional Differences
During training and competition, strategists and grinders experienced the highest number of injuries (
Table A1). Strategists had the highest overall injury incidence per 365 days (1.66), followed by grinders (1.54), flight controllers (0.59), wing trimmers (0.71) and drivers (0.24). These results align with Tan et al., who found that in two-person classes, the helmsmen (i.e., driver of the boat) had a slightly lower injury prevalence compared to the crew, although the difference was not statistically significant (
p = 0.655) [
2].
Strategists’ increased injury incidence may be explained by several factors. Firstly, strategists are typically female and shorter in stature, which may impede exiting the cockpit and reaching safe positions during manoeuvres. Second, strategists transition before manoeuvres and do not have an active role in turning the boat, reducing their ability to predict sudden changes in F50 acceleration. Third, strategists’ safety tethers have more slack because they are not deflected around the wing of the boat (
Figure A2). This may result in longer collisions and contrasts with other positions on the F50, except for the driver, who typically crosses the boat at slower speeds, when the F50 is traveling in a straight line. These observations correlate with the fact that the majority of strategist injuries were caused by falls during manoeuvres and direct impacts (
Table 1). Strategists most commonly injured the knee (
n = 3, 21%) and ankle (
n = 3, 21%) (
Table A3). Finally, nearly all female sailors in season three were strategists, contributing to the higher injury proportion in this position.
In contrast, grinders’ increased proportion of injuries may be related to the forward grinder facing away from the F50’s direction of travel, limiting their ability to anticipate crashes or sudden directional changes. Grinders most frequently injured the knee (
n = 4, 31%) and chest (
n = 2, 15.4%) (
Table A3) and were more likely to experience injuries from falls during manoeuvres and direct impacts (
Table 1). Additionally, the physical demands of the grinder, which includes manually powering the hydraulics of the F50 with a pedestal, may further increase injury prevalence. During season three, 23% of grinder injuries involved the upper extremities (
Table A3).
4.1.7. Illnesses
The most common illness symptom clusters were upper respiratory (
n = 4, 30.8%), gastrointestinal (
n = 3, 23.1%) and dermatological (
n = 3, 23.1%) (
Table A4). These findings align with Crunkhorn et al., who reported that respiratory infections were the most common illnesses during an Australian Olympic class and State Sailing Pathway Program (
n = 22, 40.7%) [
23]. Upper respiratory illnesses were likely due to increased exposure to pathogens during travel, close quarters of event venues, significant time zone changes and competition-related stress. Furthermore, environmental factors such as water quality may increase pathogen exposure risk [
2]. Gastrointestinal illnesses were likely influenced by similar factors affecting upper respiratory illness, as well as variable hygiene standards at venues and changes in diet and hydration while traveling. Dermatological issues were likely caused by repeated exposure to saltwater and wind, limited shower facilities, elevated stress levels and environmental pathogen exposure.
