
Continental Assessment of Work-Related Musculoskeletal Disorders Prevalence Among Surgeons: Systematic Review and Meta-Analysis


Abstract
1. Introduction
2. Materials and Methods
2.1. Inclusion/Exclusion Criteria
2.2. Search Strategy
2.3. Quality Assessment
2.4. Data Extraction
2.5. Statistical Analysis
2.6. Registration and Report
3. Results
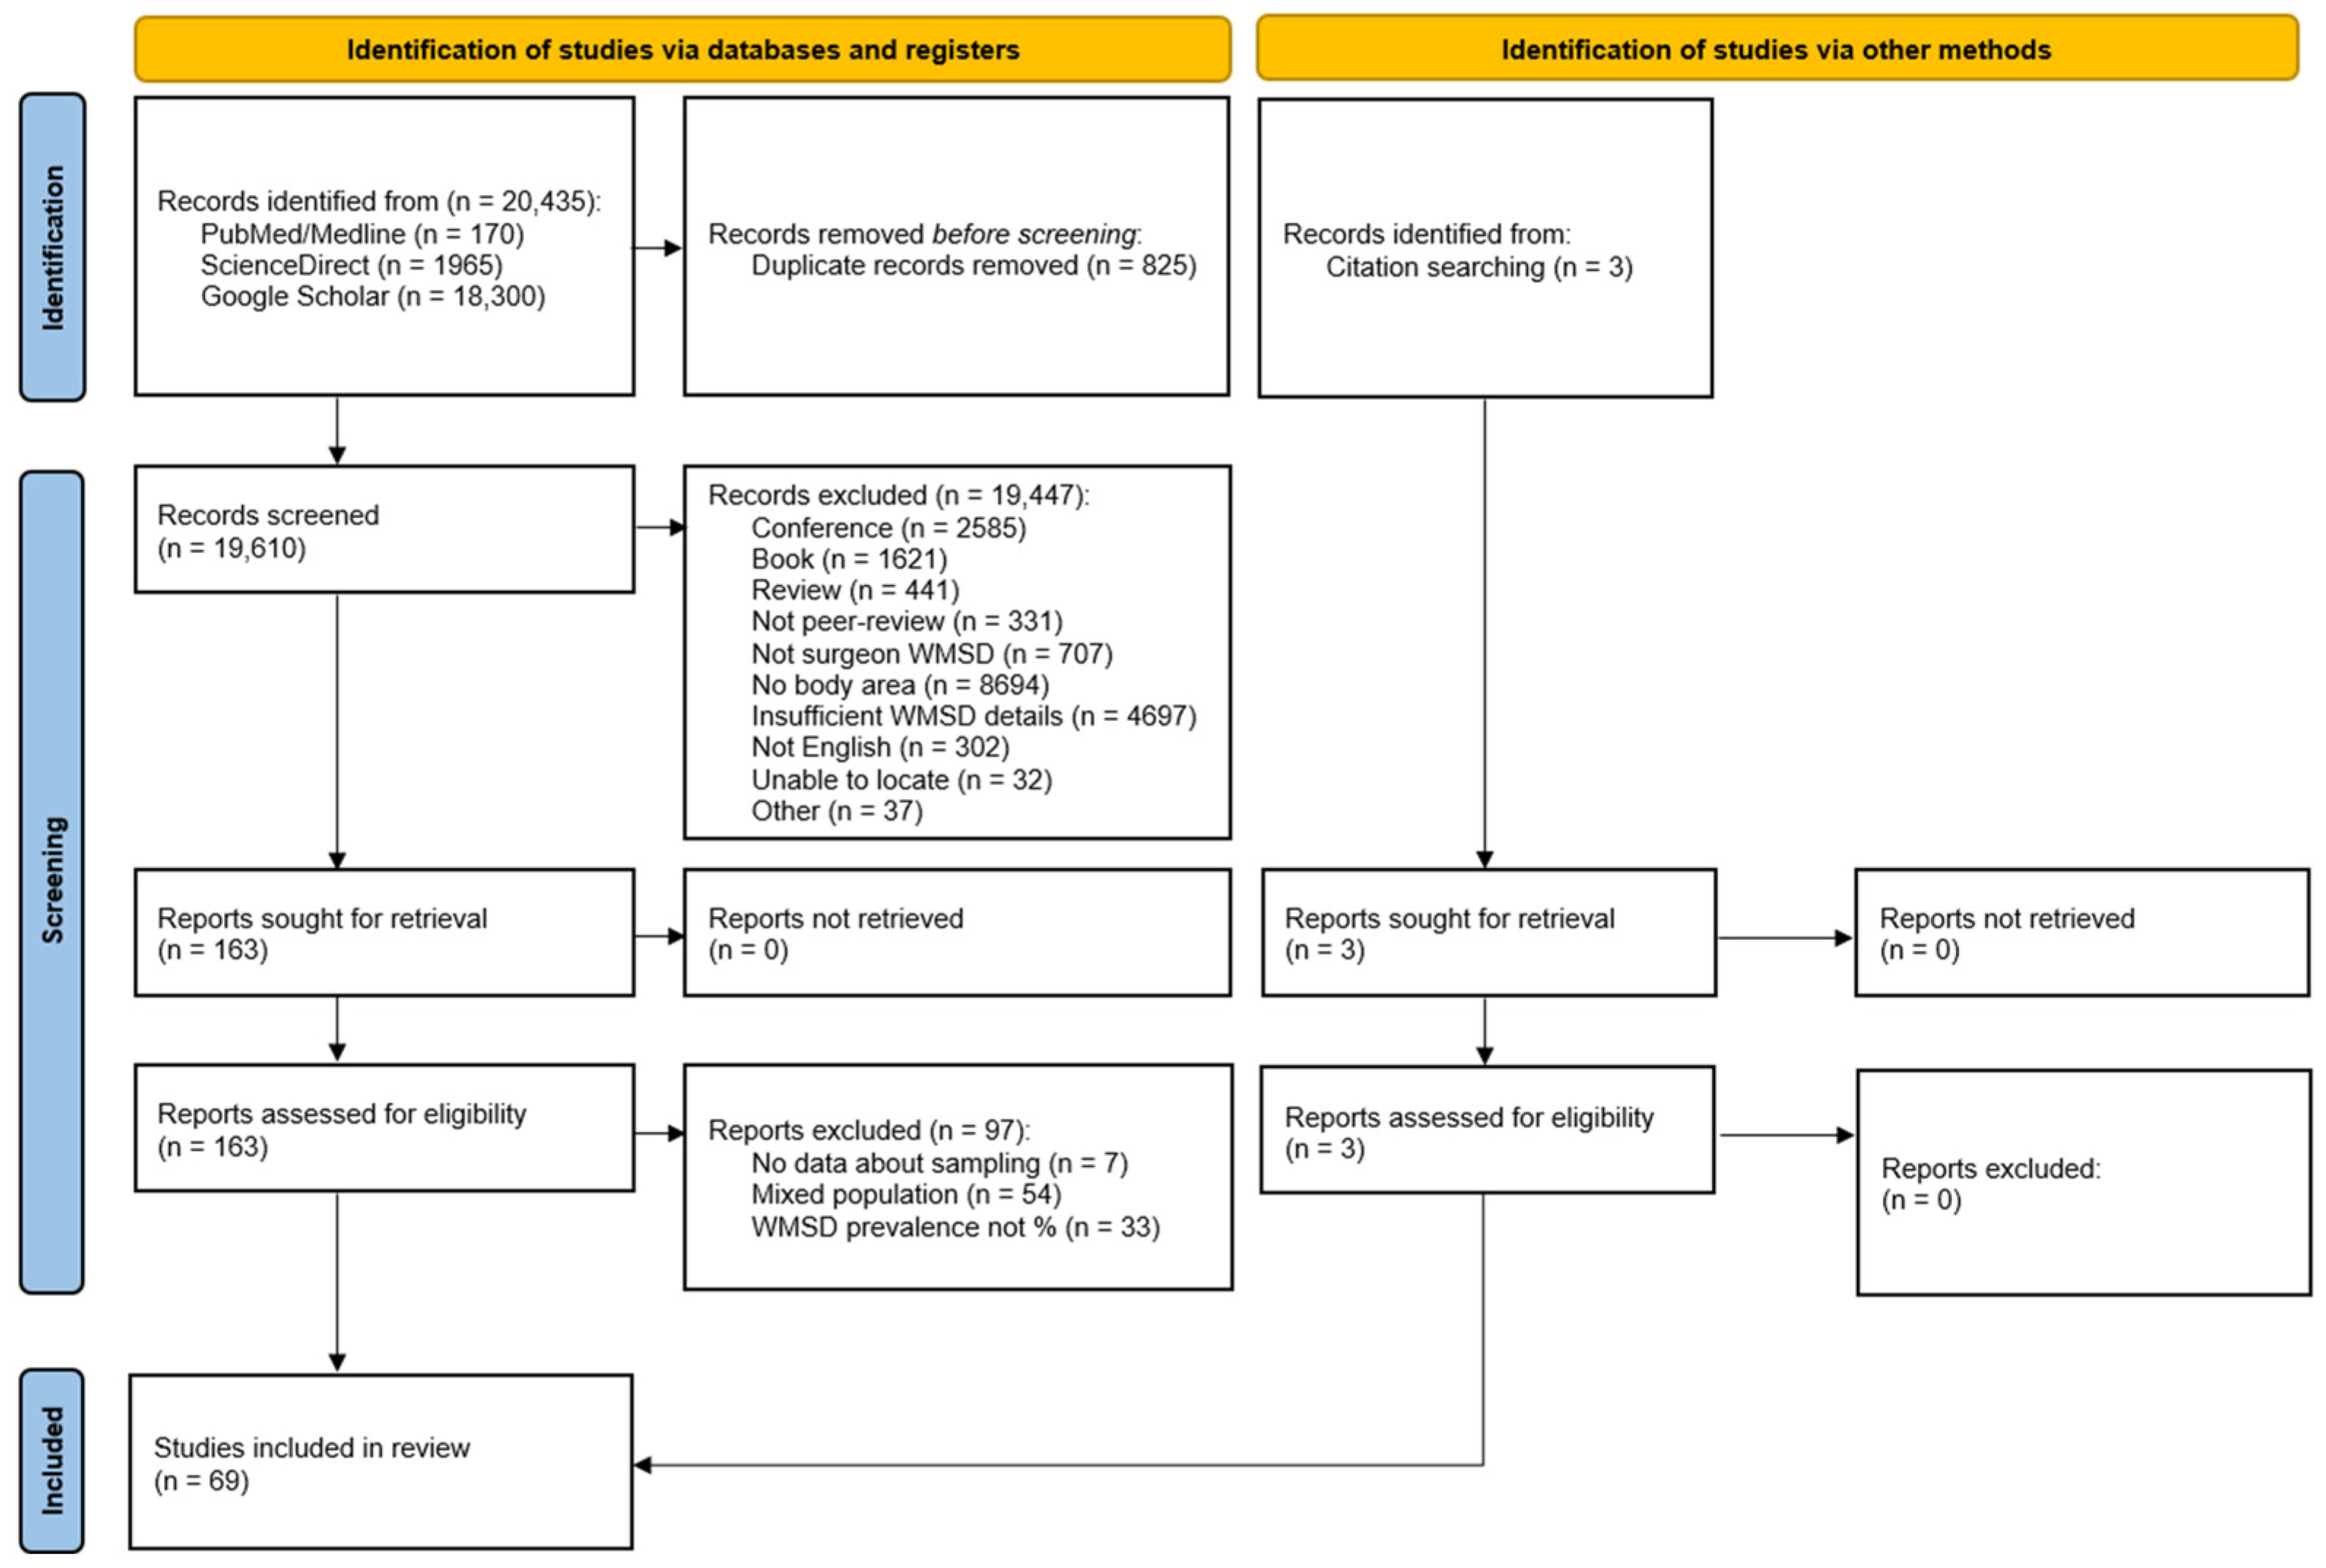
3.1. Search Results
3.2. Study Characteristics
3.3. Quality Appraisal
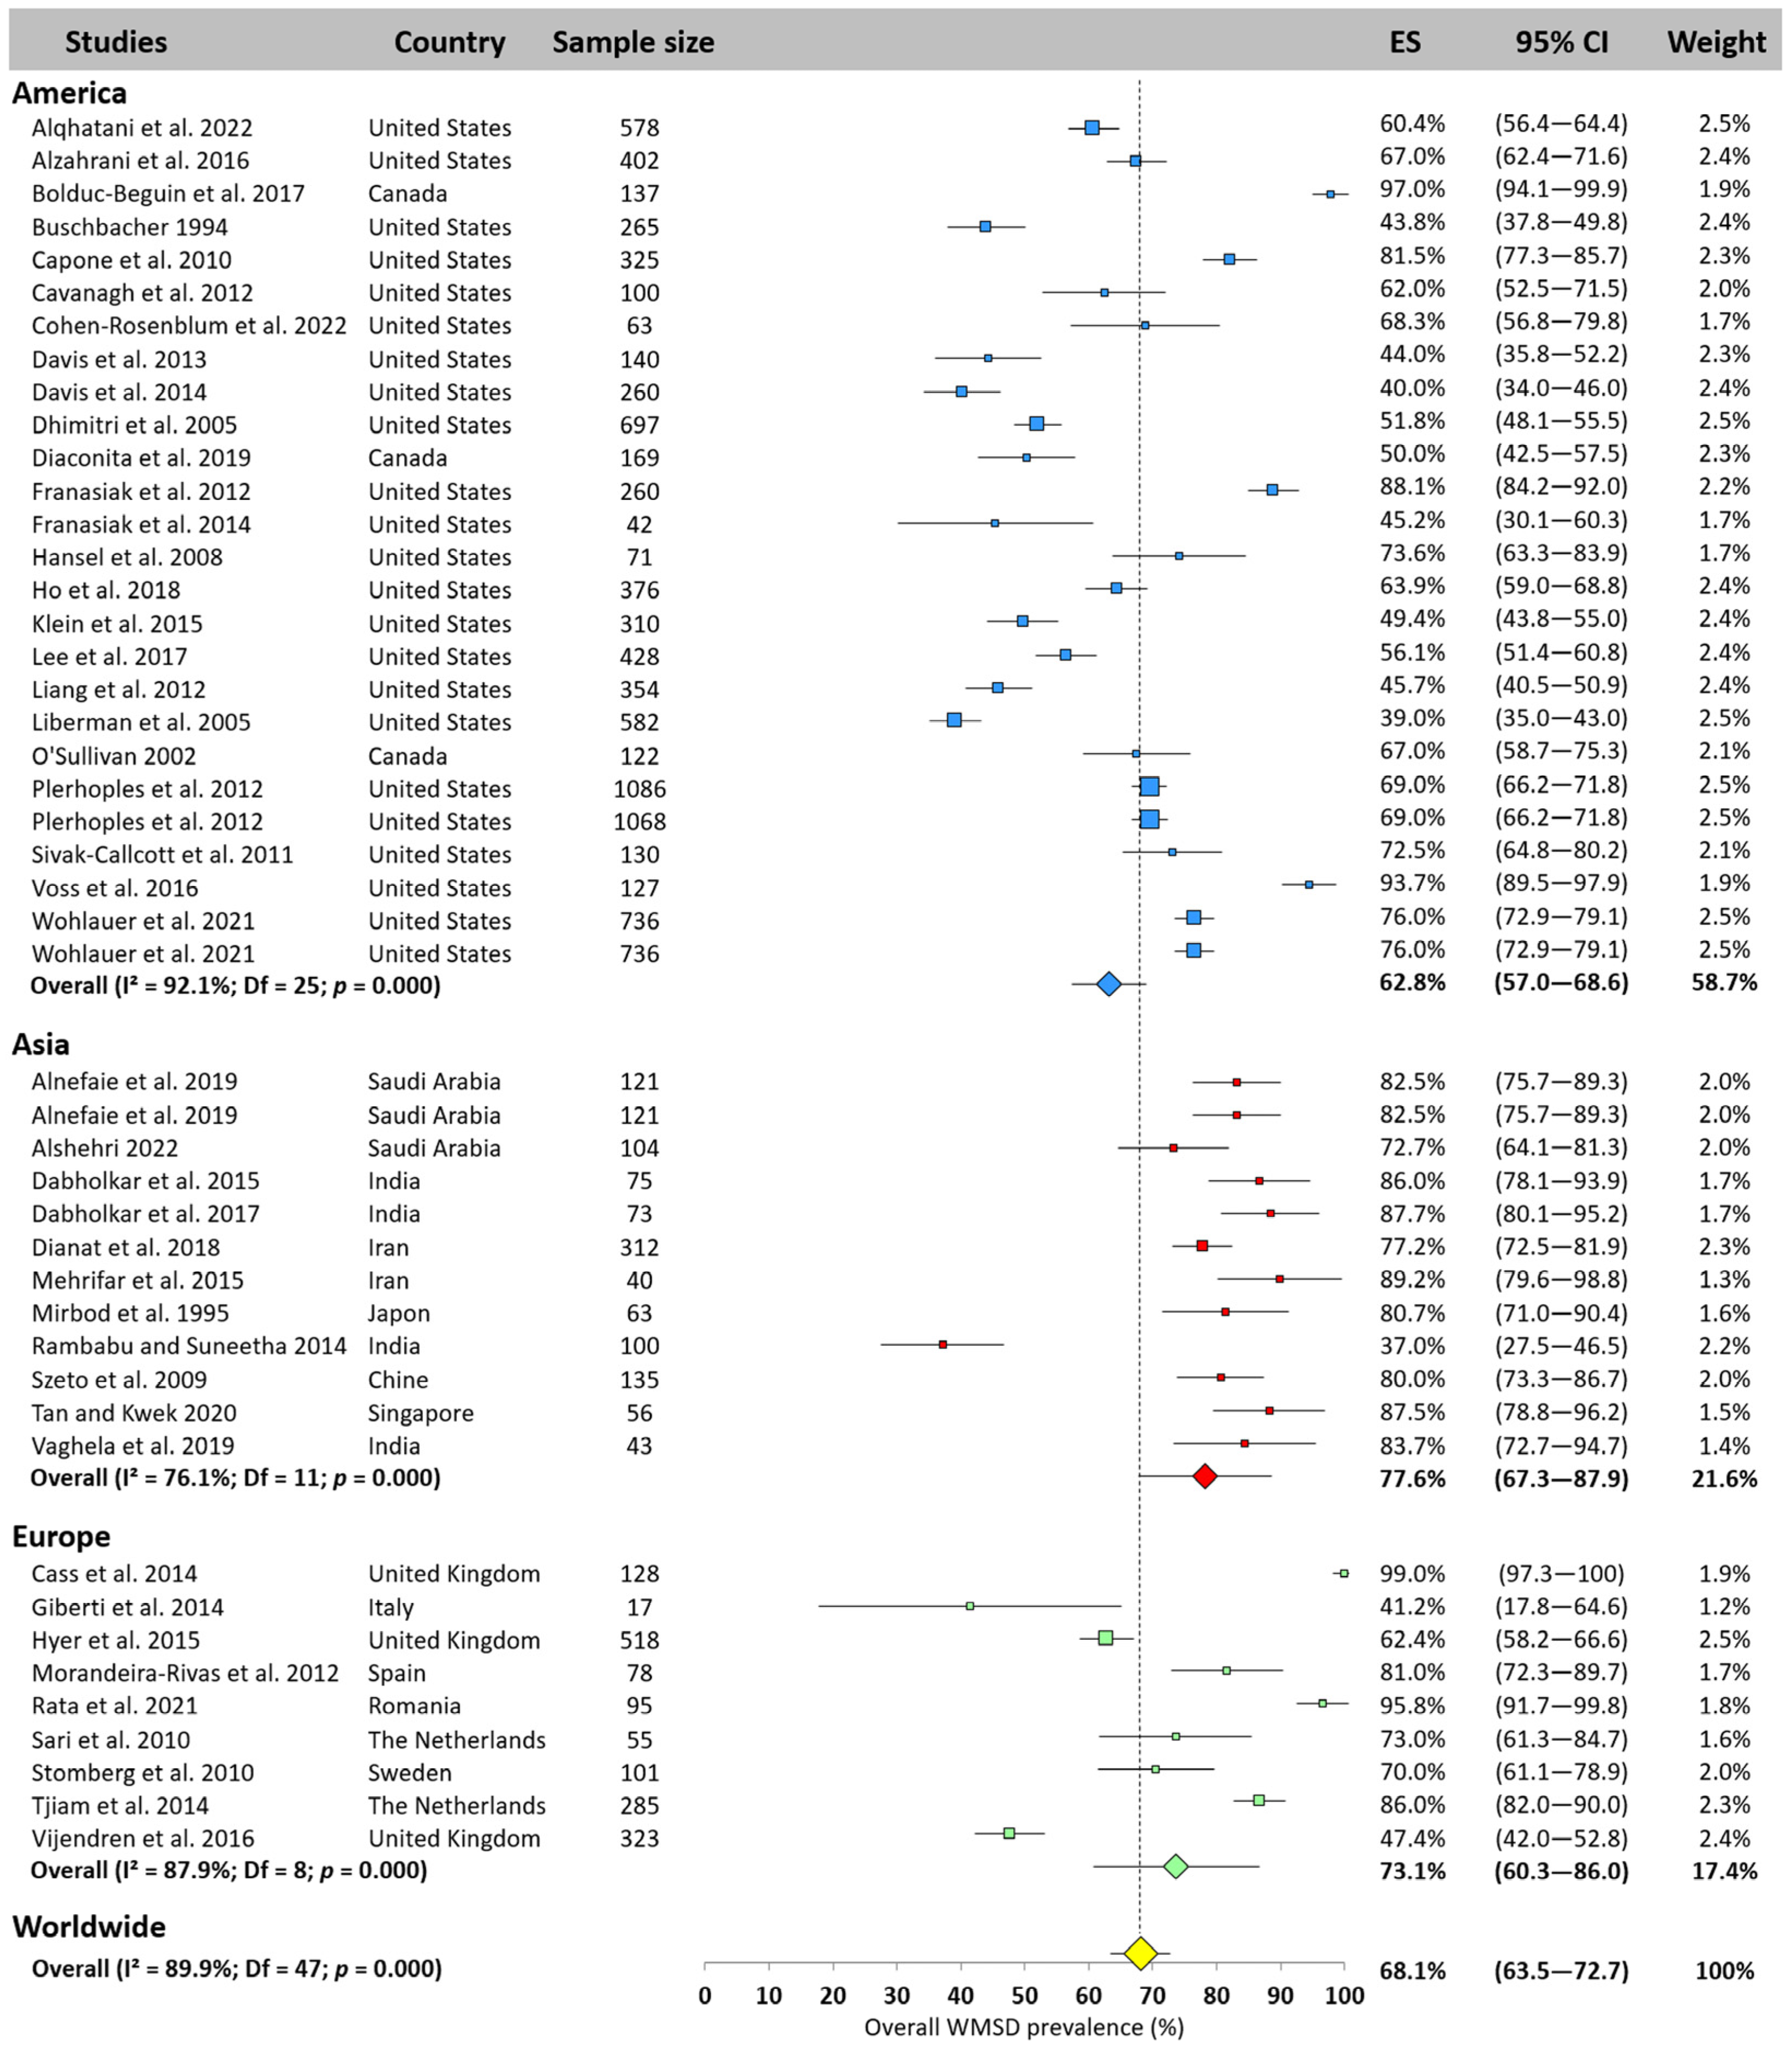
3.4. Meta-Analysis of Overall WMSD Prevalence
3.5. Meta-Analysis WMSD Prevalence by Body Area
3.5.1. Neck
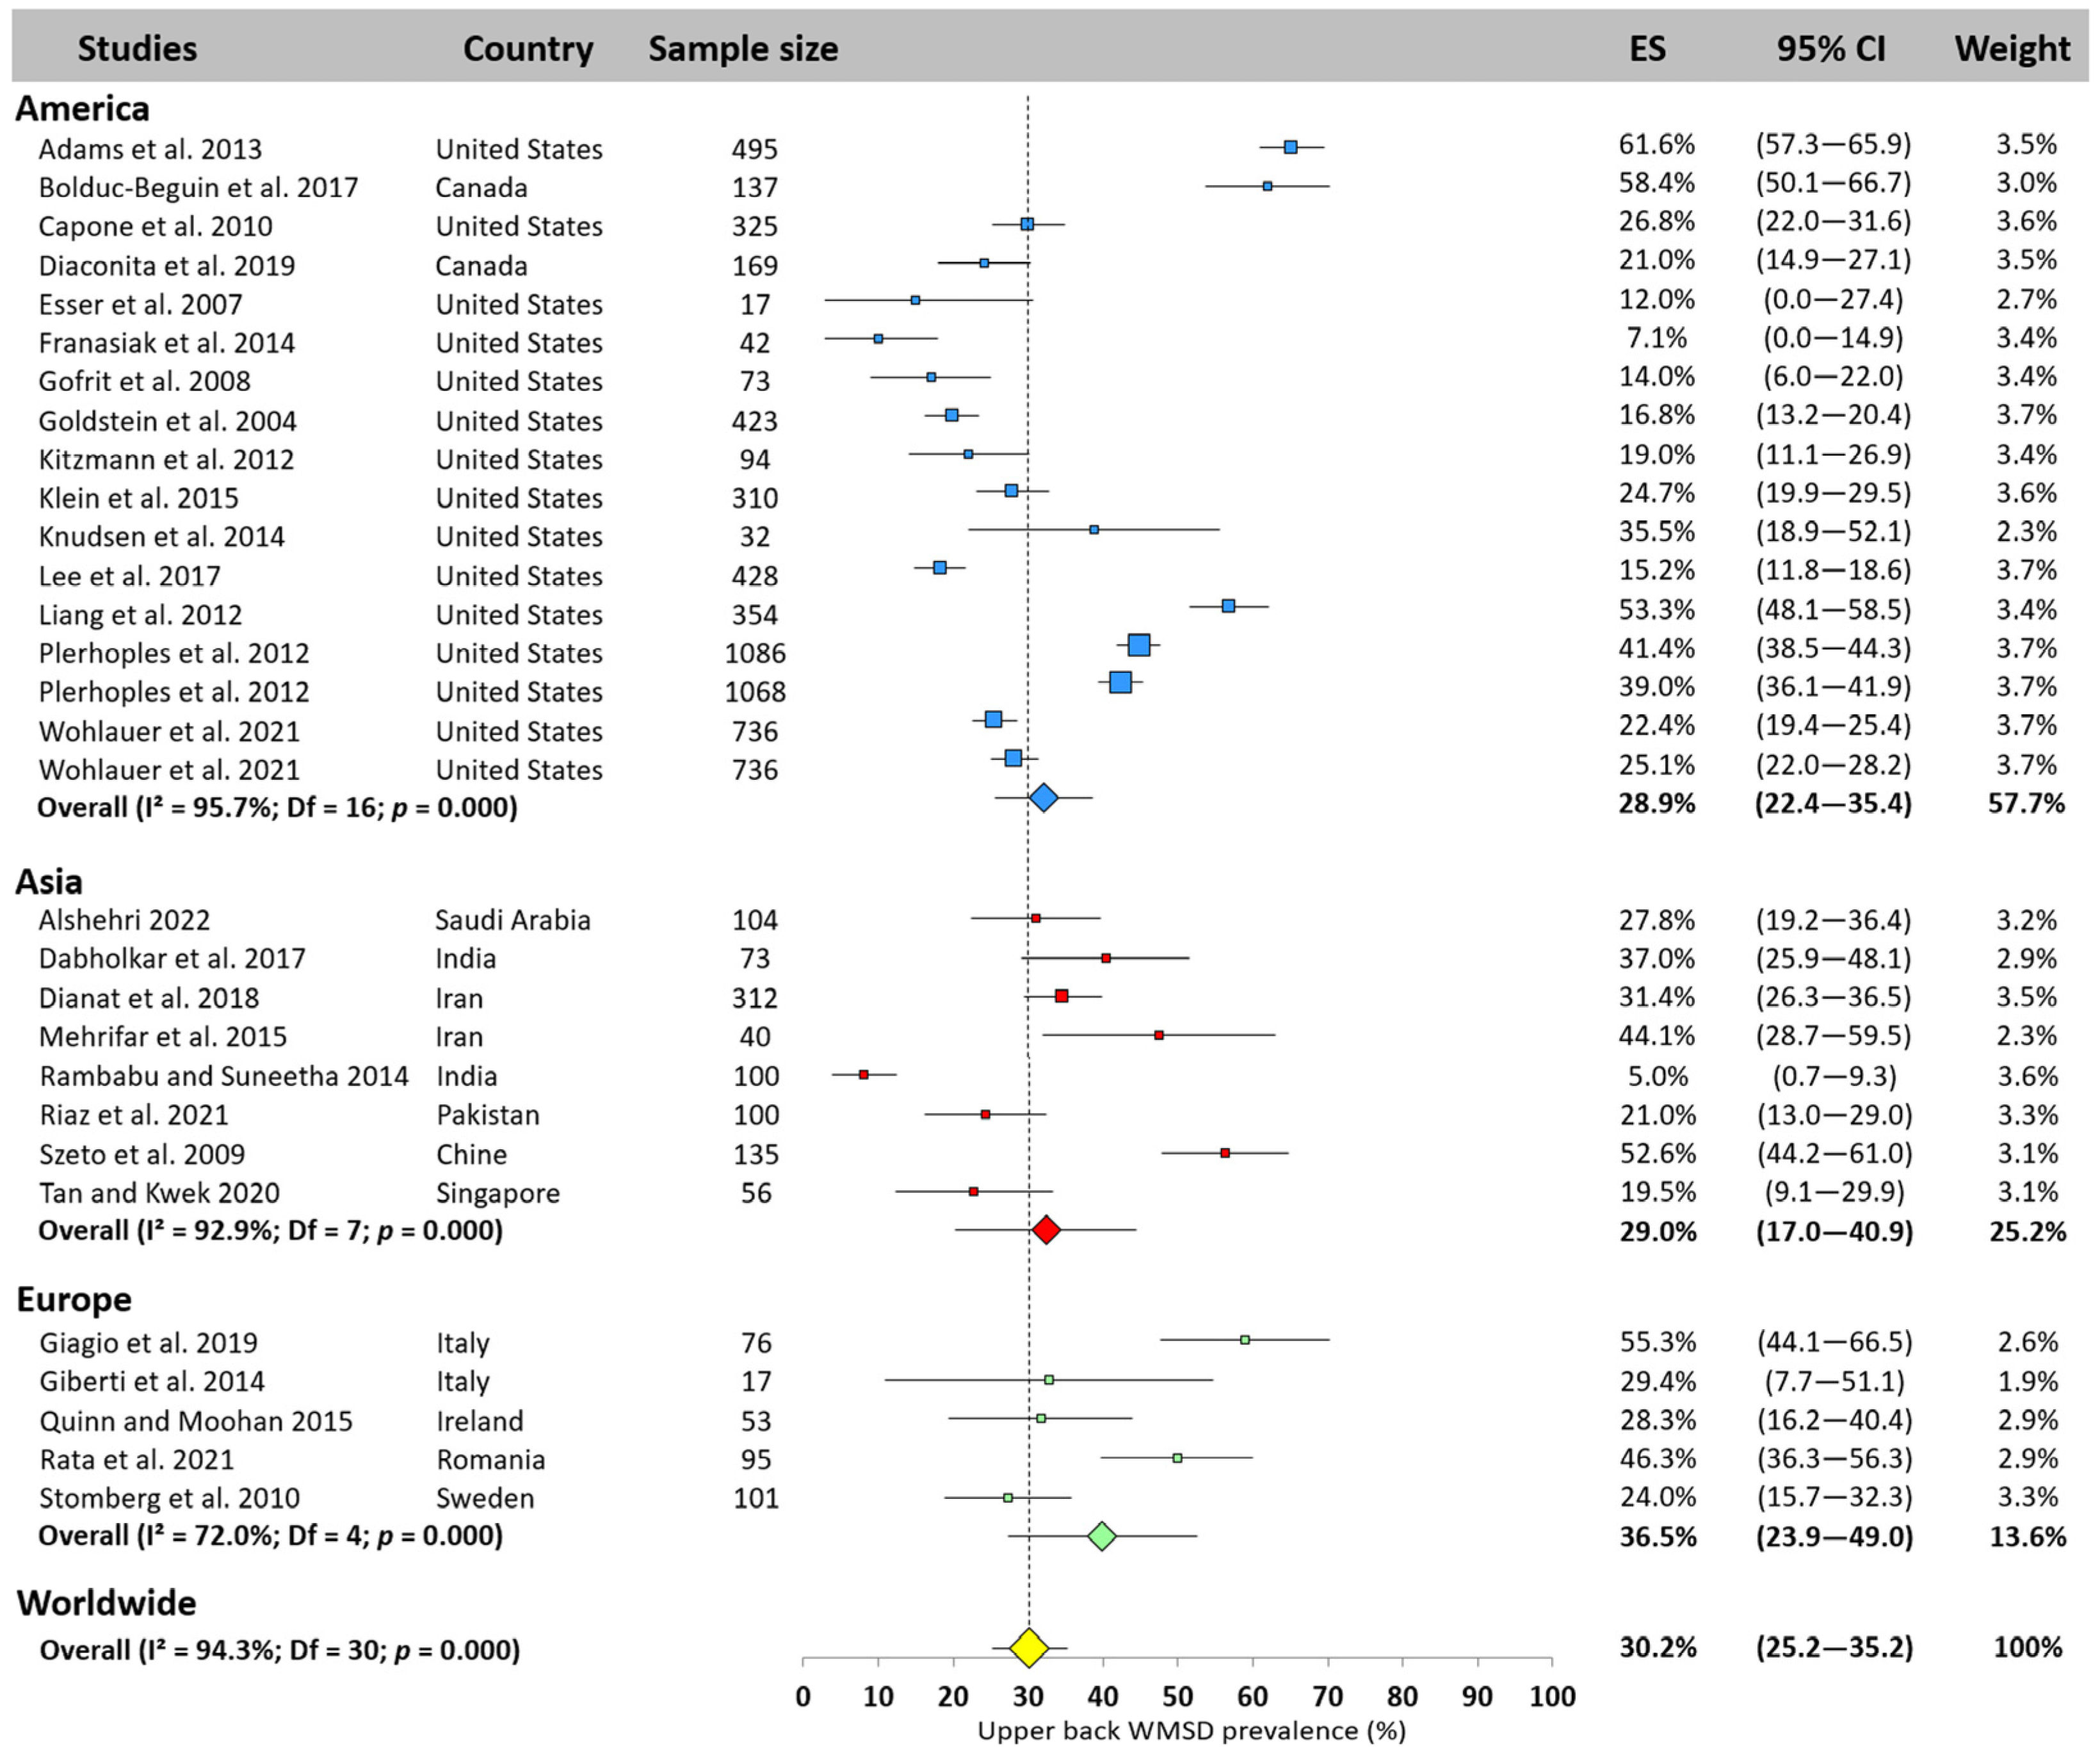
3.5.2. Upper Back
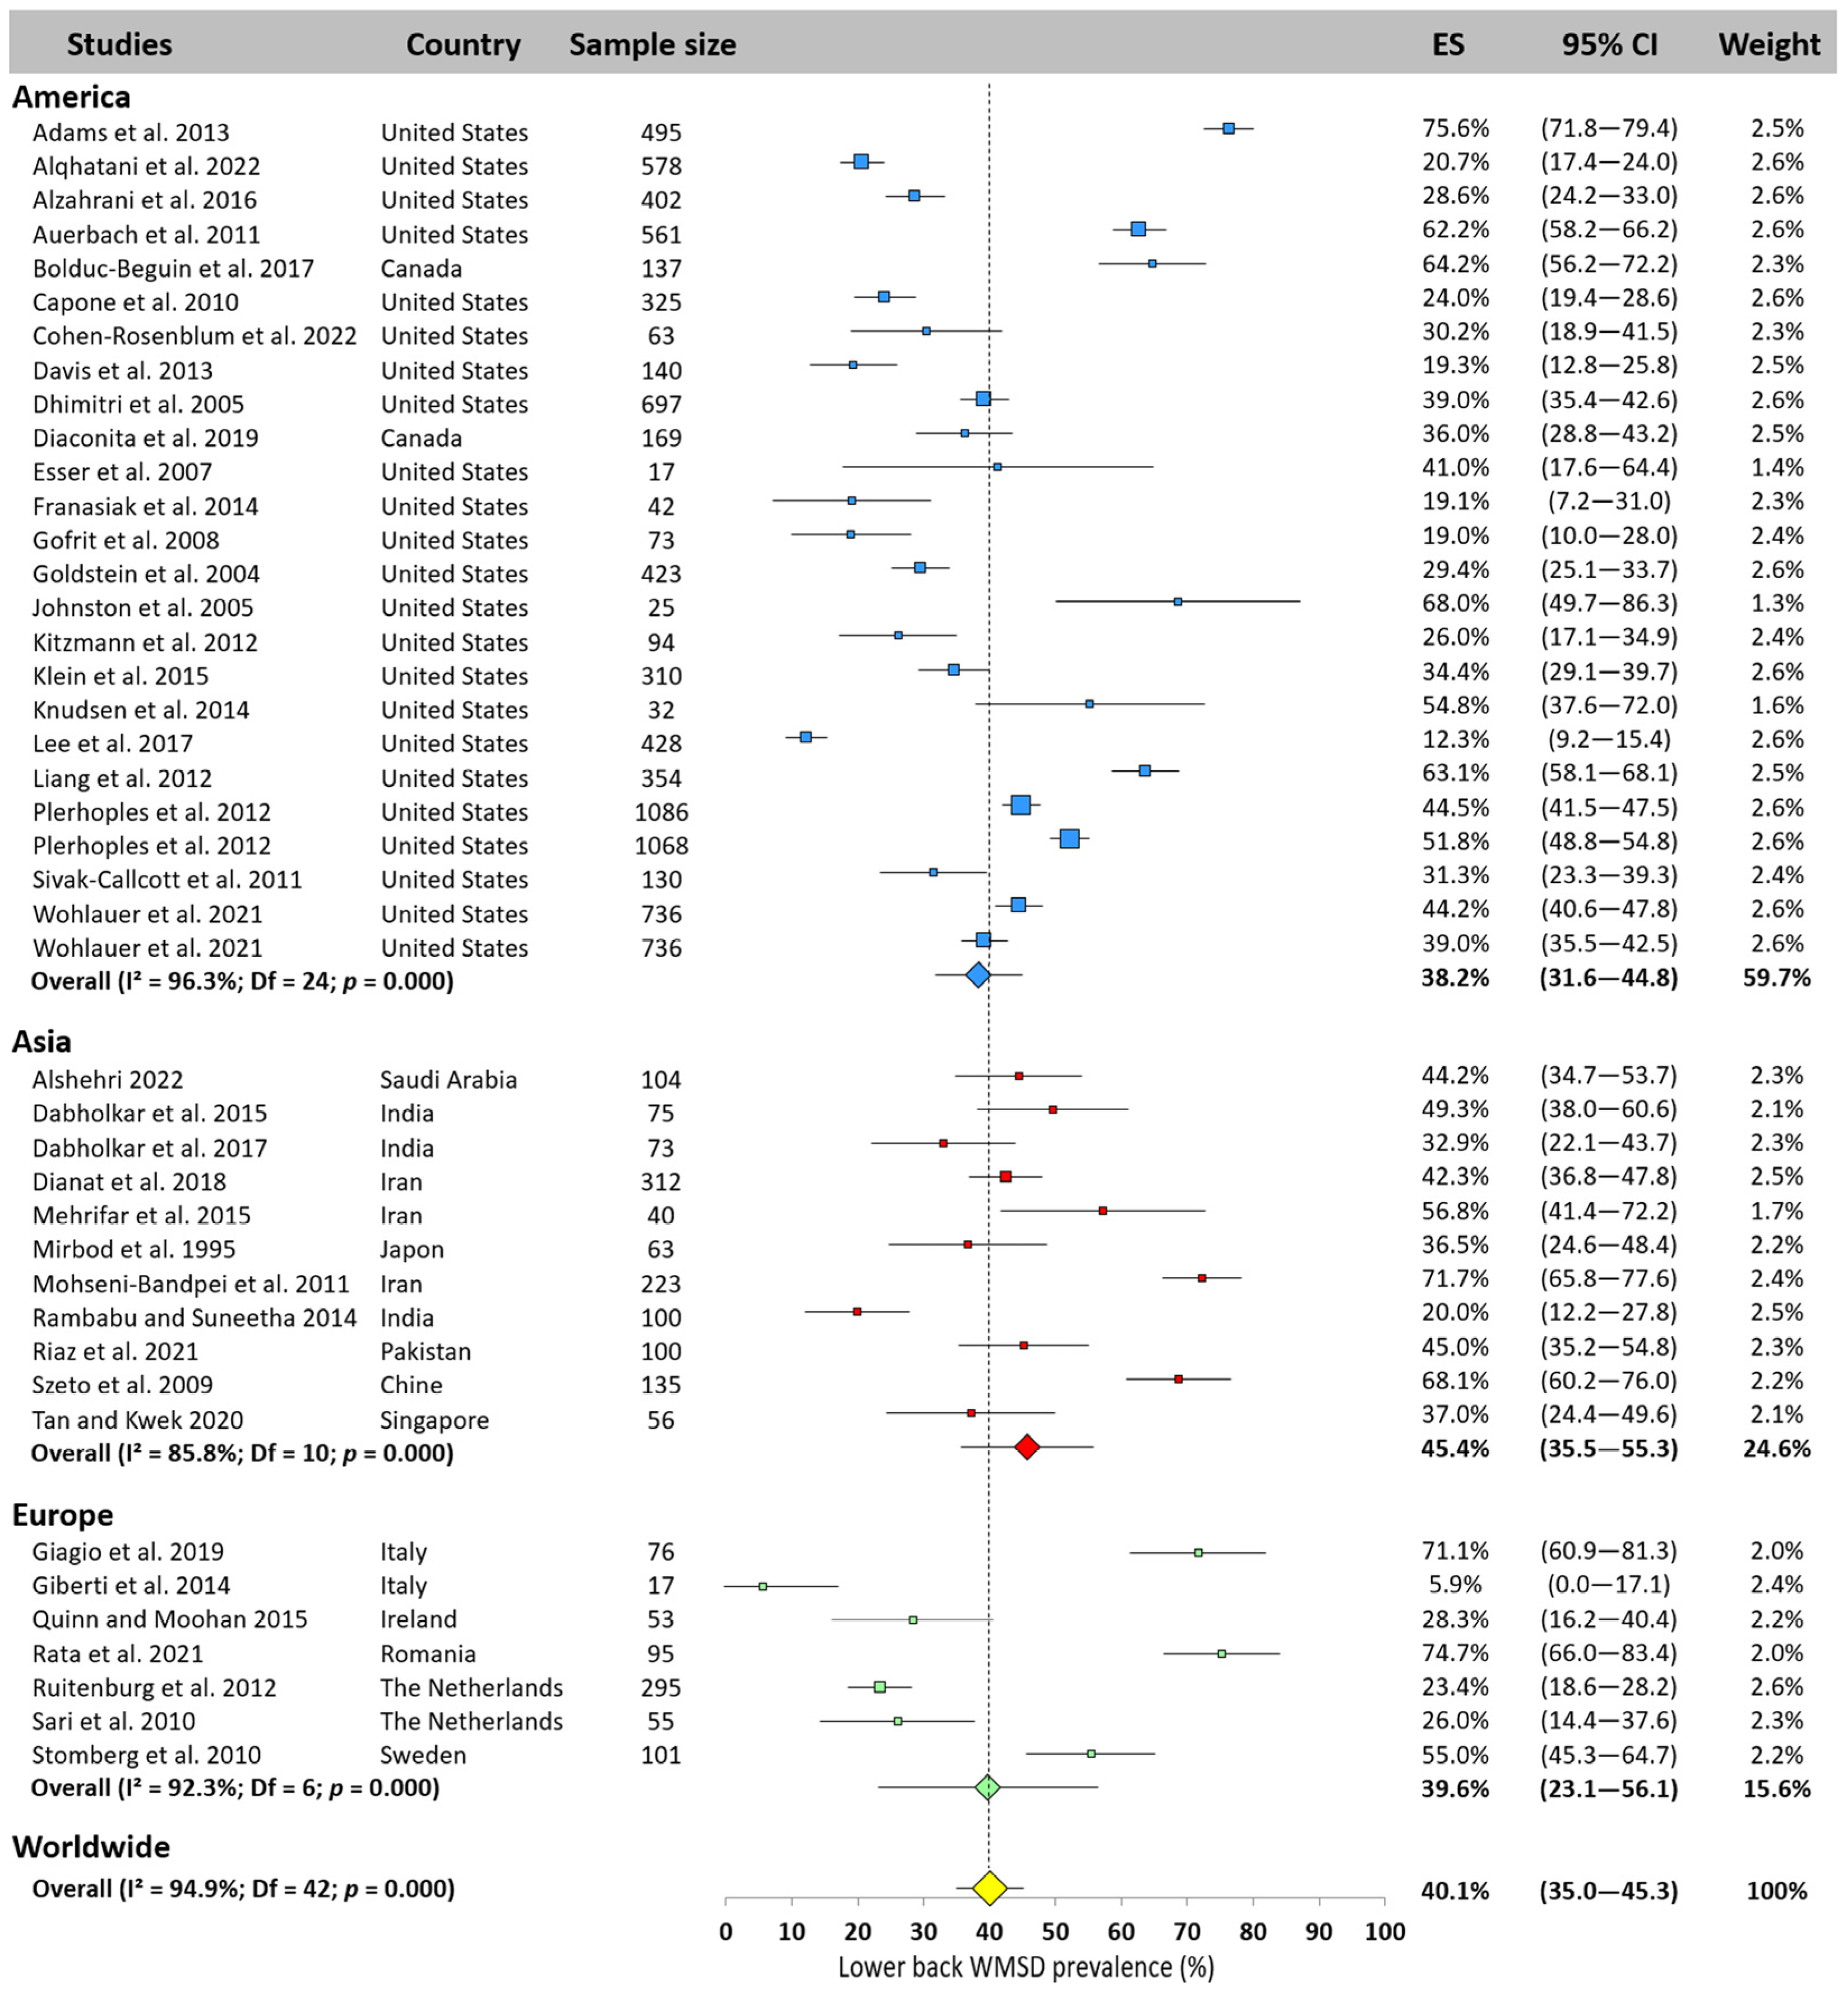
3.5.3. Lower Back
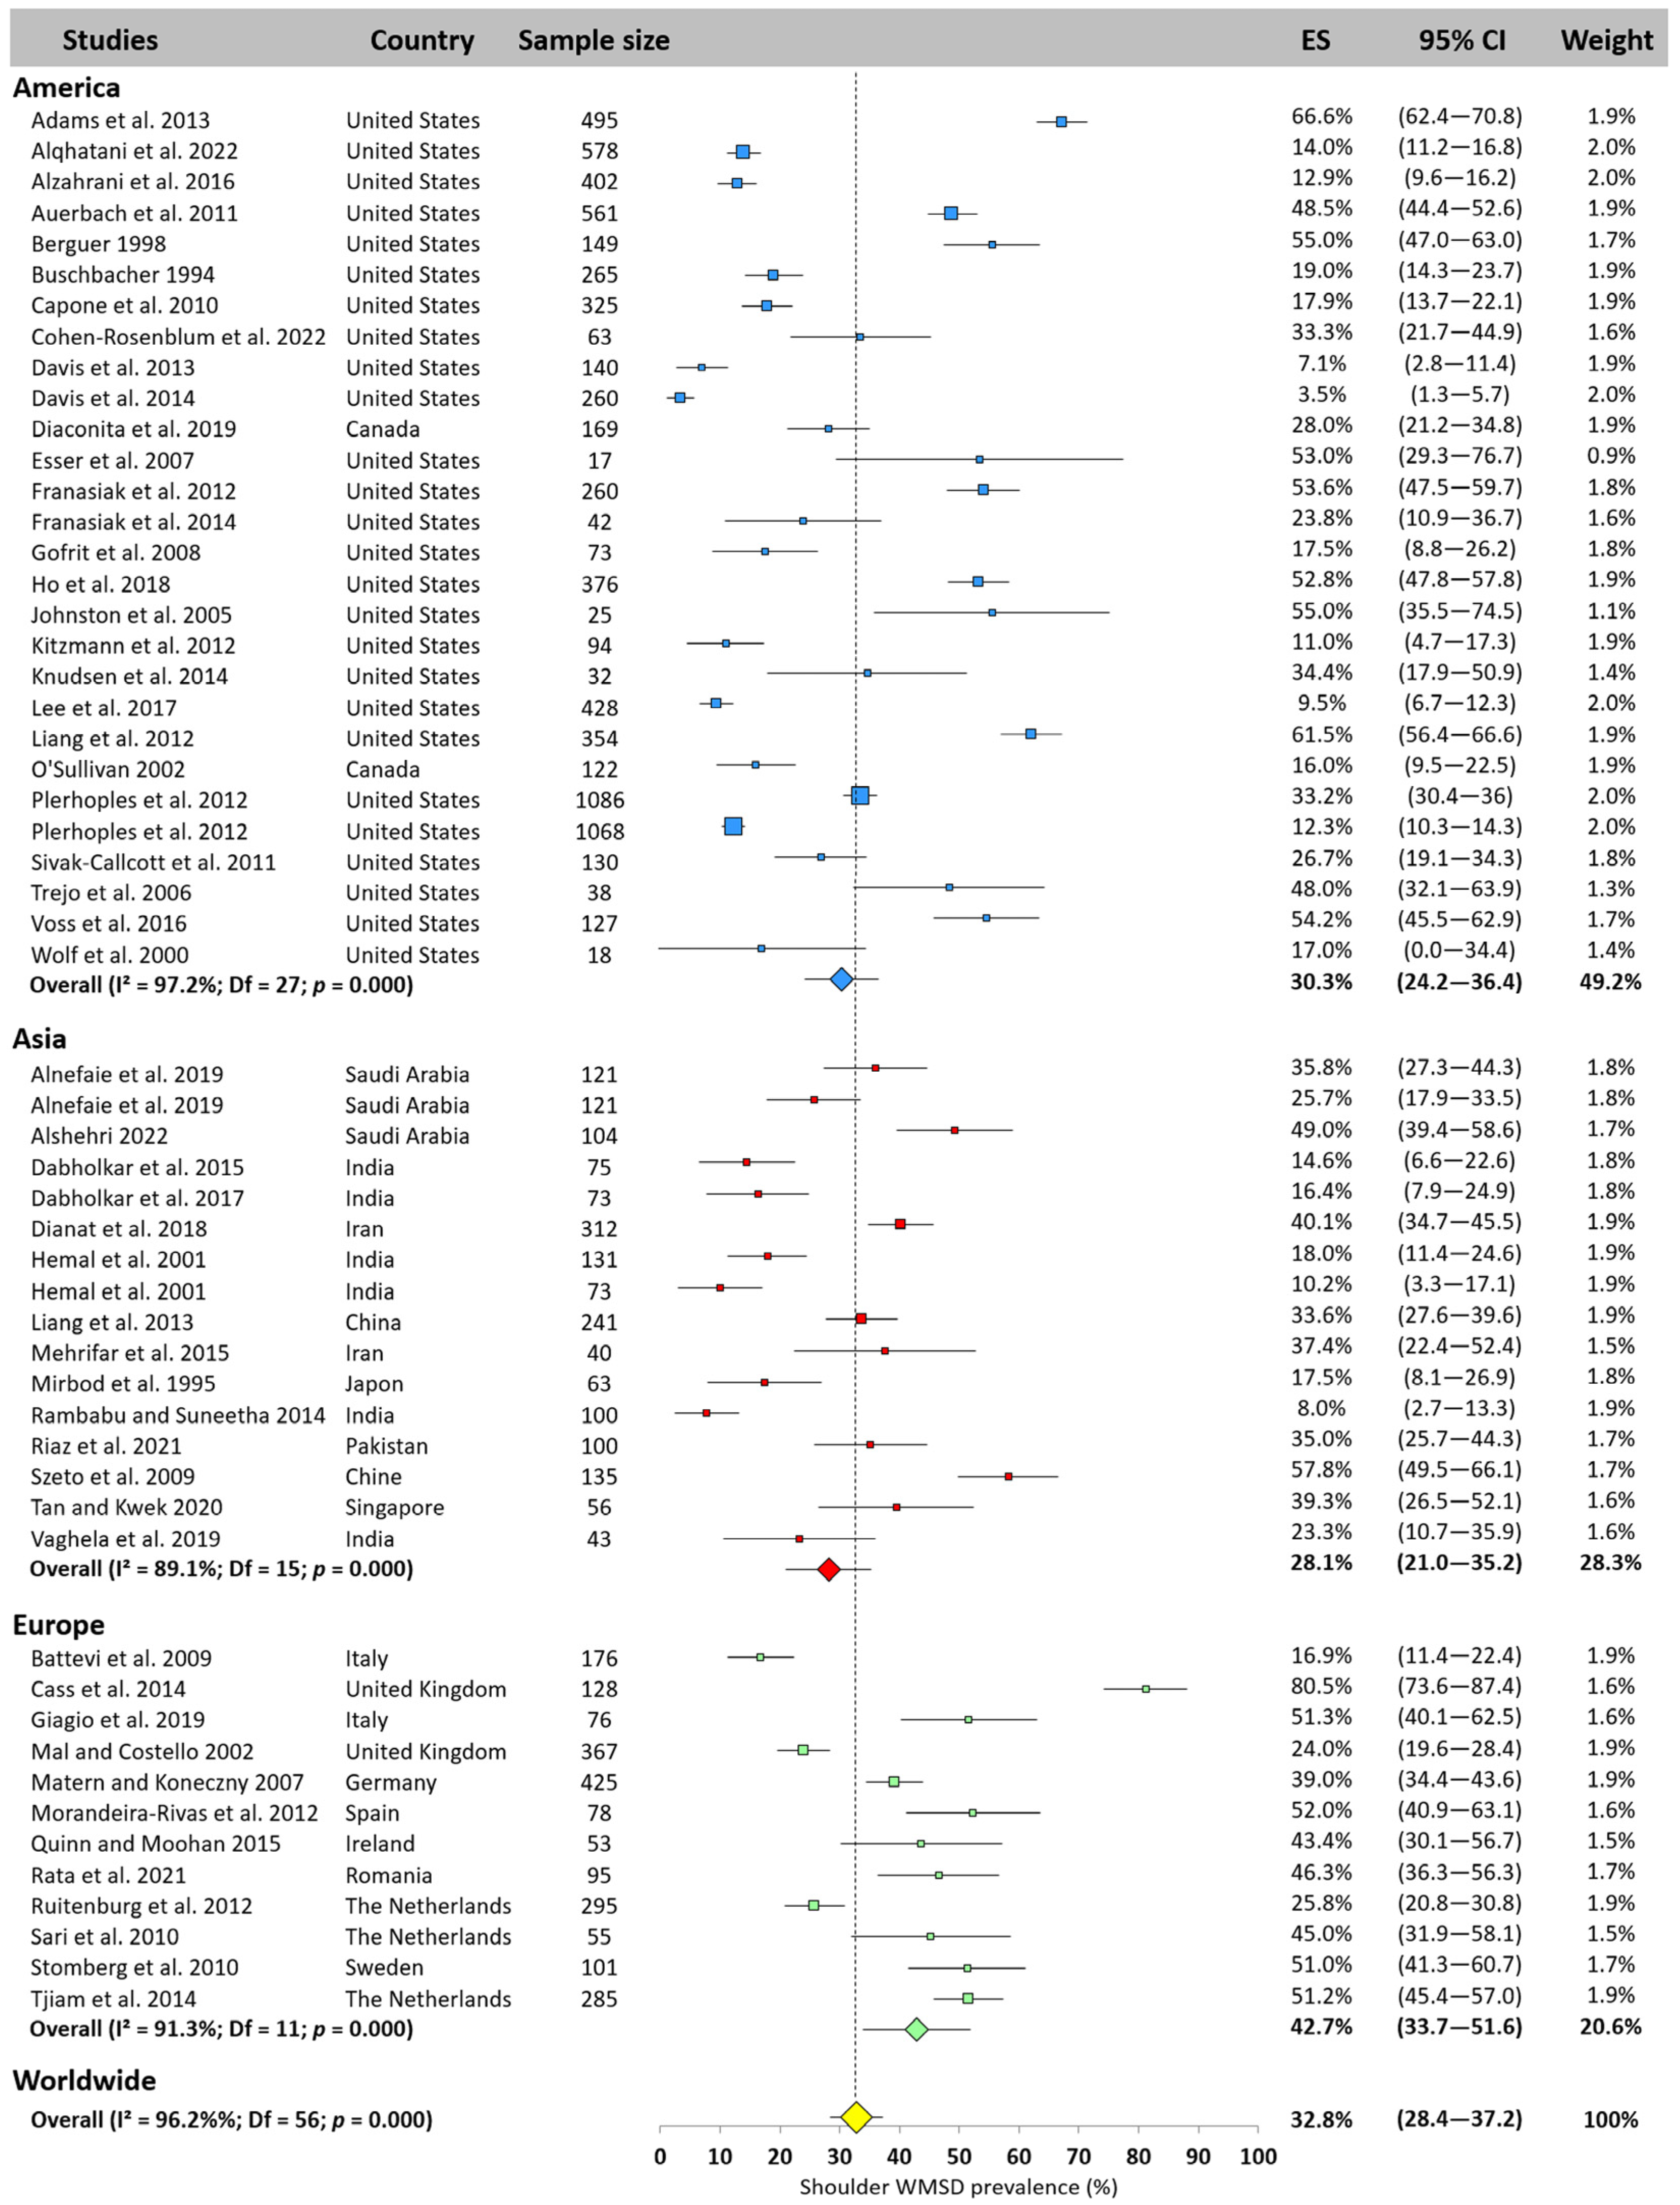
3.5.4. Shoulder
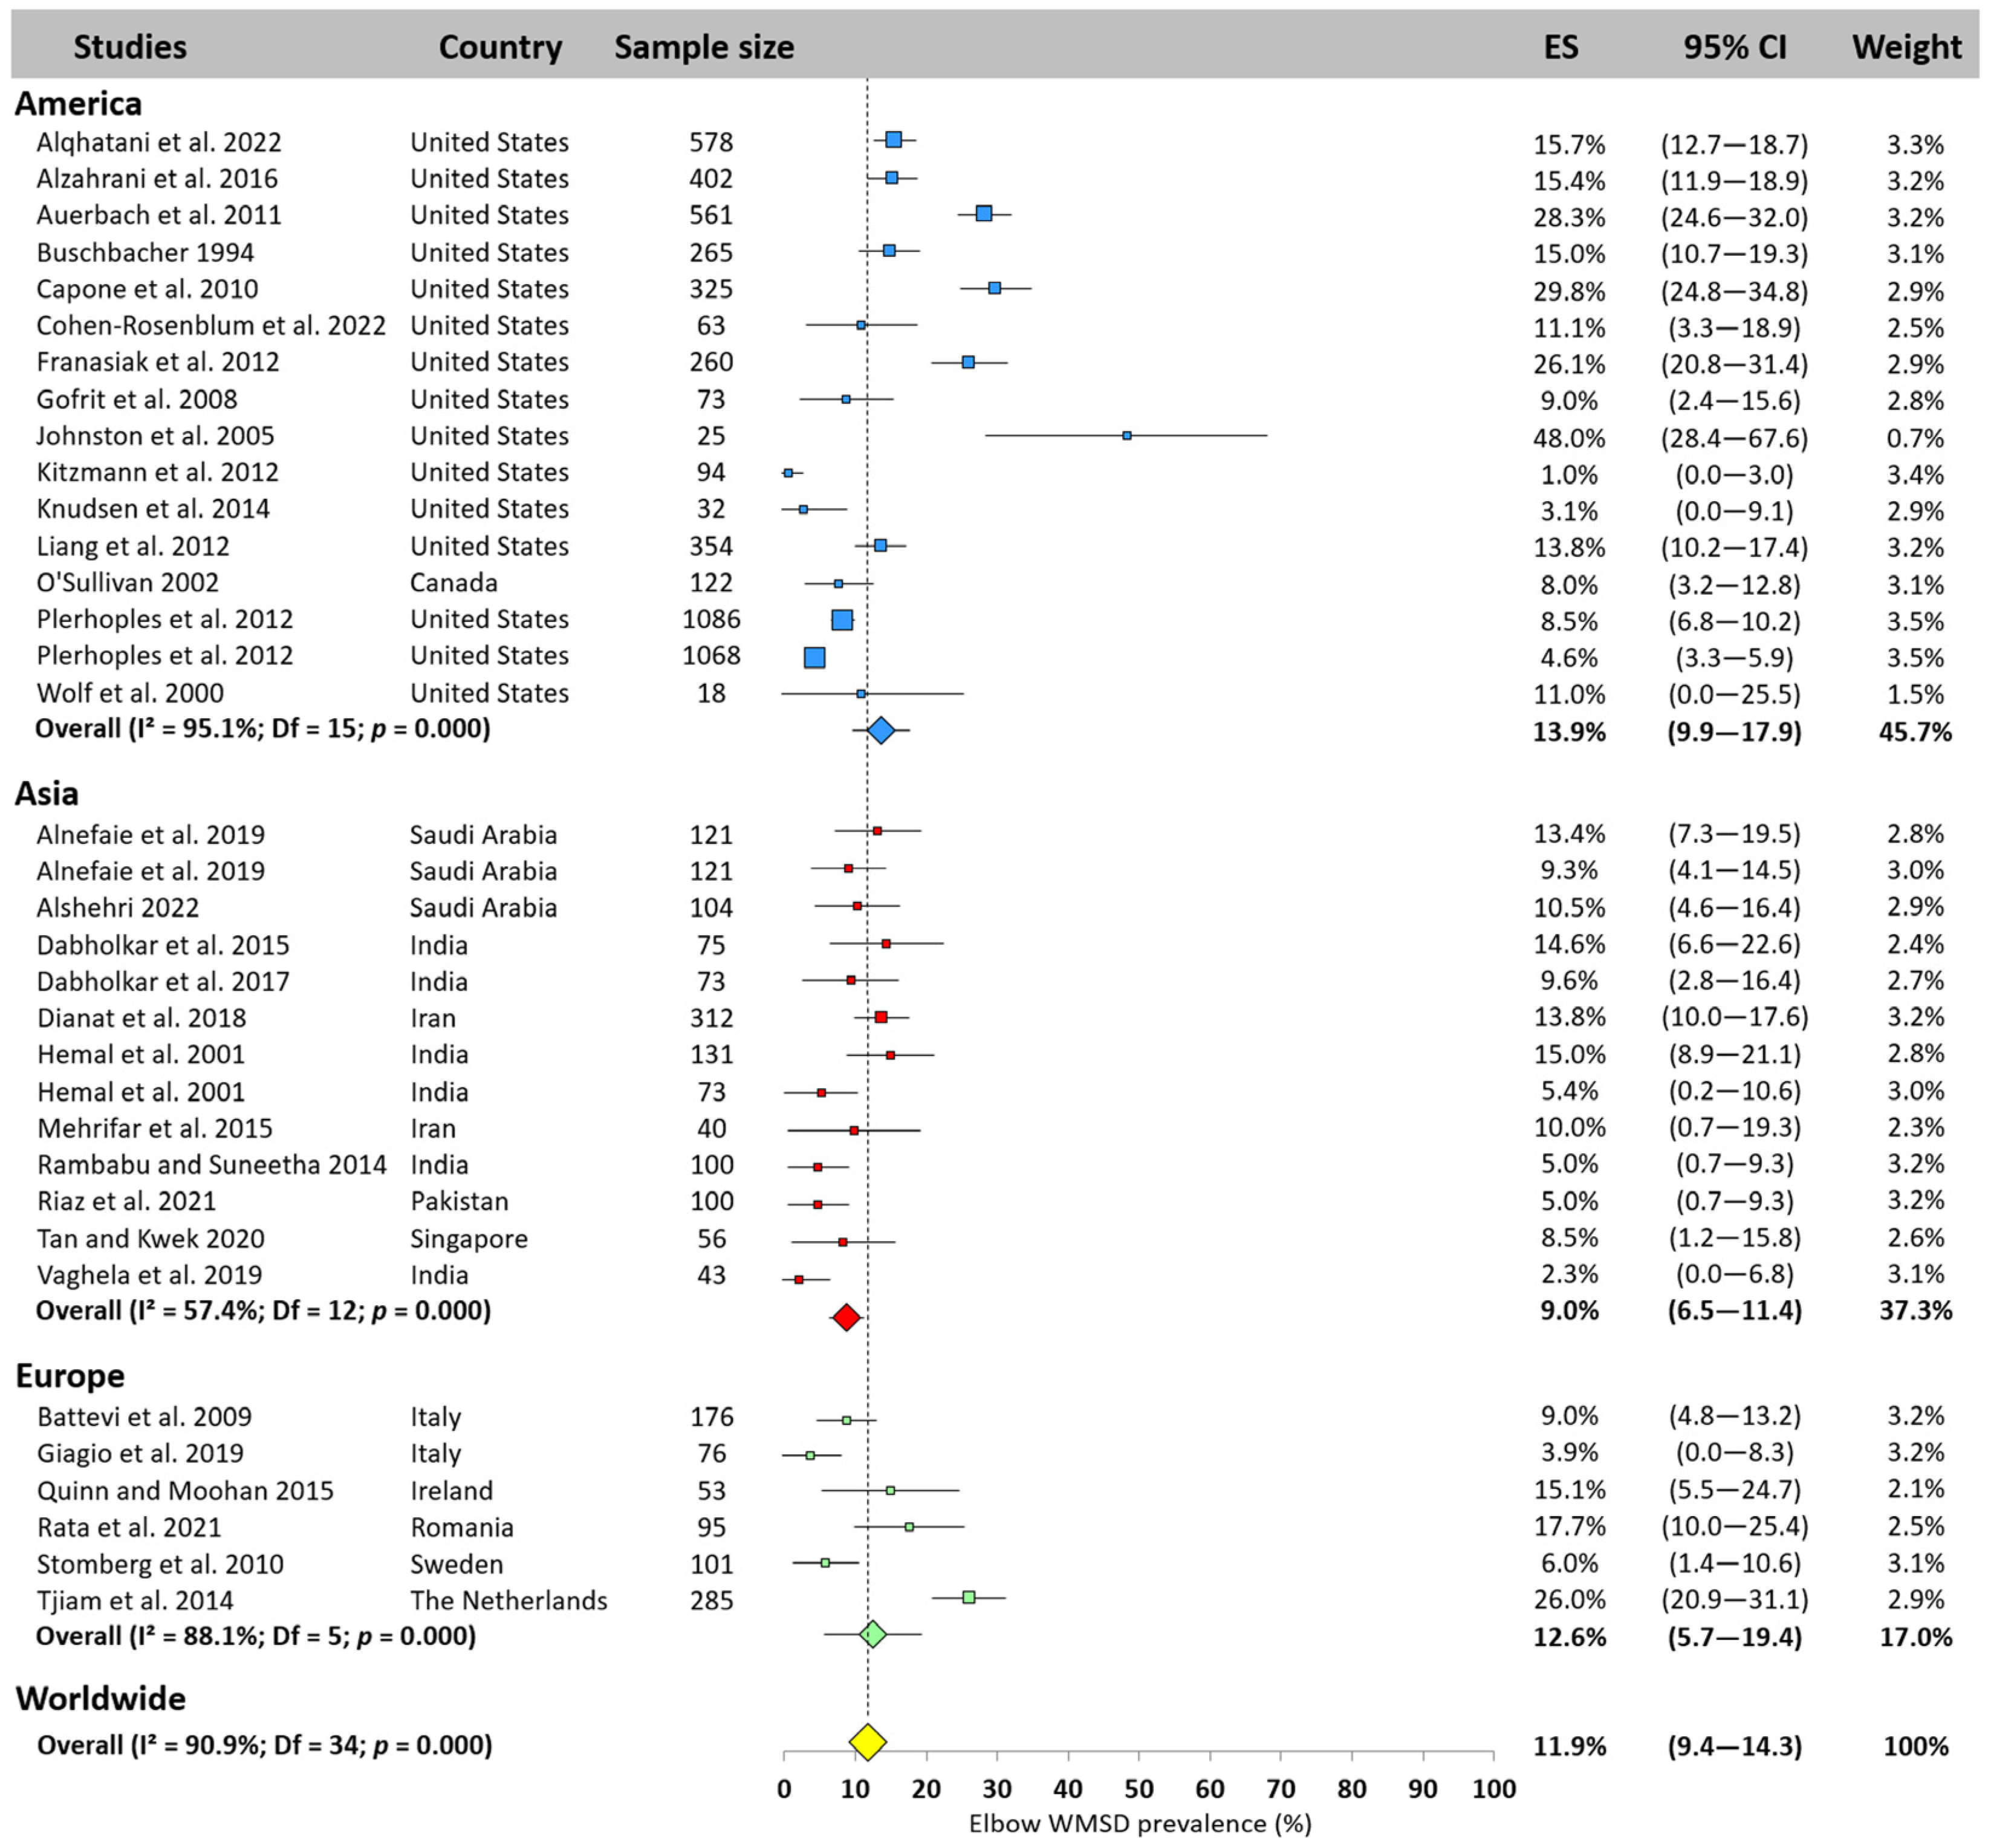
3.5.5. Elbow
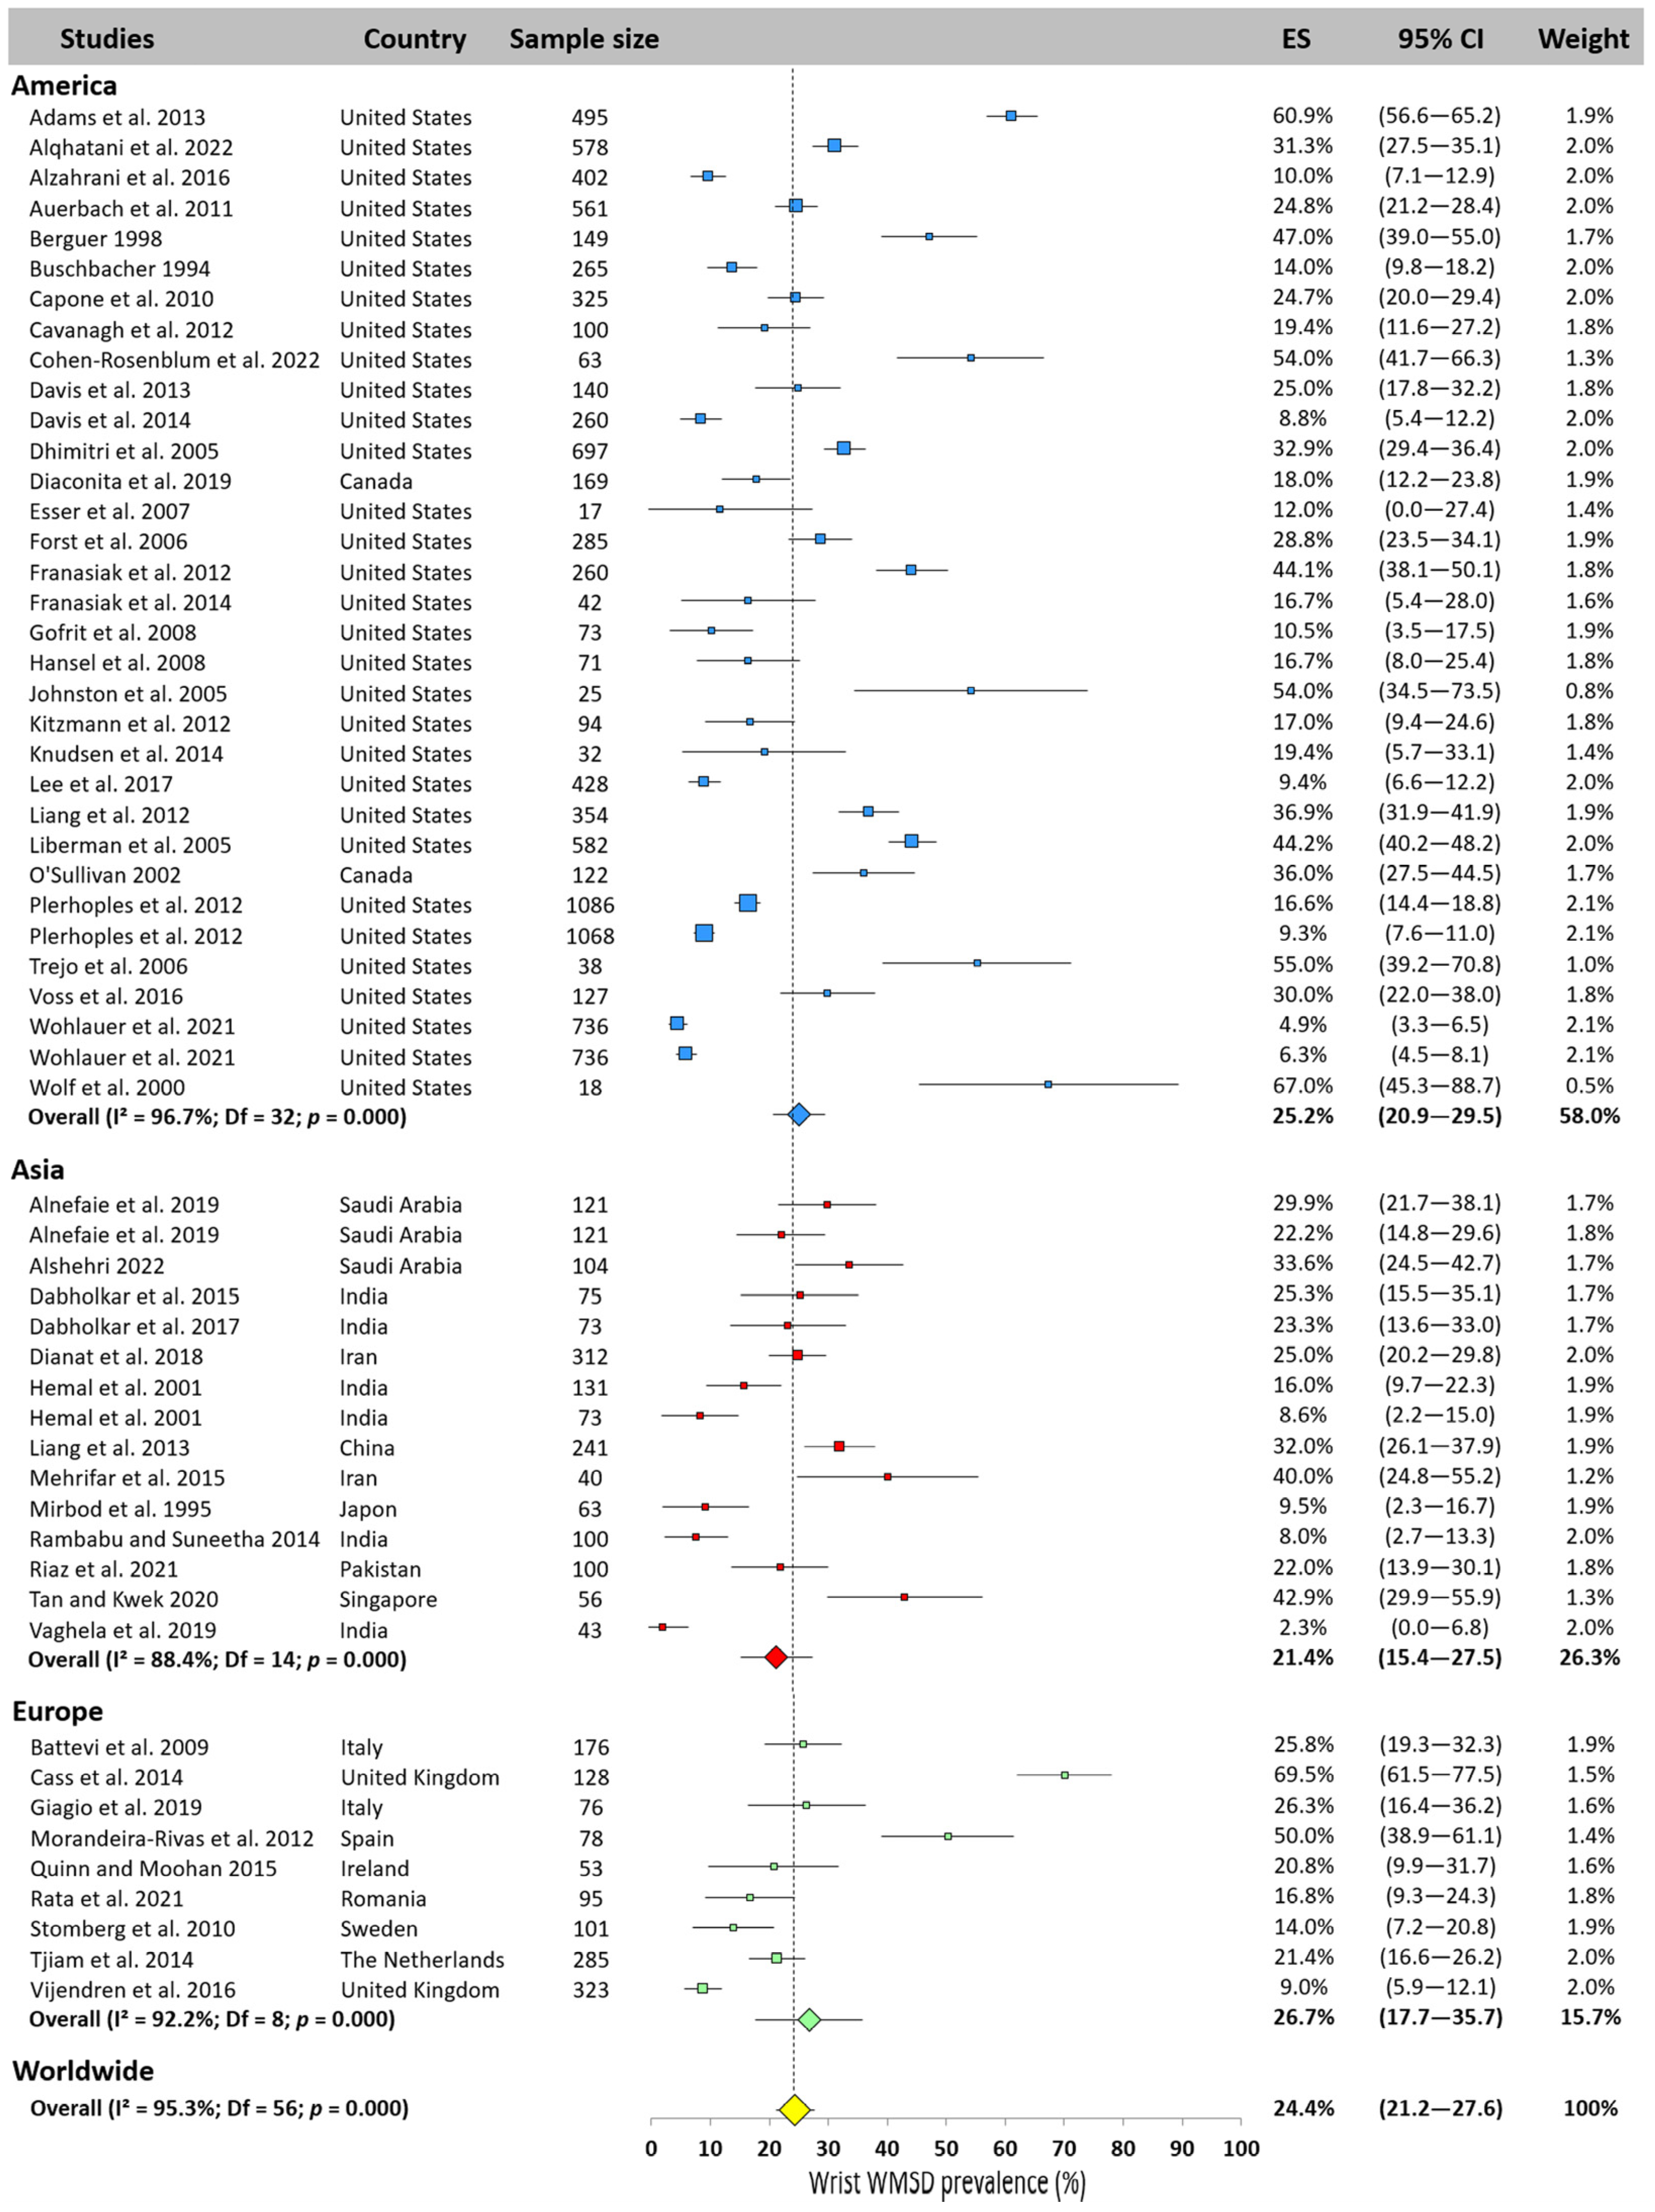
3.5.6. Wrist
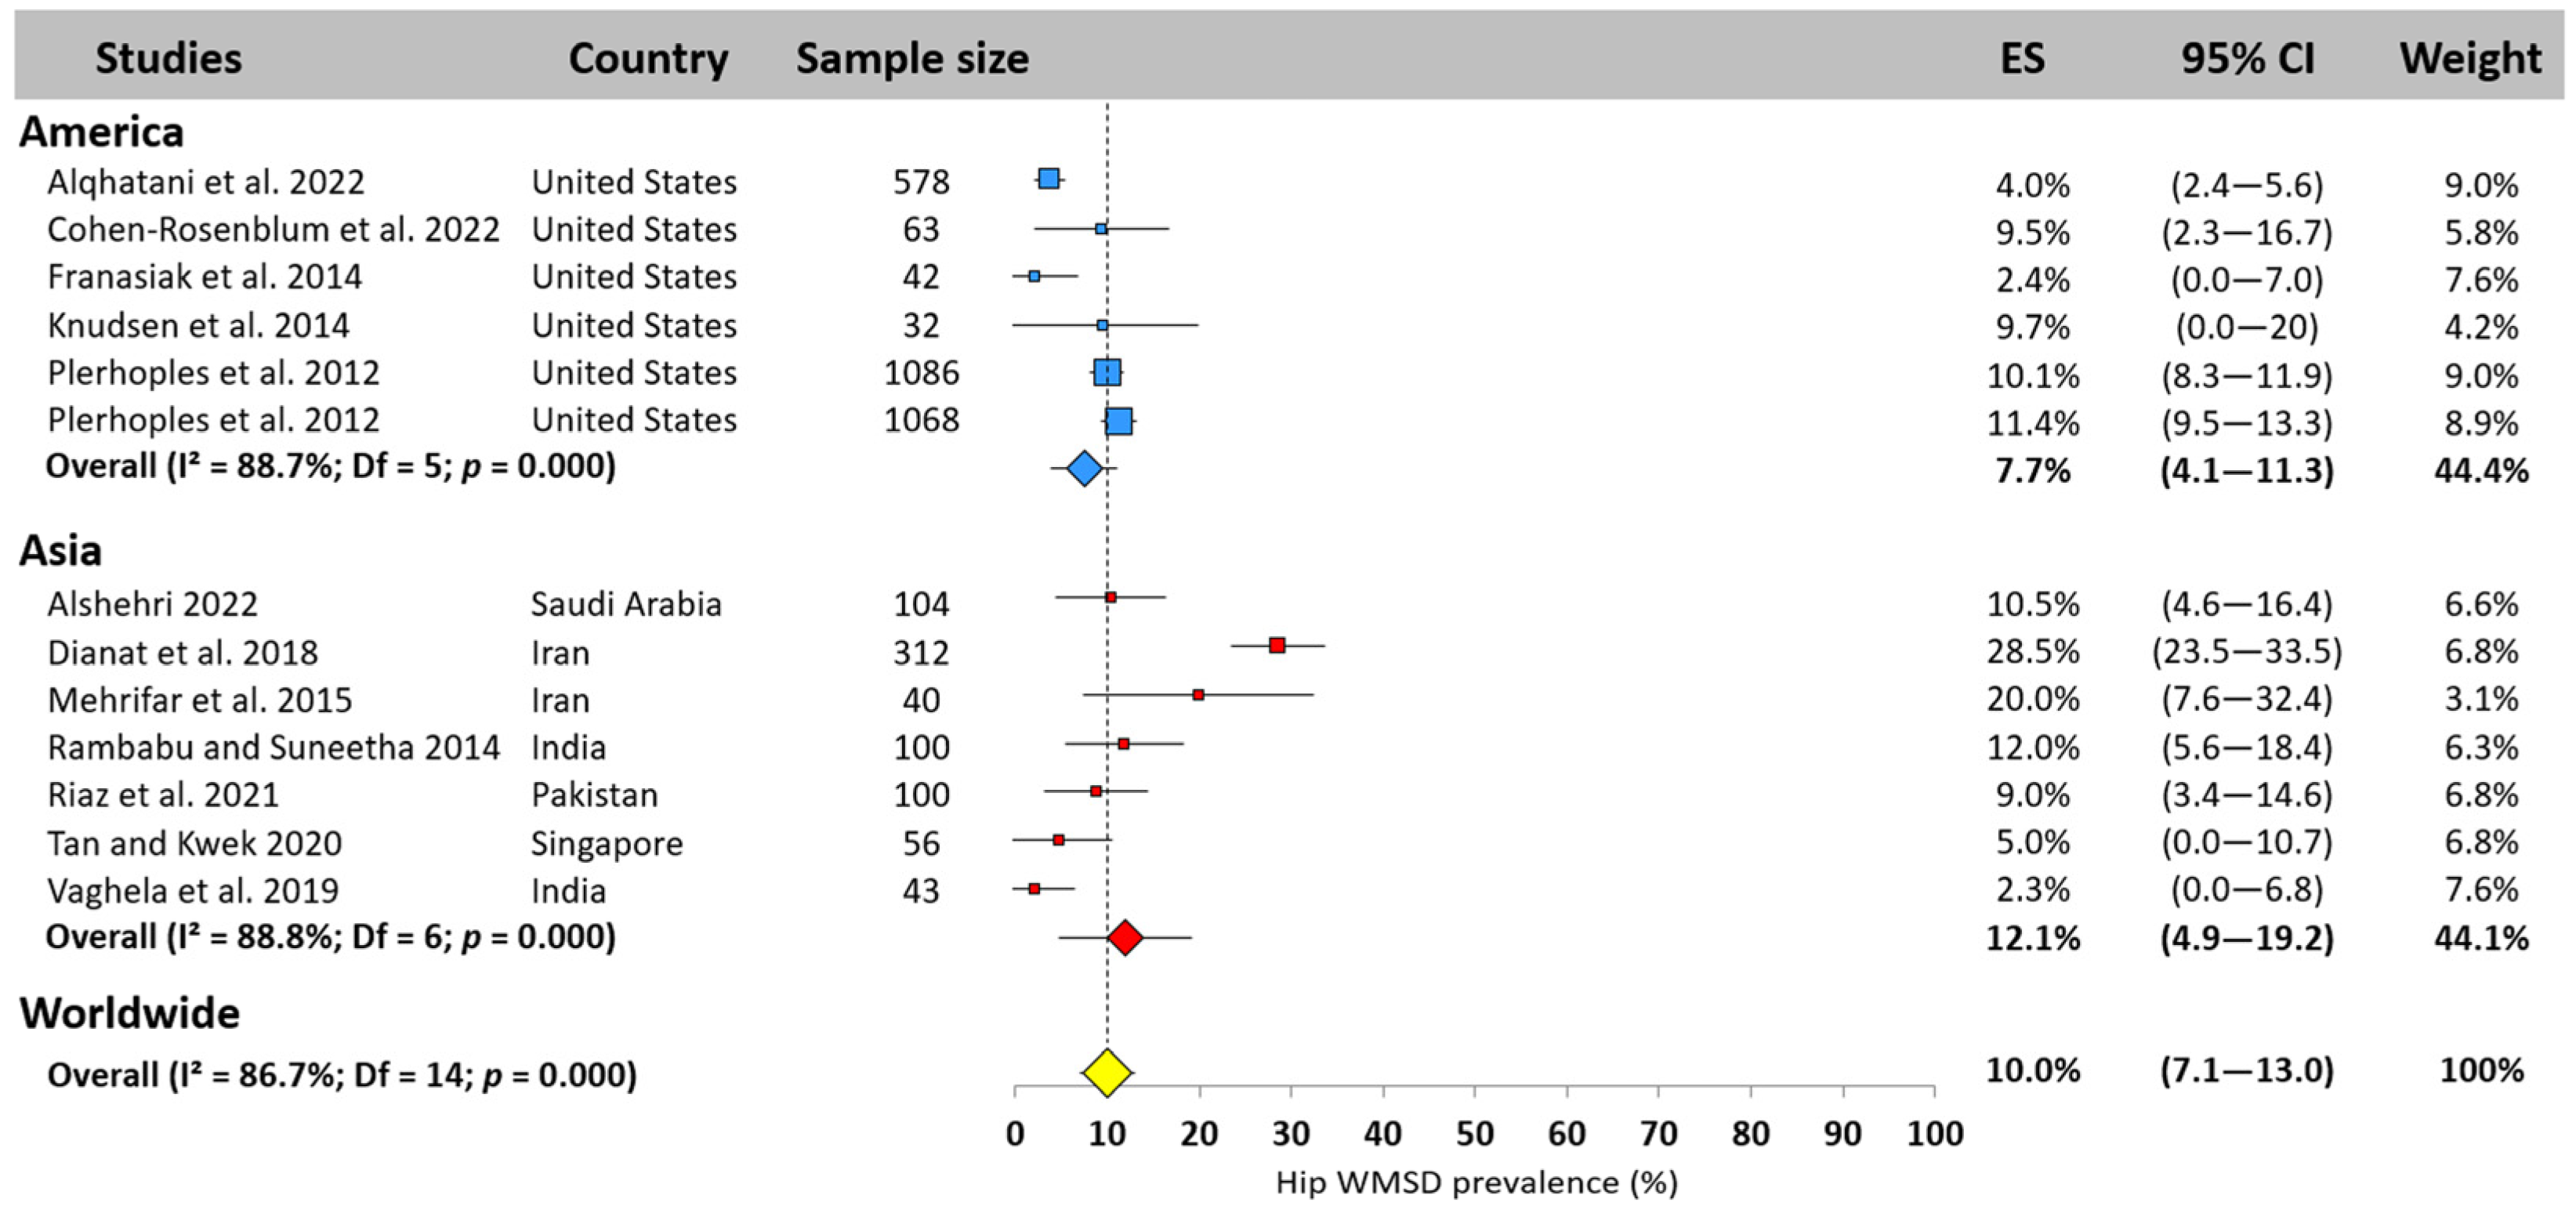
3.5.7. Hip
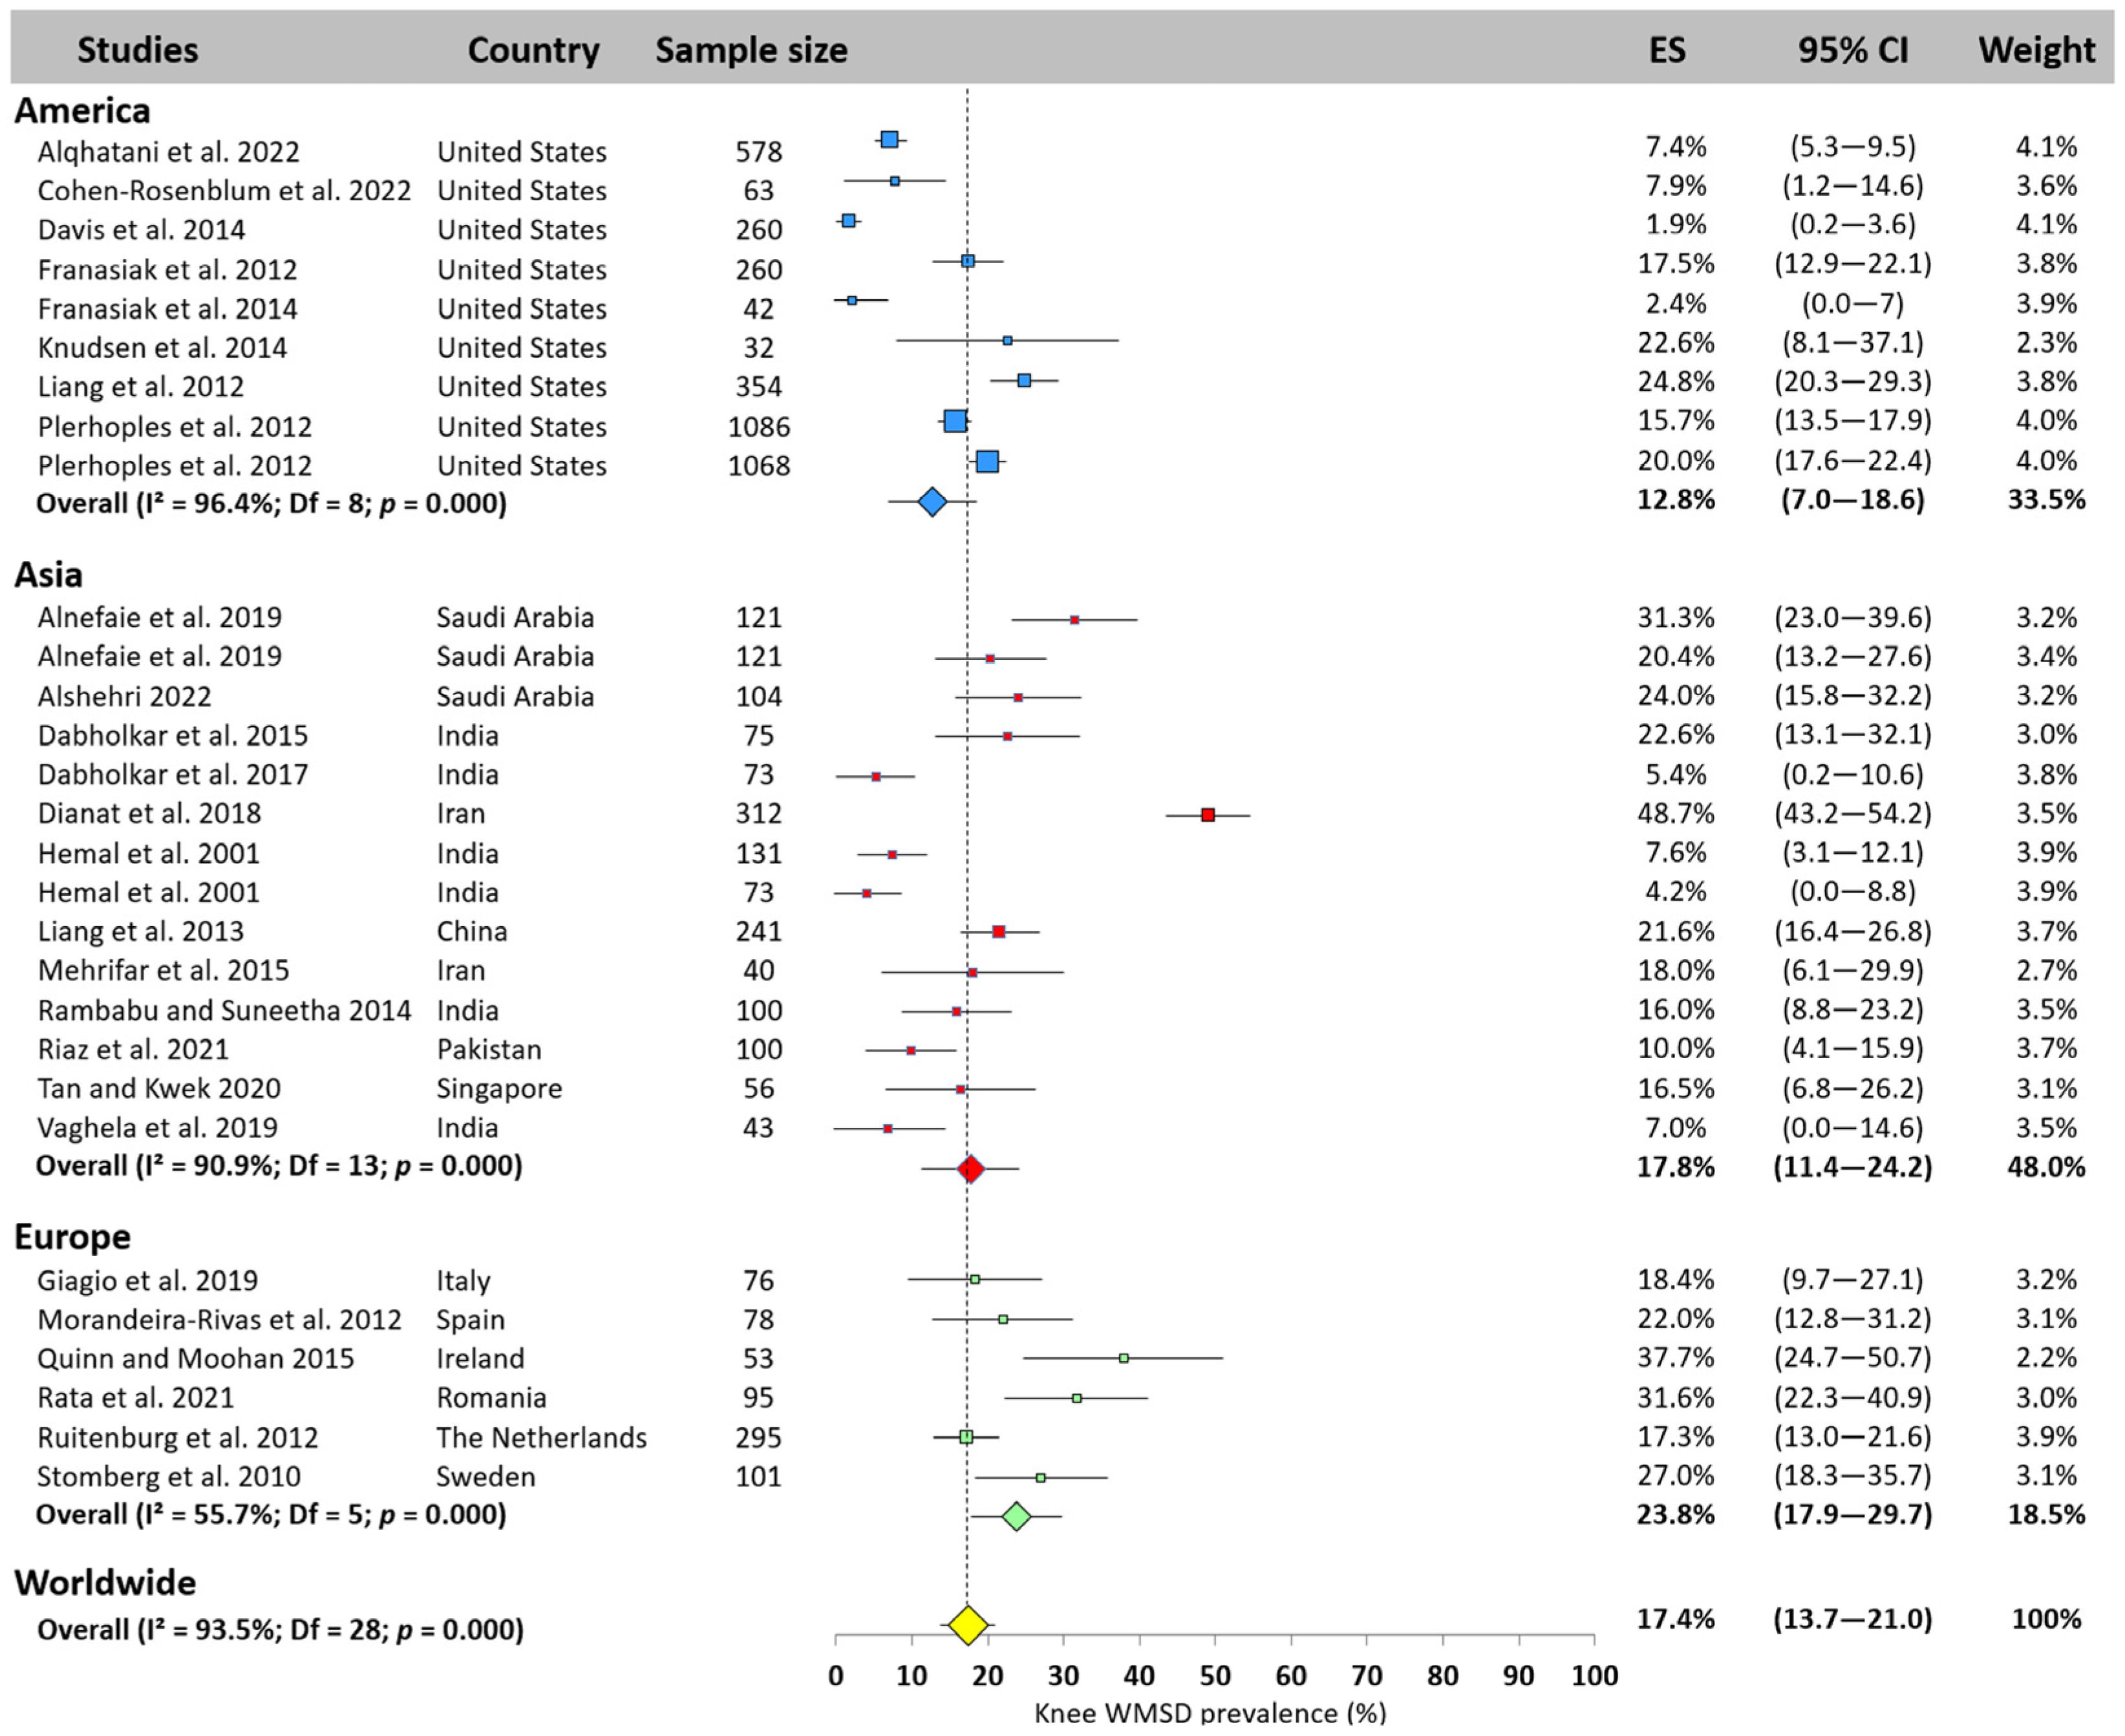
3.5.8. Knee
3.5.9. Ankle
3.6. Meta-Regression
4. Discussion
4.1. WMSD Prevalence—Overall and by Body Area
4.2. Age, Experience, and Year of Publication Effects on WMSD Prevalence
4.3. Limitations and Recommendations for Future Works
5. Conclusions
Author Contributions
Funding
Institutional Review Board Statement
Informed Consent Statement
Data Availability Statement
Conflicts of Interest
Abbreviations
| WMSDs | Work-related musculoskeletal disorders |
| AXIS | Tool for evaluating cross-sectional studies |
| BMI | Body mass index |
| PRISMA | Preferred Reporting Items for Systematic reviews and Meta-Analyses |
References
- Anderson, S.P.; Oakman, J. Allied Health Professionals and Work-Related Musculoskeletal Disorders: A Systematic Review. Saf. Health Work 2016, 7, 259–267. [Google Scholar] [CrossRef] [PubMed]
- Punnett, L.; Wegman, D.H. Work-related musculoskeletal disorders: The epidemiologic evidence and the debate. J. Electromyogr. Kinesiol. 2004, 14, 13–23. [Google Scholar] [CrossRef] [PubMed]
- Voss, R.; Chiang, Y.-J.; Cromwell, K.; Urbauer, D.; Lee, J.; Cormier, J.; Stucky, C.-C. Do No Harm, Except to Ourselves? A Survey of Symptoms and Injuries in Oncologic Surgeons and Pilot Study of an Intraoperative Ergonomic Intervention. J. Am. Coll. Surg. 2016, 224, 16–25. [Google Scholar] [CrossRef]
- Dabholkar, T.Y.; Yardi, S.S.; Dabholkar, Y.G.; Khanvilkar, A.V. Work Related Musculoskeletal Disorders in Surgeons Performing Minimal Invasive Procedures in Mumbai & Navi Mumbai India. Int. J. Health Sci. Res. 2015, 5, 347–355. [Google Scholar]
- Gorce, P.; Jacquier-Bret, J. Effect of assisted surgery on work-related musculoskeletal disorder prevalence by body area among surgeons: Systematic review and meta-analysis. Int. J. Environ. Res. Public Health 2023, 20, 6419. [Google Scholar] [CrossRef] [PubMed]
- Droeze, E.; Jonsson, H. Evaluation of ergonomic interventions to reduce musculoskeletal disorders of dentists in the Netherlands. Work 2005, 25, 211–220. [Google Scholar] [CrossRef]
- Berguer, R.; Rab, G.T.; Abu-Ghaida, H.; Alarcon, A.; Chung, J. A comparison of surgeons’ posture during laparoscopic and open surgical procedures. Surg. Endosc. 1997, 11, 139–142. [Google Scholar] [CrossRef]
- Alexopoulos, E.; Stathi, I.-C.; Charizani, F. Prevalence of musculoskeletal disorders in dentists. BMC Musculoskelet. Disord. 2004, 5, 16. [Google Scholar] [CrossRef]
- Kierklo, A.; Kobus, A.; Jaworska, M.M.; Botuliński, B. Work-related musculoskeletal disorders among dentists—A questionnaire survey. Ann. Agric. Environ. Med. 2011, 18, 79–84. [Google Scholar]
- Adams, S.; Hacker, M.; McKinney, J.; Elkadry, E.; Rosenblatt, P. Musculoskeletal Pain in Gynecologic Surgeons. J. Minim. Invasive Gynecol. 2013, 20, 656–660. [Google Scholar] [CrossRef]
- Giagio, S.; Volpe, G.; Pillastrini, P.; Gasparre, G.; Frizziero, A.; Squizzato, F. A Preventive Program for Work-related Musculoskeletal Disorders Among Surgeons: Outcomes of a Randomized Controlled Clinical Trial. Ann. Surg. 2019, 270, 969–975. [Google Scholar] [CrossRef] [PubMed]
- Cass, G.K.S.; Vyas, S.; Akande, V. Prolonged laparoscopic surgery is associated with an increased risk of vertebral disc prolapse. J. Obstet. Gynaecol. 2014, 34, 74–78. [Google Scholar] [CrossRef]
- Wolf, J.S.; Marcovich, R.; Gill, I.S.; Sung, G.T.; Kavoussi, L.R.; Clayman, R.V.; McDougall, E.M.; Shalhav, A.; Dunn, M.D.; Afane, J.S.; et al. Survey of neuromuscular injuries to the patient and surgeon during urologic laparoscopic surgery. Urology 2000, 55, 831–836. [Google Scholar] [CrossRef] [PubMed]
- Cohen-Rosenblum, A.R.; Varady, N.H.; Leonovicz, O.; Chen, A.F. Repetitive Musculoskeletal Injuries: A Survey of Female Adult Reconstruction Surgeons. J. Arthroplast. 2022, 37, 1474–1477.e1476. [Google Scholar] [CrossRef] [PubMed]
- Auerbach, J.; Weidner, Z.; Milby, A.; Diab, M.; Lonner, B. Musculoskeletal Disorders Among Spine Surgeons Results of a Survey of the Scoliosis Research Society Membership. Spine 2011, 36, E1715–E1721. [Google Scholar] [CrossRef]
- Mal, R.K.; Costello, C.H. Is shoulder impingement syndrome a problem in otolaryngologists? Clin. Otolaryngol. 2002, 27, 44–47. [Google Scholar] [CrossRef]
- Capone, A.C.; Parikh, P.M.; Gatti, M.E.; Davidson, B.J.; Davison, S.P. Occupational Injury in Plastic Surgeons. Plast. Reconstr. Surg. 2010, 125, 1555–1561. [Google Scholar] [CrossRef]
- Alqahtani, S.; Alzahrani, M.; Bicknell, R.; Pichora, D. Prevalence and factors of work-related musculoskeletal disorders among hand surgeons. World J. Orthop. 2022, 13, 465–471. [Google Scholar] [CrossRef]
- Hemal, A.; Srinivas, M.; Charles, A.R. Ergonomic Problems Associated with Laparoscopy. J. Endourol. 2001, 15, 499–503. [Google Scholar] [CrossRef]
- Plerhoples, T.A.; Hernandez-Boussard, T.; Wren, S.M. The aching surgeon: A survey of physical discomfort and symptoms following open, laparoscopic, and robotic surgery. J. Robot. Surg. 2012, 6, 65–72. [Google Scholar] [CrossRef]
- Stomberg, M.; Tronstad, S.-E.; Hedberg, K.; Bengtsson, J.; Jonsson, P.; Johansen, L.; Lindvall, B. Work-related Musculoskeletal Disorders When Performing Laparoscopic Surgery. Surg. Laparosc. Endosc. Percutan Tech. 2010, 20, 49–53. [Google Scholar] [CrossRef] [PubMed]
- Davis, W.T.; Fletcher, S.A.; Guillamondegui, O.D. Musculoskeletal occupational injury among surgeons: Effects for patients, providers, and institutions. J. Surg. Res. 2014, 189, 207–212.e6. [Google Scholar] [CrossRef]
- Rambabu, T.; Suneetha, K. Prevalence of Work Related Musculoskeletal Disorders Among Physicians, Surgeons and Dentists: A Comparative Study. Ann. Med. Res. 2014, 4, 578–582. [Google Scholar] [CrossRef] [PubMed]
- Vaghela, D.; Parekh, S.; Ganjiwale, D.; Mehta, J. Work-related musculoskeletal disorder among surgeons in Gujarat. J. Educ. Health Promot. 2019, 8, 248. [Google Scholar]
- Rata, A.; Sorin, B.; Garleanu, L.; Onofrei, R.R. Work-Related Musculoskeletal Complaints in Surgeons. Healthcare 2021, 9, 1482. [Google Scholar] [CrossRef]
- Tan, K.; Kwek, E.B.K. Musculoskeletal Occupational Injuries in Orthopaedic Surgeons and Residents. Malays. Orthop. J. 2020, 14, 24–27. [Google Scholar] [PubMed]
- Sun, W.; Yin, L.; Zhang, T.; Zhang, H.; Zhang, R.; Cai, W. Prevalence of Work-Related Musculoskeletal Disorders among Nurses: A Meta-Analysis. Iran J. Public Health 2023, 52, 463–475. [Google Scholar] [CrossRef]
- Heiden, B.; Weigl, M.; Angerer, P.; Muller, A. Association of age and physical job demands with musculoskeletal disorders in nurses. Appl. Ergon. 2013, 44, 652–658. [Google Scholar] [CrossRef]
- Gorce, P.; Jacquier-Bret, J. Work-Related Musculoskeletal Disorders Prevalence among American, Asian and European Surgeons during Robotic/Video-Assisted Surgery. Int. J. Phys. Med. Rehabil. 2023, 11, 1000689. [Google Scholar]
- Kuorinka, I.; Jonsson, B.; Kilbom, A.; Vinterberg, H.; Biering-Sørensen, F.; Andersson, G.; Jørgensen, K. Standardised Nordic questionnaires for the analysis of musculoskeletal symptoms. Appl. Ergon. 1987, 18, 233–237. [Google Scholar] [CrossRef]
- Downes, M.J.; Brennan, M.L.; Williams, H.C.; Dean, R.S. Development of a critical appraisal tool to assess the quality of cross-sectional studies (AXIS). BMJ Open 2016, 6, e011458. [Google Scholar] [CrossRef] [PubMed]
- Hermanson, J.E.; Choi, S.D. Study of musculoskeletal risks of the office-based surgeries. Work 2012, 41, 1940–1943. [Google Scholar] [CrossRef] [PubMed]
- Neyeloff, J.L.; Fuchs, S.C.; Moreira, L.B. Meta-analyses and Forest plots using a microsoft excel spreadsheet: Step-by-step guide focusing on descriptive data analysis. BMC Res. Notes 2012, 5, 52. [Google Scholar] [CrossRef] [PubMed]
- CochraneTraining. Cochrane Handbook for Systematic Reviews of Interventions. Available online: https://training.cochrane.org/handbook/archive/v6/chapter-10#section-10-10-2 (accessed on 2 February 2022).
- Harris, J.D.; Quatman, C.E.; Manring, M.M.; Siston, R.A.; Flanigan, D.C. How to Write a Systematic Review. Am. J. Sports Med. 2014, 42, 2761–2768. [Google Scholar] [CrossRef]
- Wohlauer, M.; Coleman, D.M.; Sheahan, M.G.; Meltzer, A.J.; Halloran, B.; Hallbeck, S.; Money, S.R.; Coleman, D.; Sheahan, M.; Money, S.; et al. Physical pain and musculoskeletal discomfort in vascular surgeons. J. Vasc. Surg. 2021, 73, 1414–1421. [Google Scholar] [CrossRef]
- Alnefaie, M.; Alamri, A.; Hariri, A.; Alsaad, S.; Alsulami, A.; Abbas, A.; Alfozan, A.; Aljiffry, M.; Al-Abbadi, H. Musculoskeletal Symptoms Among Surgeons at a Tertiary Care Center: A Survey Based Study. Med. Arch. 2019, 73, 49. [Google Scholar] [CrossRef]
- Alzahrani, M.; Alqahtani, S.; Tanzer, M.; Hamdy, R. Musculoskeletal disorders among orthopedic pediatric surgeons: An overlooked entity. J. Child. Orthop. 2016, 10, 461–466. [Google Scholar] [CrossRef]
- Buschbacher, R. Overuse Syndromes Among Endoscopists. Endoscopy 1994, 26, 539–544. [Google Scholar] [CrossRef]
- Cavanagh, J.; Brake, M.; Kearns, D.; Hong, P. Work environment discomfort and injury: An ergonomic survey study of the American Society of Pediatric Otolaryngology members. Am. J. Otolaryngol. 2012, 33, 441–446. [Google Scholar] [CrossRef]
- Davis, W.T.; Sathiyakumar, V.; Jahangir, A.A.; Obremskey, W.T.; Sethi, M.K. Occupational Injury Among Orthopaedic Surgeons. J. Bone Jt. Surg. Am. 2013, 95, e107. [Google Scholar] [CrossRef]
- Dhimitri, K.; McGwin, G.; McNeal, S.; Lee, P.; Morse, P.; Patterson, M.; Wertz, F.; Marx, J. Symptoms of musculoskeletal disorders in ophthalmologists. Am. J. Ophthalmol. 2005, 139, 179–181. [Google Scholar] [CrossRef] [PubMed]
- Esser, A.; Koshy, J.; Randle, H. Ergonomics in Office-Based Surgery: A Survey-Guided Observational Study. Dermatol. Surg. 2007, 33, 1304–1313; discussion 1313. [Google Scholar] [CrossRef]
- Forst, L.; Friedman, L.; Shapiro, D. Carpal Tunnel Syndrome in Spine Surgeons: A Pilot Study. Arch. Environ. Occup. Health 2006, 61, 259–262. [Google Scholar] [CrossRef] [PubMed]
- Franasiak, J.; Ko, E.M.; Kidd, J.; Secord, A.A.; Bell, M.; Boggess, J.F.; Gehrig, P.A. Physical strain and urgent need for ergonomic training among gynecologic oncologists who perform minimally invasive surgery. Gynecol. Oncol. 2012, 126, 437–442. [Google Scholar] [CrossRef]
- Franasiak, J.M.; Craven, R.; Mosaly, P.R.; Gehrig, P.A. Feasibility and acceptance of a robotic surgery ergonomic training program. J. Soc. Laparoendosc. Surg. 2014, 18, e2014.00166. [Google Scholar] [CrossRef]
- Gofrit, O.N.; Mikahail, A.A.; Zorn, K.C.; Zagaja, G.P.; Steinberg, G.D.; Shalhav, A.L. Surgeons’ Perceptions and Injuries During and After Urologic Laparoscopic Surgery. Urology 2008, 71, 404–407. [Google Scholar] [CrossRef] [PubMed]
- Goldstein, J.; Balter, S.; Cowley, M.; Hodgson, J.; Klein, L. Occupational hazards of interventional cardiologists: Prevalence of orthopedic health problems in contemporary practice. Catheter. Cardiovasc. Interv. 2004, 63, 407–411. [Google Scholar] [CrossRef]
- Hansel, S.; Crowell, M.; Pardi, D.; Bouras, E.; DiBaise, J. Prevalence and Impact of Musculoskeletal Injury Among Endoscopists: A Controlled Study. J. Clin. Gastroenterol. 2008, 43, 399–404. [Google Scholar] [CrossRef]
- Ho, T.V.T.; Hamill, C.S.; Sykes, K.J.; Kraft, S.M. Work-related musculoskeletal symptoms among otolaryngologists by subspecialty: A national survey. Laryngoscope 2018, 128, 632–640. [Google Scholar] [CrossRef]
- Johnston, W.K.I.; Hollenbeck, B.K.; Wolf, J.S. Comparison of neuromuscular injuries to the surgeon during hand-assisted and standard laparoscopic urologic surgery. J. Endourol. 2005, 19, 377–381. [Google Scholar] [CrossRef]
- Kitzmann, A.S.; Fethke, N.B.; Baratz, K.H.; Zimmerman, M.B.; Hackbarth, D.J.; Gehrs, K.M. A Survey Study of Musculoskeletal Disorders Among Eye Care Physicians Compared with Family Medicine Physicians. Ophthalmology 2012, 119, 213–220. [Google Scholar] [CrossRef] [PubMed]
- Klein, L.; Tra, Y.; Garratt, K.; Powell, W.; Lopez-Cruz, G.; Chambers, C.; Goldstein, J. Occupational health hazards of interventional cardiologists in the current decade: Results of the 2014 SCAI membership survey: Results of the 2014 SCAI Membership Occupational Health Survey. Catheter. Cardiovasc. Interv. 2015, 86, 913–924. [Google Scholar] [CrossRef]
- Knudsen, M.; Ludewig, P.; Braman, J. Musculoskeletal Pain in Resident Orthopaedic Surgeons: Results of a Novel Survey. Iowa Orthop. J. 2014, 34, 190–196. [Google Scholar] [PubMed]
- Lee, G.I.; Lee, M.R.; Green, I.; Allaf, M.; Marohn, M.R. Surgeons’ physical discomfort and symptoms during robotic surgery: A comprehensive ergonomic survey study. Surg. Endosc. 2017, 31, 1697–1706. [Google Scholar] [CrossRef]
- Liang, C.A.; Levine, V.J.; Dusza, S.W.; Hale, E.K.; Nehal, K.S. Musculoskeletal disorders and ergonomics in dermatologic surgery: A survey of Mohs surgeons in 2010. Dermatol. Surg. 2012, 38, 240–248. [Google Scholar] [CrossRef]
- Liberman, A.S.; Shrier, I.; Gordon, P.H. Injuries sustained by colorectal surgeons performing colonoscopy. Surg. Endosc. Other Interv. Tech. 2005, 19, 1606–1609. [Google Scholar] [CrossRef] [PubMed]
- Sivak-Callcott, J.; Diaz, S.; Ducatman, A.; Rosen, C.; Nimbarte, A. A Survey Study of Occupational Pain and Injury in Ophthalmic Plastic Surgeons. Ophthalmic Plast. Reconstr. Surg. 2011, 27, 28–32. [Google Scholar] [CrossRef]
- Trejo, A.E.; Doné, K.; DiMartino, A.; Oleynikov, D.; Hallbeck, M.S. Articulating vs. conventional laparoscopic grasping tools—surgeons’ opinions. Int. J. Ind. Ergon. 2006, 36, 25–35. [Google Scholar] [CrossRef]
- Bolduc-Bégin, J.; Prince, F.; Christopoulos, A.; Ayad, T. Work-related musculoskeletal symptoms amongst Otolaryngologists and Head and Neck surgeons in Canada. Eur. Arch. Oto-Rhino-Laryngol. 2017, 275, 261–267. [Google Scholar] [CrossRef]
- Diaconita, V.; Uhlman, K.; Mao, A.; Mather, R. Survey of occupational musculoskeletal pain and injury in Canadian ophthalmology. Can. J. Ophthalmol. 2019, 54, 314–322. [Google Scholar] [CrossRef]
- O’Sullivan, S.; Bridge, G.; Ponich, T. Musculoskeletal Injuries among ERCP Endoscopists in Canada. Can. J. Gastroenterol. Hepatol. 2002, 16, 369–374. [Google Scholar] [CrossRef] [PubMed]
- Liang, B.; Qi, L.; Yang, J.; Cao, Z.; Zu, X.; Liu, L.; Wang, L. Ergonomic Status of Laparoscopic Urologic Surgery: Survey Results from 241 Urologic Surgeons in China. PLoS ONE 2013, 8, e70423. [Google Scholar] [CrossRef] [PubMed]
- Szeto, G.P.Y.; Ho, P.; Ting, A.C.W.; Poon, J.T.C.; Cheng, S.W.K.; Tsang, R.C.C. Work-related Musculoskeletal Symptoms in Surgeons. J. Occup. Rehabil. 2009, 19, 175–184. [Google Scholar] [CrossRef]
- Dabholkar, T.; Yardi, S.; Dabholkar, Y.G.; Velankar, H.K.; Ghuge, G. A Survey of Work-Related Musculoskeletal Disorders Among Otolaryngologists. Indian J. Otolaryngol. Head Neck Surg. 2017, 69, 230–238. [Google Scholar] [CrossRef]
- Dianat, I.; Bazazan, A.; Souraki Azad, M.A.; Salimi, S.S. Work-related physical, psychosocial and individual factors associated with musculoskeletal symptoms among surgeons: Implications for ergonomic interventions. Appl. Ergon. 2018, 67, 115–124. [Google Scholar] [CrossRef]
- Mehrifar, Y.; Mardanparvar, H.; Mohebian, Z. Musculoskeletal disorders among surgeons working in several hospitals of Tehran, Iran (2015). J. Occup. Health 2018, 7, 97–102. [Google Scholar] [CrossRef]
- Mohseni-Bandpei, M.A.; Ahmad-Shirvani, M.; Golbabaei, N.; Behtash, H.; Shahinfar, Z.; Fernández-de-las-Peñas, C. Prevalence and Risk Factors Associated with Low Back Pain in Iranian Surgeons. J. Manip. Physiol. Ther. 2011, 34, 362–370. [Google Scholar] [CrossRef] [PubMed]
- Mirbod, S.M.; Yoshida, H.; Miyamoto, K.; Miyashita, K.; Inaba, R.; Iwata, H. Subjective complaints in orthopedists and general surgeons. Int. Arch. Occup. Environ. Health 1995, 67, 179–186. [Google Scholar] [CrossRef]
- Alshehri, S. Prevalence, characteristics, contributing factors, work sector, and impact of work-related musculoskeletal disorders among otorhinolaryngology practitioners in Saudi Arabia: A cross-sectional study. Work 2022, 73, 131–142. [Google Scholar] [CrossRef]
- Matern, U.; Koneczny, S. Safety, hazards and ergonomics in the operating room. Surg. Endosc. 2007, 21, 1965–1969. [Google Scholar] [CrossRef]
- Quinn, D.; Moohan, J. The trainees’ pain with laparoscopic surgery: What do trainees really know about theatre set-up and how this impacts their health. Gynecol. Surg. 2015, 12, 71–76. [Google Scholar] [CrossRef]
- Battevi, N.; Menoni, O.; Cosentino, F.; Vitelli, N. Digestive endoscopy and risk of upper limb biomechanical overload. Med. Lav. 2009, 100, 171–177. [Google Scholar]
- Giberti, C.; Gallo, F.; Francini, L.; Signori, A.; Testa, M. Musculoskeletal disorders among robotic surgeons: A questionnaire analysis. Arch. Ital. Urol. Androl. 2014, 86, 95–98. [Google Scholar] [CrossRef] [PubMed]
- Morandeira-Rivas, A.; Millán-Casas, L.; Moreno-Sanz, C.; Herrero-Bogajo, M.L.; Tenías-Burillo, J.M.; Giménez-Salillas, L. Ergonomics in Laparoendoscopic Single-Site Surgery: Survey Results. J. Gastrointest. Surg. 2012, 16, 2151–2159. [Google Scholar] [CrossRef]
- Ruitenburg, M.; Frings-Dresen, M.; Sluiter, J. Physical job demands and related health complaints among surgeons. Int. Arch. Occup. Environ. Health 2012, 86, 271–279. [Google Scholar] [CrossRef]
- Sari, V.; Nieboer, T.E.; Vierhout, M.E.; Stegeman, D.F.; Kluivers, K.B. The operation room as a hostile environment for surgeons: Physical complaints during and after laparoscopy. Minim. Invasive Ther. Allied Technol. 2010, 19, 105–109. [Google Scholar] [CrossRef]
- Tjiam, I.; Goossens, R.; Schout, B.; Koldewijn, E.; Hendrikx, A.; Muijtjens, A.; Scherpbier, A.; Witjes, J. Ergonomics in endourology and laparoscopy: An overview of musculoskeletal problems in urology. J. Endourol. 2014, 28, 605–611. [Google Scholar] [CrossRef] [PubMed]
- Kaya, O.; Moran, M.; Ozkardeş, A.B.; Taskin, E.Y.; Şeker, G.; Ozmen, M.M. Ergonomic Problems Encountered by the Surgical Team During Video Endoscopic Surgery. Surg. Laparosc. Endosc. Percutan Tech. 2008, 18, 40–44. [Google Scholar] [CrossRef]
- Hyer, J.N.; Lee, R.M.; Chowdhury, H.R.; Smith, H.B.; Dhital, A.; Khandwala, M. National survey of back & neck pain amongst consultant ophthalmologists in the United Kingdom. Int. Ophthalmol. 2015, 35, 769–775. [Google Scholar]
- Vijendren, A.; Yung, M.; Sanchez, J.; Duffield, K. Occupational musculoskeletal pain amongst ENT surgeons—Are we looking at the tip of an iceberg? J. Laryngol. Otol. 2016, 130, 490–496. [Google Scholar] [CrossRef]
- Daruwalla, A.C.; Patel, B. An Analysis into the Prevalence of Work-Related Musculoskeletal Disorders Affecting Surgeons: A Systematic Review. Br. J. Surg. 2022, 109, znac269.417. [Google Scholar] [CrossRef]
- Riaz, H.; Khan, H.; Malik, Q. Postural ergonomic risk assessment and work-related musculoskeletal symptoms among surgeons. Int. J. Rehabil. Res. 2021, 1, 5–10. [Google Scholar] [CrossRef]
- Grant, K.M.K.; Vo, T.; Tiong, L.U. The painful truth: Work-related musculoskeletal disorders in Australian surgeons. Occup. Med. 2020, 70, 60–63. [Google Scholar] [CrossRef]
- Vasireddi, N.; Vasireddi, N.; Shah, A.; Moyal, A.; Ng, M.; Seshadri, D.; Gould, H.P.; Poelstra, K.; Cheng, C.W.; Voos, J.; et al. Prevalence of work-related musculoskeletal disorders among orthopedic surgeons: A systematic review and meta-analysis. Spine J. 2023, 23, S32. [Google Scholar] [CrossRef]
- Alleblas, C.C.J.; de Man, A.M.; van den Haak, L.; Vierhout, M.E.; Jansen, F.W.; Nieboer, T.E. Prevalence of Musculoskeletal Disorders Among Surgeons Performing Minimally Invasive Surgery: A Systematic Review. Ann. Surg. 2017, 266, 905–920. [Google Scholar] [CrossRef]
- Vieira, E.R.; Schneider, P.; Guidera, C.; Gadotti, I.C.; Brunt, D. Work-related musculoskeletal disorders among physical therapists: A systematic review. J. Back Musculoskelet. Rehabil. 2016, 29, 417–428. [Google Scholar] [CrossRef] [PubMed]
- Chenna, D.; Pentapati, K.C.; Kumar, M.; Madi, M.; Siddiq, H. Prevalence of musculoskeletal disorders among dental healthcare providers: A systematic review and meta-analysis. F1000Research 2022, 11, 1062. [Google Scholar] [CrossRef]
- Gorce, P.; Jacquier-Bret, J. Global trends in research of Work-related musculoskeletal disorders among surgeons: Bibliometric analysis and visualization from 1991 to 2024. F1000Research 2024, 13, 1311. [Google Scholar] [CrossRef]
- Gorce, P.; Jacquier-Bret, J. Work-related musculoskeletal disorders among surgeons: A bibliometric analysis from 1982 to 2024. Explor. Musculoskelet. Dis. 2024, 2, 317–335. [Google Scholar] [CrossRef]
- Hess, P.; Athanasiadis, D.; Lee, N.K.; Monfared, S.; Cleveland, P.M.; Stefanidis, D. Preventing Surgeon Work-Related Musculoskeletal Disorders: A Pilot Study of the Comprehensive Operating Room Ergonomics (CORE) Program. Am. J. Occup. Ther. 2024, 78, 7805205090. [Google Scholar] [CrossRef]
- Jacquier-Bret, J.; Gorce, P. Prevalence of Body Area Work-Related Musculoskeletal Disorders among Healthcare Professionals: A Systematic Review. Int. J. Environ. Res. Public. Health 2023, 20, 841. [Google Scholar] [CrossRef] [PubMed]
- Gorce, P.; Jacquier-Bret, J. Global prevalence of musculoskeletal disorders among physiotherapists: A systematic review and meta-analysis. BMC Musculoskelet. Disord. 2023, 24, 265. [Google Scholar] [CrossRef] [PubMed]
- Soroush, A.; Shamsi, M.; Izadi, N.; Heydarpour, B.; Samadzadeh, S.; Shahmohammadi, A. Musculoskeletal Disorders as Common Problems among Iranian Nurses: A Systematic Review and Meta-analysis. Int. J. Prev. Med. 2018, 9, 27. [Google Scholar] [CrossRef]
- Lietz, J.; Kozak, A.; Nienhaus, A. Prevalence and occupational risk factors of musculoskeletal diseases and pain among dental professionals in Western countries: A systematic literature review and meta-analysis. PLoS ONE 2018, 13, e0208628. [Google Scholar] [CrossRef]
- Dabholkar, T.Y.; Yardi, S.S.; Dabholkar, Y.G. Prevalence of work-related musculoskeletal symptoms in surgeons performing minimally invasive surgery: A review of literature. Int. Surg. J. 2016, 3, 1028–1034. [Google Scholar] [CrossRef]
- Ghasemi, F.; Rahmani, R.; Behmaneshpour, F.; Fazli, B. Quality of work life among surgeons and its association with musculoskeletal complaints. Cogent Psychol. 2021, 8, 1880256. [Google Scholar] [CrossRef]
- AlQahtani, S.M.; Alzahrani, M.M.; Harvey, E.J. Prevalence of musculoskeletal disorders among orthopedic trauma surgeons: An OTA survey. Can. J. Surg. 2016, 59, 42–47. [Google Scholar] [CrossRef] [PubMed]
- Gadjradj, P.S.; Ogenio, K.; Voigt, I.; Harhangi, B.S. Ergonomics and Related Physical Symptoms Among Neurosurgeons. World Neurosurg. 2020, 134, e432–e441. [Google Scholar] [CrossRef]
- Michael, S.; Mintz, Y.; Brodie, R.; Assalia, A. Minimally invasive surgery and the risk of work-related musculoskeletal disorders: Results of a survey among Israeli surgeons and review of the literature. Work 2022, 71, 779–785. [Google Scholar] [CrossRef]
- Frymoyer, J.W.; Pope, M.H.; Clements, J.H.; Wilder, D.G.; MacPherson, B.; Ashikaga, T. Risk factors in low back pain. An epidemiological survey. J. Bone Jt. Surg. 1983, 65, 213–218. [Google Scholar] [CrossRef]
- Tetteh, E.; Wang, T.; Kim, J.Y.; Smith, T.; Norasi, H.; Van Straaten, M.G.; Lal, G.; Chrouser, K.L.; Shao, J.M.; Hallbeck, M.S. Optimizing ergonomics during open, laparoscopic, and robotic-assisted surgery: A review of surgical ergonomics literature and development of educational illustrations. Am. J. Surg. 2024, 235, 115551. [Google Scholar] [CrossRef] [PubMed]
- Karam, B.; Soriano, I. Ergonomics and body wellness during surgery: A review and practical guide. Semin. Colon Rectal Surg. 2025, 36, 101058. [Google Scholar] [CrossRef]
- Liu, J.H.; Etzioni, D.A.; O’Connell, J.B.; Maggard, M.A.; Ko, C.Y. The Increasing Workload of General Surgery. Arch. Surg. 2004, 139, 423–428. [Google Scholar] [CrossRef] [PubMed]


| Authors | Country | Surgeons per 100,000 Inhabitants | Sample Size | Male/Female (%) | Age * (Year) | Experience * (Year) | Case Load * (Case per Week) | Case Load * (h per Week) |
|---|---|---|---|---|---|---|---|---|
| America | ||||||||
| Adams et al., 2013 [10] | United States | 54.71 | 495 | 50.3/49.7 | 47 | 18 | 8 | |
| Alqhatani et al., 2022 [18] | United States | 54.71 | 578 | 84.8/15.2 | 52.8 | 19.78 | 8.57 | |
| Alzahrani et al., 2016 [38] | United States | 54.71 | 402 | 76.1/23.9 | 51.2 | 18.3 | ||
| Auerbach et al., 2011 [15] | United States | 54.71 | 561 | 54 | 2.8 | |||
| Berguer 1998 [7] | United States | 54.71 | 149 | |||||
| Bolduc-Beguin et al., 2017 [60] | Canada | 43.87 | 137 | 79.0/21.0 | 46 | 14 | ||
| Buschbacher 1994 [39] | United States | 54.71 | 265 | 95.1/4.9 | 48.8 ± 8.6 | |||
| Capone et al., 2010 [17] | United States | 54.71 | 325 | 87.1/12.9 | 48.1 | 12.9 | ||
| Cavanagh et al., 2012 [40] | United States | 54.71 | 100 | 85.0/15.0 | 52.96 ± 8.03 | 21.17 ± 9.32 | ||
| Cohen-Rosenblum et al., 2022 [14] | United States | 54.71 | 63 | 0.0/100.0 | 45.2 | 10.65 | 5.3 | |
| Davis et al., 2013 [41] | United States | 54.71 | 140 | 49.7 ± 10.7 | 19.3 | 13.8 | ||
| Davis et al., 2014 [22] | United States | 54.71 | 260 | 80.0/20.0 | 20 ± 11 | 19 ± 10 | ||
| Dhimitri et al., 2005 [42] | United States | 54.71 | 697 | 84.1/15.9 | 51.9 | 19.8 | 6.8 | |
| Diaconita et al., 2019 [61] | Canada | 43.87 | 169 | 68.0/32.0 | ||||
| Esser et al., 2007 [43] | United States | 54.71 | 17 | 70.6/29.4 | 39.6 | 6.8 | 24.3 | |
| Forst et al., 2006 [44] | United States | 54.71 | 285 | 97.5/2.5 | 46.7 | 14.1 | ||
| Franasiak et al., 2012 [45] | United States | 54.71 | 260 | 59.2/40.8 | 45.3 | 9.4 | ||
| Franasiak et al., 2014 [46] | United States | 54.71 | 42 | 45.2/54.8 | 3 | 5.4 | ||
| Gofrit et al., 2008 [47] | United States | 54.71 | 73 | 100.0/0.0 | 44 ± 8.4 | 11.7 ± 8.4 | 3.1 ± 2.8 | |
| Goldstein et al., 2004 [48] | United States | 54.71 | 423 | 13.8 | 9.8 | |||
| Hansel et al., 2008 [49] | United States | 54.71 | 71 | 83.1/16.9 | 45.1 | |||
| Ho et al., 2018 [50] | United States | 54.71 | 376 | 72.7/27.3 | 34.7 ± 8.69 | 4.48 | 6.7 | |
| Johnston et al., 2005 [51] | United States | 54.71 | 25 | 1.6 | ||||
| Kitzmann et al., 2012 [52] | United States | 54.71 | 94 | 66.0/34.0 | 41.5 ± 10.9 | 11.8 | ||
| Klein et al., 2015 [53] | United States | 54.71 | 310 | 89.0/11.0 | 49 | 16 | 11.1 | |
| Knudsen et al., 2014 [54] | United States | 54.71 | 32 | 75.0/25.0 | 29.5 | 2.9 | 33.8 | |
| Lee et al., 2017 [55] | United States | 54.71 | 428 | 71.3/28.7 | 47.61 ± 9.2 | 13.48 ± 9.5 | 5.24 ± 4.2 | |
| Liang et al., 2012 [56] | United States | 54.71 | 354 | 70.9/29.1 | 44.5 | 8.9 | ||
| Liberman et al., 2005 [57] | United States | 54.71 | 582 | 89.3/10.7 | 48 | 14.8 | 17 | |
| O’Sullivan 2002 [62] | Canada | 43.87 | 122 | |||||
| Plerhoples et al., 2012 [20] | United States | 54.71 | 1086 | 72.7/27.3 | 45.8 ± 9.0 | 12.1 ± 8.3 | 0.77 | |
| Plerhoples et al., 2012 [20] | United States | 54.71 | 1068 | 72.7/27.3 | 45.8 ± 9.0 | 13.8 ± 9.2 | 0.77 | |
| Sivak-Callcott et al., 2011 [58] | United States | 54.71 | 130 | 85.4/14.6 | 48 | 16.1 | 13.8 | |
| Trejo et al., 2006 [59] | United States | 54.71 | 38 | |||||
| Voss et al., 2016 [3] | United States | 54.71 | 127 | 60.6/39.4 | 7.1 | |||
| Wohlauer et al., 2021 [61] | United States | 54.71 | 736 | 83.6/16.4 | 51.4 ± 10.9 | 17.2 ± 11.6 | ||
| Wohlauer et al., 2021 [61] | United States | 54.71 | 736 | 83.6/16.4 | 51.4 ± 10.9 | 17.2 ± 11.6 | ||
| Wolf et al., 2000 [13] | United States | 54.71 | 18 | 45.5 | ||||
| Total | 11,774 | 77.4/22.6 | 48.1 ± 4.1 | 14.8 ± 3.9 | 5.2 ± 3.7 | 12.3 ± 6.3 | ||
| Asia | ||||||||
| Alnefaie et al., 2019 [37] | Saudi Arabia | 121 | 61.2/38.8 | 34.38 | ||||
| Alnefaie et al., 2019 [37] | Saudi Arabia | 121 | 61.2/38.8 | 34.38 | ||||
| Alshehri 2022 [70] | Saudi Arabia | 104 | 73.1/26.9 | 43.36 ± 10.7 | 12.93 | 4.53 | ||
| Dabholkar et al., 2015 [4] | India | 6.82 | 75 | 74.0/26.0 | 43.4 | 14.06 | 10.24 | |
| Dabholkar et al., 2017 [65] | India | 6.82 | 73 | 63.1/36.9 | 37.38 ± 10.79 | 10.60 ± 9.1 | 4.86 ± 2.23 | |
| Dianat et al., 2018 [66] | Iran | 5.02 | 312 | 65.1/34.9 | 45.2 ± 9.3 | 12.5 ± 8.3 | 13.1 ± 7.3 | |
| Hemal et al., 2001 [19] | India | 6.82 | 131 | 41.6 ± 6.1 | 4.8 ± 2.5 | 8.8 ± 4.8 | ||
| Hemal et al., 2001 [19] | India | 6.82 | 73 | 36.9 ± 8.4 | 10.9 ± 7.6 | 12.9 ± 5.7 | ||
| Liang et al., 2013 [63] | China | 40.13 | 241 | 96.7/3.3 | 44.3 | 5.28 | ||
| Mehrifar et al., 2018 [67] | Iran | 5.02 | 40 | 63.0/37.0 | 38.54 ± 8.34 | 8.7 | ||
| Mirbod et al. 1995 [69] | Japan | 37.36 | 63 | 100.0/0.0 | 41.8 ± 9.5 | 16.6 ± 9.5 | ||
| Mohseni-Bandpei et al., 2011 [68] | Iran | 5.02 | 223 | 48.4/51.6 | 42.6 | 10.5 | ||
| Rambabu and Suneetha 2014 [23] | India | 6.82 | 100 | |||||
| Riaz et al., 2021 [83] | Pakistan | 5.53 | 100 | 48.0/52.0 | 33.13 ± 11 | 7.48 ± 9.51 | 24.78 | |
| Szeto et al., 2009 [64] | China | 40.13 | 135 | 82.2/17.8 | 35.3 | 10.0 ± 7.3 | ||
| Tan and Kwek 2020 [26] | Singapore | 31.45 | 56 | 33 | 16 | |||
| Vaghela et al., 2019 [24] | India | 6.82 | 43 | 69.8/30.2 | 42.07 | 15.14 | ||
| Total | 2011 | 69.5/30.5 | 40.4 ± 4.4 | 10.9 ± 2.9 | 10.4 ± 6.2 | 11.5 ± 2.9 | ||
| Europe | ||||||||
| Battevi et al., 2009 [73] | Italy | 142.4 | 176 | 38.6/61.4 | 42.8 | |||
| Cass et al., 2014 [12] | United Kingdom | 133.3 | 128 | |||||
| Giagio et al., 2019 [11] | Italy | 142.4 | 76 | 65.8/34.2 | 37.7 ± 12.1 | 10.4 ± 11.3 | 16.1 | |
| Giberti et al., 2014 [74] | Italy | 142.4 | 17 | 94.1/5.9 | 51.3 | 3 | 6.0 | |
| Hyer et al., 2015 [80] | United Kingdom | 133.3 | 518 | 74.5/25.5 | 48.7 | 8.78 | ||
| Kaya et al., 2008 [79] | Turkey | 47.63 | 82 | |||||
| Mal and Costello 2002 [16] | United Kingdom | 133.3 | 367 | 51.2 | ||||
| Matern and Koneczny 2007 [71] | Germany | 108 | 425 | 75.0/25.0 | ||||
| Morandeira-Rivas et al., 2012 [75] | Spain | 79.9 | 78 | 87.0/13.0 | 44.06 | 1.3 | ||
| Quinn and Moohan 2015 [72] | Ireland | 71.97 | 53 | 36.0/64.0 | 30.4 | 4.5 | ||
| Rata et al., 2021 [25] | Romania | 60.53 | 95 | 62.1/37.9 | 37.56 ± 8.74 | 10.09 ± 8.41 | 7.56 ± 3.73 | |
| Ruitenburg et al., 2012 [76] | The Netherlands | 48.97 | 295 | 45.0/55.0 | 40.0 ± 9.8 | |||
| Sari et al., 2010 [77] | The Netherlands | 48.97 | 55 | 65.4/34.6 | 39.5 ± 7.3 | 8.75 ± 6.07 | 6 | |
| Stomberg et al., 2010 [21] | Sweden | 113.11 | 101 | 36.6/63.4 | 48.2 ± 10.2 | 14.5 ± 10.4 | 1.9 | |
| Tjiam et al., 2014 [78] | The Netherlands | 48.97 | 285 | 93.0/7.0 | 46 | 12.9 | 6.45 | |
| Vijendren et al., 2016 [81] | United Kingdom | 133.3 | 323 | 18.7 | ||||
| Total | 3074 | 67.0/33.0 | 45.5 ± 5.2 | 13.6 ± 4.3 | 8.2 ± 5.8 | 7.2 ± 2.1 | ||
| Oceania | ||||||||
| Grant et al., 2020 [84] | Australia | 45.11 | 329 | 73.0/27.0 | 20 | |||
| Worldwide total | 17,188 | 74.8/25.2 | 46.7 ± 5.0 | 14.3 ± 4.0 | 6.9 ± 5.3 | 11.3 ± 5.9 |
| Authors | Country | Sample Size | WMSD Prevalence by Body Area | Overall WMSD Prevalence | ||||||||
|---|---|---|---|---|---|---|---|---|---|---|---|---|
| Neck | Upper Back | Lower Back | Shoulder | Elbow | Wrist | Hip | Knee | Ankle | ||||
| America | ||||||||||||
| Adams et al., 2013 [10] | United States | 495 | 72.9% | 61.6% | 75.6% | 66.6% | 60.9% | |||||
| Alqhatani et al., 2022 [18] | United States | 578 | 18.3% | 20.7% | 14.0% | 15.7% | 31.3% | 4.0% | 7.4% | 5.7% | 60.4% | |
| Alzahrani et al., 2016 [38] | United States | 402 | 10.4% | 28.6% | 12.9% | 15.4% | 10.0% | 67.0% | ||||
| Auerbach et al., 2011 [15] | United States | 561 | 59.4% | 62.2% | 48.5% | 28.3% | 24.8% | |||||
| Berguer 1998 [7] | United States | 149 | 52.0% | 55.0% | 47.0% | |||||||
| Bolduc-Beguin et al., 2017 [60] | Canada | 137 | 64.3% | 58.4% | 64.2% | 97.0% | ||||||
| Buschbacher 1994 [39] | United States | 265 | 13.0% | 19.0% | 15.0% | 14.0% | 43.8% | |||||
| Capone et al., 2010 [17] | United States | 325 | 26.8% | 24.0% | 17.9% | 29.8% | 24.7% | 81.5% | ||||
| Cavanagh et al., 2012 [40] | United States | 100 | 59.7% | 19.4% | 62.0% | |||||||
| Cohen-Rosenblum et al., 2022 [14] | United States | 63 | 17.5% | 30.2% | 33.3% | 11.1% | 54.0% | 9.5% | 7.9% | 11.1% | 68.3% | |
| Davis et al., 2013 [41] | United States | 140 | 10.0% | 19.3% | 7.1% | 25.0% | 44.0% | |||||
| Davis et al., 2014 [22] | United States | 260 | 7.7% | 3.5% | 8.8% | 1.9% | 2.7% | 40.0% | ||||
| Dhimitri et al., 2005 [42] | United States | 697 | 32.6% | 39.0% | 32.9% | 51.8% | ||||||
| Diaconita et al., 2019 [61] | Canada | 169 | 46.0% | 21.0% | 36.0% | 28.0% | 18.0% | 50.0% | ||||
| Esser et al., 2007 [43] | United States | 17 | 59.0% | 12.0% | 41.0% | 53.0% | 12.0% | 12.0% | ||||
| Forst et al., 2006 [44] | United States | 285 | 28.8% | |||||||||
| Franasiak et al., 2012 [45] | United States | 260 | 58.8% | 53.6% | 26.1% | 44.1% | 17.5% | 6.6% | 88.1% | |||
| Franasiak et al., 2014 [46] | United States | 42 | 33.3% | 7.1% | 19.1% | 23.8% | 16.7% | 2.4% | 2.4% | 45.2% | ||
| Gofrit et al., 2008 [47] | United States | 73 | 19.0% | 14.0% | 19.0% | 17.5% | 9.0% | 10.5% | ||||
| Goldstein et al., 2004 [48] | United States | 423 | 16.8% | 29.4% | ||||||||
| Hansel et al., 2008 [49] | United States | 71 | 10.4% | 16.7% | 73.6% | |||||||
| Ho et al., 2018 [50] | United States | 376 | 73.5% | 52.8% | 63.9% | |||||||
| Johnston et al., 2005 [51] | United States | 25 | 69.0% | 68.0% | 55.0% | 48.0% | 54.0% | |||||
| Kitzmann et al., 2012 [52] | United States | 94 | 46.0% | 19.0% | 26.0% | 11.0% | 1.0% | 17.0% | ||||
| Klein et al., 2015 [53] | United States | 310 | 24.7% | 34.4% | 49.4% | |||||||
| Knudsen et al., 2014 [54] | United States | 32 | 59.4% | 35.5% | 54.8% | 34.4% | 3.1% | 19.4% | 9.7% | 22.6% | 22.6% | |
| Lee et al., 2017 [55] | United States | 428 | 21.4% | 15.2% | 12.3% | 9.5% | 9.4% | 56.1% | ||||
| Liang et al., 2012 [56] | United States | 354 | 65.2% | 53.3% | 63.1% | 61.5% | 13.8% | 36.9% | 24.8% | 20.5% | 45.7% | |
| Liberman et al., 2005 [57] | United States | 582 | 11.2% | 44.2% | 39.0% | |||||||
| O’Sullivan 2002 [62] | Canada | 122 | 46.0% | 16.0% | 8.0% | 36.0% | 67.0% | |||||
| Plerhoples et al., 2012 [20] | United States | 1086 | 44.1% | 41.4% | 44.5% | 33.2% | 8.5% | 16.6% | 10.1% | 15.7% | 5.7% | 69.0% |
| Plerhoples et al., 2012 [20] | United States | 1068 | 46.6% | 39.0% | 51.8% | 12.3% | 4.6% | 9.3% | 11.4% | 20.0% | 7.2% | 69.0% |
| Sivak-Callcott et al., 2011 [58] | United States | 130 | 58.0% | 31.3% | 26.7% | 72.5% | ||||||
| Trejo et al., 2006 [59] | United States | 38 | 65.0% | 48.0% | 55.0% | |||||||
| Voss et al., 2016 [3] | United States | 127 | 65.4% | 54.2% | 30.0% | 31.0% | 93.7% | |||||
| Wohlauer et al., 2021 [61] | United States | 736 | 24.0% | 22.4% | 44.2% | 4.9% | 20.8% | 76.0% | ||||
| Wohlauer et al., 2021 [61] | United States | 736 | 45.2% | 25.1% | 39.0% | 6.3% | 17.9% | 76.0% | ||||
| Wolf et al., 2000 [13] | United States | 18 | 28.0% | 17.0% | 11.0% | 67.0% | ||||||
| Asia | ||||||||||||
| Alnefaie et al., 2019 [37] | Saudi Arabia | 121 | 49.3% | 35.8% | 13.4% | 29.9% | 31.3% | 26.9% | 82.5% | |||
| Alnefaie et al., 2019 [37] | Saudi Arabia | 121 | 46.3% | 25.7% | 9.3% | 22.2% | 20.4% | 20.4% | 82.5% | |||
| Alshehri 2022 [70] | Saudi Arabia | 104 | 67.3% | 27.8% | 44.2% | 49.0% | 10.5% | 33.6% | 10.5% | 24.0% | 22.10% | 72.7% |
| Dabholkar et al., 2015 [4] | India | 75 | 26.6% | 49.3% | 14.6% | 14.6% | 25.3% | 22.6% | 86.0% | |||
| Dabholkar et al., 2017 [65] | India | 73 | 41.0% | 37.0% | 32.9% | 16.4% | 9.6% | 23.3% | 5.4% | 87.7% | ||
| Dianat et al., 2018 [66] | Iran | 312 | 45.8% | 31.4% | 42.3% | 40.1% | 13.8% | 25.0% | 28.5% | 48.7% | 27.9% | 77.2% |
| Hemal et al., 2001 [19] | India | 131 | 13.0% | 18.0% | 15.0% | 16.0% | 7.6% | |||||
| Hemal et al., 2001 [19] | India | 73 | 6.0% | 10.2% | 5.4% | 8.6% | 4.2% | |||||
| Liang et al., 2013 [63] | China | 241 | 58.1% | 33.6% | 32.0% | 21.6% | ||||||
| Mehrifar et al., 2018 [67] | Iran | 40 | 84.6% | 44.1% | 56.8% | 37.4% | 10.0% | 40.0% | 20.0% | 18.0% | 24.0% | 89.2% |
| Mirbod et al. 1995 [69] | Japan | 63 | 20.6% | 36.5% | 17.5% | 9.5% | 80.7% | |||||
| Mohseni-Bandpei et al., 2011 [68] | Iran | 223 | 71.7% | |||||||||
| Rambabu and Suneetha 2014 [23] | India | 100 | 11.0% | 5.0% | 20.0% | 8.0% | 5.0% | 8.0% | 12.0% | 16.0% | 15.0% | 37.0% |
| Riaz et al., 2021 [83] | Pakistan | 100 | 37.0% | 21.0% | 45.0% | 35.0% | 5.0% | 22.0% | 9.0% | 10.0% | 18.0% | |
| Szeto et al., 2009 [64] | China | 135 | 82.9% | 52.6% | 68.1% | 57.8% | 80.0% | |||||
| Tan and Kwek 2020 [26] | Singapore | 56 | 66.1% | 19.5% | 37.0% | 39.3% | 8.5% | 42.9% | 5.0% | 16.5% | 21.0% | 87.5% |
| Vaghela et al., 2019 [24] | India | 6.82 | 30.2% | 23.3% | 2.3% | 2.3% | 2.3% | 7.0% | 7.0% | 83.7% | ||
| Europe | ||||||||||||
| Battevi et al., 2009 [73] | Italy | 176 | 16.9% | 9.0% | 25.8% | |||||||
| Cass et al., 2014 [12] | United Kingdom | 128 | 73.4% | 80.5% | 69.5% | 99.0% | ||||||
| Giagio et al., 2019 [11] | Italy | 76 | 78.9% | 55.3% | 71.1% | 51.3% | 3.9% | 26.3% | 14.5% | 18.4% | 18.4% | |
| Giberti et al., 2014 [74] | Italy | 17 | 29.4% | 5.9% | 41.2% | |||||||
| Hyer et al., 2015 [80] | United Kingdom | 518 | 29.6% | 62.4% | ||||||||
| Kaya et al., 2008 [79] | Turkey | 82 | 72.0% | |||||||||
| Mal and Costello 2002 [16] | United Kingdom | 367 | 24.0% | |||||||||
| Matern and Koneczny 2007 [71] | Germany | 425 | 60.0% | 39.0% | ||||||||
| Morandeira-Rivas et al., 2012 [75] | Spain | 78 | 55.0% | 52.0% | 50.0% | 22.0% | 81.0% | |||||
| Quinn and Moohan 2015 [72] | Ireland | 53 | 41.5% | 28.3% | 28.3% | 43.4% | 15.1% | 20.8% | 37.7% | 20.8% | ||
| Rata et al., 2021 [25] | Romania | 95 | 55.8% | 46.3% | 74.7% | 46.3% | 17.7% | 16.8% | 11.6% | 31.6% | 4.2% | 95.8% |
| Ruitenburg et al., 2012 [76] | The Netherlands | 295 | 30.2% | 23.4% | 25.8% | 17.3% | ||||||
| Sari et al., 2010 [77] | The Netherlands | 55 | 15.0% | 26.0% | 45.0% | 73.0% | ||||||
| Stomberg et al., 2010 [21] | Sweden | 101 | 50.0% | 24.0% | 55.0% | 51.0% | 6.0% | 14.0% | 27.0% | 70.0% | ||
| Tjiam et al., 2014 [78] | The Netherlands | 285 | 59.3% | 51.2% | 26.0% | 21.4% | 86.0% | |||||
| Vijendren et al., 2016 [81] | United Kingdom | 323 | 29.7% | 9.0% | 47.4% | |||||||
| Oceania | ||||||||||||
| Grant et al., 2020 [84] | Australia | 329 | 59.0% | 38.0% | 55.0% | 75.0% | ||||||
| 1. Were the Aims/Objectives of the Study Clear? | 2. Was the Study Design Appropriate for the Stated Aim(s)? | 3. Was the Sample Size Justified? | 4. Was the Target/Reference Population Clearly Defined? (Is it Clear Who the Research Was About?) | 5. Was the Sample Frame Taken from An appropriate Population Base so that it Closely Represented the Target/Reference Population Under Investigation? | 6. Was the Selection Process Likely to Select Subjects/Participants that Were Representative of the Target/Reference Population Under Investigation? | 7. Were Measures Undertaken to Address and Categorise Non-Responders? | 8. Were the Risk Factor and Outcome Variables Measured Appropriate to the Aims of the Study? | 9. Were the Risk Factor and Outcome Variables Measured Correctly Using Instruments/Measurements that Had Been Trialled, Piloted or Published Previously? | 10. Is it Clear What Was Used to Determined Statistical Significance and/or Precision Estimates? (e.g., p Values, CIs) | 11. Were the Methods (Including Statistical Methods) Sufficiently Described to Enable Them to Be Repeated? | 12. Were the Basic Data Adequately Described? | 13. Does the Response Rate Raise Concerns About Non-Response Bias? | 14. If Appropriate, Was information About Non-Responders Described? | 15. Were the Results Internally Consistent? | 16. Were the Results for the Analyses Described in the Methods, Presented? | 17. Were the Authors’ Discussions and Conclusions Justified by the Results? | 18. Were the Limitations of the Study Discussed? | 19. Were There Any Funding Sources or Conflicts of Interest That May Affect the Authors’ Interpretation of The Results? * | 20. Was Ethical Approval or Consent of Participants Attained? | Yes | No | Yes (%) | Risk of Biais | |
|---|---|---|---|---|---|---|---|---|---|---|---|---|---|---|---|---|---|---|---|---|---|---|---|---|
| Adams et al., 2013 [10] | Yes | Yes | No | Yes | Yes | Yes | No | Yes | Yes | Yes | Yes | Yes | No | NA | Yes | Yes | Yes | Yes | No | Yes | 16 | 3 | 89% | Low |
| Alnefaie et al., 2019 [37] | Yes | Yes | No | Yes | Yes | Yes | No | Yes | Yes | Yes | Yes | Yes | No | NA | Yes | Yes | Yes | No | No | Yes | 15 | 4 | 84% | Low |
| Alqhatani et al., 2022 [18] | Yes | Yes | No | Yes | Yes | Yes | No | Yes | Yes | Yes | Yes | Yes | No | NA | Yes | Yes | Yes | Yes | No | Yes | 16 | 3 | 89% | Low |
| Alshehri 2022 [70] | Yes | Yes | No | Yes | Yes | Yes | No | Yes | Yes | Yes | Yes | Yes | No | NA | Yes | Yes | Yes | Yes | No | Yes | 16 | 3 | 89% | Low |
| Alzahrani et al., 2016 [38] | Yes | Yes | No | Yes | Yes | Yes | No | Yes | Yes | Yes | Yes | Yes | No | NA | Yes | Yes | Yes | Yes | No | Yes | 16 | 3 | 89% | Low |
| Auerbach et al., 2011 [15] | Yes | Yes | No | Yes | Yes | Yes | No | Yes | Yes | Yes | Yes | Yes | No | NA | Yes | Yes | Yes | Yes | No | Yes | 16 | 3 | 89% | Low |
| Battevi et al., 2009 [73] | Yes | Yes | No | Yes | Yes | Yes | No | Yes | Yes | No | Yes | Yes | No | NA | Yes | Yes | Yes | No | No | Yes | 14 | 5 | 79% | Medium |
| Berguer 1998 [7] | Yes | Yes | No | Yes | Yes | Yes | No | Yes | Yes | No | Yes | Yes | No | NA | Yes | Yes | Yes | No | No | Yes | 14 | 5 | 79% | Medium |
| Bolduc-Beguin et al., 2017 [60] | Yes | Yes | Yes | Yes | Yes | Yes | No | Yes | Yes | Yes | Yes | Yes | No | NA | Yes | Yes | Yes | No | No | Yes | 16 | 3 | 89% | Low |
| Buschbacher 1994 [39] | Yes | Yes | Yes | Yes | Yes | Yes | No | Yes | Yes | Yes | Yes | Yes | No | NA | Yes | Yes | Yes | No | No | Yes | 16 | 3 | 89% | Low |
| Capone et al., 2010 [17] | Yes | Yes | No | Yes | Yes | Yes | No | Yes | Yes | Yes | Yes | Yes | No | NA | Yes | Yes | Yes | Yes | No | Yes | 16 | 3 | 89% | Low |
| Cass et al., 2014 [12] | Yes | Yes | No | Yes | Yes | Yes | No | Yes | Yes | Yes | Yes | Yes | No | NA | Yes | Yes | Yes | Yes | No | Yes | 16 | 3 | 89% | Low |
| Cavanagh et al., 2012 [40] | Yes | Yes | No | Yes | Yes | Yes | No | Yes | Yes | Yes | Yes | Yes | No | NA | Yes | Yes | Yes | Yes | No | Yes | 16 | 3 | 89% | Low |
| Cohen-Rosenblum et al., 2022 [14] | Yes | Yes | No | Yes | Yes | Yes | No | Yes | Yes | Yes | Yes | Yes | No | NA | Yes | Yes | Yes | Yes | No | Yes | 16 | 3 | 89% | Low |
| Dabholkar et al., 2015 [4] | Yes | Yes | No | Yes | Yes | Yes | No | Yes | Yes | No | Yes | Yes | No | NA | Yes | Yes | Yes | Yes | No | Yes | 15 | 4 | 84% | Low |
| Dabholkar et al., 2017 [65] | Yes | Yes | No | Yes | Yes | Yes | No | Yes | Yes | Yes | Yes | Yes | No | NA | Yes | Yes | Yes | No | No | Yes | 15 | 4 | 84% | Low |
| Davis et al., 2013 [41] | Yes | Yes | No | Yes | Yes | Yes | No | Yes | Yes | No | Yes | Yes | No | NA | Yes | Yes | Yes | Yes | No | Yes | 15 | 4 | 84% | Low |
| Davis et al., 2014 [22] | Yes | Yes | No | Yes | Yes | Yes | No | Yes | Yes | No | Yes | Yes | No | NA | Yes | Yes | Yes | No | No | Yes | 14 | 5 | 79% | Medium |
| Dhimitri et al., 2005 [42] | Yes | Yes | No | Yes | Yes | Yes | No | Yes | Yes | Yes | Yes | Yes | No | NA | Yes | Yes | Yes | No | No | Yes | 15 | 4 | 84% | Low |
| Diaconita et al., 2019 [61] | Yes | Yes | No | Yes | Yes | Yes | No | Yes | Yes | Yes | Yes | Yes | No | NA | Yes | Yes | Yes | No | No | Yes | 15 | 4 | 84% | Low |
| Dianat et al., 2018 [66] | Yes | Yes | No | Yes | Yes | Yes | No | Yes | Yes | Yes | Yes | Yes | No | NA | Yes | Yes | Yes | Yes | No | Yes | 16 | 3 | 89% | Low |
| Esser et al., 2007 [43] | Yes | Yes | No | Yes | Yes | Yes | No | Yes | Yes | No | Yes | Yes | No | NA | Yes | Yes | Yes | No | No | Yes | 14 | 5 | 79% | Medium |
| Forst et al., 2006 [44] | Yes | Yes | No | Yes | Yes | Yes | No | Yes | Yes | Yes | Yes | Yes | No | NA | Yes | Yes | Yes | Yes | No | Yes | 16 | 3 | 89% | Low |
| Franasiak et al., 2012 [45] | Yes | Yes | No | Yes | Yes | Yes | No | Yes | Yes | Yes | Yes | Yes | No | NA | Yes | Yes | Yes | Yes | No | Yes | 16 | 3 | 89% | Low |
| Franasiak et al., 2014 [46] | Yes | Yes | No | Yes | Yes | Yes | No | Yes | Yes | No | Yes | Yes | No | NA | Yes | Yes | Yes | Yes | No | Yes | 15 | 4 | 84% | Low |
| Giagio et al., 2019 [11] | Yes | Yes | Yes | Yes | Yes | Yes | No | Yes | Yes | Yes | Yes | Yes | No | NA | Yes | Yes | Yes | Yes | No | Yes | 17 | 2 | 95% | Low |
| Giberti et al., 2014 [74] | Yes | Yes | No | Yes | Yes | Yes | No | Yes | Yes | Yes | Yes | Yes | No | NA | Yes | Yes | Yes | Yes | No | Yes | 16 | 3 | 89% | Low |
| Gofrit et al., 2008 [47] | Yes | Yes | No | Yes | Yes | Yes | No | Yes | Yes | Yes | Yes | Yes | No | NA | Yes | Yes | Yes | No | No | Yes | 15 | 4 | 84% | Low |
| Goldstein et al., 2004 [48] | Yes | Yes | No | Yes | Yes | Yes | No | Yes | Yes | No | Yes | Yes | No | NA | Yes | Yes | Yes | Yes | No | Yes | 15 | 4 | 84% | Low |
| Grant et al., 2020 [84] | Yes | Yes | Yes | Yes | Yes | Yes | No | Yes | Yes | Yes | Yes | Yes | No | NA | Yes | Yes | Yes | Yes | No | Yes | 17 | 2 | 95% | Low |
| Hansel et al., 2008 [49] | Yes | Yes | No | Yes | Yes | Yes | No | Yes | Yes | Yes | Yes | Yes | No | NA | Yes | Yes | Yes | Yes | No | Yes | 16 | 3 | 89% | Low |
| Hemal et al., 2001 [19] | Yes | Yes | No | Yes | Yes | Yes | No | Yes | Yes | Yes | Yes | Yes | No | NA | Yes | Yes | Yes | No | No | Yes | 15 | 4 | 84% | Low |
| Ho et al., 2018 [50] | Yes | Yes | No | Yes | Yes | Yes | No | Yes | Yes | Yes | Yes | Yes | No | NA | Yes | Yes | Yes | Yes | No | Yes | 16 | 3 | 89% | Low |
| Hyer et al., 2015 [80] | Yes | Yes | No | Yes | Yes | Yes | No | Yes | Yes | Yes | Yes | Yes | No | NA | Yes | Yes | Yes | Yes | No | Yes | 16 | 3 | 89% | Low |
| Johnston et al., 2005 [51] | Yes | Yes | No | Yes | Yes | Yes | No | Yes | Yes | No | Yes | Yes | No | NA | Yes | Yes | Yes | Yes | No | Yes | 15 | 4 | 84% | Low |
| Kaya et al., 2008 [79] | Yes | Yes | No | Yes | Yes | Yes | No | Yes | Yes | No | Yes | Yes | No | NA | Yes | Yes | Yes | No | No | Yes | 14 | 5 | 79% | Medium |
| Kitzmann et al., 2012 [52] | Yes | Yes | No | Yes | Yes | Yes | No | Yes | Yes | Yes | Yes | Yes | No | NA | Yes | Yes | Yes | Yes | No | Yes | 16 | 3 | 89% | Low |
| Klein et al., 2015 [53] | Yes | Yes | No | Yes | Yes | Yes | No | Yes | Yes | Yes | Yes | Yes | No | NA | Yes | Yes | Yes | Yes | No | Yes | 16 | 3 | 89% | Low |
| Knudsen et al., 2014 [54] | Yes | Yes | No | Yes | Yes | Yes | No | Yes | Yes | No | Yes | Yes | No | NA | Yes | Yes | Yes | Yes | No | Yes | 15 | 4 | 84% | Low |
| Lee et al., 2017 [55] | Yes | Yes | No | Yes | Yes | Yes | No | Yes | Yes | Yes | Yes | Yes | No | NA | Yes | Yes | Yes | Yes | No | Yes | 16 | 3 | 89% | Low |
| Liang et al., 2012 [56] | Yes | Yes | No | Yes | Yes | Yes | No | Yes | Yes | Yes | Yes | Yes | No | NA | Yes | Yes | Yes | Yes | No | Yes | 16 | 3 | 89% | Low |
| Liang et al., 2013 [63] | Yes | Yes | No | Yes | Yes | Yes | No | Yes | Yes | Yes | Yes | Yes | No | NA | Yes | Yes | Yes | Yes | No | Yes | 16 | 3 | 89% | Low |
| Liberman et al., 2005 [57] | Yes | Yes | No | Yes | Yes | Yes | No | Yes | Yes | Yes | Yes | Yes | No | NA | Yes | Yes | Yes | Yes | No | Yes | 16 | 3 | 89% | Low |
| Mal and Costello 2002 [16] | Yes | Yes | No | Yes | Yes | Yes | No | Yes | Yes | Yes | Yes | Yes | No | NA | Yes | Yes | Yes | No | No | Yes | 15 | 4 | 84% | Low |
| Matern and Koneczny 2007 [71] | Yes | Yes | No | Yes | Yes | Yes | No | Yes | Yes | No | Yes | Yes | No | NA | Yes | Yes | Yes | No | No | Yes | 14 | 5 | 79% | Medium |
| Mehrifar et al., 2015 [67] | Yes | Yes | No | Yes | Yes | Yes | No | Yes | Yes | No | Yes | Yes | No | NA | Yes | Yes | Yes | No | No | Yes | 14 | 5 | 79% | Medium |
| Mirbod et al. 1995 [69] | Yes | Yes | No | Yes | Yes | Yes | No | Yes | Yes | Yes | Yes | Yes | No | NA | Yes | Yes | Yes | No | No | Yes | 15 | 4 | 84% | Low |
| Mohseni-Bandpei et al., 2011 [68] | Yes | Yes | No | Yes | Yes | Yes | No | Yes | Yes | Yes | Yes | Yes | No | NA | Yes | Yes | Yes | Yes | No | Yes | 16 | 3 | 89% | Low |
| Morandeira-Rivas et al., 2012 [75] | Yes | Yes | No | Yes | Yes | Yes | No | Yes | Yes | Yes | Yes | Yes | No | NA | Yes | Yes | Yes | Yes | No | Yes | 16 | 3 | 89% | Low |
| O’Sullivan 2002 [62] | Yes | Yes | No | Yes | Yes | Yes | No | Yes | Yes | No | Yes | Yes | No | NA | Yes | Yes | Yes | Yes | No | Yes | 15 | 4 | 84% | Low |
| Plerhoples et al., 2012 [20] | Yes | Yes | No | Yes | Yes | Yes | No | Yes | Yes | Yes | Yes | Yes | No | NA | Yes | Yes | Yes | Yes | No | Yes | 16 | 3 | 89% | Low |
| Quinn and Moohan 2015 [72] | Yes | Yes | No | Yes | Yes | Yes | No | Yes | Yes | Yes | Yes | Yes | No | NA | Yes | Yes | Yes | No | No | Yes | 15 | 4 | 84% | Low |
| Rambabu and Suneetha 2014 [23] | Yes | Yes | No | Yes | Yes | Yes | No | Yes | Yes | No | Yes | Yes | No | NA | Yes | Yes | Yes | Yes | No | Yes | 15 | 4 | 84% | Low |
| Rata et al., 2021 [25] | Yes | Yes | No | Yes | Yes | Yes | No | Yes | Yes | Yes | Yes | Yes | No | NA | Yes | Yes | Yes | Yes | No | Yes | 16 | 3 | 89% | Low |
| Riaz et al., 2021 [83] | Yes | Yes | Yes | Yes | Yes | Yes | No | Yes | Yes | Yes | Yes | Yes | No | NA | Yes | Yes | Yes | Yes | No | Yes | 17 | 2 | 95% | Low |
| Ruitenburg et al., 2012 [76] | Yes | Yes | No | Yes | Yes | Yes | No | Yes | Yes | Yes | Yes | Yes | No | NA | Yes | Yes | Yes | No | No | Yes | 15 | 4 | 84% | Low |
| Sari et al., 2010 [77] | Yes | Yes | No | Yes | Yes | Yes | No | Yes | Yes | Yes | Yes | Yes | No | NA | Yes | Yes | Yes | Yes | No | Yes | 16 | 3 | 89% | Low |
| Sivak-Callcott et al., 2011 [58] | Yes | Yes | No | Yes | Yes | Yes | No | Yes | Yes | Yes | Yes | Yes | No | NA | Yes | Yes | Yes | No | No | Yes | 15 | 4 | 84% | Low |
| Stomberg et al., 2010 [21] | Yes | Yes | No | Yes | Yes | Yes | No | Yes | Yes | Yes | Yes | Yes | No | NA | Yes | Yes | Yes | Yes | No | Yes | 16 | 3 | 89% | Low |
| Szeto et al., 2009 [64] | Yes | Yes | No | Yes | Yes | Yes | No | Yes | Yes | Yes | Yes | Yes | No | NA | Yes | Yes | Yes | Yes | No | Yes | 16 | 3 | 89% | Low |
| Tan and Kwek 2020 [26] | Yes | Yes | No | Yes | Yes | Yes | No | Yes | Yes | Yes | Yes | Yes | No | NA | Yes | Yes | Yes | Yes | No | Yes | 16 | 3 | 89% | Low |
| Tjiam et al., 2014 [78] | Yes | Yes | No | Yes | Yes | Yes | No | Yes | Yes | Yes | Yes | Yes | No | NA | Yes | Yes | Yes | Yes | No | Yes | 16 | 3 | 89% | Low |
| Trejo et al., 2006 [59] | Yes | Yes | No | Yes | Yes | Yes | No | Yes | Yes | Yes | Yes | Yes | No | NA | Yes | Yes | Yes | No | No | Yes | 15 | 4 | 84% | Low |
| Vaghela et al., 2019 [24] | Yes | Yes | No | Yes | Yes | Yes | No | Yes | Yes | No | Yes | Yes | No | NA | Yes | Yes | Yes | Yes | No | Yes | 15 | 4 | 84% | Low |
| Vijendren et al., 2016 [81] | Yes | Yes | No | Yes | Yes | Yes | No | Yes | Yes | No | Yes | Yes | No | NA | Yes | Yes | Yes | Yes | No | Yes | 15 | 4 | 84% | Low |
| Voss et al., 2016 [3] | Yes | Yes | No | Yes | Yes | Yes | No | Yes | Yes | Yes | Yes | Yes | No | NA | Yes | Yes | Yes | Yes | No | Yes | 16 | 3 | 89% | Low |
| Wohlauer et al., 2021 [36] | Yes | Yes | No | Yes | Yes | Yes | No | Yes | Yes | Yes | Yes | Yes | No | NA | Yes | Yes | Yes | Yes | No | Yes | 16 | 3 | 89% | Low |
| Wolf et al., 2000 [13] | Yes | Yes | No | Yes | Yes | Yes | No | Yes | Yes | Yes | Yes | Yes | No | NA | Yes | Yes | Yes | No | No | Yes | 15 | 4 | 84% | Low |
| Rank | 1 | 2 | 3 |
|---|---|---|---|
| Neck | Europe (48.8%) | Asia (41.5%) | America (40.2%) |
| Upper back | Europe (36.5%) | Asia (29.0%) | America (28.9%) |
| Lower back | Asia (45.4%) | Europe (39.6%) | America (38.2%) |
| Shoulder | Europe (42.7%) | America (30.3%) | Asia (28.1%) |
| Elbow | America (13.9%) | Europe (12.6%) | Asia (9.0%) |
| Wrist | Europe (26.7%) | America (25.2%) | Asia (21.4%) |
| Hip | Asia (12.1%) | America (7.7%) | - |
| Knee | Europe (23.8%) | Asia (17.8%) | America (12.8%) |
| Ankle | Asia (20.1%) | Europe (13.5%) | America (12.4%) |
| Overall | Asia (77.6%) | Europe (73.1%) | America (62.8%) |
| Rank | America | Asia | Europe |
|---|---|---|---|
| 1 | Neck (40.2%) | Lower back (45.4%) | Neck (48.8%) |
| 2 | Lower back (38.2%) | Neck (41.5%) | Shoulder (42.7%) |
| 3 | Shoulder (30.3%) | Upper back (29.0%) | Lower back (39.6%) |
| 4 | Upper back (28.9%) | Shoulder (28.1%) | Upper back (36.5%) |
| 5 | Wrist (25.2%) | Wrist (21.4%) | Wrist (26.7%) |
| 6 | Elbow (13.9%) | Ankle (20.1%) | Knee (23.8%) |
| 7 | Knee (12.8%) | Knee (17.8%) | Ankle (13.5%) |
| 8 | Ankle (12.4%) | Hip (12.1%) | Elbow (12.6%) |
| 9 | Hip (7.7%) | Elbow (9.0%) | - |
Disclaimer/Publisher’s Note: The statements, opinions and data contained in all publications are solely those of the individual author(s) and contributor(s) and not of MDPI and/or the editor(s). MDPI and/or the editor(s) disclaim responsibility for any injury to people or property resulting from any ideas, methods, instructions or products referred to in the content. |
© 2025 by the authors. Licensee MDPI, Basel, Switzerland. This article is an open access article distributed under the terms and conditions of the Creative Commons Attribution (CC BY) license (https://creativecommons.org/licenses/by/4.0/).
Share and Cite
Gorce, P.; Jacquier-Bret, J. Continental Assessment of Work-Related Musculoskeletal Disorders Prevalence Among Surgeons: Systematic Review and Meta-Analysis. J. Funct. Morphol. Kinesiol. 2025, 10, 221. https://doi.org/10.3390/jfmk10020221
Gorce P, Jacquier-Bret J. Continental Assessment of Work-Related Musculoskeletal Disorders Prevalence Among Surgeons: Systematic Review and Meta-Analysis. Journal of Functional Morphology and Kinesiology. 2025; 10(2):221. https://doi.org/10.3390/jfmk10020221
Chicago/Turabian StyleGorce, Philippe, and Julien Jacquier-Bret. 2025. "Continental Assessment of Work-Related Musculoskeletal Disorders Prevalence Among Surgeons: Systematic Review and Meta-Analysis" Journal of Functional Morphology and Kinesiology 10, no. 2: 221. https://doi.org/10.3390/jfmk10020221
APA StyleGorce, P., & Jacquier-Bret, J. (2025). Continental Assessment of Work-Related Musculoskeletal Disorders Prevalence Among Surgeons: Systematic Review and Meta-Analysis. Journal of Functional Morphology and Kinesiology, 10(2), 221. https://doi.org/10.3390/jfmk10020221