Abstract
Executing the obligation of strengthened concrete is essential in investigating load exchanges from concrete to the inner reinforcing bar. The bond–displacement conduct and extreme pullout quality for pullout samples are essential information related to the durability of RC structures. The slip in the interface is basically due to a contrast in stresses between concrete and reinforcement. This distinction brings about the start of the split in encompassing concrete. This study examined the simple pullout solid 3D cylinder model strengthened by a reinforced steel bar, considered a line element for bond–slip conduct. The non-linear finite element model utilizing ANSYS software was established to concentrate on the concrete and steel reinforcement bond. Material nonlinearity because of cracking, crushing of concrete, and the steel reinforcing bar’s yielding were investigated. Test results showed that: a prediction model for early-age bond stress–slip relationship between steel bars and concrete was proposed based on modeling, which showed good agreement with test results. The precision of this model is explored by contrasting the finite element numerical analysis and that anticipated from test consequences of pullout examples. Immense homogeneity between the model and test results was found. This study could provide more accurate bond properties for structural analysis and design.
1. Introduction
The capacity to utilize strengthened concrete as a basic material is taken from a mix of concrete that is solid in compression with strengthening steel that is strong and malleable in tension. Keeping up composite activity requires an exchange of load between the concrete and steel, which is called a bond. Bonds can be initiated under different activities such as pure tension, pullout, push-in, etc. [,,,,,]. The determination of any of these loading strategies relies on numerous variables, such as attributes of the reinforcing bar, the concrete’s physical properties, and the geometry of the involved parts. Several methods can be used to investigate the bond between concrete and steel. These tests can widely be divided into two categories: pullout tests and beam tests [,,,]. The first category, pullout tests, involves the concentric and eccentric bars embedded in the pullout specimen. The other category is flexure beam tests such as the Texas bond beam test. The current tests belong to the determination of bond behavior of steel rebar and have been well-tested and deeply reviewed by researchers [,,,,]. So far, no test has been standardized to evaluate the bond strength. Both methods, direct tension pullout or the standard pullout test, which are used to assess the bond between steel and concrete, are traditionally and most broadly used, due to their simplicity and ease in fabrication. The standard form to explain the real position of the bar has been described in many technical reports and was considered in this study. The pullout test sample consists of a bar usually embedded concentrically in the center of a concrete cube or cylinder, and the force that makes the bar slip or pullout from the surrounding concrete is measured as shown in (Figure 1). ASTM-C 234 [] developed the pullout test but later withdrew it due to inconsistent test results. As reported by [], this test can only be used practically when it needs to compare the relative local bond resistance rather than obtaining the real bond resistance. Regarding the shape of the concrete specimen and the location of the bonded length, there are two different approaches based on Figure 1 that have been undertaken in the literature. Some researchers, such as RILEM [] and Sonebi [], have supported using the cube with bond length at the bar end, while others, such as [,], have supported using the cylindrical specimen due to it providing the same cover all around the bar specimen, with the bonded length provided in the center. The cylindrical specimen has a better performance in the bond strength between steel bars and concrete. In the situation of the cylindrical specimen, as shown in Figure 2, when the bar slips, there is high bond stress near the loaded end, while the other bar end is free from any stress.
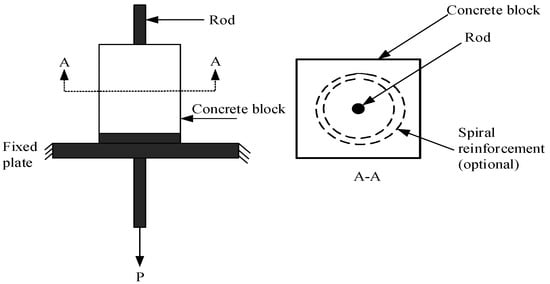
Figure 1.
Schematic diagram for pullout test [].
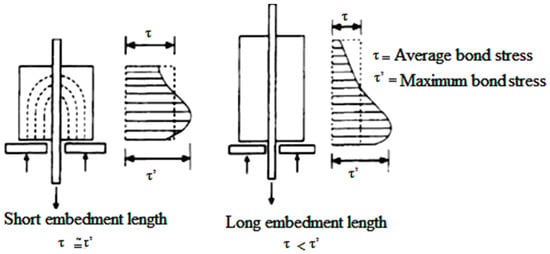
Figure 2.
Stress profile in pullout test specimen with short and long bonded lengths.
Usually, as the result of an applied load effect to a bar embedded in a specimen, the demonstrated slip can be recorded and measured continuously over a certain range until the specimen fracture occurs. This will be clearly noted at the complete bond–slip relationship stage. It is well known that the effects of the anchorage length of the bar by the bond stress vary along the anchorage length. This has led to the use of shorter bonded lengths over which the bond stress is taken to be more or less uniform or constant. The short embedment length as a length of 5 db and long embedment length of 10 db to 15 db were specified by []. Based on their study, the relevant bond stress behavior is labeled as local bond stress–slip. In addition, the relationship between local bonds and stress–slip can be used effectively for the numerical modeling of concrete structures. Then, the longer embedment length can be extrapolated successfully by an established numerical modeling approach. A summary of the proposed bond lengths based on various research is given in Table 1. The different approaches used for the pullout test are given in Table 2. On the other hand, the admiration of bond in finite element technique (FEM) permits considering a few phenomenon: plasticity, contact, cracking, etc. This might be the motivation behind why FEM has been connected to bond modeling by a few scientists, beginning with the founding work of [,,,,] to the up-to-date progressions. It can be stated that previous studies have mainly focused on experimentally evaluating load exchange from the concrete to the inner reinforcing bar and bond strength in reinforced concrete elements. To obtain a better understanding of the bond–slip conduct, material nonlinearity, crushing of concrete, and the steel reinforcing bar’s yielding are required to be assessed numerically in detail. In this study, the test measures the force required to pull out a formerly cast-in steel embed contained in a solid cylinder of concrete. In this operation, either the reinforcing bar or a cone of concrete is pulled out, and the force required for this operation is identified with the compressive quality of concrete. In addition, in the present work, simple pullout tension test specimens are modeled in the Finite Element (FE) framework using ANSYS 15.0. It is commonly known that by varying the reinforcement, grades have shown no change in bond-stress behavior. However, sufficient development length needs to be provided to develop the required stress in reinforcement.

Table 1.
Proposed bond lengths based on various research.

Table 2.
Summary of different approaches of pullout tests to evaluate bond strength [M. Yousaf].
2. Experimental Work
Execution of the pullout test was a part of the extensive experimentation that has been used to simulate the actual stress field that produces in the tension zone of flexural elements through the concrete cover surrounding the reinforcement [,,]. The pullout test scheme studied the effect of different parameters on the bond strength of the steel embedded in cylindrical concrete. However, this pullout test approach does not simulate the actual stress condition as prevails in the beam and thus has been objected to by various researchers and has not received an ACI code. However, this is generally utilized to gain an idea about the stress state between steel and concrete. Then, the established FE modeling approaches can provide a desirable prediction of structural element behavior, which leads to a reduction in the large requested numbers of experiments in a certain studied case. On the other hand, the validated numerical analysis model should take into account that reliable test results are essential and are the basic process to determine the correct convergent result of FEM results which can then be assessed for other affected parameters. In this study, after the pullout tests, the same was validated using the numerical approach utilizing ANSYS code. The main process of the experimental part has been summarized in the flowing subsection.
2.1. Cast of Testing Samples
In this study, different diameters of deformed bars, 13 mm, 16 mm, and 19 mm, were used in the casting and testing of direct tension pullout specimens. Each one of these bars was embedded in 150 × 300 mm cylinders. According to the same concept in the available literature, the embedment lengths chosen with each sample were 5 db and 10 db, which were considered to give representative bond strengths. Then, the remaining bar length was de-bonded by mounting the PVC pipe sleeves, same as in []. In order to achieve a properly tight grip, the sleeves were tightened against the bars by using wooden or plywood chips. In addition, to ensure proper sealing between the bar and the concrete, silicone gel was applied at both ends of the sleeves. More details of the pullout test specimens are given in Table 3. It is worth mentioning that there is a clear difference between the measurement of a deformed bar’s diameter and that of plain bars due to surface lugs. So, the rebar should comply with allowable “variation in mass (VIM)” in lieu of diameter measurement. In the present work, to check for this VIM, a rebar of 1 m has been weighed, and the diameter was found using steel density and then compared with maximum tolerance given in the standard. Typical geometrical properties for the rebar used and parameters for a 13 mm bar based on ASTM standard are given in Table 4 and Table 5, respectively. According to ASTM A-370-03A specifications, the tensile characteristics of steel bars such as stress and modulus of elasticity used were measured. The average modulus of elasticity of steel bars was considered, which is equal to 210 GPa. The average value of the modulus of elasticity of steel bars was considered, which is equal to 210 GPa. The test of the steel bar under direct tension was shown in Figure 3. Figure 4 shows how pullout test samples are made and how long it takes for them to cure. Figure 5 shows a picture of the test set-up and a diagram of how it works.

Table 3.
Details of pullout test scheme.

Table 4.
Typical geometrical properties for the rebar used (α = rib angle ≈ 65°).

Table 5.
Typical measurement for 13 mm rebar diameter.
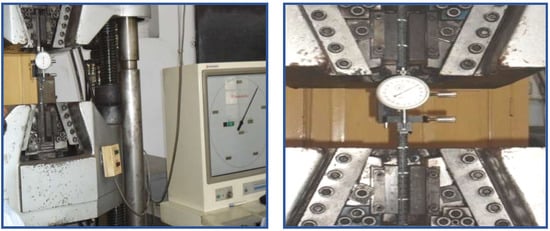
Figure 3.
Steel bar tension test in progress using digital UTM (ASTM A-370-03).
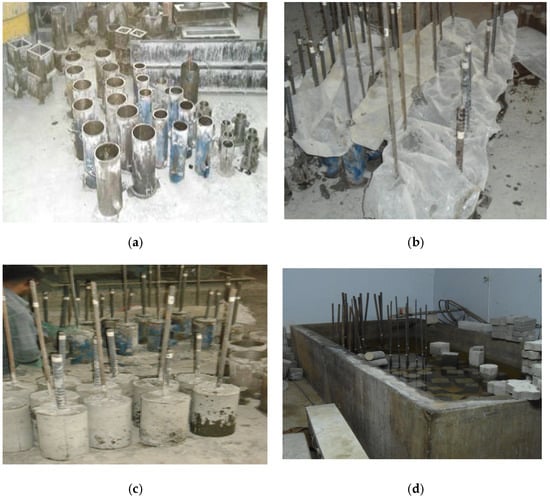
Figure 4.
Casting–testing process: (a) Molds ready for casting; (b) Pullout samples after pouring; (c) Capped test samples after pouring; (d) Curing of test samples.
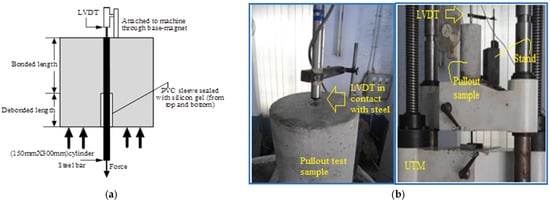
Figure 5.
Experimental setup of tested samples: (a) Schematic diagram and (b) actual arrangement for pullout test with sample.
The same laboratory conditions as in the trials have been followed in the casting of the pullout test specimens, and the bar in each sample was kept concentric with the concrete cylinders. After finishing casting, and to avoid moisture evaporation for 24 h, the specimens were covered completely with polythene bags. Then, the samples were placed in the curing water tank. To obtain proper curing, concrete samples fully immersed in the water were applied, but the steel bars were protruding out of the water to avoid the water’s effects on steel material.
2.2. Testing of Pullout Test Specimens
After curing and drying, pullout test samples were put inverted in Schimadzu UTM in such a way that the LVDT tip was placed in contact with the steel in the middle of the pullout test sample, as shown in Figure 5b. The monotonic pullout force was applied to the steel bar, through displacement-controlled UTM at a rate of 1 mm/min (0.0166 mm/s) controlled with computer software “Trapezium”, and the steel displacement concerning stationary platen of the machine was recorded by data acquisition system via the data logger. Ignoring the small decrease in length of the cylinder, the same displacement may be considered the end slip of the bar [].
3. Experimental Results
The observed performance of the tested samples under different loading rates has been obtained. The photographic summaries displayed typical pullout test samples after failure. Figure 6 clearly shows the crack and failure modes of the samples after applied loads and until they reached the partial or total pullouts in some specimen responses. The main results of the pullout test samples for bonded length are summarized in Table 6.
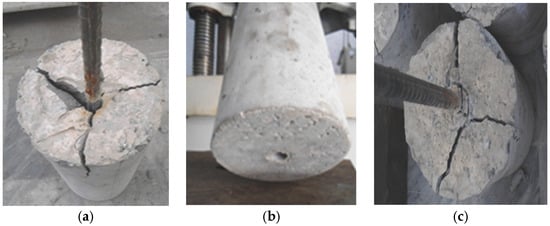
Figure 6.
Typical Pullout test samples after failure: (a) #16 D bar; (b) #13 D bar; (c) 19 D bar.

Table 6.
The main results of pullout test samples for bond length 10 db.
3.1. Finite Element Modeling
Finite Element Analysis, a branch of Solid Mechanics, is a numerical technique strategy usually utilized for Metaphysics issues. FEM subdivides an expansive issue into smaller, more straightforward parts, called a finite element. An established FE Analysis method that can be used is the nonlinear comparison of force and displacement. Contrary to linear elastic analysis, the nonlinear analysis may have more than one solution and needs the use of an incremental procedure to guarantee a valid result. The fundamental and decisive features in nonlinear analysis to ensure maintaining an equilibrium path during analysis are as follows: first, the incremental load procedure (force-controlled, displacement-controlled, etc.); second, the iteration solution scheme (Newton–Raphson method, etc.); and third, the solution convergence criteria. Any method of load increment in software codes can be adopted by keeping in view the physics or nature of the problem. Commonly, the procedure of load-displacement control has been adopted for a structural nonlinear solution. In addition, any type of incremental load procedure can be chosen for analysis based upon the graphical representation of the load versus displacement performance, which characterizes the overall behavior of the problem (termed as the equilibrium path). Usually, computer codes use the Newton–Raphson method by default, where the convergence norms are set through conducting several trials. In the present work, simple pullout tension test specimens are modeled in the Finite Element (FE) framework using ANSYS 15.0.
In ANSYS, two approaches are generally used to run the analysis. One is force control and the other is displacement control. In the force control approach, force is required to be applied to the model, and in analysis, the force–slip curve will never go to a negative slope due to convergence problems. The load control method is utilized for the structural element models. Consistently expanding force is exerted, and the limit points (the points on the equilibrium way the tangent becomes flat) are not to be examined. The outcome for this situation diverges because the exerted load shown by ANSYS is higher than the load-carrying capacity of the model, and global failure is shown by the model. So, in this approach, the complete collapse of the model will never take place. As an alternative to the previous method, the displacement control approach is utilized. In the displacement control approach, displacement is required to be applied to the model. The displacement applied to the model produces stresses bringing about forces at these nodes. The summation of these nodal forces, aside from the minus sign, gives the aggregate sum of response proportional to externally applied load brought about by recommended displacement. It will give the failure of the model. In this paper, the displacement control approach is used to obtain the solution. Some steps to achieve accurate results by using the mentioned approach have been detailed in the following subsections.
3.2. Choice of the Method
The appropriate decision of the incremental techniques relies on the structural response curve. In the displacement controlled approach, the tangential stiffness matrix technique is better adopted, bringing about quicker convergence behavior of the iteration procedure, and so the displacement control method is considered to offer a favorable position overload control method. In addition, in the displacement control approach, inverse to that of the force-controlled technique, the stiffness matrix becomes singular at limit points, indicating either global failure or local maximum on the force–slip curve. In the displacement technique, the model is able to assess passing limit points where load control falls flat. In addition, the load control approach dominates over the displacement control approach if the structural element is asymmetrically reinforced [].
3.3. Solution-Convergence Criteria
In the nonlinear examination, convergence conditions are controlled by utilizing the norms of force, displacement, or both. When all is said to be done, the determination of norms of convergence criteria and related tolerance relies on the expert’s determination of norms of convergence criteria and related tolerance relies on the expert’s experience or the number of trials managing the investigation of structural designing structures. Criteria based upon the displacement approach appear to be characteristic yet, for the most part, not fitting. These can be misleading, particularly in asymmetric reinforcement itemizing that load criteria are dependable, as it checks the accomplishment of equilibrium within indicated tolerance. However, it cannot follow the equilibrium path beyond the limit point []. Along these lines, it appears to be ideal to utilize both force and displacement norms simultaneously. The tolerance of the ANSYS code and the convergence criteria must not be too loose or too tight, making the outcomes inaccurate or expanding iteration beyond the manageable point. In general, there are many advantages of FE analysis that that can be obtained through solution-convergence of the ANSYS, such as the subdivision of an entire domain into more simple parts. The following are a few points of interest: precise representation of complex geometry, consideration of different material properties, simple illustration of solutions, and the choice of cost- and time-effective methods for analyzing complex geometry.
3.4. Modeling Methodology
3.4.1. Geometry and Element Type
The first step in initializing the analysis is to produce geometry. Geometry includes the modeling of the concrete cylinder and steel rebar. The specimen is a concrete cylinder of 150 mm diameter and 300 mm length, with a single concentric plain bar. Three types of specimens (having bar diameters #13, #16, and #19) are used in this study. The modeling elements include concrete mold and reinforcement rebar. The solid brick component, SOLID65, was used to display the concrete in the ANSYS program. The solid component has eight nodes with three degrees of freedom at every node, interpreted in the nodal x, y, and z directions. The component is equipped for plastic deformation and splitting in three orthogonal directions. The two-node LINK180 bar component was utilized to show the steel reinforcement. At every node, the degrees of freedom are indistinguishable from those for the SOLID65. The component is moreover equipped for plastic deformation. Combin39 was used to model the bond between concrete and steel. It is also a two-node element. It is a unidirectional element. It has three degrees of freedom at each node. The detail regarding the input fundamental properties is enlisted in Table 7.

Table 7.
Element properties and behavior.
3.4.2. Material Properties
To model the concrete components reinforced by steel bars, ANSYS software 2016 R1 (15) was employed in this study. In ANSYS, to define the material behavior of concrete, the nonlinear elastic property of ANSYS was used. To model the reinforced structures, we need to give the stress–strain relation of concrete and steel, as given by their graphical display in Figure 6 and Figure 7, respectively. Some coefficients are used to define the different parameters of concrete in ANSYS code, as given in Table 8. To model the bond between concrete and steel, Combin39 is used, which is influenced by the load–slip curve. The load–slip data extracted from pullout tests were fed into ANSYS for simulation purposes for every sample. Typical data for #13 with 10 db are given in Table 9.
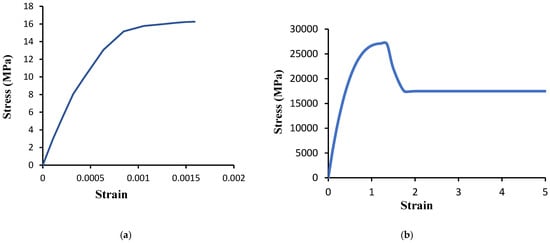
Figure 7.
Typical stress–strain curve used for (a) concrete and (b) steel.

Table 8.
Coefficients used for concrete.

Table 9.
Force–slip data for Combination.
3.4.3. Meshing and Load Application Adjustment
The actual behavior of the tested concrete reinforced with steel bars was modeled and simulated appropriately to obtain exact results in a reasonable computational period. The sweep command is used for meshing of concrete, and the steel bar is meshed so that the nodes of steel and concrete lie exactly over each other. A solid element brick (SOLID65) with three translational degrees of freedom was used to model the concrete and filling materials. The interpolation functions for displacements and capability to model cracks and crushing behavior can be achieved by this element. The 3D spar element (LINK180) with two nodes was used to simulate the steel bar. Each node in this element has three translational DOF, which improves the capability and nonlinearity of plastic deformation. For the displacement control arrangement, displacement is applied at the top node of the rebar in order to pull it out from the concrete specimen. Boundary conditions are already adjusted, as those are already known from the experiment. To avoid non-convergence problems, the load has been applied in small increments, same as recommended in testing. At the loading convergence, each load increment end intolerance limit has been obtained by using Raphson equilibrium iterations. The greatest anticipated displacement value is given to the computer to produce displacement values. In this study, UZ was given a displacement of 1 mm in the vertical bearing on the tip node of the rebar. Figure 7 shows the typical stress-strain curve used for (a) concrete and (b) steel.
4. Modeling Results and Discussion
In this paper, different pullout assemblies were modeled to understand the modeling of reinforced structures and obtain results in comparison with the experimental results. The displacement control technique is used to examine the pullout specimens. Force–slip relations have been established from the finite element analysis and then compared with experimental results. The corresponding results have been detailed in the following figures. In the following ANSYS contour, we can examine that the concrete fails from the corner, and the steel bar is pulled out with a wedge cone. In addition, the curve generated by the code confirms this mode of failure. For this model, the bonded lengths of 10 db and 5 db have been generated. Figure 8, Figure 9 and Figure 10 show the stress of the steel bar at failure and the generated curves of load and slip for bond 10 db and bond 5 db of #13 Diameter, #16 Diameter, and of #19 Diameter. There is also a comparison of the force–slip curve with experimental data for each bonded length of bars shown in Figure 11.
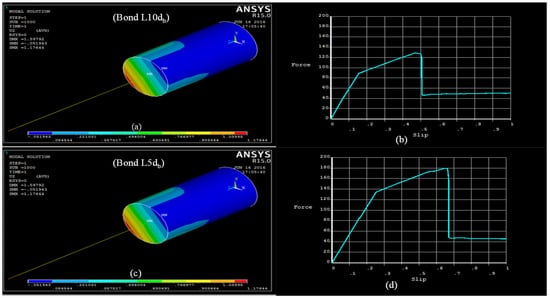
Figure 8.
Stress of #13 diameter bar at failure and the generated curve (a,b) for bond 10 db and (c,d) for bond 5 db.
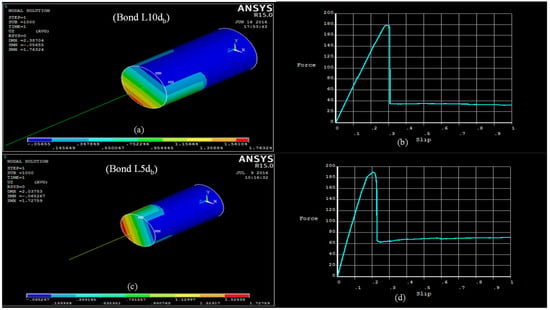
Figure 9.
Stress of #16 diameter bar at failure and generated curves (a,b) for bond 10 db and (c,d) for bond5 db.
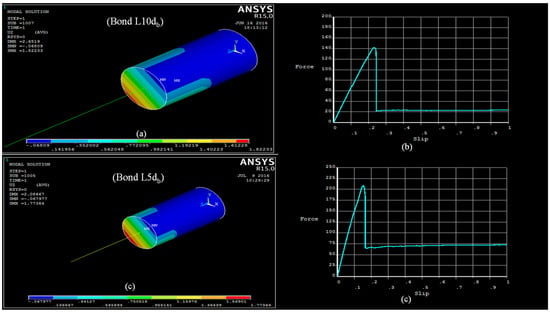
Figure 10.
Stress of #19 diameter bar at failure and generated curves (a,b) for bond10 db, (c,d) for bond5 db.
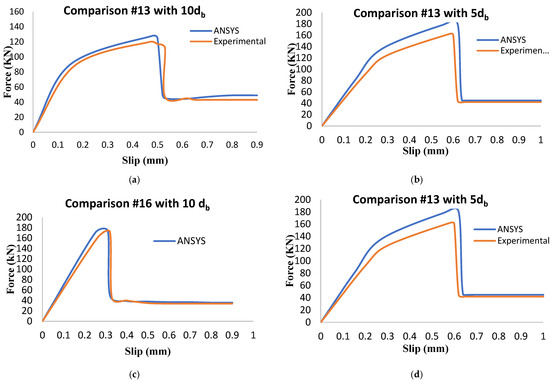
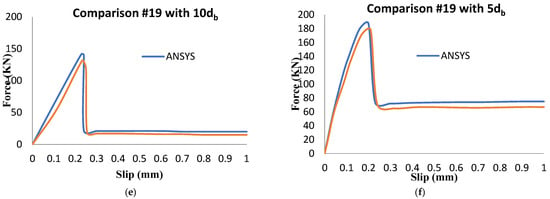
Figure 11.
Comparison of force–slip curves for experimental and FE models: (a) #13 with10 db; (b) #13 with 5 db; (c) #16 with 10 db; (d) #16 with 5 db; (e) #19 with1 0 db; (f) #19 with 5 db.
In general, all force–slip graphs of the pullout tests show a steep rise in the pre-peak region followed by a sudden drop in the force. After that, the residual resistance is offered by the crushed keys or broken concrete texture where splitting was not dominant. As clear from experimental and modeling results, in some cases, unusual stress–slip behavior has been observed. Stress increases in steps due to some local hindrance offered by the deposition of crushed concrete aggregates in front of the bar lugs that change the behavior of the force–slip performance. Under such conditions, the slip value also varies with variable splitting stresses. The horizontal component of inclined wedging action in front of lugs results in new sliding surfaces. It causes a change in the inclination angle of bar forces to concrete, which progressively causes larger splitting forces and other components reducing the bond force []. It has been noticed that the stress–slip behavior between concrete and steel bars also depends on the strength and type of concrete []. It helps in the stress-transferring mechanism from concrete to the embedded steel. In this regard, an important work [] proposed a model to understand the bond strength as follows:
where µ is the ultimate bond strength, db is the bond diameter, lb is the bond diameter, and c is the concrete cover.
µ = 0.083045 √f’c [1.2 + 3 (c/(db)) + 50((db)/(lb))]
It is evident from the experiments that the failure was due to the splitting of the concrete cover around the rebar. The cracks develop around the rebar, and the crack length increases as the load reaches towards its maximum and hits the splitting damage in the concrete, as shown in the Figure 6. Figure 9 and Figure 10 show a relationship between the load slip and the pullout load. As the ultimate load decreases, the load slip increases.
5. Conclusions
In this study, experiments and nonlinear finite element models of a pullout solid of a cylinder model strengthened by a reinforced steel bar were performed using ANSYS software to investigate their behavior under loads. Two bonded lengths, 10 db and 5 db, for different steel bars have been considered in this study. As clearly shown in the results of tests and modeling, the pattern of the bond–slip connection was discovered to be autonomous of the bar diameter. A bonded length of 5 db is optimal in resisting bond stresses. The utilization of the interface (contact) component through analytical study helps the numerical solution display a decent concurrence with experimental results. The distinctions (errors) between the outcomes anticipated by FEA were tentatively credited to the trouble in deciding the ordinary stiffness of the interface component. The chemical adhesion decreases with the increase in the installed bar diameter. Concrete split failure is observed during the pullout of the steel bar in all of the specimens. Tensile stresses created in reinforcement during the pullout decrease drastically at the contact surface with concrete and reach nearly zero. The most extreme shear stress in concrete occurs at the top bit of concrete cylinders. Shear stress is more significant in the concrete near the reinforcing steel bar. Stress in concrete both in the Y-bearing and the XY plane has shown increments with the growth in concrete strength. High-quality concrete creates more stretch before falling flat happens.
Author Contributions
Conceptualization, N.A. and M.Y.; methodology, N.A.; software, M.A.; validation, M.Y., N.A. and M.A.; formal analysis, N.A.; investigation, M.Y. and M.A.; resources, N.A.; data curation, M.A.; writing—original draft preparation, M.Y. and M.A.; writing—review and editing, M.A.S., P.H. and Z.H.; visualization, M.A.; supervision, M.A.; project administration, M.Y. All authors have read and agreed to the published version of the manuscript.
Funding
This paper was supported by the Second Tibetan Plateau Scientific Expedition and Research Program (STEP) (Grant No. 2019QZKK0902), and National Natural Science Foundation of China (Grant No. 42077275). It was also supported by Youth Innovation Promotion Association of the Chinese Academy of Sciences (2018405).
Institutional Review Board Statement
Not applicable.
Informed Consent Statement
We declare that we do not have human participants, human data, or human tissue.
Data Availability Statement
Data will be provided from corresponding author on demand.
Acknowledgments
The author acknowledge the work to Institute of Mountain Hazards and Environment, Chinese Academy of Sciences, Chengdu, China.
Conflicts of Interest
The authors declare that there is no conflict of interest regarding the publication of this paper.
References
- Banholzer, B.; Brameshuber, W.; Jung, W. Analytical simulation of pull-out tests—The direct problem. Cem. Concr. Compos. 2005, 27, 93–101. [Google Scholar] [CrossRef]
- Tastani, S.P.; Pantazopoulou, S.J. Direct Tension Pullout Bond Test: Experimental Results. J. Struct. Eng. 2010, 136, 731–743. [Google Scholar] [CrossRef]
- Cai, C.; Wu, Q.; Song, P.; Zhou, H.; Akbar, M.; Ma, S. Study on Oxygen Diffusion in Coral Concrete under Different Loads. Constr. Build. Mater. 2022, 319, 126147. [Google Scholar] [CrossRef]
- Mirzaalimohammadi, A.; Ghazavi, M.; Lajevardi, S.; Roustaei, M. Experimental Investigation on Pullout Behavior of Geo-synthetics with Varying Dimension. Int. J. Geomech. 2021, 21, 04021089. [Google Scholar] [CrossRef]
- Achillides, Z.; Pilakoutas, K. Bond Behavior of Fiber Reinforced Polymer Bars under Direct Pullout Conditions. J. Compos. Constr. 2004, 8, 173–181. [Google Scholar] [CrossRef]
- Novidis, D.; Pantazopoulou, S. Beam pull out tests of NSM–FRP and steel bars in concrete. In Proceedings of the Fourth International Conference on FRP Composites in Civil Engineering, Zurich, Switzerland, 22 July 2008; pp. 22–24. [Google Scholar]
- Souzana Tastani, S.P. Experimental evaluation of the direct tension-pollout bond test. In Bond in Concrete. Research to Standards; 2014; Volume 1, pp. 1–8. [Google Scholar]
- Alkaysi, M.; El-Tawil, S. Factors affecting bond development between Ultra High Performance Concrete (UHPC) and steel bar reinforcement. Constr. Build. Mater. 2017, 144, 412–422. [Google Scholar] [CrossRef]
- Portal, N.W.; Perez, I.F.; Thrane, L.N.; Lundgren, K. Pull-out of textile reinforcement in concrete. Constr. Build. Mater. 2014, 71, 63–71. [Google Scholar] [CrossRef]
- Ali, A.; Akbar, M.; Huali, P.; Mohsin, M.; Guoqiang, O.; Azka, A.; Yousaf, H. Seismic analysis of lateral force resisting steel frame with honeycombed steel thin plate shear wall. J. Vibroeng. 2021, 24, 357–368. [Google Scholar] [CrossRef]
- Kwak, H.-G.; Kim, S.-P. Bond-slip behavior under monotonic uniaxial loads. Eng. Struct. 2000, 23, 298–309. [Google Scholar] [CrossRef]
- Momayez, A.; Ehsani, M.; Ramezanianpour, A.; Rajaie, H. Comparison of methods for evaluating bond strength between concrete substrate and repair materials. Cem. Concr. Res. 2005, 35, 748–757. [Google Scholar] [CrossRef]
- BS EN. 2009:12390-3; Testing Hardened Concrete. Compressive Strength of Test Specimens. Management Centre: Brussels, Belgium, 2009.
- Deng, M.; Pan, J.; Sun, H. Bond behavior of steel bar embedded in Engineered Cementitious Composites under pullout load. Constr. Build. Mater. 2018, 168, 705–714. [Google Scholar] [CrossRef]
- 1991A EDITION—Comparing Concretes on the Basis of the Bond Developed with Reinforcing Steel. ASTM C234-91a. 1991. Available online: https://www.document-center.com/standards/show/ASTM-C234/history/1991A%20EDITION (accessed on 15 July 2022).
- Ferguson, P.M. Small bar spacing or cover—A bond problem for the designer. J. Proc. 1977, 74, 435–439. [Google Scholar]
- Rilem-Fip-Ceb. Bond test for reinforcing steel: 1-Beam test (7-II-28 D). 2-Pullout test (7-II-128): Tentative recommendations. RILEM J. Mater. Struct. 1973, 6, 96–105. [Google Scholar]
- De Almeida Filho, F.M.; El Debs, M.K.; El Debs, A.L.H.C. Bond-slip behavior of self-compacting concrete and vibrated concrete using pull-out and beam tests. Mater. Struct. 2008, 41, 1073–1089. [Google Scholar] [CrossRef]
- Abrishami, H.H.; Mitchell, D. Analysis of Bond Stress Distributions in Pullout Specimens. J. Struct. Eng. 1996, 122, 255–261. [Google Scholar] [CrossRef]
- Shima, H.; Chou, L.-L.; Okamura, H. Bond characteristics in post-yield range of deformed bars. Doboku Gakkai Ronbunshu 1987, 1987, 213–220. [Google Scholar] [CrossRef]
- Amleh, L.; Mirza, M.S.; Ahwazi, B.B.N. Bond Deterioration of Reinforcing Steel in Concrete due to Corrosion. Ph.D. Thesis, McGill University, Montreal, QC, Canada, 2002. [Google Scholar]
- Akbar, M.; Huali, P.; Adedamola, A.-A.; Guoqiang, O.; Amin, A. The seismic analysis and performance of steel frame with additional low-yield-point steel dampers. J. Vibroeng. 2021, 23, 647–674. [Google Scholar]
- Cairns, J.; Plizzari, G.A. Towards a harmonised European bond test. Mater. Struct. 2003, 36, 498–506. [Google Scholar] [CrossRef]
- Lutz, L.A.; Gergely, P. Mechanics of bond and slip of deformed bars in concrete. J. Proc. 1967, 64, 711–721. [Google Scholar]
- Sezen, H.; Moehle, J.P. Bond-slip behavior of reinforced concrete members. In Proceedings of the FIB Symposium on Concrete Structures in Seismic Regions, Athens, Greece, 6–8 May 2003. [Google Scholar]
- Mathisen, K.M. Solution Methods for Nonlinear Finite Element Analysis (NFEA); Norwegian University of Science and Technology: Trondheim, Norway, 2012. [Google Scholar]
- Yousaf, M. Performance of SCC in Bond at Beams Intersection; UET Laohre: Laohre, Pakistan, 2014. [Google Scholar]
- Jendele, L.; Cervenka, J. Finite element modelling of reinforcement with bond. Comput. Struct. 2006, 84, 1780–1791. [Google Scholar] [CrossRef]
- Harajli, M.H. Comparison of Bond Strength of Steel Bars in Normal- and High-Strength Concrete. J. Mater. Civ. Eng. 2004, 16, 365–374. [Google Scholar] [CrossRef]
- C1404/C1404M-98; ASTM Standard Test Method for Bond Strength of Adhesive Systems Used with Concrete as Measured by Direct Tension (with-drawn 2010). ASTM International: West Conshohocken, PA, USA, 2010.
- Chu, S.; Kwan, A. A new method for pull out test of reinforcing bars in plain and fibre reinforced concrete. Eng. Struct. 2018, 164, 82–91. [Google Scholar] [CrossRef]
- Shen, D.; Shi, X.; Zhang, H.; Duan, X.; Jiang, G. Experimental study of early-age bond behavior between high strength concrete and steel bars using a pull-out test. Constr. Build. Mater. 2016, 113, 653–663. [Google Scholar] [CrossRef]
Publisher’s Note: MDPI stays neutral with regard to jurisdictional claims in published maps and institutional affiliations. |
© 2022 by the authors. Licensee MDPI, Basel, Switzerland. This article is an open access article distributed under the terms and conditions of the Creative Commons Attribution (CC BY) license (https://creativecommons.org/licenses/by/4.0/).