Article

Wind Variation near the Black Sea Coastal Areas Reflected by the ERA5 Dataset

Department of Mechanical Engineering, Faculty of Engineering, Dunarea de Jos University of Galati, 800008 Galati, Romania
*
Author to whom correspondence should be addressed.
Inventions 2022, 7(3), 57; https://doi.org/10.3390/inventions7030057
Submission received: 1 June 2022 / Revised: 29 June 2022 / Accepted: 4 July 2022 / Published: 7 July 2022

Abstract

:
In the context of the European Green Deal implementation, it is expected that there will be an increase in number of the wind farms located near the coastal areas in order to support this initiative. The Black Sea represents an important source of wind energy, and as a consequence, in the present work the regional wind resources (onshore and offshore) are evaluated by considering a total of 20 years of ERA5 wind data covering the 20-year time interval from January 2002 to December 2021. From a general perspective, it is clear that the offshore areas (100 km from the shoreline) are defined by much higher wind speed values than in the onshore, reaching an average of 8.75 m/s for the points located on the western sector. During the winter, these values can go up to 8.75 m/s, with the mention that the northern sectors from Ukraine and Russia may easily exceed 8 m/s. In terms of the wind turbines’ selection, for the offshore areas defined by consistent wind resources, generators will be considered that are defined by a rated wind speed of 11 m/s. Finally, we can mention that a theoretical offshore wind turbine of 20 MW can reach a capacity factor located between 20.9 and 48.3%, while a maximum annual electricity production of 84.6 GWh may be obtained from the sites located near the Romanian and Ukrainian sectors, respectively.

1. Introduction

It is well known that human development is directly related to the access to energy sources that subsequently involves the process of some specific types of resources. The foundation of the industrial revolution was built around the use of fossil fuels (oil, coal, and gas) that worked fine until the modern days, when the efficiency and the environmental impact is questioned [1]. The volatility of this sector represents another issue, with significant fluctuations in the prices and stocks during crisis periods that may occur from various causes, such as geopolitical or the pandemic [2,3].
By looking at the near future, it is expected there will be a significant increase in the renewable sources in the energy market, at least on a European level, this being in fact the strategy promoted by the European Union (EU) throughout various agreements, such as the Green Deal. Various priorities are proposed, among those being mentioned an increase in the Europe’s offshore wind capacities to 60 GW by 2030 and up to 300 GW at the end of 2050 [4]. The European wind market is an active one, and these targets can be easily achieved. For example, at the end of 2021, an installed capacity of 207 GW was accounted by the onshore sector, while for the offshore one, a value of 16 GW was indicated. The offshore projects have definitely started to gain momentum, with the average power of a newly installed generator being located near 8.5 MW compared to only 4 MW for the onshore turbines. From the EU countries located near the Black Sea, the annual electricity demand covered from wind reached 11% for Romania compared to 4% indicated for Bulgaria. Without doubt, there is room for improvement, taking into account that on a European level the average is close to 14%, to which we can add that most of the countries with coastal regions are already involved in the development of the offshore wind sector [5].
Each wind project is defined by particular features, according to the area of installation (onshore and offshore). For example, Enevoldsen and Valentine [6] highlighted the fact that it is more expensive to build an offshore project, and in some case the wind quality from some regions was similar than the onshore ones. More than this, the authors suggest that an onshore project located close to a forest area may represent a better alternative, if the onshore areas are limited and if the offshore costs are very high. Nevertheless, a marine site may provide multiple advantages, ranging from the development of hybrid projects [7] or suitability for coastal protection [8], with this being viewed as the best option for the expansion of the wind sector.
The Black Sea coastal environment is defined by relevant wind resources that can be used to power a wind farm, this being the case of the western sectors where some major onshore wind farms are located. The best example is probably the Fantanele-Cogealac project, that is defined by an operating capacity of 600 MW and is located at approximately 17 km from the shoreline [9]. By looking at the existing studies focused on the wind conditions from the Black Sea, we can notice that these resources significantly increase as we go from onshore to offshore, with a sharp transition near the shoreline being expected. For example, in the work by Rusu et al. [10], from the spatial distribution of the wind conditions, it was highlighted that the wind resources from the marine areas are constantly exceeding the onshore ones (by at least 2× time). Another interesting aspect is represented by the fact that from this region the best wind resources are noticed in the central part of the Azov Sea, where a maximum of 8.24 m/s may occur during winter (U10 values—wind speed at 10 m height). In Kubryakov et al. [11], the regional wind resources (U10 values) were evaluated by considering this time satellite measurements. During the winter, average wind speed values of 8 m/s may occur in the north-western areas (e.g., Crimean Peninsula) while minimum average values of 3.5 m/s are associated with the southeastern sector. Although the wind conditions significantly increase from the shoreline to the offshore region, at some point it a stabilization of the conditions is expected. This seems to be the case of the Romanian coastal sector [12], where the average wind conditions (U10) may start from 4.37 m/s (shoreline), reach a maximum of 5.89 m/s (at 100 km from the shore), and reduce to 5.75 m/s at a distance of 220 km from the shore. These values are specific to the southern part of this region being based on the ERA5 reanalysis data.
Most of the wind studies focused on the entire Black Sea basin and cover only the marine areas, being designed around various topics such as the analysis of extreme events [13], climate change [14], or as inputs for regional wave models [15]. The results are delivered in terms of spatial maps that may provide relevant information from a meteorological point of view.
In this context, the aim of the present work is to provide a parallel evaluation of the wind resources from onshore and offshore areas of the Black Sea by taking into account some relevant local sites, such as harbors. Throughout specific indicators, the wind conditions at 100 m (U100) were processed in order to highlight some new insights of the regional wind energy potential, such as:
(a)
What is the range of wind turbines to be installed in this region according to the expected rated wind speed;
(b)
Provide a classification of the onshore and offshore sites by using a multicriteria approach that involves various indicators such as average wind speed, monthly variations, or distance from the coast;
(c)
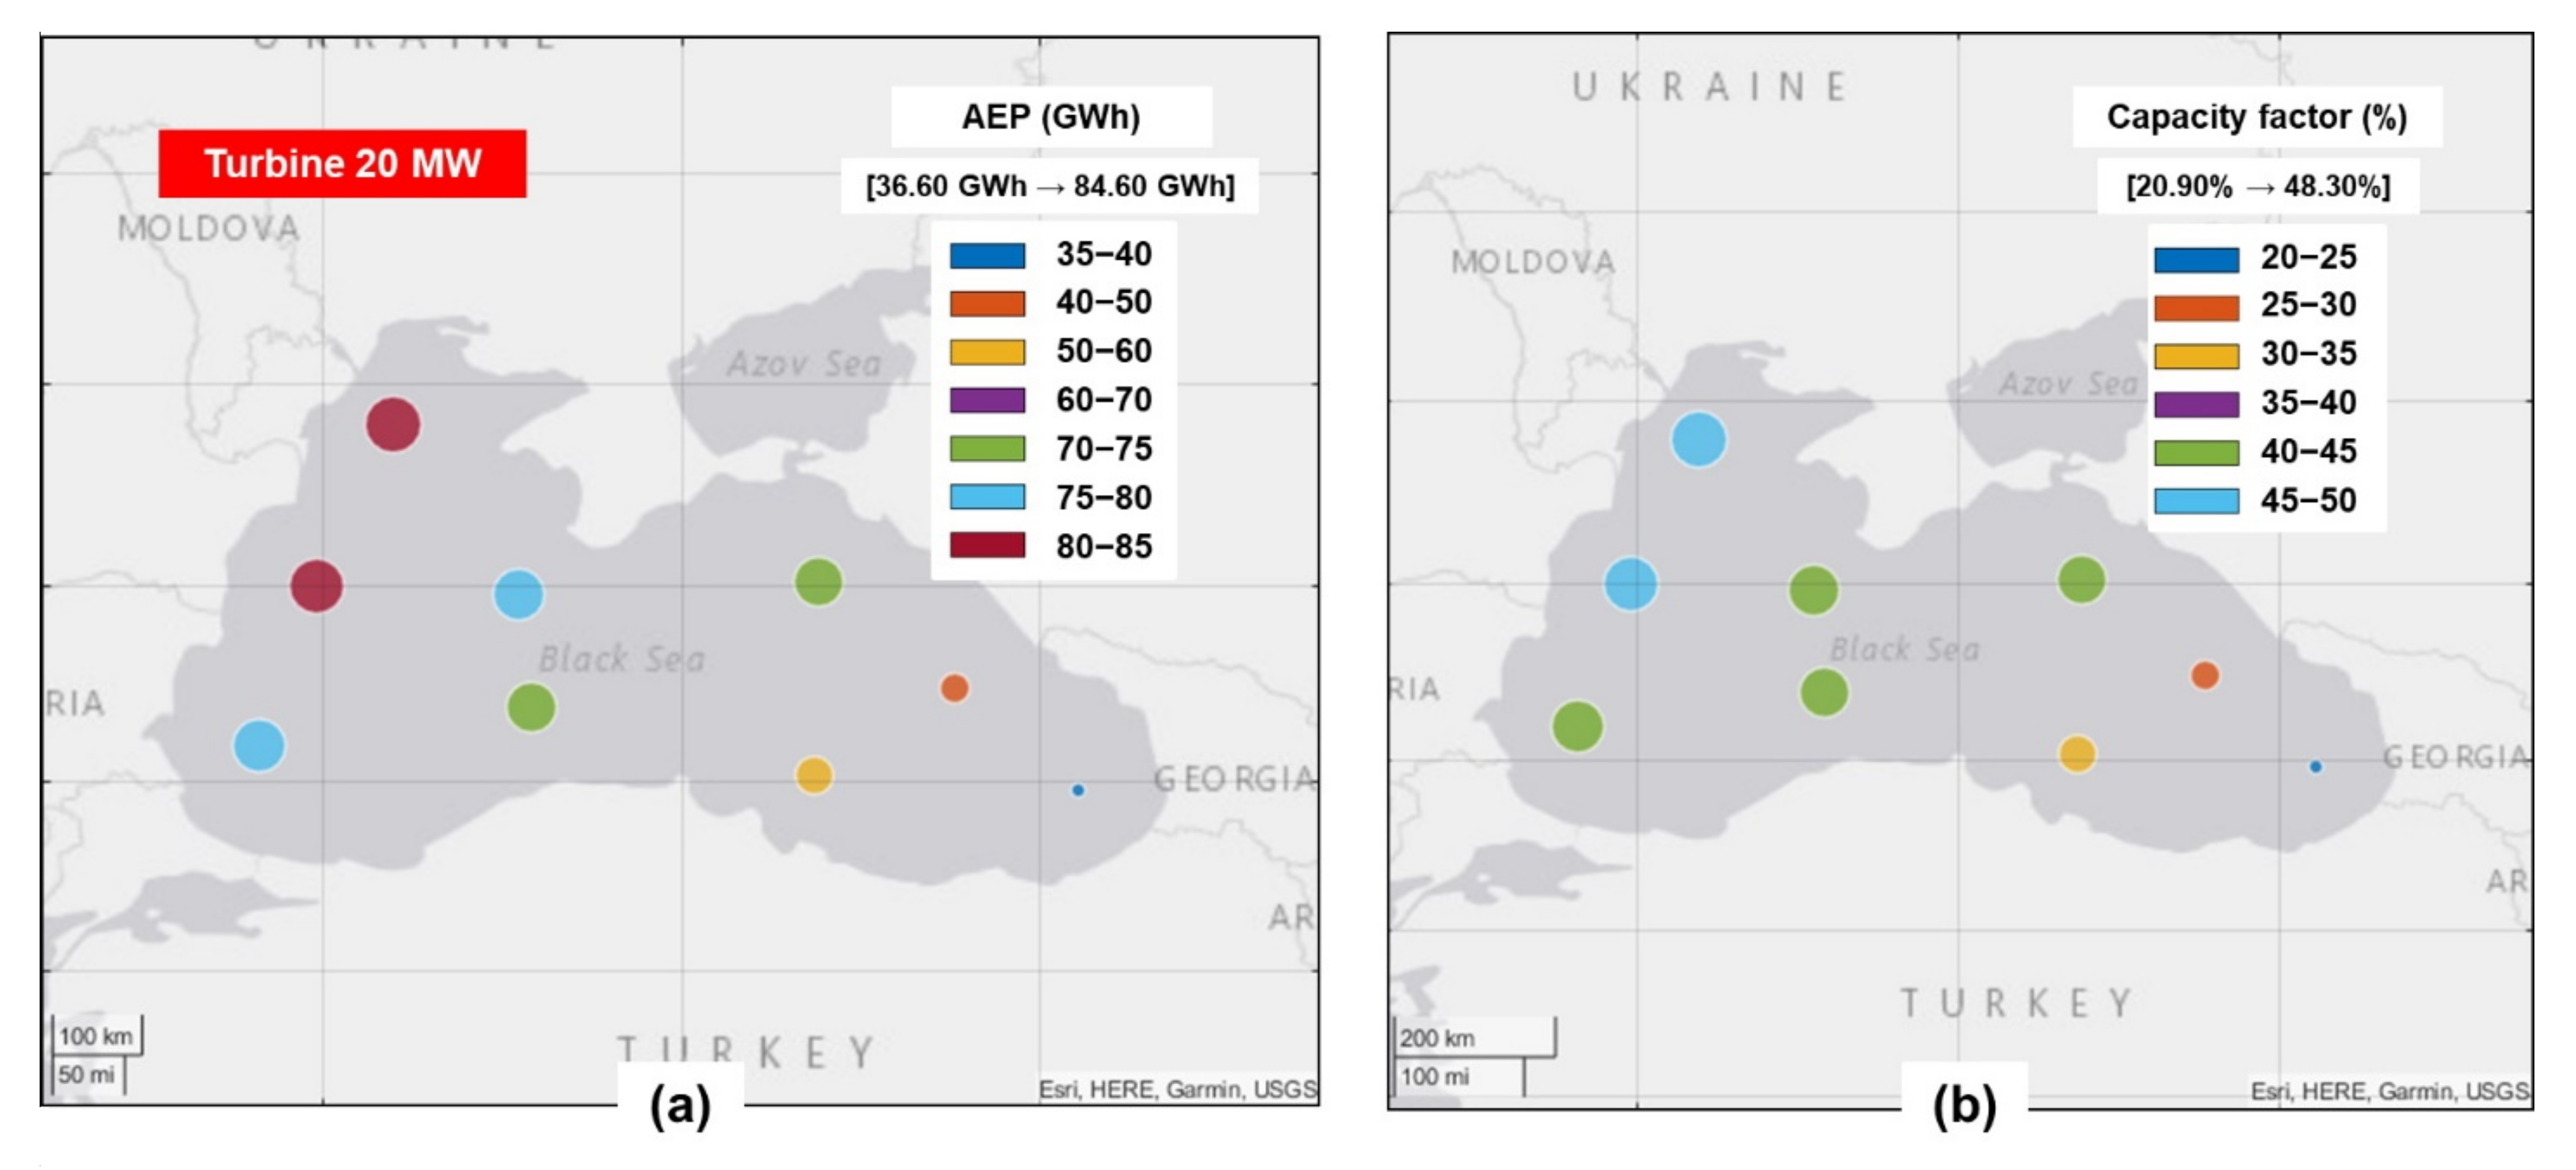
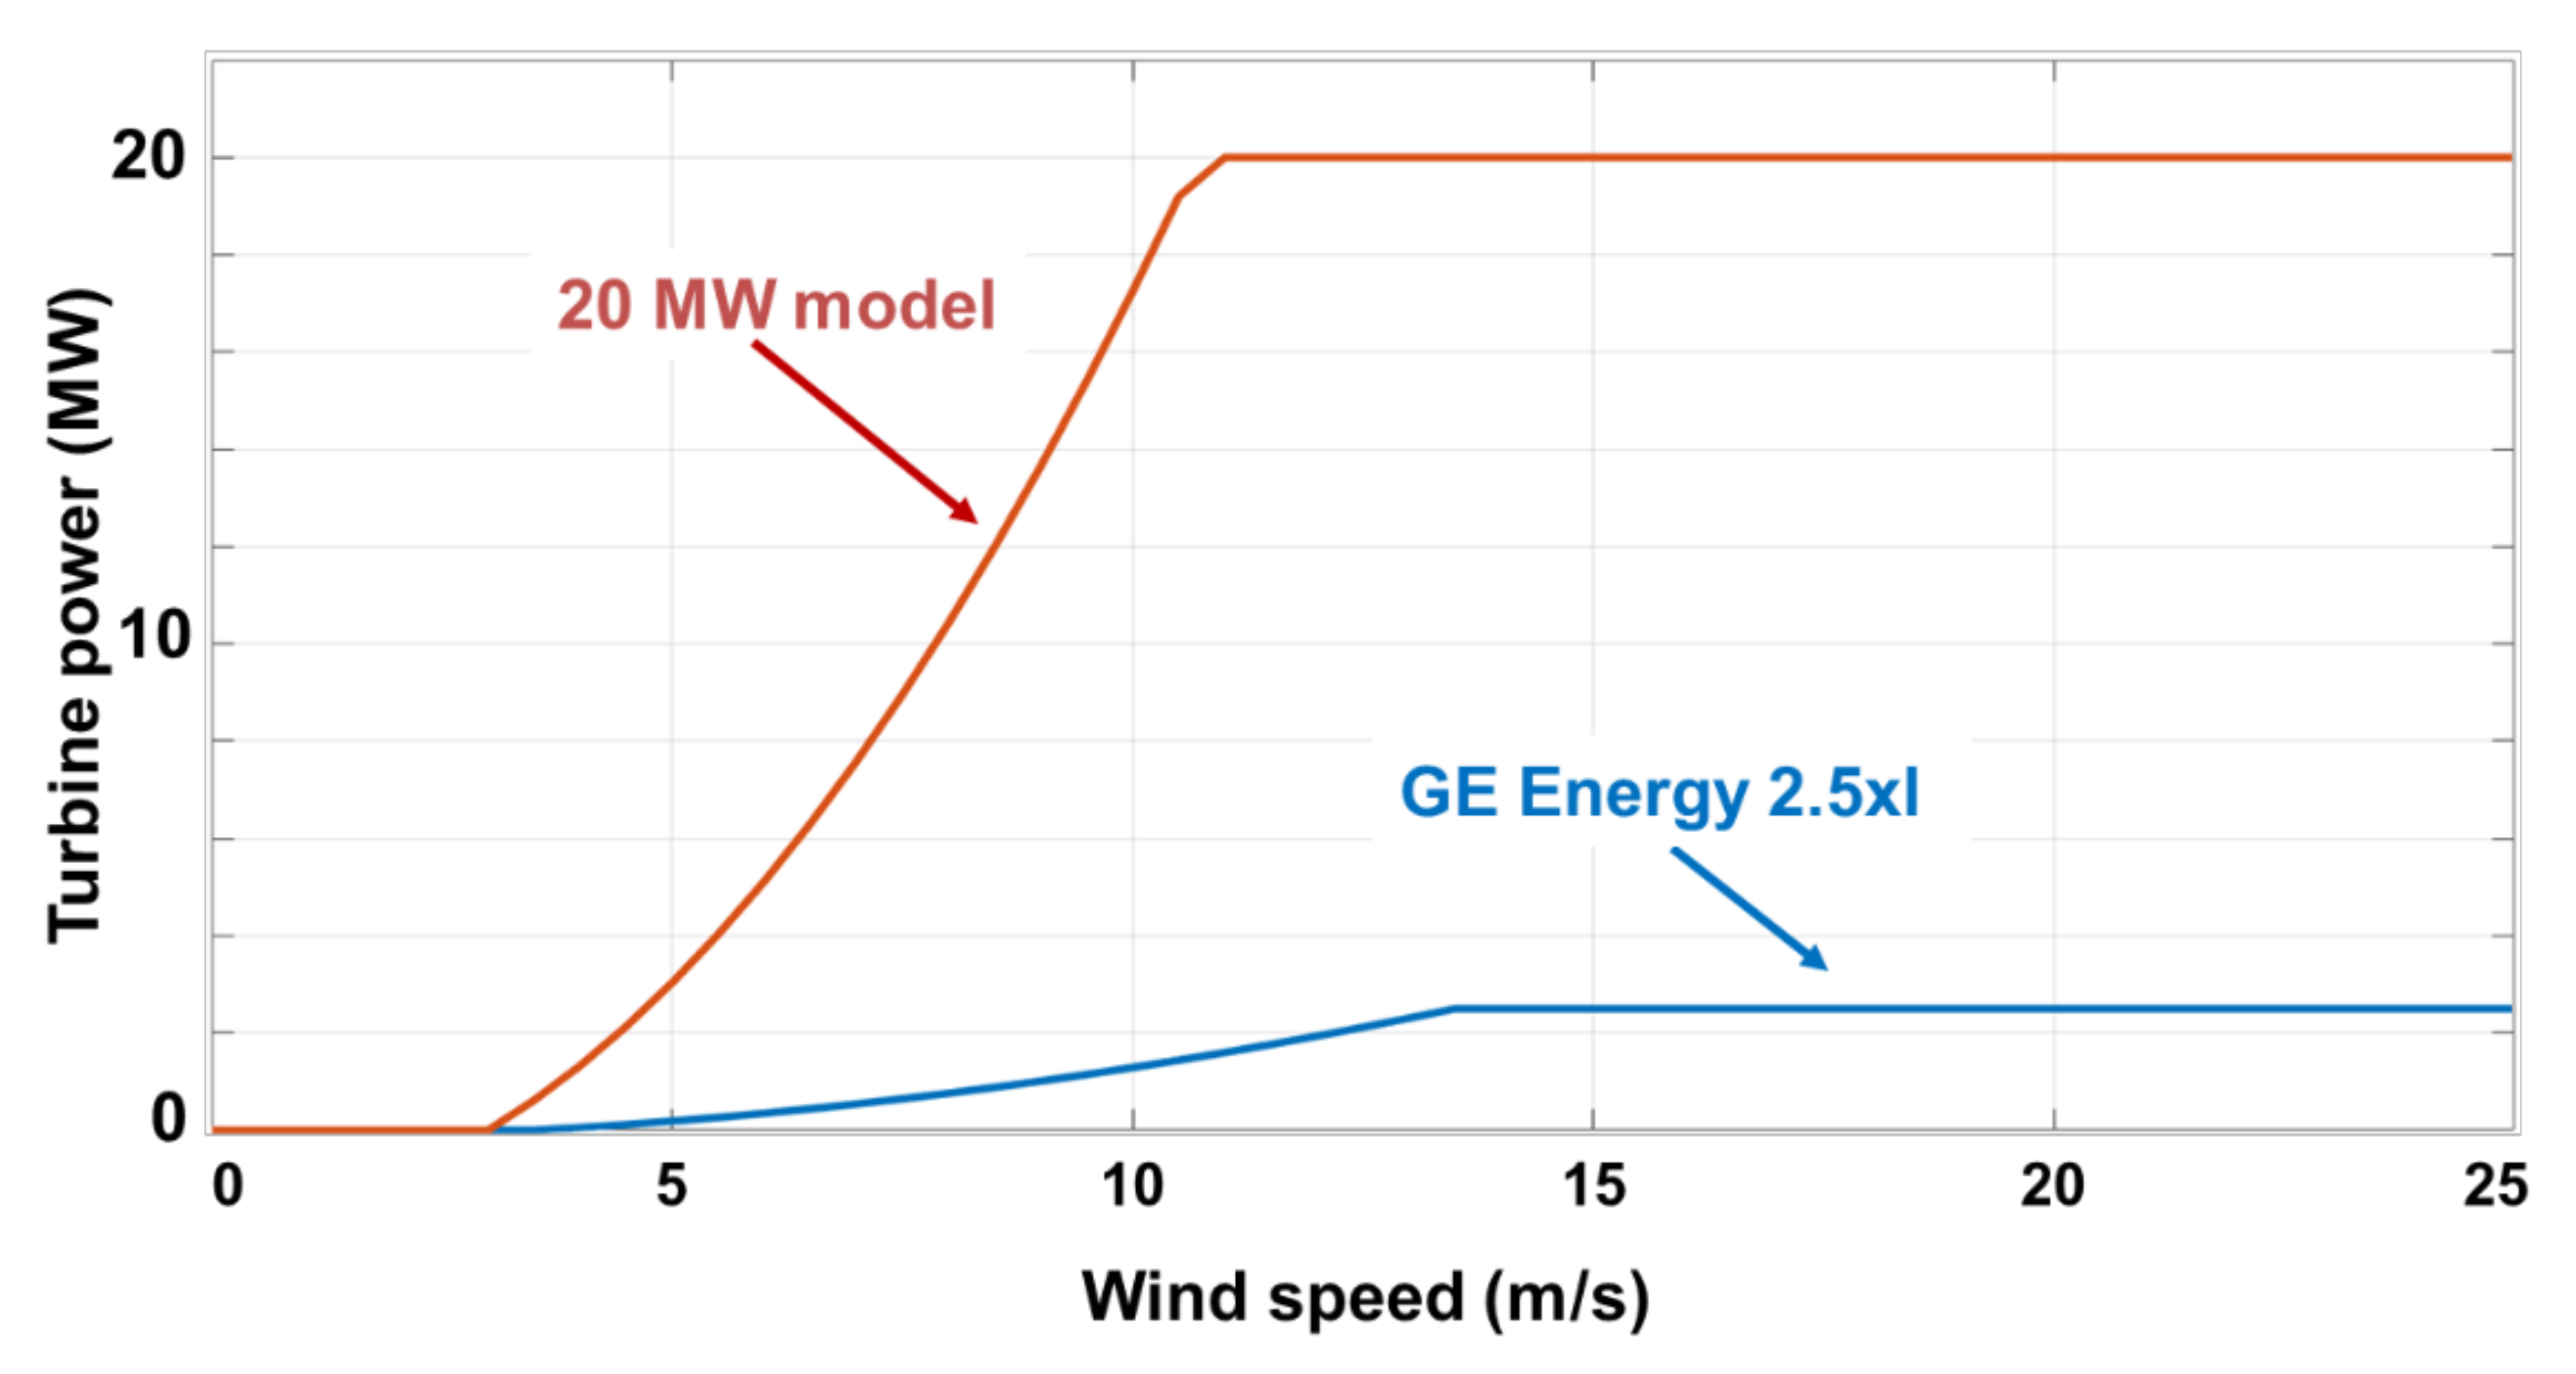
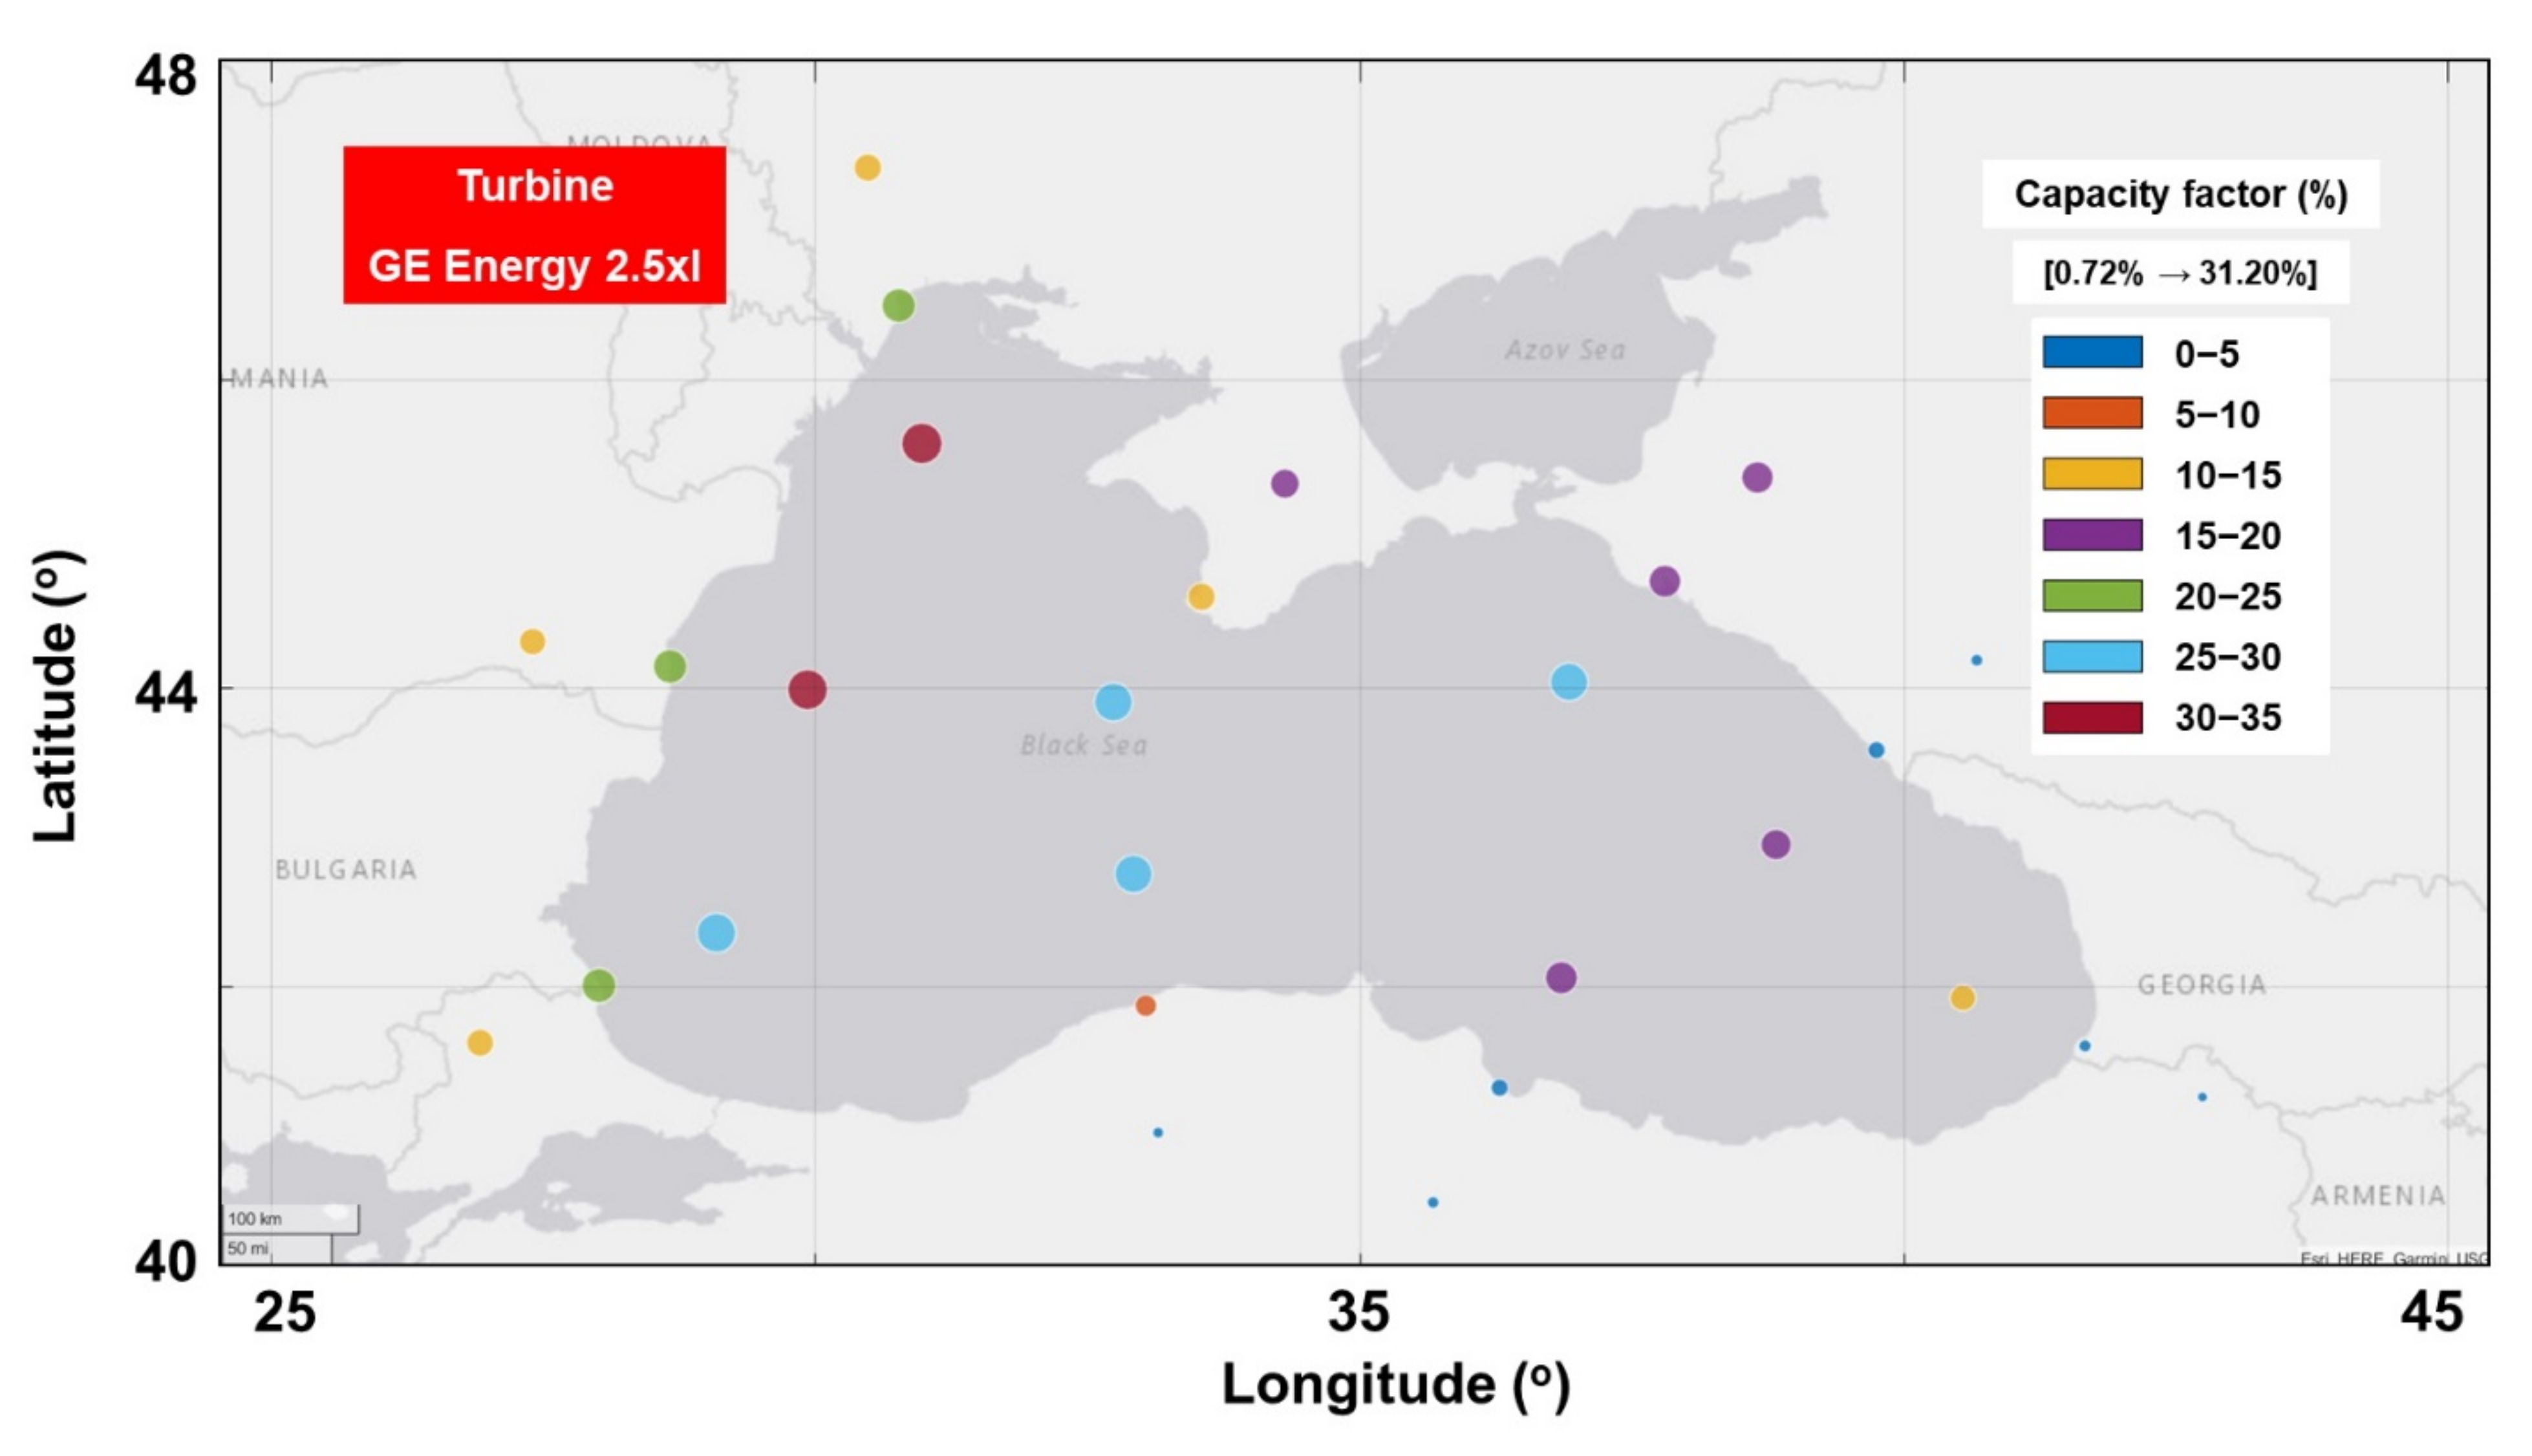
Identify the performances of two wind turbines (rated at 2.5 MW and 20 MW) that may involve monopile or floating foundations.

2. Materials and Methods
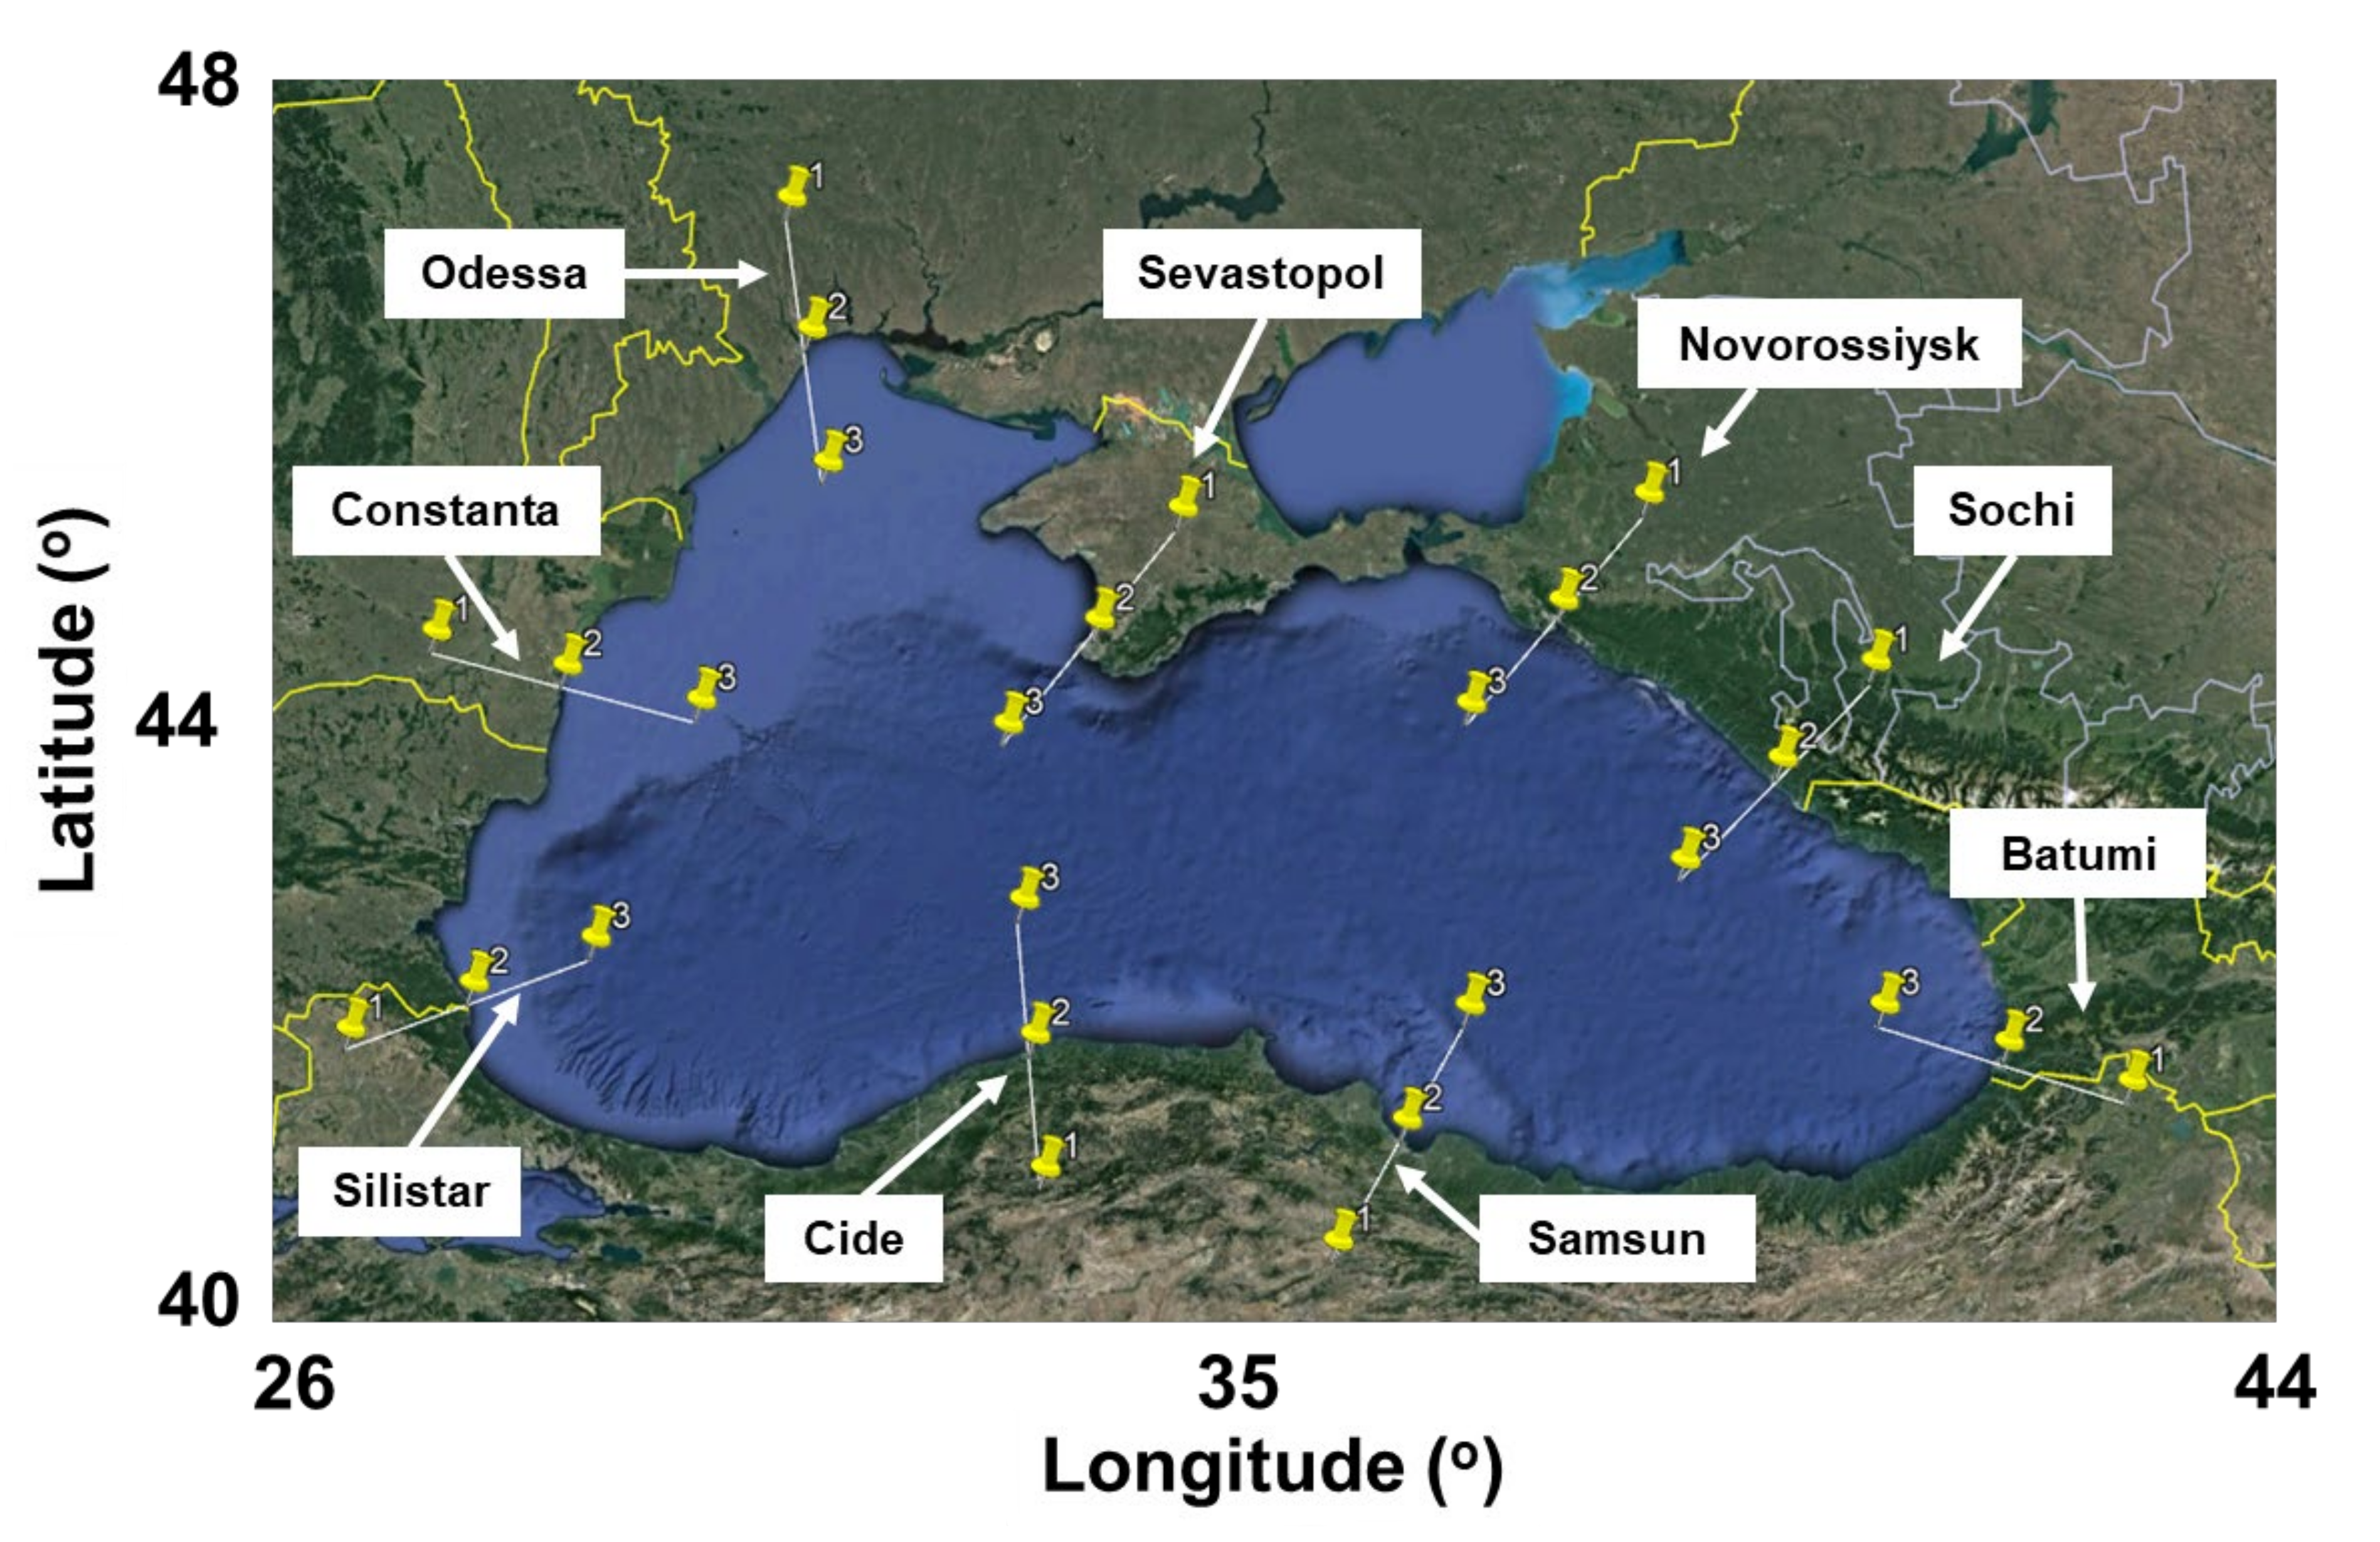
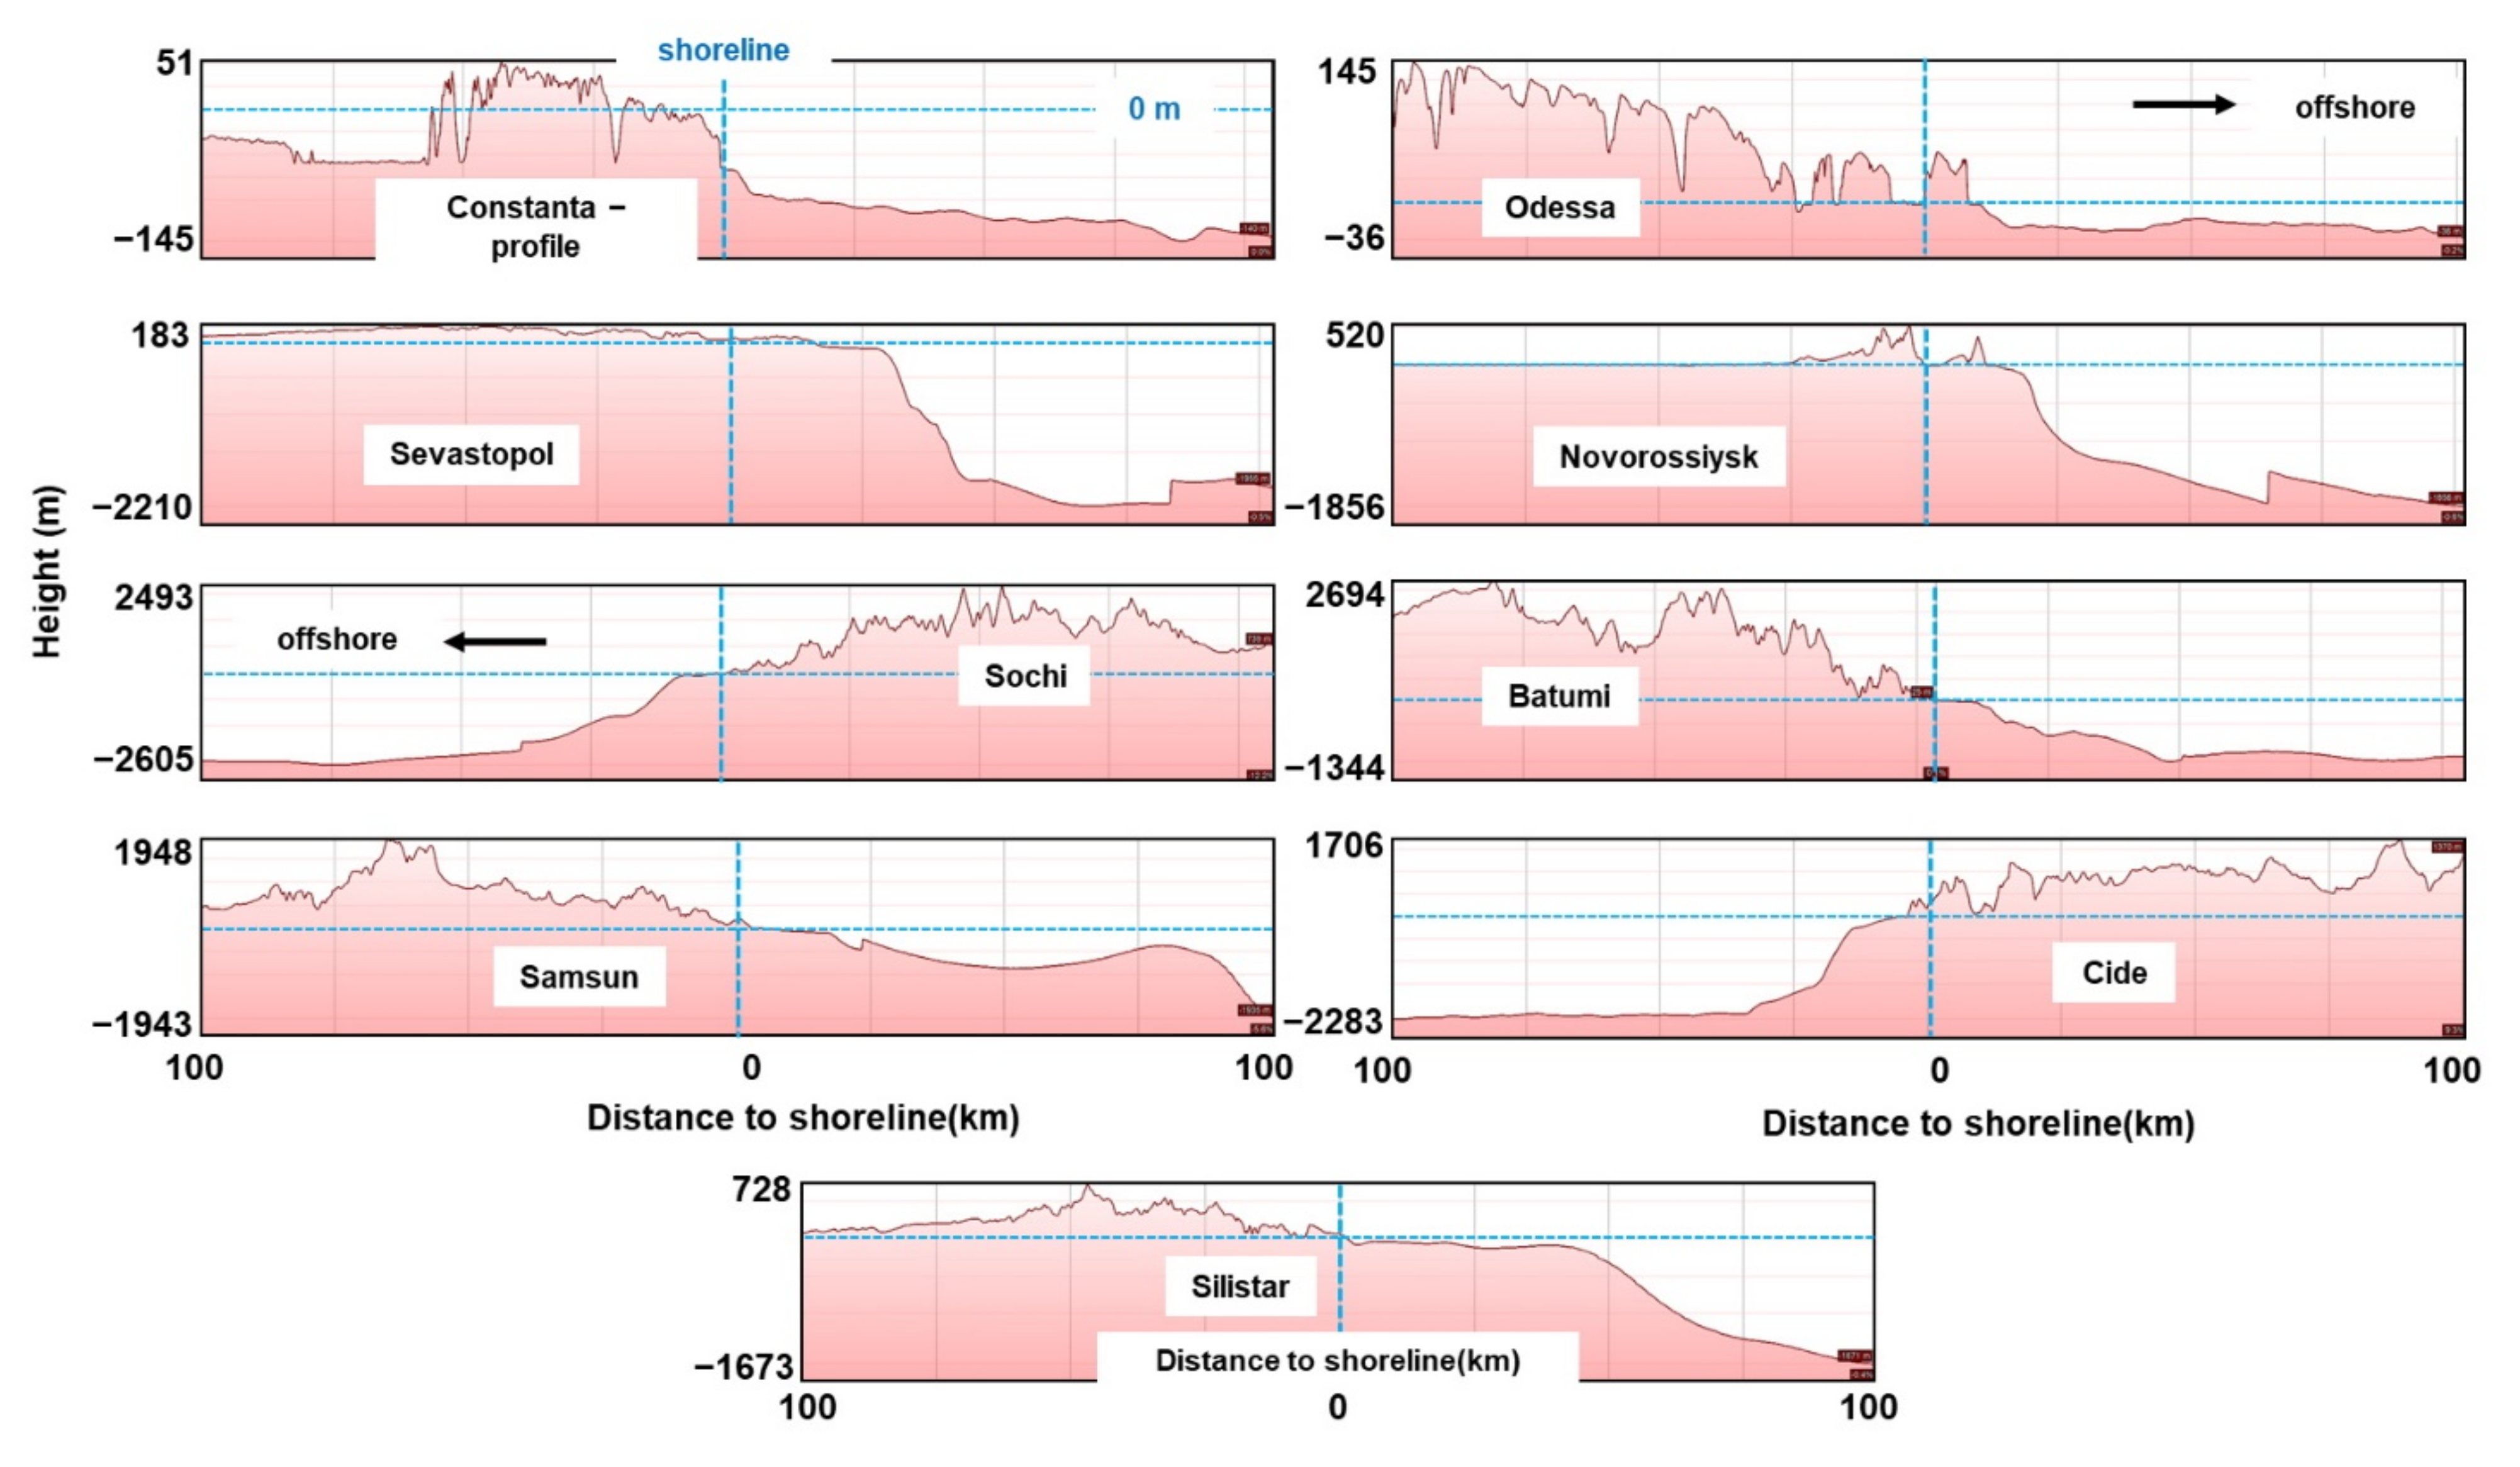
2.1. Target Area

In Figure 1, the Black Sea target area is illustrated, including the sites considered for analysis. In total, there are nine reference lines, defined along various coastal areas, such as Romania, Russia, Georgia, or Türkiye with the mention that from the sites located near the shoreline (denoted with no. 2), a distance of 100 km was considered to define the onshore sites (no. 1) while a similar distance was associated with the offshore sites (no. 3). More details regarding the sites considered are provided in Table 1.
Figure 2 presents in more detail the profile lines, including information related to the sea level (height = 0 m) and the distance to the nearshore sites (distance from the shoreline = 0 km). In general, the water depth significantly increases as we go offshore, and as a consequence it will be necessary to use floating wind platforms, since in most of the cases the areas located near the shoreline will be already allocated for some other maritime activities. The marine sites located near Constanta/Odessa may allow the implementation of a monopile project, since they are located in a plateau area where the water depth is close to 50 m (or below).

2.2. Wind Data and Indicators

The evolution of the regional wind resources is carried out by using the ERA5 dataset [16] that includes wind fields reported directly at 100 m level (denoted with U100), this height being frequently considered for the development of onshore and offshore wind generators. A total of 20 years of data covering the interval from January 2002 to December 2021 are processed, the initial dataset being defined by a spatial resolution of 0.25° and by four values per day (00-06-12-18 UTC). This dataset is frequently used for the evaluation of the wind energy all over the world, being also considered for some coastal sectors from the Black Sea [12]. Various analyses are performed, including the seasonal distribution, that are sorted according to: Spring—March, April, May; Summer—June, July, August; Autumn—September, October, November; Winter—December, January, February.
One way to quantify the quality of the wind resources is to use the wind classes. These go from C1 (low energy level) to C7 (ideal conditions) as can be noticed from Table 2. In the present work, only the wind conditions between the classes C4 and C7 are considered, since these are more representative for the development of a wind project.
A more detailed classification of the wind conditions is provided in Costoya et al. [17,18] as can be noticed from Table 3. Several parameters are taken into account, namely: Wann (m/s)—annual average wind speed, related to U100; EWSO (%)—frequency of occurrence of effective wind speed; RLO (%)—rich level occurrence; Cv—coefficient of variation; Mv—monthly variability; EWS (m/s)—extreme wind speeds; WD (m)—water depth; DC (°)—distance to coast. In the first part (denoted with a), a normalized value between 0 and 1 (with a value of 0,25 as interval) is allocated to each indicator. For example, the EWSO indicator is related to the distribution of the wind speed between the cut-in and cut-out values of a turbine (4 and 25 m/s in this case), and if a percentage higher than 80% is noticed, a normalized value of 1 is allocated to each indicator.
This type of analysis was developed to assess only the wind potential of a particular marine site, while in the present work, in a similar way the onshore sites were taken into account, which may be considered as an element of novelty. In the next step (denoted with b), a weight value is applied to each indicator according to their importance, the most important being considered Wann and EWSO, while on the opposite side we found water depth (0.07) and monthly variability (0.05), respectively.
The RLO indicator is related to the occurrence of the wind power density above 200 W/m2 and, for example, if a 90% distribution is noticed above this threshold, a normalized value of one is accounted. Regarding the CV and Mv parameters, if the values reported by a site exceed 1.75, a normalized value of zero is taken into account. In the case of the water depth and distance to coast, if this does not exceed 25 m and 0.5°, a maximum score will be given, while on the opposite side, if the depth exceeds 500 m, a normalized value of zero is obtained. In an ideal scenario, a particular site can be classified as superb (class C7) if for all the criteria mentioned in Table 3 (section a) a normalized value of one is obtained.
Finally, for each site, a number located in the range of 0–1 is obtained that can be included in seven classes (from C1 and C7) according to their attractiveness for a wind project. More details regarding this approach and the definition of the parameters involved are provided in [17].
The wind speed carrying maximum energy parameter (denoted with VmaxE) can be used to match a particular wind turbine to a particular site, by considering the available wind resources [20]. In this case, a generator defined by a rated wind speed, which is close to the value of this indicator, is more than recommended. This index can be computed as [21]:
V m a x E = c 1 + 2 k 1 / k
where c and k represent the scale and shape parameters of a Weibull distribution function. The Weibull distribution can be defined as [22]:
f u = k c u c k 1 e x p u c k
where: c, k—Weibull parameters; u—wind speed (U100 in this case).
Another objective of the present work was to assess the performances of some wind turbines that may operate onshore and offshore. In Table 4, two wind turbines are presented, the first one being frequently used in onshore projects such as the one from Fantanele-Cogealac, Romania [23]. The second generator is designed for the offshore areas, being expected to become operational in the near future when the rated capacity of these systems may easily exceed 20 MW [24,25].
The annual electricity production of a particular turbine can be defined as [28]:
A E P = T × c u t i n c u t o u t f u P u d u
where: AEP—is expressed in GWh; T—number of operational hours in a year (8760 in this case); f(u)—Weibull function from Equation (2); P(u)—power curve of a particular wind turbine, defined by the cut-in/cut-out values. More details regarding the power curves of the two wind turbines used in this work can be found in Figure 3.
Finally, the performance of each generator will be measured by using the capacity factor (Cf), denoted as follows [28]:
C f = P g e n e r a t e d P r a t e d
where: Pgeneratedexpected power to be generated by a wind turbine; Prated—rated power of a generator.

3. Results

In Figure 4, the distribution of the U100 parameter (average values) considering the full time distribution is presented. The results are sorted according to different intervals that go from a minimum of 2.45 m/s to a maximum of 7.35 m/s. From this representation, we can clearly notice that the offshore sites are defined by much higher values that frequently exceed 7 m/s in the case of the western region. Considerably lower values are associated with the onshore sites from south and southeast, where for this time period the average wind speed values are below 3 m/s. The shoreline points from line Constanta, Odessa and Sevastopol are defined by similar wind conditions as the offshore points (100 km from the shore) associated with the lines Sevastopol, Novorossiysk, and Cide that present wind resources in the range 6–7 m/s.
The seasonal evolution of the wind speed is presented in Figure 5, where we can observe more impressive values during the wintertime, when the offshore sites from west and north can reach average wind speed values up to 8.75 m/s.
During the spring time, these average wind speed values oscillate in the range 2.44–7.36 m/s, with the mention that this time the offshore site from Silistar is not rated among the most important sites. As for the summertime, we can expect a maximum of 6.02 m/s only from the site associated with Odessa, while a minimum of 2.07 m/s is noticed on the land areas from east and south. During the wintertime, an offshore wind turbine will obtain the best performances near the sites from the north and west sectors, compared to the southeastern site (Georgia) that is on the same energy level as the onshore sites from Constanta and Silistar (100 km onshore).
Figure 6 illustrates the wind distribution by classes (in %), considering only the values from intervals C4 and C7. For the class C4, only the alongshore sites from Constanta and Odessa indicate higher values (>5%), that even exceed the offshore sites where a maximum of 5% is expected. For the class C5, the site from the western sector (alongshore and offshore) presents values in the range 5–5.5%, in this category being included also a marine site from Cide (south sector). The differences between onshore and offshore sites tend to become more significant as we go to higher classes, for example in the case of the class C7 when it goes from 0.021 to 26.1%. For the C7 class, only the Odessa site presents more consistent wind resources, being closely followed by some other reference sites that indicate a distribution in the range 20–25%.
The evolution of the VmaxE indicator is provided in Figure 7, considering all the available wind data (U100—total time). According to these values, several patterns may occur. For example, the marine sites from the west constantly indicate values in the range 11–11.5 m/s in this section being also included a site from Novorossiysk. On the second place, we have the marine sites from Sevastopol and Cide (north and south) with maximum values of 11 m/s. Most of the onshore sites from west and north can be included in the interval 7.5–8.5 m/s, being expected also an increase to a maximum of 9.5 m/s in the case of the alongshore sites from Constanta and Odessa. The onshore sites from south and east present lower values that reach a minimum of 3.72 m/s, this being relatively close to the cut-in values of some high-capacity wind turbines.
A similar analysis is presented in Figure 8, considering this time the seasonal evolution. As expected, during the wintertime we encounter most of the important wind resources that go in the range 11.5–13 m/s, in this category being included most of the marine sites, except the one from Samsun (southeast), where a maximum of 11 m/s is expected. During spring, these values go from 3.96 to 11.4 m/s, being followed by autumn with values in the interval 3.47–11.3 m/s, while during summer a maximum of 9.44 m/s is expected near the offshore sites.
Figure 9 presents a more detailed classification of the site, by taking into account various indicators that present interest for a wind project. From this area, none of the sites are included in the C7 category (superb) and only the marine site from Odessa is associated with the C6 section (Outstanding). Three of the sites are related to the class C5 (Excellent), this being the case of Constanta and Silistar, to which we add the onshore site from Novorossiysk. For the remaining sites, most of them are included in the class 4 (good), except the western ones that are associated with class 1 (poor).
Figure 10 is focused on a similar evaluation, considering this time the values related to each season. Regardless of the season taken into account, none of the sites are rated as a C7 site, with expected values in the ranges: spring—0.33–0.78 m/s; summer—0.33–0.74 m/s; autumn—0.33–0.84; winter—0.37–0.87 m/s. During spring, a significant part of the sites is included in the classes C4 and C5 (good and excellent), while during summer the balance is shifted to class C4 and C3 (fair). For the autumn season, the marine sites from Constanta and Odessa are included in the class C6, while from the winter interval the onshore sites from Odessa and Novorossiysk may also present interest.
The annual electricity production (AEP) of an individual GE Energy 2.5 xl system is taken into account in Figure 11, by considering all the reference sites (onshore and offshore). By looking at these data, we can notice that the production range goes from 0.159 to 6.84 GWh, with better performances being expected in the western sector. From the marine sites located in the west (Odessa, Constanta, and Silistar), we may expect a production in the range 6–6.84 GWh, that gradually decreases to 4.5 GWh for the shoreline sites and further to 2.3 GWh for the onshore ones. In the case of the eastern sector, only the marine site from Novorossiysk can exceed a production of 5 GWh, while for the onshore sites in this area (east and south) the production does not exceed 1 GWh.
Figure 12 presents the spatial distribution of the capacity factor reported for this wind turbine. Better performances are expected in the offshore areas, where a maximum value of 31.2% is expected near Constanta and Odessa, while a maximum of 30% may be reached by the marine sites from the central part of the Black Sea. Close to the shoreline, the capacity is relatively close to 25% (western sector) or 20% (northern sector), and does not exceed 5% in the case of the eastern and southern sites. For the onshore sites located on the western sector, a capacity factor in the range 10–15% is expected.
In Figure 13, the performances of the 20 MW wind turbine are presented, considering this time only the marine sites. For the AEP indicator (Figure 13a), the values go in the range 34.6–84.6 GWh, indicating the sites from Constanta and Odessa as the most promising. The performances of this turbine gradually decrease from west to east, in the conditions where the sites from the central parts can reach maximum values of 75 GWh, and drops to 60 GWh in the case of the Samsun site and finally reaches 36.6 GWh near Batumi.
As for the capacity factor (Figure 13b) this turbine is defined by higher values compared to the previous turbine (GE model), the main reasons being related to the lower values of the cut-in and rated wind speed characteristics. Values in the range 45–48.3% are expected for the Constanta and Odessa sites, while on the second place we find the interval 40–45% that defines the central part of the Black Sea. The sites from the southeast represent a particular category that does not exceed the percentage of 35% and can reach a minimum of 20.9% in the case of Batumi.

4. Discussions

The reanalysis dataset represents an important source of information, especially for an enclosed basin such as the Black Sea, where the in situ measurements are limited and in some cases outdated. As a consequence, several research papers focused on the wind energy from this region were published; this is the case for Rusu [14] or Raileanu [29] where an offshore wind farm was proposed to partially cover the energy demand of the Constanta harbor (Romania). In Yildirir et al. [30], the wind resources from the onshore and shoreline area were discussed by making a direct comparison between ERA5 and in situ measurements. According to these results, it was found that for the average values, ERA5 underestimates the onshore wind conditions located below 9 m/s, while as we go near the shoreline, a reverse pattern is noticed (close to Sulina site). A similar trend is observed for the maximum values, where the in situ measurements present peaks in the range 7–13 m/s for the onshore sites, while close to the shoreline this is shifted to the interval 17–25 m/s.
The results provided in this work are related to a hub height of 100 m, with this being frequently used in various projects, such as the one from Fantanele-Cogealac, Romania [31]. As for the 20 MW wind turbine, the performance of this system was evaluated at a hub height of 160.2 m, in the condition where only a single blade has a length of 135 m [27]. For the offshore regions, there are numerous studies focused on the evaluation of the U100 parameter, this being the case for Fabiola et al. [32] who was focused on the Porto Santo Island or Archer and Jacobson [33] who provided an analysis on a global scale. Some other studies are dedicated to climatological data, one of which being by Li et al. [34] where some offshore sites from the Yellow Sea were evaluated.
In this work, several reference points were considered for evaluation, among them being mentioned some located at 100 km from the coast. A distance such as this cannot be considered to be exaggerated taking into account that at this moment there are several projects working in similar regions (EnBW Albatros, Germany), with plans to implement projects at 200 km from the shoreline [35]. This may represent good news for the countries located in this region, taking into account that the coastal areas area already used for some other maritime activities are possible for development of wind projects in the nearshore and offshore areas. For example, the exclusive economic zone (EEZ) of Romania is estimated at 22,486 km2, while for Bulgaria this goes up to 29,052 km2 [36]. By looking at some other offshore projects, we can notice that the Lincs offshore wind farm has a total capacity of 250 MW and an overall area of 35 km2, while the London Array project is defined by a capacity of 630 MW developed over 100 km2 [37]. Comparing these values to the size of the Romania EEZ, the area covered will be less than 0.5%, being possible to find a suitable site that will not be affected by other maritime restrictions.
From the analysis of the ERA5 wind data (U100), we can clearly say that the offshore wind resources from the Black Sea are significantly higher than the ones from onshore areas, this being the first time when a study was focused on this issue. In general, the sites from the west and north present more important wind resources that can go to average wind speeds up to 8.75 m/s during the wintertime. The sites from the southern sector (Turkey) can be linked to the second place, easily exceeding the ones from the southeast (Georgia) that are associated with lower wind resources. Nevertheless, the chances that the Turkish authorities will consider developing a wind project in the Black Sea are quite low, taking into account that the wind resources from the Mediterranean Sea are more consistent [38,39].
The VmaxE indicator can be used to identify a range of wind turbines suitable for a particular site. In Wen et al. [40], several offshore wind turbines were considered, and based on the power curves of these systems, the first option for the Black Sea area will be the AMSC wt10000dd (7 MW) and Sea Titan (10 MW) generators. At these, we can add that they are defined by a rated wind speed of 12 m/s that have a capacity production in the range 2–7 MW. More than this, the new generation of marine wind turbines are defined by relatively lower rated speeds, which are located in the interval 10.6–11.4 m/s [24,27,41]. During the wintertime, this indicator can reach a value of 12.8 m/s in the case of the offshore sites, but it will not exceed 10.5 m/s if we discuss about onshore areas.
The aim of this work is not to make a direct comparison between the two wind generators (2.5 MW and 20 MW) since they are designed for different projects, this being the reason why in Figure 13 only the offshore sites were considered. On the other hand, the aim of this work is to make a direct comparison between the land and marine areas from the Black Sea region, and for this reason a 2.5 MW generator may represent a suitable solution, since we can find similar generators in the onshore projects (e.g., Cogealac, Romania) or in offshore ones (old technology). As for the marine areas, in the near future we can notice the occurrence of a new generation of wind turbines that may easily exceed 20 MW in terms of rated power, making them a suitable candidate for the Black Sea environment or for a repowering project. At this point, it can be also mentioned that in the work of Girleanu et al. [42], a total of 12 models of wind turbines, ranging from 2 to 10 MW, were evaluated for the Romanian coastal area, and a similar approach can be considered for some other regions of the Black Sea, especially in the case of the marine sites.
A particularity of the marine areas is represented by the possibility to implement high-capacity wind turbines that on a longer term have the capacity to reduce the CO2 emissions. For example, in Onea et al. [43] such an evaluation was made for the Iberian coast, being estimated that a turbine rated at 9.5 MW could avoid the CO2 emissions with values located in the range 3–15 t/MWh according to the local wind energy. By simply scaling these results for the Black Sea, a maximum of 10.2 t/MWh can be expected from the GE Energy 2.5 xl, while a maximum of 22.8 t/MWh is associated with the 20 MW turbine considered in this work.
At this moment, the geopolitical situation in the Black Sea is not a stable one, with this aspect being reflected in the cost of electricity and due to the fact that some countries from this region (e.g., Romania) are depending on the electricity imports being forced in some cases to reactivate some coal power plants that were closed until now [30]. From all the countries located in the Black Sea area, the best chances to develop an offshore wind project are related to Bulgaria and Romania that may benefit from the initiatives proposed under the European Green Deal [44]. Russia is an important exporter of oil; therefore, there is no interest at this moment to invest in renewable energy, while on a long-term, Ukraine may efficiently use the existing offshore wind resources if a reconstruction plan will be implemented.

5. Conclusions

The present work provides a general picture of the wind energy resources in the coastal environment of the Black Sea (onshore and offshore) ERA5 wind data that cover the 20-year time interval from January 2002 to December 2021.
Besides a general analysis of the wind resources at a hub height level (100 m), some specific analyses related to the wind energy were also performed. These include the distribution by wind classes, a multicriteria classification of the sites, evolution of the VmaxE indicator, and performance of a 20 MW wind turbine. Based on these results, we can conclude that the regional offshore wind resources are significantly stronger than onshore regardless of the coastal sector considered. Furthermore, it was also noticed that the wind conditions gradually increase from the land to the marine areas, with the mention that the sites located alongshore may present suitable conditions for the development of a wind project.
Looking now at the initial research questions formulated in the Introduction, the following answers can be provided:
(a)
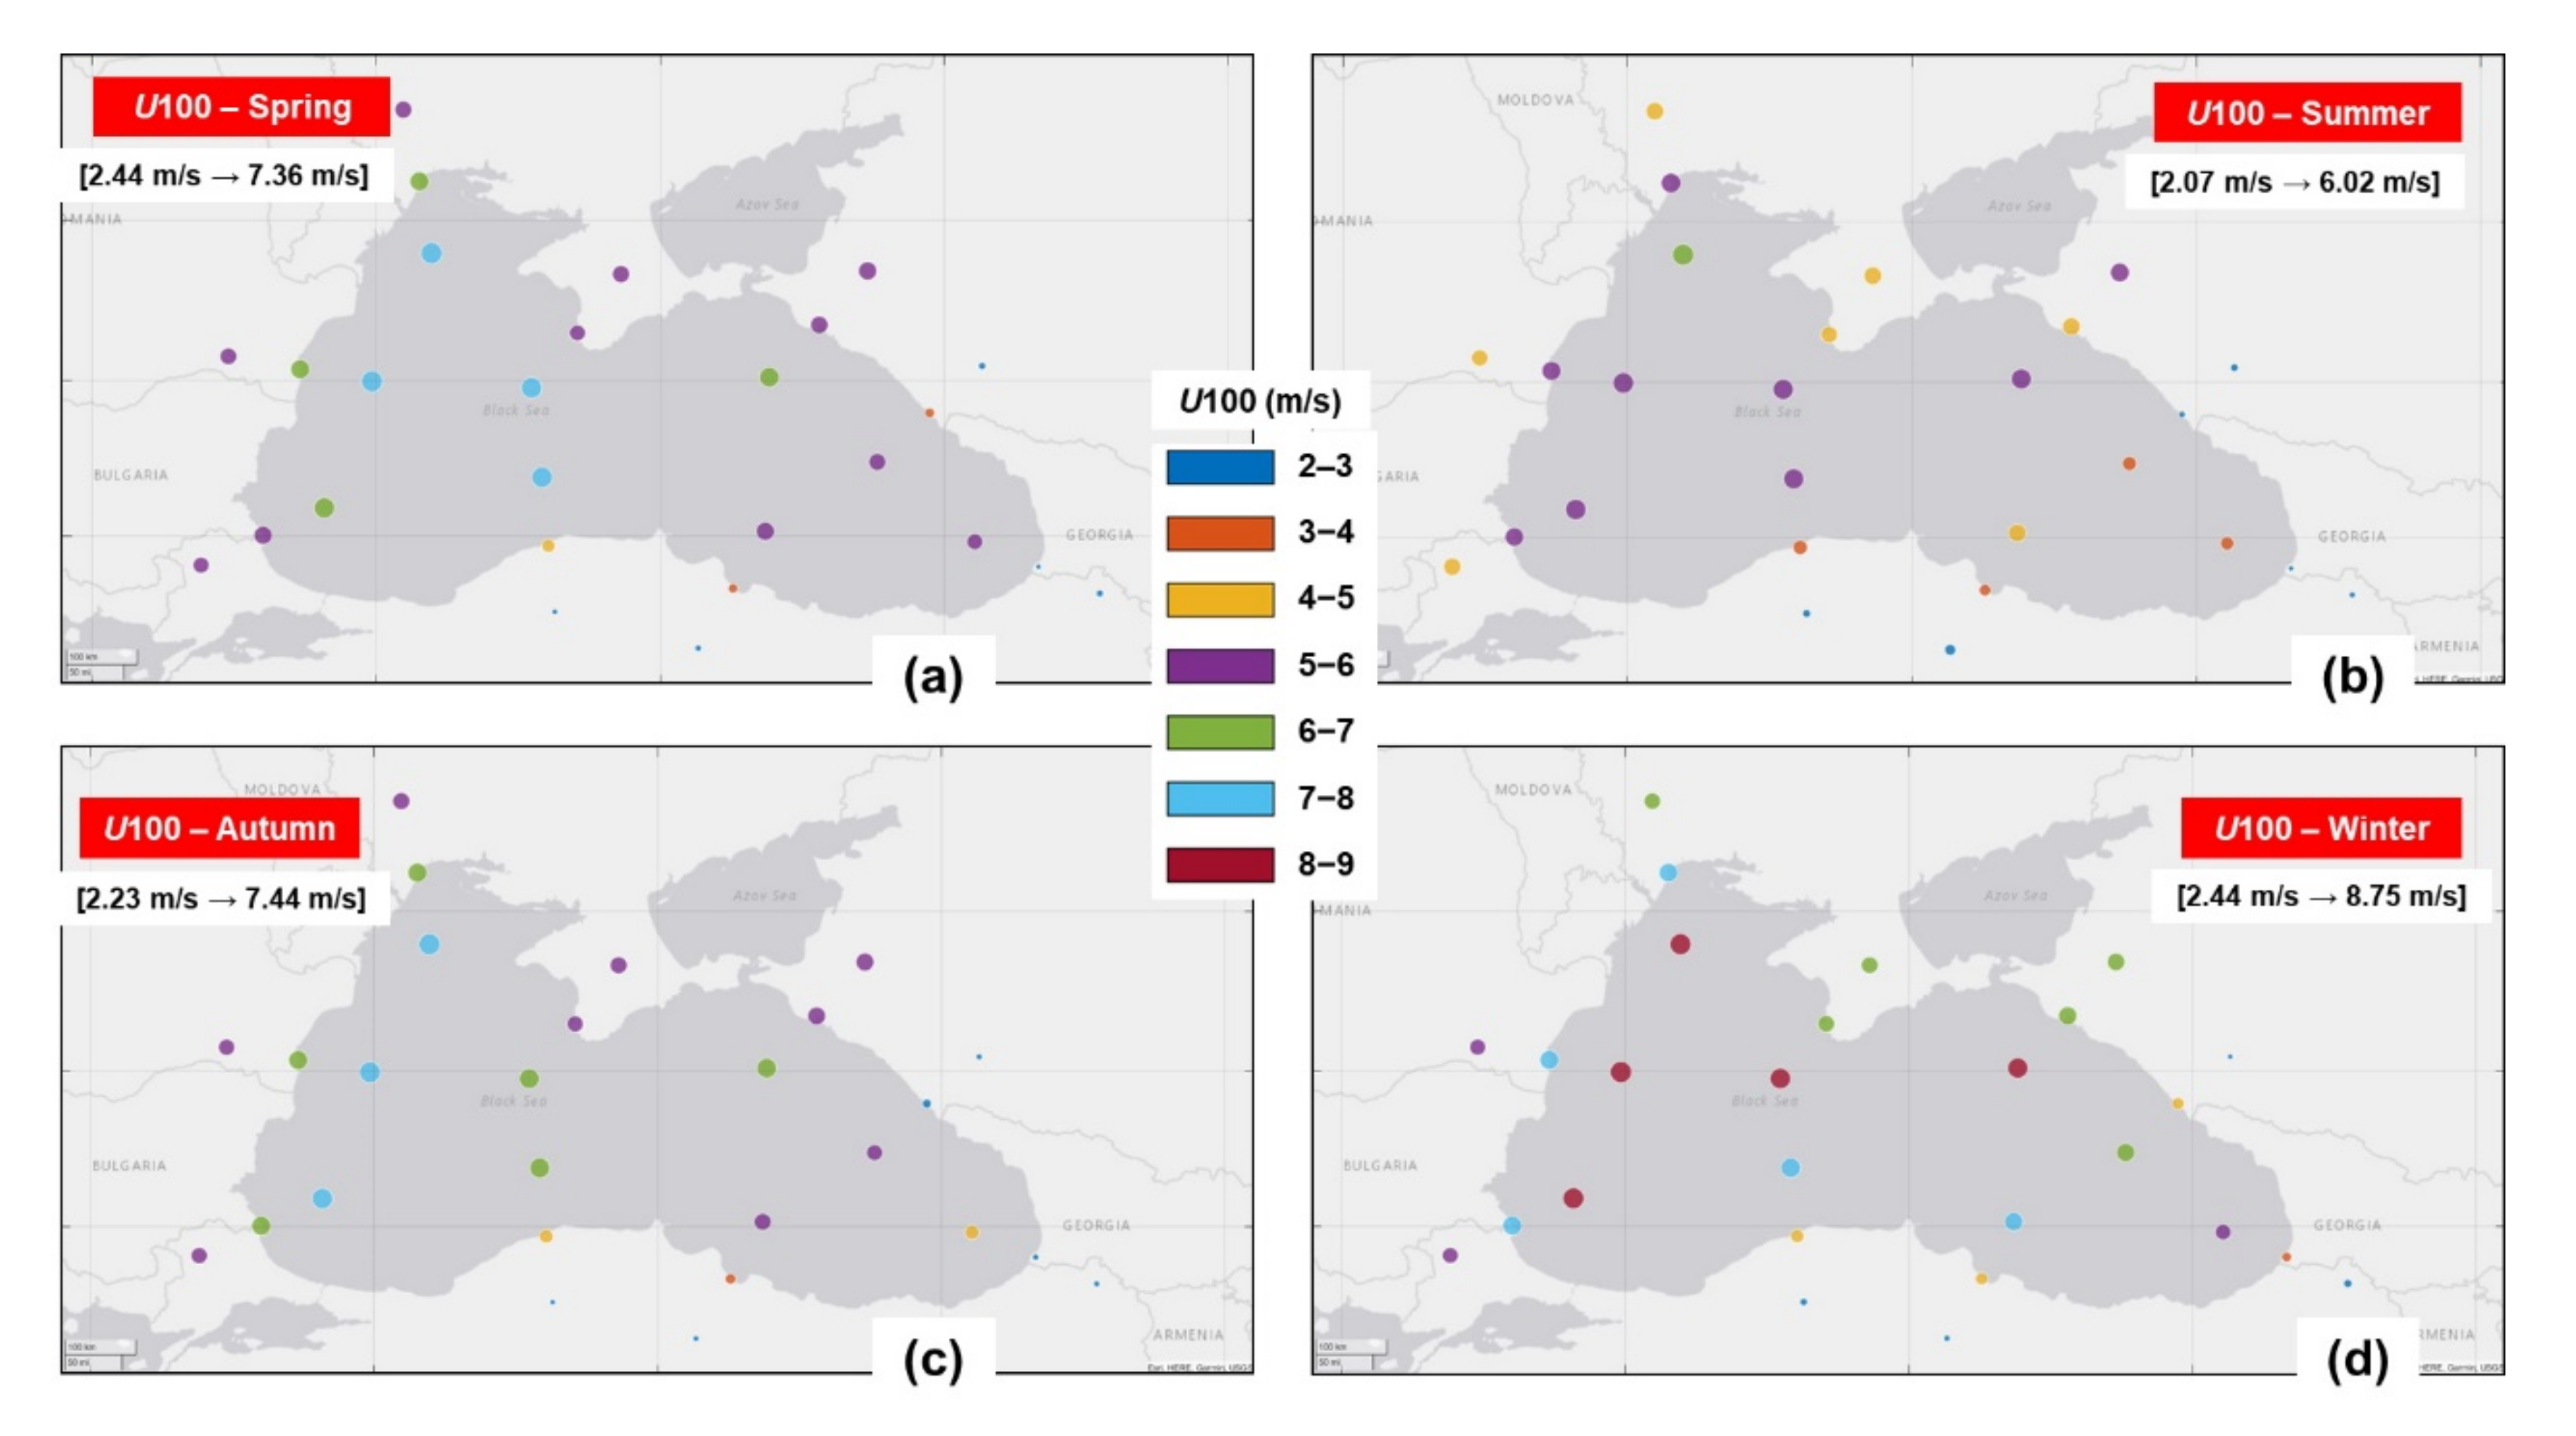
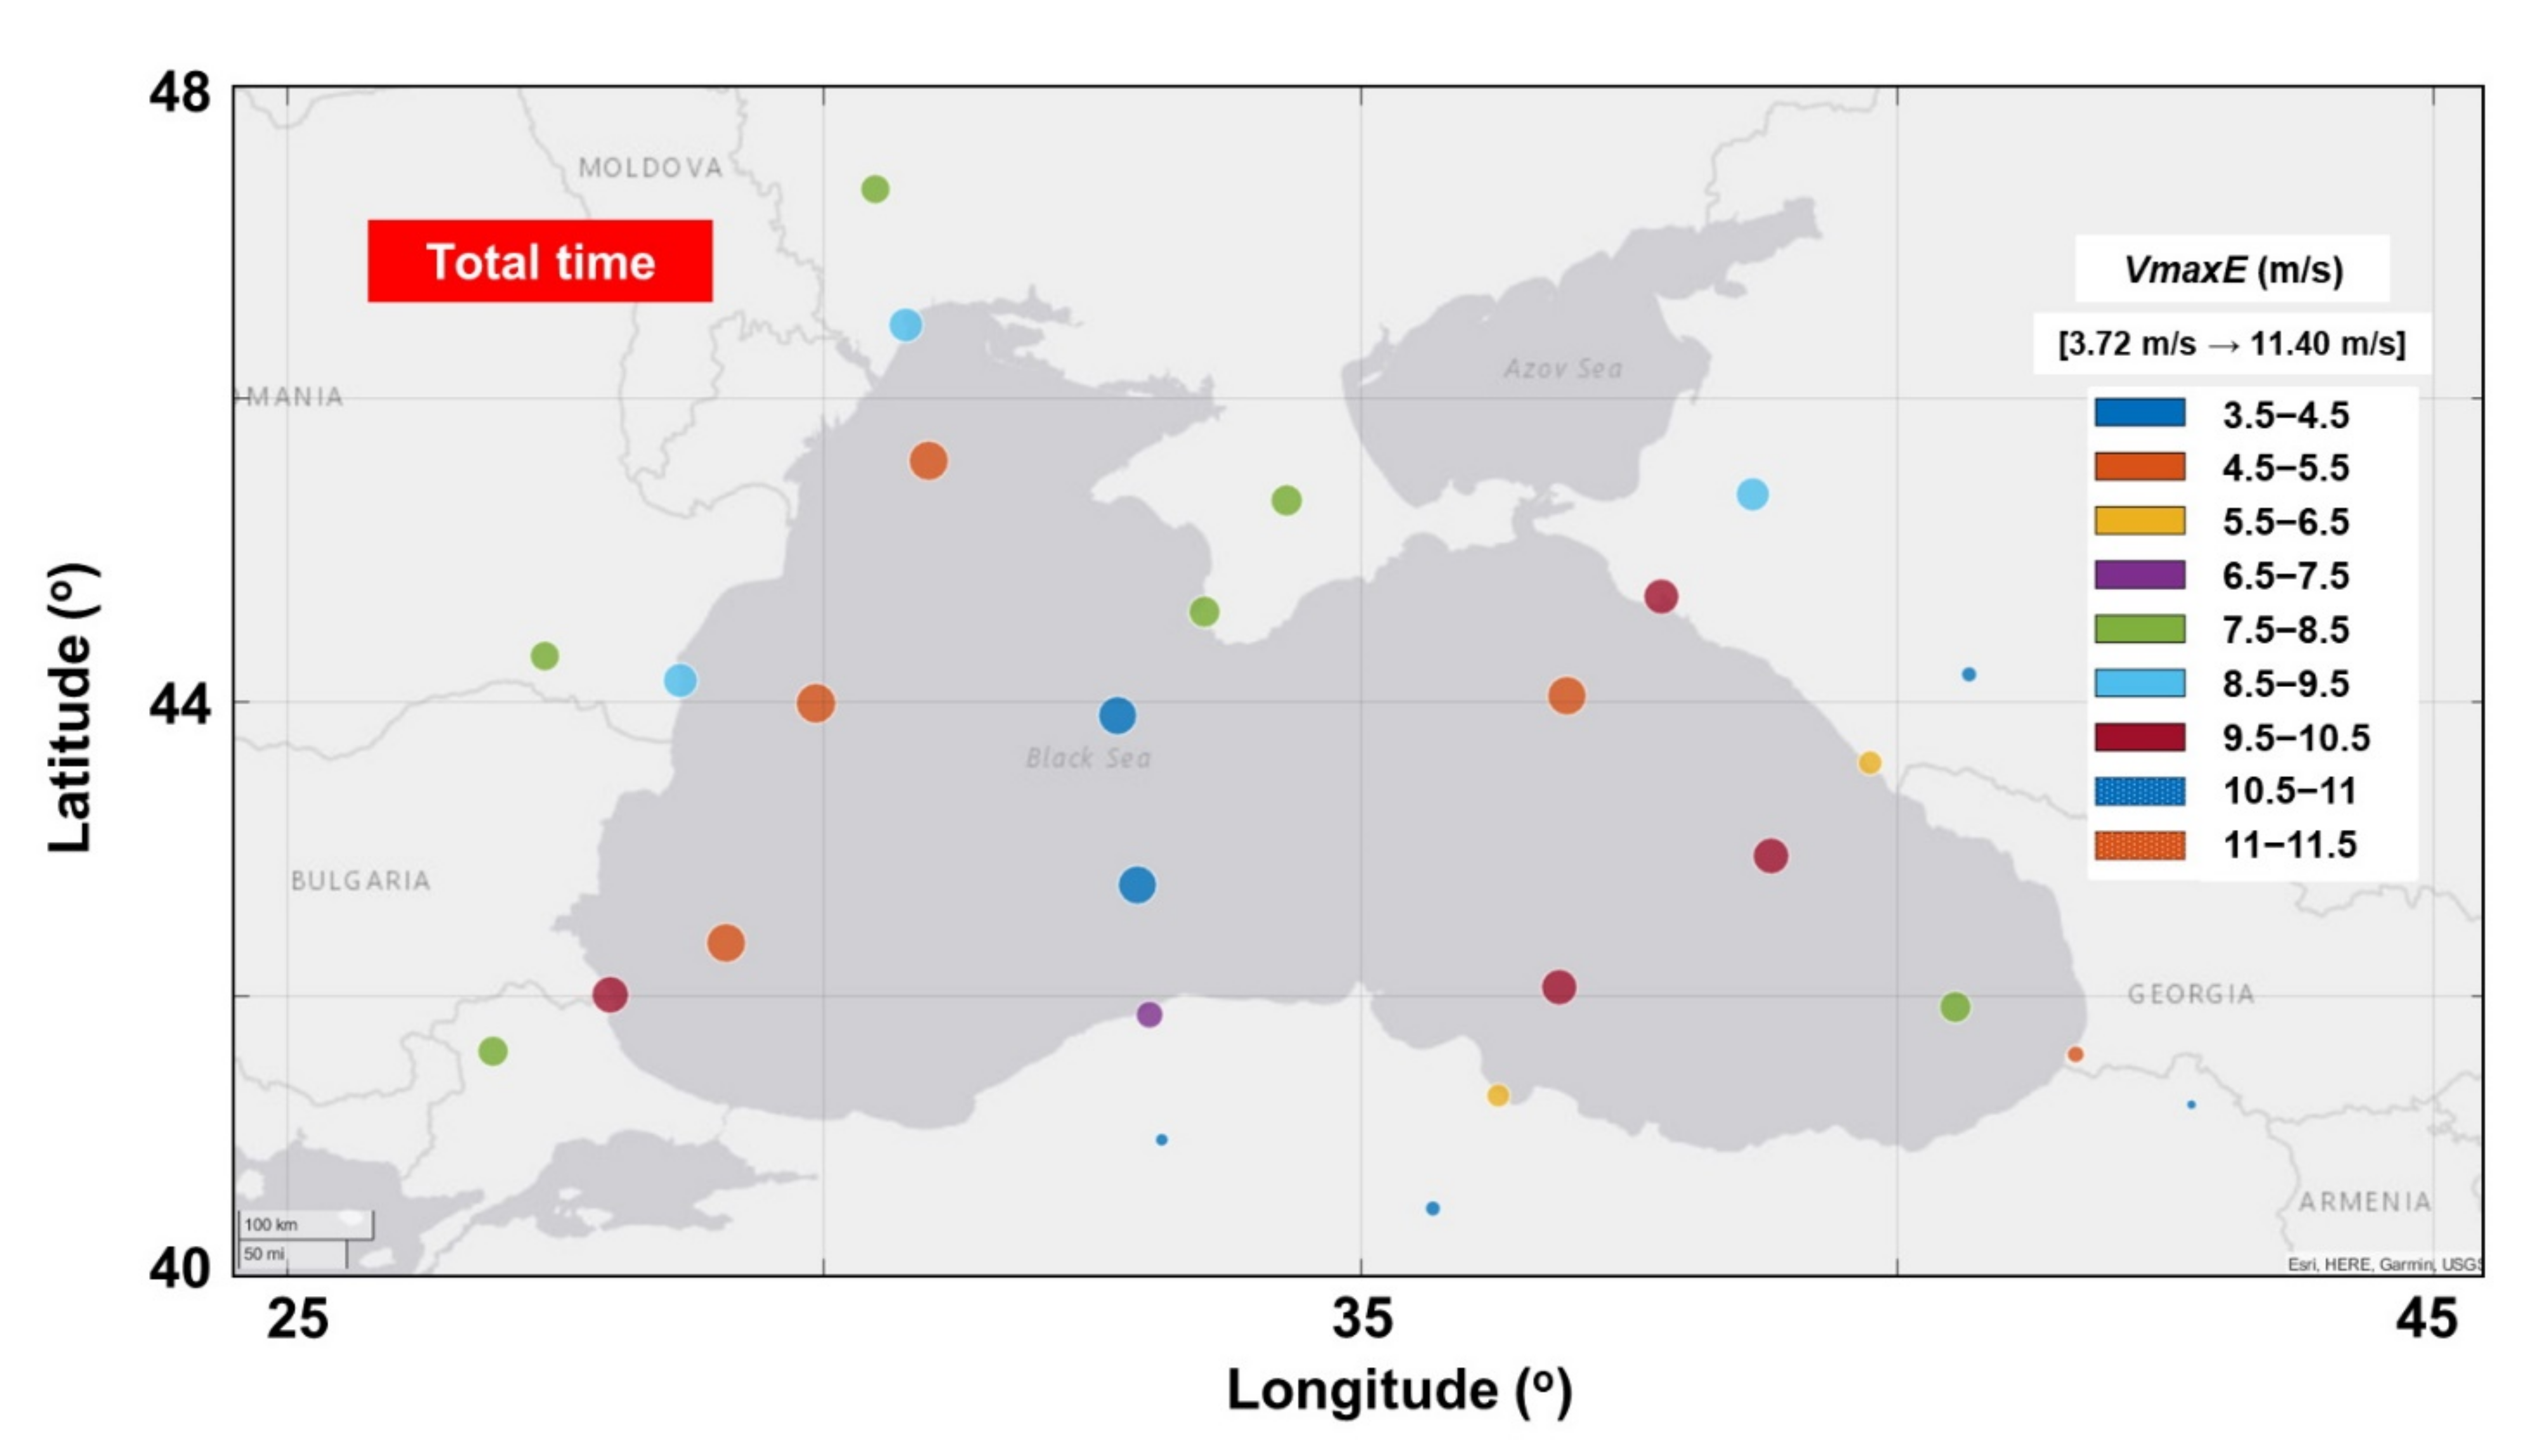
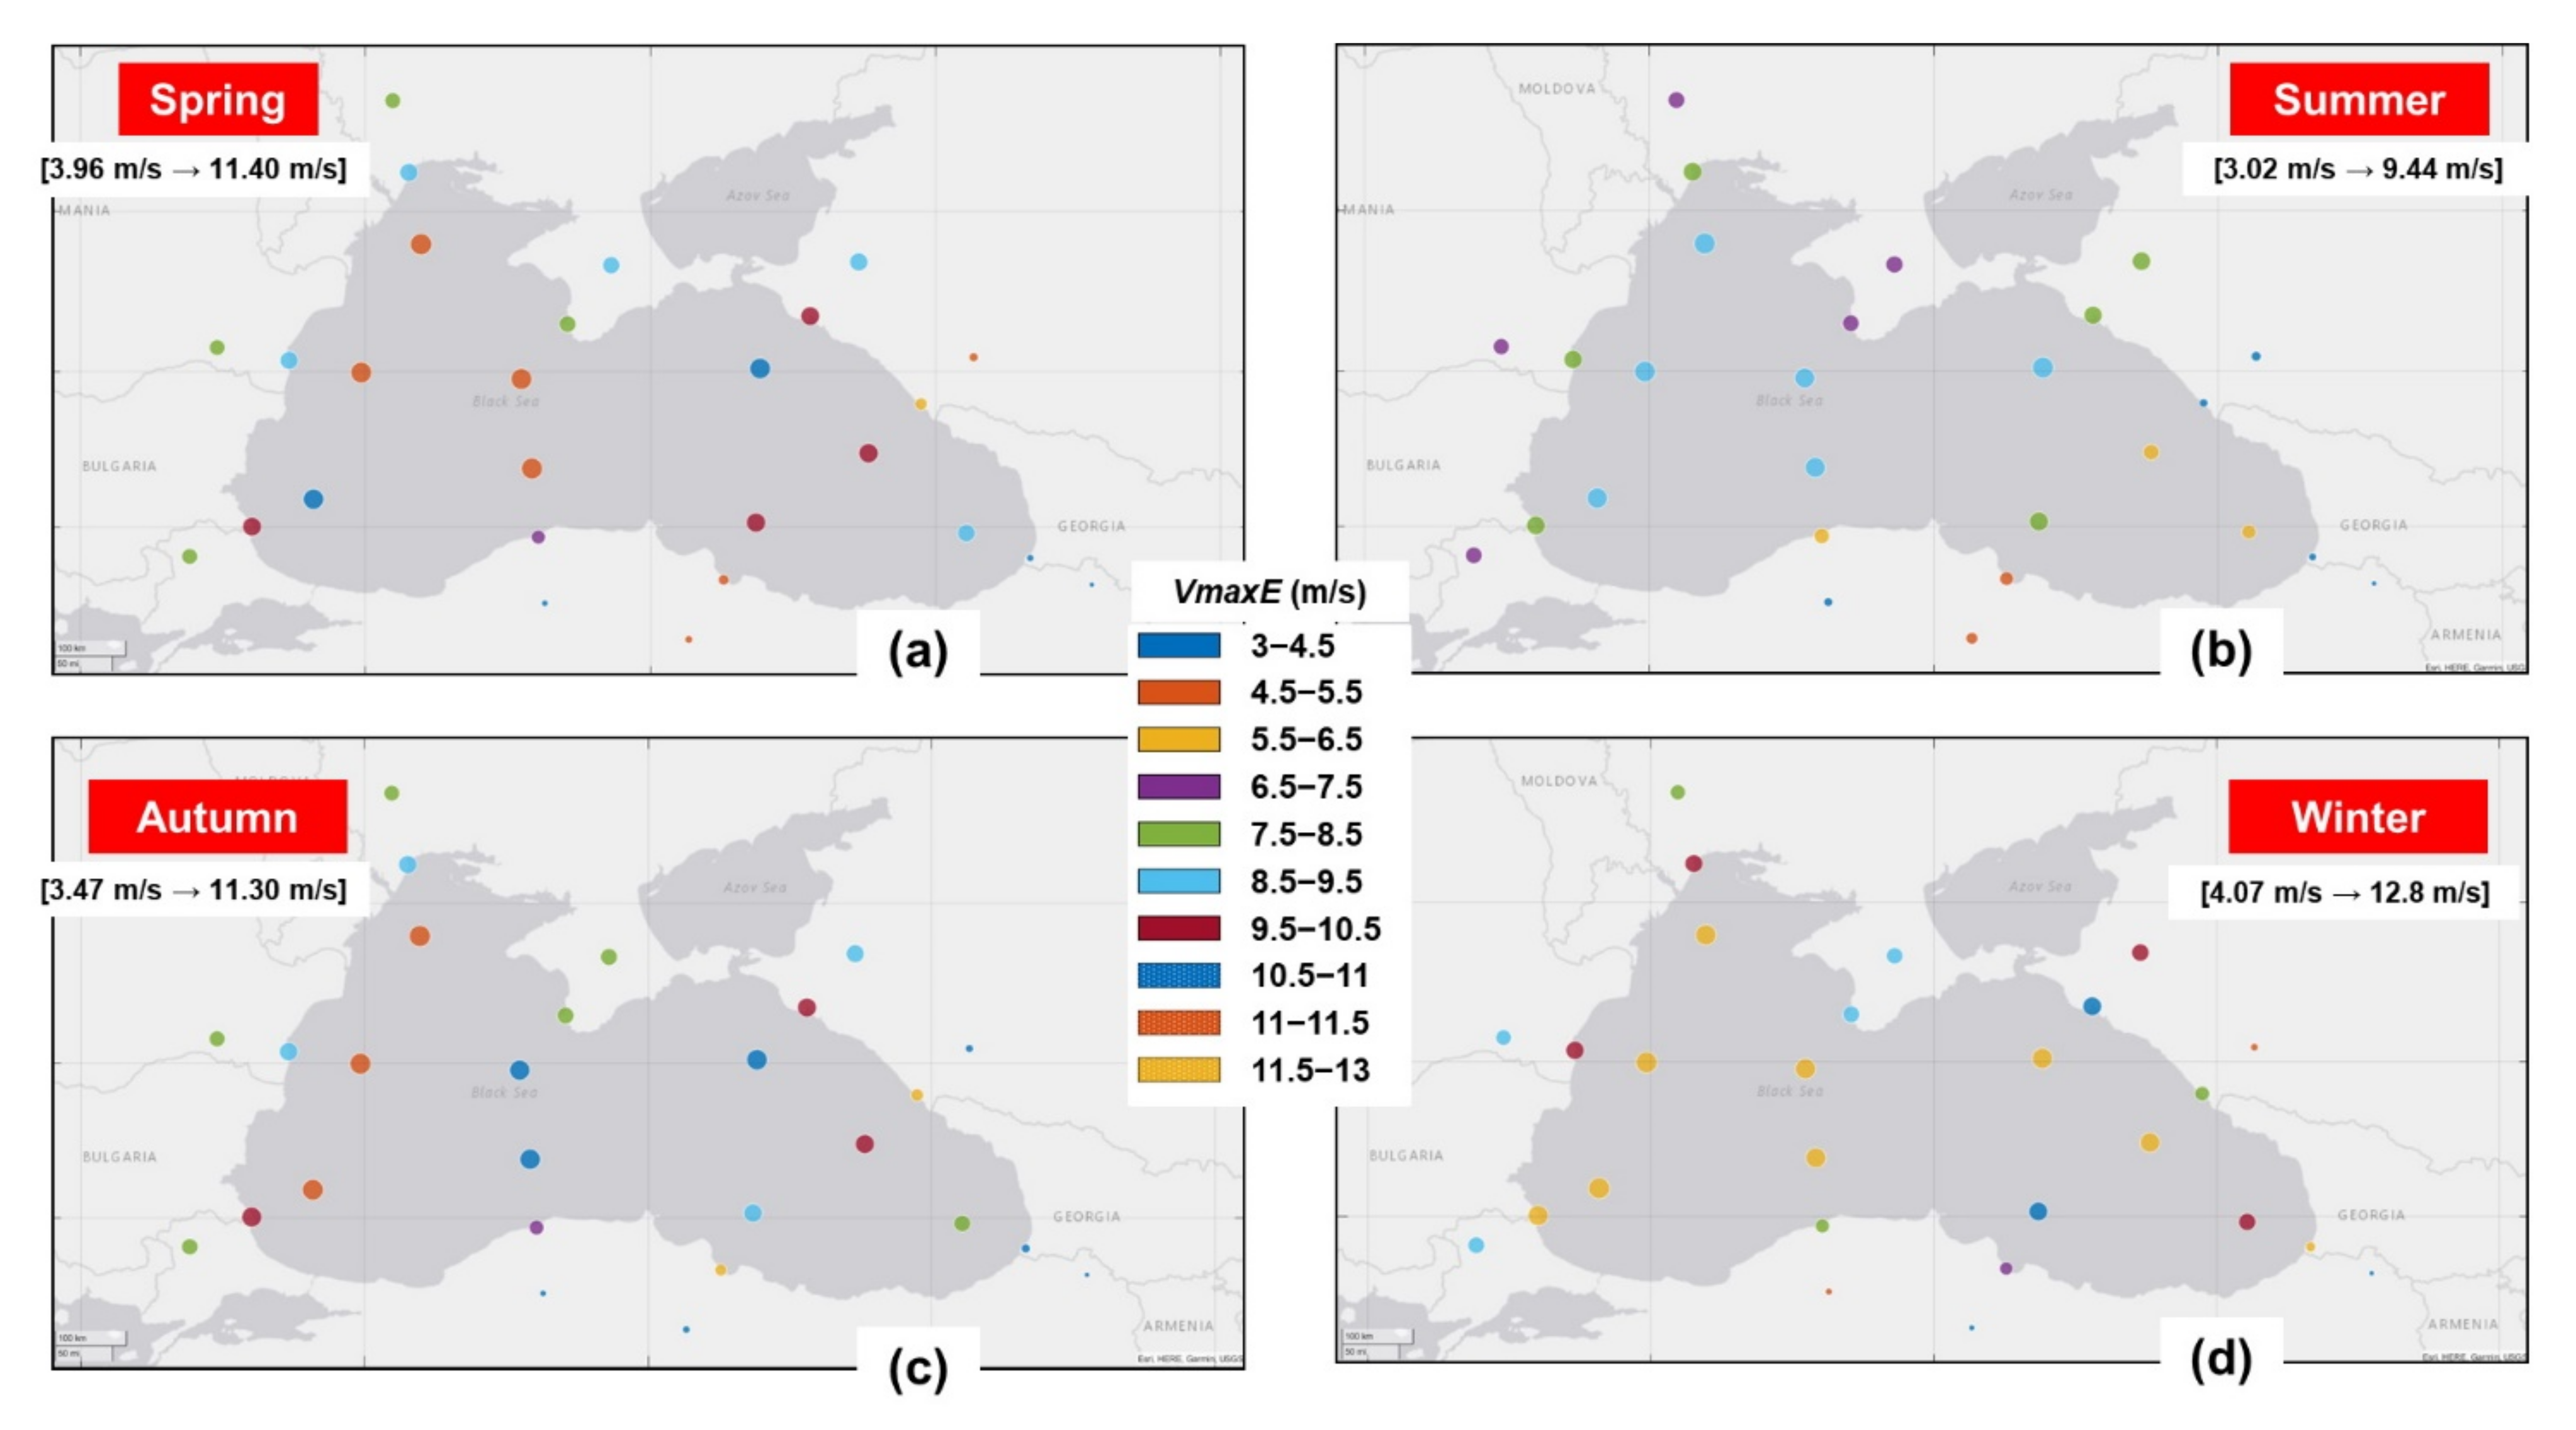
According to the evolution of the VmaxE indicator, the rated wind speed of a wind turbine should be located in the range of 3.5–11.5 m/s on a general scale, with higher values being related to an offshore wind generator. During wintertime, a generator operating near a rated speed of 12.8 m/s may be considered efficient for most of the marine areas (100 km from the shore);
(b)
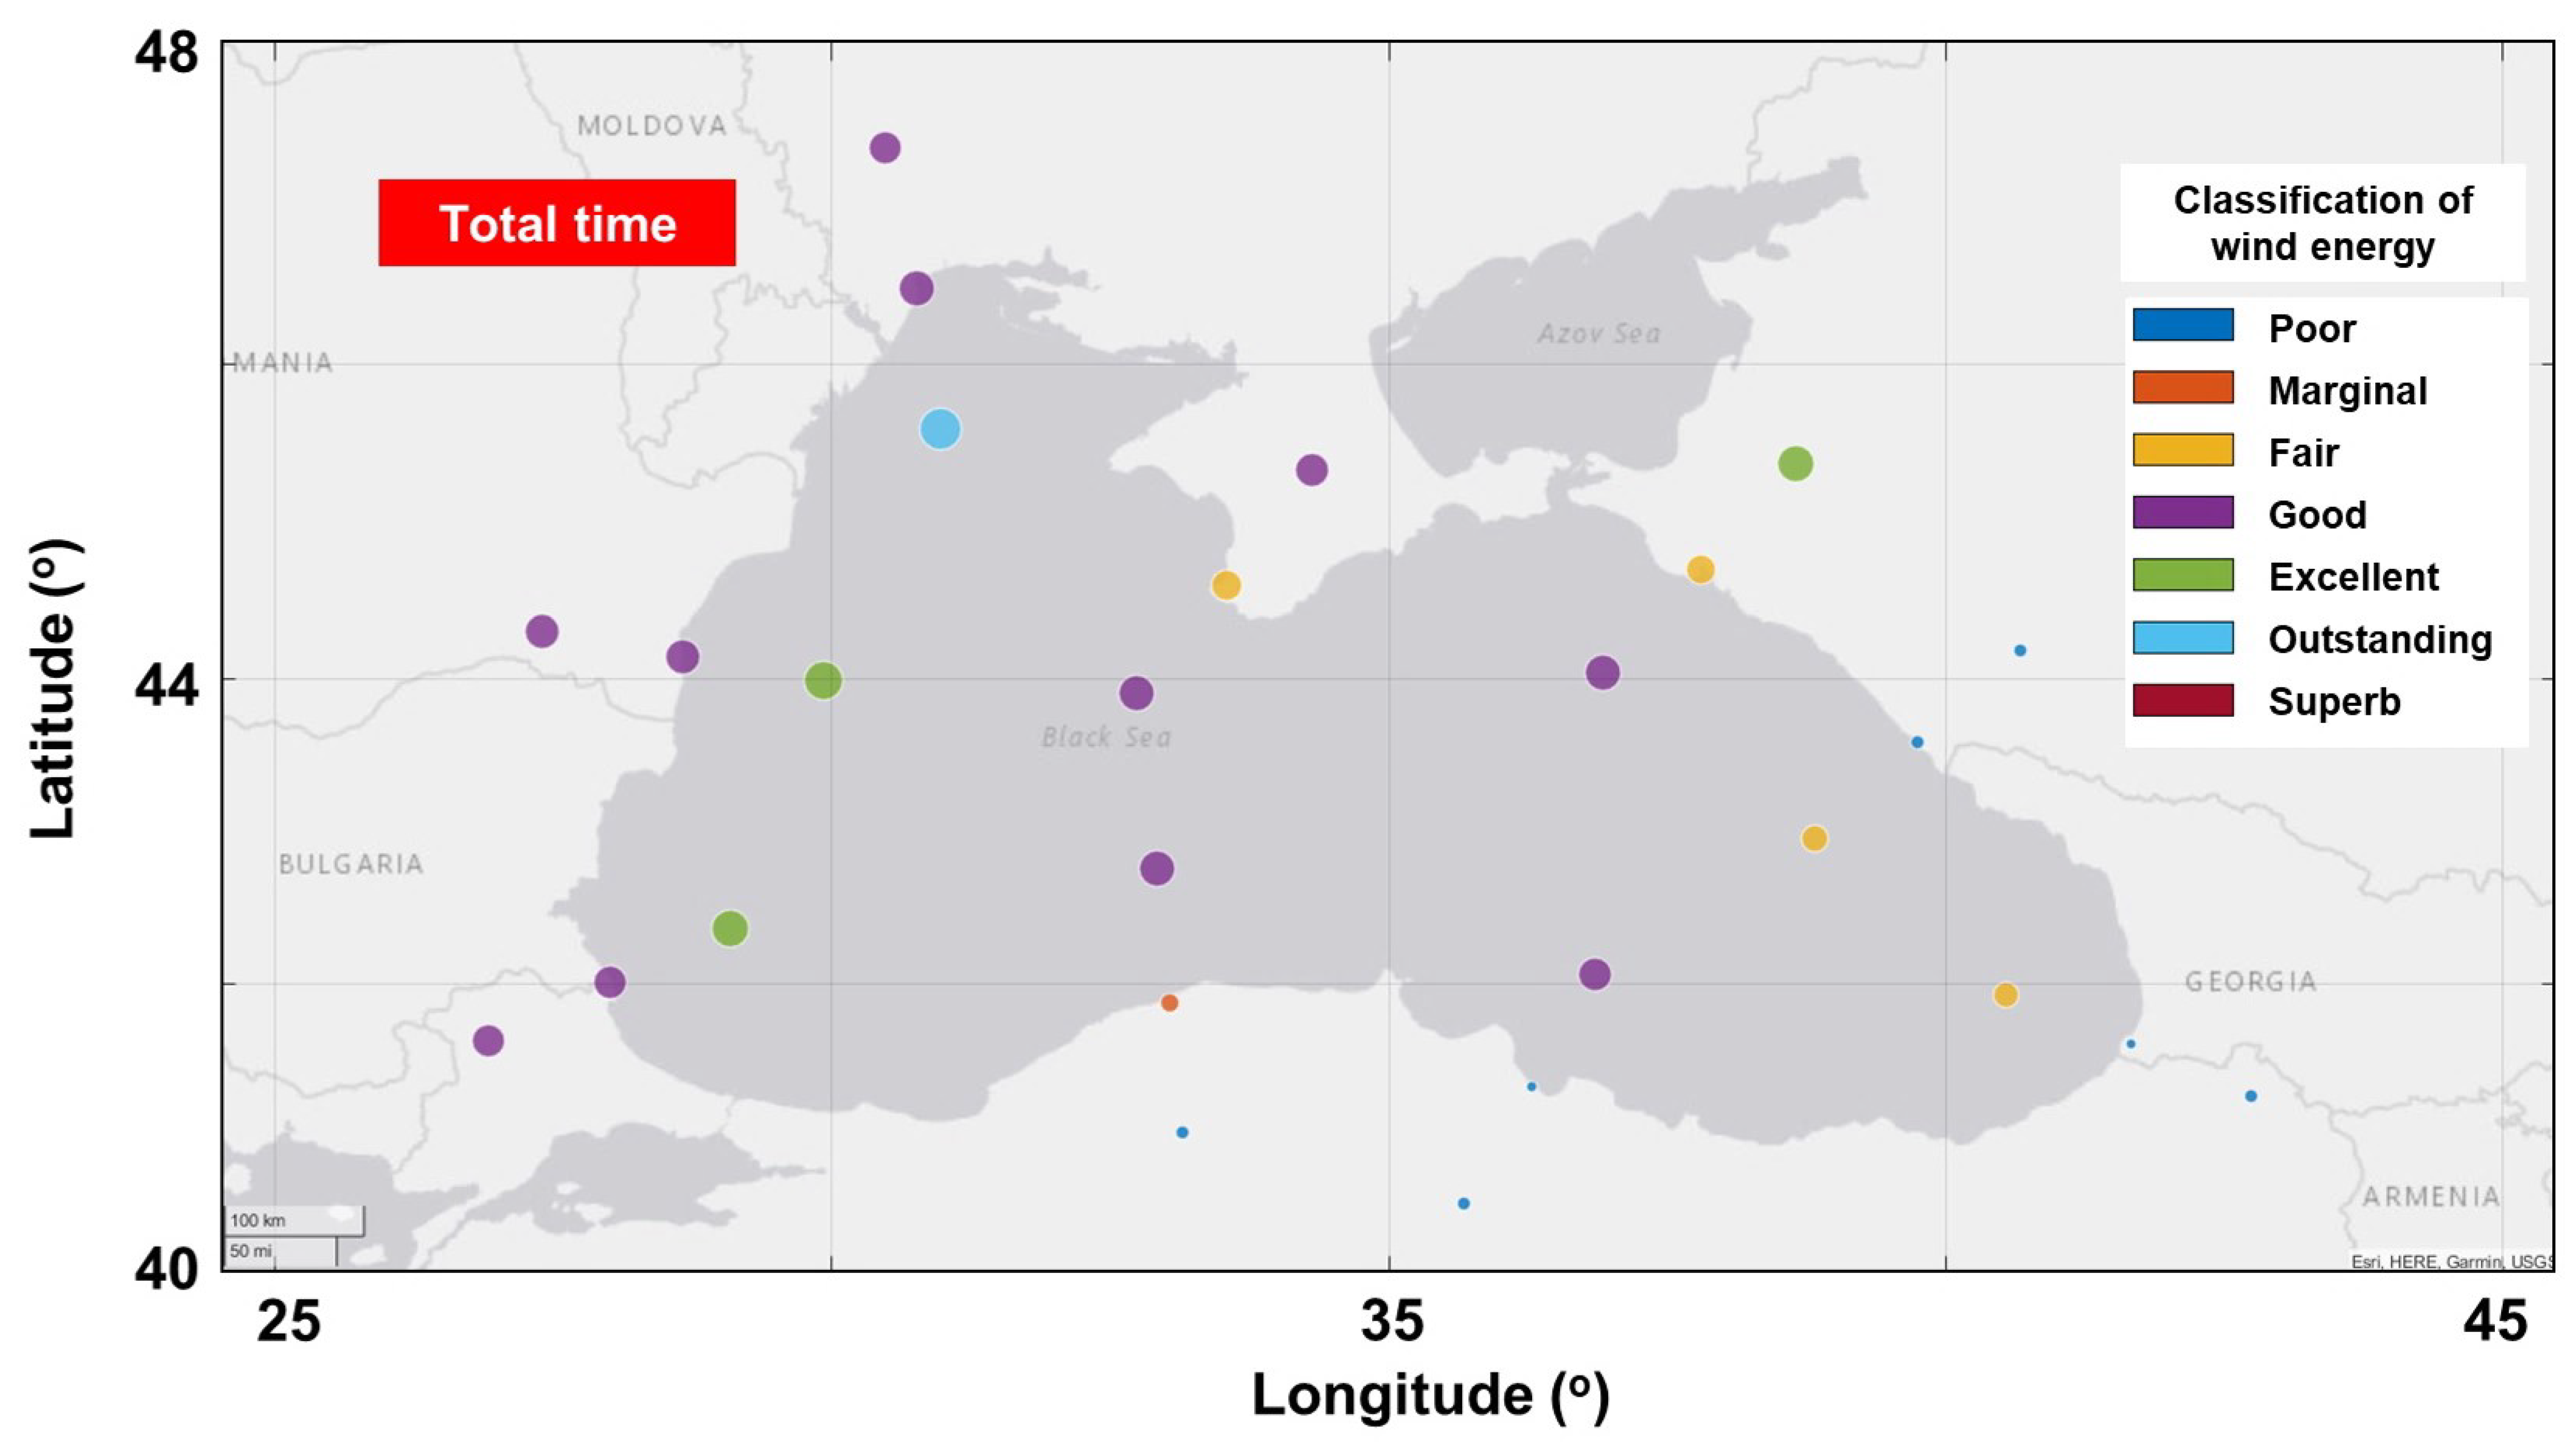
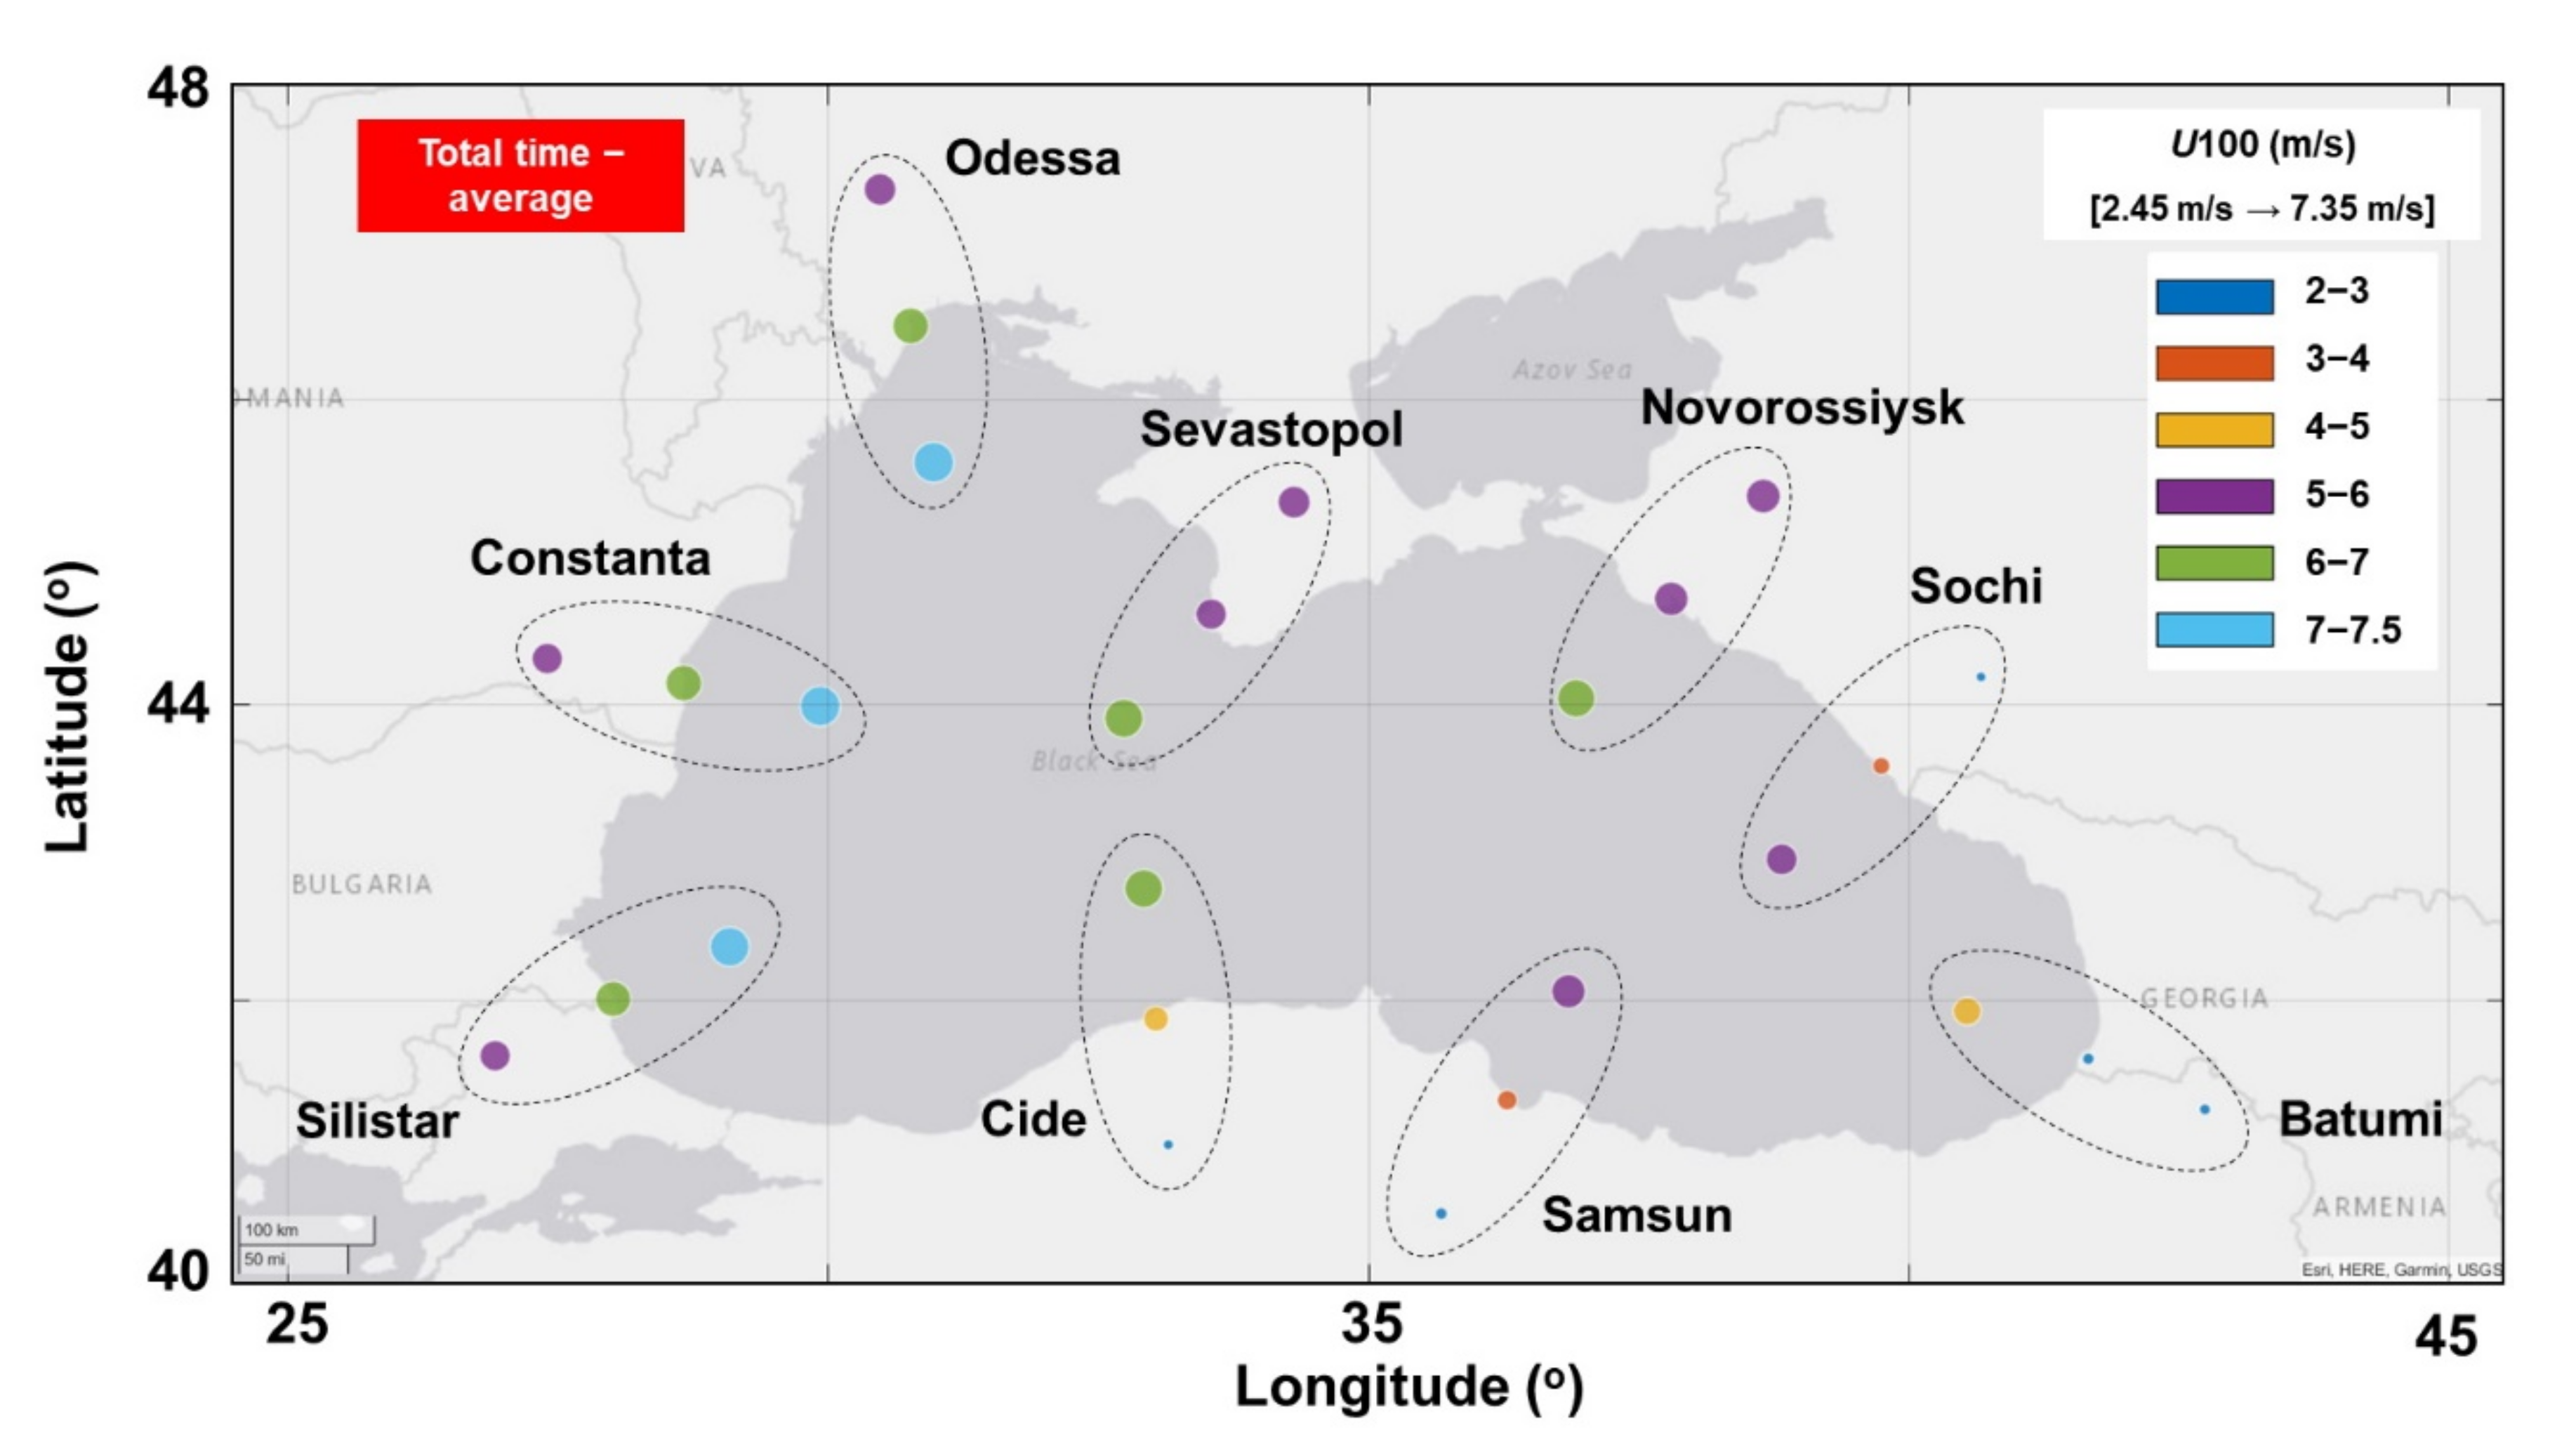
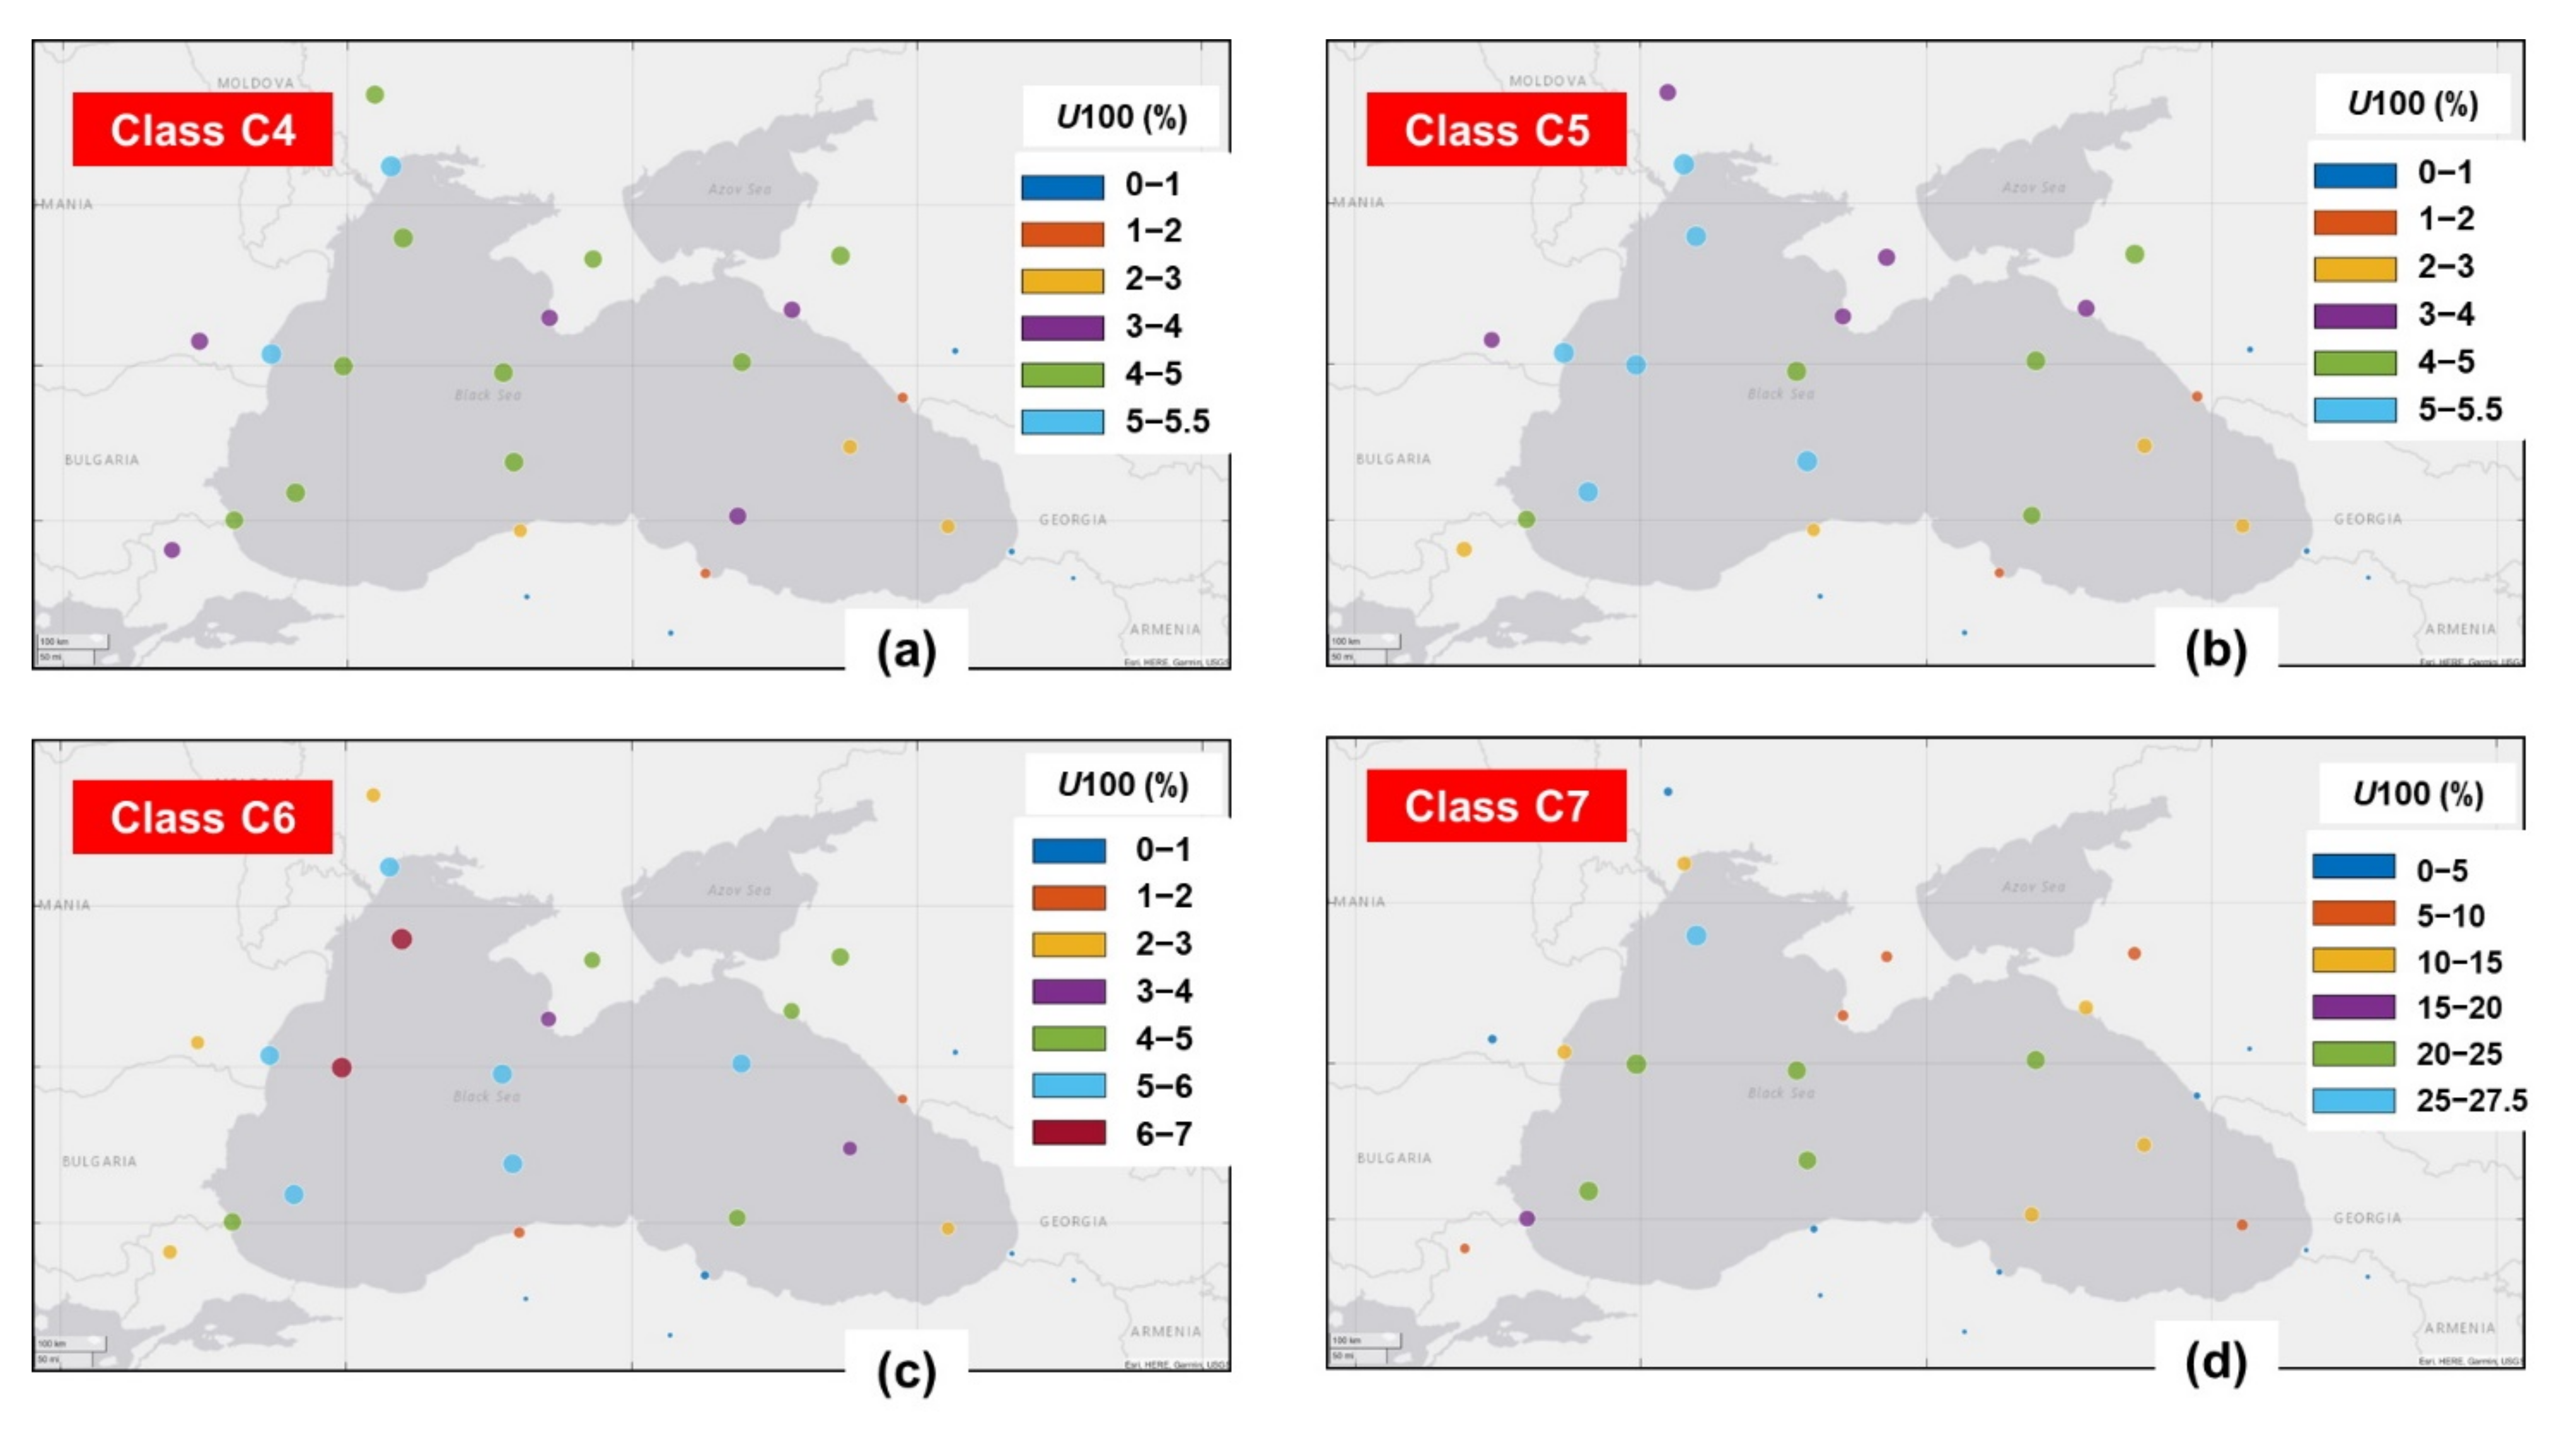
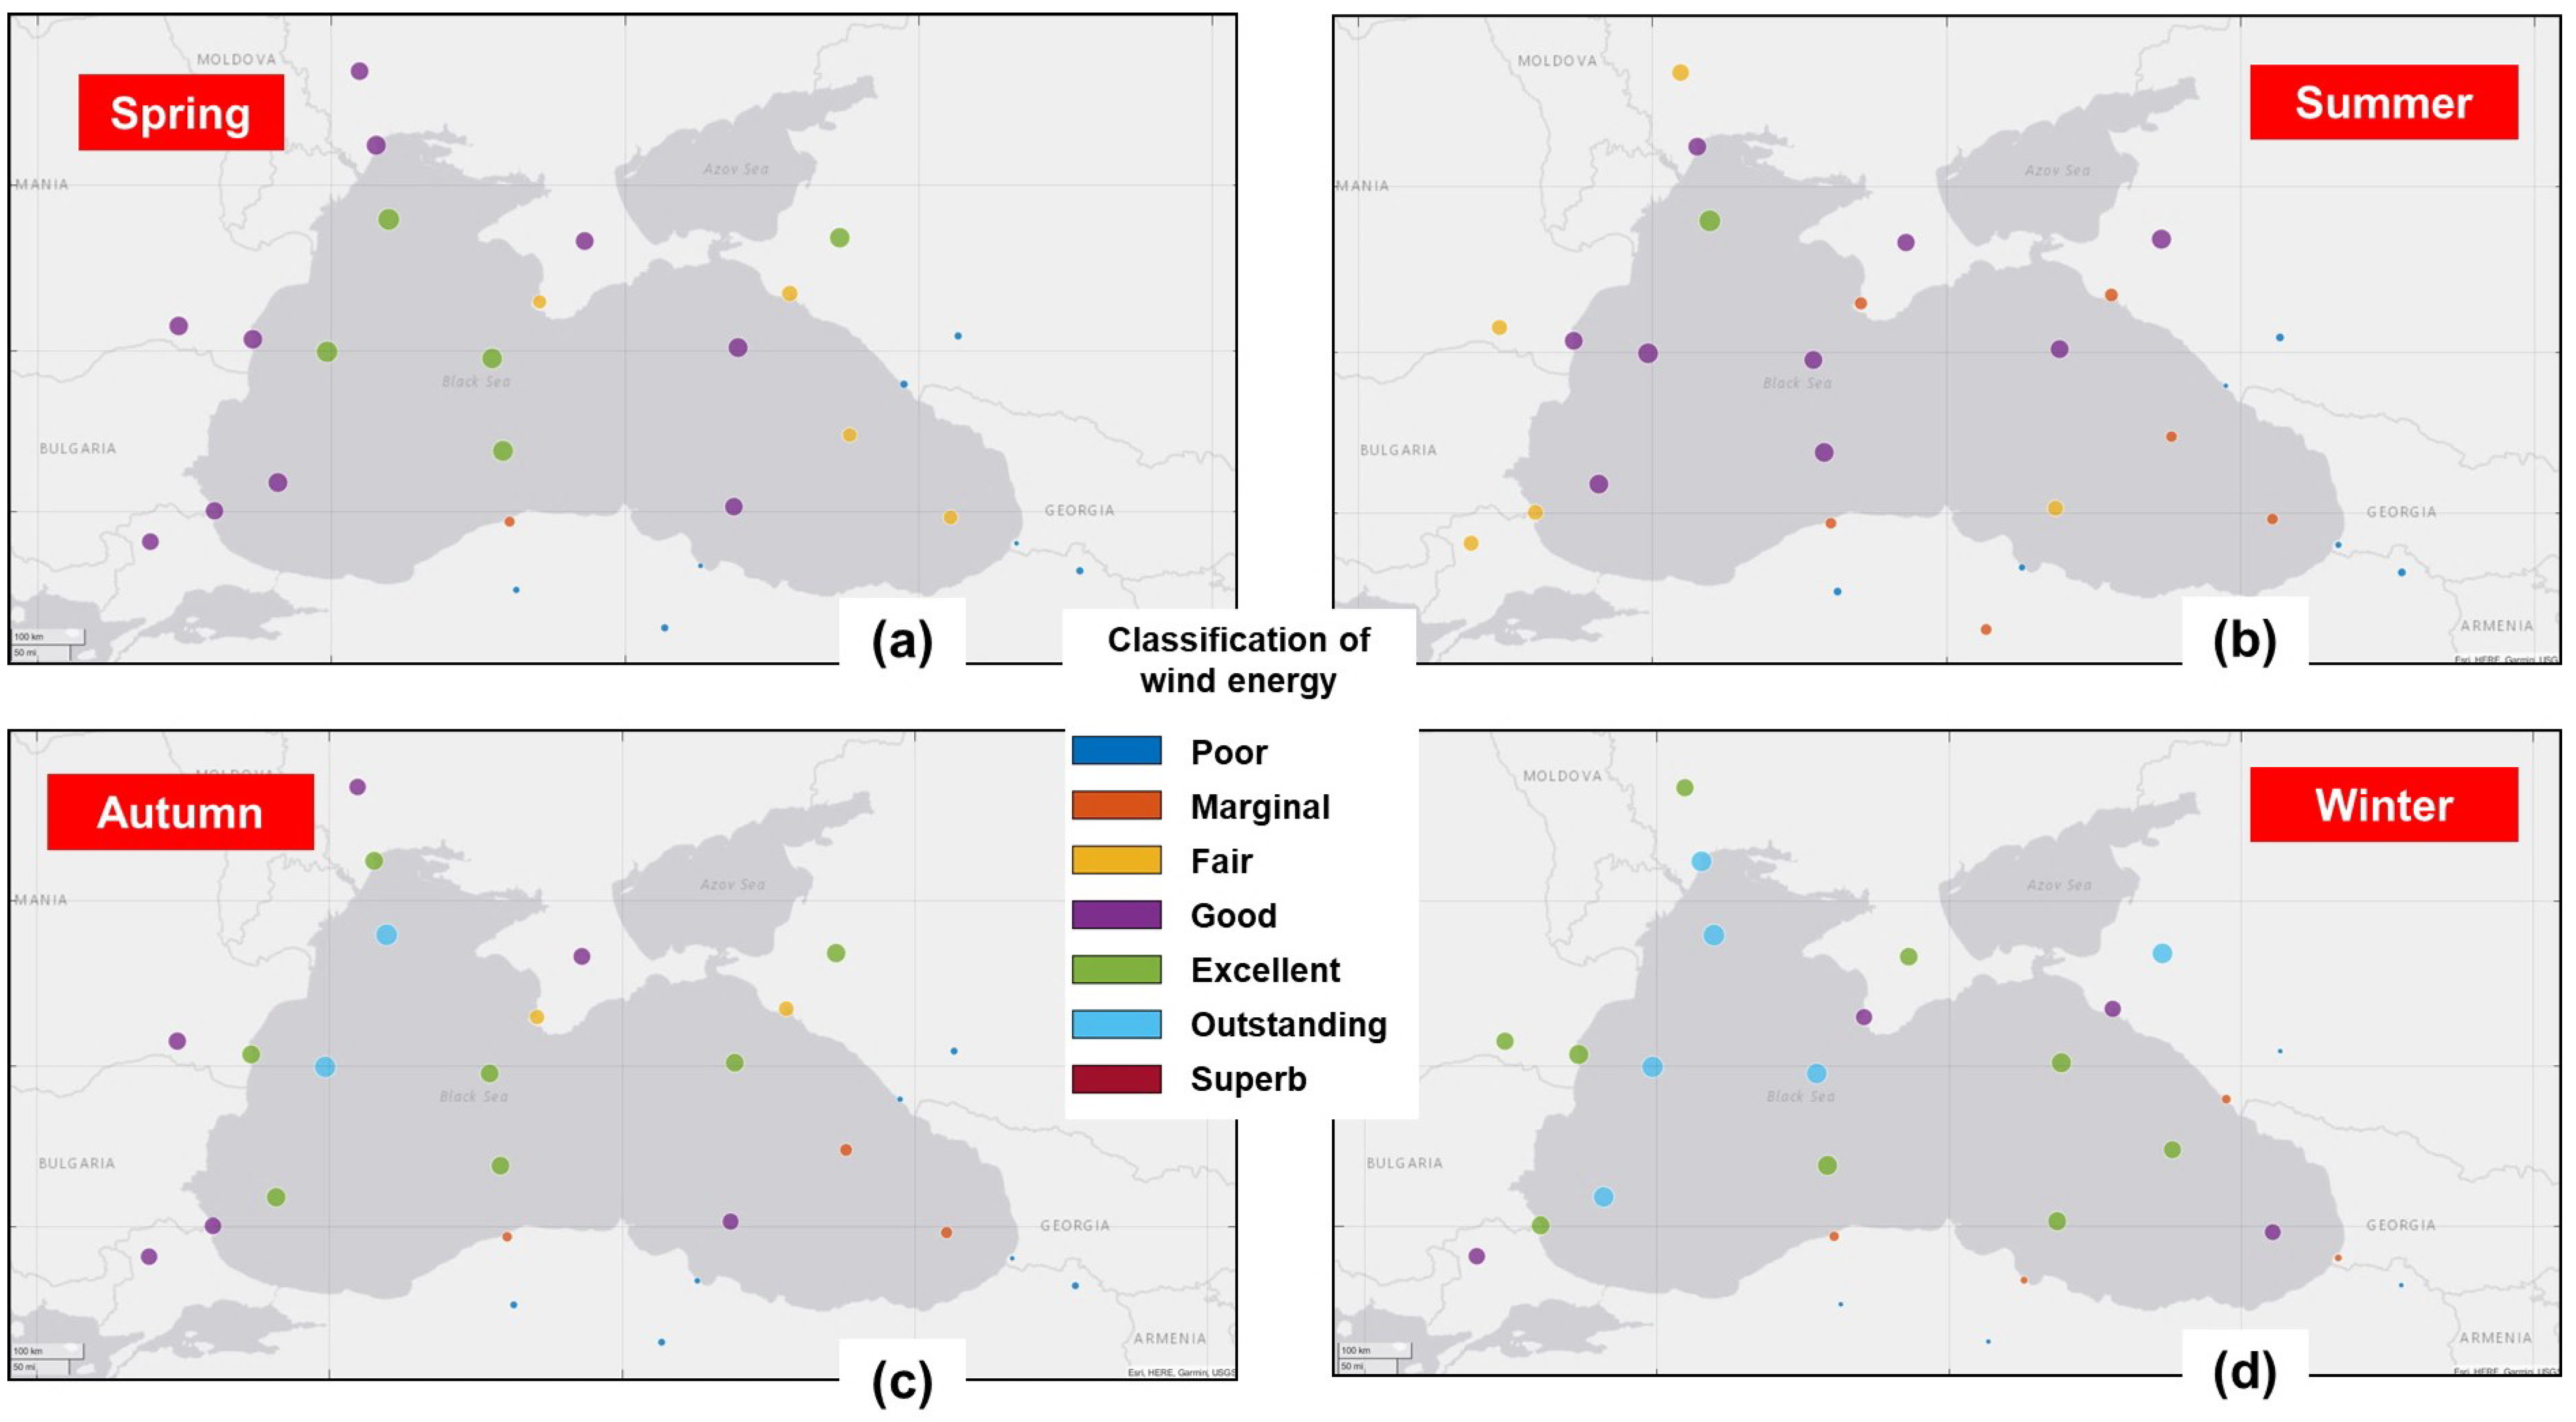
By applying a multicriteria decision, it was found that the marine site located close to the Odessa area (Ukraine) presents wind conditions rated as outstanding (class C6), while during autumn and winter, some other sites are included in this category, for example, Constanta, Romania;
(c)
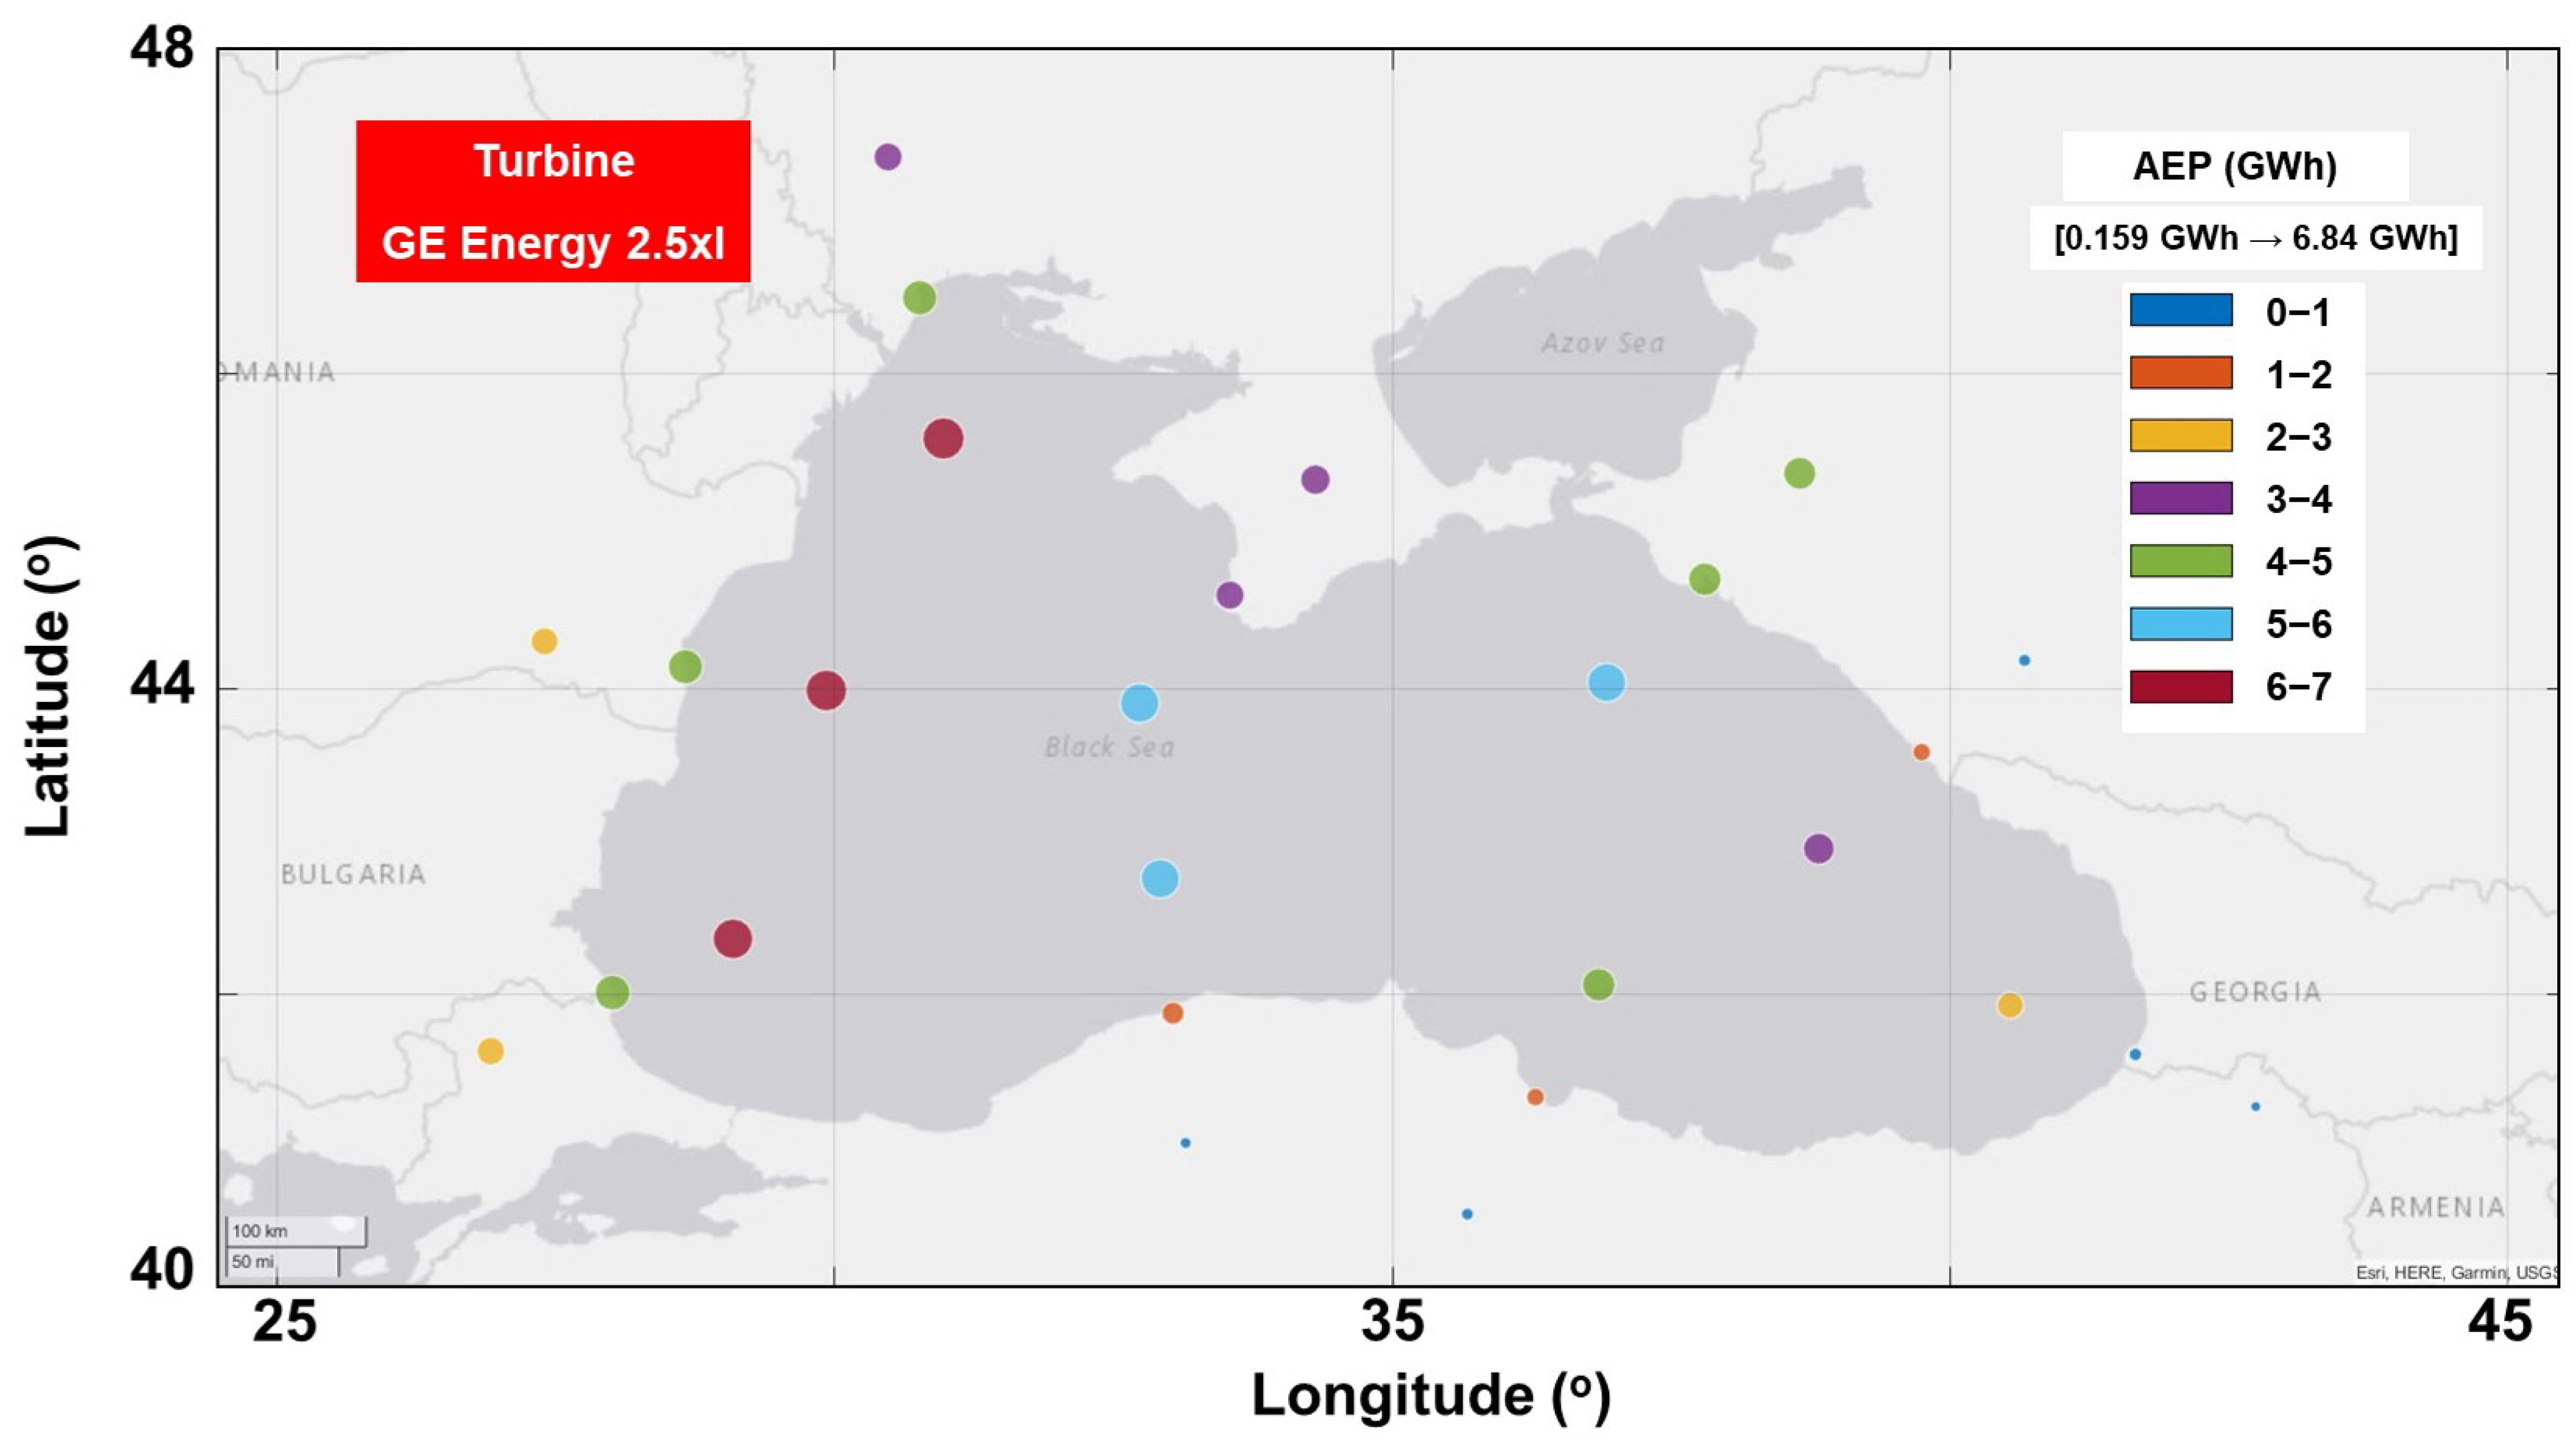
As expected, a wind turbine rated at 20 MW (marine version) will have a higher electricity production, compared to a 2.5 MW generator (onshore version), indicating also better performances in terms of the capacity factor.
It has to be also highlighted that the present work has some limitations, of which we can mention the use of the ERA5 wind dataset that is not real, observed data. On the other hand, the ERA5 dataset is considered to be some of the best reanalysis data available at this moment, being frequently used by scientists from various research fields. We need also to mention that there is currently no wind project where a 20 MW generator operates, but on a longer term, this is the philosophy promoted by the European Union that can be achieved throughout projects such as Mobil-Grid-CoP [45].
Finally, we can conclude that the Black Sea area represents an important wind energy source for the implementation of the European Green Deal strategy. From this perspective, a significant contribution is expected from the EU countries (Romania and Bulgaria) that are defined by windy areas and shallow water regions, being possible to develop fixed and floating wind projects.

Author Contributions

V.Y. designed and wrote the manuscript. E.R. drafted and supervised the manuscript. F.O. analyzed the data and performed the interpretation of the results. The final manuscript has been approved by all authors. All authors have read and agreed to the published version of the manuscript.

Funding

This work was carried out in the framework of the research project DREAM (Dynamics of the REsources and technological Advance in harvesting Marine renewable energy), supported by the Romanian Executive Agency for Higher Education, Research, Development and Innovation Funding—UEFISCDI, grant number PN-III-P4-ID-PCE-2020-0008.

Acknowledgments

The results of this work will also be presented to the 10th edition of the Scientific Conference organized by the Doctoral Schools of “Dunărea de Jos” University of Galati (SCDS-UDJG) http://www.cssd-udjg.ugal.ro/ (accessed on 4 June 2022) that will be held on the 9–10 June 2022, in Galati, Romania. The data processed in this work are openly available. The ERA5 wind dataset is freely available through the EU-funded Copernicus Climate Change Service.

Conflicts of Interest

The authors declare no conflict of interest.

References

  1. Zou, C.; Ma, F.; Pan, S.; Lin, M.; Zhang, G.; Xiong, B.; Wang, Y.; Liang, Y.; Yang, Z. Earth Energy Evolution, Human Development and Carbon Neutral Strategy. Pet. Explor. Dev. 2022, 49, 468–488. [Google Scholar] [CrossRef]
  2. Jia, Z.; Wen, S.; Lin, B. The Effects and Reacts of COVID-19 Pandemic and International Oil Price on Energy, Economy, and Environment in China. Appl. Energy 2021, 302, 117612. [Google Scholar] [CrossRef] [PubMed]
  3. Bento, P.M.R.; Mariano, S.J.P.S.; Calado, M.R.A.; Pombo, J.A.N. Impacts of the COVID-19 Pandemic on Electric Energy Load and Pricing in the Iberian Electricity Market. Energy Rep. 2021, 7, 4833–4849. [Google Scholar] [CrossRef]
  4. Boosting Offshore Renewable Energy. Available online: https://ec.europa.eu/commission/presscorner/detail/en/IP_20_2096 (accessed on 23 June 2022).
  5. Wind Energy in Europe: 2021 Statistics and the Outlook for 2022–2026|WindEurope. Available online: https://windeurope.org/intelligence-platform/product/wind-energy-in-europe-2021-statistics-and-the-outlook-for-2022-2026/ (accessed on 23 June 2022).
  6. Enevoldsen, P.; Valentine, S.V. Do Onshore and Offshore Wind Farm Development Patterns Differ? Energy Sustain. Dev. 2016, 35, 41–51. [Google Scholar] [CrossRef]
  7. Saenz-Aguirre, A.; Saenz, J.; Ulazia, A.; Ibarra-Berastegui, G. Optimal Strategies of Deployment of Far Offshore Co-Located Wind-Wave Energy Farms. Energy Convers. Manag. 2022, 251, 114914. [Google Scholar] [CrossRef]
  8. Raileanu, A.; Onea, F.; Rusu, E. An Overview of the Expected Shoreline Impact of the Marine Energy Farms Operating in Different Coastal Environments. J. Mar. Sci. Eng. 2020, 8, 228. [Google Scholar] [CrossRef] [Green Version]
  9. Dawn, S.; Tiwari, P.K.; Goswami, A.K.; Singh, A.K.; Panda, R. Wind Power: Existing Status, Achievements and Government’s Initiative towards Renewable Power Dominating India. Energy Strategy Rev. 2019, 23, 178–199. [Google Scholar] [CrossRef]
  10. Rusu, L.; Ganea, D.; Mereuta, E. A Joint Evaluation of Wave and Wind Energy Resources in the Black Sea Based on 20-Year Hindcast Information. Energy Explor. Exploit. 2018, 36, 335–351. [Google Scholar] [CrossRef]
  11. Kubryakov, A.; Stanichny, S.; Shokurov, M.; Garmashov, A. Wind Velocity and Wind Curl Variability over the Black Sea from QuikScat and ASCAT Satellite Measurements. Remote Sens. Environ. 2019, 224, 236–258. [Google Scholar] [CrossRef]
  12. Onea, F.; Rusu, E.; Rusu, L. Assessment of the Offshore Wind Energy Potential in the Romanian Exclusive Economic Zone. J. Mar. Sci. Eng. 2021, 9, 531. [Google Scholar] [CrossRef]
  13. Islek, F.; Yuksel, Y.; Sahin, C. Spatiotemporal Long-Term Trends of Extreme Wind Characteristics over the Black Sea. Dyn. Atmos. Oceans 2020, 90, 101132. [Google Scholar] [CrossRef]
  14. Rusu, E. A 30-Year Projection of the Future Wind Energy Resources in the Coastal Environment of the Black Sea. Renew. Energy 2019, 139, 228–234. [Google Scholar] [CrossRef]
  15. Amarouche, K.; Akpınar, A.; Soran, M.B.; Myslenkov, S.; Majidi, A.G.; Kankal, M.; Arkhipkin, V. Spatial Calibration of an Unstructured SWAN Model Forced with CFSR and ERA5 Winds for the Black and Azov Seas. Appl. Ocean Res. 2021, 117, 102962. [Google Scholar] [CrossRef]
  16. Guillory, A. ERA5. Available online: https://www.ecmwf.int/en/forecasts/datasets/reanalysis-datasets/era5 (accessed on 31 May 2019).
  17. Costoya, X.; de Castro, M.; Carvalho, D.; Gómez-Gesteira, M. On the Suitability of Offshore Wind Energy Resource in the United States of America for the 21st Century. Appl. Energy 2020, 262, 114537. [Google Scholar] [CrossRef]
  18. Costoya, X.; de Castro, M.; Santos, F.; Sousa, M.C.; Gómez-Gesteira, M. Projections of Wind Energy Resources in the Caribbean for the 21st Century. Energy 2019, 178, 356–367. [Google Scholar] [CrossRef]
  19. Oh, K.-Y.; Kim, J.-Y.; Lee, J.-K.; Ryu, M.-S.; Lee, J.-S. An Assessment of Wind Energy Potential at the Demonstration Offshore Wind Farm in Korea. Energy 2012, 46, 555–563. [Google Scholar] [CrossRef]
  20. Belu, R. Fundamentals and Source Characteristics of Renewable Energy Systems, 1st ed.; Series: Nano and energy Series; CRC Press: Boca Raton, FL, USA, 2019; ISBN 978-0-429-29728-1.a. [Google Scholar]
  21. Shu, Z.R.; Jesson, M. Estimation of Weibull Parameters for Wind Energy Analysis across the UK. J. Renew. Sustain. Energy 2021, 13, 023303. [Google Scholar] [CrossRef]
  22. Al-Nassar, W.K.; Neelamani, S.; Al-Salem, K.A.; Al-Dashti, H.A. Feasibility of Offshore Wind Energy as an Alternative Source for the State of Kuwait. Energy 2019, 169, 783–796. [Google Scholar] [CrossRef]
  23. Joian, R.; Lung, C.; Horgos, M. The Experimental Determinations at the Wind Farm Fantanel—Cogealac in Dobrogea. In Proceedings of the 2021 IEEE 27th International Symposium for Design and Technology in Electronic Packaging (SIITME), Timisoara, Romania, 27 October 2021; pp. 369–373. [Google Scholar]
  24. Qin, C.; Loth, E.; Zalkind, D.S.; Pao, L.Y.; Yao, S.; Griffith, D.T.; Selig, M.S.; Damiani, R. Downwind Coning Concept Rotor for a 25 MW Offshore Wind Turbine. Renew. Energy 2020, 156, 314–327. [Google Scholar] [CrossRef]
  25. De Souza, C.E.S.; Bachynski-Polić, E.E. Design, Structural Modeling, Control, and Performance of 20 MW Spar Floating Wind Turbines. Mar. Struct. 2022, 84, 103182. [Google Scholar] [CrossRef]
  26. GE Energy 2.5xl-Manufacturers and Turbines-Online Access-The Wind Power. Available online: https://www.thewindpower.net/turbine_en_59_ge-energy_2.5xl.php (accessed on 10 March 2019).
  27. Ashuri, T.; Martins, J.R.R.A.; Zaaijer, M.B.; Van Kuik, G.A.M.; Van Bussel, G.J.W. Aeroservoelastic Design Definition of a 20 MW Common Research Wind Turbine Model: A 20 MW Common Research Wind Turbine Model. Wind. Energy 2016, 19, 2071–2087. [Google Scholar] [CrossRef]
  28. Rusu, E.; Onea, F. A Parallel Evaluation of the Wind and Wave Energy Resources along the Latin American and European Coastal Environments. Renew. Energy 2019, 143, 1594–1607. [Google Scholar] [CrossRef]
  29. Raileanu, A.B.; Onea, F.; Rusu, E. Implementation of Offshore Wind Turbines to Reduce Air Pollution in Coastal Areas—Case Study Constanta Harbour in the Black Sea. J. Mar. Sci. Eng. 2020, 8, 550. [Google Scholar] [CrossRef]
  30. Yildirir, V.; Rusu, E.; Onea, F. Wind Energy Assessments in the Northern Romanian Coastal Environment Based on 20 Years of Data Coming from Different Sources. Sustainability 2022, 14, 4249. [Google Scholar] [CrossRef]
  31. Fantanele-Cogealac Wind Farm-Power Technology. Available online: https://www.power-technology.com/projects/fantanele-cogealac-wind-farm/ (accessed on 22 June 2022).
  32. Pereira, F.S.; Silva, C.S. Offshore Wind Energy Resource Assessment from Satellite Data Observations and WRF in Porto Santo Island. Wind. Energy Sci. Discuss. 2020, preprint. [Google Scholar] [CrossRef] [Green Version]
  33. Archer, C.L.; Jacobson, M.Z. Evaluation of Global Wind Power. J. Geophys. Res. Atmos. 2005, 110, 1–10. [Google Scholar] [CrossRef] [Green Version]
  34. Li, D.; Geyer, B.; Bisling, P. A Model-Based Climatology Analysis of Wind Power Resources at 100-m Height over the Bohai Sea and the Yellow Sea. Appl. Energy 2016, 179, 575–589. [Google Scholar] [CrossRef]
  35. Offshore Wind in Europe-Key Trends and Statistics 2020|WindEurope. Available online: https://windeurope.org/intelligence-platform/product/offshore-wind-in-europe-key-trends-and-statistics-2020/ (accessed on 23 June 2022).
  36. Countries. Available online: https://maritime-spatial-planning.ec.europa.eu/msp-practice/countries (accessed on 23 June 2022).
  37. Top 10 Biggest Offshore Wind Farms-Power Technology. Available online: https://www.power-technology.com/analysis/feature-top-10-biggest-offshore-wind-farms-uk/ (accessed on 23 June 2022).
  38. Argin, M.; Yerci, V.; Erdogan, N.; Kucuksari, S.; Cali, U. Exploring the Offshore Wind Energy Potential of Turkey Based on Multi-Criteria Site Selection. Energy Strategy Rev. 2019, 23, 33–46. [Google Scholar] [CrossRef]
  39. Pantusa, D.; Tomasicchio, G.R. Large-Scale Offshore Wind Production in the Mediterranean Sea. Cogent Eng. 2019, 6, 1661112. [Google Scholar] [CrossRef]
  40. Wen, Y.; Kamranzad, B.; Lin, P. Assessment of Long-Term Offshore Wind Energy Potential in the South and Southeast Coasts of China Based on a 55-Year Dataset. Energy 2021, 224, 120225. [Google Scholar] [CrossRef]
  41. Sartori, L.; Bellini, F.; Croce, A.; Bottasso, C. Preliminary Design and Optimization of a 20MW Reference Wind Turbine. J. Phys. Conf. Ser. 2018, 1037, 042003. [Google Scholar] [CrossRef]
  42. Girleanu, A.; Onea, F.; Rusu, E. Assessment of the Wind Energy Potential along the Romanian Coastal Zone. Inventions 2021, 6, 41. [Google Scholar] [CrossRef]
  43. Onea, F.; Ruiz, A.; Rusu, E. An Evaluation of the Wind Energy Resources along the Spanish Continental Nearshore. Energies 2020, 13, 3986. [Google Scholar] [CrossRef]
  44. A European Green Deal|European Commission. Available online: https://ec.europa.eu/info/strategy/priorities-2019-2024/european-green-deal_en (accessed on 22 June 2022).
  45. Mobil-Grid-CoP. Available online: https://www.iwes.fraunhofer.de/en/research-projects/current-projects/mobil-grid-cop.html (accessed on 22 June 2022).
Figure 1. Black Sea target area including the reference points, where: 1—onshore; 2—alongshore; 3—offshore. Map processed from Google Earth, 2022.
Inventions 07 00057 g001
Figure 2. Profile lines represented for each coastal area taken into account. All the values are relative to the seafloor according to the information provided in Google Earth 2022.
Inventions 07 00057 g002
Figure 3. Wind turbines—power curve representation.
Inventions 07 00057 g003
Figure 4. U100 average values of the ERA5 wind data corresponding to the 20-year time interval from January 2002 to December 2021. The numbers from the square brackets indicate the minimum and maximum values related to this map.
Inventions 07 00057 g004
Figure 5. Seasonal distribution of the U100 parameter (average values) associated with the 20-year time interval January 2002–December 2021, where: (a) spring; (b) summer; (c) autumn; (d) winter. The numbers from the square brackets indicate the minimum and maximum values related to each map.
Inventions 07 00057 g005
Figure 6. Distribution of U100 parameter by wind classes processed for the entire 20-year time period (2002–2021), where: (a) class C4; (b) class C5; (c) class C6; (d) class C7. This classification was made according to the information provided in Oh et al. [19].
Inventions 07 00057 g006
Figure 7. Overview of the VmaxE indicator (in m/s) associated with each reference point. Results computed for the entire 20-year time interval (2002–2021) and related to the U100 parameter. The numbers from the square brackets indicate the minimum and maximum values related to this map.
Inventions 07 00057 g007
Figure 8. Seasonal distribution of the VmaxE indicator (in m/s) based on the U100 input, where: (a) spring; (b) summer; (c) autumn; (d) winter. The numbers from the square brackets indicate the minimum and maximum values related to each map.
Inventions 07 00057 g008
Figure 9. Wind energy classification involving eight parameters (Wann, EWSO, RLO, CV, Mv, EWS, WD, DC) corresponding to the total time distribution (2002–2021). These results consider the U100 parameter and are based on the methodology proposed in Costoya et al. [17].
Inventions 07 00057 g009
Figure 10. Seasonal values of the wind energy classification index associated with the 20-year time interval January 2002–December 2021, where: (a) spring; (b) summer; (c) autumn; (d) winter. These results are using the U100 parameter and are based on the methodology proposed in Costoya, et al. [17].
Inventions 07 00057 g010
Figure 11. Annual Electricity Production (in GWh) related to the wind turbine GE Energy 2.5 xl.
Inventions 07 00057 g011
Figure 12. Capacity factor (in %) associated with the wind turbine GE Energy 2.5 xl. The numbers from the square brackets indicate the minimum and maximum values related to this map.
Inventions 07 00057 g012
Figure 13. Performances of a theoretical wind turbine defined by a rated capacity of 20 MW, where: (a) annual electricity production; (b) capacity factor. These results are processed for a hub height of 160.2 m, according to the details mentioned in Ashuri, et al. [27]. The numbers from the square brackets indicate the minimum and maximum values related to each map.
Inventions 07 00057 g013
Table 1. Characteristics of the reference points located along the shoreline.
SiteLat
(°)
Long
(°)
Height/Depth
(m)
Constanta (RO)44.15°28.66°−9
Odessa (UA)46.47°30.76°1
Sevastopol (UA)44.60°33.55°47
Novorossiysk (RU)44.70°37.81°63
Sochi (RU)43.59°39.75°78
Batumi (GA)41.60°41.66°47
Samsun (TR)41.31°36.29°0
Cide (TR)41.87°33.04°216
Silistar (BG)42.01°28.01°17
Table 2. U100—wind classification according to Oh, et al. [19].
Wind classIndicatorWind Speed (m/s)WPD
(W/m2)
C1Poor<6.1<260
C2Marginal6.1–7.1260–420
C3Fair7.1–7.8420–560
C4Good7.8–8.3560–670
C5Excellent8.3–8.9670–820
C6Outstanding8.9–9.7820–1060
C7Superb>9.7>1060
Table 3. Classification of the wind energy resources involving multiple parameters. Results processed from (a) to (c) according to Costoya, et al. [17].
(a) Normalized Criterion
Normalized ValuesEWSO (%)RLO (%)CvMvEWS
(m/s)
WD
(m)
DC
(o)
0<20<20>1.75>1.75>28>500>4
0.2520–4020–401.25–1.751.25–1.7525–28100–5003–4
0.540–6040–600.75–1.250.75–1.2520–2550–1002–3
0.7560–8060–800.25–0.750.25–0.7515–2025–500.5–2
180–10080–100<0.25<0.25<150–25<0.5
(b) Importance of each parameter
WannEWSORLOCvMvEWSWDDC
Weight0.220.220.10.10.050.140.070.1
(c) Resources classification
Class1234567
Categoryx ≤ 0.40.4 ≤ x ≤ 0.50.5 ≤ x ≤ 0.60.6 ≤ x ≤ 0.70.7 ≤ x ≤ 0.80.8 ≤ x ≤ 0.9x > 0.9
IndicatorPoorMarginalFairGoodExcellentOutstandingSuperb
Table 4. Characteristics of the wind turbines considered in the present work.
TurbinePower
(MW)
Cut-in Speed (m/s)Rated Wind Speed
(m/s)
Cut-out Speed (m/s)Tower Range
(m)
Reference
GE Energy 2.5 xl2.53.513.52575–100[26]
20 MW model20310.725160.2[27]
Publisher’s Note: MDPI stays neutral with regard to jurisdictional claims in published maps and institutional affiliations.

