Article

Developing and Investigating the Analyzers of Kinematic Viscosity and Density of Petroleum Products on Throttle Bridge Transducers

1
Faculty for Infocommunications, Radioelectronics and Nanosystems, Vinnytsia National Technical University, Khmelnytske Shose 95, 21000 Vinnytsia, Ukraine
2
Department of Automation, Electrical Engineering and Computer-Integrated Technologies, National University of Water and Environmental Engineering, Soborna Street 11, 33000 Rivne, Ukraine
3
Department of Electronics and Information Technologies, Lublin University of Technology, 38A Nadbystrzycka Street, 20618 Lublin, Poland
*
Author to whom correspondence should be addressed.
Inventions 2022, 7(1), 6; https://doi.org/10.3390/inventions7010006
Submission received: 30 October 2021 / Revised: 16 December 2021 / Accepted: 21 December 2021 / Published: 24 December 2021
(This article belongs to the Section Inventions and Innovation in Advanced Manufacturing)

Abstract

:
Measuring the viscosity and density of petroleum products is important for their proper production, transportation and application. Viscosity and density are the main parameters determining the composition and structure of petroleum products. Therefore, in the industry, to control the quality of petroleum products during various technological processes, automatic and non-automatic devices are used for their measurement. The accuracy of measuring the viscosity and density of petroleum products is an important factor. The authors analyzed different methods of measuring the viscosity and density of petroleum products and synthesized three versions of throttle bridge transducers. These versions implement differential measurement methods and have different numbers of laminar and turbulent throttles. The authors obtained new equations of static conversion functions by channels of measuring the kinematic viscosity and density of petroleum products of the proposed throttle bridge transducers. The authors developed a block diagram and designed measuring equipment to study experimentally the static characteristics of the throttle bridge transducers. The authors determined that the maximal relative deviations of the results of experimental studies from numerical calculations of a static conversion factor by channels of kinematic viscosity and density were 5.88% and 8.76%, respectively. The authors developed two versions of automatic devices for measuring the kinematic viscosity and density of petroleum products based on the proposed throttle bridge transducers. The first version is an automatic analyzer with tracking astatic balancing. The second version is an automatic analyzer with deployment balancing. The authors developed constructions of both versions of automatic analyzers and obtained the results of experimental measuring of the kinematic viscosity and density of petroleum products in different ranges.

1. Introduction

The need for reliable information about physical and chemical parameters of fluids, fuels and lubricants is one of the conditions for improving the efficiency of industrial production [1]. Viscosity and density are the main parameters that characterize composition and structure of petroleum products, which are mostly Newtonian fluids, and determine their properties [2]. Therefore, accurate measurements of these parameters must be provided in refining industry, aviation, transport, metallurgy and heat power engineering [3].
Issues of improving the reliability and efficiency of transport are directly related to the rational selection and application of fuels, oils, lubricants and special fluids in engines and mechanisms. Low-quality petroleum products may enter the market of fuels and lubricants. After their application, friction units and machines may fail prematurely. This requires restoration of the operating condition of equipment. The solution is to create new methods and automatic devices for determining the quality of fuels and lubricants, suitable for use in refineries and in processes of transportation, storage and utilization of petroleum products [4,5,6].
Kinematic viscosity and density are important factors when standardizing fuel for jet, gas turbine and diesel engines. For all types of oils and lubricants, kinematic viscosity is a main indicator of quality, which determines their chemical properties [7].
To determine viscosity and density is a time-consuming task [8]. These parameters are difficult to establish during quality control of petroleum product production, transportation and utilization, especially in conditions of fast-moving technological processes. Known methods and devices for determining the viscosity and density of petroleum products [2,9] do not meet modern practical requirements. Therefore, there is a relevant problem of developing measuring methods and facilities for providing high sensitivity and accuracy in conditions of manufacturing and production. Therefore, the development of new sustainable methods of time-combined automatic measurement of viscosity and density of petroleum products is relevant for many industries. This improvement would increase the accuracy of quality control and determination of the composition of petroleum products and provide a high level of technological process automation.
The density of petroleum products is in a (650–1000) kg/m3 range. The range of changes in kinematic viscosity v from ether to bitumen is much larger and equals 108 [10]. For each type of petroleum product, viscosity and density are two of the main indicators of quality and composition. These parameters determine the efficiency and durability of technical means and devices used in industry and transport. The kinematic viscosity of fuel affects properties of engines, such as the wear of their components, fluidity and pumping ability, especially at low temperatures [11]. The fuel density also determines caloric content and combustion intensity [12].
Newtonian fluids (gasoline, kerosene, diesel fuel, solvents, mineral oils, synthetic base liquids, ready-made condensed lubricants) have a viscosity that remains unchanged and does not depend on impact and shear-rate. Non-Newtonian fluids (condensed lubricants, bitumens, tars and other low refining fractions) are characterized by a significant dependence of viscosity on impact and shift rate. Despite their non-Newtonian properties, kinematic viscosity and density are also measured to evaluate their quality.
For most light petroleum products, the kinematic viscosity is measured in a (1–5)·10−6 m2/s range at a temperature of 20 °C [13]. For refined intermediary products (motor oils, base oils, distillate components, extracts and deasphalzate), the viscosity changes in a (5–25)·10−6 m2/s range at a temperature of 100 °C. The kinematic viscosity varies only in lower fractions of the oil rectification process (tar, fuel oil, oil fuel), at a temperature of 100° C in a (50–300)·10−6 m2/s range.
Considering the efficiency of application of fuels and lubricants, one may claim that it is important to control kinematic viscosity, humidity [14] and density when preparing the fuel for combustion in engines of vehicles. The kinematic viscosity at constant pressure before the injector in engines on diesel fuel determines the degree of spraying and the completeness of its combustion [15,16]. Therefore, creating automatic viscosity control systems is a relevant task [17,18].
The aim of the work is experimental investigation of the developed automatic analyzers of kinematic viscosity and density of petroleum products on throttle bridge transducers with the increased accuracy of quality control and the parallel estimation of indicators of petroleum product quality.

2. Materials and Methods

The most promising devices for studying rheological structural and mechanical properties of fluids are rotary viscometers with rotating or symmetrical bodies moving in a studied medium [19].
Flow and immersion viscometers were developed for industrial measurements. They provide measurements without a manual sampling of dynamic viscosity of Newtonian fluids and rheological parameters of non-Newtonian fluids. The measurement results are fed to indicator and control devices, and this regulates technological processes by changing the viscosity.
Industrial rotary viscometers manufactured by Contraves (Zevenhuizen, The Netherlands) of DD and DC types are flow types, and those of the TO kind are used for continuous viscosity measurements in open tanks, when a measuring transducer is immersed in a test fluid [20]. A measuring part of the device is completely sealed for protection against vapors of aggressive gases and fluids. All elements touching the fluid are made of stainless steel. The measuring cylinder moves by a magnetic coupling. These viscometers transmit signals remotely to the indicator and controller simultaneously with torque readings at a measuring point. The Covimat 105 series of rotary flow viscometers was developed by Solartron Mobrey Limited (Bognor Regis, UK) for the rapid measurement of viscosity at various shift stresses [21]. The device consists of an explosion-proof measuring head connected by a magnet to a measuring cell filled with a test fluid. The measuring head can be disconnected from the measuring cell without stopping the technological process in all versions of the devices. The viscosity measurement range is (8–720,000) Pa·s, and a relative measurement error is ±1% of the viscometer scale. The Brookfield company (Terschuur, The Netherlands) produces an immersion viscometer TT-200 [22]; its readings do not depend on temperature, pressure, flow laminarity and fluid density. The device measures viscosity by the braking moment on a rotating cylinder mounted on a torsion bar. The main feature of TT 200 is a patented measuring system with a twisting tube, which is completely isolated from torsional and compressing pressures on the measuring cylinder. The measurement uncertainty does not exceed ±0.5% of a scale.
Basic information about rotary viscometers is given in Table 1.
All laboratory and industrial rotary viscometers measure only dynamic viscosity and rheological characteristics of fluids and do not measure fluid density, which does not allow for determining the kinematic viscosity of petroleum products.
The disadvantages of rotary devices are the thermoreological effect (a change in temperature of a test fluid during measurement due to viscous friction) and the influence of edge effects on measurement results, which reduces their accuracy.
In oscillating viscometers, electrical elements are utilized to generate oscillations and to measure the oscillatory characteristics of probes. In some cases, pneumatic elements are utilized for these purposes [23]. We considered industrial vibrating viscometers—devices of the “Covistat type” by Thermo Scientific (Waltham, MA, USA). They include a viscosity regulator with remote maintenance and remote recording. When the measured viscosity value deviates from a set value, a controller generates electrical pulses that directly control actuators. The viscometers are made of aluminum alloys, resistant to aggressive liquids and gases. The measuring unit is explosion-proof. Characteristics of the vibrating industrial viscometers are given in Table 2.
The output signal of oscillating viscometers is proportional to a square root of the product of dynamic viscosity by density. Therefore, automatic analyzers for continuous measurement of kinematic viscosity and fluid density with high metrological characteristics cannot be built on their basis. In addition, the accuracy of measurement is significantly affected by pressure [24] and non-Newtonian behavior of the tested fluid [25], as well as the influence of external vibrations.
Theoretical foundations of capillary viscometers were described in the works of Hagenbach [26] and Poiseuille [27]. According to Poiseuille’s law, for a fluid flow at a given flow rate in long capillaries in a laminar mode (laminar throttles), the pressure drop across them is proportional to the dynamic viscosity of the fluid. At a given flow rate of fluid flow through nozzles or diaphragms (turbulent throttles), the pressure drop across them depends on the density of the fluid [28]. Therefore, the output signal of laminar throttles depends on the dynamic viscosity, while the output signal of turbulent throttles depends on the fluid density. Therefore, we suggest that connected laminar and turbulent throttles can be utilized as primary converters of kinematic viscosity and fluid density. However, in the previously studied measuring transducers, this was not realized. Technical characteristics of industrial capillary viscometers are given in Table 3.
Capillary viscometers provide the automatic continuous measurement for the dynamic viscosity [29]. Capillary viscometers measure kinematic viscosity “only for application to liquids for which primarily the shear stress and shear rates are proportional (Newtonian flow behavior)” [29]. Kinematic viscosity is measured periodically in Ostwald or Engler glass viscometers. In automatic capillary viscometers, the substance is pumped through a capillary in a laminar mode at Re < 2000. Dynamic viscosity is determined by a pressure drop across the capillary according to Poiseuille’s law. Capillaries connecting to bridge circuits and bridge circuits with turbulent throttles expand their capabilities but do not eliminate this disadvantage. Laminar-turbulent dividers and bridge circuits as primary transducers of kinematic viscosity have potential, but this requires additional research.
After the analysis, we considered that the most promising method was the capillary method, as well as measuring transducers synthesized on its basis from throttles of different shapes.
Float, weight, vibration, radioisotope and hydrodynamic methods are most often used to measure the petroleum product density when determining their composition, quality and compliance with standards.
A common disadvantage of all types of float densitometers is low accuracy, the need for thermal compensation, and changes in readings over time when particles of the measuring medium stick to the float, which is typical for petroleum products [30]. Therefore, the investigated medium is additionally filtrated and its thermostatting is performed. When particles of the substance adhere significantly, which is typical for synthetic proteins, periodically cleaning the measuring transducer is required [31]. The interval of cleaning is determined by the degree of adhesion and is 10 min and more. Flushing liquids (water, alcohol, acids, etc., depending on the investigated medium and the degree of adhesion) are applied to clean the measuring transducer. Duration of flushing the measuring transducer is up to 1 min.
In a weighting method the readings do not depend on properties of the medium (surface tension, viscosity, presence of solid particles, etc.) and on parameters of the controlled flow (velocity through a sensing element, pressure, flow pulsation and pressure, etc.). The densitometer consists of a sensing element as horizontal loop-shaped tube fixed at one end in a support implemented on two rolling bearings. The tube has two flexible undulated pipes for the supply and discharge of fluid.
The sensitive elements of vibration density sensors are tubes, cylinders and plates. They are rigidly fixed and driven into the self-oscillating mode of motion by an excitation system. Resonators are mechanical oscillators with low scattering of a vibrational energy in fixation nodes. Such resonators can be of open or closed types. The advantage of the closed-type resonators is the absence of positional error, which depends on the resonator location in space, and the higher sensitivity of the sensor to changes in the controlled fluid density [32].
To measure the density of liquid media, the attenuation of penetrating radiation (γ-rays) when passing through the test medium is used. Radioisotope densitometers are not applied for quality control of petroleum products during their manufacture and usage.
Hydrodynamic measuring transducers of fluid density operate on a basis of measuring the pressure drop ΔP on a throttle element at a constant flow rate. Throttle elements are a diaphragm or a nozzle. An output signal of the hydrodynamic transducers is affected by pressure pulsations, changes in viscosity and temperature of fluid [33]. Hydrodynamic densitometers do not measure density in a wide range of its change with sufficient accuracy. Therefore, development of the hydrodynamic method and improvement of a design of petroleum products densitometers are relevant scientific and technical problems.
The paper considers the possibility of constructing measuring transducers on balanced throttle pressure dividers—a laminar one, which consists of two series-connected laminar throttle in form of capillary tubes with different sizes, and a combined one, consisting of a laminar throttle and turbulent in form of a diaphragm.
Fluid can move in a laminar or in a turbulent mode. In the laminar mode, fluid jets move parallel to each other, and the layers do not mix. When the Reynolds number Re < 2000, the mode of fluid motion is considered to be laminar [34]. In the turbulent mode, there is a disordered motion of the fluid, particles mixing with each other and moving chaotically along variable trajectories. It is considered that for the turbulent flow Re > 2000.
A hydrodynamic throttle (Figure 1a) consists of an interconnected chamber 1 and a capillary tube 2 of cylindrical shape (D and L are the diameter and length of the throttle chamber; d and l are the diameter and length of the throttle tube).
A system of hydrodynamic equations [35] can be applied as a theoretical basis for the processes in hydrodynamic throttles in case the flow is laminar and Re < 2000. This system of hydrodynamic equations consists of the Navier-Stokes Equation (1) and the equation of flow continuity (2) for stationary fluid motion without compression
V t = ν 2 V ( V ) V 1 ρ P ,
V = 0 ,
where ν is the kinematic viscosity of fluid; Ρ is the pressure at each point of the throttle; t is the time; V is the velocity vector; = x , y , z is Hamilton’s differential operator.
Since the hydrodynamic throttle is of axial symmetry, let us consider the area Ω of half of the longitudinal section (Figure 1b).
In the laminar mode of fluid flowing through the hydrodynamic throttle with axial symmetry, the radial and longitudinal flow velocities do not change, while the density and viscosity of the fluid at each point of its volume are constant [36]. The boundary conditions Ω at the boundary of the considered area are as follows:
  • the radial component of velocity on the axis of symmetry is zero
    n V = 0   for   Ω s y m m e t r y ;
  • at the inlet to the throttle, the fluid moves along its axis at the velocity υ 0
    V = 0 ,   υ 0   for   Ω i n ;
  • at the outlet of the throttle there is no radial component of the velocity, and the zero pressure is maintained
    t V = 0 ,   p = 0   for   Ω o u t ;
  • the fluid near the walls of the throttle is at the resting state
    V = 0 ,   0   for   Ω b o u n d a r y .
To illustrate the processes in the laminar throttle, some simulations were performed for a fluid with a kinematic viscosity of 10−5 m2/s and a density of 850 kg/m3, which flows in a cylindrical tube with a diameter of 1.5 mm and a length of 150 mm. For the laminar mode conditions, Re = 1000 was selected. The average fluid flow velocity is determined by the formula
V c = Re ν d D 2 ,
where d is the diameter of the tube; D is the diameter of the chamber.
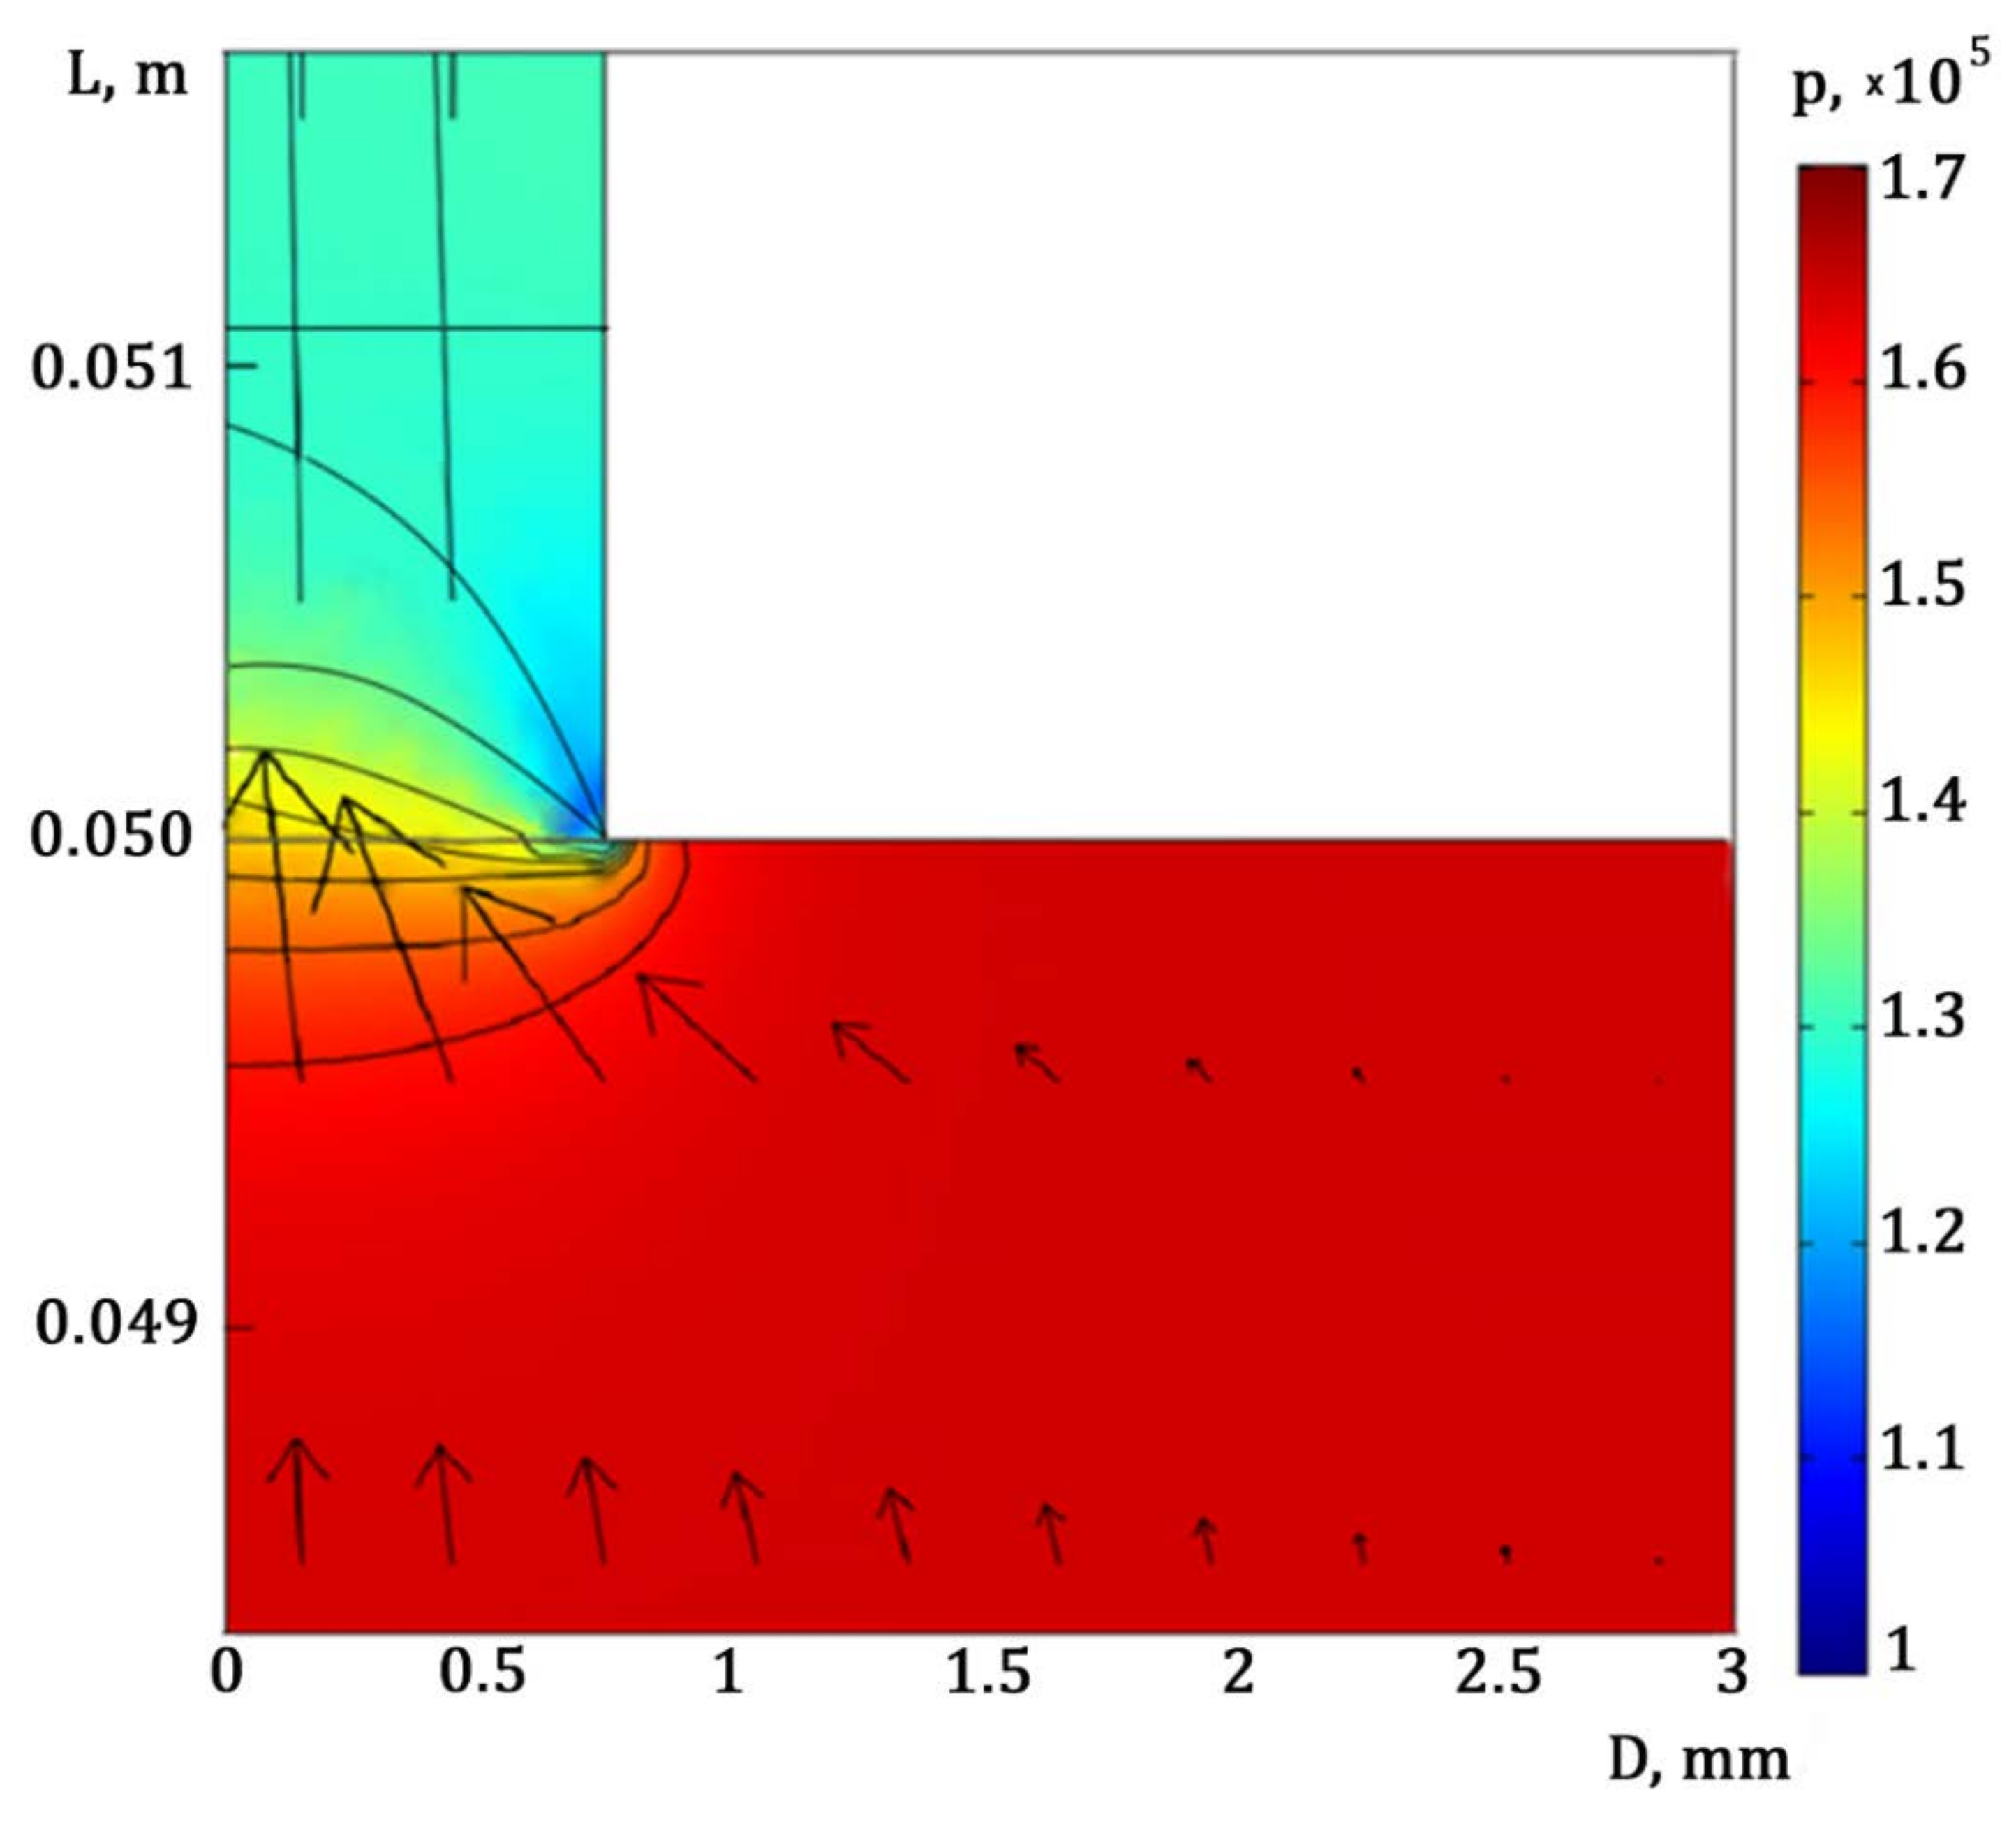
Figure 2 shows the pressure distribution in the chamber-tube transition region of the hydrodynamic throttle with laminar flow mode, where the arrows show the scale of the fluid velocity and solid lines show isolines of the pressure. The pressure distribution in the chamber-tube transition region shows that in the chamber at the 5 mm distance from the boundary of the chamber-tube, the pressure is redistributed in the radial direction. When the fluid enters the tube, it is inhibited near its walls and the pressure is distributed irregularly in the radial direction. At a distance of approximately 10 mm from this boundary, inside the tube the pressure is equalized at the cross section, which indicates forming the laminar flow mode.
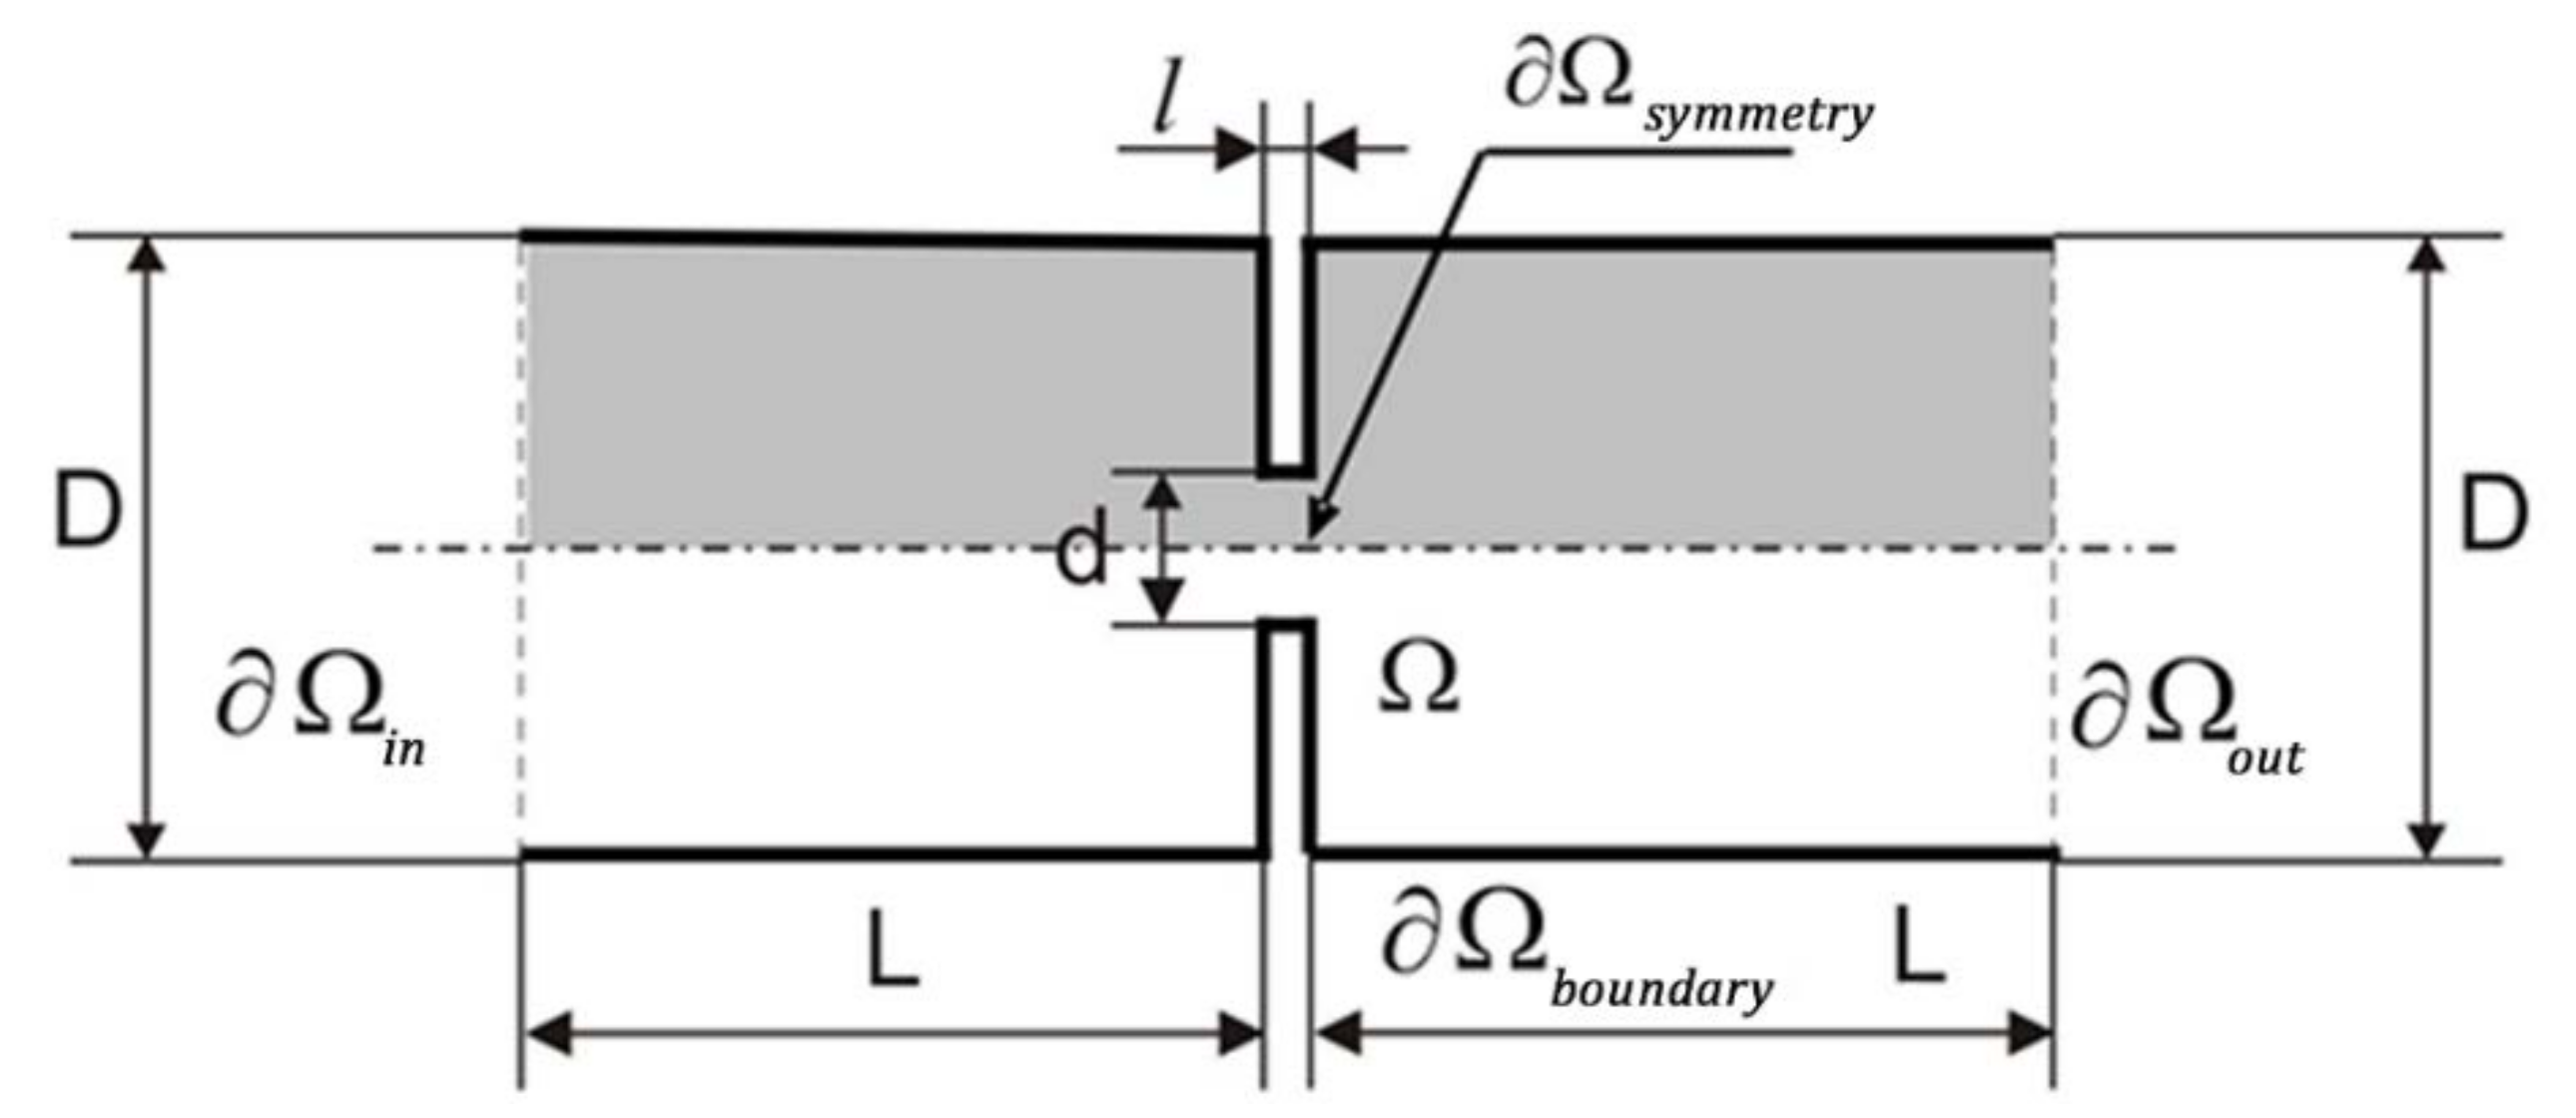
Figure 3 shows an axisymmetric model of the turbulent throttle. It consists of inlet and outlet chambers of a diameter D and a length L with aligned axes connected by a short tube (diaphragm) of a diameter d and a thickness l .
Considering the axial symmetry of the hydrodynamic throttle, we set the following boundary conditions [37].
  • The radial component of velocity on the axis of symmetry is zero (3);
  • At the inlet of the throttle, the fluid moves along its axis with velocity υ 0 , the energy value is maintained constant, and the energy dissipation along this axis is
    V = 0 , υ 0 , n k = 0 , n ε = 0 ,       for   Ω i n ; .
  • At the outlet of the throttle there is no radial component of velocity, a zero value of the pressure is maintained, the energy value is maintained constant, and the energy dissipation along this axis is
    t V = 0 , P = 0 , n k = 0 , n ε = 0 ,       for   Ω o u t ;
  • The distribution of fluid velocity near the inner surface of the throttle is described by a logarithmic function. Kinetic energy and energy dissipation are functions of the velocity component tangential to the surface
    V = v τ 1 K ln δ w v τ ν + C , k = v τ 2 C μ , ε = v τ C μ δ w ,       for   Ω b o u n d a r y ,
    where v τ is the velocity component tangential to the surface of the throttle; K = 0.42 is the von Kármán constant; δ w is the distance from the point where the velocity is determined to the wall; C = 5.5 is the constant of the model [4].
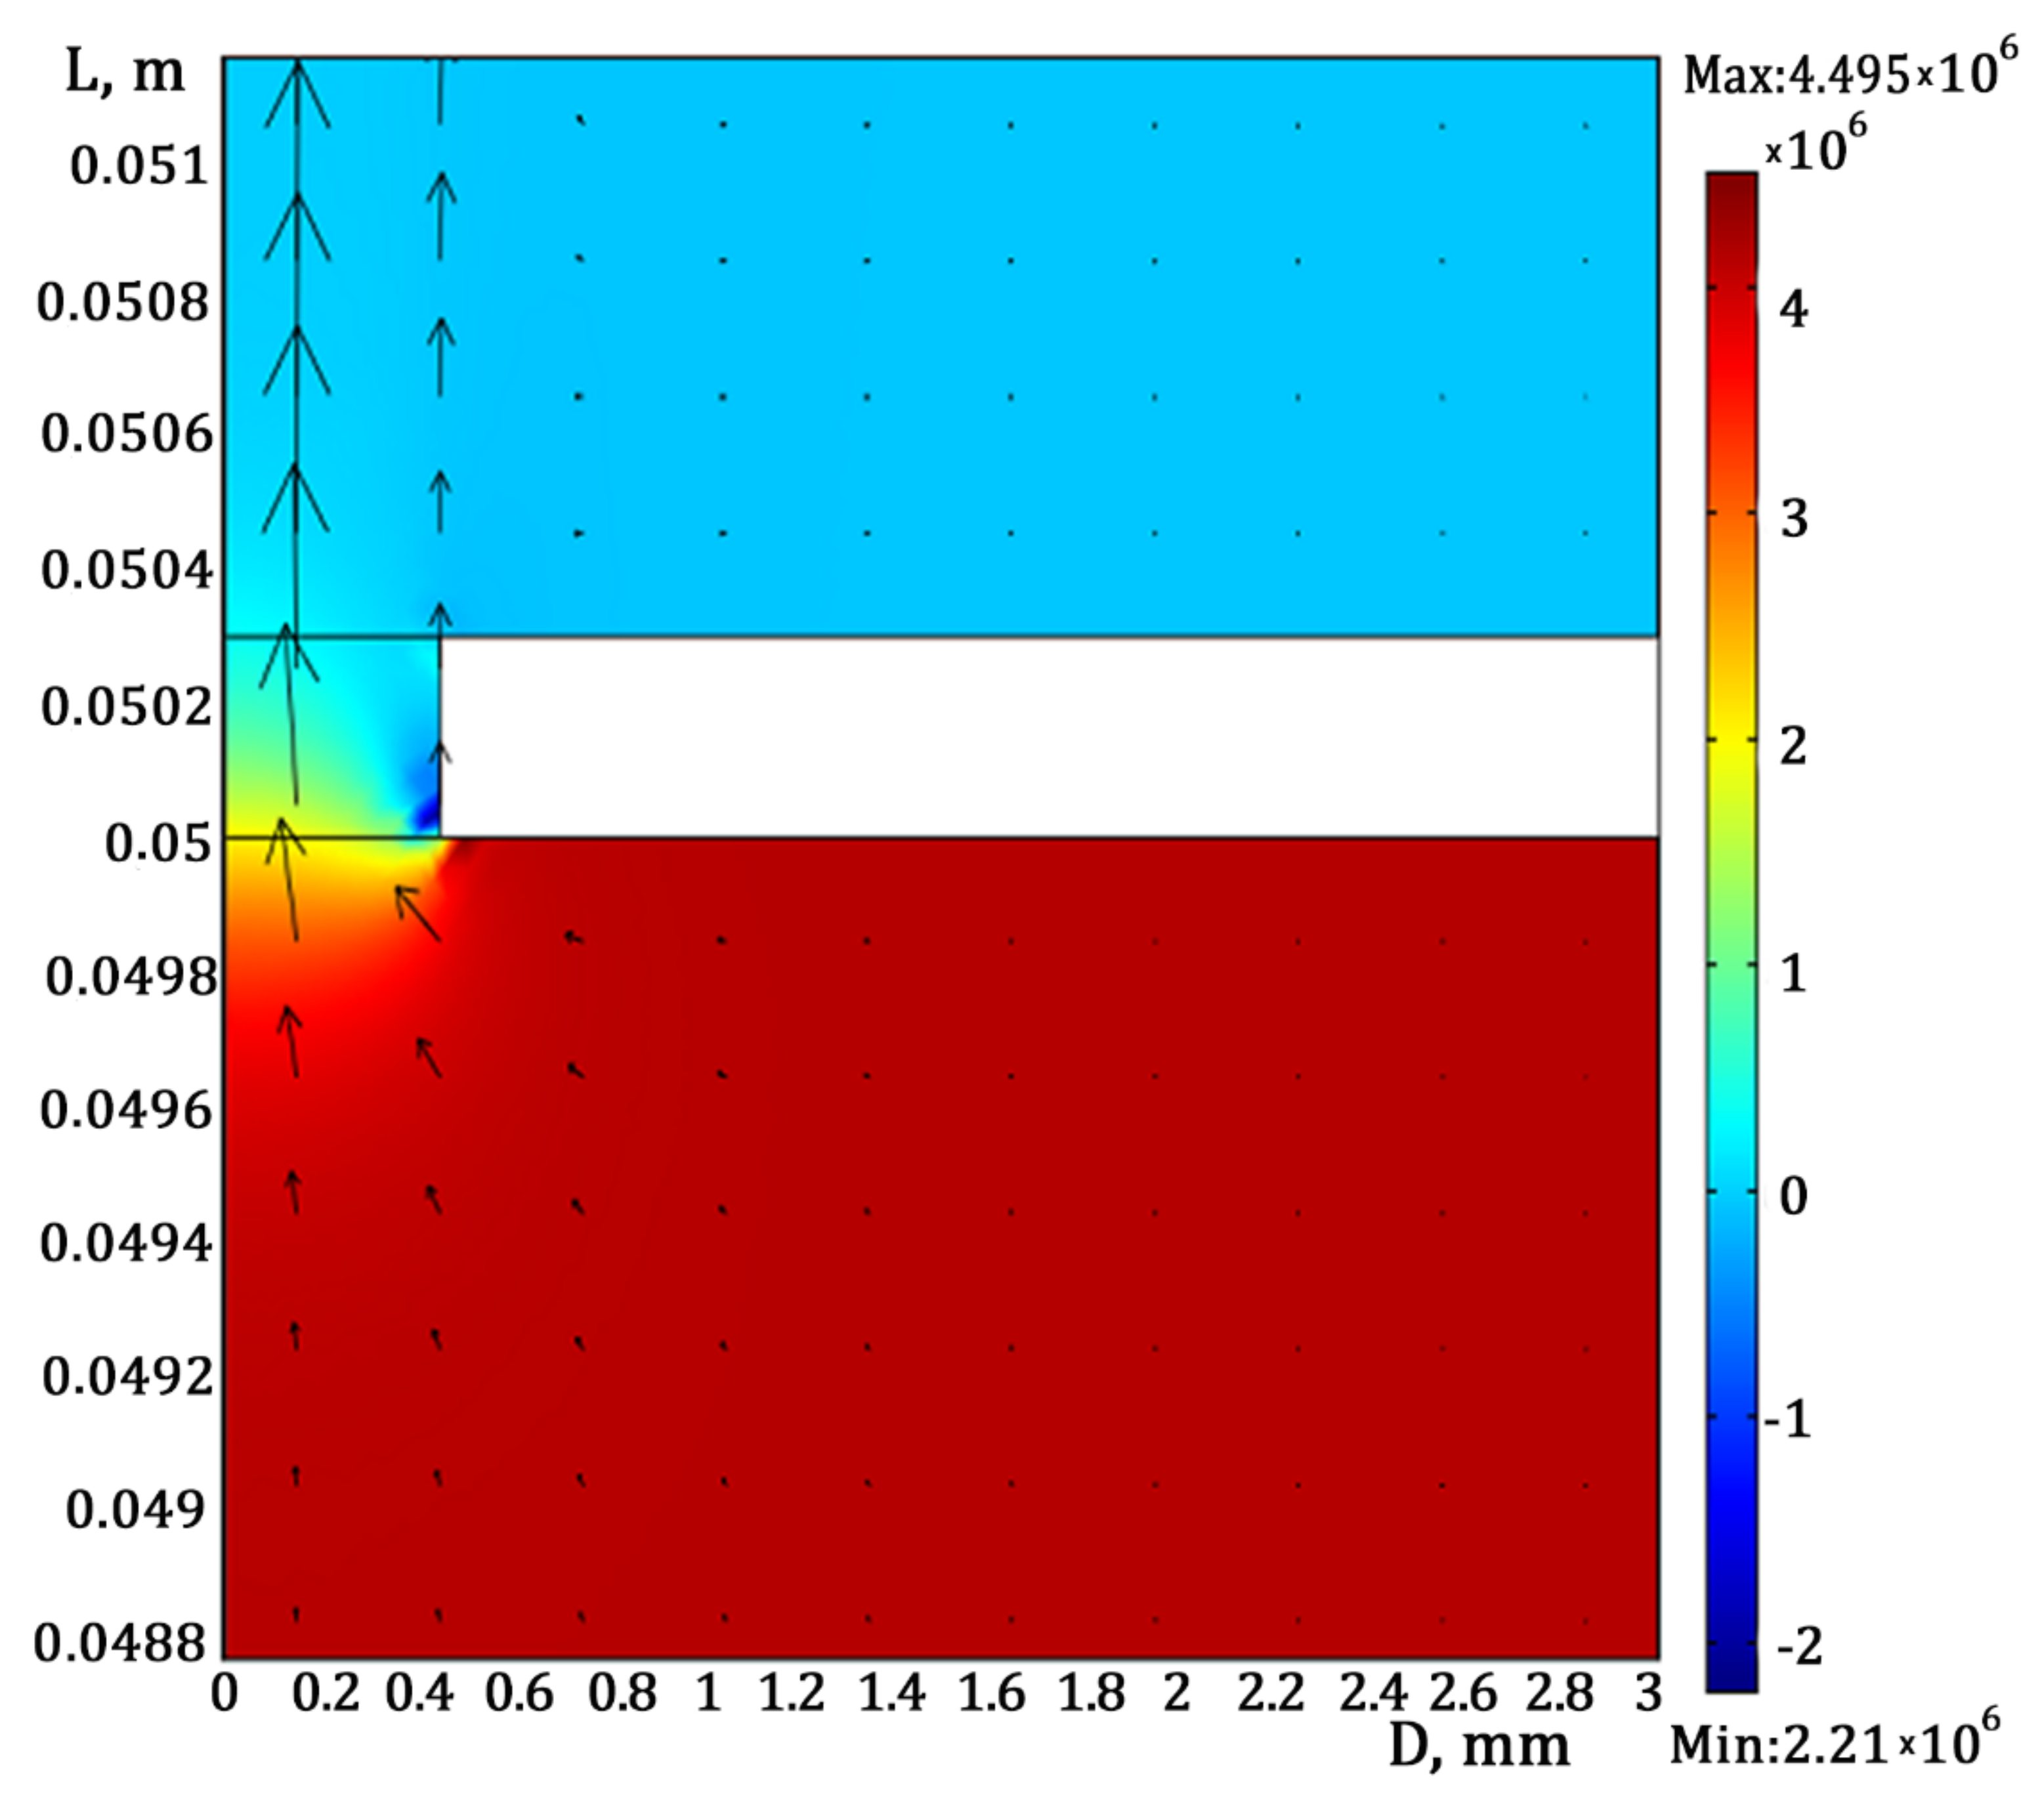
To illustrate the processes in a turbulent choke with a 0.9 mm diameter and a 0.3 mm length, the fluid flow was simulated; it had an 850 kg/m3 density, a 10 5 m2/s kinematic viscosity, and Reynolds numbers in the tube equaled 4000 and in the chamber they equaled 1330. By the simulation results (Figure 4), the authors established that in the chamber-tube transition region of the hydrodynamic throttle the pressure was redistributed in radial direction and declined along the axis of the throttle. The main pressure drop occurred at the boundary of the inlet chamber and in the area of the tube. When the fluid flowed in the outlet chamber, the pressure became negative due to depression of the fluid during its flowing from the tube to the outlet chamber.
After testing we can consider that when the pressure drop on the laminar divider throttles is balanced by a change in the volume flow rate, the kinematic viscosity ν of fluid is defined as
ν = k Q 0 ,
where k is the constructive factor of the divisor; Q 0 is the flow rate at which the pressure drop on the divider throttles is balanced.
The sensitivity of the laminar divider to changes in kinematic viscosity is maximal when the ratio of diameters of the laminar throttles equals 0.5 and the length is minimal. It was established that one of the laminar throttles should have a minimum length and be transformed into a diaphragm, and the laminar divider should be transformed into a laminar-turbulent divider.
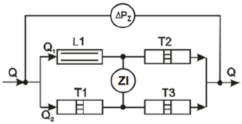
The differential measurement method having a number of advantages, three types of throttle bridge transducers (TBTs) with different numbers of laminar and turbulent throttles were synthesized. For the first time, their static conversion functions were described analytically by measuring the kinematic viscosity and density of petroleum products (Table 4). They were obtained under the condition of balancing a hydrodynamic bridge measuring circuit (in the absence of pressure drop in a measuring diagonal) by the system of equations of fluid flow continuity and pressure change equality on throttles located in parallel branches of the bridge.
The Reynolds number of the flux over the entire measurement range was experimentally established to be constant, because when the kinematic viscosity changed in proportion to it the fluid flow rate changed. This determines the stability of conversion factors of laminar and turbulent inductors and the overall conversion factor of the TBT.
Table 4 shows schematics and static conversion functions of throttle bridge transducers of kinematic viscosity and density of fluids. Three TBT schemes with various combinations of laminar and turbulent throttles were considered. The choice of the sustainable ratio of structural dimensions of laminar and turbulent throttles in the synthesized TBT circuits has some restrictions. These constraints (parameters A, B and C) must be taken into account when designing throttle bridge converters. According to the results of the performed analysis, the TBT of 2L-2T type in comparison with other schemes is characterized by a maximal sensitivity, so it is eligible for application when creating industrial analyzers.

3. Results

An installation was developed to investigate experimentally the TBTs with different numbers of laminar and turbulent throttles, the block diagram of which is shown in Figure 5.
The installation included a thermostat 5 with the tested TBT 9 inside it and a vessel 6 with a calibrated liquid. Distilled water was used as thermostatic liquid at a temperature of +(10–60) °C, while medical Vaseline oil was used at a temperature of +(50–110) °C. Two heaters 7 and a stirrer 8 driven by an engine were installed to maintain the set temperature in the thermostat. The temperature inside the thermostat was measured by a mercury glass laboratory thermometer 13. A similar thermometer was installed in a vessel 6 for measuring the temperature of the calibrated liquid from the TBT.
In order to eliminate a systematic error, both thermometers were installed in the thermostat and the difference between their readings was determined. The power of the heater maintaining the set temperature was set automatically by a temperature controller 14 according to readings of the contact thermometer.
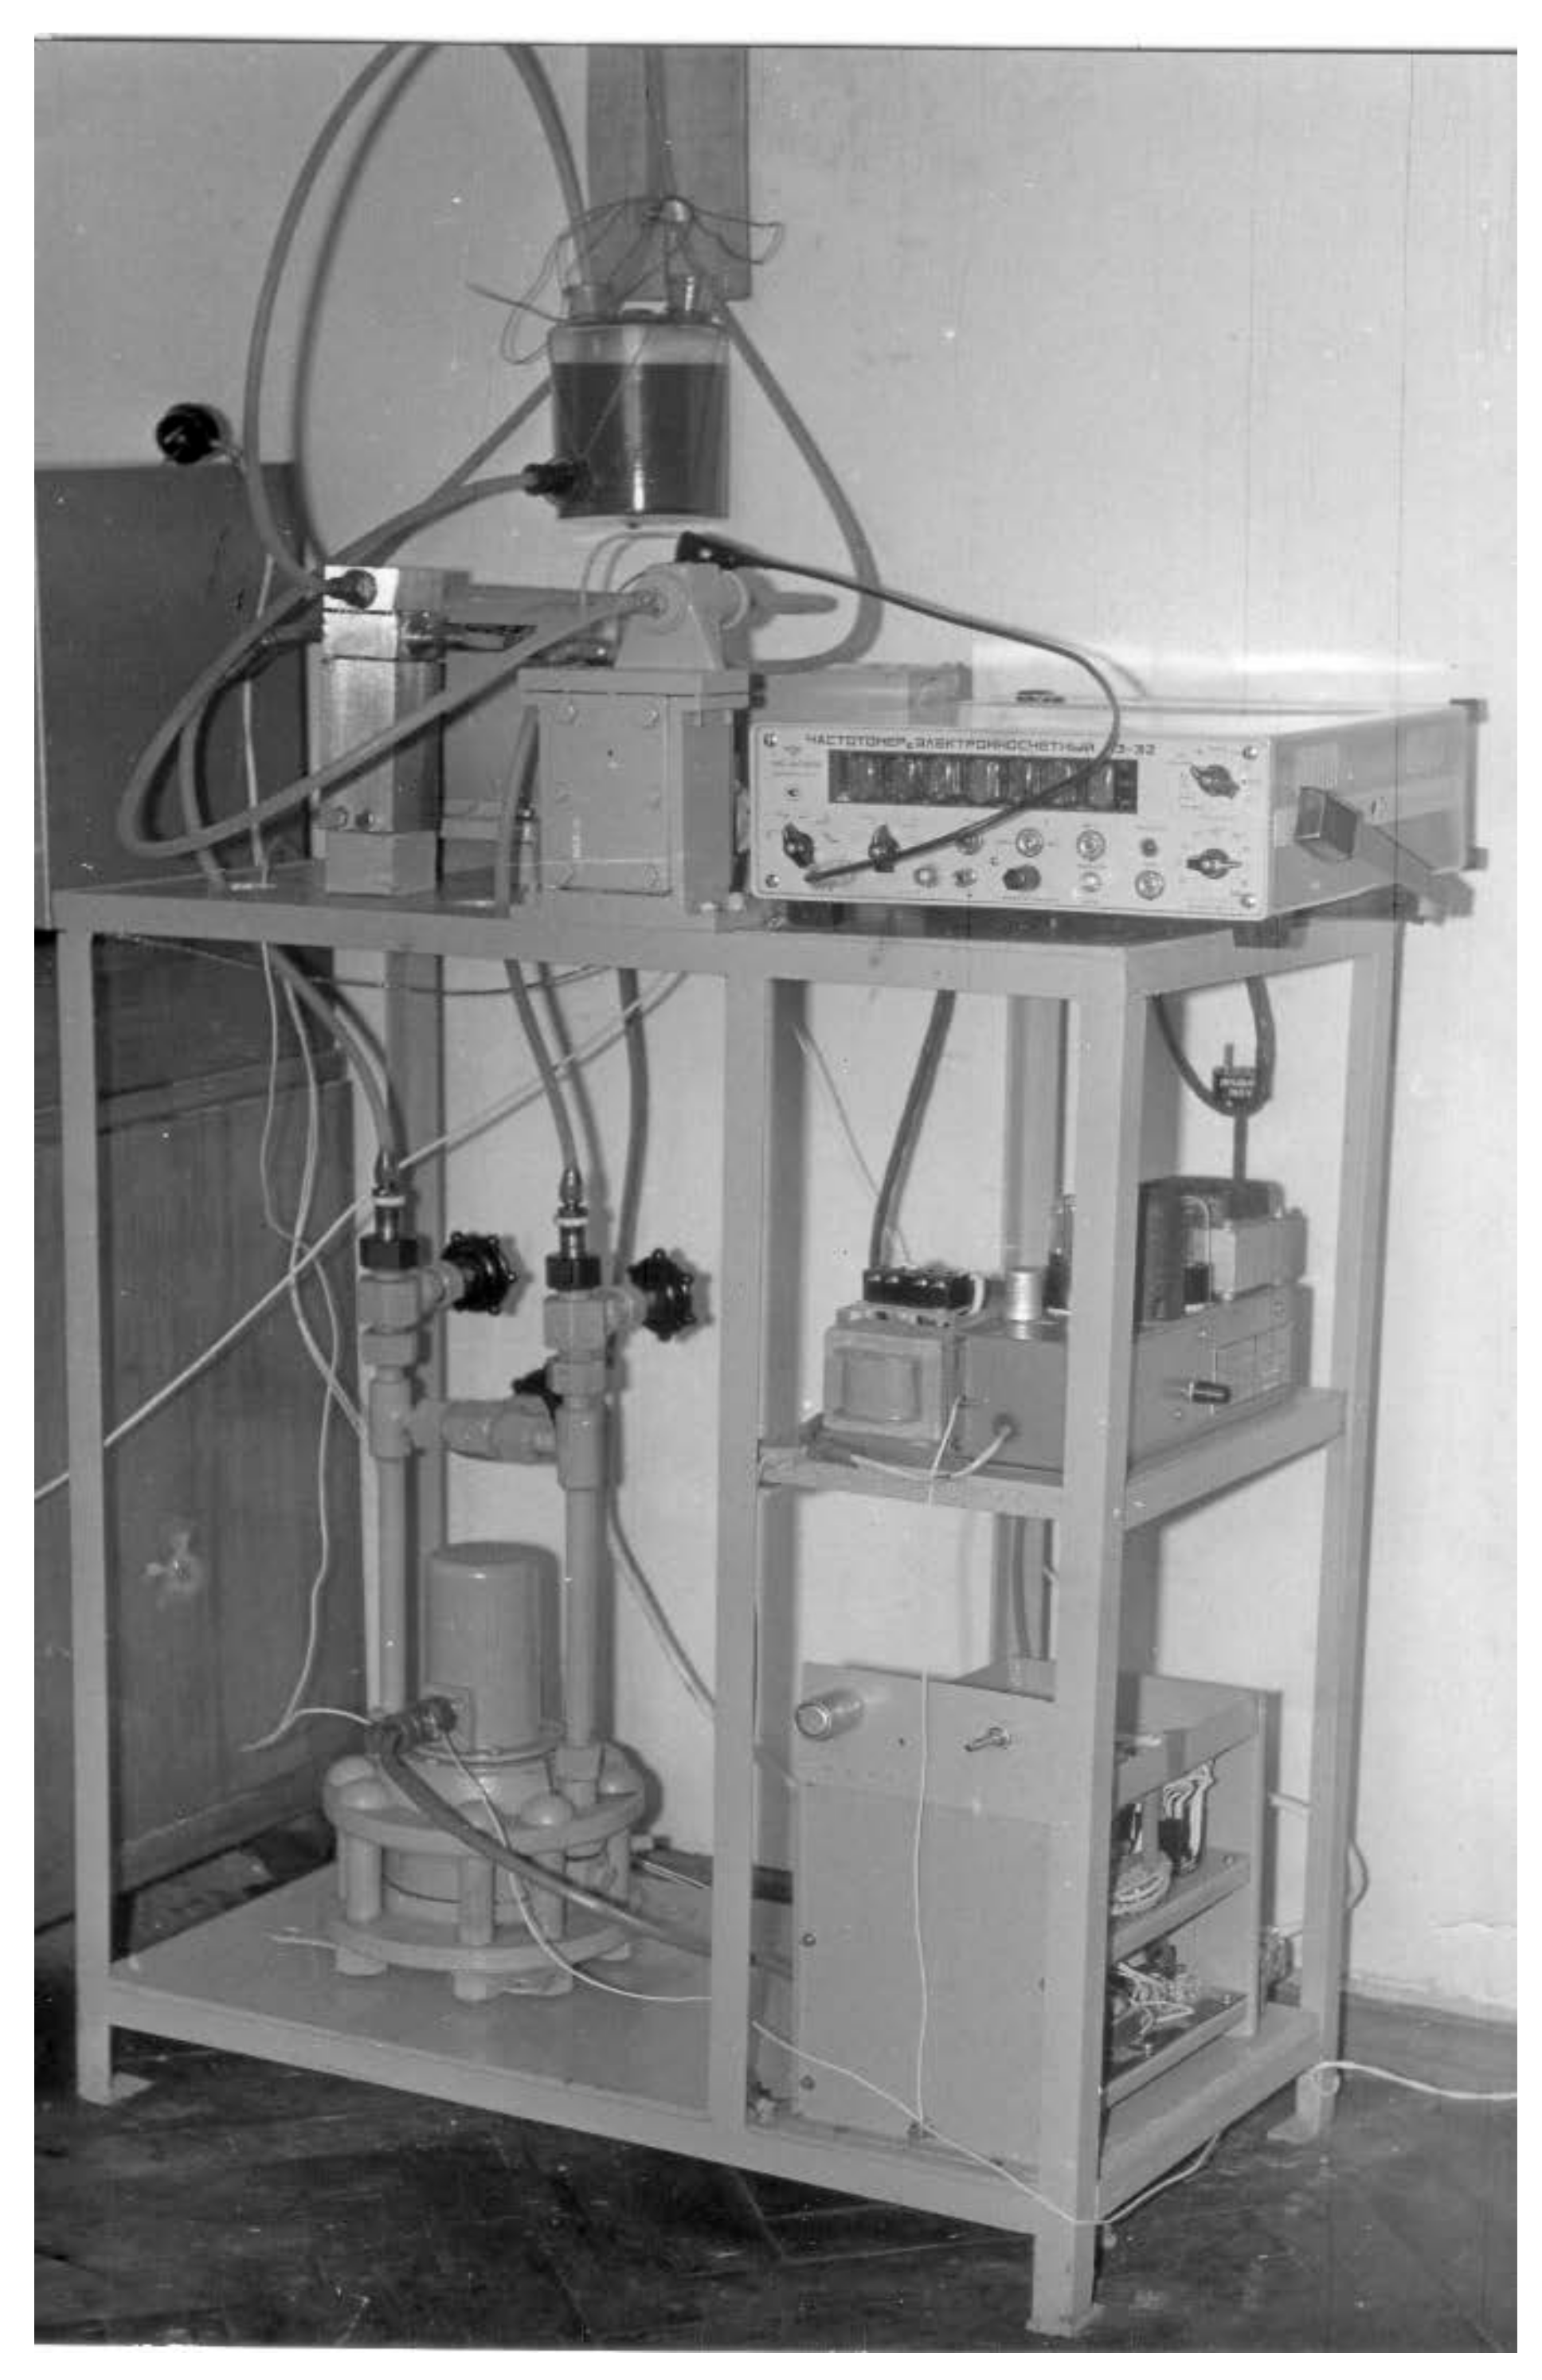
The calibrating liquid was pumped through the TBT with a pump 1. A change and maintenance of rotation speed of the pump engine was performed with a regulator 4 change and maintained a fluid flow rate through the TBT. A change of the flow rate was set by special dosing pumps of various productivity (NS-3, NS-6, NS-12), powered by the electric engine of ETO-1 type (Figure 6).
The flow rate was measured by averaging 5 fillings from a measuring flask 15 with capacity of 250 or 500 cm3. The fluid came in the measuring flask from the TBT through a 3-way tap 12. In the first position of the tap, the calibrated fluid through the TBT came back to a vessel 6. When measuring the flow rate, the tap 12 was turned to the second position and the fluid flowed into the measuring flask 15.
The pressure drop in an indicator diagonal of the TBT was measured with a U-shaped water differential pressure gauge 11 having a measuring range of (0–630) kPa. The total pressure drop on the transducer is measured by a differential pressure gauge 10 of DM 3583 type having a measuring range of (0–1.6) MPa. The uncertainty of the pressure drop measurement was 9.8 Pa.
According to recommendations [29], calibrating substances are the mixtures of refined petroleum products in different proportions:
  • Turbine oil TP-22 with the density ρ 20 = 880   kg / m 3 at the temperature 20 °C and the kinematic viscosity ν 50 = 18.312   mm 2 / s at the temperature 50 °C;
  • Airplane oil M-20A with ρ 20 = 895   kg / m 3 and ν 50 = 195.43   mm 2 / s ;
  • Kerosene ρ 20 = 882   kg / m 3 and ν 20 = 1.453   mm 2 / s ;
  • Petrol A-95 with ρ 20 = 732   kg / m 3 and ν 20 = 0.924   mm 2 / s .
The kinematic viscosity was measured with a glass capillary viscometer of VPZh-1 type according to [29]. The density of calibration fluids was measured with an oil densimeter of ASTM D5002 type according to [38].
When the static conversion factor of TBT was determined experimentally, the calibrated mixture of petroleum products was poured into the vessel 6. Changing the speed of the pump 1 set the flow rate at which the balancing state controlled by the differential pressure gauge 11 could be achieved. At this value of the flow rate, the mixture was pumped through the TBT for 30–40 min until complete mixing to exclude the influence of residues of a previous sample, which could remain in throttles of the TBT. Next, the TBT was accurately balanced one more time, the flow rate value was measured and a sample for measuring the kinematic viscosity was chosen. To exclude a temperature error, the TBT and the volumetric flask were installed directly in the vessel 6. The total pressure drop in the TBT was measured with a differential pressure gauge of DM 3583 type.
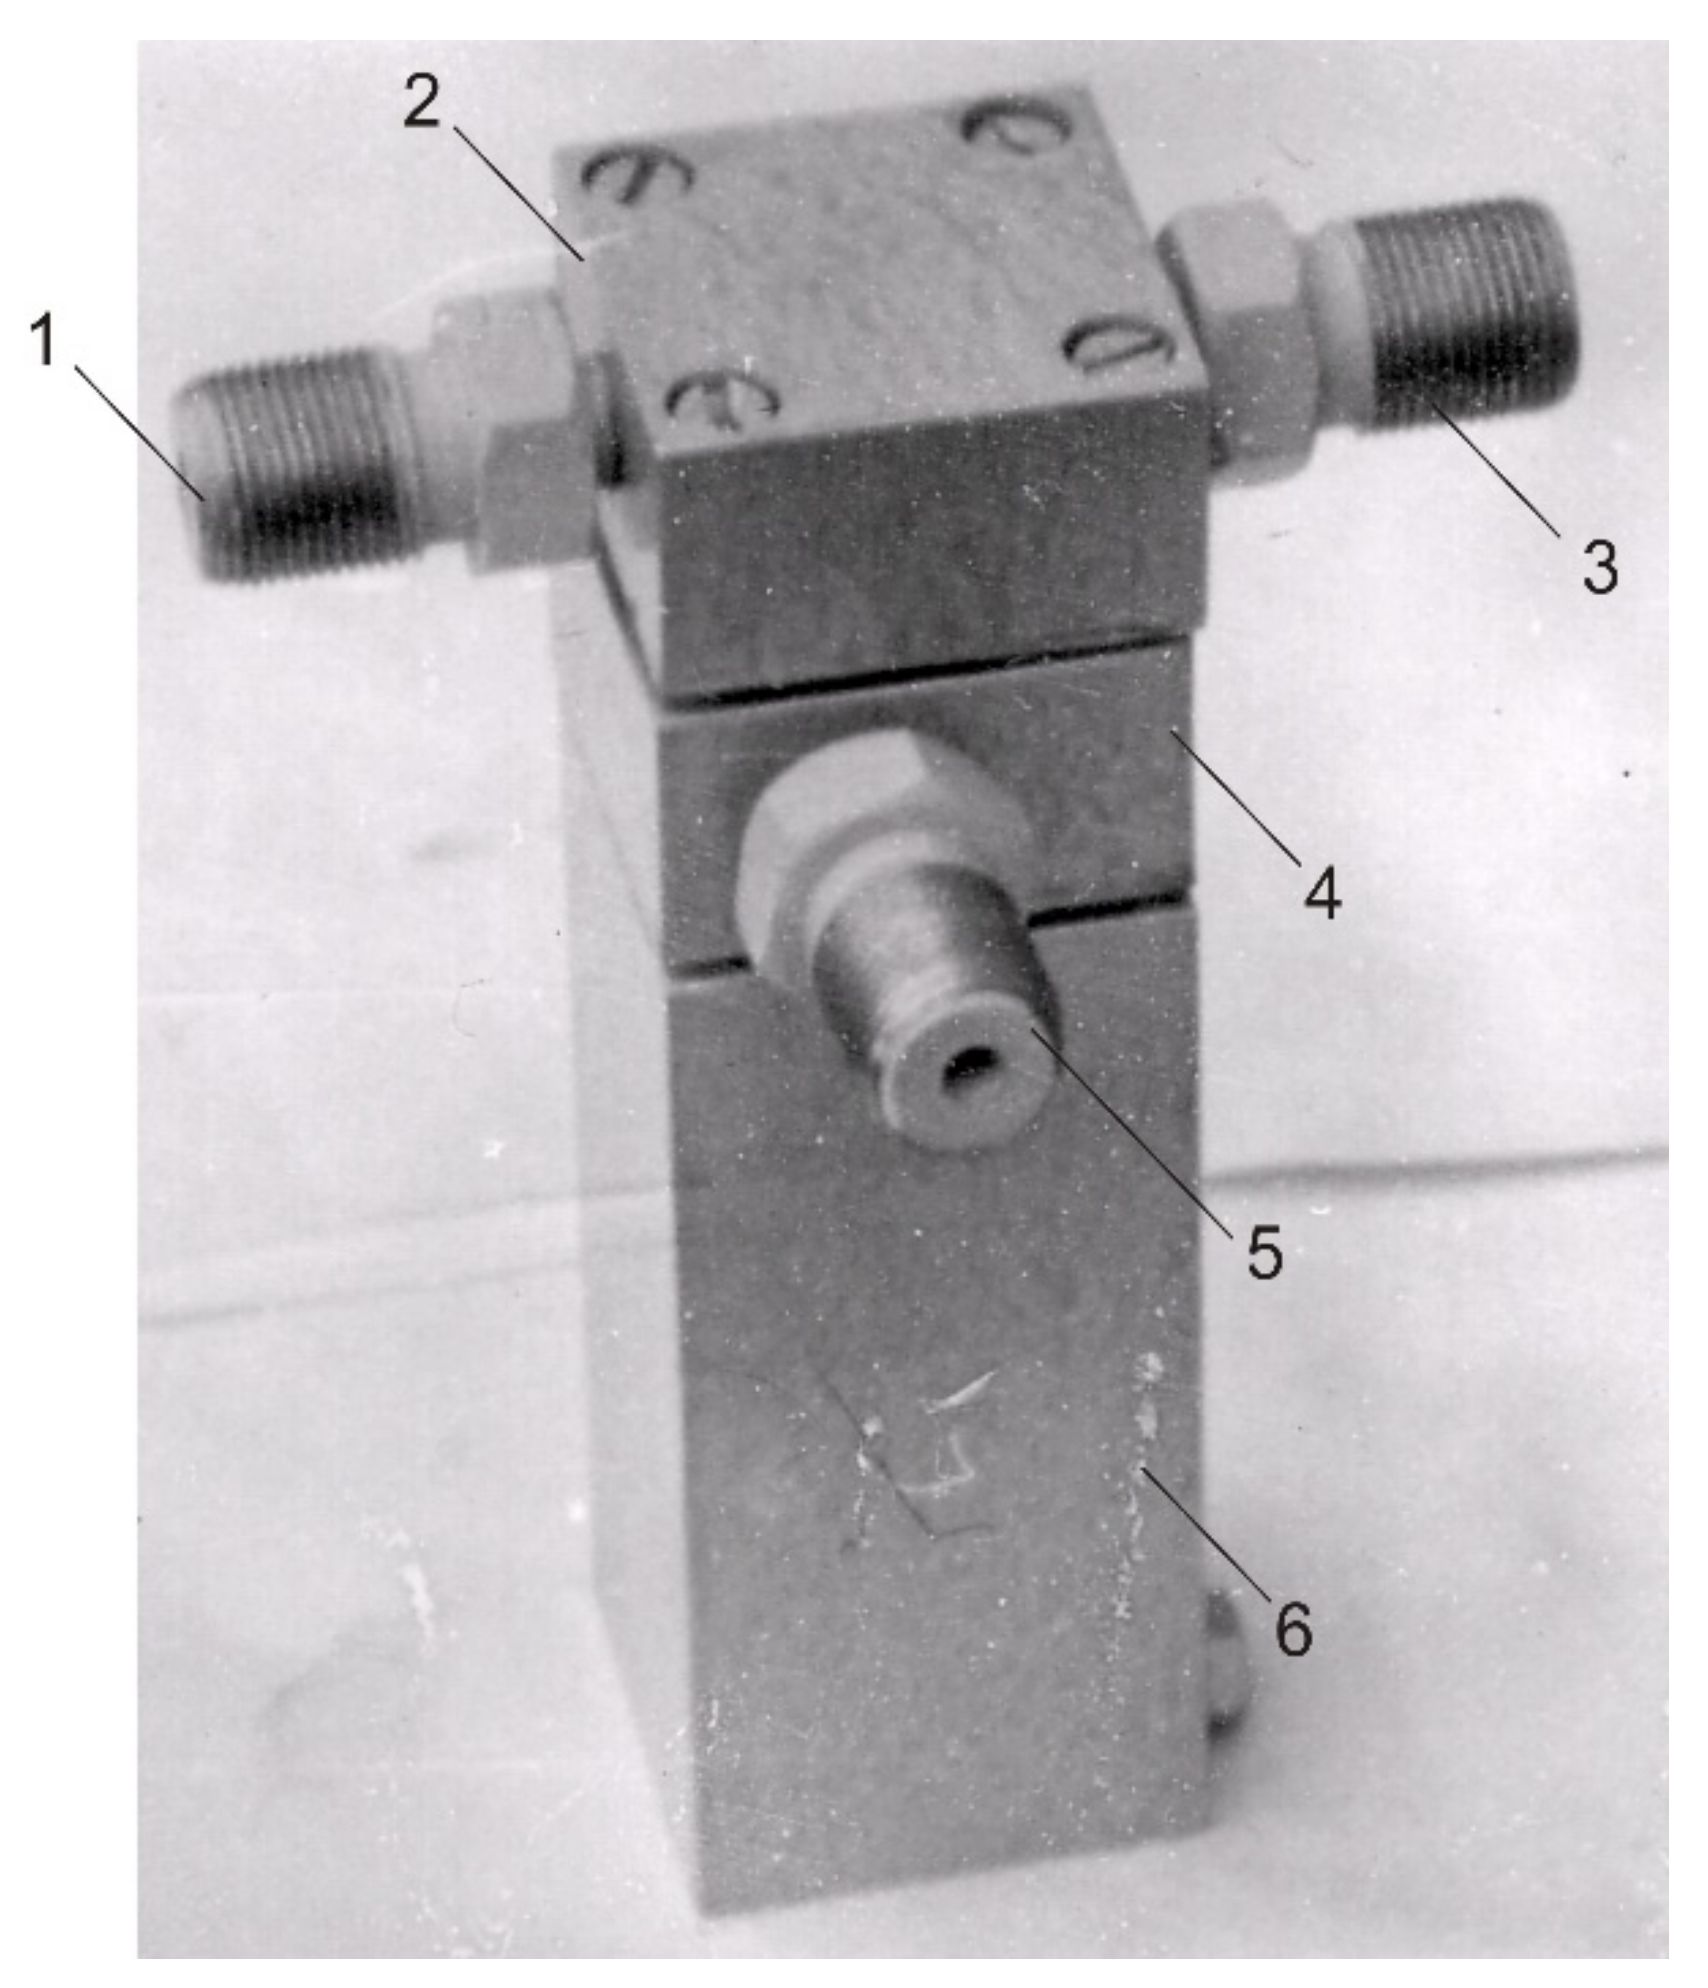
Six TBT samples were investigated (Figure 7), two for each of three schematics (Table 4) with a range of kinematic viscosity measurements of (5–25)·10−6 m2/s. The samples were designed with symmetrical and asymmetrical bridge circuits. For each TBT, the static conversion factor and the pressure drop at imbalance were determined at 10–12 different points of the kinematic viscosity range at constant density of the petroleum product mixture, and then the experimental results were averaged (Table 5).
When the asymmetry factor n = 1 (Table 4), the uncertainty of the analytical estimation of the static conversion factor of the TBT test samples by kinematic viscosity is in a (3.76–7.53)% range, and by density is in (4.32–12.18)% range. This uncertainty is due to the insufficient accuracy of measuring geometric dimensions of the laminar and turbulent throttles, and to the uncertainty of the fluid flow rate estimate at the time of TBT equilibrium. To increase the accuracy of automatic analyzers [39] with TBT, their nominal conversion characteristics must be calibrated using sample fluids with known values of kinematic viscosity and density [40,41].
Three prototypes of automatic analyzers with different balancing methods were experimentally investigated. Each sample was tested in two different ranges of kinematic viscosity and at a different density of petroleum products. The range was changed by replacing the TBT throttles with appropriate geometric sizes, while other elements of the analyzer were not replaced. Metrological characteristics were estimated by verifying the measurement results of the automatic analyzer of kinematic viscosity and density with calibration mixtures of petroleum products at five points for each measurement range [42]. The density of the petroleum product mixture was measured with a naphtodensimeter of 0.2 accuracy class [38]. The actual value of kinematic viscosity was determined by a glass VPZh-1 type viscometer by conventional methods [33]. The installation was calibrated (Figure 6). The thermostat of the installation contains the TBT, a vessel with a calibration fluid and a glass viscometer. The zero indicator and the flow rate meter were removed from the thermostat. All hydraulic connections were carefully thermally insulated. The calibration mixture was poured into the vessel 6 (Figure 5), and the automatic analyzer was turned on, and after setting its readings, the measured value of kinematic viscosity was recorded. Following values of the automatic analyzer readings were determined after reconnection. Thus, 10 measurements of the kinematic viscosity of one sample under the same conditions were performed. To eliminate the effect of temperature error, the glass viscometer was placed in the vessel 6 and constantly washed with the calibration fluid from the TBT output of the automatic analyzer. Simultaneously with the measurements of the kinematic viscosity by the differential pressure gauge, the total pressure drop on the TBT was determined, which was used to determine the density of the calibration mixture.
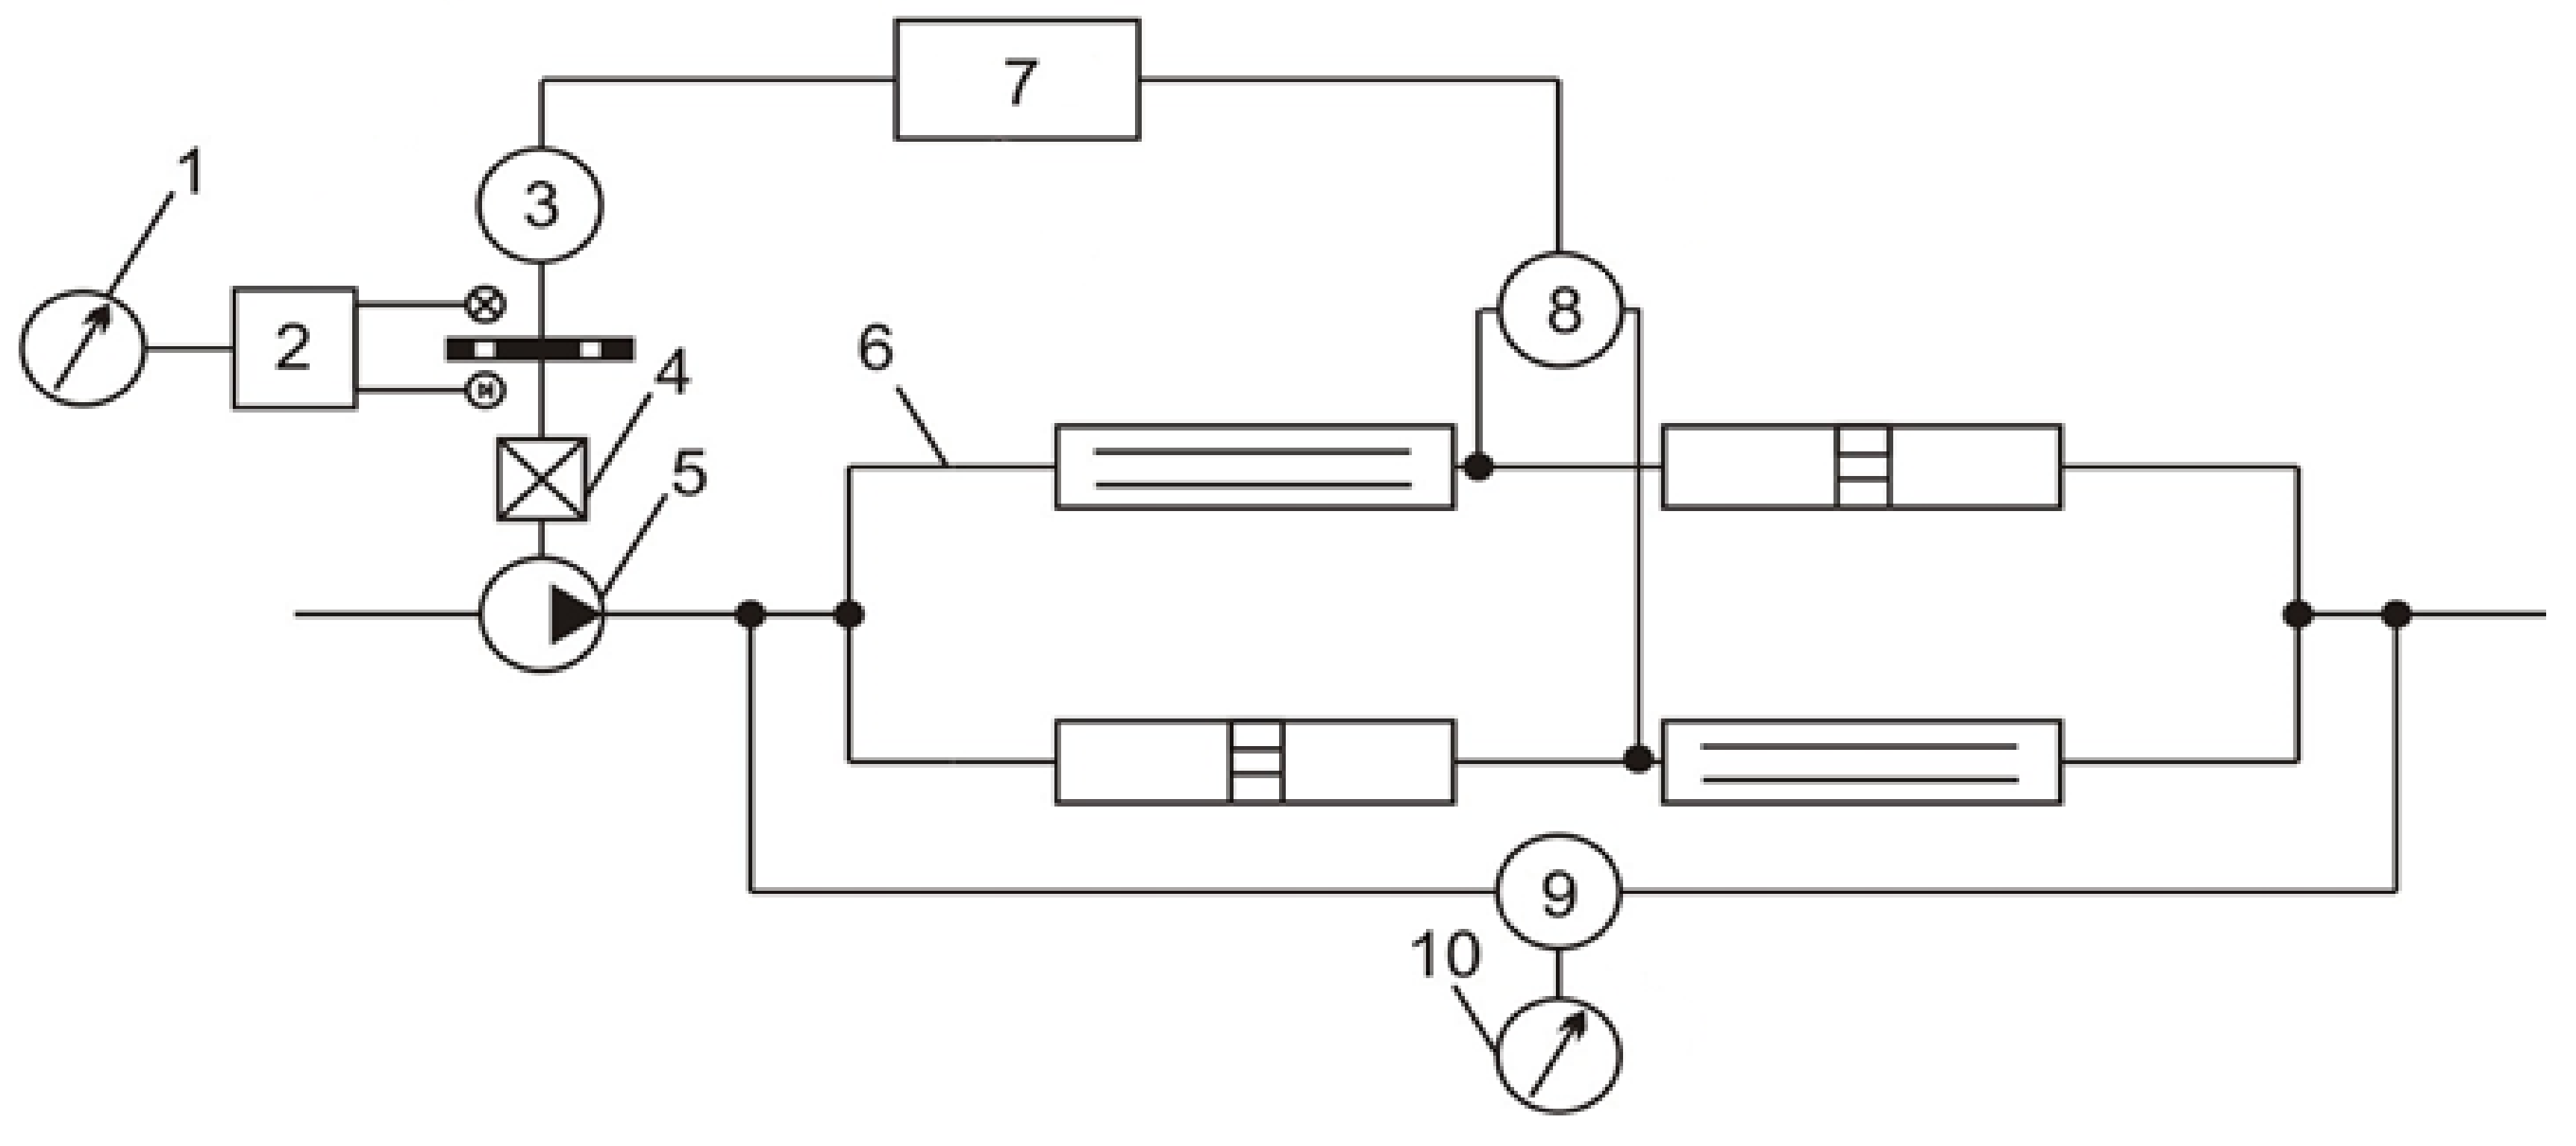
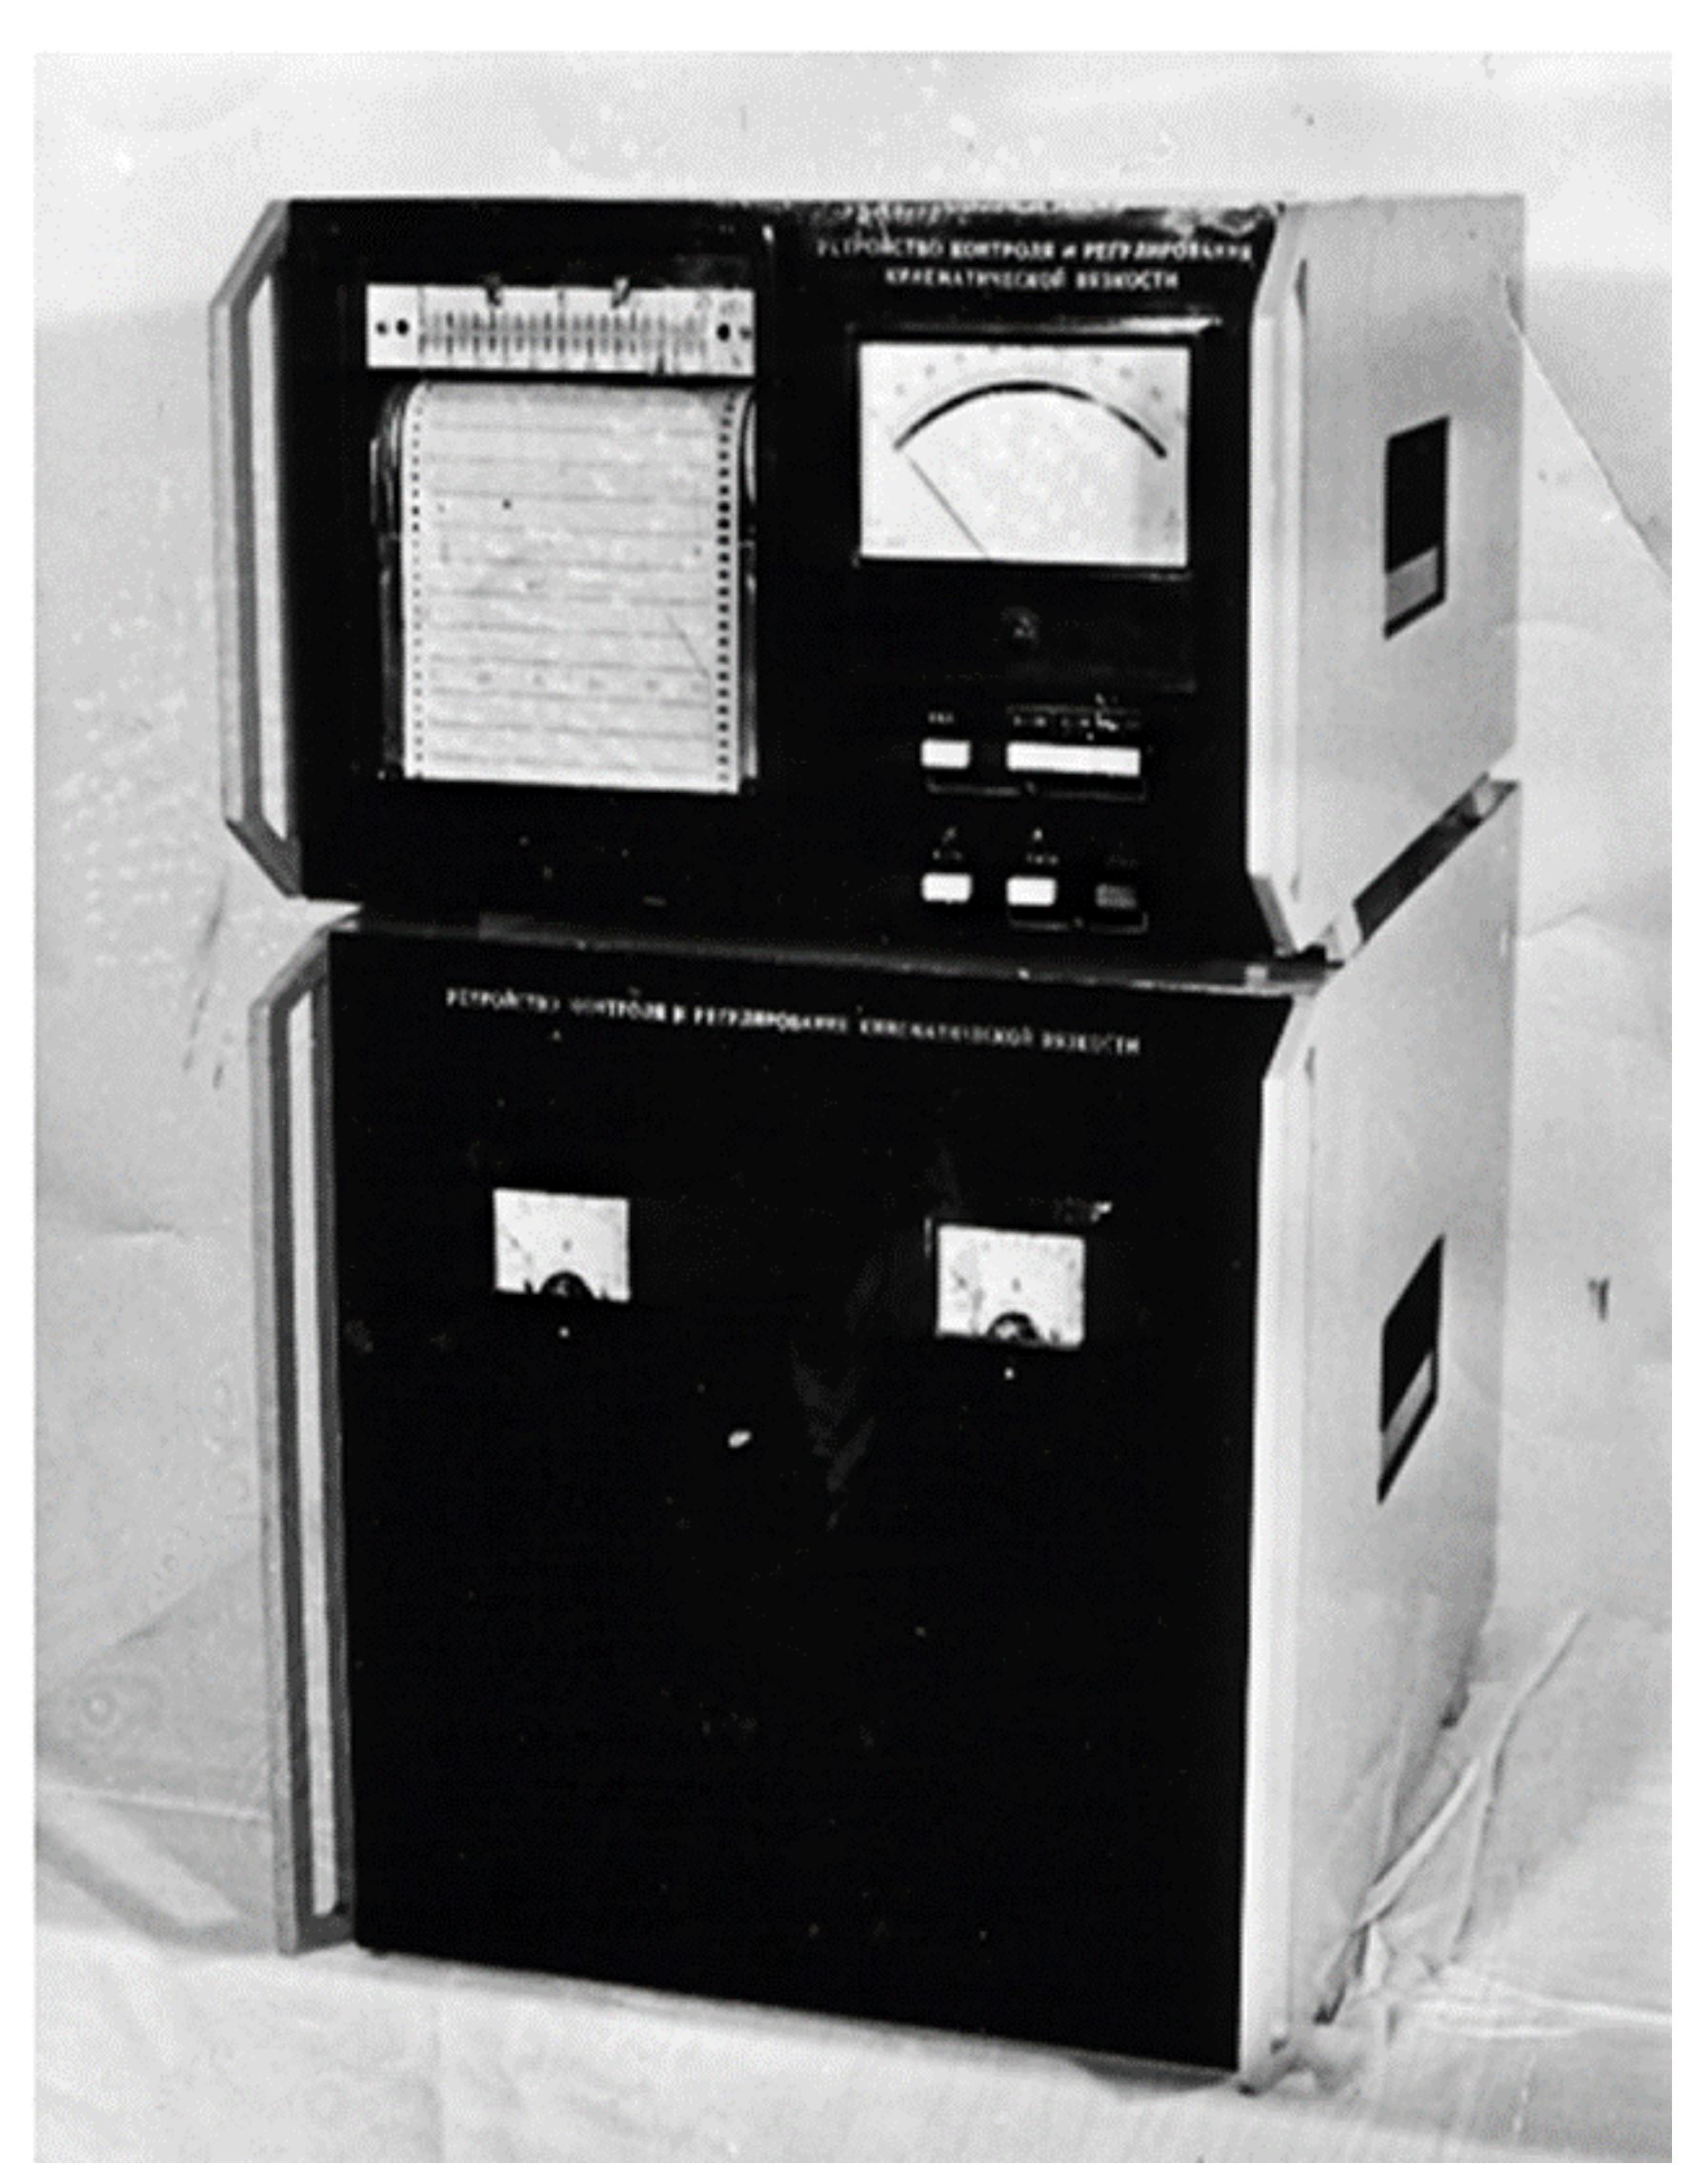
Figure 8 illustrates a block diagram of the tested automatic analyzer with static balancing.
The TBT of the analyzer was designed according to the symmetrical scheme of 2L-2T type. Inside it, two identical laminar throttles were made as a capillary tube cut into two parts, and two identical turbulent throttles were made as a diaphragm with a cylindrical hole. The zero indicator 8 is a differential pressure gauge of DM 3583 type with a nominal pressure drop of 6.3 kPa. The signal from output of the differential pressure gauge was amplified and after rectification was fed to a thyristor unit 7 to control an engine 3 of ETO-1 type. The electric engine through a worm gear 4 with a gear ratio 60 drives a gear pump 5 of NSh-20 type. The output signal of the analyzer is a rotation speed of the engine, measured by a photoelectric speed converter with 100 symmetrical holes. The frequency of electric pulses at the time of TBT balancing was measured with a frequency meter 2 of ChZ-32 type. The conversion factor between frequency and flow rate for 100 holes of the photoelectric converter disk and the performance of the pump of NSh-3 type 3·10−6 m3/s is 3·10−8 m3/pulse.
Results of experimental investigation of the automatic analyzer with tracking static balancing performed in the range of kinematic viscosity measurement (0.9–5)·10−6 m2/s are shown in Table 6.
According to the obtained results, the static conversion characteristic of the automatic analyzer with tracking static balancing was determined as a regression polynomial of the first order [40,41]
ν = a + k ν Q ,
where a and k ν are the constant and conversion factor (regression coefficient) determined experimentally.
Values a and k ν were found by well-known regression equations [43]
a = i = 1 n Q i i = 1 n ν i 2 i = 1 n ν i Q i i = 1 n ν i n i = 1 n ν i 2 i = 1 n ν i 2 ,
k ν = n i = 1 n ν i Q i i = 1 n Q i i = 1 n ν i n i = 1 n ν i 2 i = 1 n ν i 2 ,
where n = 10 is the number of measurements.
The static characteristic of the conversion determined from the experimental data is
ν = 0.058 + 0.044 Q
with average and maximum relative approximation errors of 0.438% and 1.266%, respectively, with a pairwise correlation coefficient of 0.9977, which confirms the accuracy of the approximation.
The constant component in (15) is explained by incomplete balancing, because the analyzer provides the static balancing. The relative deviation of the conversion factor k ν determined from the experimental data is 5.88% by the value calculated in Table 4 (Figure 9).
The calculated and experimental conversion factors have a discrepancy due to inaccuracy in determining the geometric dimensions (especially the inner diameter) of laminar and turbulent throttles and because of the dosing pump efficiency. Due to the high accuracy of approximation, we considered Equation (15) as nominal static characteristic of the automatic analyzer with tracking static balancing by kinematic viscosity.
To estimate metrological characteristics of the automatic analyzer with tracking static balancing, experimentally measured flow values were converted by Equation (15) into the value of kinematic viscosity. According to the estimation results, the systematic component of automatic analyzer error in the range of kinematic viscosity measurement (0.9–5)·10−6 m2/s does not exceed 0.032·10−6 m2/s, and the standard deviation of kinematic viscosity measurement is less than 0.024·10−6 m2/s.
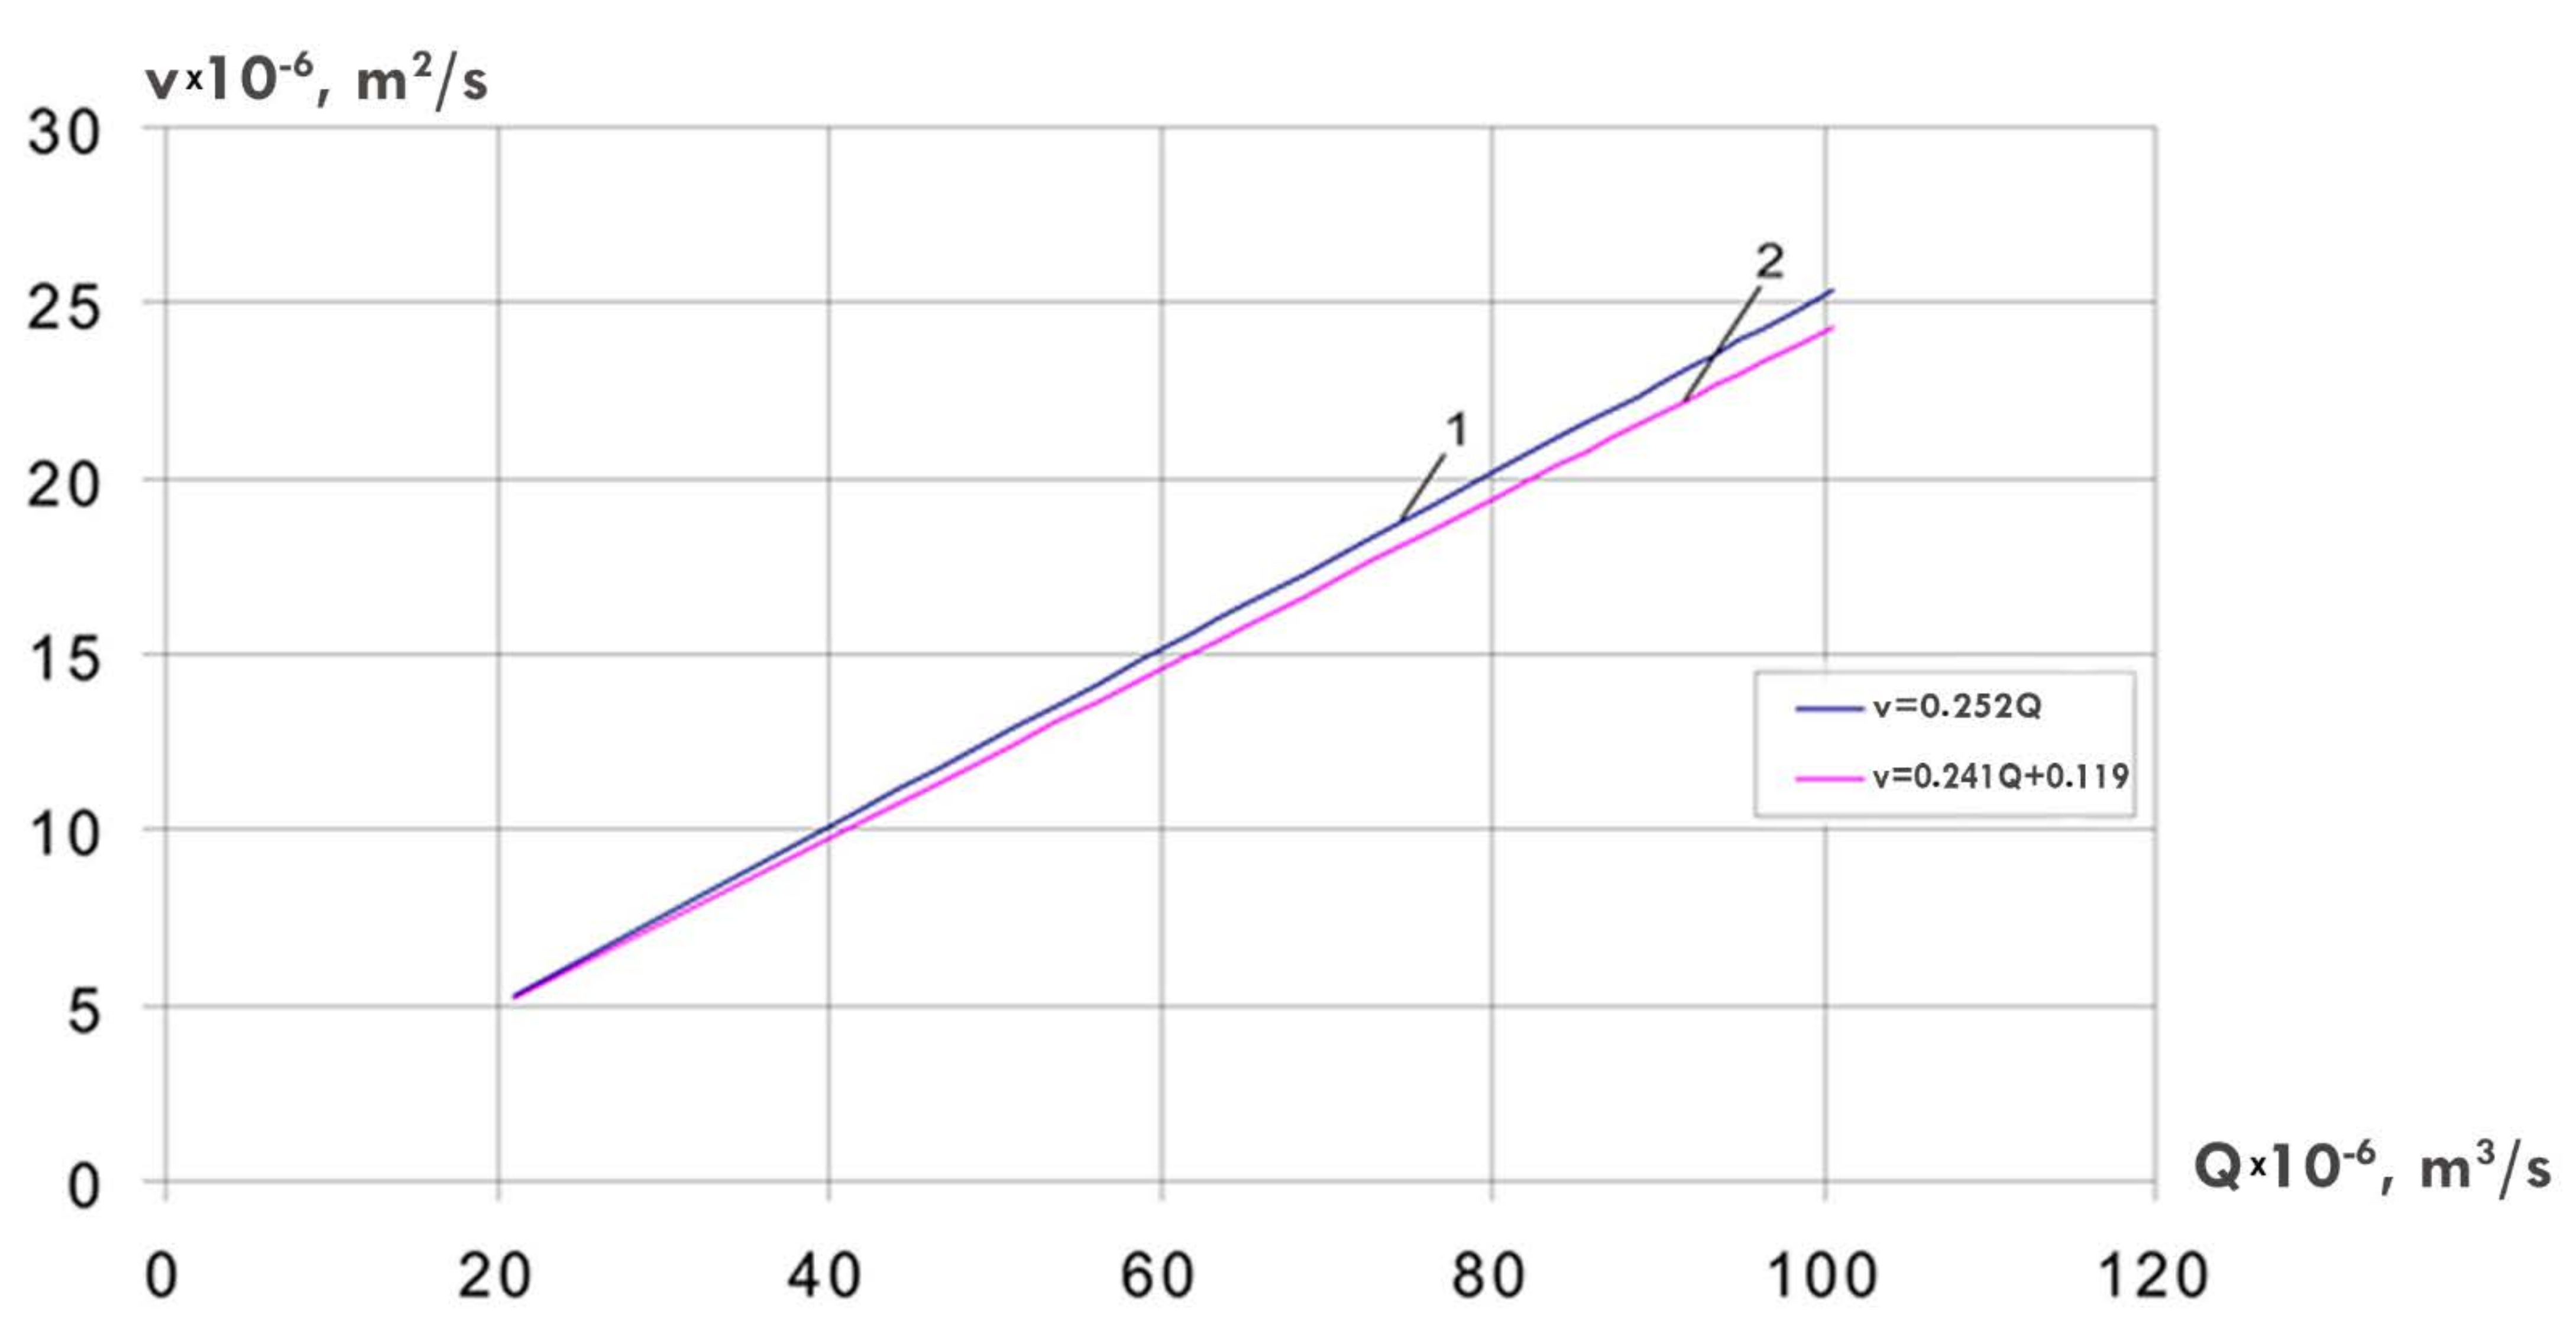
The automatic analyzer with a measuring range (5–25)·10−6 m2/s based on the TBT with laminar and turbulent throttles with changed geometric dimensions was investigated by the considered method. The results of this investigation are presented in Table 7.
The static characteristic of the conversion determined from experimental data for the range (5–25)·10−6 m2/s is
ν = 0.119 + 0.241 Q
with average and maximum relative approximation errors of 0.318% and 0.976%, respectively at a pairwise correlation coefficient of 0.9986, which confirms the accuracy of approximation.
The static conversion characteristic of the analyzer in the measuring range (5–25)·10−6 m2/s was calculated according to Table 4 and has the form ν = 0.252 Q . The calculated and experimental characteristics of the analyzer are shown in Figure 10 and have minor differences due to shortcomings of static balancing and inaccuracy in the definition of structural complexes of the throttles. According to the evaluation results, the systematic component of error in the automatic analyzer in the range of kinematic viscosity measurement (5–25)·10−6 m2/s did not exceed 0.42·10−6 m2/s, and the standard deviation of the kinematic viscosity measurement was less than 0.097·10−6 m2/s.
The total pressure drop in the TBT was measured (Table 8) in order to determine experimentally metrological characteristics for each calibrated sample of petroleum products by the density measurement channel.
Considering the results of the experiments (Table 7 and Table 8), density values were estimated and metrological characteristics of the automatic analyzer by density channel were evaluated according to the formulas in Table 4. We established that the systematic component of error of the automatic analyzer did not exceed 4.1 kg/m3 when measuring density, and the standard deviation of density measurement was s ρ 9.6 kg/m3.
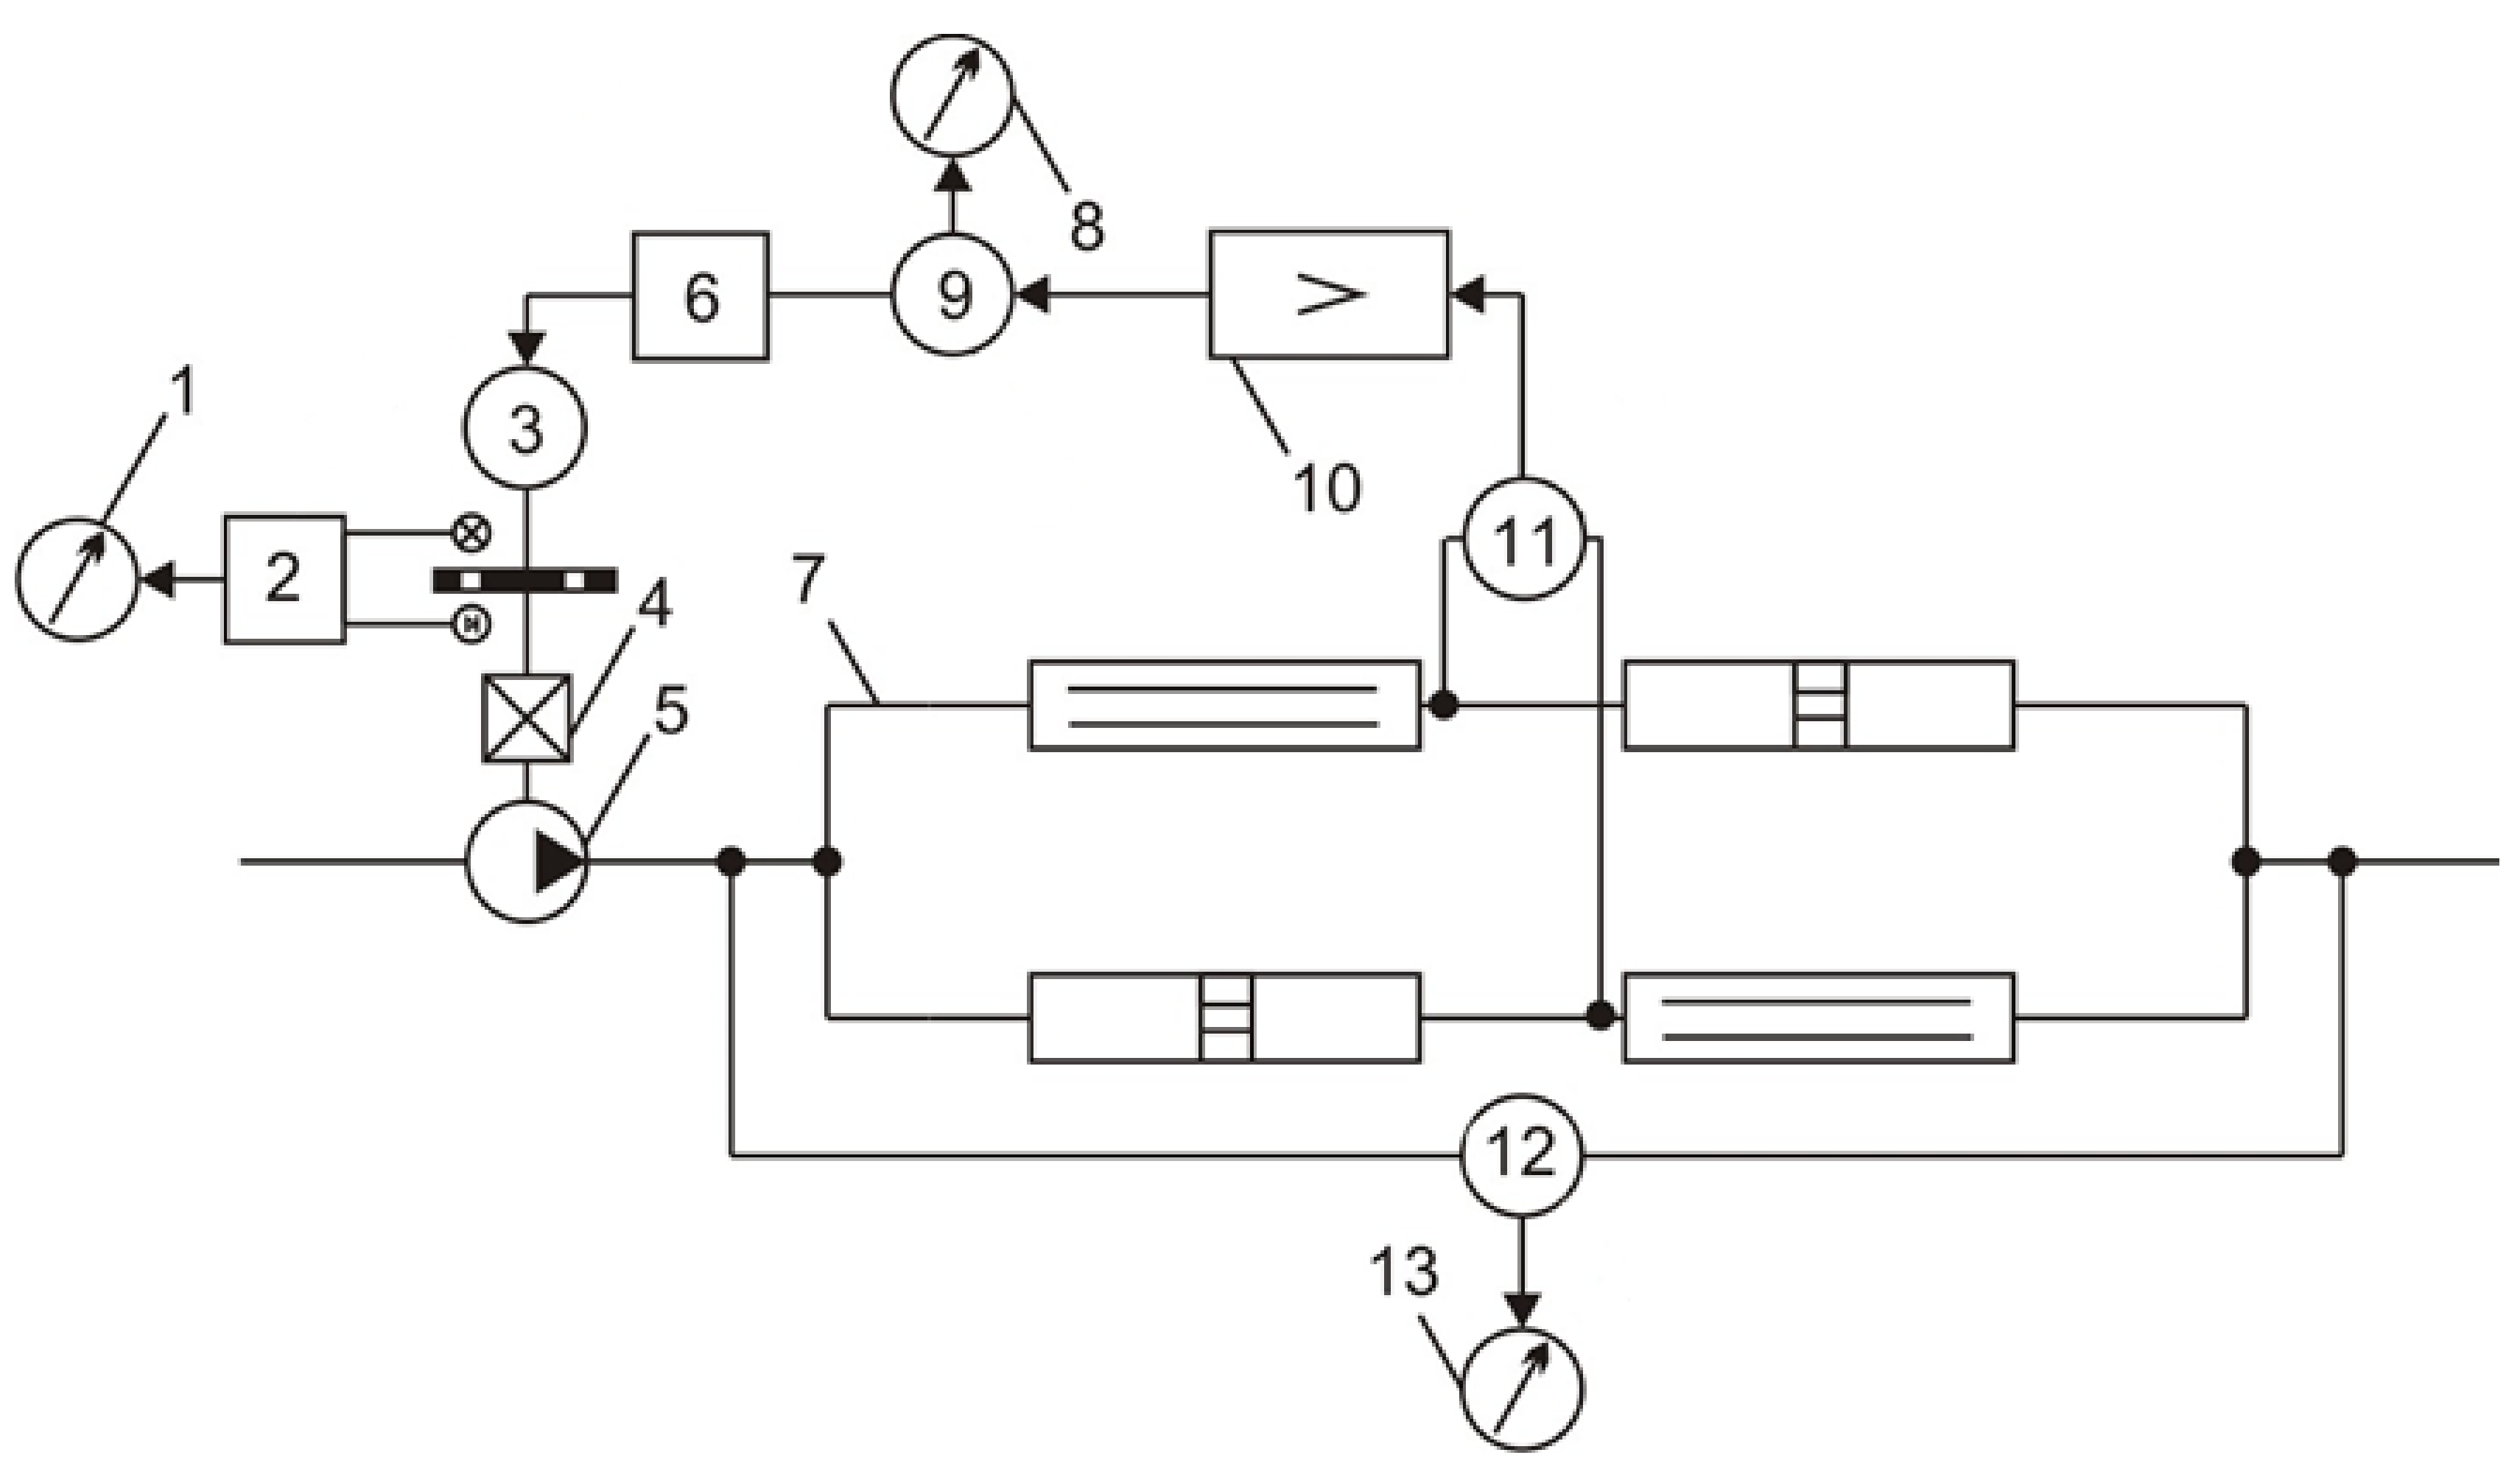
The experimental automatic analyzer with astatic balancing was realized similarly and consists of the unified equipment and TBT (Figure 11).
The imbalance signal in an indicator diagonal TBT 7 was measured by a differential pressure gauge 11 of DM 3583 type. The coil of the differential pressure gauge was shifted so that at zero pressure drop the voltage of the secondary winding was also zero. The compensating winding of the differential-transformer converter was short-circuited, so the voltage from output of a differential pressure gauge 12 was fed to input of a secondary measuring instrument 13.
With the kinematic viscosity changing, a voltage of some amplitude and phase was supplied to input of an amplifier 10, and a reversing engine 9 changed parameters of a terrestrial control unit 6 of an engine 3. With the speed of the engine 3 changing, a gear pump 5 connected through a gearbox 4 changed the flow rate of the petroleum product mixture through the TBT to reach a new state of balancing. Simultaneously, the reversing engine 9 changed the readings of a secondary measuring instrument 8. The photoelectric converter of a frequency meter 2 monitored the speed of the engine 3 according to the readings of a secondary measuring instrument 1.
The total gain of the automatic analyzer K Σ exceeded K Σ max even at the minimum gain K min of the amplifier 10, which led to oscillations in the measuring instrument. To maintain stability without replacing serial elements, a nonlinear pulse correcting element with adjustable pulse ratio was implemented into the automatic analyzer. Pins of the pulse element were connected in series with a control winding of a reversing motor 9, which ensured stable operation of the automatic analyzer. Results of experimental investigation of the automatic analyzer with astatic balancing (Figure 12) for a range of kinematic viscosity measurement of (1 … 5)·10−6 m2/s are shown in Table 9.
The systematic error component of the automatic analyzer with tracking astatic balancing in the range of kinematic viscosity measurement (1–5)·10−6 m2/s was no more than 0.039·10−6 m2/s, and the standard deviation of the kinematic viscosity measurement was s ν 0.045 10 6 m2/s.
In the automatic analyzer with tracking astatic balancing in a range of kinematic viscosity measurement (5–25)·10−6 m2/s laminar and turbulent throttles with the following geometrical sizes l L = 0.175 m; d L = 1.1 mm; d T = 0.75 mm were used in the TBT (Figure 13). Results of experimental investigation of the automatic analyzer with tracking astatic balancing for the range of kinematic viscosity measurement of (5–25)·10−6 m2/s are presented in Table 10. We have established that in this range of kinematic viscosity measurement the systematic component of measurement error did not exceed 0.097·10−6 m2/s, and the standard deviation of kinematic viscosity measurement was s ν 0.109 10 6 m2/s.
Metrological characteristics of the automatic analyzer with astatic balancing were determined by a channel for measuring the density of petroleum product mixture (Table 11 and Table 12).
Having performed the investigation, we established that the systematic component of error in the automatic analyzer with tracking astatic balancing by the channel of petroleum product density did not exceed 7.42 kg/m3, and the standard deviation of density measurement equaled s ρ 25.11 kg/m3, which was 1% and 3.3% of the measurement scale.
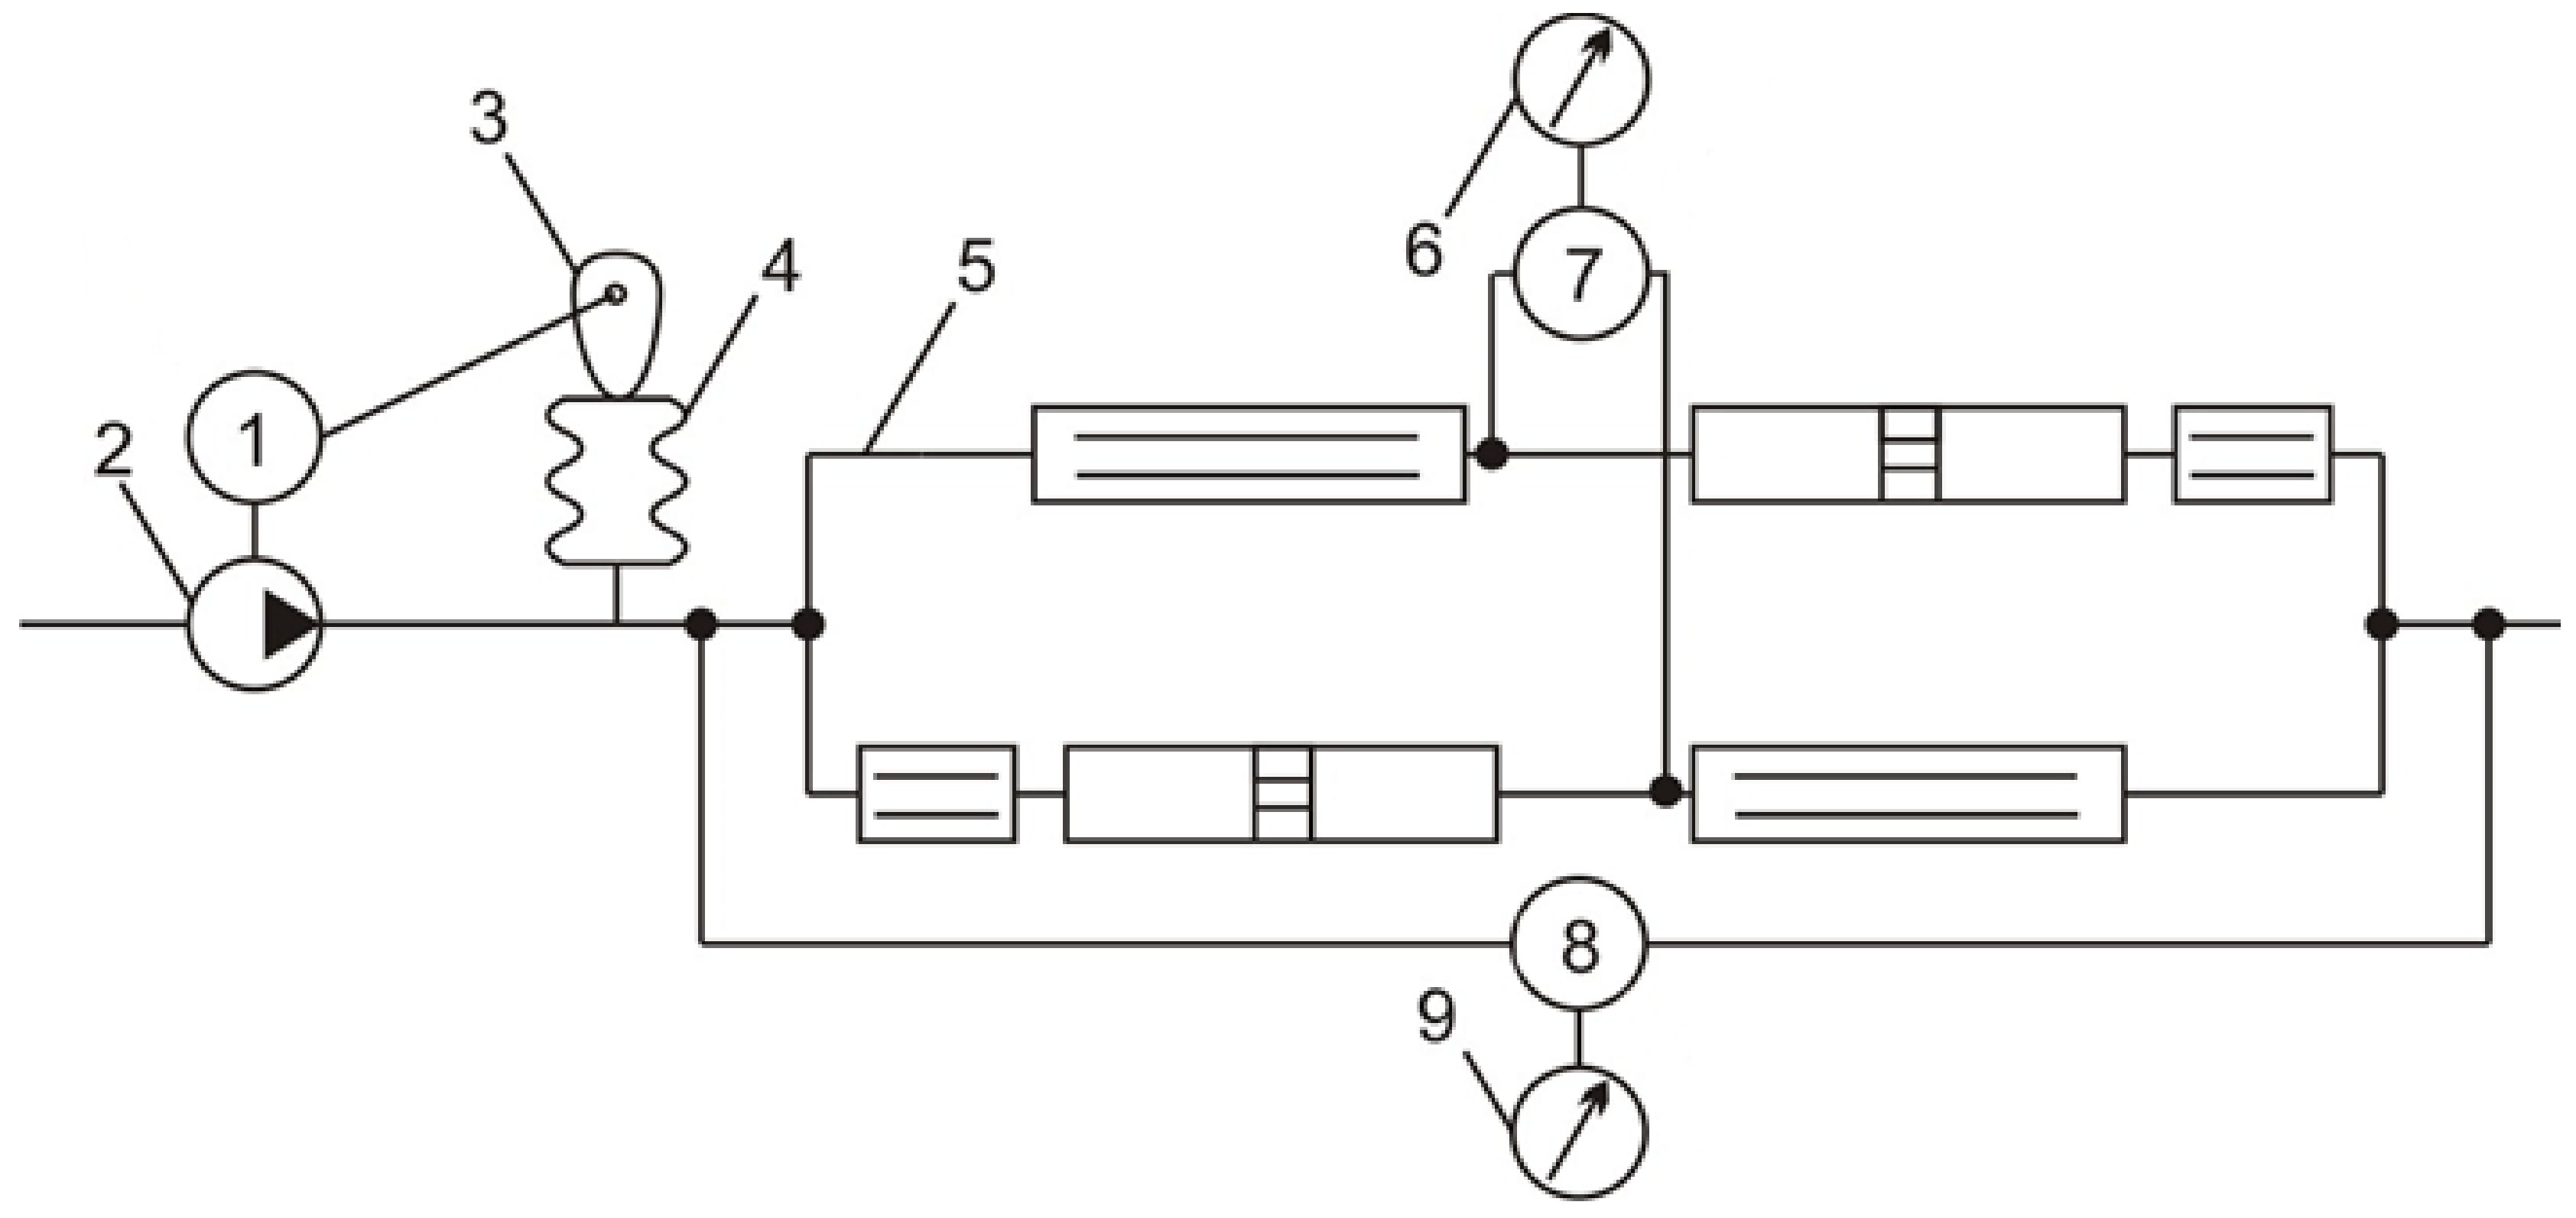
In an automatic analyzer with unfolding balancing (Figure 14) the TBT 5 was designed by the scheme with additional throttles. This provided a linear dependence of the output signal on the kinematic viscosity when the flow rate of the petroleum product mixture changed by sawtooth with a constant component law. To implement this law, at output of a gear pump 2 a tank with a variable volume—an undulated pipe 4—was installed. The volume of the undulated pipe was changed with a profiled pusher with an eccentric 3. The pump and the pusher were driven by a synchronous engine 1.
In the indicator diagonal of the TBT there was a low-inertia zero indicator 7, consisting of a soft membrane with a solid magnetic center and a magnetically controlled contact. The time interval between two tripping of the zero indicator (an output signal of the automatic analyzer) was measured by a frequency meter 6 of ChZ-32 type.
Results of experimental investigation of the automatic analyzer with unfolding balancing in ranges of kinematic viscosity measurement (1–5)·10−6 m2/s and (5–30) 10−6 m2/s are shown in Table 13 and Table 14.
In the range of kinematic viscosity measurement (1–5)·10−6 m2/s, the maximal systematic component value of measurement error was 0.035·10−6 m2/s, and the standard deviation of kinematic viscosity measurement was s ν 0.079 10 6 m2/s. For the automatic analyzer with the measuring range (5–30)·10−6 m2/s, these values equaled 0.181·10−6 m2/s and 0.243·10−6 m2/s, respectively.
In the measuring instrument channels with noise, a random component of uncertainty may appear, which can be estimated by the equation [44]
s N = s 1 2 + s 2 2 + s 1 s 2 sin φ = q 1 + q 2 + q 1 q 2 sin φ q 1 q 2 ,
where s 1 and s 2 are the noise RMS in the measuring instrument channels; q 1 = P 1 s 1 2 and q 2 = P 2 s 2 2 are the ratio of the signal power P 1 or P 2 to the noise power in the measuring instrument channels; φ is the phase shift determined by time delay of signal propagation in the channel.
In [45], the Allan variance method was proposed for identification of the noise structure in channels of the measuring instrument.
The TBTs were investigated analytically and experimentally. Additionally, the automatic analyzer prototypes based on TBT were investigated. The results of the investigations can be applied when developing industrial automatic analyzers for the continuous and simultaneous measurement of kinematic viscosity and density of petroleum products in the stream.

4. Discussion

Three TBTs with different numbers of laminar and turbulent throttle in arms of the bridge circuit were experimentally investigated. They confirmed the adequacy of the mathematical models and static transformation characteristics obtained in Table 4.
The maximal relative deviations of the results of experimental investigations from the analytical calculations of the static conversion factor by channels of kinematic viscosity and density were 5.88% and 8.76%, respectively. The reason for these discrepancies is the lack of accuracy in determining geometric dimensions of the turbulent and laminar throttles, performance of the dosing pump and the influence of technological holes and of TBT channels. Therefore, to clarify their static conversion factors when creating industrial automatic analyzers, the TBT should be calibrated using reference mixtures of petroleum products.
We established experimentally that for the automatic analyzer with tracking astatic balancing, the uncertainties for estimating the kinematic viscosity and density of petroleum products were less than in the automatic analyzers with tracking static balancing. The systematic component of measurement error of such automatic analyzers is less than 2.7% for the kinematic viscosity and less than 1.1% for the density of petroleum products. For such automatic analyzers, the standard deviation of kinematic viscosity measurement is s ν 4.2 % , and the standard deviation of measurement of the density of petroleum products is s ρ 2.4 % .
According to the results of experimental investigation, the minimal values of measurement uncertainties were established for the automatic kinematic viscosity analyzer with unfolding balancing—the systematic component was less than 2.3%, the standard deviation of kinematic viscosity measurement was s ν 2.2 % ) However, the technical implementation of such analyzer is more complex and less reliable than that of the automatic analyzer with tracking balancing.

5. Conclusions

The paper presents developed mathematical models and determined constructive restrictions for three schemes of a throttle bridge transducer (TBT) with various quantity of laminar and turbulent throttles in arms of the bridge scheme. According to the results of experimental investigations of such TBTs, the maximal relative deviations of the obtained results from the analytical calculations of a static conversion factors by channels were 5.88% for kinematic viscosity and 8.76% for density. The discrepancies were caused by the inaccuracies in determining geometric dimensions of the TBT throttles, the instability of the dosing pump flow rate and the influence of technological holes and TBT channels. Industrial automatic analyzers of kinematic viscosity and density of petroleum products have been developed, manufactured and implemented. The automatic analyzer with deployment balancing was experimentally established to have minimal uncertainties for estimating the kinematic viscosity of petroleum products (a systematic component was less than 2.3%, a standard deviation of kinematic viscosity measurement was sυ ≤ 2.2%). Furthermore, the automatic analyzer with tracking astatic balancing was experimentally established to have the minimal uncertainties for estimating the density of petroleum products (a systematic component was less than 1.1%, a standard deviation of petroleum product density measurement was sρ ≤ 2.4%). However, technical implementation of the automatic analyzer with deployment balancing is more complex and less reliable than that of the automatic analyzer with tracking balancing. When creating industrial automatic analyzers, the TBTs should be calibrated when pumping reference mixtures of petroleum products to clarify their static conversion factors.
The results of experimental investigations of the TBT and automatic analyzers confirmed the reliability and validity of the developed theory. This provides the development, manufacture and implementation of industrial automatic analyzers of kinematic viscosity and density of petroleum products.

Author Contributions

Conceptualization, A.S. and A.R.; methodology, A.R. and V.D.; validation, O.S., P.K. and V.D.; formal analysis, A.R.; investigation, V.D.; resources, P.K.; data curation, O.S.; writing—original draft preparation, A.R.; writing—review and editing, O.S.; visualization, P.K.; supervision, A.S.; project administration, A.S.; funding acquisition, A.S. All authors have read and agreed to the published version of the manuscript.

Funding

This research received no external funding.

Conflicts of Interest

The authors declare no conflict of interest.

References

  1. Panneerselvam, S.I.; Miranda, L.R. Biodiesel production from mutton tallow. In Proceedings of the 2011 IEEE Conference on Clean Energy and Technology (CET), Kuala Lumpur, Malaysia, 27–29 June 2011; pp. 83–86. [Google Scholar] [CrossRef]
  2. Borminskii, S.A.; Parshina, A.V. Metrological analysis of the system for complex control of the level, density and viscosity of multi-layer liquids in tanks. In Proceedings of the 2020 International Multi-Conference on Industrial Engineering and Modern Technologies (FarEastCon), Vladivostok, Russia, 6–9 October 2020; pp. 1–5. [Google Scholar] [CrossRef]
  3. Grigoriev, B.A.; Koldaev, A.I.; Boldyrev, D.V. Neural network approach to prediction of the liquid petroleum products viscosity. In Proceedings of the 2020 International Multi-Conference on Industrial Engineering and Modern Technologies (FarEastCon), Vladivostok, Russia, 6–9 October 2020; pp. 1–5. [Google Scholar] [CrossRef]
  4. Kalghatgi, G.; Aramco, S. Manufacture, Composition, and Properties of Practical Fuels for Internal Combustion Engines. In Fuel/Engine Interactions; SAE: Warrendale, PA, USA, 2014; pp. 33–62. [Google Scholar] [CrossRef] [Green Version]
  5. Akula, R.; Sai, B.R.; Jaswitha, K.; Kumar, M.S.; Yamini, V. Sensor based quality check and automated fuel level indication system. In Proceedings of the 2019 3rd International Conference on Recent Developments in Control, Automation & Power Engineering (RDCAPE), Noida, India, 10–11 October 2019; pp. 164–168. [Google Scholar] [CrossRef]
  6. Osadchuk, O.V.; Semenov, A.O.; Zviahin, O.S.; Semenova, O.O.; Rudyk, A.V. Increasing the Sensitivity of Measurement of a Moisture Content in Crude Oil. Nauk. Visnyk Natsionalnoho Hirnychoho Universytetu 2021, 5, 49–53. [Google Scholar] [CrossRef]
  7. Jamal, D.N.; Shajahan, M.S.M.; Cruz, S.N.; Abhineshjayram, M.; Goutham, S. Empirical investigation and comparison of different viscosity liquids with increasing temperature. In Proceedings of the 2020 International Conference on Emerging Trends in Information Technology and Engineering (ic-ETITE), Vellore, India, 24–25 February 2020; pp. 1–4. [Google Scholar] [CrossRef]
  8. Zhou, L. Toward prediction of kinematic viscosity of biodiesel using a robust approach. Energy Sources Part A Recovery Util. Environ. Eff. 2018, 40, 2895–2902. [Google Scholar] [CrossRef]
  9. Tan, F.; Ye, P.; Qiu, D.; Guo, L.; Huang, W.; Zeng, H.; Hou, D. A new method for measuring properties of liquid by using a single quartz crystal microbalance. In Proceedings of the 2017 Joint Conference of the European Frequency and Time Forum and IEEE International Frequency Control Symposium (EFTF/IFCS), Besancon, France, 9–13 July 2017; pp. 649–651. [Google Scholar] [CrossRef]
  10. Riazi, M.R.; Eser, S. Properties, specifications, and quality of crude oil and petroleum products. In Petroleum Refining and Natural Gas Processing; Riazi, M., Eser, S., Agrawal, S., Peña, J.D., Eds.; ASTM International: West Conshohocken, PA, USA, 2013; pp. 79–100. [Google Scholar] [CrossRef]
  11. Sun, L.; Zhang, T.; Zhou, Z. Experimental study on turbine flowmeter’s performance measuring fluids with different viscosities. In Proceedings of the 2006 6th World Congress on Intelligent Control and Automation, Dalian, China, 21–23 June 2006; pp. 5397–5401. [Google Scholar] [CrossRef]
  12. FY 2013 Progress Report for FUEL & LUBRICANT Technologies. Energy Efficiency and Renewable Energy. U.S. Department of Energy. Vehicle Technologies Office. Approved by Kevin Stork, DOE/EE-1042. 2014. Available online: https://www.energy.gov/sites/prod/files/2014/07/f17/fy2013_fuels_technologies.pdf (accessed on 29 October 2021).
  13. Khanchych, K.; Zhelezny, V.; Motovoy, I. Investigation of viscosity of O-xylene/Fullerene C60 solutions. In Proceedings of the 2020 IEEE 10th International Conference Nanomaterials: Applications & Properties (NAP), Sumy, Ukraine, 9–13 November 2020; pp. 01TPNS01-1–01TPNS01-4. [Google Scholar] [CrossRef]
  14. Osadchuk, A.V.; Semenov, A.A.; Zviahin, O.S.; Savytskyi, A.Y.; Komada, P.; Nurseitova, K. Numerical method for processing frequency measuring signals from microelectronic sensors based on transistor structures with negative differential resistance. Proc. SPIE 2019, 11176, 111765Y. [Google Scholar] [CrossRef]
  15. Ganesh, D.; Gowrishankar, G. Effect of nano-fuel additive on emission reduction in a biodiesel fuelled CI engine. In Proceedings of the 2011 International Conference on Electrical and Control Engineering, Yichang, China, 16–18 September 2011; pp. 3453–3459. [Google Scholar] [CrossRef]
  16. Schiffer, M.; Mackowiak, P.; Ngo, H.; Ehrmann, O.; Schneider-Ramelow, M.; Lang, K. Mems mass flow controller for liquid fuel supply to HCCI-driven engine. In Proceedings of the 2019 20th International Conference on Solid-State Sensors, Actuators and Microsystems & Eurosensors XXXIII (TRANSDUCERS & EUROSENSORS XXXIII), Berlin, Germany, 23–27 June 2019; pp. 793–796. [Google Scholar] [CrossRef]
  17. Ye, Z.; Mao, X.; Huang, H. Investigation of a fuel oil viscosity and temperature control system based on state observation. In Proceedings of the 2018 11th International Symposium on Computational Intelligence and Design (ISCID), Hangzhou, China, 8–9 December 2018; pp. 231–235. [Google Scholar] [CrossRef]
  18. Xin, Z.; Xin, W. Research on transformer oil kinematic viscosity detection method based on IWOA-RBF and multi-frequency ultrasonic technology. In Proceedings of the 2020 3rd International Conference on Control and Robots (ICCR), Tokyo, Japan, 26–29 December 2020; pp. 199–203. [Google Scholar] [CrossRef]
  19. Kuzma, O. The dynamic destruction aggregates in nano suspensions into rotary viscometer. In Proceedings of the 2017 IEEE 7th International Conference Nanomaterials: Application & Properties (NAP), Odessa, Ukraine, 10–15 September 2017; pp. 01PCSI32-1–01PCSI32-4. [Google Scholar] [CrossRef]
  20. Bunn, T.F.; Jones, M.G.; Wheeler, C.A. Pumping power station ash as a high concentration slurry. In Paste 2010: Proceedings of the Thirteenth International Seminar on Paste and Thickened Tailings; Jewell, R., Fourie, A.B., Eds.; Australian Centre for Geomechanics: Perth, Australia, 2010; pp. 515–527. [Google Scholar] [CrossRef] [Green Version]
  21. PRC Technologies. Viscometer—Covimat 105 DC. Available online: http://www.prctech-th.com/Covimat-105-DC.html (accessed on 29 October 2021).
  22. Brookfield Viscosity. Brookfield TT200 Viscometer. Available online: http://brookfield-benelux.com/Bookfield_TT200_Process_viscometer.html (accessed on 29 October 2021).
  23. Zhu, P.; Lai, J.; Wu, K.; Zhang, Z.; Huang, X.; Zhang, L.; Liu, J. An attenuated time measurement based on pulse interval for oscillating cup viscometer. In Proceedings of the 2017 Chinese Automation Congress (CAC), Jinan, China, 20–22 October 2017; pp. 3109–3111. [Google Scholar] [CrossRef]
  24. Akbay, C.; Koçak, O. Vibrational viscosimeter design for biomedical purposes. In Proceedings of the 2018 Medical Technologies National Congress (TIPTEKNO), Magusa, Cyprus, 8–10 November 2018; pp. 1–4. [Google Scholar] [CrossRef]
  25. Kuntner, J.; Stangl, G.; Jakoby, B. Characterizing the rheological behavior of oil-based liquids: Microacoustic sensors versus rotational viscometers. IEEE Sens. J. 2005, 5, 850–856. [Google Scholar] [CrossRef]
  26. Hagenbach, E. Über die Bestimmung der Zähigkeit einer Flüssigkeit durch den Ausfluß der Röhren. Ann. Phys. 1860, 108, 385–426. [Google Scholar] [CrossRef] [Green Version]
  27. Sutera, S.P.; Skalak, R. The History of Poiseuille’s Law. Annu. Rev. Fluid Mech. 1993, 25, 1–19. [Google Scholar] [CrossRef]
  28. Pistun, Y.; Matiko, H.; Krykh, H. Mathematical models of throttle elements of gashydrodynamic measuring transducers. Energy Eng. Control Syst. 2019, 5, 94–107. [Google Scholar] [CrossRef]
  29. ISO 3104:2020. Petroleum Products—Transparent and Opaque Liquids—Determination of Kinematic Viscosity and Calculation of Dynamic Viscosity. Available online: https://www.iso.org/ru/standard/67965.html (accessed on 29 October 2021).
  30. Hongguang, X.; Mei, C. Study on the oil quantities calculation method of coriolis mass flow meter in oil dynamic measurement. In Proceedings of the 2017 13th IEEE International Conference on Electronic Measurement & Instruments (ICEMI), Yangzhou, China, 20–22 October 2017; pp. 22–26. [Google Scholar] [CrossRef]
  31. Liu, T.; Leusheva, E.; Morenov, V.; Li, L.; Jiang, G.; Fang, C.; Zhang, L.; Zheng, S.; Yu, Y. Influence of Polymer Reagents in the Drilling Fluids on the Efficiency of Deviated and Horizontal Wells Drilling. Energies 2020, 13, 4704. [Google Scholar] [CrossRef]
  32. Gonzalez, M.; Seren, H.R.; Ham, G.; Buzi, E.; Bernero, G.; Deffenbaugh, M. Viscosity and Density Measurements Using Mechanical Oscillators in Oil and Gas Applications. IEEE Trans. Instrum. Meas. 2018, 67, 804–810. [Google Scholar] [CrossRef]
  33. Zhang, M.; Chen, D.; He, X.; Wang, X. A Hydrodynamic Model for Measuring Fluid Density and Viscosity by Using Quartz Tuning Forks. Sensors 2020, 20, 198. [Google Scholar] [CrossRef] [PubMed] [Green Version]
  34. Tan, C.; Dai, W.; Wu, H.; Dong, F. A Conductance Ring Coupled Cone Meter for Oil-Water Two-Phase Flow Measurement. IEEE Sens. J. 2014, 14, 1244–1252. [Google Scholar] [CrossRef]
  35. Cappa, F. Modelling fluid transfer and slip in a fault zone when integrating heterogeneous hydromechanical characteristics in its internal structure. Geophys. J. Int. 2009, 178, 1357–1362. [Google Scholar] [CrossRef] [Green Version]
  36. McComb, D. Renormalization methods applied to turbulence theory. In Theories of Turbulence; CISM Courses and Lectures No. 442; International Centre for Mechanical Sciences; Oberlack, M., Busse, F.H., Eds.; Springer: Vienna, Austria, 2002; pp. 123–195. [Google Scholar]
  37. Kolmogorov, A.N. Mathematical models of turbulent motion of an incompressible viscous fluid. Uspekhi Mat. Nauk. 2004, 59, 5–10. [Google Scholar] [CrossRef]
  38. ASTM D1298—12b. Standard Test Method for Density, Relative Density, or API Gravity of Crude Petroleum and Liquid Petroleum Products by Hydrometer Method. 2017. Available online: https://www.astm.org/Standards/D1298.htm (accessed on 29 October 2021).
  39. Semenov, A.; Baraban, S.; Semenova, O.; Voznyak, O.; Vydmysh, A.; Yaroshenko, L. Statistical Express Control of the Peak Values of the Differential-Thermal Analysis of Solid Materials. Solid State Phenom. 2019, 291, 28–41. [Google Scholar] [CrossRef] [Green Version]
  40. Kucheruk, V.; Palamarchuk, Y.; Kulakov, P. The statistical models of machinery milking duration by group milking machines. East. Eur. J. Enterp. Technol. 2014, 4, 13–17. [Google Scholar] [CrossRef] [Green Version]
  41. Kucheruk, V.; Palamarchuk, Y.; Kulakov, P.; Gnes, T. The statistical model of mechanical milking duration of farmyard milking installation. East. Eur. J. Enterp. Technol. 2014, 2, 31–37. [Google Scholar] [CrossRef] [Green Version]
  42. Kucheruk, V.; Kurytnik, I.; Kulakov, P.; Lishchuk, R.; Moskvichova, Y.; Kulakova, A. Definition of dynamic characteristics of pointer measuring devices on the basis of automatic indications determination. Arch. Control Sci. 2018, 28, 401–418. [Google Scholar] [CrossRef]
  43. Judd, C.M.; McClelland, G.H.; Ryan, C.S. Data Analysis: A Model Comparison Approach to Regression, ANOVA, and Beyond, 3rd ed.; Taylor & Francis: New York, NY, USA, 2017; pp. 10–24. [Google Scholar]
  44. Rudyk, A.; Semenov, A.; Kryvinska, N.; Semenova, O. Study of phase and amplitude-phase methods for measuring a reactive element quality factor. Measurement 2022, 187, 110271. [Google Scholar] [CrossRef]
  45. Rudyk, A.V.; Semenov, A.O.; Kryvinska, N.; Semenova, O.O.; Kvasnikov, V.P.; Safonyk, A.P. Strapdown Inertial Navigation Systems for Positioning Mobile Robots—MEMS Gyroscopes Random Errors Analysis Using Allan Variance Method. Sensors 2020, 20, 4841. [Google Scholar] [CrossRef] [PubMed]
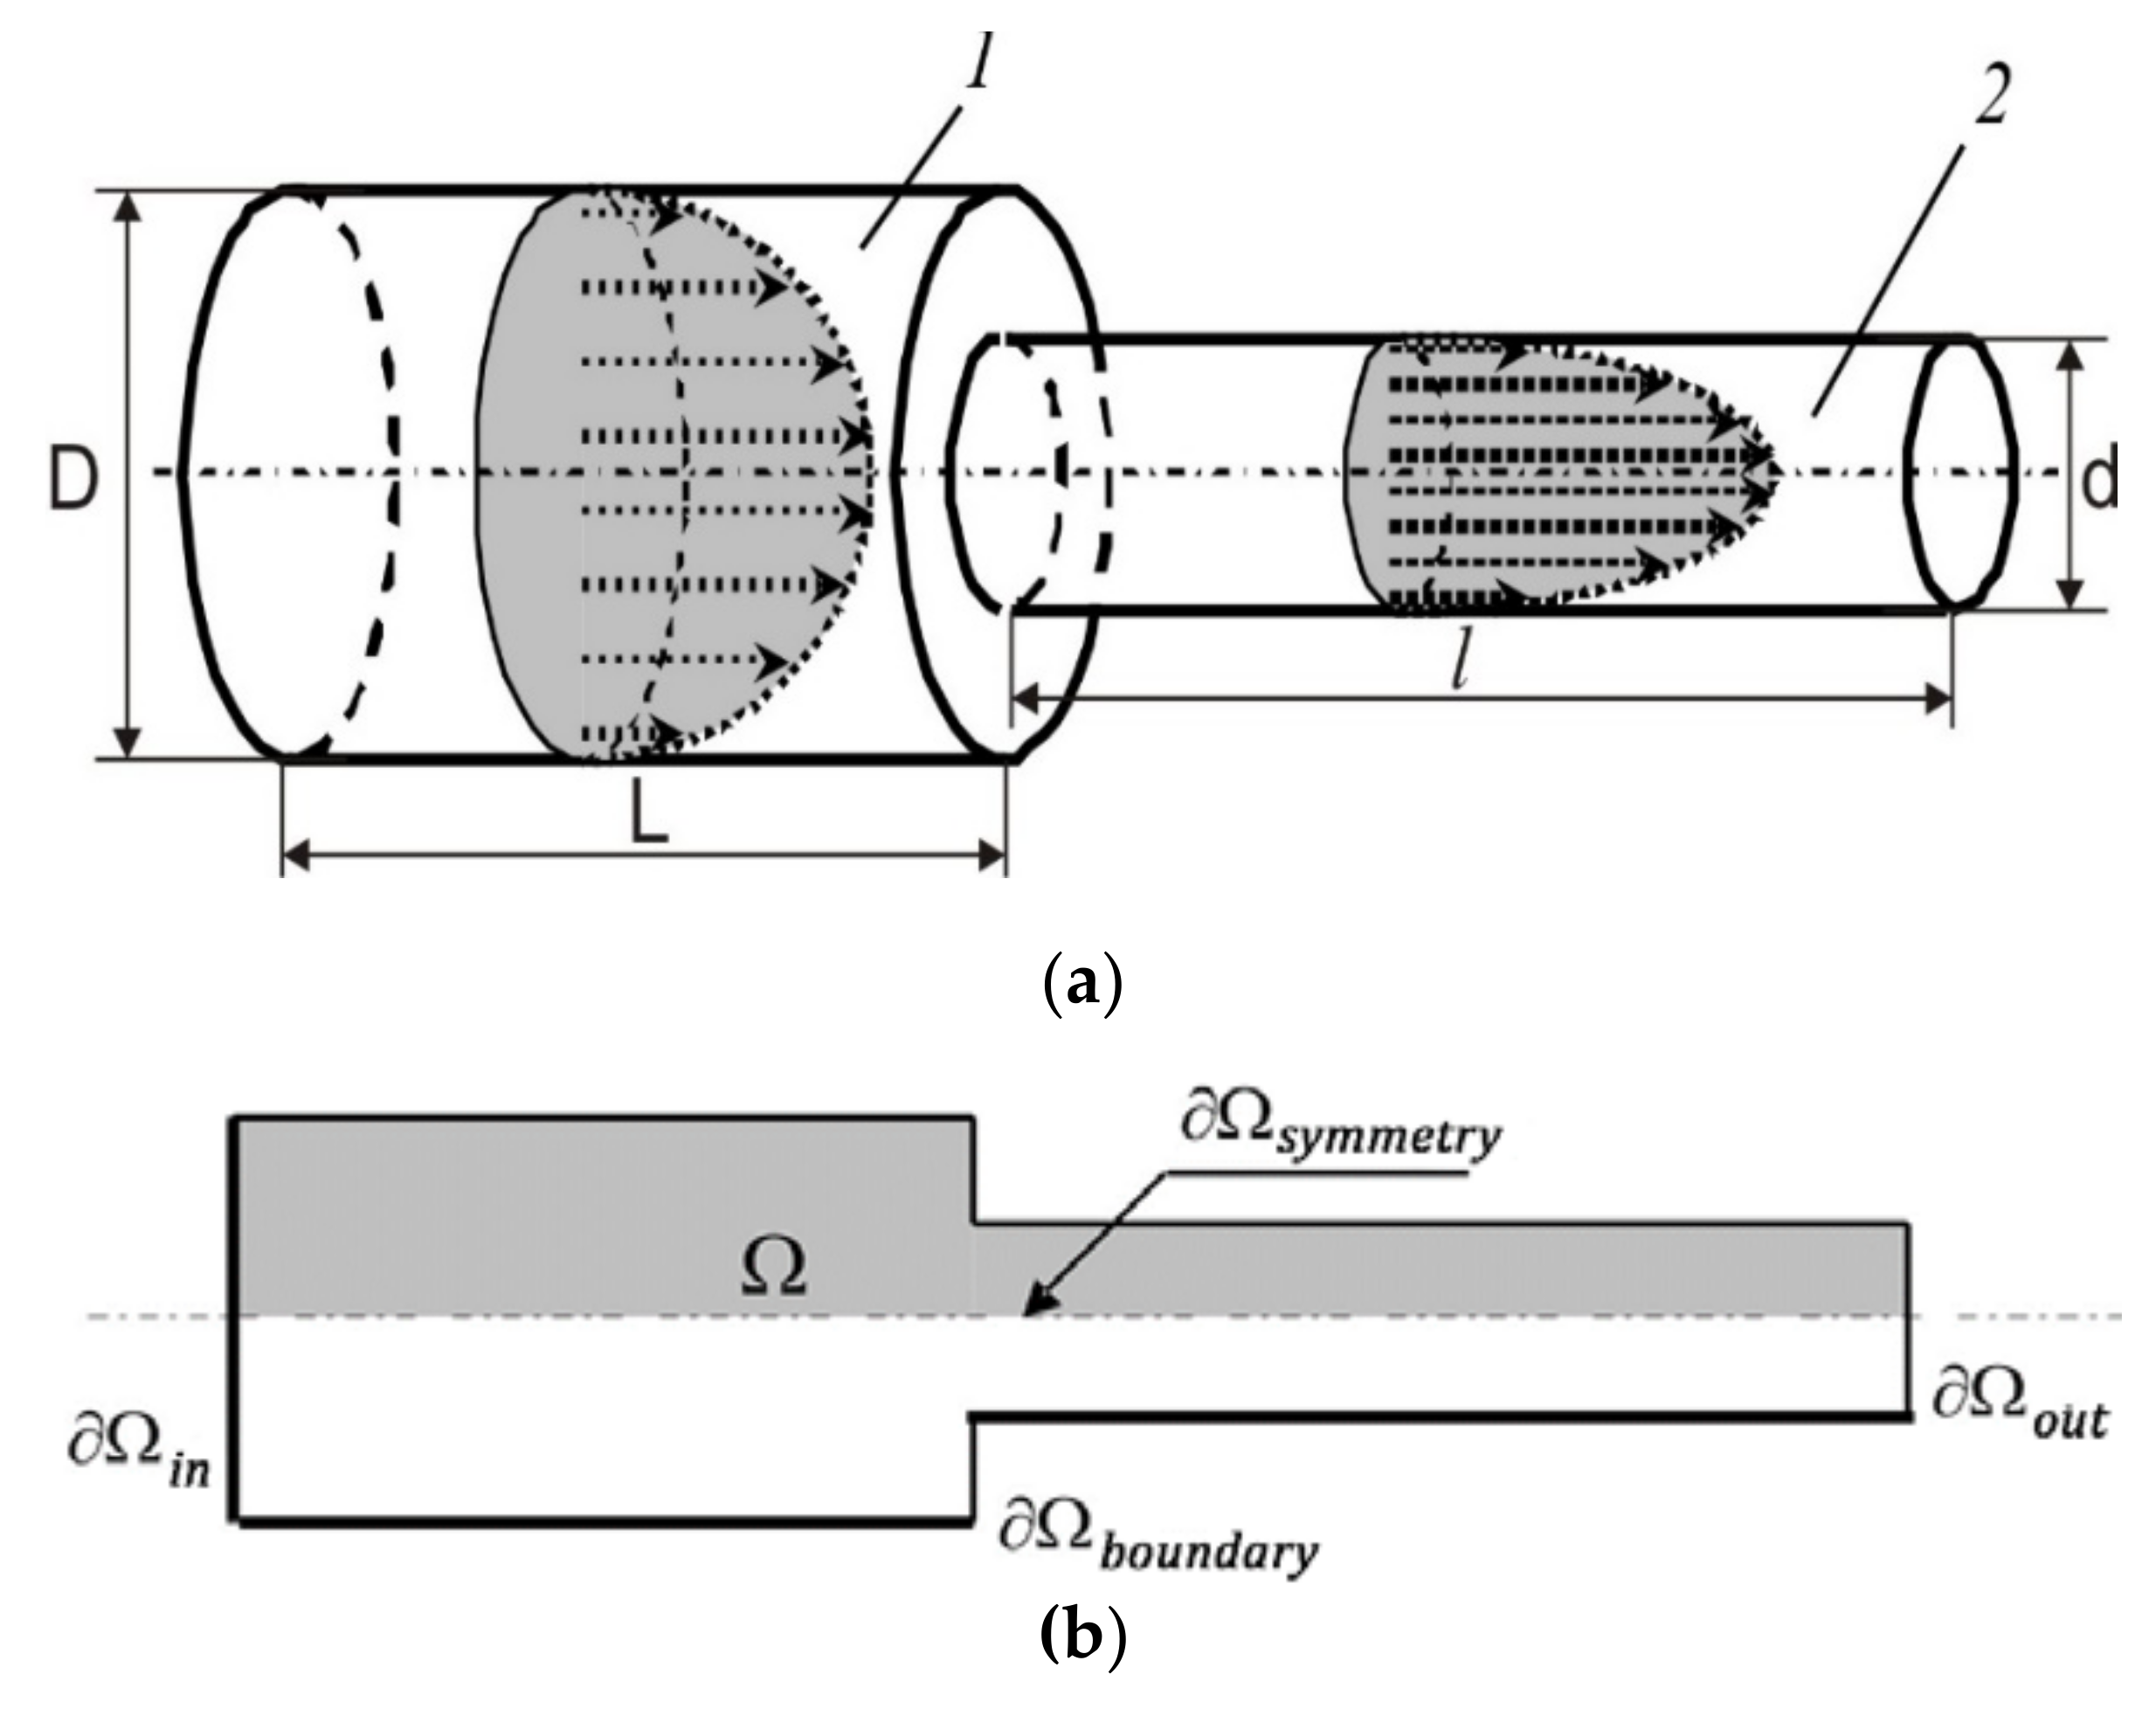
Figure 1. Design of the hydrodynamic throttle (a) and its axisymmetric model (b): 1 is an interconnected chamber; 2 is a capillary tube of cylindrical shape.
Inventions 07 00006 g001
Figure 2. Pressure distribution in the chamber-tube transition region of the hydrodynamic throttle with laminar flow mode.
Inventions 07 00006 g002
Figure 3. Axisymmetric model of the turbulent throttle.
Inventions 07 00006 g003
Figure 4. Pressure distribution in the chamber-tube transition region of the turbulent throttle.
Inventions 07 00006 g004
Figure 5. Block diagram of the installation for experimental investigation of TBTs: 1 pump; 2 reducer; 3 DC engine; 4 automatic control system; 5 thermostat; 6 vessel; 7 heater; 8 stirrer; 9 TBT; 10 differential pressure gauge; 11 U-shaped differential pressure gauge; 12 three-way tap; 13 thermometer; 14 temperature regulator; 15 measuring flask.
Inventions 07 00006 g005
Figure 6. Installation for experimental investigation of the TBT.
Inventions 07 00006 g006
Figure 7. Design of the TBT for the kinematic viscosity and density of petroleum products: 1 input adapter; 2 block of input and output cells; 3 output adapter; 4 block of turbulent throttles; 5 adapter for connection with the differential pressure gauge; 6 block of laminar throttles.
Inventions 07 00006 g007
Figure 8. Block diagram of the automatic analyzer with tracking static balancing: 1, 10 secondary measuring instruments; 2 frequency meter; 3 electric engine; 4 reducer; 5 pump; 6 TBT; 7 electric engine control unit; 8 zero indicator; 9 differential pressure gauge.
Inventions 07 00006 g008
Figure 9. Static calculated (1) and experimental (2) characteristics of conversion for the automatic analyzer with tracking static balancing in the range of kinematic viscosity measurement (0.9–5)·10−6 m2/s.
Inventions 07 00006 g009
Figure 10. Static calculated (1) and experimental (2) conversion characteristics of the automatic analyzer with tracking static balancing in the range of kinematic viscosity measurement (5–25)·10−6 m2/s.
Inventions 07 00006 g010
Figure 11. Block diagram of the automatic analyzer with tracking astatic balancing: 1, 8, 13 secondary measuring instruments; 2 frequency meter; 3 electric engine; 4 reducer; 5 pump; 6 electric drive control unit; 7 TBT; 9 reversing engine; 10 amplifier; 11 zero indicator; 12 differential pressure gauge.
Inventions 07 00006 g011
Figure 12. Automatic analyzer with tracking astatic balancing with the range of kinematic viscosity measurement (1–5)·10−6 m2/s.
Inventions 07 00006 g012
Figure 13. Automatic analyzer with tracking astatic balancing with the range of kinematic viscosity measurement (5–25)·10−6 m2/s.
Inventions 07 00006 g013
Figure 14. Block diagram of the automatic analyzer with unfolding balancing: 1 electric engine; 2 pump; 3 eccentric; 4 undulated pipe; 5 TBT with additional laminar throttles; 6 frequency meter; 7 zero indicator; 8 differential pressure gauge; 9 secondary measuring instrument.
Inventions 07 00006 g014
Table 1. Technical characteristics of rotary viscometers.
BrandModelViscosity Measurement Range, Pa·sMaximal Flow Rate, 10−3 m3/sTemperature Range
BrookfieldTT-200(10–50)·104immersive−40 °C–150 °C
TT-100(10–50)·1041.5up to 150 °C
BrussSystem Bruss(100–50)·107immersiveup to 120 °C
ContravesCovlstat 1up to 20000.2up to 150 °C
DC43up to 4.5·1060.7up to 350 °C
DD0.4–12,0000.1up to 90 °C
TO(1–5)·104immersiveup to 65 °C
CrosfieldViscomex 39010–4000.150 °C–150 °C
Eur-Controevisc-21 E, P80–15000.240 °C–120 °C
HaakeViscontro5·1070.27up to 160 °C
VC-1, VC-210000.1up to 100 °C
RheometricsOn-Line104–107-up to 150 °C
Solartron MobleyCovimat 105(8–72)·1040.05up to 120 °C
Table 2. Technical characteristics of vibrating viscometers.
BrandModelViscosity Measurement Range of the Viscometers, mPa·sNote
Automation ProductDynatro CL-10RL100–105Compensating T
Zendix CorporationUltra-Viscoson”50–50,000Compensating T
Nametre7.006 CЧP1–106Digital display T
UnipanType 50550–50,000Compensating T
ANDSV-10A1–100,000Controlling T
Solartron Mobrey LimitedSolartron 78270.5–20,000Controlling T
Table 3. Technical characteristics of capillary viscometers of dynamic viscosity.
BrandModelRange of Measurement,
mPa·s
Maximal Operating Temperature, °CPressure,
MPa
m-VROCType A0.2–10070-
m-VROCType E1–100,00070-
RHEOTESTLK 2.21–10,000800.75
AmetekTT10010–500,0001502
RheotecKV 100-F0–5001500.25
Table 4. Static characteristics of the throttle bridge transducer (TBT) conversion.
TBT SchematicStatic Conversion FunctionsRestrictions
by Kinematic Viscosityby Density
Inventions 07 00006 i001
3L-1T
ν = C 2 n 2 B 1 1 + n n A 1 Q ρ = n 1 + n 2 A 1 n A 1 C 2 + B 4 + A 4 C 2 B 1 n 2 Δ P Σ Q 2 B 4 B 3 < n < A 4 A 3
Inventions 07 00006 i002
1L-3T
ν = C 2 n 2 B 1 1 + n n A 1 Q ρ = 1 + n 2 C 2 + B 4 Δ P Σ Q 2 C 2 C 3 > B 2 C 4
Inventions 07 00006 i003
2L-2T
ν = C 2 n 2 B 1 1 + n n A 1 Q ρ = 1 + n 2 C 2 + n 2 C 3 Δ P Σ Q 2 B 4 C 3 < n < C 2 B 1
Where n = Q 1 Q 2 ; L1, L2, L3 are the laminar throttles; T1, T2, T3 are the turbulent throttles; A 1 ,   A 2 ,   A 3 ,   B 1 ,   B 2 ,   B 3 are the structural constants of laminar throttles A i = 4 a l i π d i 4 ; B i = 16 b π d i 4 ; C 1 ,   C 2 ,   C 3 are the structural constants of turbulent throttles C i = 16 c π d i 4 ; ZI is the zero indicator; Δ P Σ is the general pressure drop on TBT.
Table 5. Results of experimental investigation of static conversion factors of the TBT for kinematic viscosity and density.
Type of the CBR SchemeStatic Conversion Factor of the TBTRelative Uncertainty, %
νρ
CalculatedExperimentalCalculatedExperimentalνρ
1L-3Tsymmetrical0.2920.2794.92·10−65.34·10−64.658.54
asymmetrical0.4020.3834.56·10−64.96·10−64.968.76
2L-2Tsymmetrical0.2520.2415.51·10−65.85·10−64.646.17
asymmetrical0.2930.2805.26·10−65.68·10−65.527.98
3L-1Tsymmetrical0.3600.3404.63·10−64.28·10−65.888.17
asymmetrical0.3140.2974.19·10−63.86·10−65.728.55
Table 6. Results of experimental investigation of the automatic analyzer with tracking static balancing performed in the range of kinematic viscosity measurement (0.9–5)·10−6 m2/s.
ν r 10 6 ,   m 2 / s Flow Rate at a Balancing Moment in the TBT Q i 10 6 ,   m 3 / s Q ¯ 10 6 ,   m 3 / s
0.9222.5122.4822.4122.4622.4622.5022.4122.3422.2622.2022.40
2.1148.7448.3648.2148.5848.0948.5148.5348.6648.0548.6148.43
2.9468.2568.1568.3368.1568.1468.0568.6568.4368.9169.3868.44
3.8588.7688.7588.7888.8488.8688.7688.7688.9488.9689.1188.85
4.95113.23112.79113.08113.53113.43113.65113.29113.54113.78113.73113.40
Where ν r is the actual value of kinematic viscosity, Q ¯ is the average flow rate.
Table 7. Results of experimental investigation of the automatic analyzer with tracking static balancing in the range of kinematic viscosity measurement (5–25)·10−6 m2/s.
ν r 10 6 ,   m 2 / s Flow Rate at a Balancing Moment in the TBT Q i 10 6 ,   m 3 / s Q ¯ 10 6 ,   m 3 / s
5.1220.9820.8520.8320.6820.8921.0621.1420.9921.1120.9920.95
10.3441.7641.5941.6941.6841.9341.9941.5841.4441.4941.8141.69
14.8761.4161.5961.4161.7662.0362.2062.0362.2361.9161.6061.82
21.5789.4989.1490.0690.1890.1890.4590.2890.2090.1189.9890.01
24.55100.55100.39100.38100.11100.21100.70101.00101.05101.04100.59100.60
Table 8. Results of experimental investigation of the automatic analyzer by the density measurement channel.
ν r 10 6 ,   m 2 / s ρ r ,
kg/m3
Pressure Drop in the TBT Δ P Σ i ,   kPa P ¯ Σ ,
kP
5.127325958565958565757595657.5
10.34770239242244242240238241244242239241.1
14.87795543540551540554546549551554543547.1
21.5783012121196118712121222121512181215122212081210.7
24.5583615111516150815261508153015261523151115361519.5
Where ρ r is the actual value of the density, P ¯ Σ is the average value of the pressure drop.
Table 9. Results of experimental investigation of the automatic analyzer with tracking astatic balancing in the range of kinematic viscosity measurement (1–5)·10−6 m2/s.
ν r 10 6 ,   m 2 / s Results   of   Measurement   ν i 10 6 ,   m 2 / s Δ ν s 10 6 ,   m 2 / s s ν 10 6 ,   m 2 / s  
1.0701.031.041.051.071.081.081.041.061.081.040.0130.022
2.0382.002.022.001.982.032.052.001.962.002.050.0290.029
2.9653.022.982.982.963.003.023.042.982.922.92−0.0170.040
3.8183.803.783.783.803.763.783.773.803.743.800.0370.020
4.9034.904.944.964.884.914.954.904.964.884.84−0.0090.040
Where Δ ν s is the systematic error component, s ν is the standard deviation of kinematic viscosity measurement.
Table 10. Results of experimental investigation of the automatic analyzer with tracking astatic balancing in the range of kinematic viscosity measurement (5–25)·10−6 m2/s.
ν r 10 6 ,   m 2 / s Results   of   Measurement   ν i 10 6 ,   m 2 / s Δ ν s 10 6 ,   m 2 / s s ν 10 6 ,   m 2 / s  
5.105.115.125.115.215.315.135.175.285.135.31−0.0880.079
9.869.999.9210.1010.1210.099.869.9810.0610.099.88−0.060.082
14.9214.9114.7614.9114.9214.9314.8314.8214.8314.8014.720.0770.072
20.2220.3420.4120.3820.1820.1920.2320.1420.3620.3420.41−0.0780.102
24.8624.7124.6924.8024.8024.7524.6224.6424.9024.8424.910.0940.102
Table 11. Results of experimental investigation of the automatic analyzer with astatic balancing by the channel of density measurement.
ν r 10 6 ,   m 2 / s ρ r ,
kg/m3
Pressure Change in the TBT Δ P Σ i ,   MPa P ¯ Σ ,
MPa
5.107300.0610.0610.0610.0630.0660.0610.0620.0650.0610.0660.063
9.867630.2440.2400.2490.2500.2490.2370.2430.2470.2490.2380.245
11.927860.5590.5480.5590.5600.5610.5530.5520.5530.5510.5450.554
20.228181.0831.0901.0871.0661.0671.0711.0621.0851.0831.0901.078
24.868401.6411.6391.6531.6531.6471.6291.6321.6671.6591.6681.649
Table 12. Results of experimental investigation of the automatic analyzer with tracking astatic balancing by the density channel.
ρ r ,   kg / m 3 Results of Measurement ρ i ,   kg / m 3 Δ ρ s ,
kg/m3
s ρ ,   kg / m 3
730754.0739.1730.0736.8720.4736.2771.6728.6748.1709.3−7.4219.22
763779.7793.9735.2723.2758.2765.0781.2762.7727.5784.31.9125.11
786773.1801.8781.6769.3775.3782.9791.1774.4790.4796.12.4011.16
818823.3799.7802.8821.9831.8832.3822.0816.4819.6815.4−0.5210.71
840841.9847.4839.9837.9832.6846.0858.5838.2826.5829.50.169.39
Where Δ ρ s is the systematic component of error, s ρ is the standard deviation of density measurement.
Table 13. Results of experimental investigation of the automatic analyzer with unfolding balancing in the range of kinematic viscosity measurement (1–5)·10−6 m2/s.
ν r 10 6 ,   m 2 / s Results   of   Measurement   ν i 10 6 ,   m 2 / s Δ ν s 10 6 ,   m 2 / s s ν 10 6 ,   m 2 / s  
1.111.101.211.101.111.021.191.100.981.011.000.0280.019
1.941.951.961.881.851.891.941.971.841.911.860.0350.048
3.023.103.093.103.053.043.023.022.952.982.97−0.0120.054
4.114.074.104.074.204.194.184.164.094.074.13−0.0160.053
4.814.784.764.814.824.864.844.894.894.834.80−0.0180.043
Table 14. Results of experimental investigation of the automatic analyzer with unfolding balancing in the range of kinematic viscosity measurement (5–30)·10−6 m2/s.
ν r 10 6 ,   m 2 / s Results   of   Measurement   ν i 10 6 ,   m 2 / s Δ ν s 10 6 ,   m 2 / s s ν 10 6 ,   m 2 / s  
5.235.325.535.585.615.315.015.025.545.605.14−0.1360.112
10.1210.0210.3810.5610.6010.2410.1110.0210.0410.5810.46−0.1810.217
15.3115.0414.9815.2615.1315.3915.5415.6215.4015.0215.470.0250.232
20.0820.0019.6820.1120.1720.3620.4420.2820.1220.0519.96−0.0370.218
29.6329.8729.7429.5129.4229.2029.1829.3729.4629.3129.440.1800.218
Publisher’s Note: MDPI stays neutral with regard to jurisdictional claims in published maps and institutional affiliations.