Article

Strategic Placement of Solar Power Plant and Interline Power Flow Controllers for Prevention of Blackouts

by
Akanksha Mishra
1,*,
Nagesh Kumar Gundavarapu Venkata
2,
Sravana Kumar Bali
3,
Venkateswara Rao Bathina
4,
Uma Maheswari Ramisetty
5,
Srikanth Gollapudi
6,
Hady Habib Fayek
7 and
Eugen Rusu
8,*
1
Department of Electrical and Electronics Engineering, Vignan’s Institute of Engineering for Women, Visakhapatnam 530049, India
2
Department of Electrical and Electronics Engineering, JNTUA CE, Pulivendula 516390, India
3
Department of Electrical and Electronics Engineering, GITAM University, Visakhapatnam 530045, India
4
Department of Electrical and Electronics Engineering, V R Siddhartha Engineering College, Vijayawada 520007, India
5
Department of Electronics and Computer Engineering, Vignan’s IIT, Visakhapatnam 530049, India
6
Life Sciences and Systems Engineering, Kyushu Institute of Technology, Fukuoka 808-0135, Japan
7
Electromechanics Engineering Department, Faculty of Engineering, Heliopolis University, Cairo 11785, Egypt
8
Department of Mechanical Engineering, Faculty of Engineering, ‘Dunarea de Jos’ University of Galati, Domneasca Street, 800008 Galati, Romania
*
Authors to whom correspondence should be addressed.
Inventions 2022, 7(1), 30; https://doi.org/10.3390/inventions7010030
Submission received: 6 February 2022 / Revised: 21 February 2022 / Accepted: 24 February 2022 / Published: 2 March 2022

Abstract

:
In these post COVID times, the world is going through a massive restructuring which India can use to its benefit by attracting foreign industrial investment. The major requirement is a reliable and ecofriendly electrical power source. Of late, renewable energy sources have increasingly become popular as alternative source of electricity. They can provide immense aid in improving the reliability of the power system, when placed properly. The alternative integrated energy sources along with FACTS devices can provide a promising future for reliable power systems. In this paper, an effective location for the solar power unit and Interline Power Flow Controller using Line Severity Index is proposed in order to avoid contingencies. An Indian 62 bus system and IEEE 57 bus system are considered for the study. The Firefly algorithm is used to tune the IPFC in the Integrated Energy Systems scenario, for a dual objective function. The effect of placement of the solar unit and the optimized IPFC is analyzed and studied in detail in this paper.

1. Introduction

India is an overpopulated nation with increasing power demands. There is immense pressure on the power industry to cater to the needs of the fast-developing nation with the rapid growth in the industrial sector. Controlling atmospheric pollution and global warming while catering to the rising energy demand is a matter of concern to present-day system engineers. Consequently, substantial research is being made in the use of renewable energy for delivering the increased demand for power. The increase in the power flow through the transmission lines may cause congestion in the transmission corridors leading to contingency and blackouts.
Researchers have done an intensive study on different methods of incorporating alternative sources of energy in conventional power systems. Clegg et al. [1] have modeled a transmission system considering the operational impacts of the power to a gas integrated system. Bai et al. [2] have proposed a scheduling model for wind, gas and power transmission system to sustain stable operation in N-1 contingency conditions of either gas pipeline or power transmission line. Solar energy is the most viable renewable source which can be used in India throughout the terrain. Researchers have worked actively on various aspects of latent heat thermal storage to solve the intermittency problem in solar energy systems. For improving the energy storage efficiency, an optimal number of fins have been designed [3] and a fin–foam hybrid structure has been proposed [4]. To improve its temperature uniformity, various conditions for fin pitch and positions have been designed [5]. A downward bending angle of 10 degrees at the fins reduces the full melting point by 55.4% and improves the uniformity in temperature by 20% [6]. Non-uniform angled fins have been designed and found to reduce the melting point by 65.59% [7].
FACTS devices have been found to be an effective solution for power system issues [8]. Interline Power Flow Controller (IPFC) is a multi-terminal FACTS. The modeling of IPFC has been performed considering a lossless system [9,10]. The IPFC has been found to be very effective for solving power system congestion and contingency issues [11,12]. Since an IPFC is a multi-terminal device, a correct location for each of the IPFC converters has to be planned [13]. Contingency analysis using a voltage index has been proposed in [14]. Kumar et al. [15] have proposed a cat swarm optimization-based method of IPFC placement for the improvement of voltage stability. Control of FACTS devices the Integrated power systems scenario has been studied [16]. Firefly algorithm is a very effective optimization method [17]. It has a very fast convergence rate and accuracy. It has been used to solve various power system issues very effectively and accurately. Tuning of IPFC using the Firefly algorithm has also provided effective results. It can be very effective in improving the performance of the integrated system [18]. Nusair et al. [19] have performed optimal power flow of a power system with renewable systems in the presence of TCSC. Authors have performed OPF for reduction of cost in presence of FACTS devices [20,21]. Authors have performed OPF for a wind farm integrated system in the presence of TCSC and UPFC to reduce cost [22,23].
Although, a great amount of study has been performed on successfully incorporating renewable systems in the conventional power systems as an alternative power source. Still, authors have not yet given attention to the effective placement of renewable energy sources in the power system to avoid system contingency issues. The effectiveness of renewable systems in controlling the contingencies and avoiding blackouts is yet to be explored. There is a need to effectively strategize the location of renewable resources with an aim to avoid future contingencies and blackouts. Strategic placement of the alternative power sources in combination with the FACTS devices can be very effective in improving the reliability of the transmission system.
In this paper, a line severity index is proposed which is capable of providing an effective location for the placement of both solar power systems and IPFC. An integrated Indian 62 bus system is studied under contingency conditions. The 62-bus system has been studied in detail for all possible contingencies. The most severe contingency for the 62-bus system is identified on the basis of active and reactive power loss. A tuned IPFC is installed in the system at a location-based online severity index (LSI). The LSI proposed in this study indicates the weakest line in the system and also the weakest bus suitable for the allocation of the solar system. The second converter of the IPFC is placed using Disparity Line Utilization Factor (DLUF). The performance of the system in presence of the device is compared with that of the failed system. The parameters chosen for the comparison are Line Utilization Index, voltage stability and voltage deviation.

2. Mathematical Modelling

2.1. Mathematical Modelling of IPFC

A basic IPFC model with two converters is shown in Figure 1. Bus I is the common bus. The converter 1 is connected on the transmission line ij while the converter 2 is connected on the line ik.
The mathematical model of two converters IPFC [14] is represented as—
P i = V n 2 g n n V i V n [ g i n cos ( θ n θ i ) + b i n sin ( θ n θ i ) ] + V n V s e i n [ g i n sin ( θ n θ s e i n ) b i n cos ( θ n θ s e i n ) ]
Q i = V i 2 b i i n = j , k V i V n [ g i n sin ( θ i θ n ) b i n cos ( θ i θ n ) ) ] n = j , k V i V s e i n [ g i n sin ( θ i θ s e i n ) b i n cos ( θ i θ s e i n ) ]
P n i = V n 2 g n n V i V n [ g i n cos ( θ n θ i ) + b i n sin ( θ n θ i ) ] + V n V s e i n [ g i n sin ( θ n θ s e i n ) b i n cos ( θ n θ s e i n ) ]
Q n i = V n 2 b n n V i V n [ g i n sin ( θ n θ i ) b i n cos ( θ n θ i ) ] + V n V s e i n [ g i n sin ( θ n θ s e i n ) b i n cos ( θ n θ s e i n ) ]
where n = j, k
g i n + j b i n = 1 / z s e i n = y s e i n , g n n + j b n n = 1 / z s e i n = y s e i n g i i = n = j , k g i n , b i i = n = j , k b i n
Assuming lossless converter, the active power supplied by one converter equals the active power demanded by the other, if there are no underlying storage systems
Re ( V s e i j I j i * + V s e i k I k i * ) = 0
V1 = Vl∟θl (l = i, j, k) and Vl, θl are the magnitude and angle of Vl.
Vsein is the complex controllable series injected voltage source which represents the series compensation of the series converter.
Vsein is defined as Vsein = Vsein ∟θsein (n = j, k).
Vsein and θsein are the magnitude and angle of Vsein.
Zsein is the series transformer impedance.
Pni and Qni—active and reactive power flows leaving bus n connected to IPFC.

2.2. Inequality Constraints

V i   min V i V i max       i loadbus
S i j ( V , δ ) | S i j max i j
IPFC Constraints
V s e min V s e V s e max  
θ s e min θ s e θ s e max  

3. Problem Formulation

3.1. Placement of Solar Power Plant and IPFC

An index-based placement of solar power plant and IPFC is used. The index proposed is Line Severity Index (LSI).

Proposed Line Severity Index

LSI is an index used for determining the severity of the system loading under normal and contingency conditions. It is given by Equation (12)
L S I i j = a × [ M V A i j M V A i j max ] 2
where LSIij is the Line Severity Index (LSI) of the line connected to bus i and bus j.
MVAij(max) is Maximum MVA rating of the line between bus i and bus j.
MVAij is the actual MVA rating of the line between bus i and bus j.
a is the multiplying factor. In this study a = 1.
The ratio has been squared in order to be able to differentiate in the values of LSI of transmission lines in large power systems. The value of LSI will be trivial when the apparent power in the line is within its limits. During overload conditions, the LSI shows a high value. Thus, it provides a precise measure of the severity of the line overloads for a given state of the power system. When LSI ≥ 1, the line is considered to be overloaded.

3.2. Tuning of IPFC

The IPFC has been tuned using the Firefly Algorithm for the following multi-objective function.

3.2.1. Minimization of Voltage Deviation

f 2 ( x ) = ( k = 1 Nbus | V k V k ref | 2 )
Vk is the voltage magnitude at bus k.

3.2.2. Improvement of Security Margin

f 3 ( x ) = j J L S j lim j J L S j initial j J L S j lim
where JL = No. of load buses.
Since the multi-objective function is a minimization function. The objective is to minimize the inverse security margin.

4. Methodology

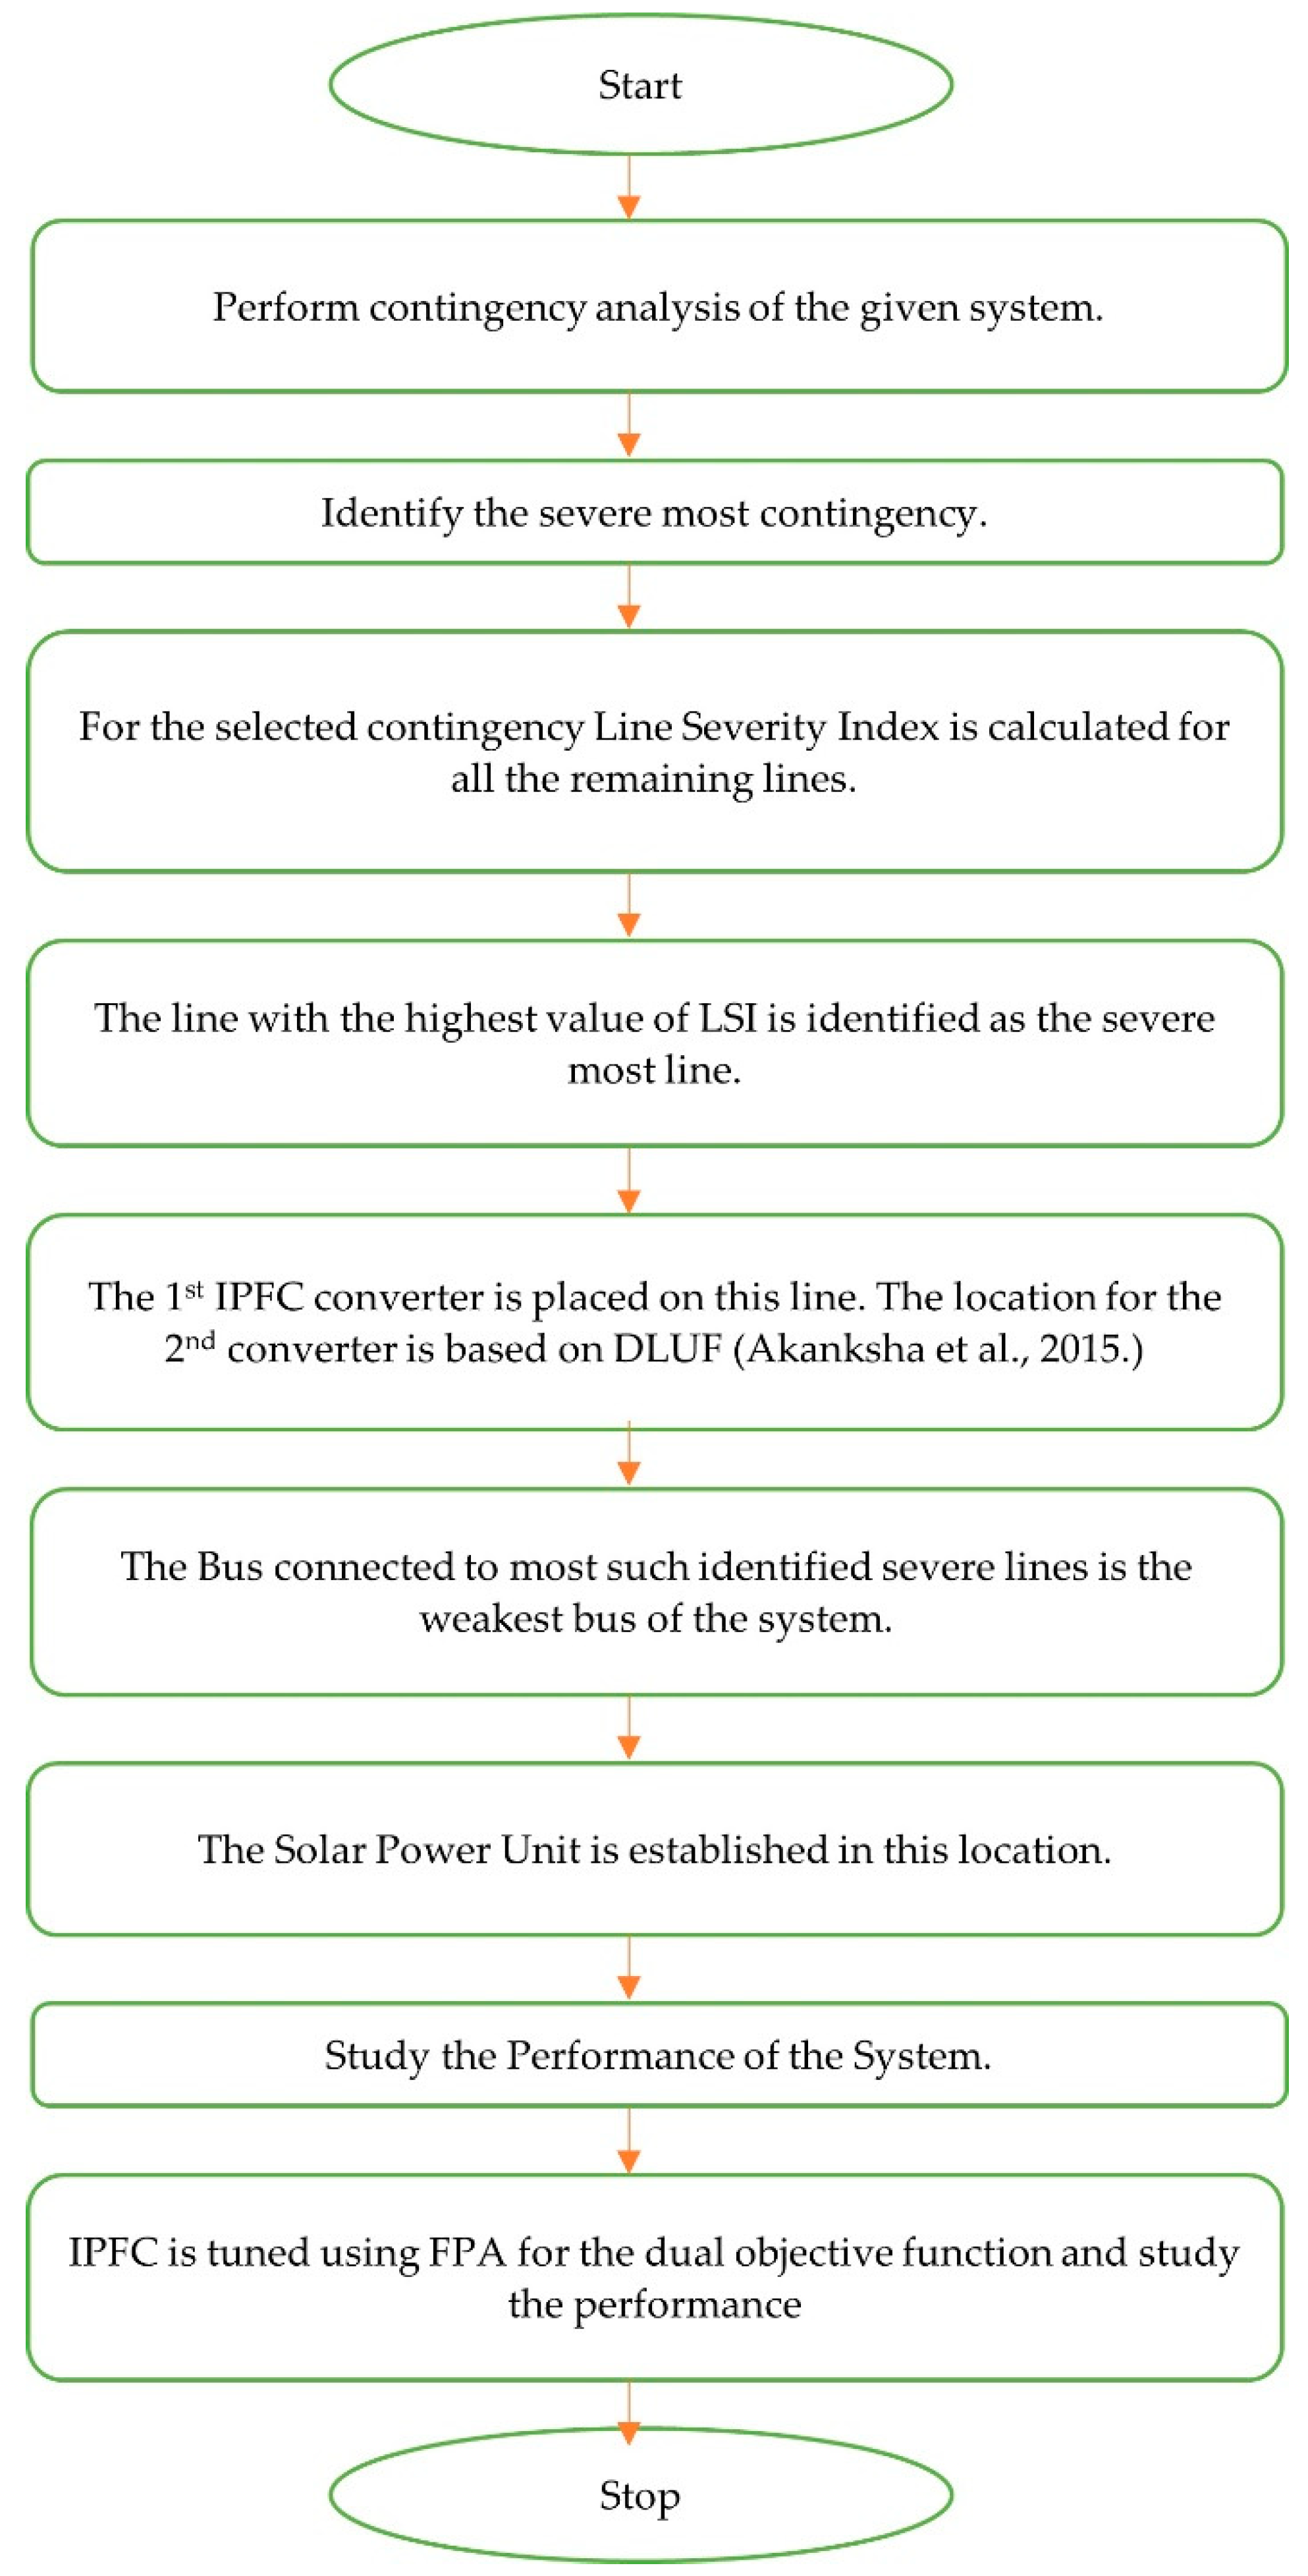
The methodology followed for the strategic placement of Solar power plant and IPFC is depicted in Figure 2. It is assumed that only one IPFC with two converters is placed. However, it can be extended to a greater number of IPFCs and converters.

5. Results

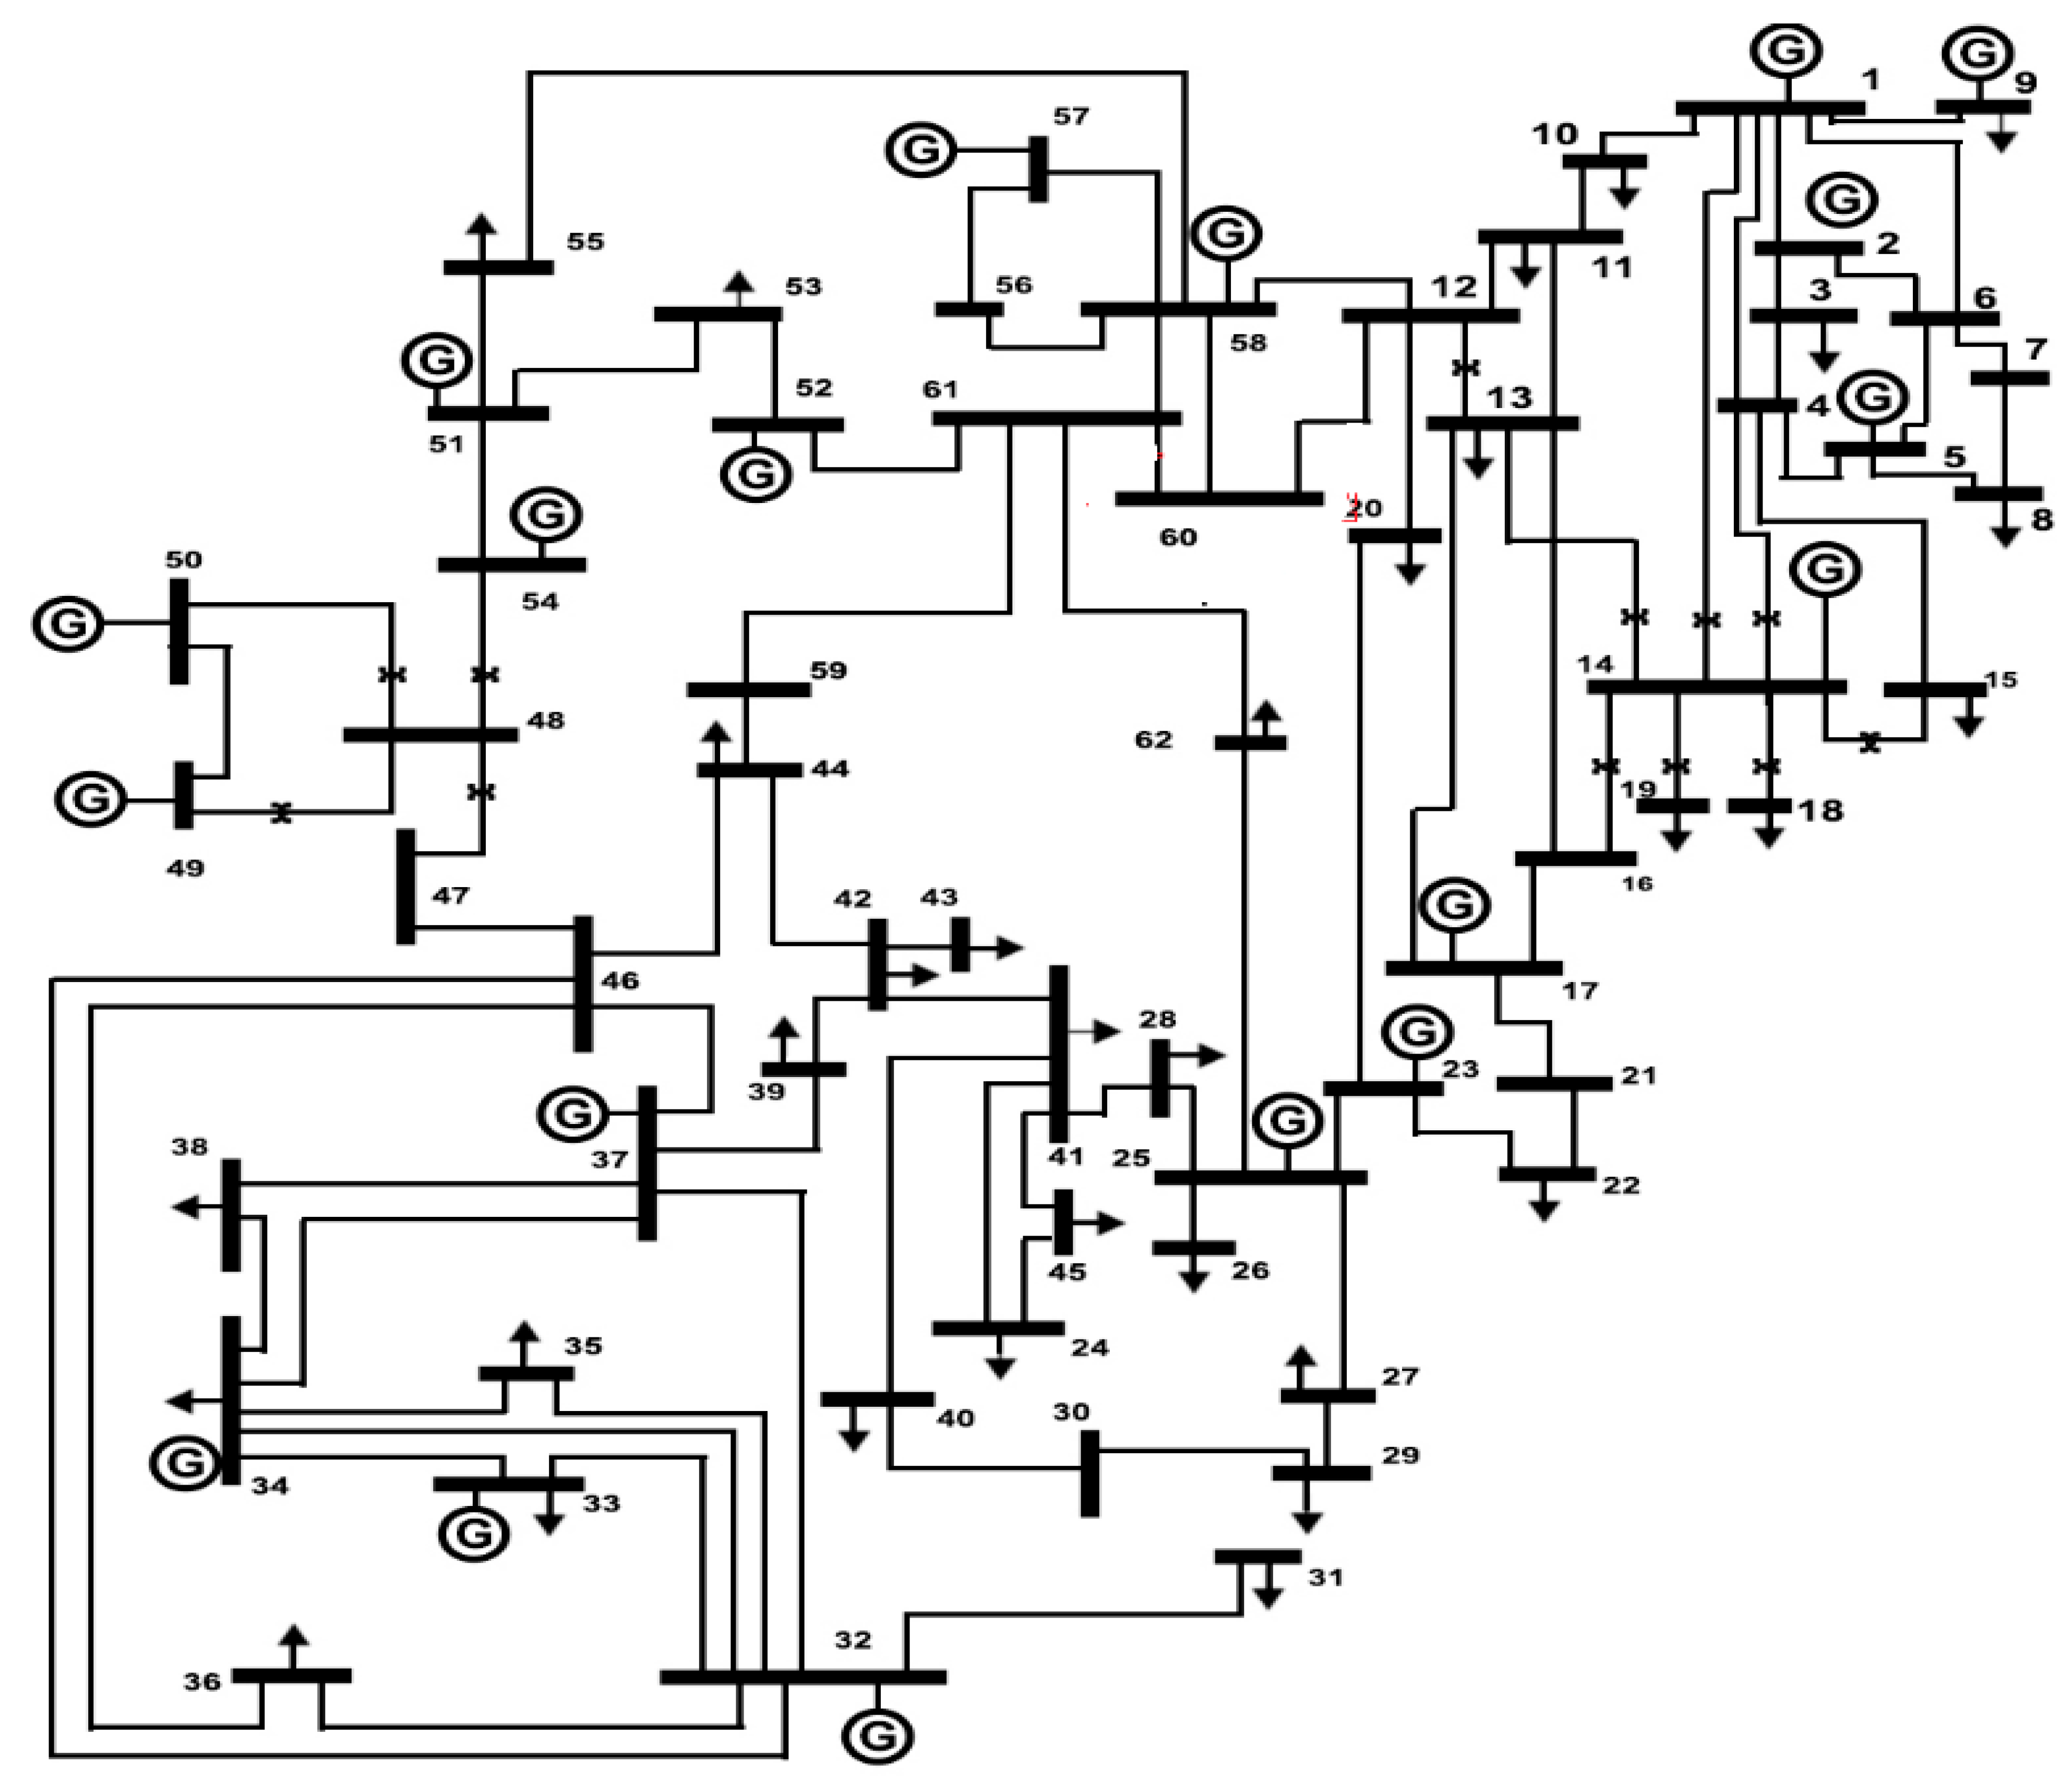
An Indian Utility 62 bus system (Figure 3) is taken for the study of line contingencies. It consists of 1 slack bus, 8 generator buses, 43 load buses and 89 transmission corridors. In this system, 49 lines are connected to load buses while the remaining are connected to the generator and slack buses. The results for all line contingencies are tabulated in Table 1.
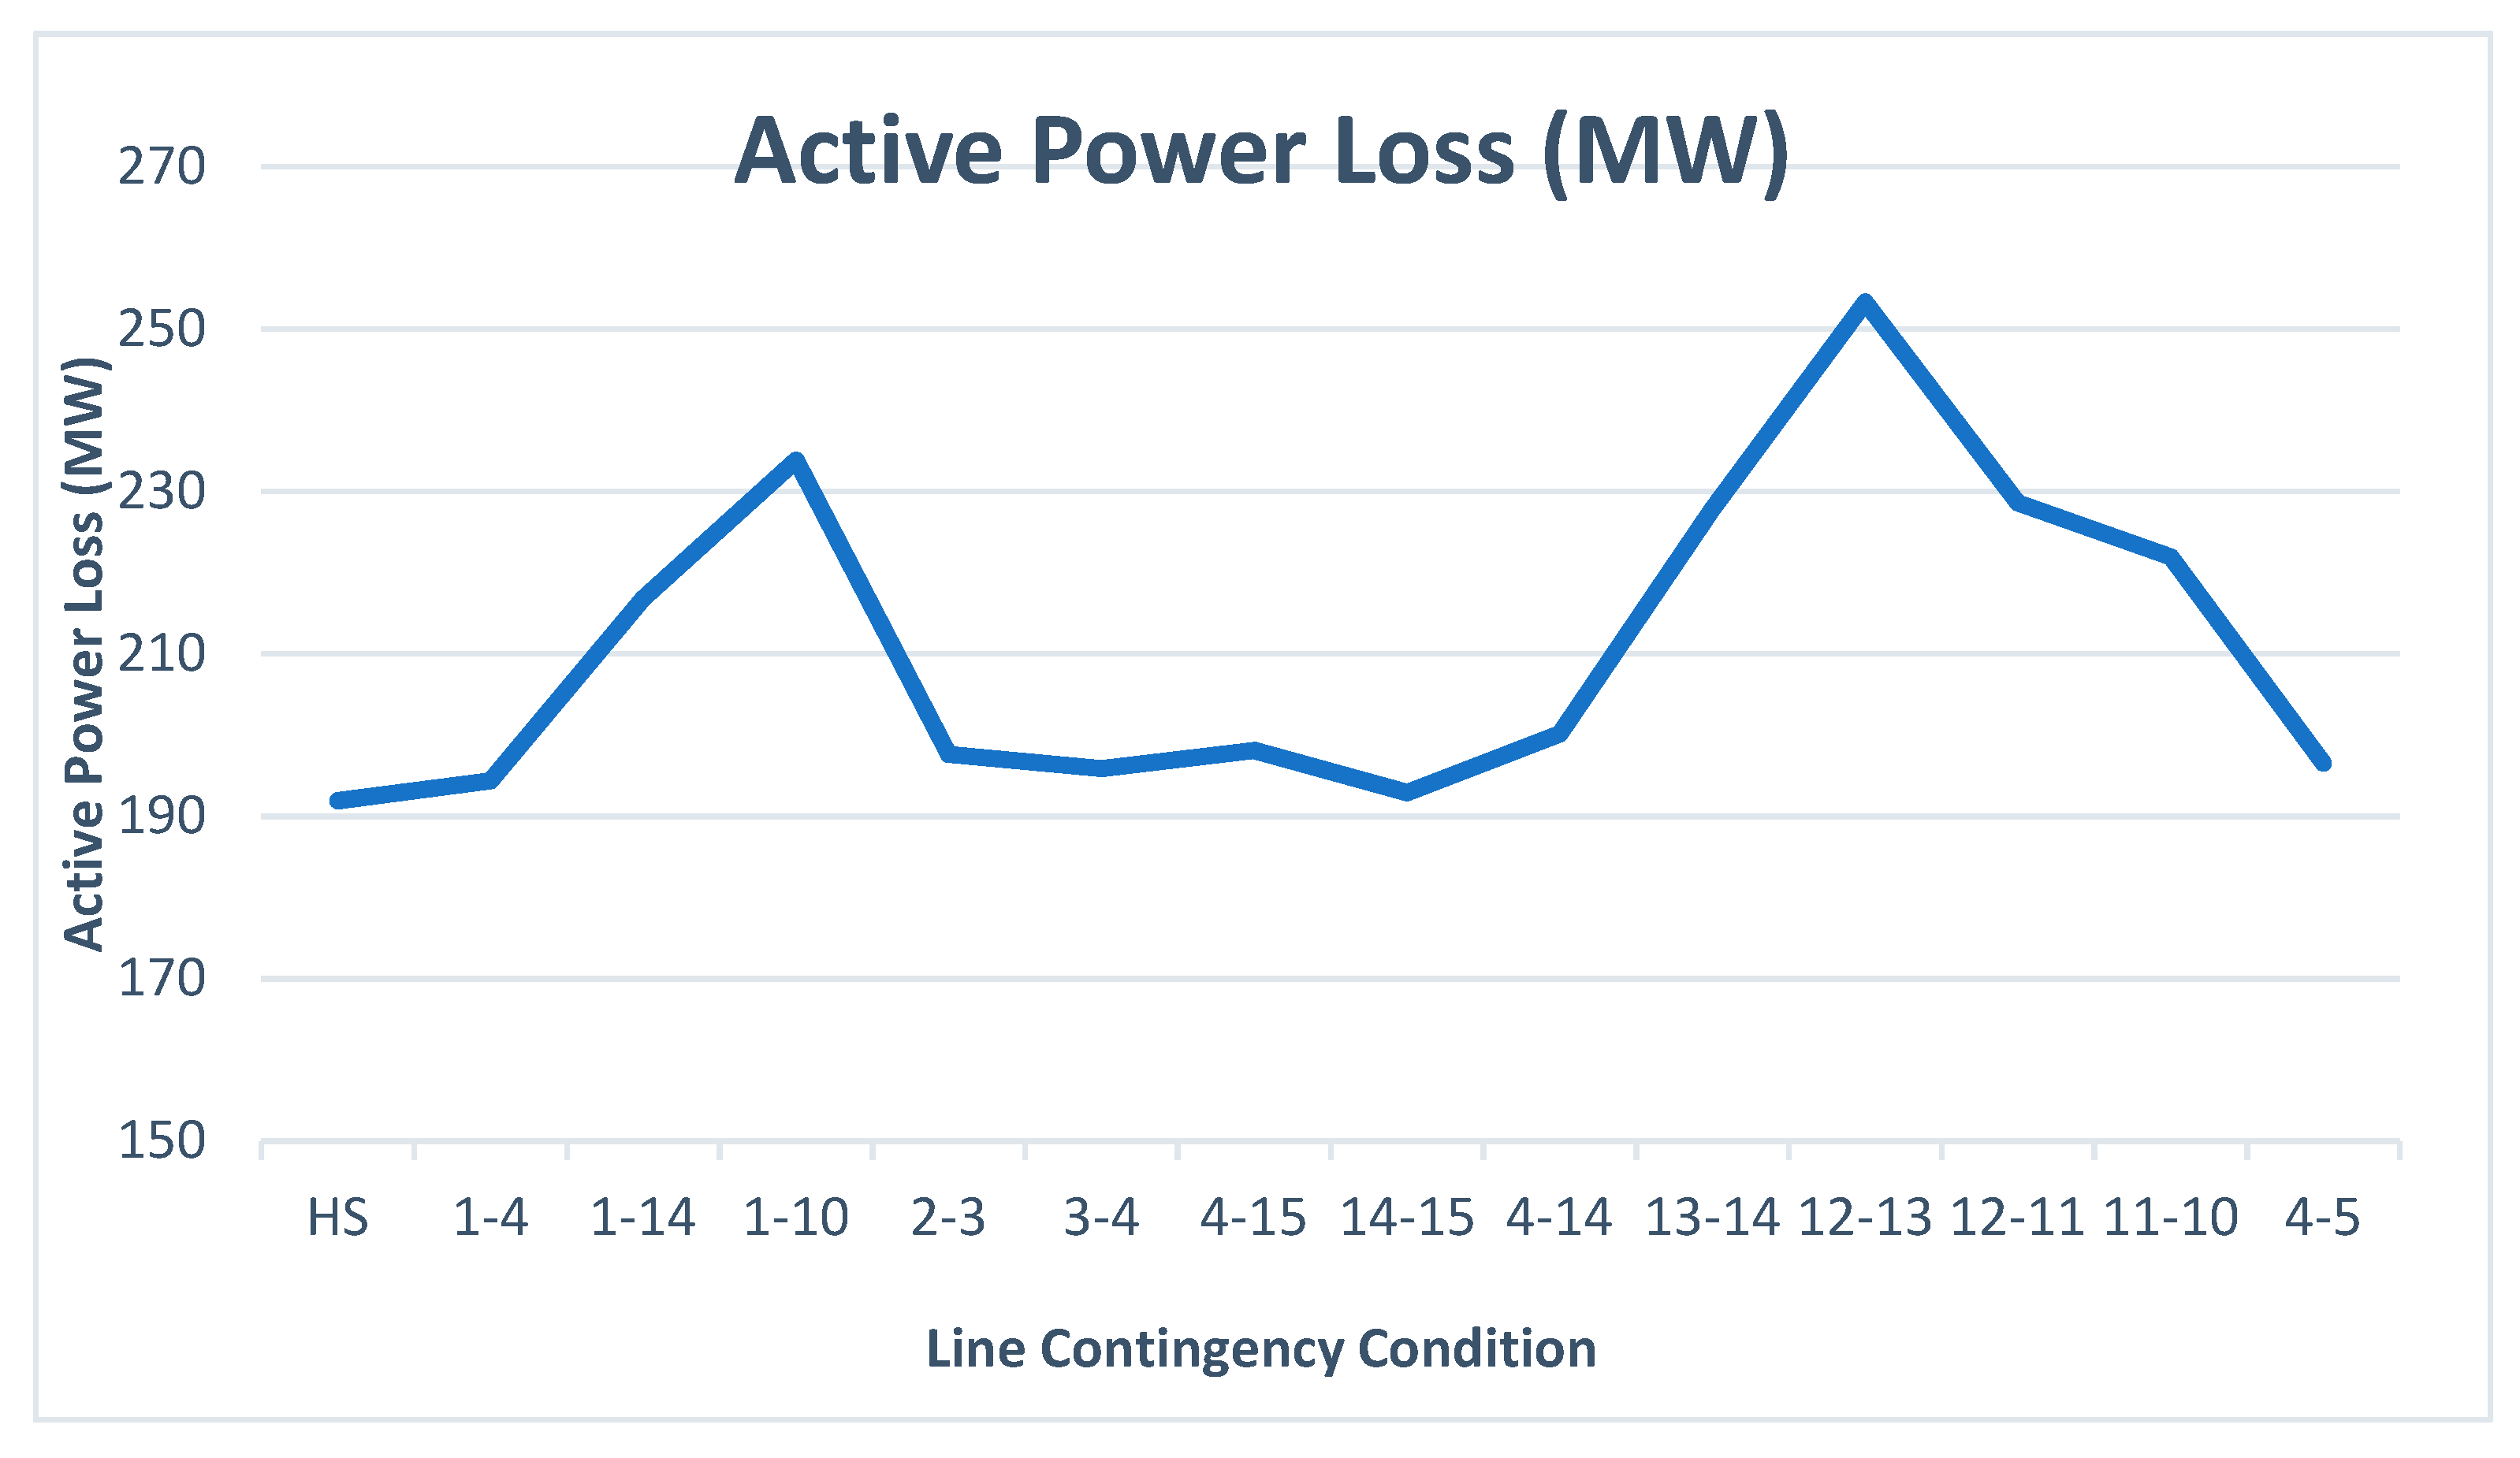
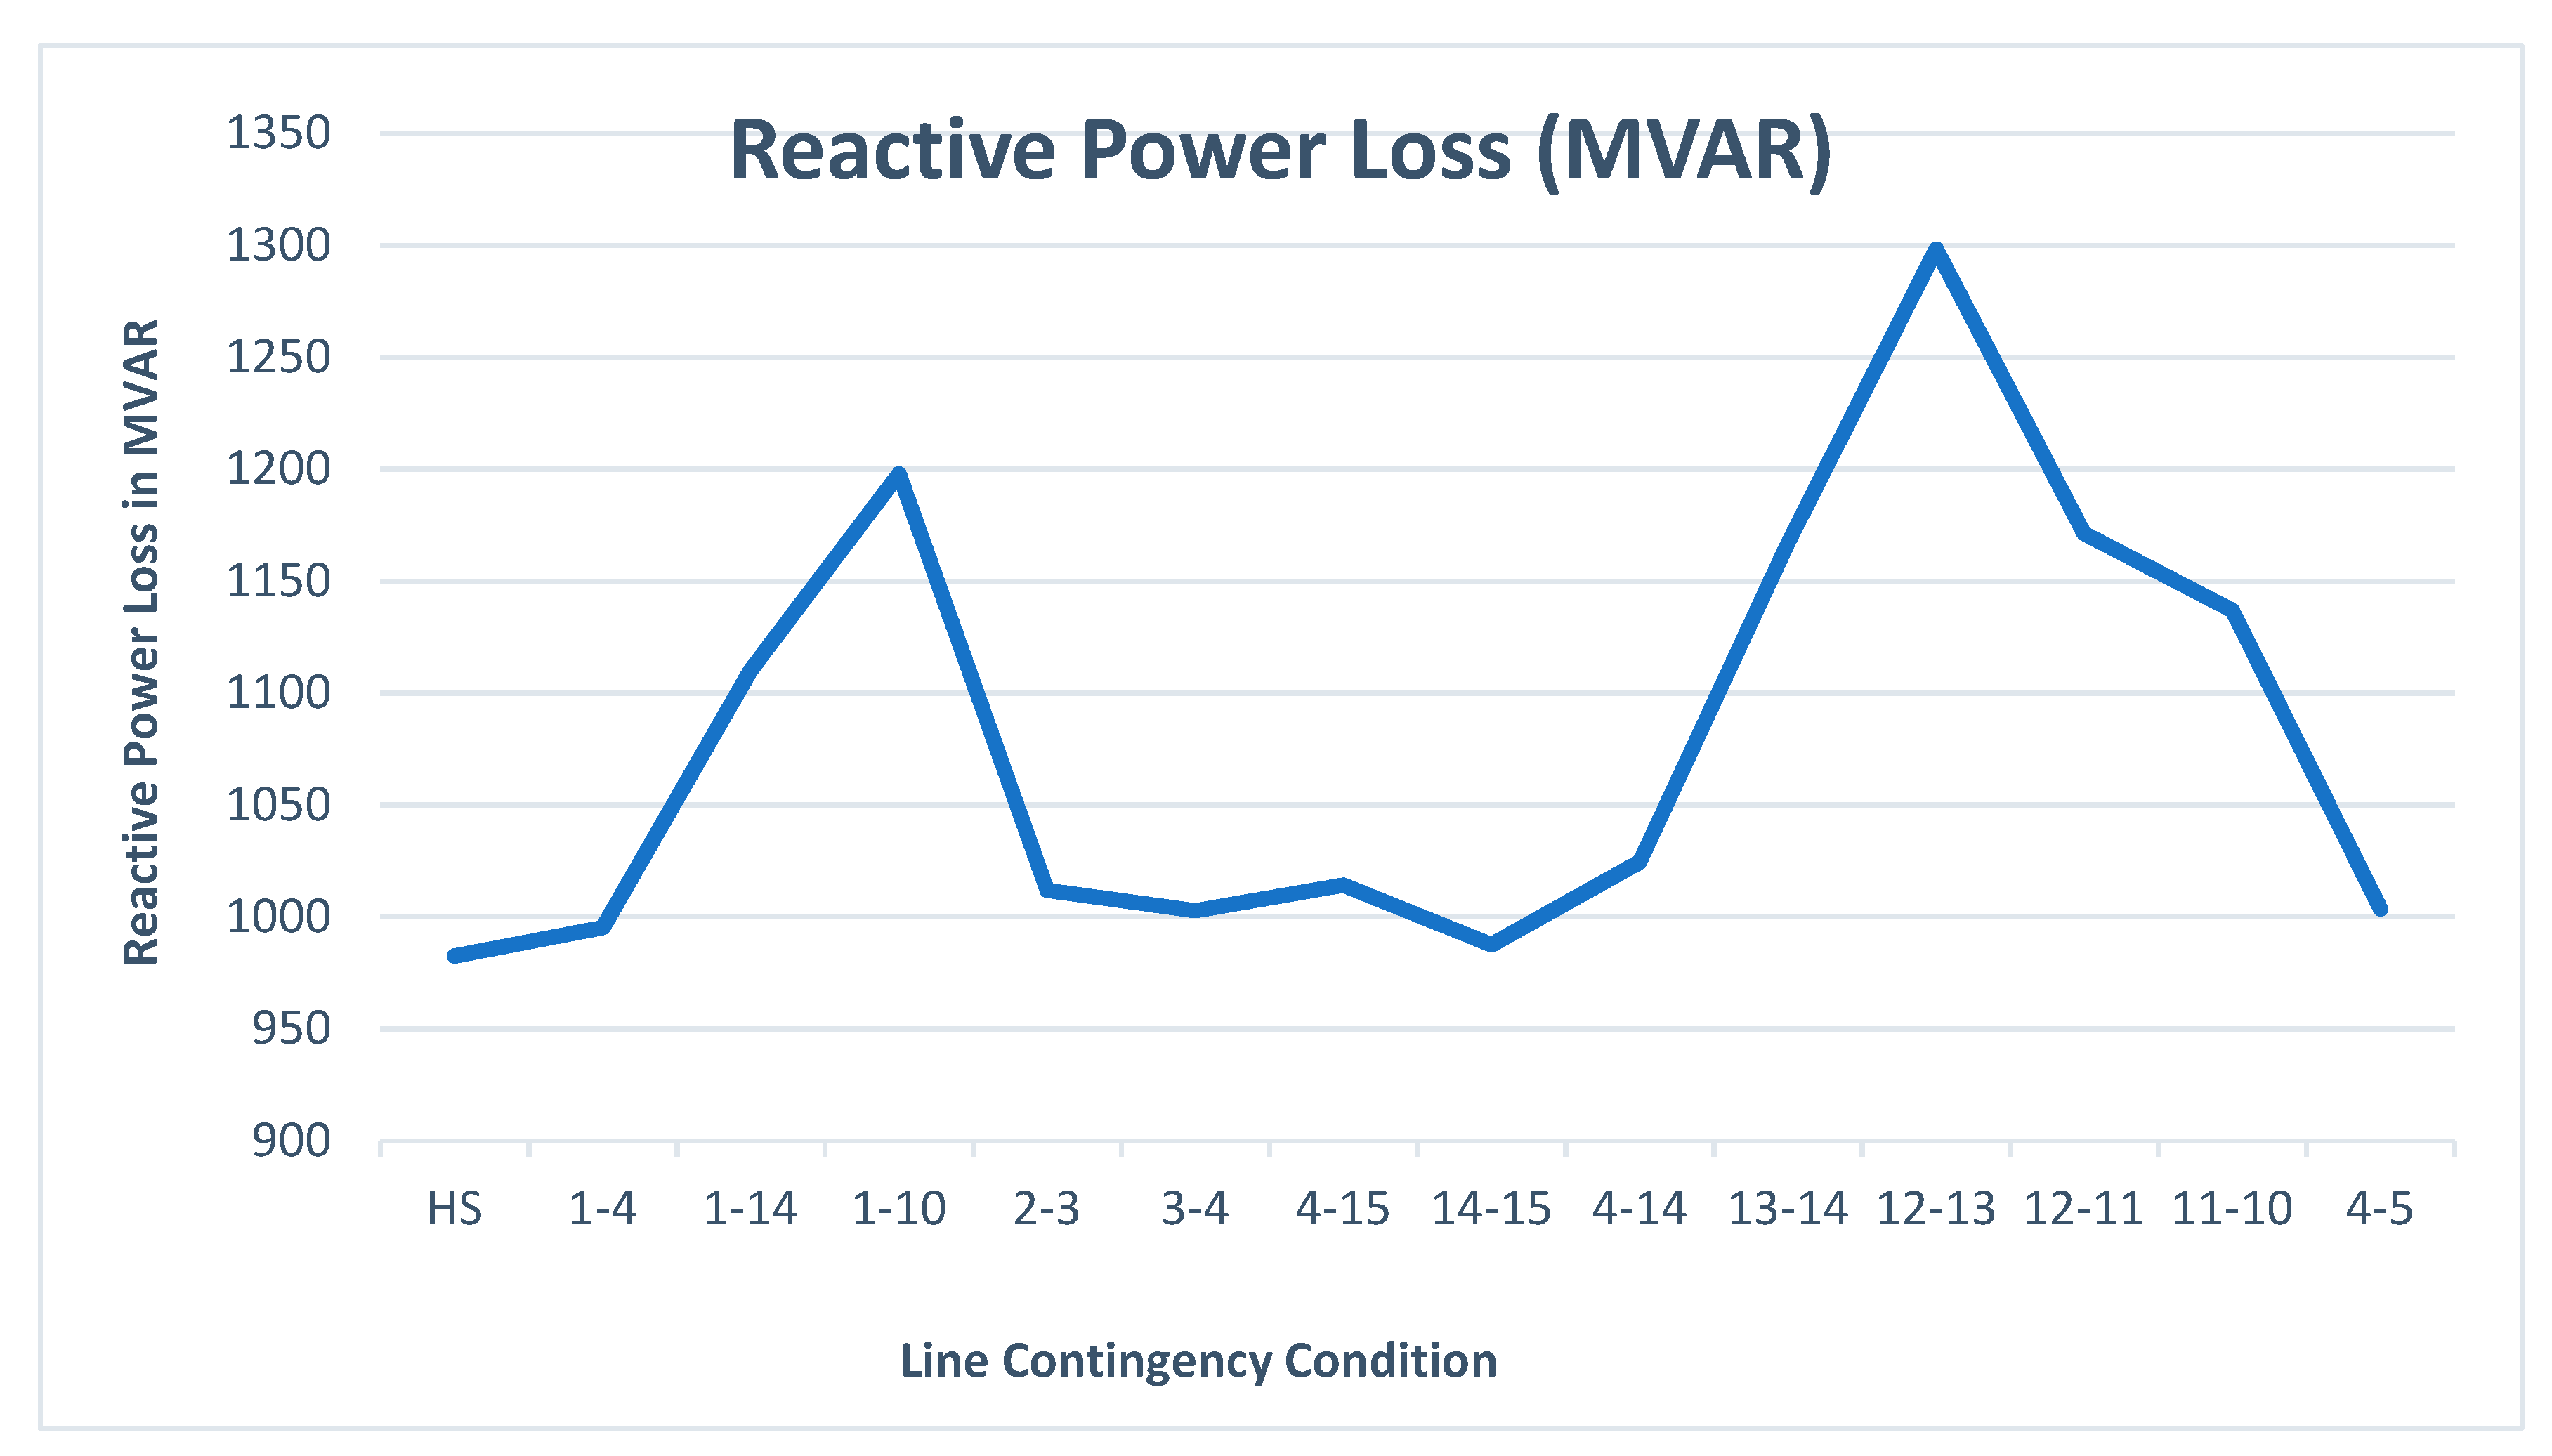
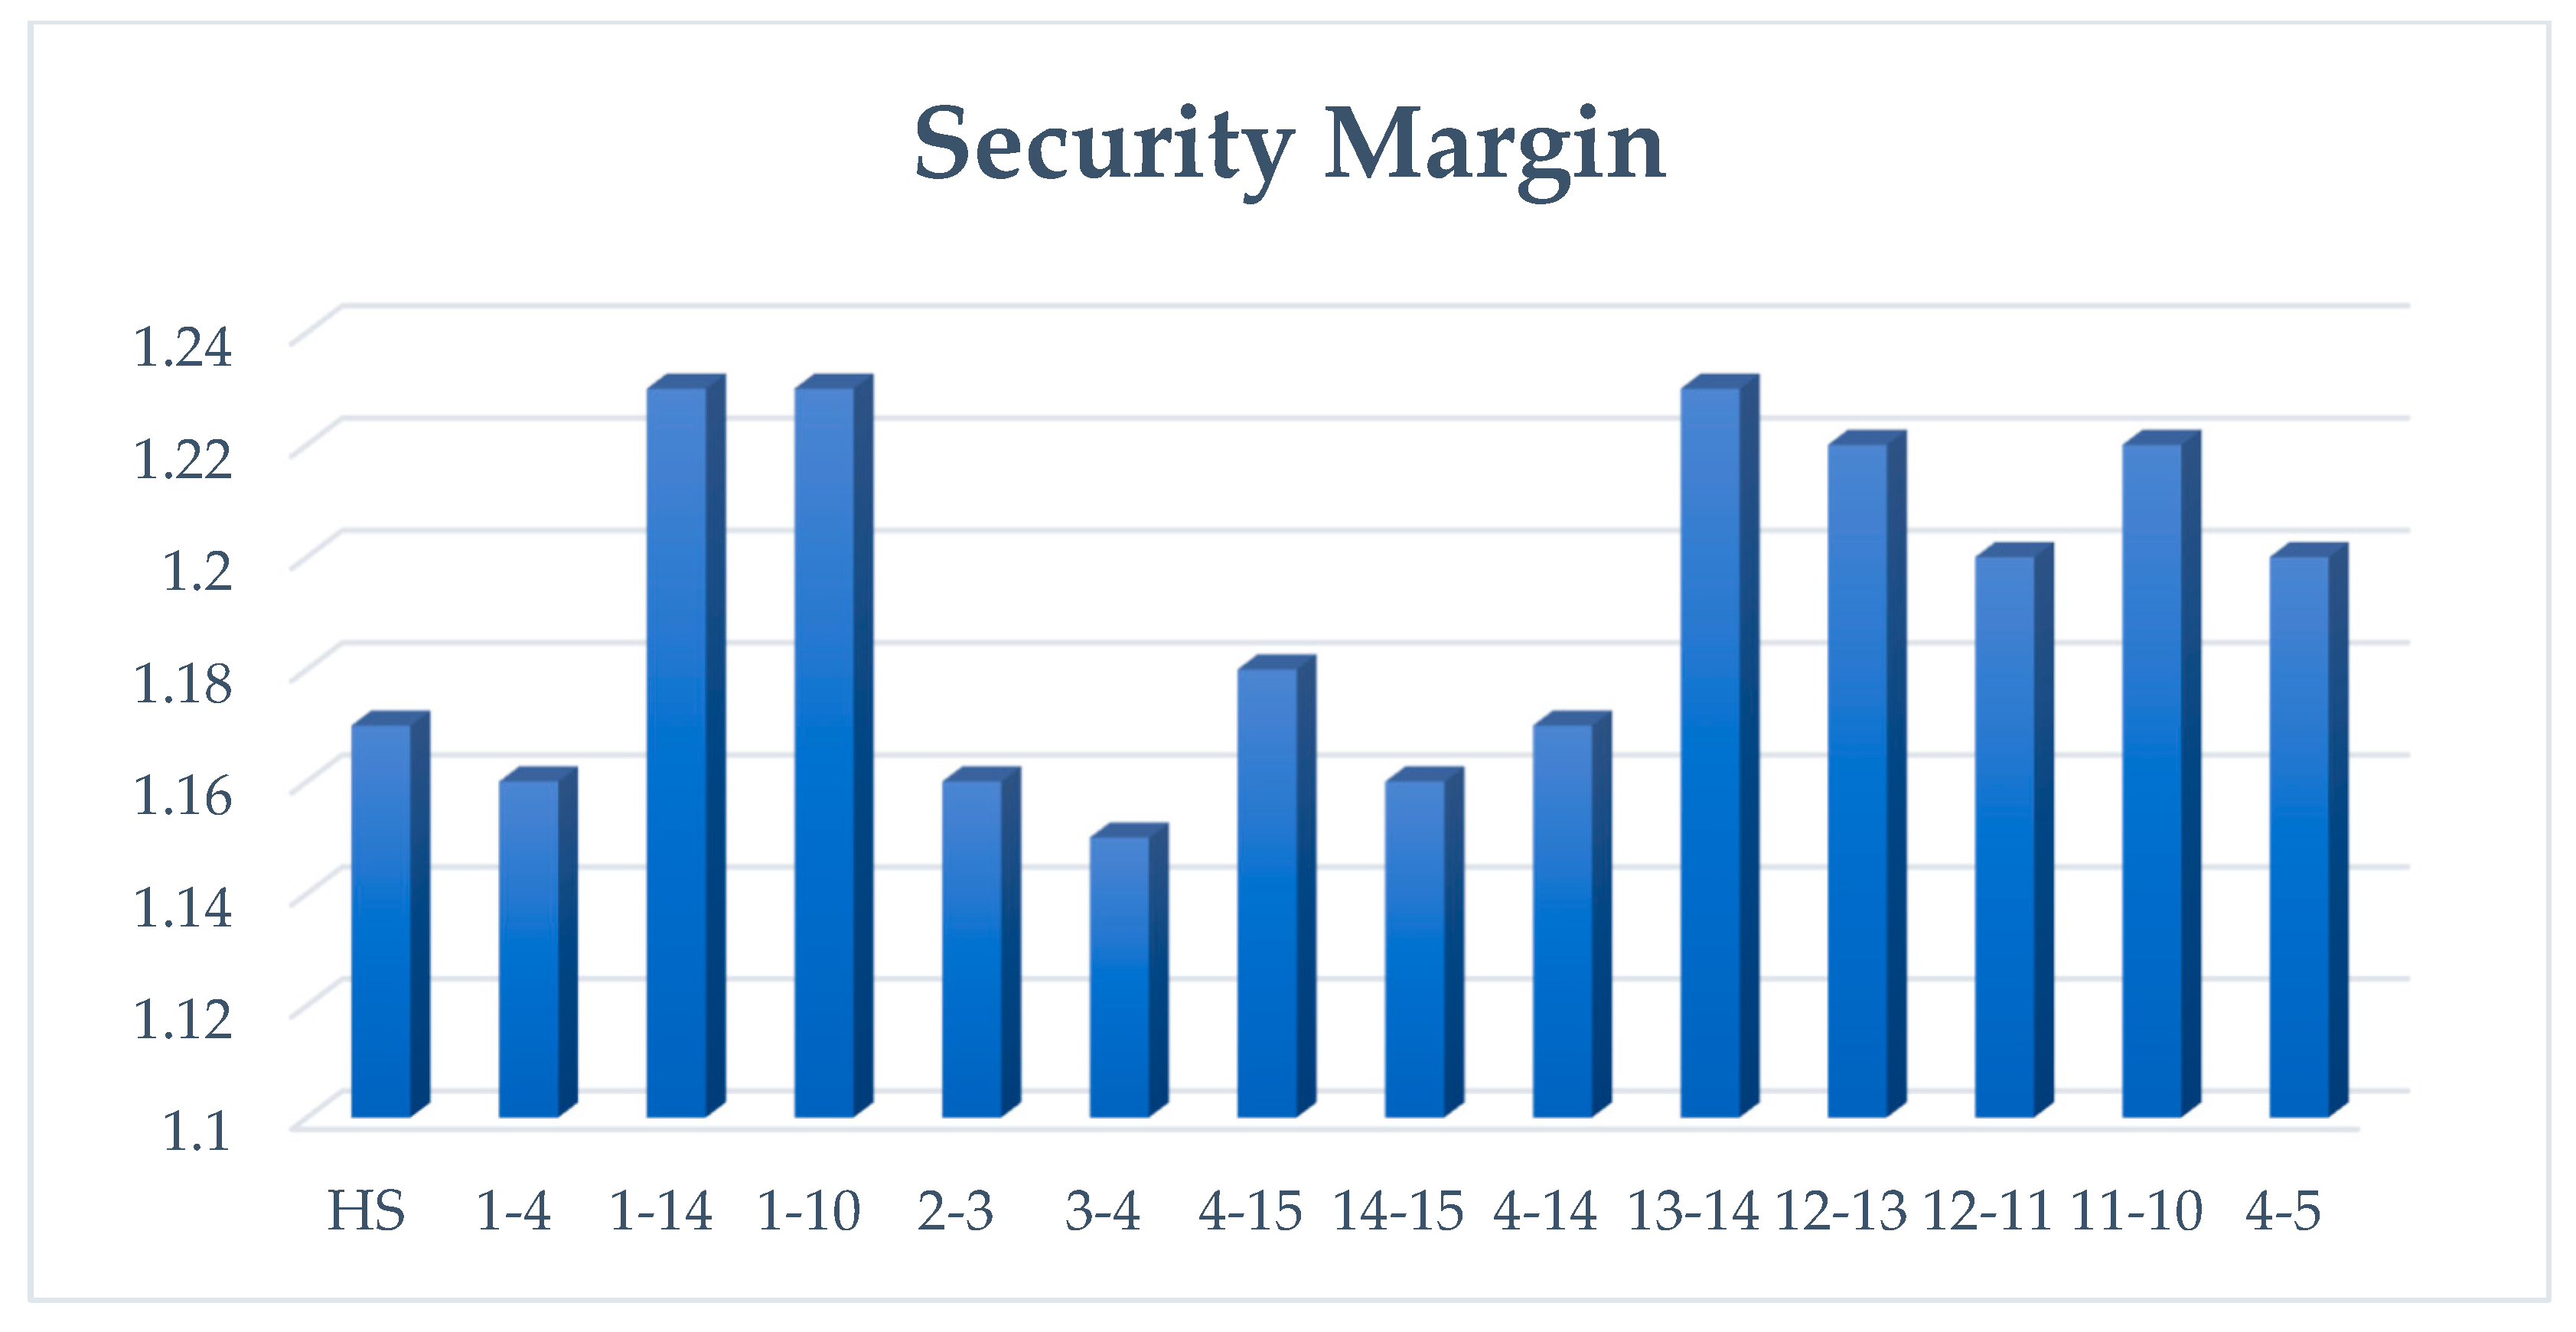
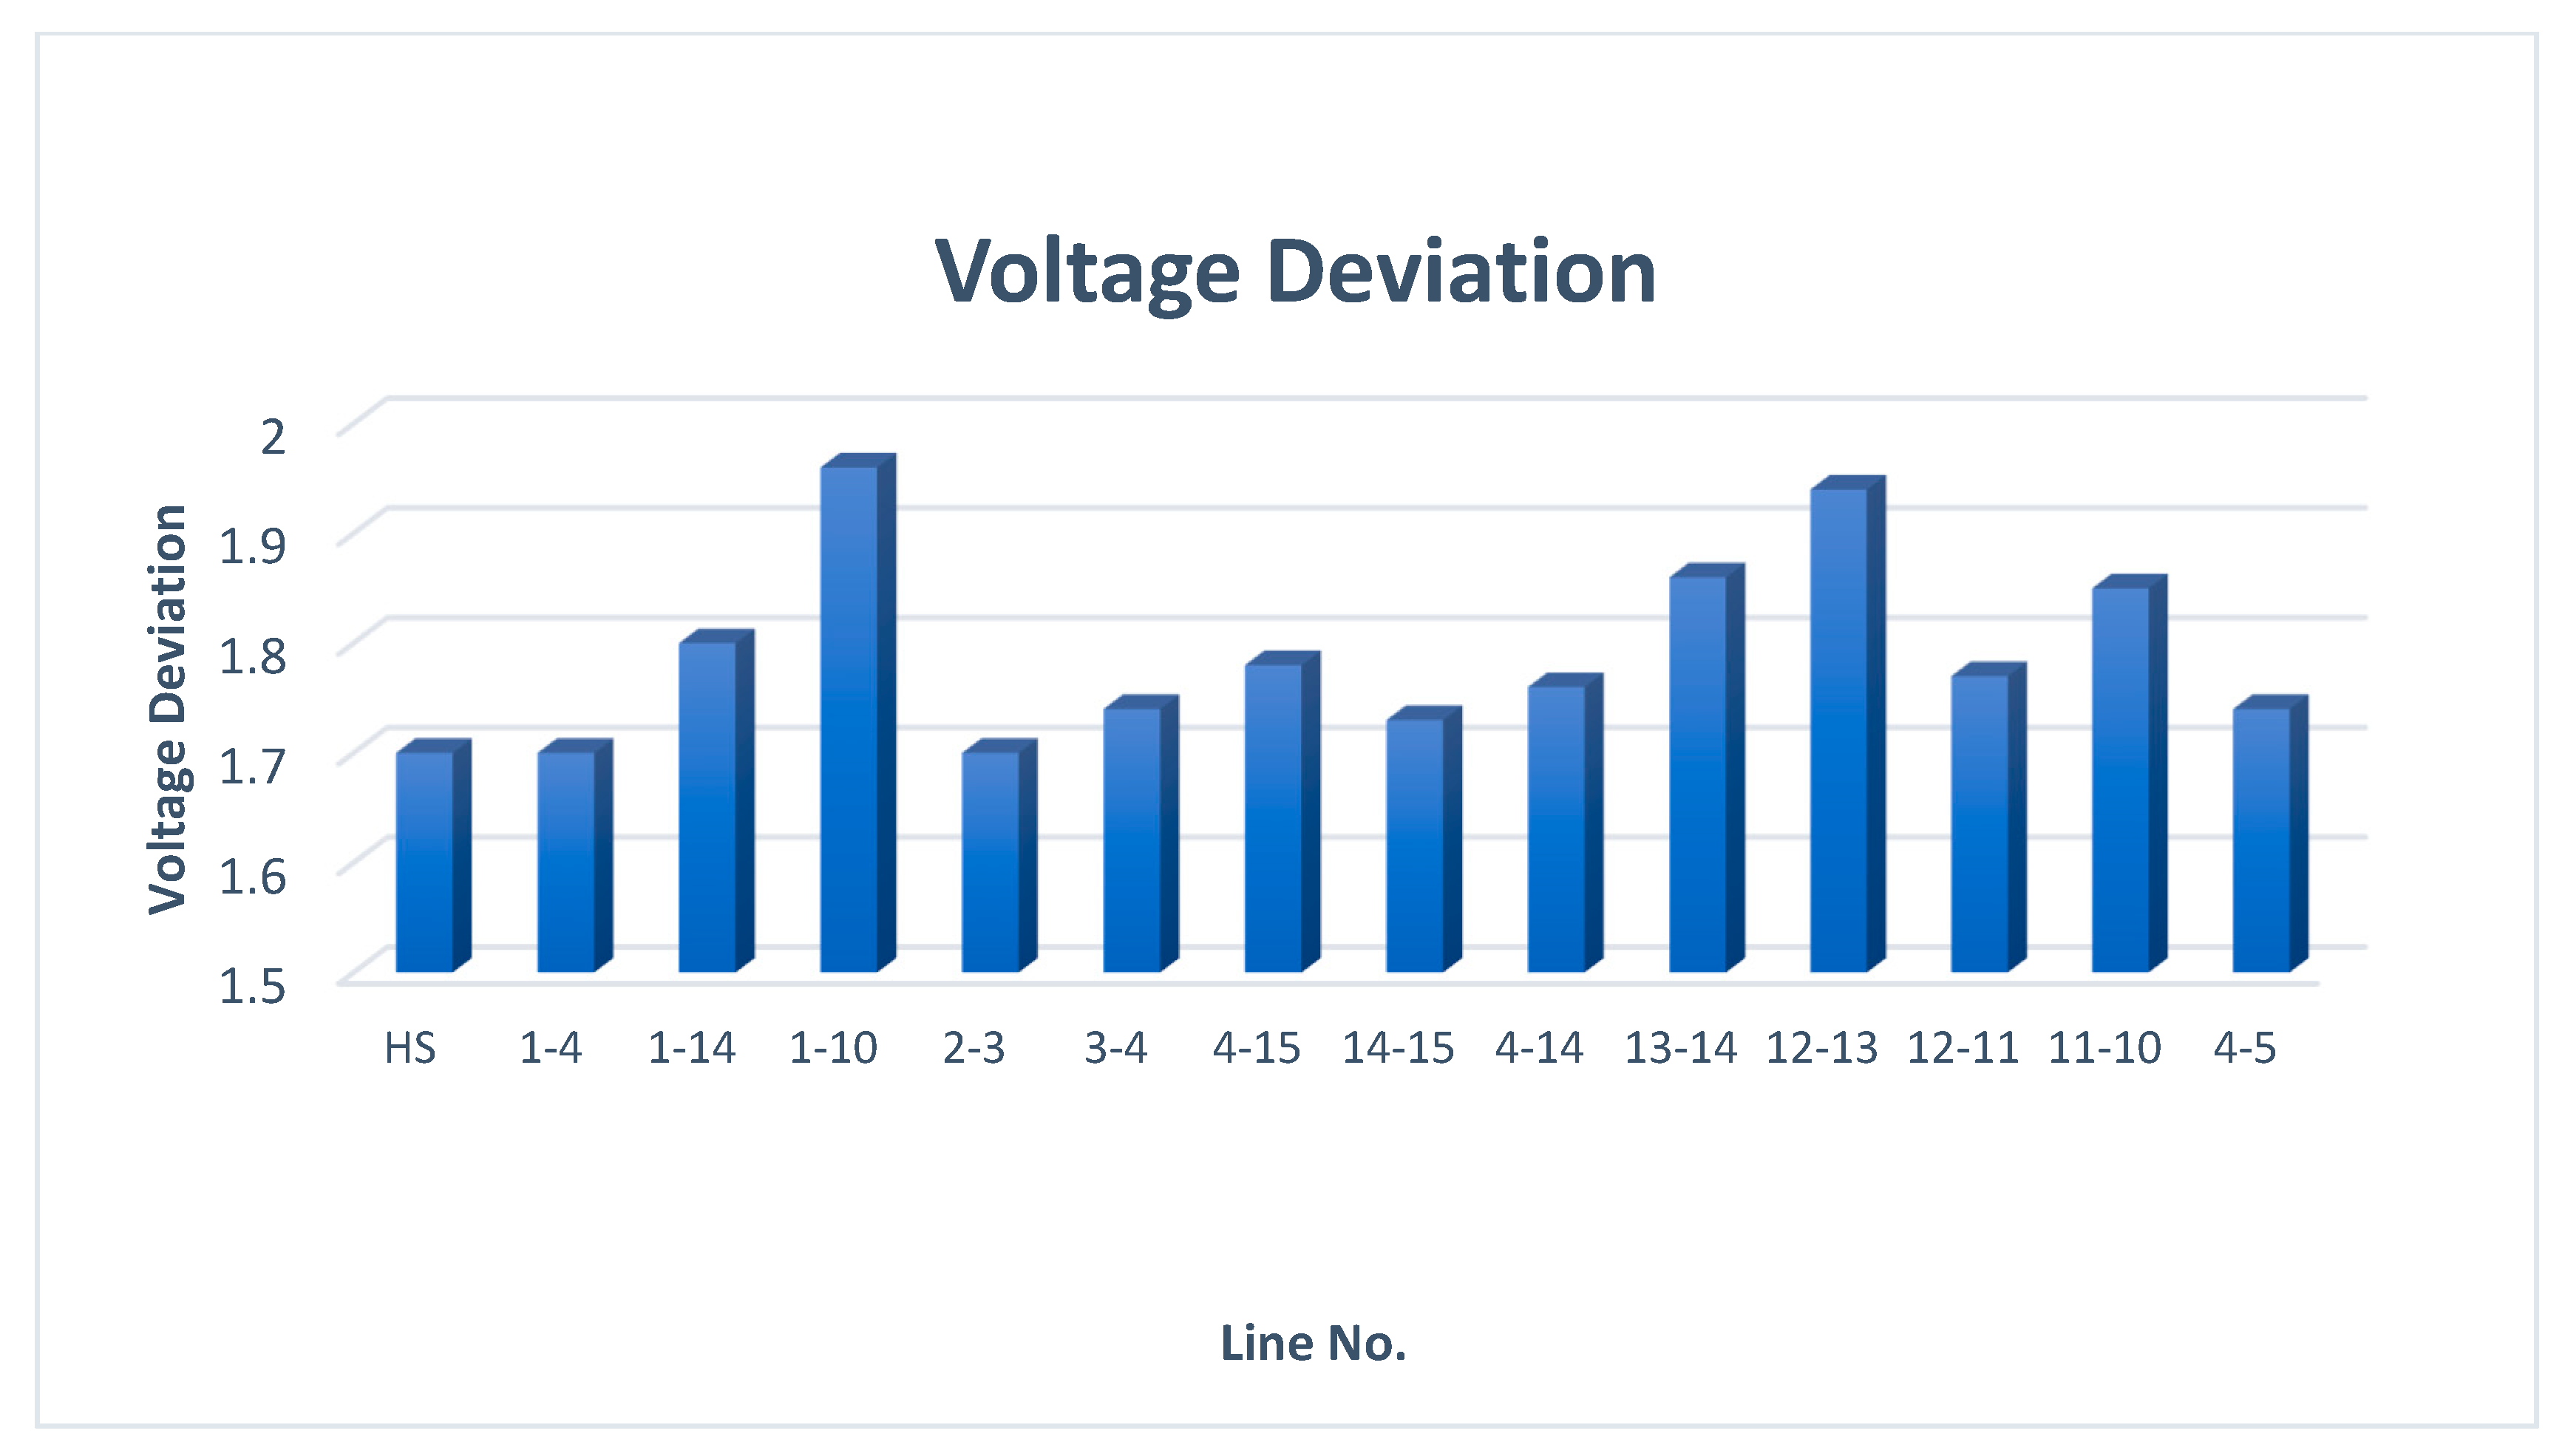
It is observed that the contingency of lines 12–13 is the most severe as it causes the maximum active and reactive power loss as seen in Figure 4 and Figure 5. The Security margin and voltage deviation of the system for lines 12–13 contingency can be observed in Figure 6 and Figure 7 respectively. It is observed that the security margin and the voltage deviation are also highly compromised in this condition. Therefore, the line 12–13 contingency condition is considered for the study. The system is studied in detail for lines 12–13 contingency as shown in Table 2. The line severity index for all lines is observed for the above contingency condition. The line severity index clearly indicates that lines 12–11 are the weakest lines of the system. Hence, it has been chosen for the placement of the first IPFC converter. The 2nd converter of the IPFC is placed on lines 12–20 based on DLUF [17]. Since most of the lines connected to buses 7 and 11 are found to be weak, the buses are identified as weak buses. Hence, the solar power unit of 2 MW each is installed in locations near bus 7 and bus 11.
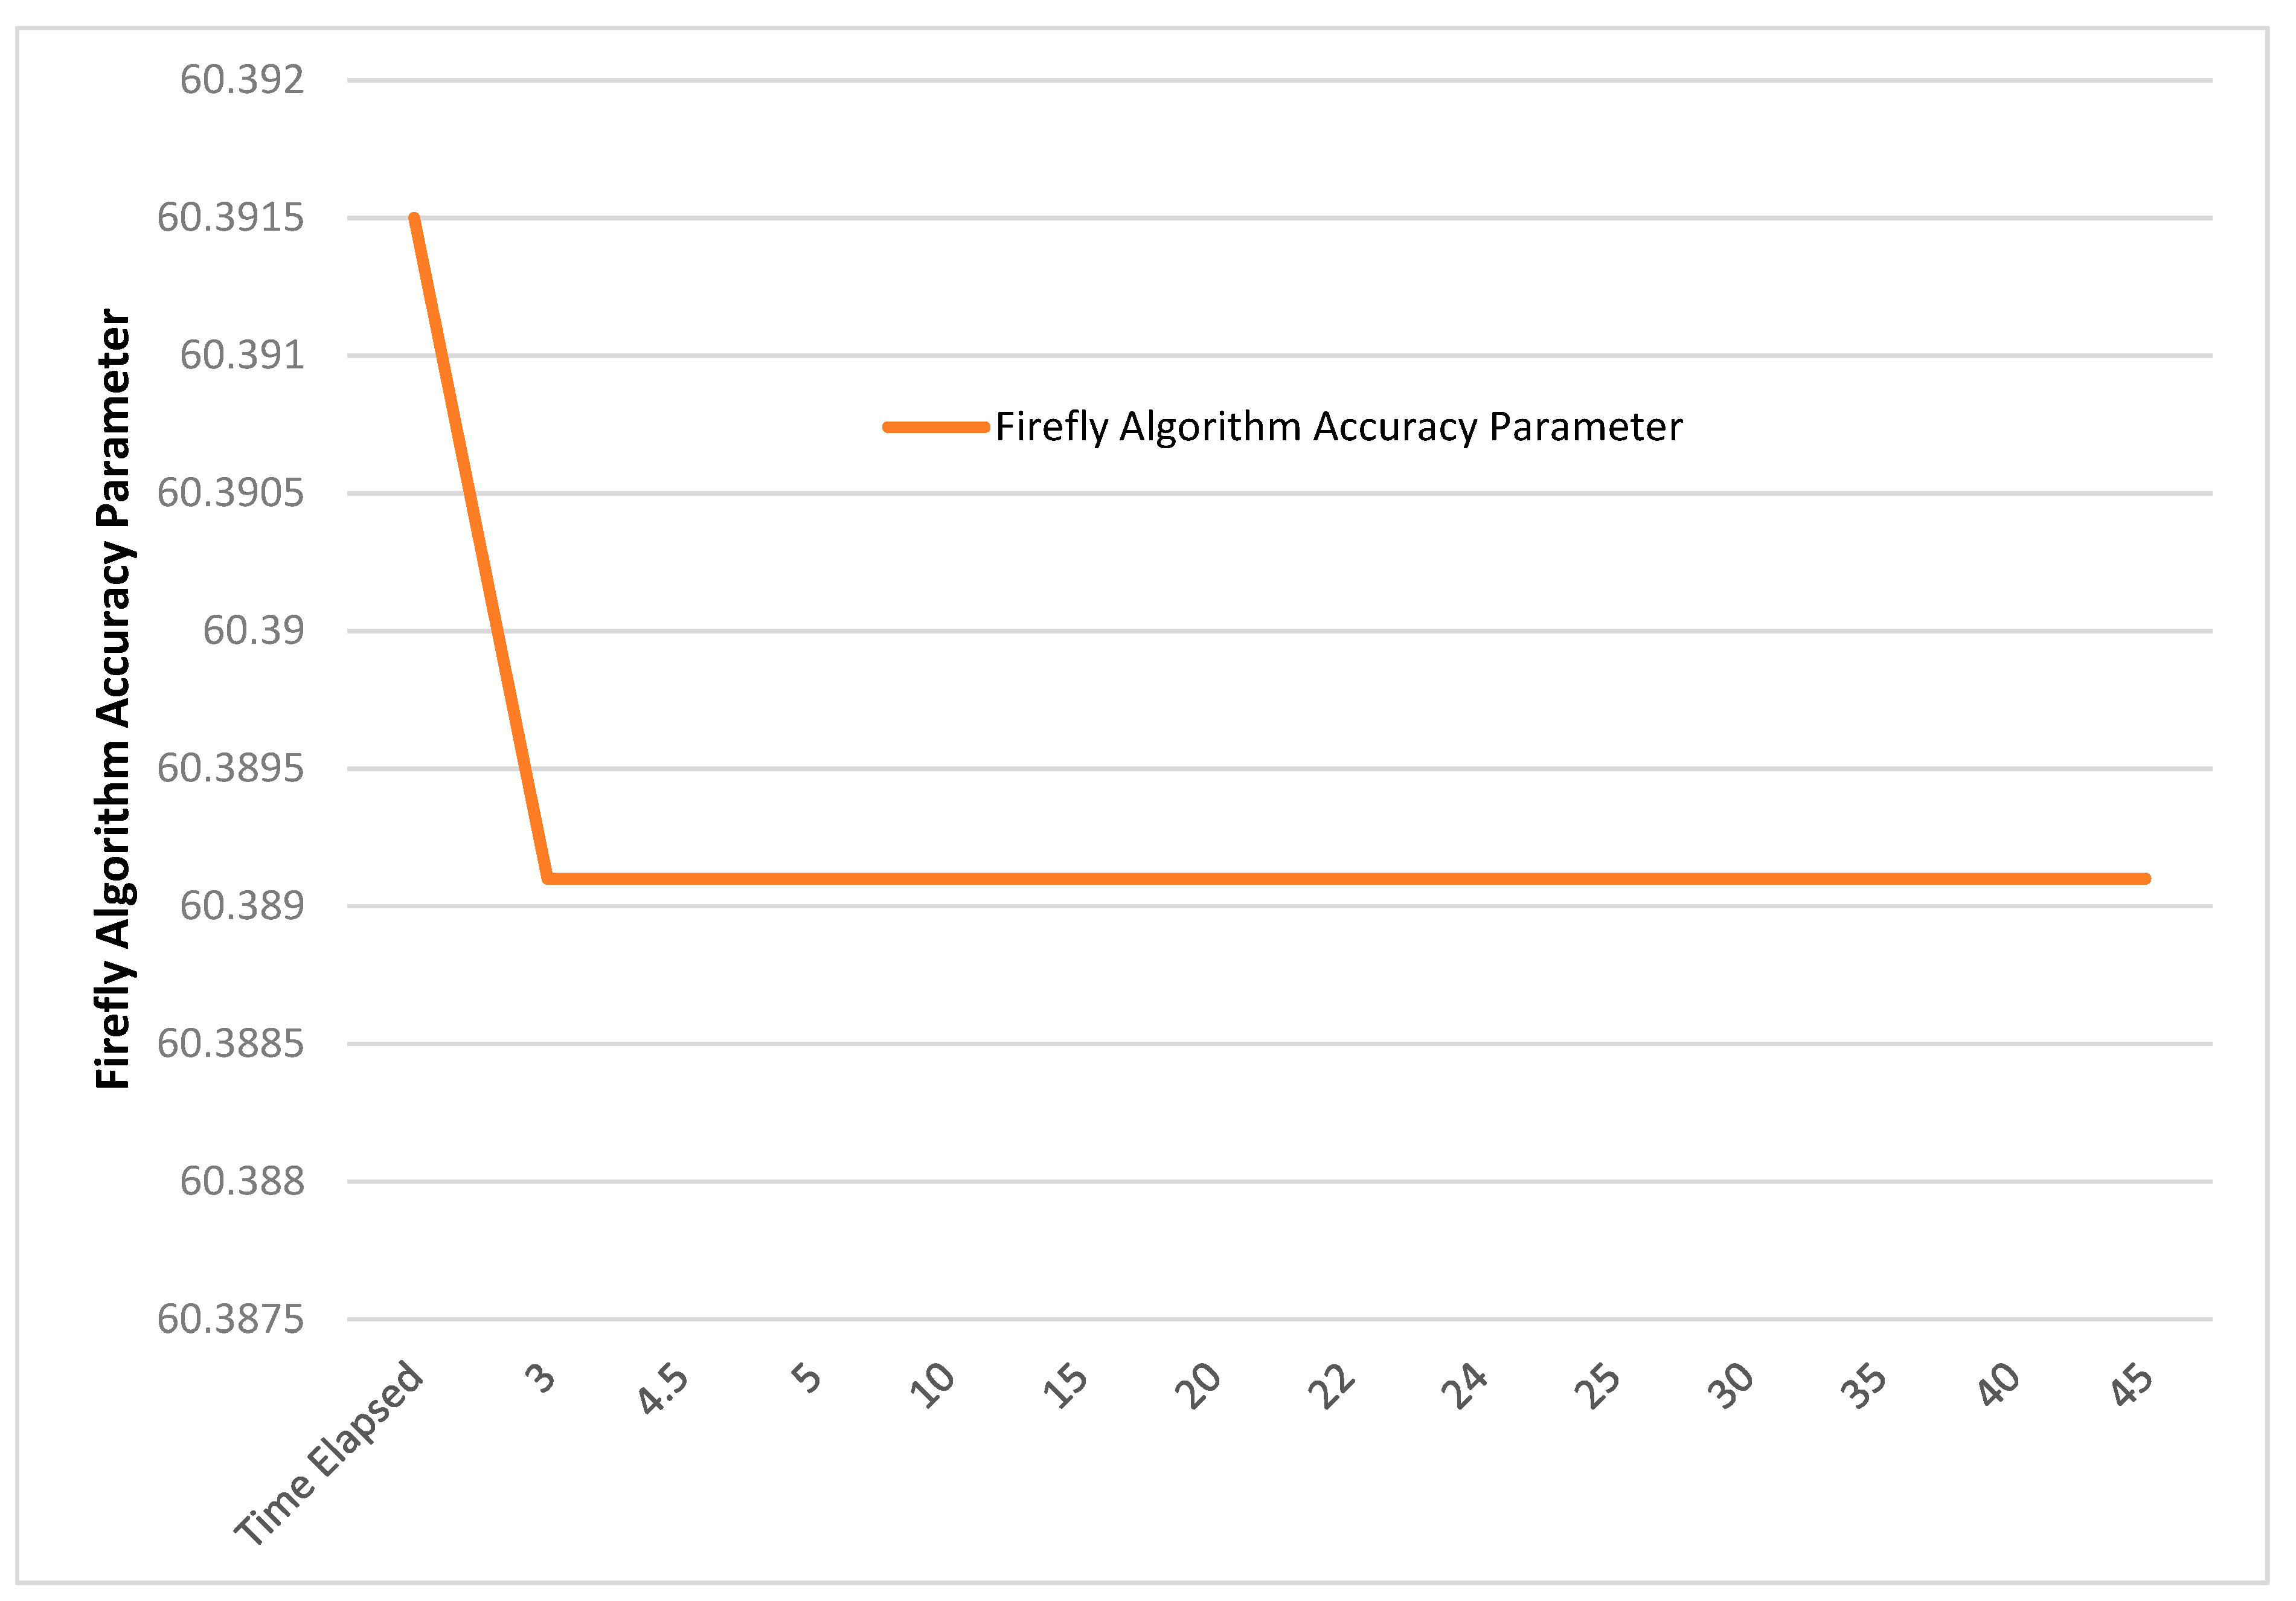
The solar integrated system is then analyzed for contingency conditions with and without IPFC. The tuning of IPFC has been performed using the Firefly algorithm [18]. The time elapsed for the tuning is 232.59 s. The improvement in the accuracy in result by Firefly Algorithm is shown in Figure 8. The figure shows that the accuracy level has been achieved in less than 5 s.
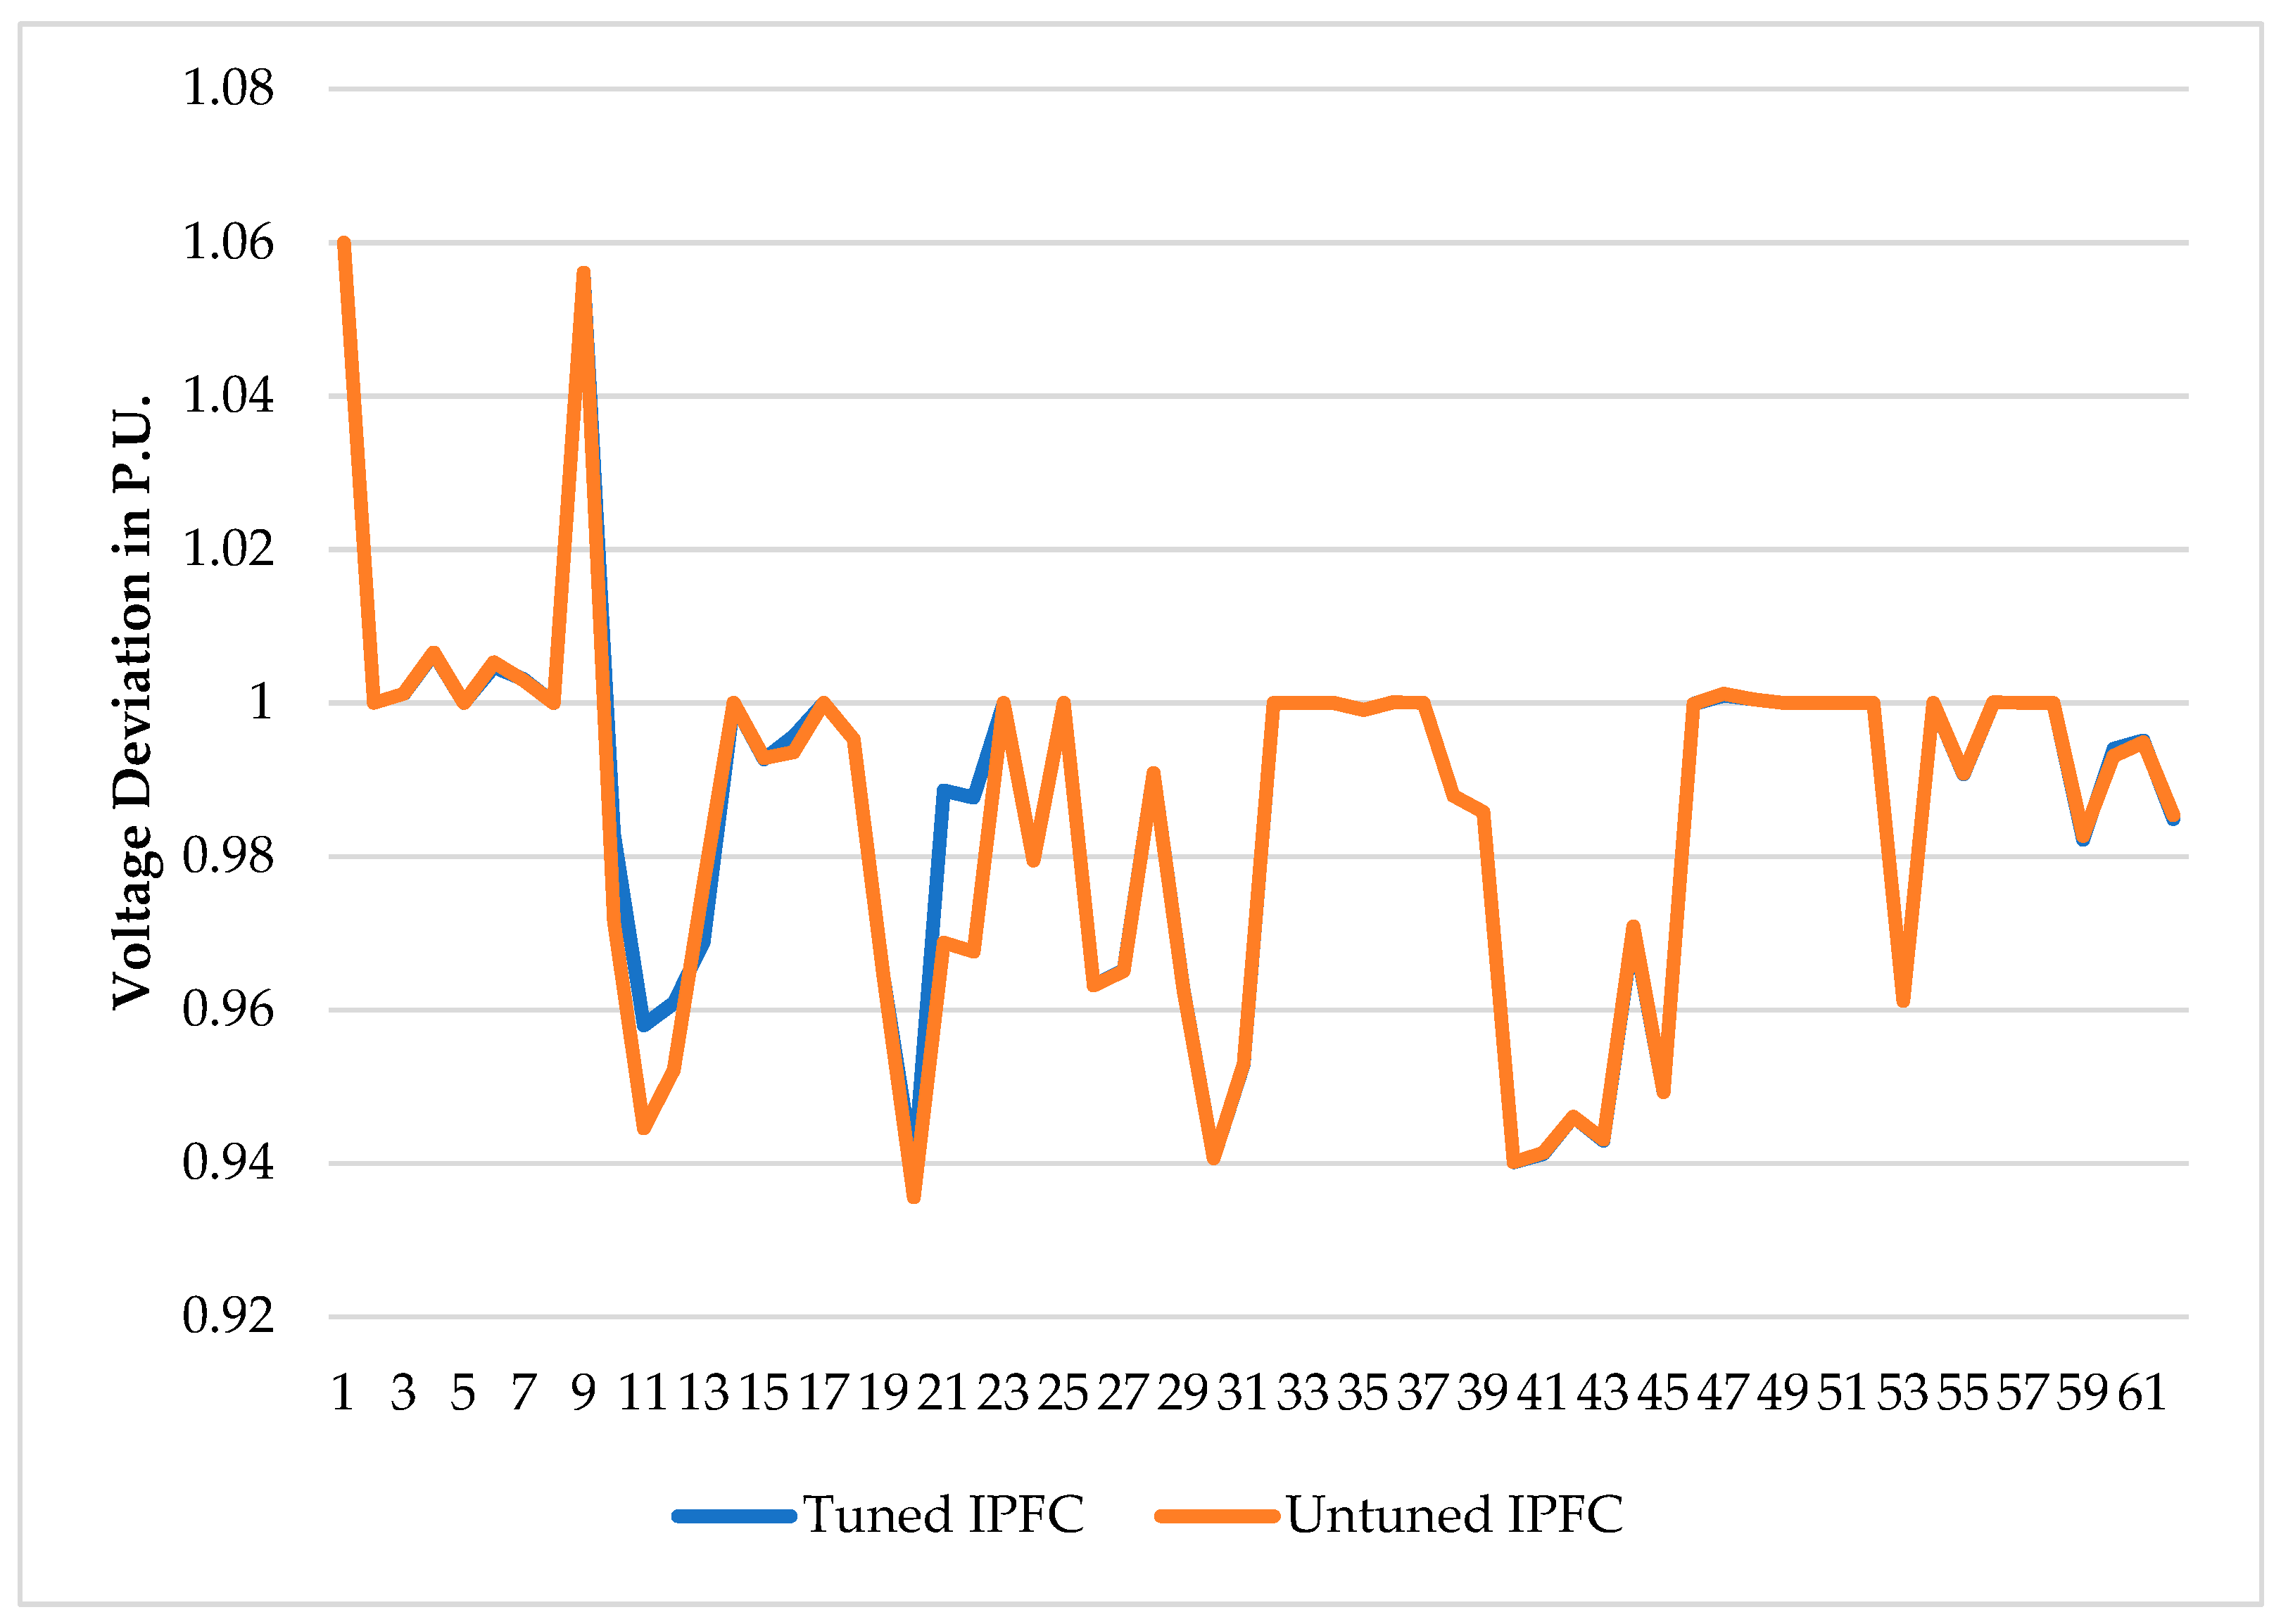
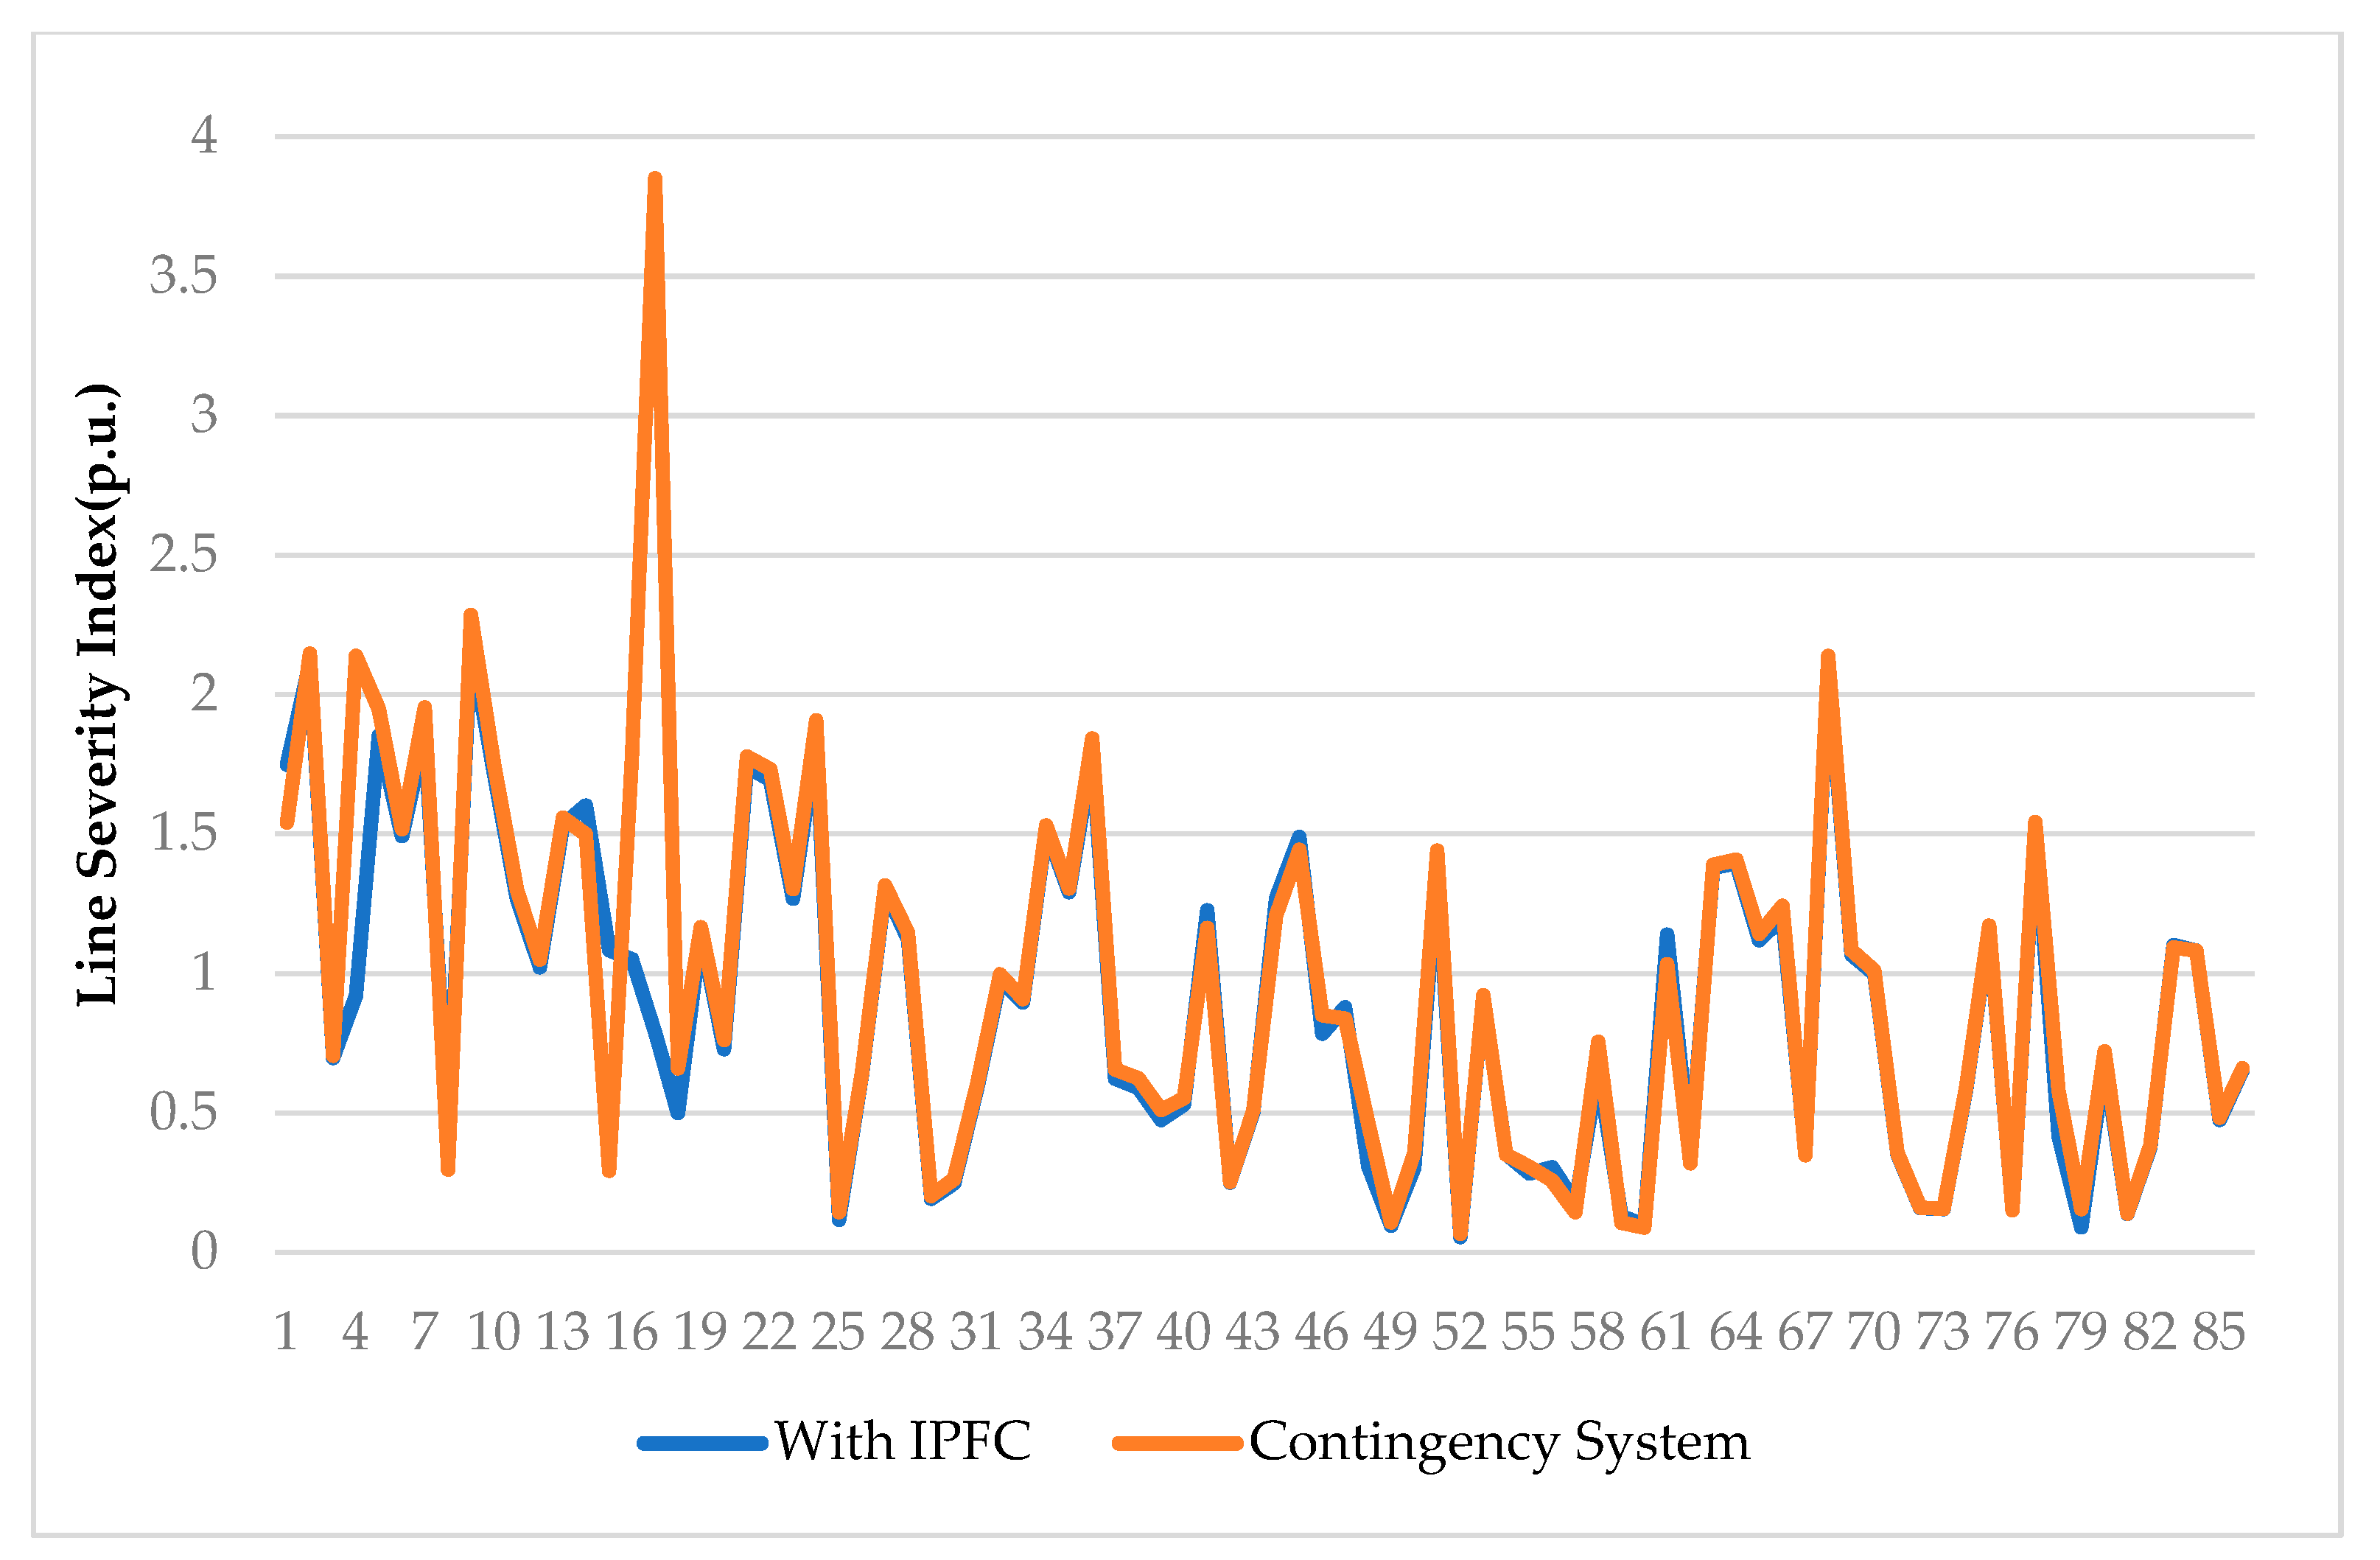
The comparison of the performance of the system has been presented in Table 3. It is observed that the losses for the system are reduced for the integrated system with IPFC. Figure 9 indicates that the voltage deviation is least for a tuned IPFC placed in the integrated system. The line severity index in Figure 10 shows the reduction in the severity of the system after the placement of IPFC in the integrated system.

IEEE 57 Bus System

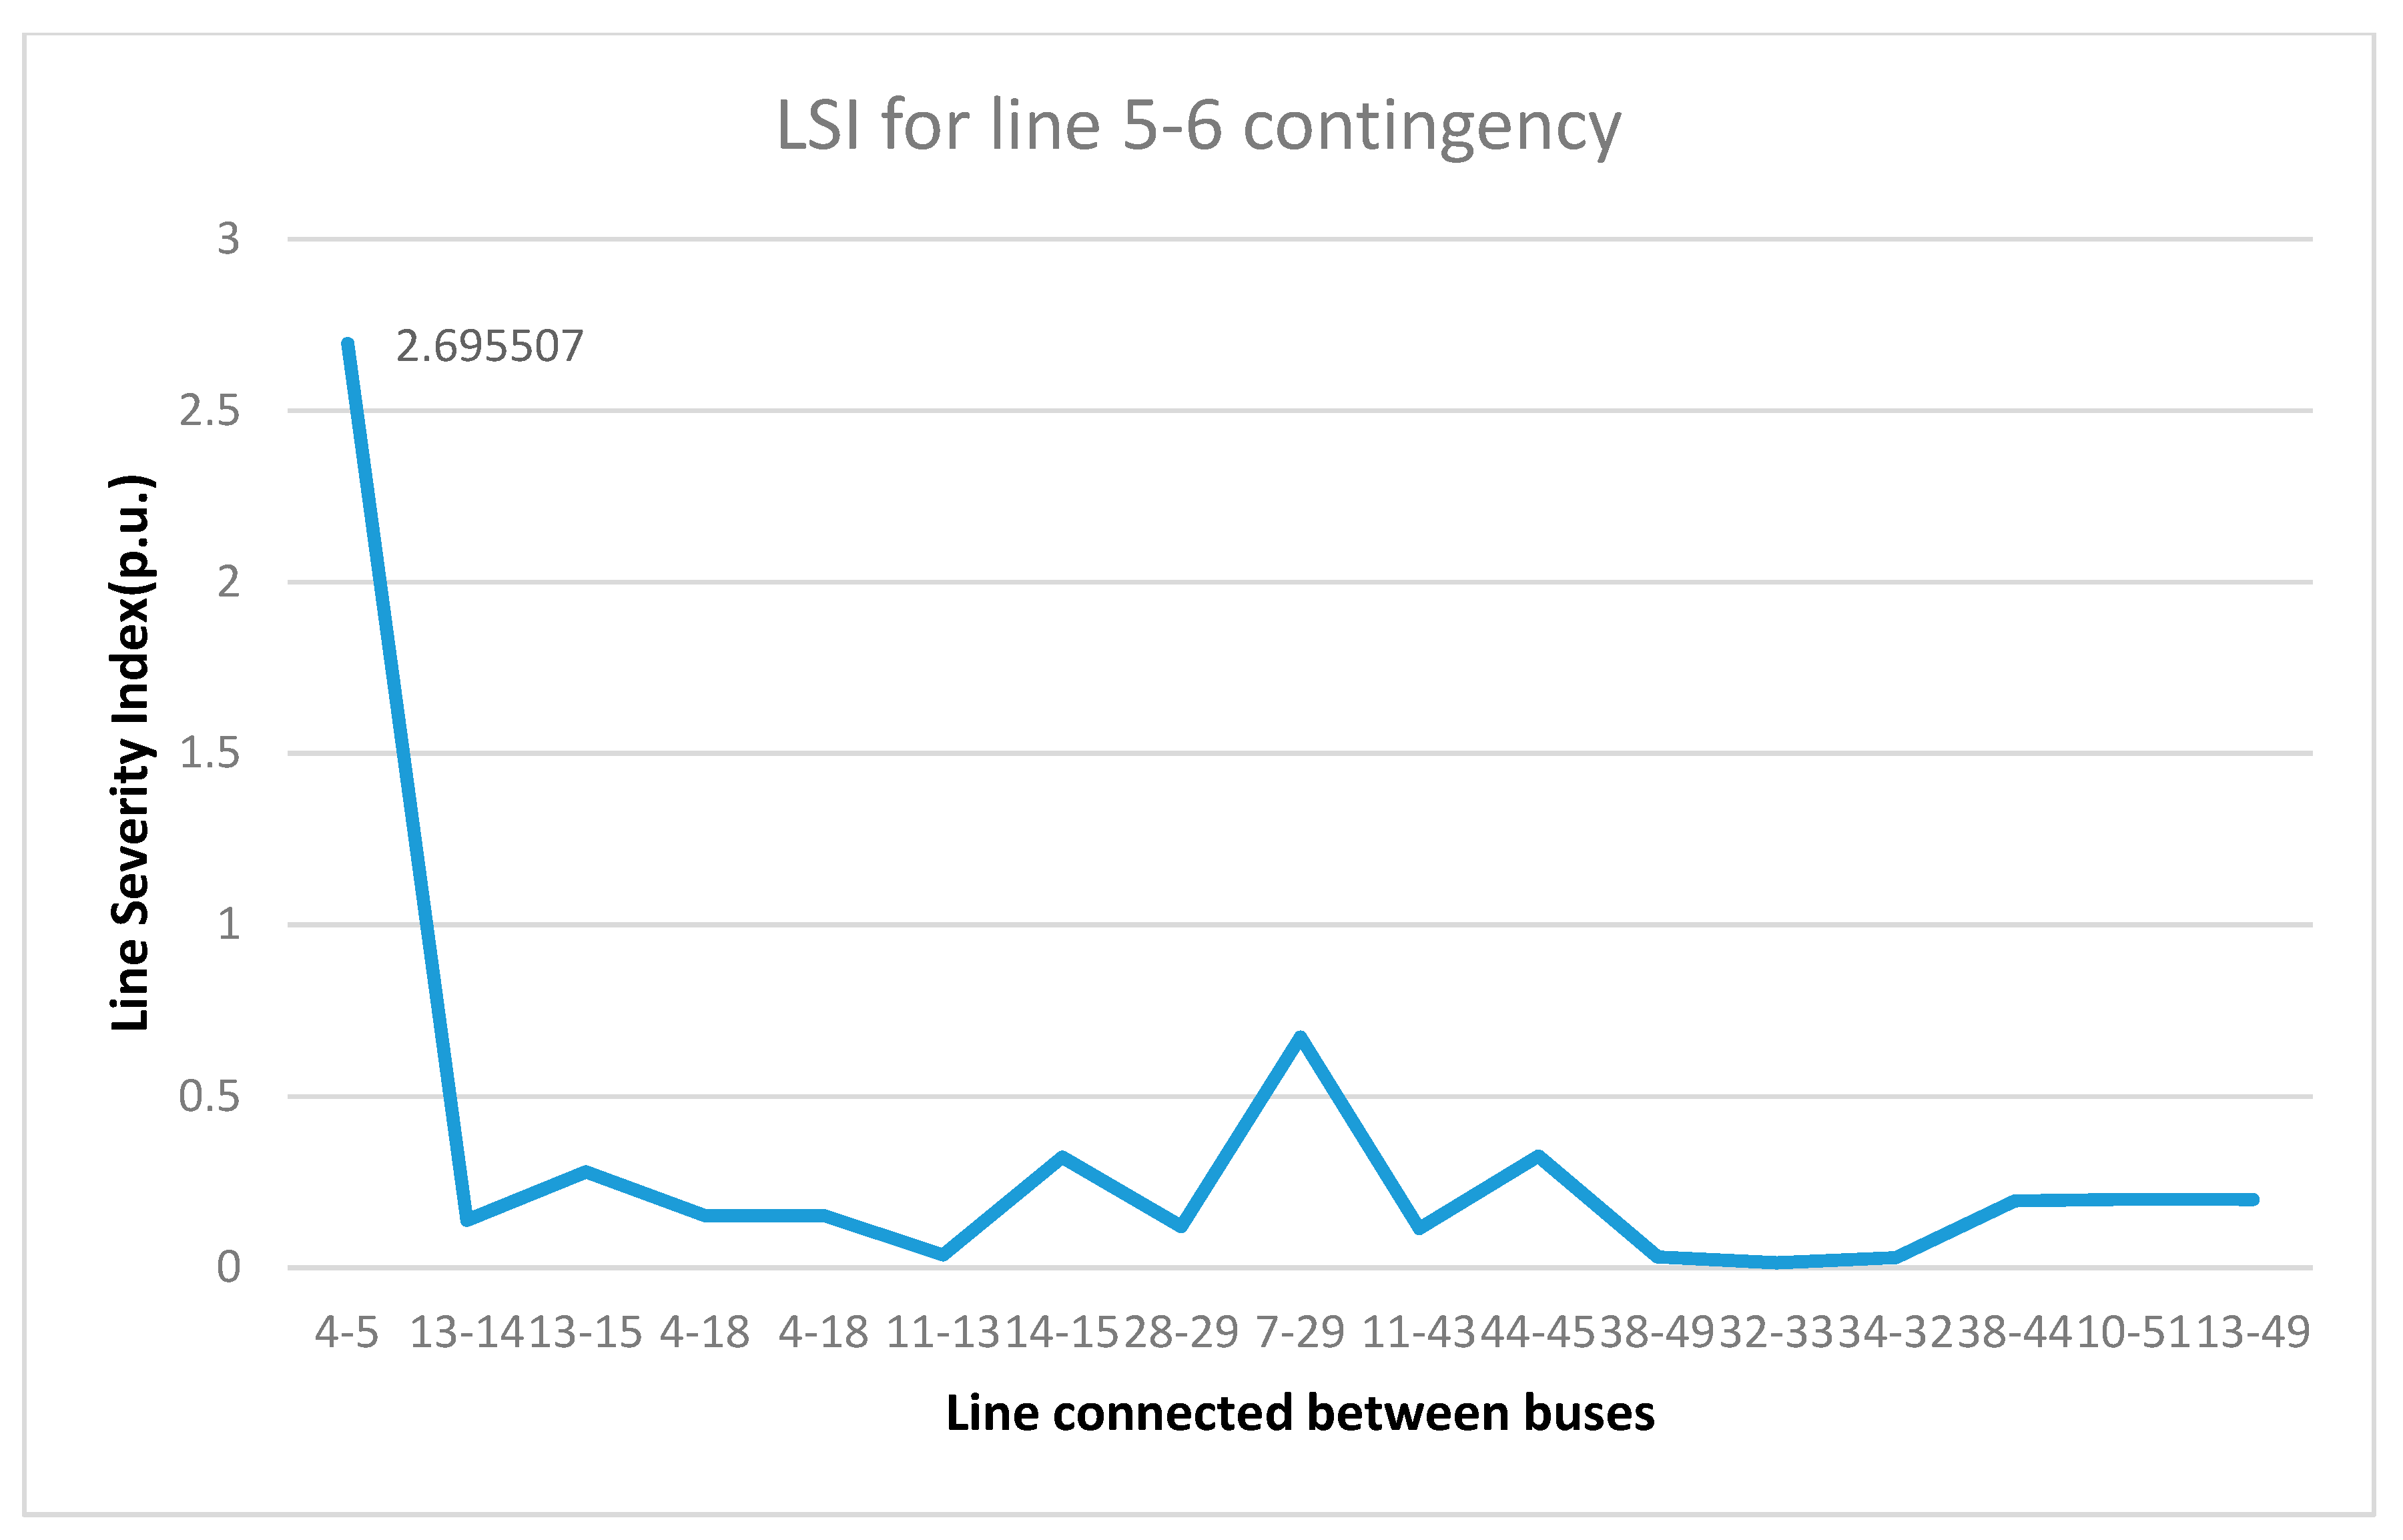
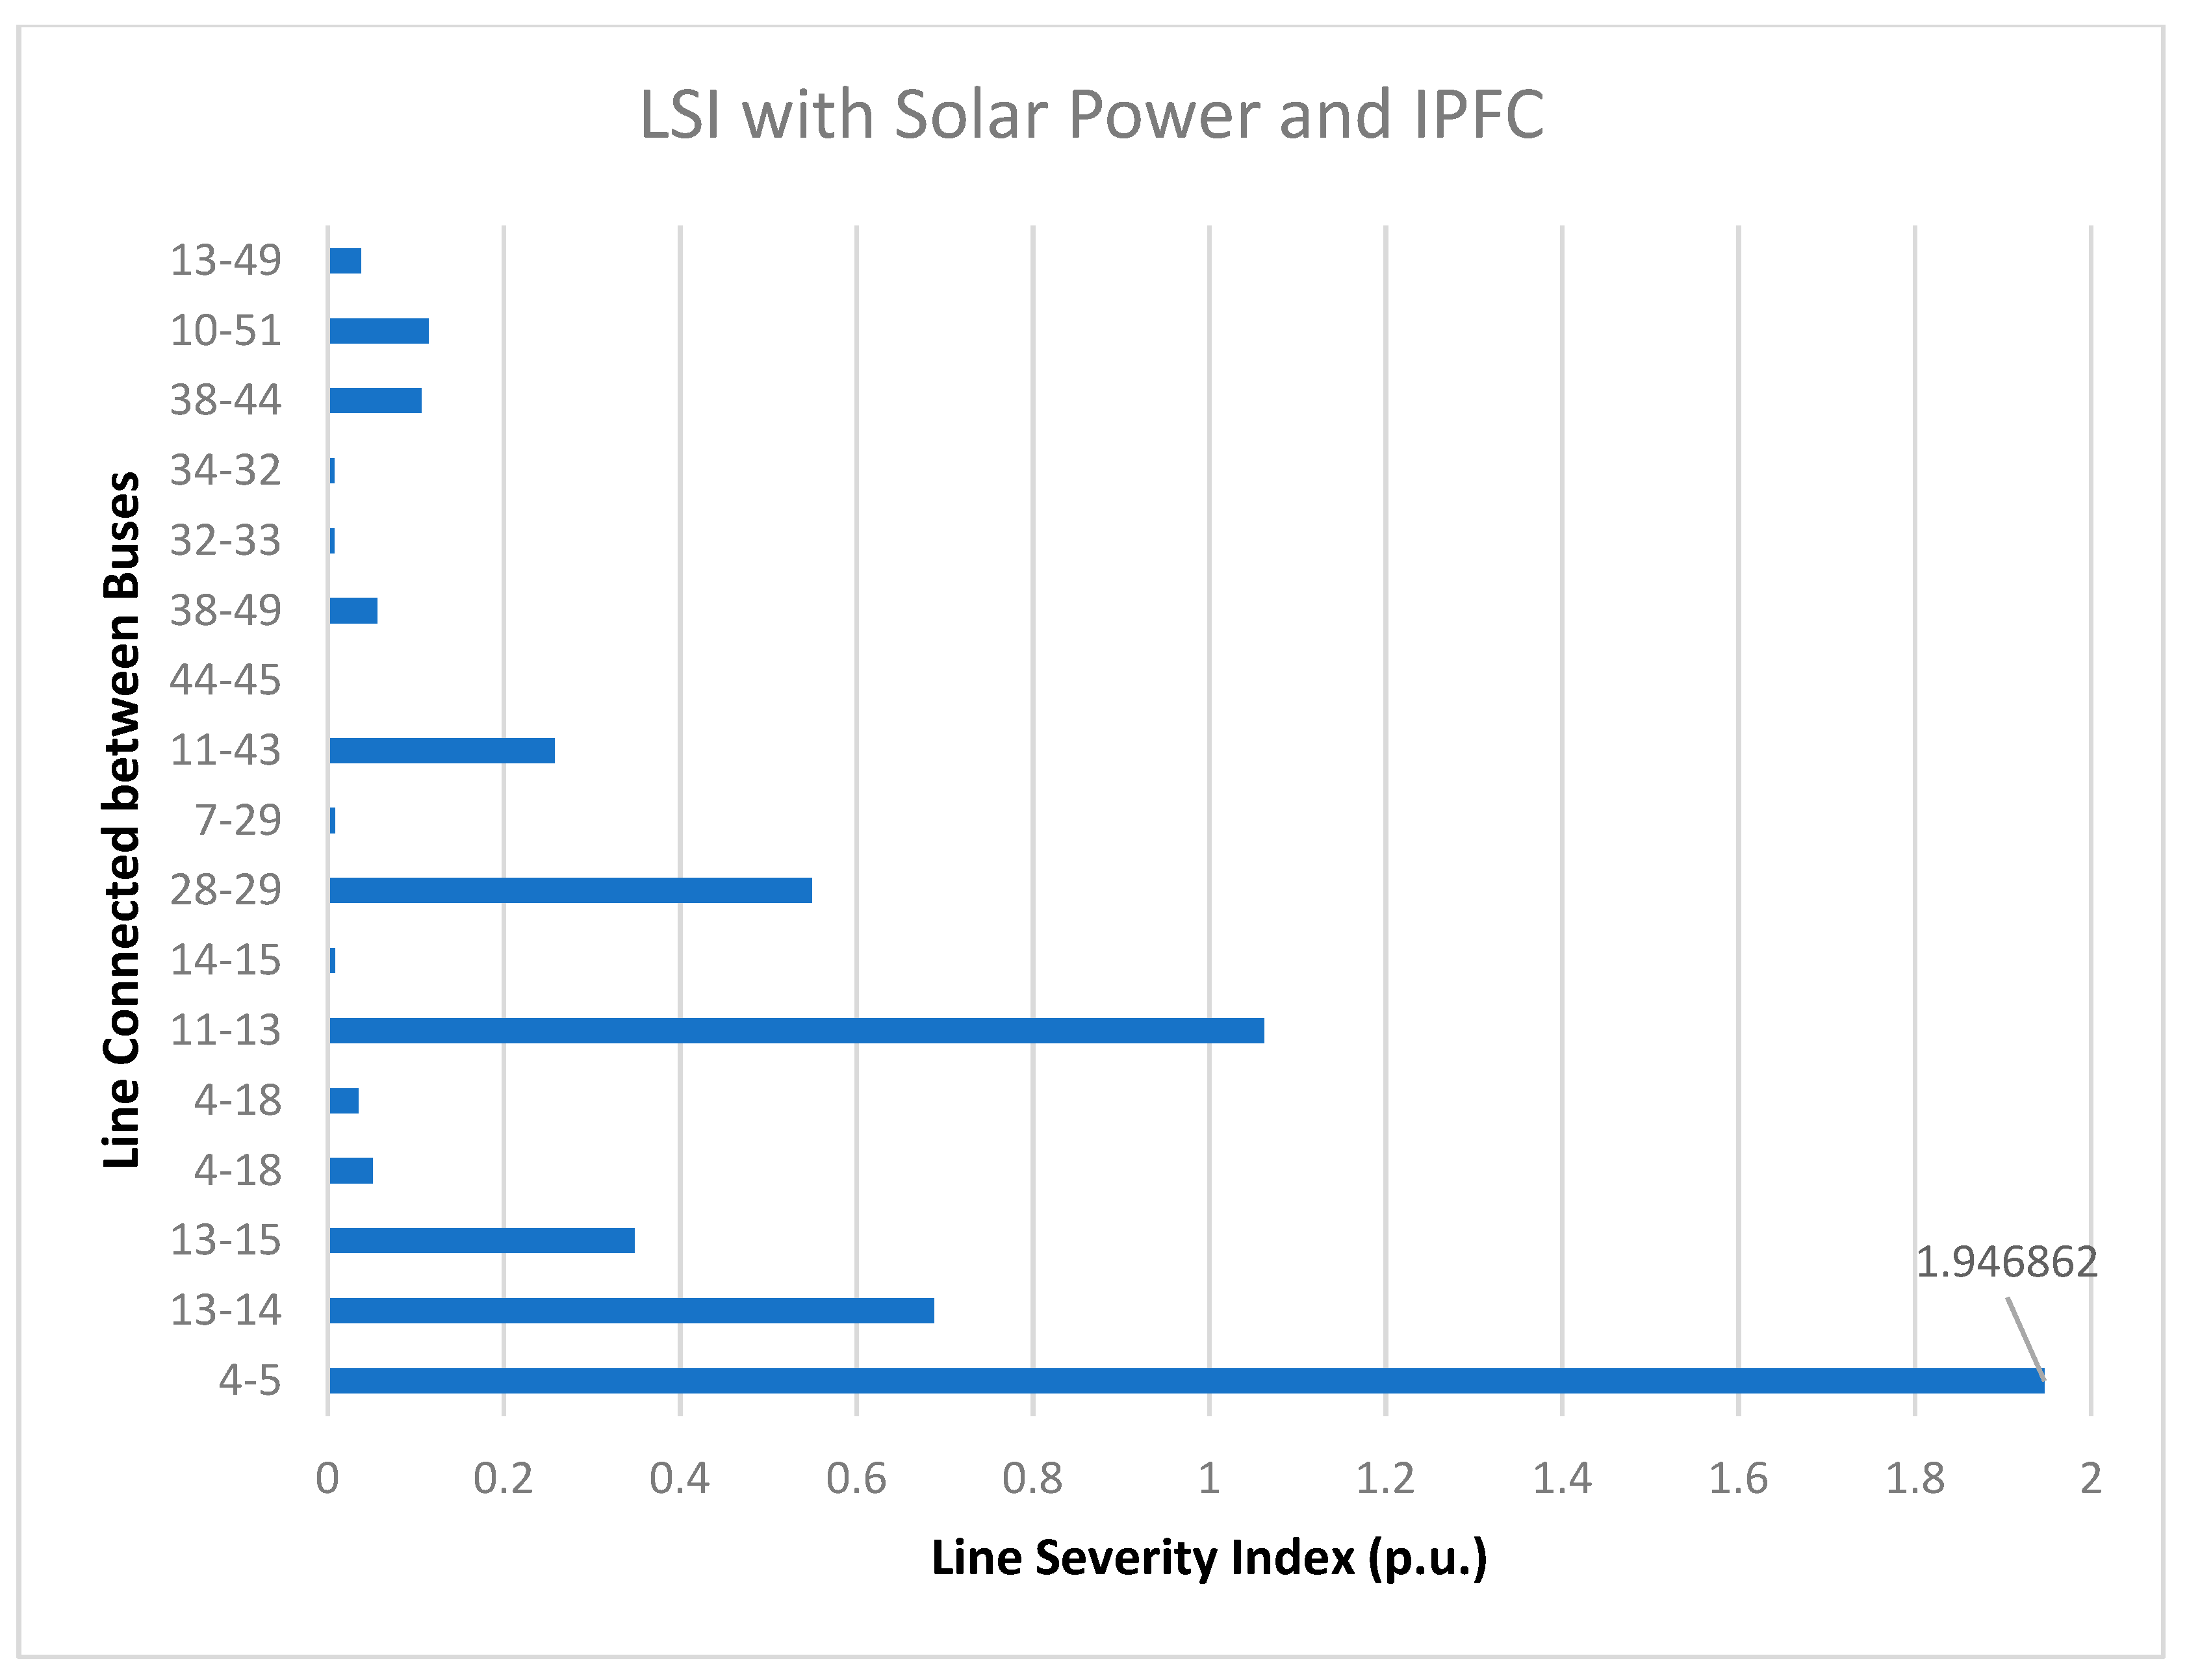
An IEEE 57 bus system from American Electric Power System is considered. It consists of 80 transmission lines. A detailed contingency analysis is performed on the system. LSI of transmission line for lines 5–6 contingency is depicted in Table 4. It is observed that lines 5–6 contingency is the severe most contingency as it causes the highest power loss in the system as mentioned in Table 5. The active power loss in the system increases from 58.604 MW to 81.49 MW. Similarly, the reactive power loss increases from 225.717 MW to 280.35 MW. It is observed from Figure 11 that the severity of lines 4–5 is 2.69 which is much higher than the other lines. Hence, a solar power unit of 2 MW is installed in the location. The IPFC is placed at lines 2–4 and 4–18 as per DLUF. The improvement in the LSI after the installation of the integrated system and the FACTS device is shown in Figure 12. It is observed that after the placement of the solar power unit and the IPFC the LSI of lines 4–5 is reduced to 1.94.
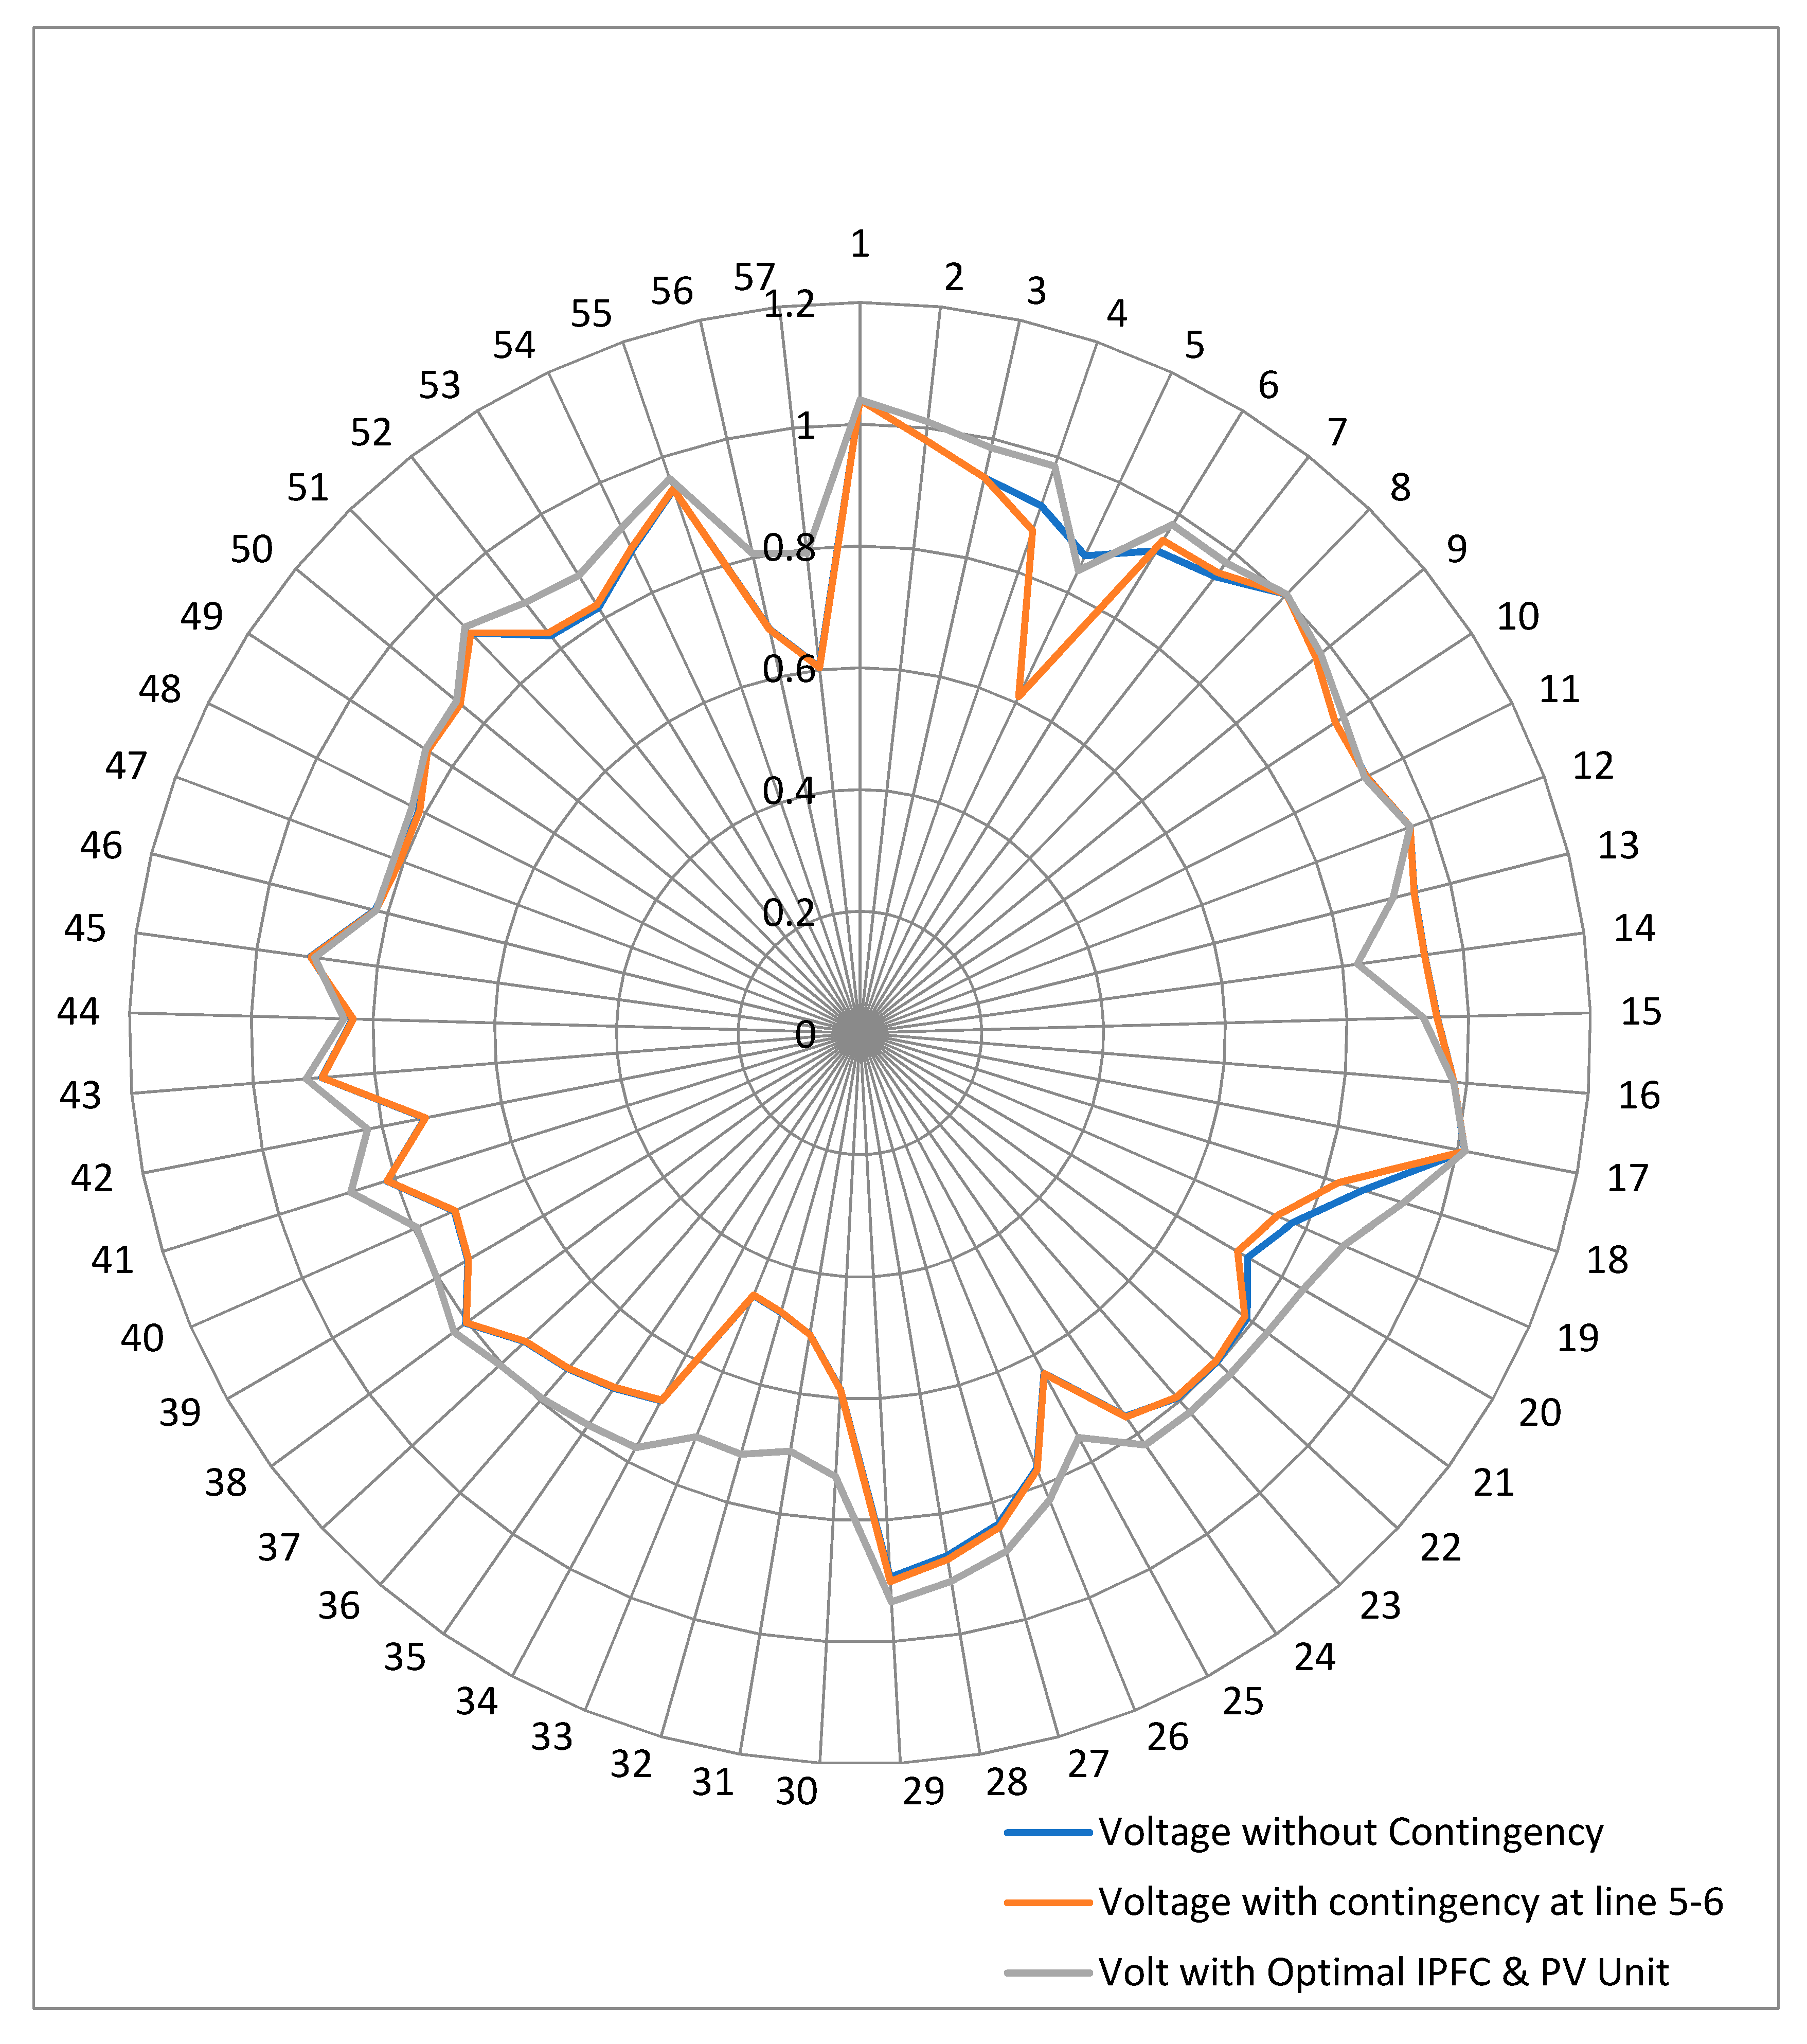
The IPFC was then tuned using the firefly algorithm for the objective functions mentioned in Nomenclature. A good improvement in the system parameters were observed as seen in Table 6. The active power loss in the system has reduced to 65.24 MW which is nearly same as the loss in healthy system. Similarly the voltage deviaton is almost equal to 1 as that of a healthy system. The voltage at the buses of the 57 bus system is shown in Table 7. The voltage profile of the IEEE-57 bus system with and without optimum IPFC and PV unit is shown in Figure 13. The voltage profile of the system is improved and smoothened in the presence of IPFC and the solar unit.

6. Conclusions

A reliable power system is a key to attracting foreign investment in the country in the form of industries. The renewable energy sources which are already a promising alternative to conventional power systems can be used in combination with FACTS devises to improve the stability and reliability of the existing power systems. The results obtained lead to the following observations:
  • Solar power systems can effectively reduce the stress on the existing system.
  • The IPFC along with the solar power unit has reduced the active and reactive losses in the power system.
  • The voltage deviation, security margin and line severity can be controlled within acceptable limits by the proposed method even in the situation of n-1 contingencies. This helps in avoiding any further disruptions in the power system. Thus, the proposed method is an effective means of avoiding blackouts in the country.

7. Future Prospects

In upcoming research the following works may be incorporated:
  • More Solar and wind units may be installed to study its effect.
  • The more effective indices may be developed for the effective placement of solar and wind units.
  • Other methods of placements may be incorporated into the system.
  • The proposed method may be implemented on larger transmission systems to study its effectiveness.

8. Limitations

In this work, it has been assumed that constant power output from the solar PV unit is produced. In the actual case, the output power of a PV unit may vary as per whether conditions.

Author Contributions

Writing—original draft, S.K.B.; conceptualization, A.M.; methodology, N.K.G.V., validation, V.R.B.; project administration, U.M.R.; review and editing, S.G. and E.R.; data acquisition, H.H.F.; funding, E.R. All authors have read and agreed to the published version of the manuscript.

Funding

This work was funded by Unitatea Executiva Pentru Finantarea Invatamantului Superior a Cercetarii Dezvoltarii si Inovarii: PN-III-P4-ID-PCE-2020-0008.

Institutional Review Board Statement

Not applicable.

Informed Consent Statement

Not applicable.

Data Availability Statement

Not applicable.

Conflicts of Interest

The authors declare no conflict of interest.

Nomenclature

Pi, QiInverter active and reactive power.
Vl—Vl∟θl (l = i, j, k) and Vl, θl Magnitude and angle of Vl.
Vsein, ∟θseinMagnitude and angle of Vsein
VseinComplex controllable series injected voltage source, series compensation of the series converter
nbus j, k - common bus connected to IPFC.
ZseinSeries transformer impedance
Pni and QniActive and reactive power flows leaving bus n connected to IPFC
gin, binConductance and susceptance of a transmission line respectively
SSolar irradiance
L(S)Lognormal function
P(s)Solar electric power generated
PminMinimum output power of the PV unit
Sst, ScStandard and critical point solar irradiance respectively
SijApparent power flow in line ij
MVAij(max)Maximum MVA rating of the line between bus i and bus j
MVAijActual MVA rating of the line between bus i and bus j
aMultiplying factor.
VkVoltage magnitude at bus k
JL No. of load buses
µ, σ Mean and standard deviation of the log-normal probability function respectively

References

  1. Clegg, S.; Mancarella, P. Integrated modeling and assessment of the operational impact of power-to-gas (P2G) on electrical and gas transmission networks. IEEE Trans. Sustain. Energy 2015, 6, 1234–1244. [Google Scholar] [CrossRef]
  2. Bai, L.; Li, F.; Jiang, T.; Jia, H. Robust scheduling for wind integrated energy systems considering gas pipeline and power transmission N–1 contingencies. IEEE Trans. Power Syst. 2017, 32, 1582–1584. [Google Scholar] [CrossRef]
  3. Yang, X.; Wang, X.; Liu, Z.; Luo, X.; Yan, J. Effect of fin number on the melting phase change in a horizontal finned shell-and-tube thermal energy storage unit. Sol. Energy Mater. Sol. Cells 2022, 236, 111527. [Google Scholar] [CrossRef]
  4. Guo, J.; Liu, Z.; Du, Z.; Yu, J.; Yang, X.; Yan, J. Effect of fin-metal foam structure on thermal energy storage: An experimental study. Renew. Energy 2021, 172, 57–70. [Google Scholar] [CrossRef]
  5. Yang, X.; Guo, J.; Yang, B.; Cheng, H.; Wei, P.; He, Y.-L. Design of non-uniformly distributed annular fins for a shell-and-tube thermal energy storage unit. Appl. Energy 2020, 279, 115772. [Google Scholar] [CrossRef]
  6. Guo, J.; Liu, Z.; Yang, B.; Yang, X.; Yan, J. Melting assessment on the angled fin design for a novel latent heat thermal energy storage tube. Renew. Energy 2022, 183, 406–422. [Google Scholar] [CrossRef]
  7. Guo, J.; Wang, X.; Yang, B.; Yang, X.; Li, M.-J. Thermal assessment on solid-liquid energy storage tube packed with non-uniform angled fins. Sol. Energy Mater. Sol. Cells 2022, 236, 111526. [Google Scholar] [CrossRef]
  8. Ahmad, A.; Ahmad Reza, S. Optimal placement and sizing of multi-type FACTS devices in power systems using metaheuristic optimisation techniques: An updated review. Ain Shams Eng. J. 2020, 11, 611–628. [Google Scholar] [CrossRef]
  9. Zhang, X.P. Modeling of the interline power flow controller and the generalized unified power flow controller in Newton power flow. IET Proc.-Gener. Transm. Distrib. 2003, 150, 268–274. [Google Scholar] [CrossRef]
  10. Teerthana, S.; Yokoyama, A. An optimal power flow control method of power system using interline power flow controller (IPFC). In Proceedings of the 2004 IEEE Region 10 Conference TENCON, Chiang Mai, Thailand, 24 November 2004; pp. 343–346. [Google Scholar]
  11. Velayutham, U.; Ponnusamy, L.; Venugopal, G. Minimization of cost and congestion management using interline power flow controller. COMPEL—Int. J. Comput. Math. Electr. Electron. Eng. 2016, 35, 1495–1512. [Google Scholar] [CrossRef]
  12. Daram, S.B.; Venkataramu, P.S.; Nagaraj, M.S. Performance index based contingency ranking under line outage condition incorporating IPFC. In Proceedings of the International Conference on Electrical, Electronics, and Optimization Techniques (ICEEOT), Chennai, India, 3–5 March 2016. [Google Scholar]
  13. Yang, X.S. Firefly algorithm, Levy flights and global optimization. In Research and Development in Intelligent Systems XXVI; Springer: London, UK, 2009; pp. 209–218. [Google Scholar]
  14. Akanksha, M.; Nagesh Kumar, G.V. Line utilisation factor-based optimal allocation of IPFC and sizing using firefly algorithm for congestion management. IET Gener. Transm. Distrib. 2016, 10, 115–122. [Google Scholar]
  15. Oyekanmi, W.A.; Radman, G.; Babalola, A.A.; Ajewole, T.O. Power System Simulation and Contingency Ranking Using Load Bus Voltage Index. In Proceedings of the 2014 11th International Conference on Electronics, Computer and Computation (ICECCO), Abuja, Nigeria, 29 September–1 October 2014; IEEE: Piscataway, NJ, USA, 2014. [Google Scholar]
  16. Verma, R.; Rathore, A. Optimal Placement of Facts Device Considering Voltage Stability and Losses using Teaching Learning based Optimization. J. Inst. Eng. India Ser. B 2021, 102, 771–776. [Google Scholar] [CrossRef]
  17. Kumar, G.N.; Kalavathi, M.S. Cat Swarm Optimization for optimal placement of multiple UPFC’s in voltage stability enhancement under contingency. Electr. Power Energy Syst. 2014, 57, 97–104. [Google Scholar] [CrossRef]
  18. Adetokun, B.B.; Cristopher, M.M. Application and control of flexible alternating current transmission system devices for voltage stability enhancement of renewable-integrated power grid: A comprehensive review. Heliyon 2021, 7, e06461. [Google Scholar] [CrossRef] [PubMed]
  19. Nusair, K.; Alasali, F.; Ali, H.; William, H. Optimal placeent of FACTS devices and power-flow solutions for a power network system integrated with stochastic renewable energy resources using metaheuristic optimization techniques. Int. J. Energy Res. 2021, 45, 18786–18809. [Google Scholar] [CrossRef]
  20. Dawn, S.; Tiwari, P.K.; Goswami, A.K. An approach for long term economic operations of competitive power market by optimal combined scheduling of wind turbines and FACTS controllers. Energy 2019, 181, 709–723. [Google Scholar] [CrossRef]
  21. Aghdam, F.H.; Ghaemi, S.; Safari, A.; Farrokhifar, M. Profit-based evaluation of optimal FACTS devices planning for the large consumers and TRANSCO considering uncertainty. Int. Trans. Electr. Energy Syst. 2021, 31, e12828. [Google Scholar] [CrossRef]
  22. Ma, R.; Li, X.; Luo, Y.; Wu, X.; Jiang, F. Multi-objective Dynamic Optimal Power Flow of Wind Integrated Power Systems Considering Demand Response. CSEE J. Power Energy Syst. 2019, 5, 466–473. [Google Scholar] [CrossRef]
  23. Mishra, A.; Nagesh Kumar, G.V.; Rao, B.V.; Chowdary, D.D. Real power performance index and line stability index-based management of contingency using firefly algorithm. IET Gener. Transm. Distrib. 2016, 10, 2327–2335. [Google Scholar] [CrossRef]
Figure 1. IPFC mathematical model.
Inventions 07 00030 g001
Figure 2. Methodology followed for Solar Power and IPFC placement and tuning [14].
Inventions 07 00030 g002
Figure 3. Indian Utility 62 bus system.
Inventions 07 00030 g003
Figure 4. Active Power Loss in various line contingencies. HS = Healthy System.
Inventions 07 00030 g004
Figure 5. Active Power Loss in various line contingencies. HS = Healthy System.
Inventions 07 00030 g005
Figure 6. Security Margin of Indian 62 Bus system for various contingencies. HS = Healthy System.
Inventions 07 00030 g006
Figure 7. Voltage Deviation of Indian 62 Bus system for various contingencies. HS = Healthy System.
Inventions 07 00030 g007
Figure 8. Time elapsed vs. accuracy for firefly algorithm.
Inventions 07 00030 g008
Figure 9. Voltage Deviation at the buses for the 62-bus system.
Inventions 07 00030 g009
Figure 10. Line Severity Index of the Indian Transmission System.
Inventions 07 00030 g010
Figure 11. Line Severity Index for various contingency conditions.
Inventions 07 00030 g011
Figure 12. Line Severity Index of the IEEE 57 Bus system with IPFC and Solar Power Unit.
Inventions 07 00030 g012
Figure 13. Voltage profile of the IEEE 57 bus system under various stages of operation.
Inventions 07 00030 g013
Table 1. Sample results for major Line Contingency Study of the 62 bus Transmission System.
S. No.Contingency ConditionActive Power Loss (MW)Reactive Power Loss (MVAR)SM (p.u.)VD
(p.u.)
1Healthy System191.9982.51.171.7
21–4194.3995.31.161.7
31–14216.81110.21.231.8
41–10233.81198.01.231.96
52–3197.61011.81.161.70
63–4195.81002.81.151.74
74–15198.11014.21.181.78
814–15192.9987.61.161.73
94–14200.11024.61.171.76
1013–14227.81167.11.231.86
1112–13253.31298.31.221.96
1212–11228.61171.31.201.77
1311–10221.91136.91.221.85
144–5196.51003.61.201.74
Table 2. Line Severity Index of transmission lines connected to load buses for line 12–13 contingency condition.
S. No.Contingency ConditionLine Severity Index (p.u.)
1.3–43.49
2.4–155.12
3.12–13Contingency Line
4.12–1116.11
5.11–108.66
6.6–714
7.7–814.56
8.11–166.71
9.21–2213.46
10.27–290.13
11.29–300.16
12.12–200.59
13.13–170.16
14.24–450.81
15.24–410.73
16.41–450.47
17.40–410.28
18.41–421.29
19.42–430.063
20.42–440.114
Table 3. Comparison of parameters of integrated system under various conditions.
ParameterHealthy SystemSystem ContingencyWith Solar Unit &IPFCIPFC Tuning
Active Power Loss (MW)87.372102.12698.74791.139
Reactive Power Loss (MVAR)445.172523.159500.62467.78
Voltage Deviation (p.u.)1.121.18281.13181.1105
Security Margin (p.u.)0.921.791.411.35
Table 4. LSI of transmission lines for lines 5–6 contingency.
S. No.From Bus-To BusLSI for Line 5–6 Contingency (p.u.)LSI with Solar Power and IPFC (p.u.)
1.4–52.6955071.946862
2.13–140.1383840.68796
3.13–150.2796290.347864
4.4–180.1522560.051076
5.4–180.1522560.034708
6.11–130.0371331.06193
7.14–150.322510.008668
8.28–290.1200620.549526
9.7–290.673220.008354
10.11–430.1137710.257759
11.44–450.3252420.000361
12.38–490.0315420.056644
13.32–330.014280.007762
14.34–320.0292070.007569
15.38–440.1949220.10614089
16.10–510.1992730.11418384
17.13–490.1989190.037791
Table 5. Values of system parameters for line 5–6 Contingency.
S. No.ParameterValue of System Parameter for Line 5–6 OutageHealthy System
1Active Power Loss (MW)81.4958.604
2Reactive Power Loss (MVAR)280.35225.717
3Voltage Deviation (p.u.)1.11.01
4Security Margin (p.u.)1.91.12
Table 6. Comparison of System Parameters for an IEEE 57 Bus system.
S. No.ParameterHealthy SystemWith
Contingency
With Solar Power and IPFCWith Tuned IPFC
1Active Power Loss (MW)58.60481.4973.10665.24
2Reactive Power Loss (MVAR)225.717280.35249.050231.12
3Voltage Deviation (p.u.)1.011.11.080.988
4Security Margin (p.u.)1.121.91.681.3
Table 7. Voltage Deviation of IEEE.
S. No.Volt without Contingency (p.u.)Volt with Contingency at 5–6
(p.u.)
Volt with Optimal IPFC and Solar Unit (p.u.)
1.1.041.041.04
2.0.980.981.01
3.0.9350.9350.985
4.0.91590.8730.9841
5.0.86660.61110.8403
6.0.930.950.98
7.0.95010.95770.9789
8.1.0051.0051.005
9.0.970.970.98
10.0.93250.93240.9487
11.0.93260.93240.9291
12.0.9650.9650.965
13.0.93910.93880.9027
14.0.93610.93580.8249
15.0.94820.9480.9255
16.0.97890.97860.9782
17.1.0121.01221.0123
18.0.86490.82360.9346
19.0.77550.74750.8674
20.0.73520.71610.8404
21.0.78880.78420.8297
22.0.79630.79450.8261
23.0.79350.79190.8249
24.0.76460.76610.8221
25.0.63450.63550.7543
26.0.77110.77310.8269
27.0.8370.84210.8835
28.0.86940.87560.9122
29.0.89440.90130.9348
30.0.58530.58610.7287
31.0.50110.50130.6952
32.0.4760.47530.7181
33.0.46430.46360.715
34.0.68590.68460.7729
35.0.70850.70720.7825
36.0.73050.72920.7949
37.0.74780.74650.8036
38.0.80370.80230.8275
39.0.74360.74230.8025
40.0.72770.72630.7948
41.0.81420.81370.8761
42.0.72770.72690.8241
43.0.88670.88640.9127
44.0.83360.83250.8476
45.0.91090.91030.9043
46.0.82140.82030.8199
47.0.80780.80660.8168
48.0.81150.81030.8241
49.0.84920.84830.8519
50.0.85130.85060.8583
51.0.91670.91650.9305
52.0.82690.83280.8958
53.0.820.82530.8821
54.0.87720.88030.9177
55.0.94380.94470.9629
56.0.68050.67950.8073
57.0.6050.60370.7929
Publisher’s Note: MDPI stays neutral with regard to jurisdictional claims in published maps and institutional affiliations.