Article

A Numerical Analysis of Fluid Flow and Torque for Hydropower Pelton Turbine Performance Using Computational Fluid Dynamics

by
Mohammed A. Qasim
1,*,
Vladimir I. Velkin
1,
Sergey E. Shcheklein
1,
Abduljabbar O. Hanfesh
2,
Talib Z. Farge
2 and
Fadl A. Essa
3
1
Nuclear Power Plants and Renewable Energy Sources Department, Ural Federal University, 620002 Yekaterinburg, Russia
2
Electromechanical Engineering Department, University of Technology, Baghdad 10066, Iraq
3
Mechanical Engineering Department, Faculty of Engineering, Kafrelsheikh University, Kafrelsheikh 33516, Egypt
*
Author to whom correspondence should be addressed.
Inventions 2022, 7(1), 22; https://doi.org/10.3390/inventions7010022
Submission received: 16 January 2022 / Revised: 25 January 2022 / Accepted: 28 January 2022 / Published: 3 February 2022
(This article belongs to the Special Issue Recent Trends in Nanofluids III)

Abstract

:
The difficulty of delivering electrical power to rural areas motivated the researchers to explore more accessible power sources. Hydropower is considered a desirable option due to its sustainability and lower costs. Pelton turbines have been widely used in hydropower plants because of their low installation and maintenance costs. This study provides a computational fluid dynamics (CFD) model for Pelton turbine performance under various flow conditions. The model is based on the conservation of mass principle, Newton’s second law, and the first law of thermodynamics. It is used to predict the torque produced by a turbine at different rotational speeds. Previously published experimental results for the same turbine geometry and flow parameters were used to validate the model’s predictions. Validation revealed that the model can reproduce the experimental results. This provides the required robustness for its use as a tool for turbine design and modification.

1. Introduction

Delivering electricity to rural areas requires expensive electricity network expansion. However, the small populations and limited individual incomes in these areas makes electricity unaffordable. Furthermore, fossil fuels have negative impacts on the environment. This motivates scientists to explore cleaner, more sustainable, and lower-cost energy resources. Among the explored energy resources, hydropower has been found to be a reliable [1], clean [2], efficient, and cost-effective alternative [3,4]. It has considerably lower installation and maintenance costs than the other renewable energy technologies [5]. Pelton turbine hydropower plants are widely used in water-rich regions. They use an impulse type of turbine that consists of a set of buckets where the water potential energy is converted to kinetic energy. The design and performance of this turbine have been widely investigated using both numerical and experimental approaches. Gupta et al. [6] numerically evaluated their efficiency, velocity, blade loading, and water distribution. The evaluations were performed under various turbine operating conditions. Furthermore, Bajracharya et al. [7] adopted computational fluid dynamics (CFD) code to model their injector flow. Various nozzle openings, jet contraction phenomena and jet velocity distributions were considered in the model. Popovski et al. [8] provided a push-out jet deflector shape optimization method using CFD to reduce the stresses and torque on the deflector servomotor. Good correlation with experimental results was achieved, indicating that the method is reliable for design and development. Kumashiro et al. [9] presented experimental and numerical approaches to evaluate the non-uniformity of the water flow. Their CFD code was used to simulate two-phase flow in a nozzle, a bent pipe, and a distributor. Good agreement with the experimental results was achieved for the velocity profile and jet deviation.
The casing flow in a two-jet turbine was numerically studied by Petley and Aggidis [10] to improve its performance. The study was performed using the ANSYS FLUENT code, where a Reynolds-averaged Navier Stokes (RANS) model and a two-phase volume of fluid (VOF) model were implemented. The study concluded that the presented model successfully predicted the turbine casing flow. This study further proposed shrouds and baffles to improve turbine performance. Another numerical study was conducted by Messa et al. [11] to evaluate the injector design and operational conditions on turbine susceptibility to hydro-abrasive erosion. The VOF model was used to simulate the free nozzle jet, and the solid particle trajectories were simulated using a Lagrangian particle tracking model. Model robustness was demonstrated by comparing its results with the earlier experimental results of [12]. The study reported that needle and nozzle seats are the most vulnerable parts to erosion, and that the primary erosive mechanism is shear force.
Židonis and Aggidis [13] presented a CFD model to optimize the number of turbine buckets. The number of buckets, as well as the angular and radial position parameters were grouped and simultaneously studied. The results revealed that reducing the number of buckets could enhance efficiency. In the same way, Wahyudi [14] presented a turbine efficiency optimization using CFD. The optimized parameters included the number of buckets and nozzles, as well as nozzle diameter. An optimal efficiency of 59.58% was reported for an 18-bucket turbine with two 5 mm diameter nozzles.
Obayes and Qasim [15] conducted an experimental investigation to evaluate the flow parameter effects on Pelton turbine performance. The parameters considered included the water head, volume flow rate, and nozzle size. The study found that for a specific nozzle size, reducing the water head leads to a reduced water discharge, which consequently decreases performance. Moreover, the study reported a 60% increase in efficiency using a 8.87 mm nozzle diameter compared to a nozzle diameter of 5.19 mm. Rai et al. [16] performed an experimental examination to evaluate bucket erosion behavior due to suspended sediments. A 1:8 scaled-down Pelton turbine prototype was used. The evaluations were simultaneously performed for various velocities, exposure times, concentrations, and sediment sizes. The study concluded that the developed erosion model was successful in predicting the erosion behavior in buckets made of various materials. Din and Harmain [17] employed a novel 3D scanning technology to evaluate the erosive wear of a Pelton injector (spear nozzle tribo pair) in a 4.66 MW capacity hydropower plant. The study reported 3.71 and 5% erosion of the initial volume in the spear and nozzle, respectively. Okdinata et al. [18] investigated Pelton turbine prototype operating parameters for a 10 m high waterfall with a 46.745 m3/s discharge flow. The maximum output power was found to be at a 691.3 rpm rotational speed, 35 L/min flow discharge, and 50° nozzle output angle. Zidonis et al. [19] conducted an investigation of the impact of nozzle and spear configuration on Pelton turbine performance. Various injector designs were fabricated and tested, including a standard design (nozzle angle of 80° and spear angle of 55°) and developed design (110° nozzle angle and 70° spear angle). The study concluded that higher turbine efficiency came with greater nozzle and spear angles.
The current paper presents a CFD model for Pelton turbine performance under various flow parameters. The model provides predictions for turbine performance that have been experimentally evaluated by [15]. The experimental results were used to validate the model, which may be employed as a low-cost alternative to expensive practical experimentation, particularly for different geometric and flow parameters.

2. Materials and Methods

The model presented in the current study attempts to reproduce the experimental results presented in [15]. Figure 1 shows a Pelton turbine system that has been experimentally investigated to evaluate the flow parameter effects on turbine performance. These parameters included the nozzle diameter, the pressure head, and the flow rate. The experimental setup consisted of a 24-bucket Pelton turbine with tip and hub diameters of 269.89 and 221.29 mm, respectively. A water pump with a 46 m head was used to provide the required pressure and a digital flow meter was used to monitor the flow rate. Further, tension scale gauges were used to apply various brake loads, while a tachometer was employed to measure the turbine rotational speed.

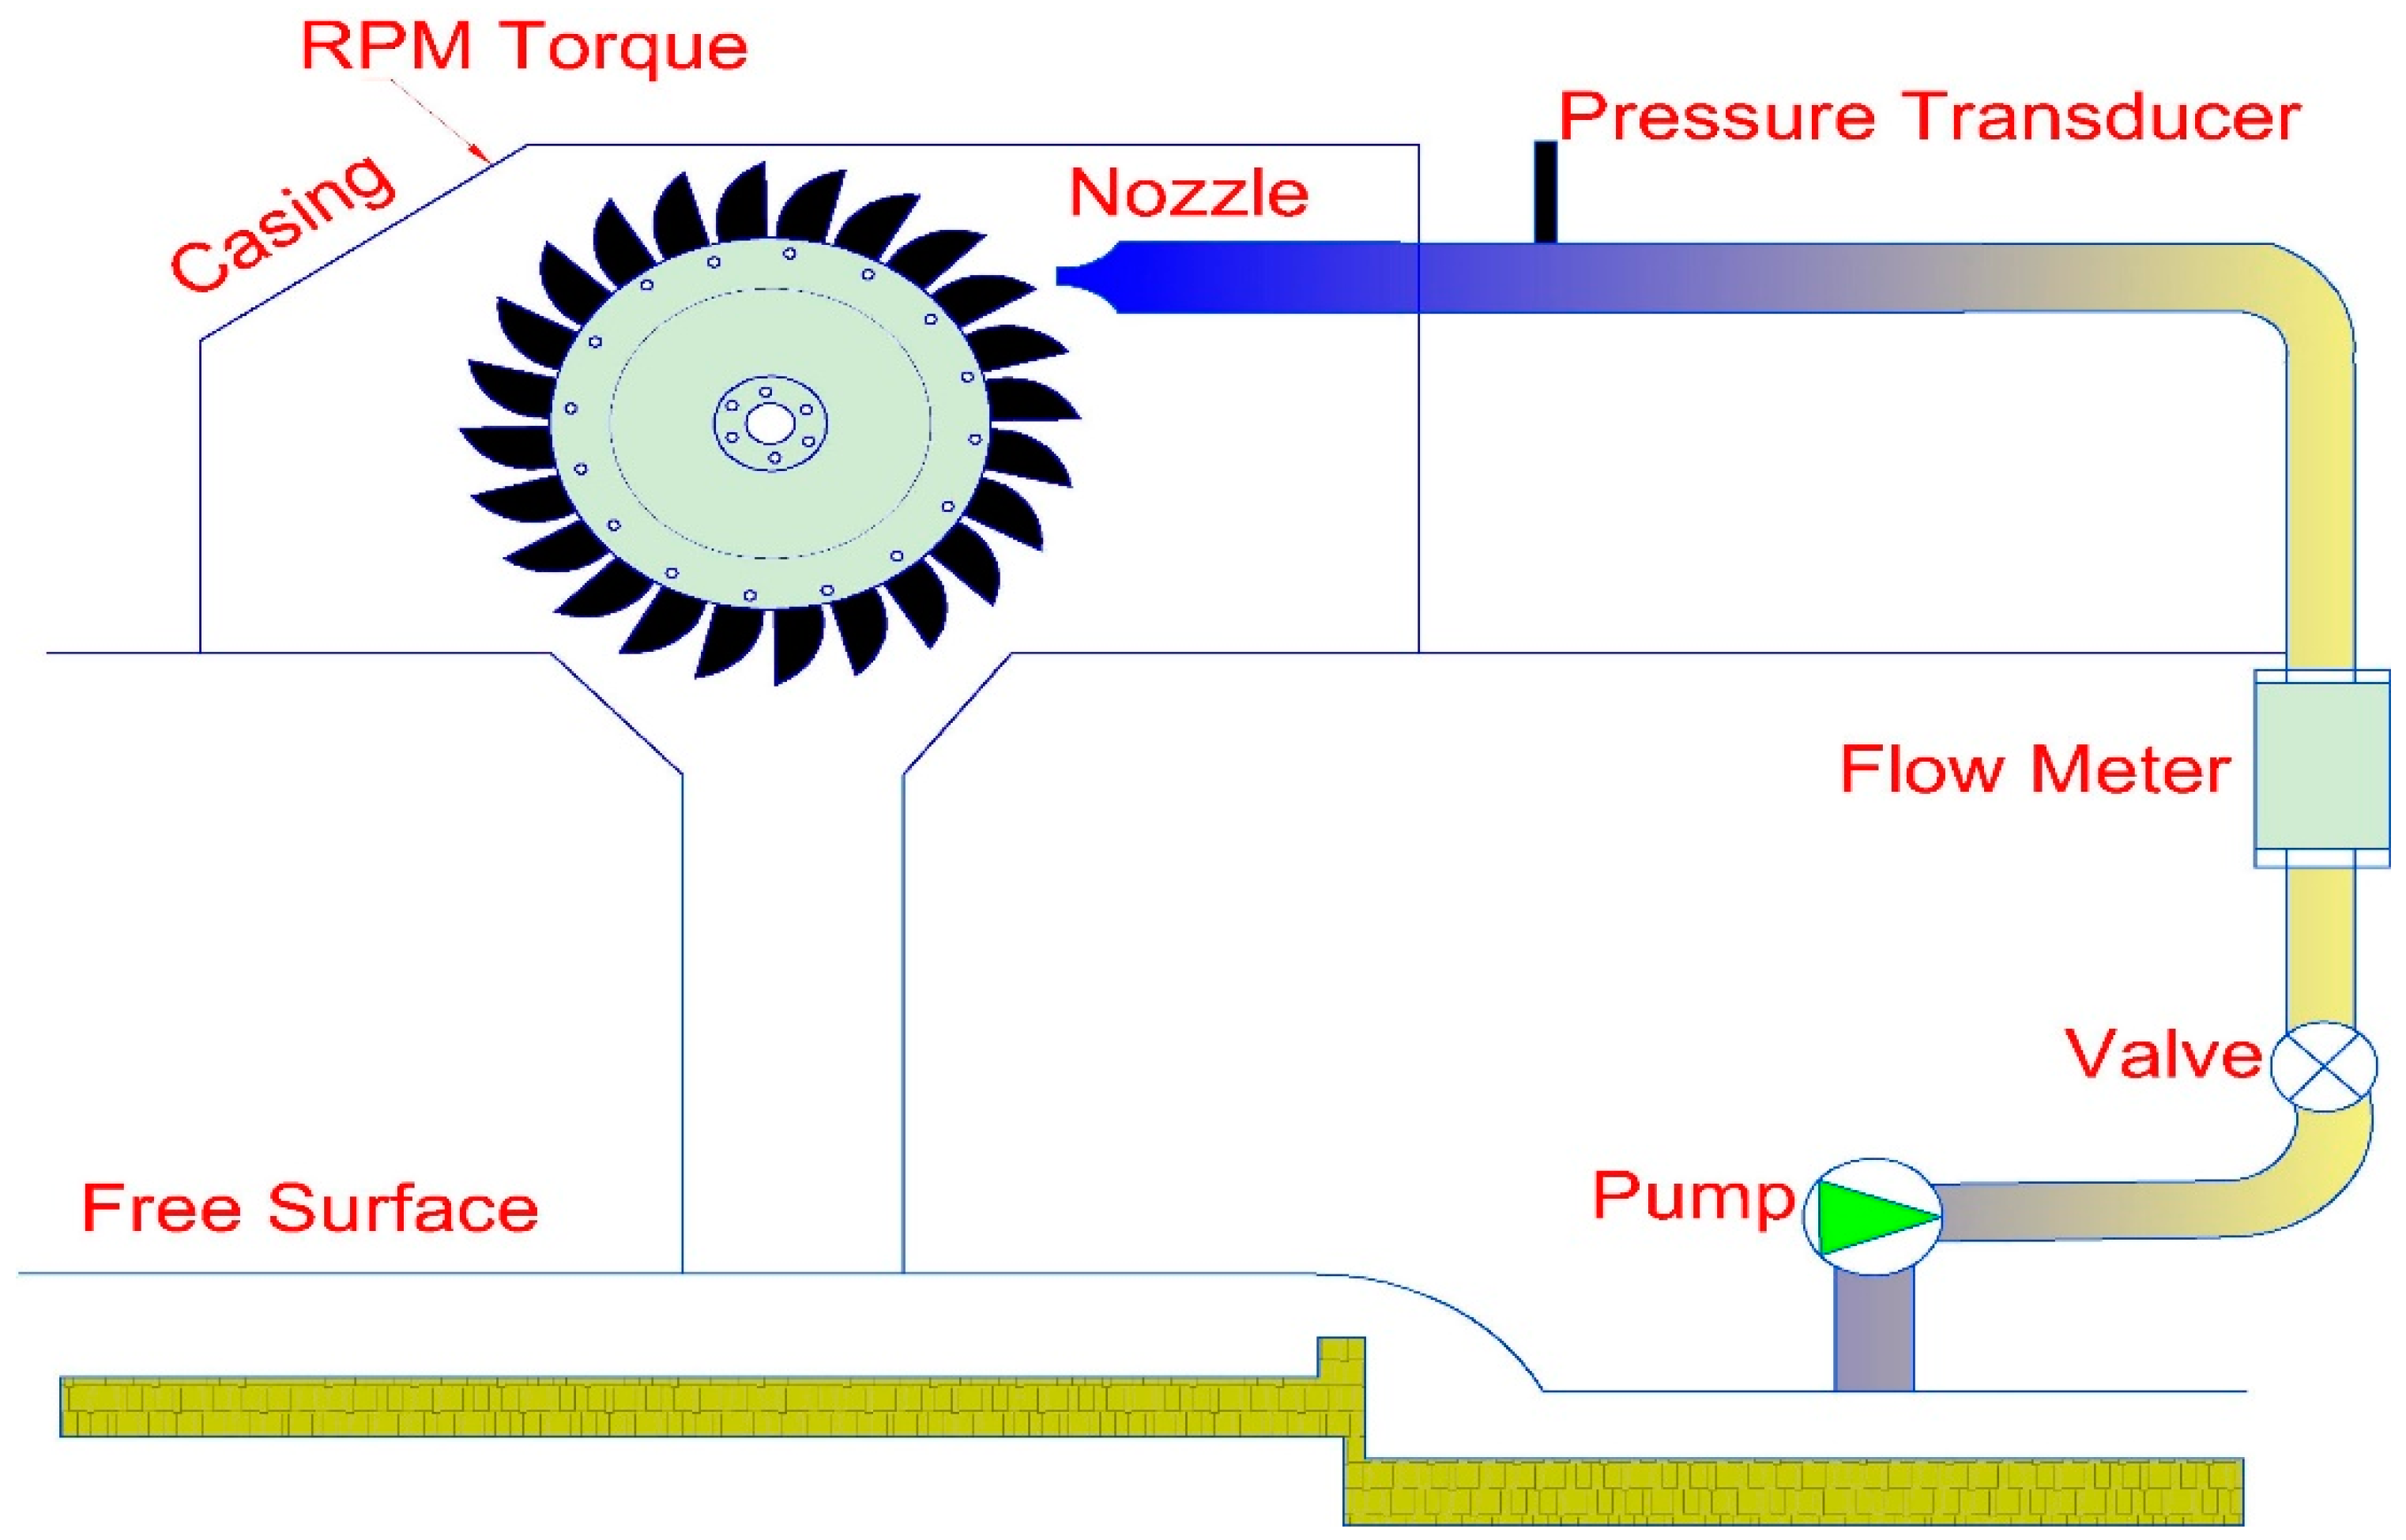
2.1. CFD Model Description

CFD code has been widely used to provide numerical predictions for engineering problems that include fluid motion and flow reactions. It provides excellent simulation for real life problems with acceptable results in effective cost and time frames. The CFD model presented in this study was dedicated to studying the flow parameter effects on Pelton turbine performance. It comprises turbine runner geometry generation, mesh discretization, boundary condition applications, and appropriate solution method implementation. Finally, the required results are presented in plots in which quantities such as velocity profile, pressure distribution, and moments are extracted.

2.2. Governing Equations
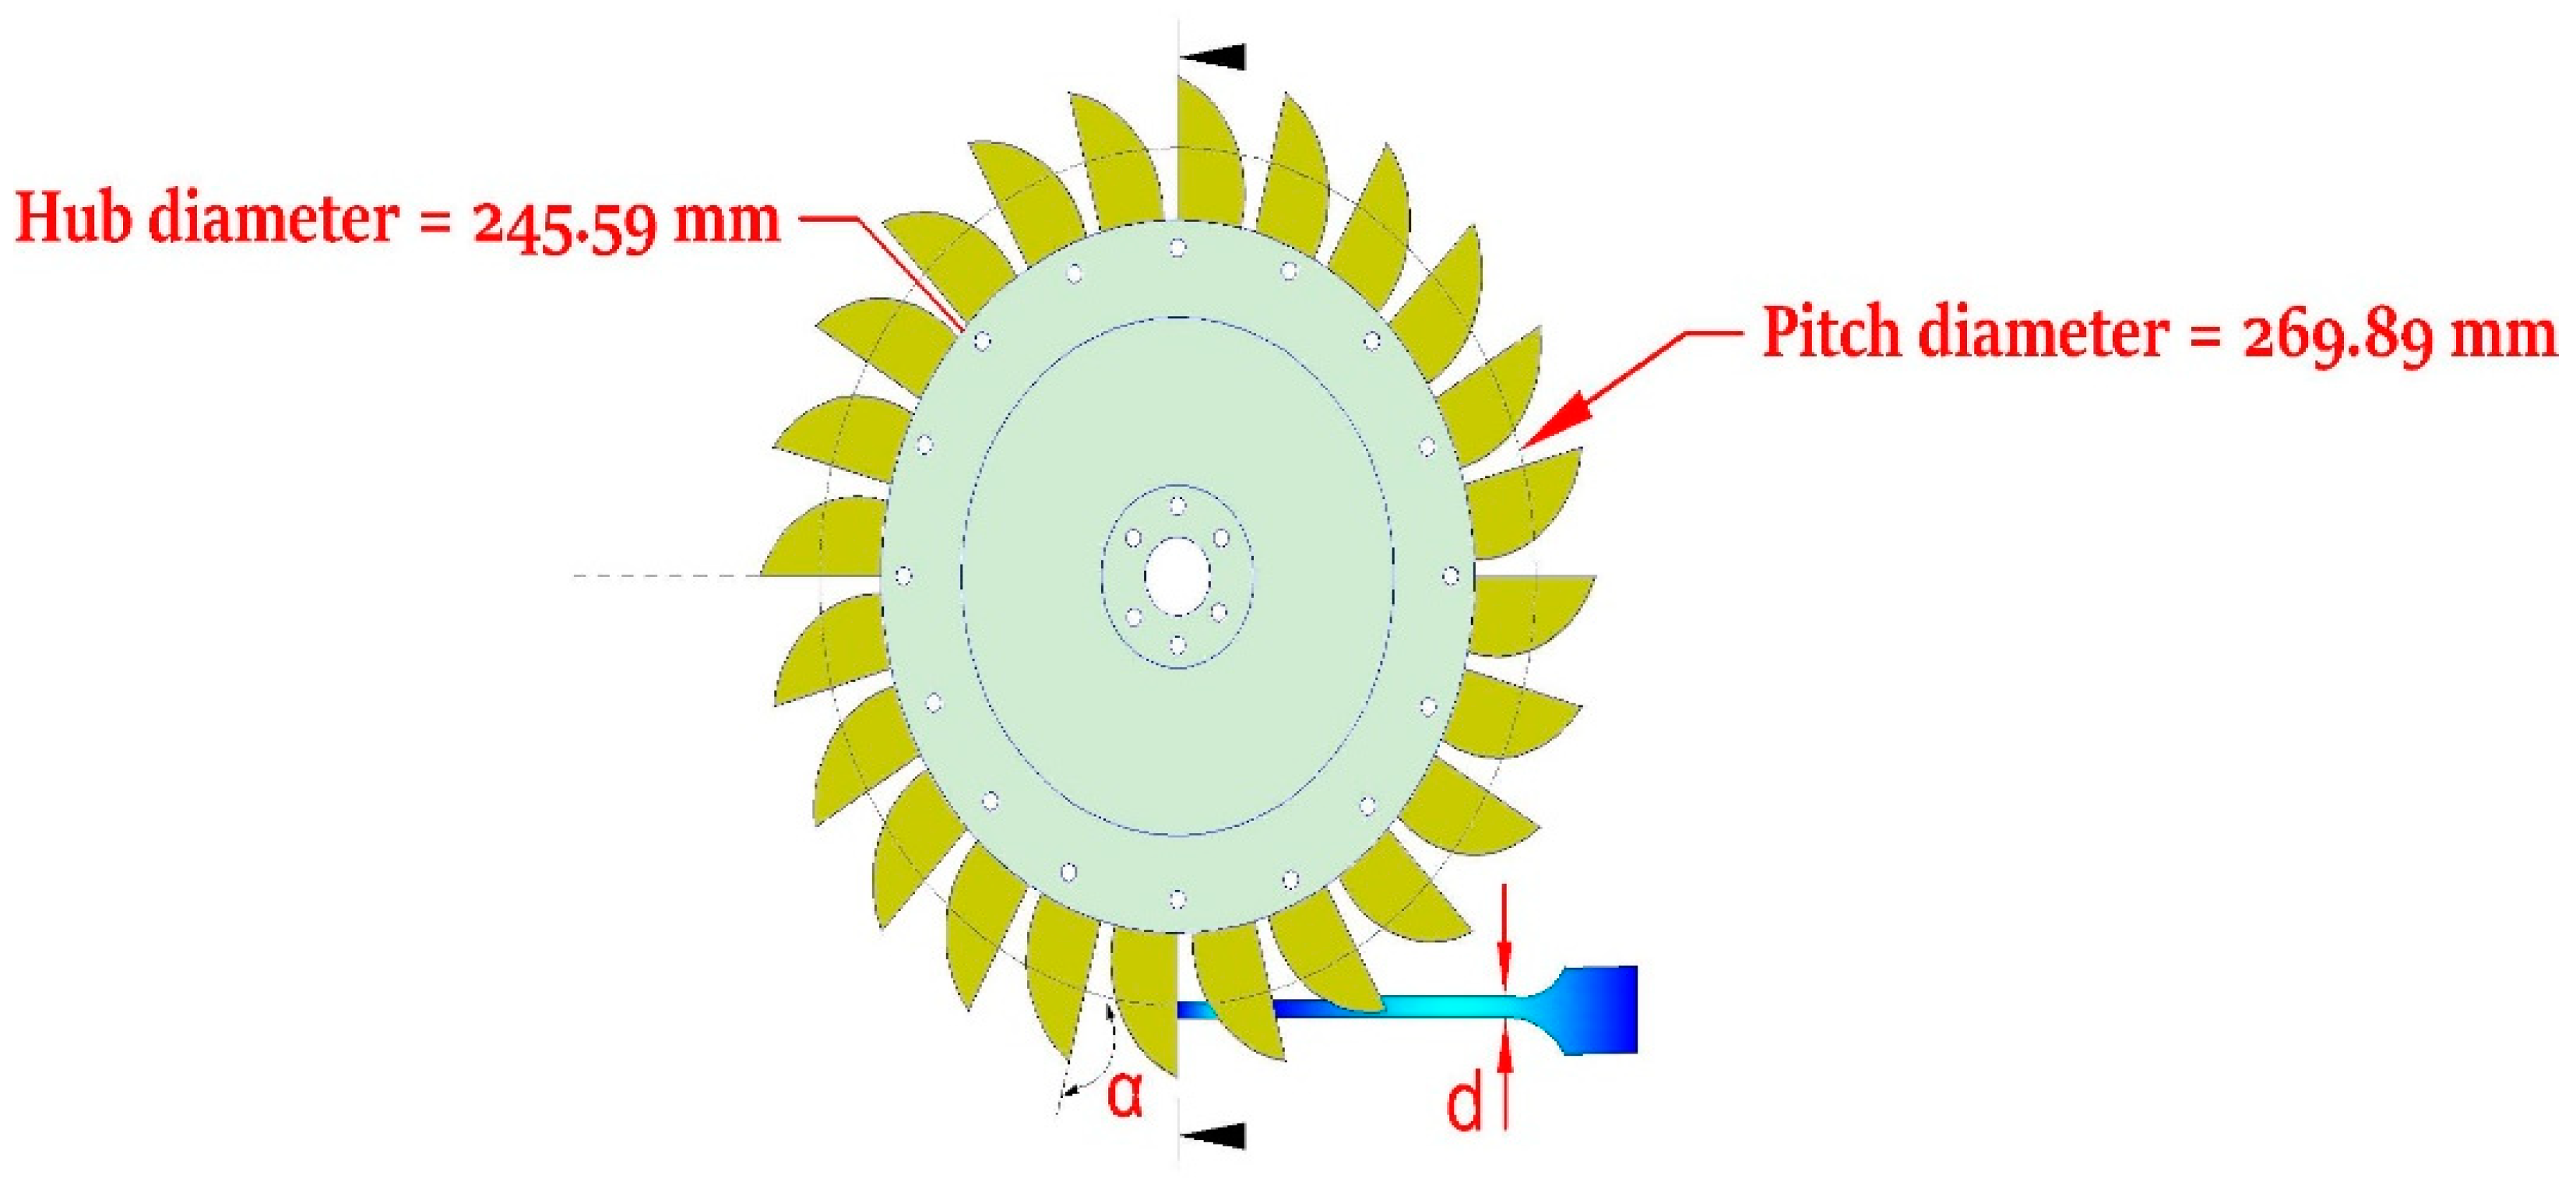
The conservation of mass, Newton’s second law, and the first law of thermodynamics were the governing laws that were used to describe the fluid flow. The implementation of these laws involves some fundamental assumptions for the field fluid flow in the domain. First, fluid is considered an infinitely large number of fluid particles which have mass, momentum, and internal energy in addition to the fluid’s other properties. This is known as a Lagrangian approach, which describes fluid particle motion. Second, the change in the fluid properties within a tiny constant element in the space was described using Eulerian considerations. The mathematical representation of the model’s governing laws mentioned above is given below.
Equation (1) is the continuity equation, where ρ is the fluid density, t is the time, and u denotes the velocity vector components in the x, y and z-directions. Since the flow is considered incompressible, the density variation has been assumed to be zero.
ρ t + ( ρ u ) x + ( ρ v ) y + ( ρ w ) z = 0
The viscous stress in the balanced form of momentum is described by the Navier–Stokes equations. Equation (2) below shows the x-momentum, and it can be rewritten in the y and z directions as well.
ρ u t + d i v   ( ρ u u ) = p x + d i v   ( μ   g r a d   u   ) + S M x
where, p is the pressure, μ is the fluid viscosity and S is the source term. This equation can be put in the general form shown in Equation (3) below.
ρ u . u = p + . τ
Here, τ refers to the shear stress tensor and is denoted as x + y + z .
The Reynolds number was calculated to determine the flow regime. The results indicated that the simulation lies in the turbulent region. Accordingly, the computational procedure was adapted to provide better representation for turbulent fluid behavior. The CFD code provides many options to solve and simplify the computational domain. The k-ε domain style is one of these. It has three important sub-models: standard, RNG, and realizable. k-ε models are capable of providing the relationship between the two main parameters in fluid flow problems, namely the kinetic energy and dissipation rate [20].

2.3. Model Geometry

Workbench ANSYS program design modeler software [21], was used to prepare a Pelton turbine parts model that matches the actual design of such a turbine. This represents the first step of the modeling process, where the runner size, casing flow, bucket design, and number of buckets are precisely defined. The details of the turbine geometry and flow parameters are listed in Table 1 and Figure 2 below. A further turbine runner CAD model is provided in Figure 3.

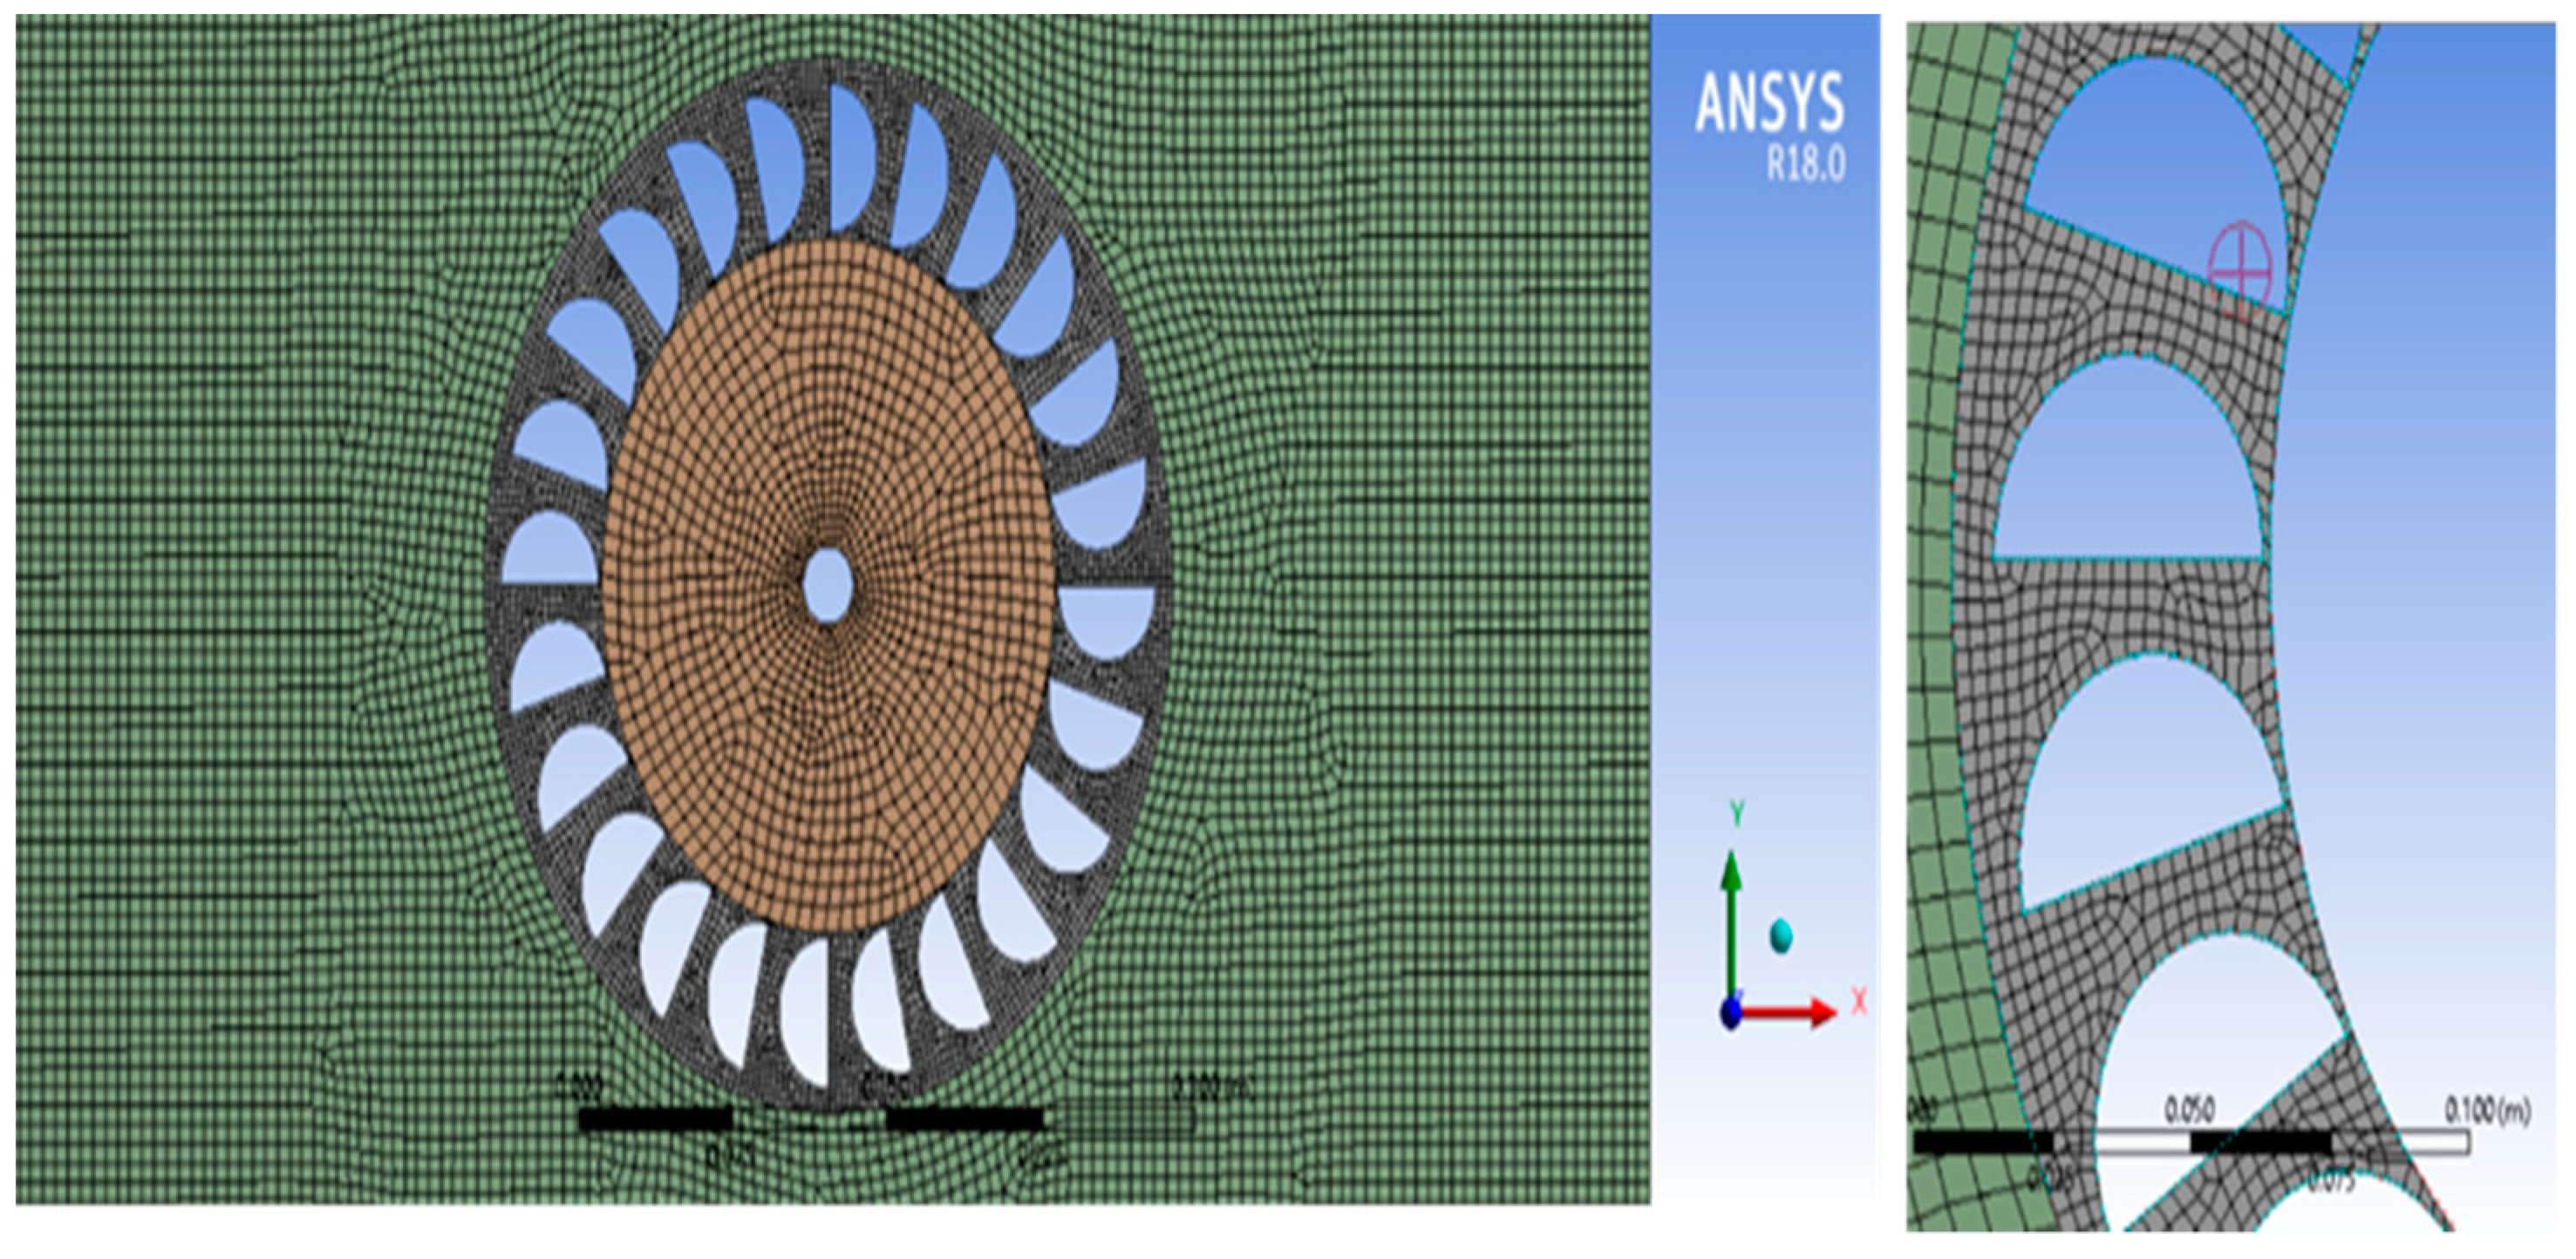
2.4. Mesh Generation

Meshing software [21], was used to generate a proper structural mesh pattern. Due to the design sophistication of the turbine runner and the attached buckets, a structured mesh with hexahedral shape generation is not easily attained. Instead, an unstructured mesh was used. To avoid any discretization issues related to the constructed mesh that could lead to analysis divergence, the mesh in the current study was generated to optimize the meshing process, as shown in Table 2. This table shows the geometry spilt into two parts, the turbine and outer domain; the latter is an outer zone surrounding the turbine. Therefore, these two zones were meshed at different element sizes. The number of elements and the aspect ratio of the elements are presented in Table 2. Since the grids were generated as unstructured meshes, tetrahedral elements were used around some of the small parts to avoid missing any of the surface. The mesh was generated so that an individual tetrahedral element’s growth rate was 1:10, with an average skewness value of 0.25 and average cell quality of 0.85. These parameters are acceptable and close to ideal values according to the ANSYS manual [22]. In Figure 4, the mesh shape is shown. This process produced a mesh that fully covered the surface of the geometry, providing good discretization for the solution.

2.5. Modelling and Boundary Conditions

The flow system in a Pelton turbine is defined by four regions. First is the steady state flow of the distributor and upstream pipes. The second is the water jet beyond the injector. Third is the bucket flow, which is a free surface transient flow, and the last is the casing single-phase flow [23]. After the runner, the flow is directed by the casing wall and therefore is highly turbulent, and inertia is the main driver of its motion. This is due to the loss of the flow kinetic energy when the flow impacts a solid surface or another water sheet.
In the current model, a 2D planer with a gravity option was used for both steady state and transient regimes. A steady state model was used for the mesh in the dependent study and for predicting torque values. Alternatively, a transient model was used for predicting the required time for the rotation rate to become stable during torque determination. A k-ε with standard option and stationary wall function near the wall were utilized in turbulent flow.
The solution method used the SIMPLE scheme to couple pressure and velocity. For spatial discretization, second order and second order upwind were chosen for the pressure and momentum, respectively.
In Figure 3c, the boundary conditions that represent and are applied to the model are discussed below. A Pelton turbine is considered a moving wall that rotates at various rates (24.514, 44, 53.952 and 59.924 rad/s). In Figure 3a,b, the right hand, left hand, and upper sides are symmetric walls. The lower part was used to handle outlet pressure. It is notable that this study can be used to provide useful information for simulation validation. Therefore, the nozzle was ignored, and it was assumed that the fluid flowed into the domain causing the Pelton turbine to rotate at its steady state speed. This assumption was made to avoid model complexity. Further work is planned to investigate the effects of nozzle speed as the Pelton turbine reaches a steady state rotation rate.

3. Results

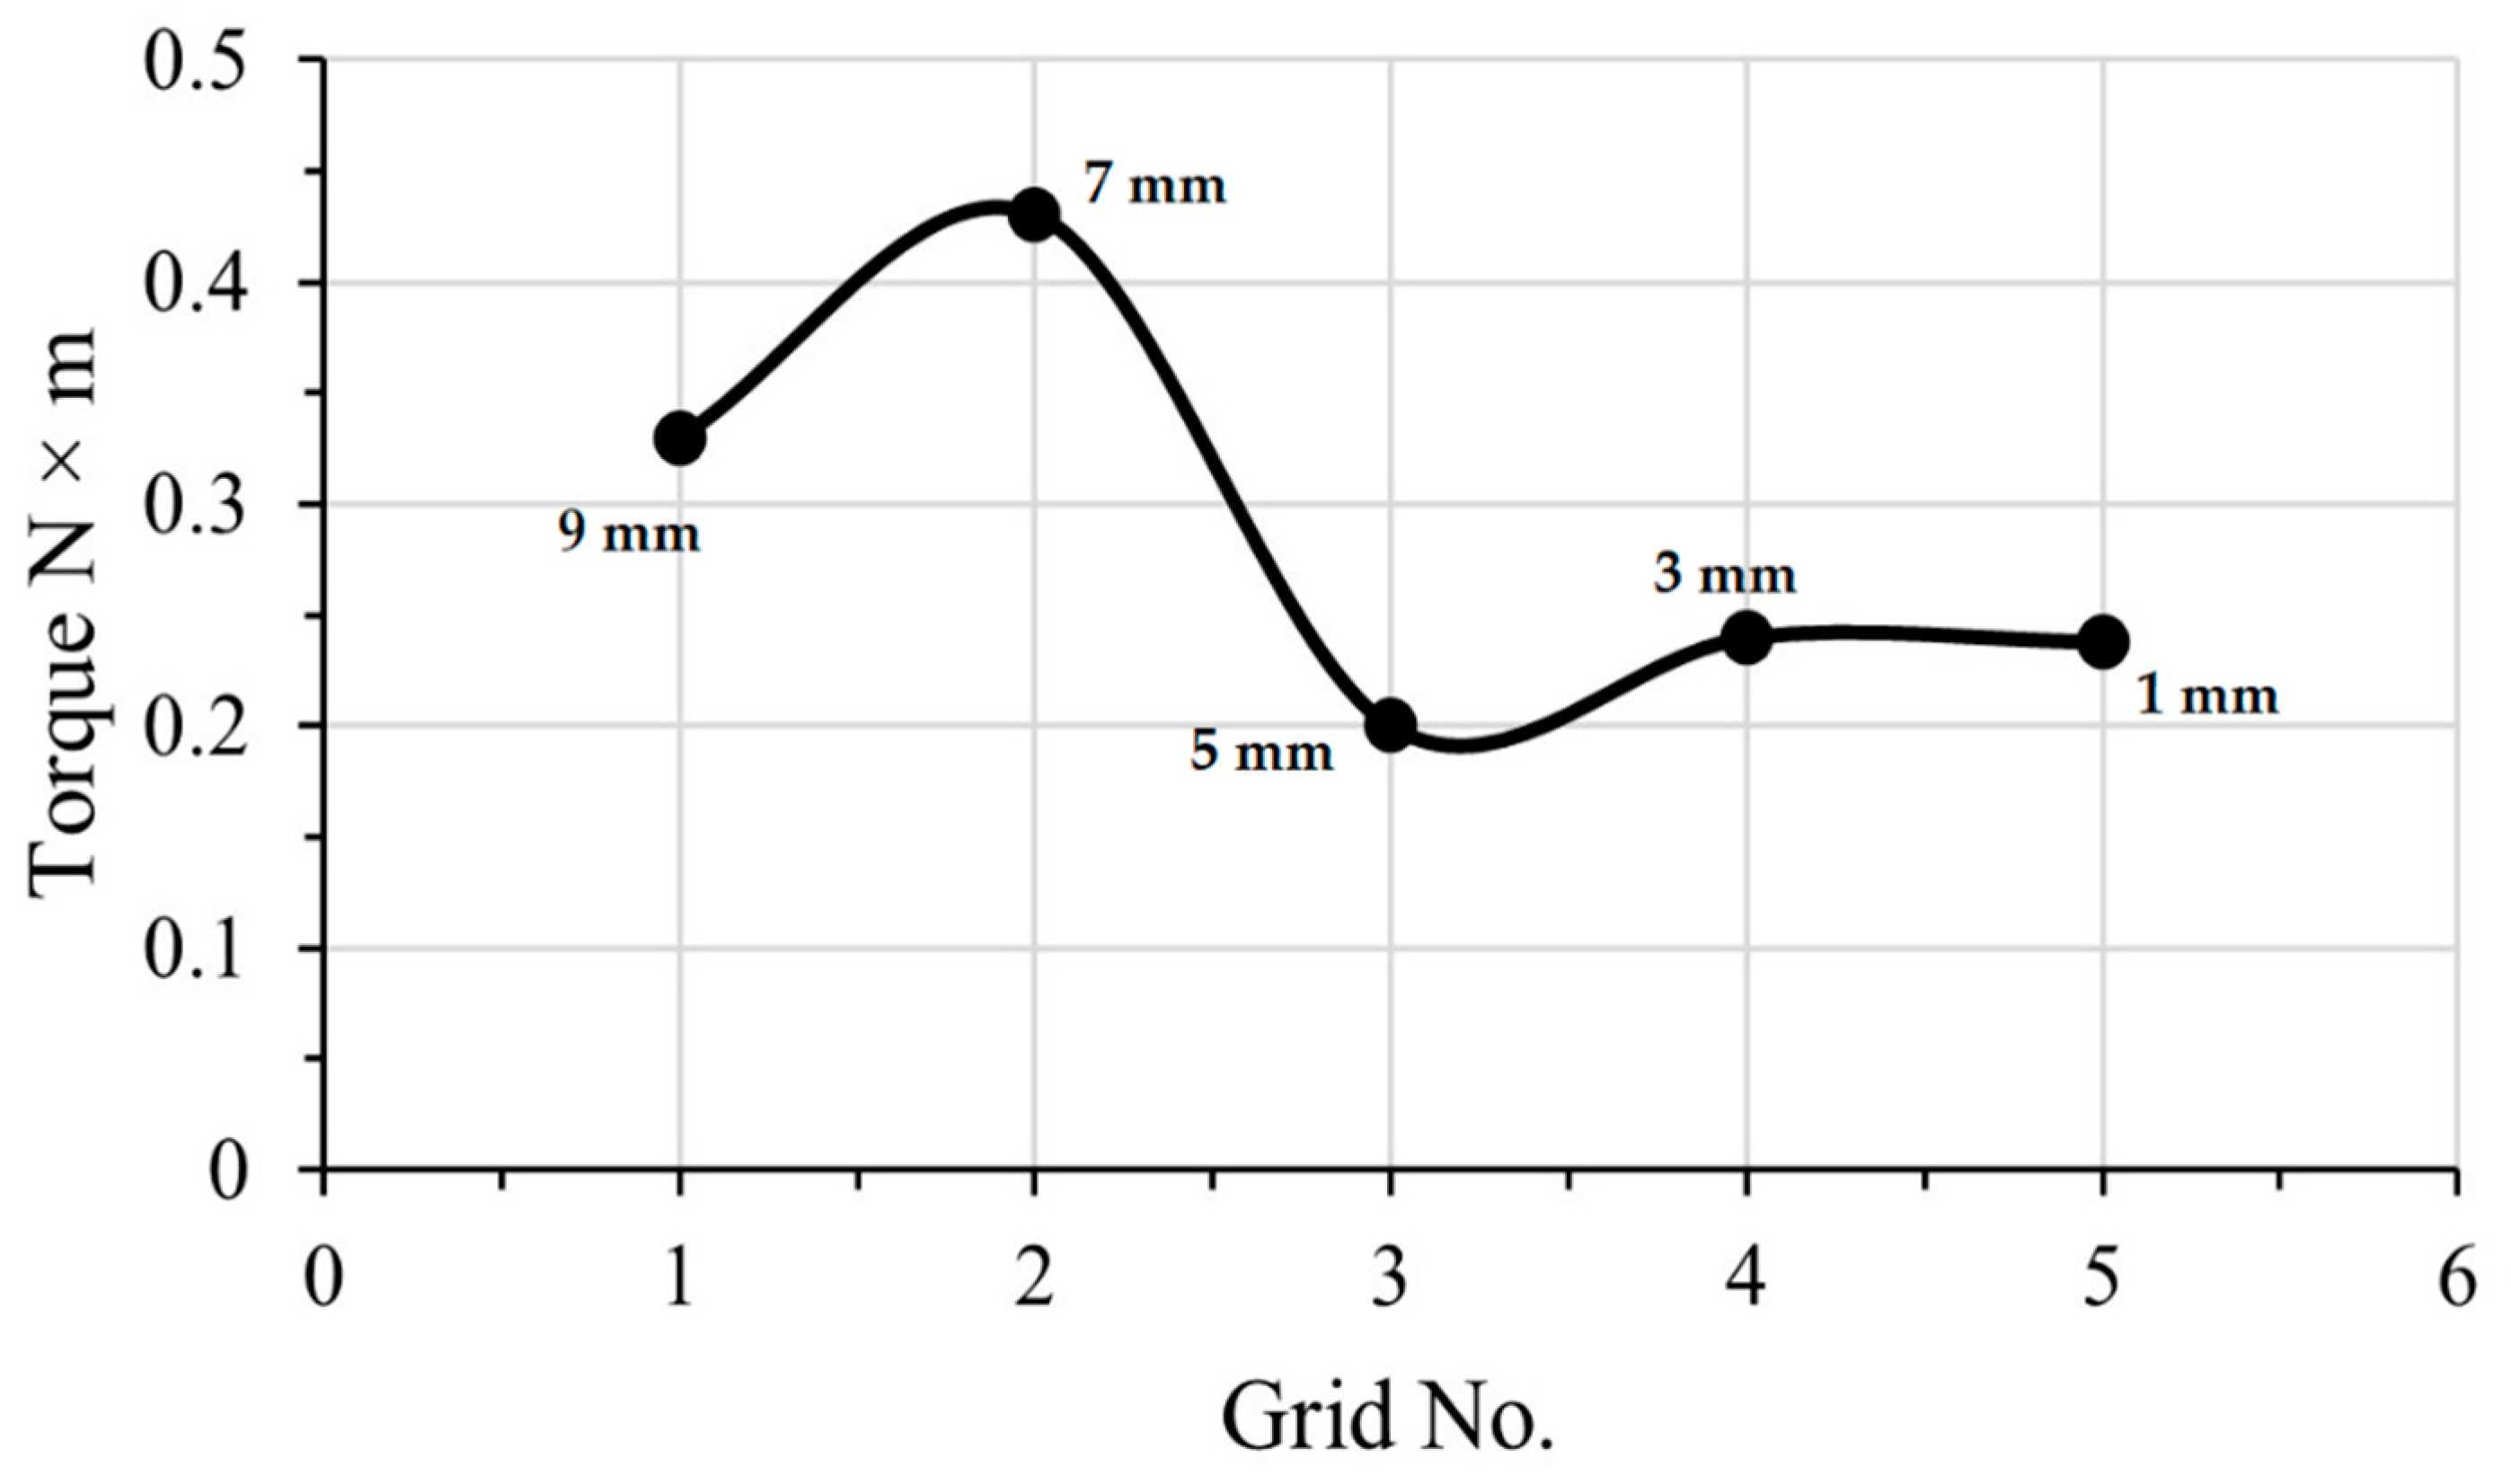
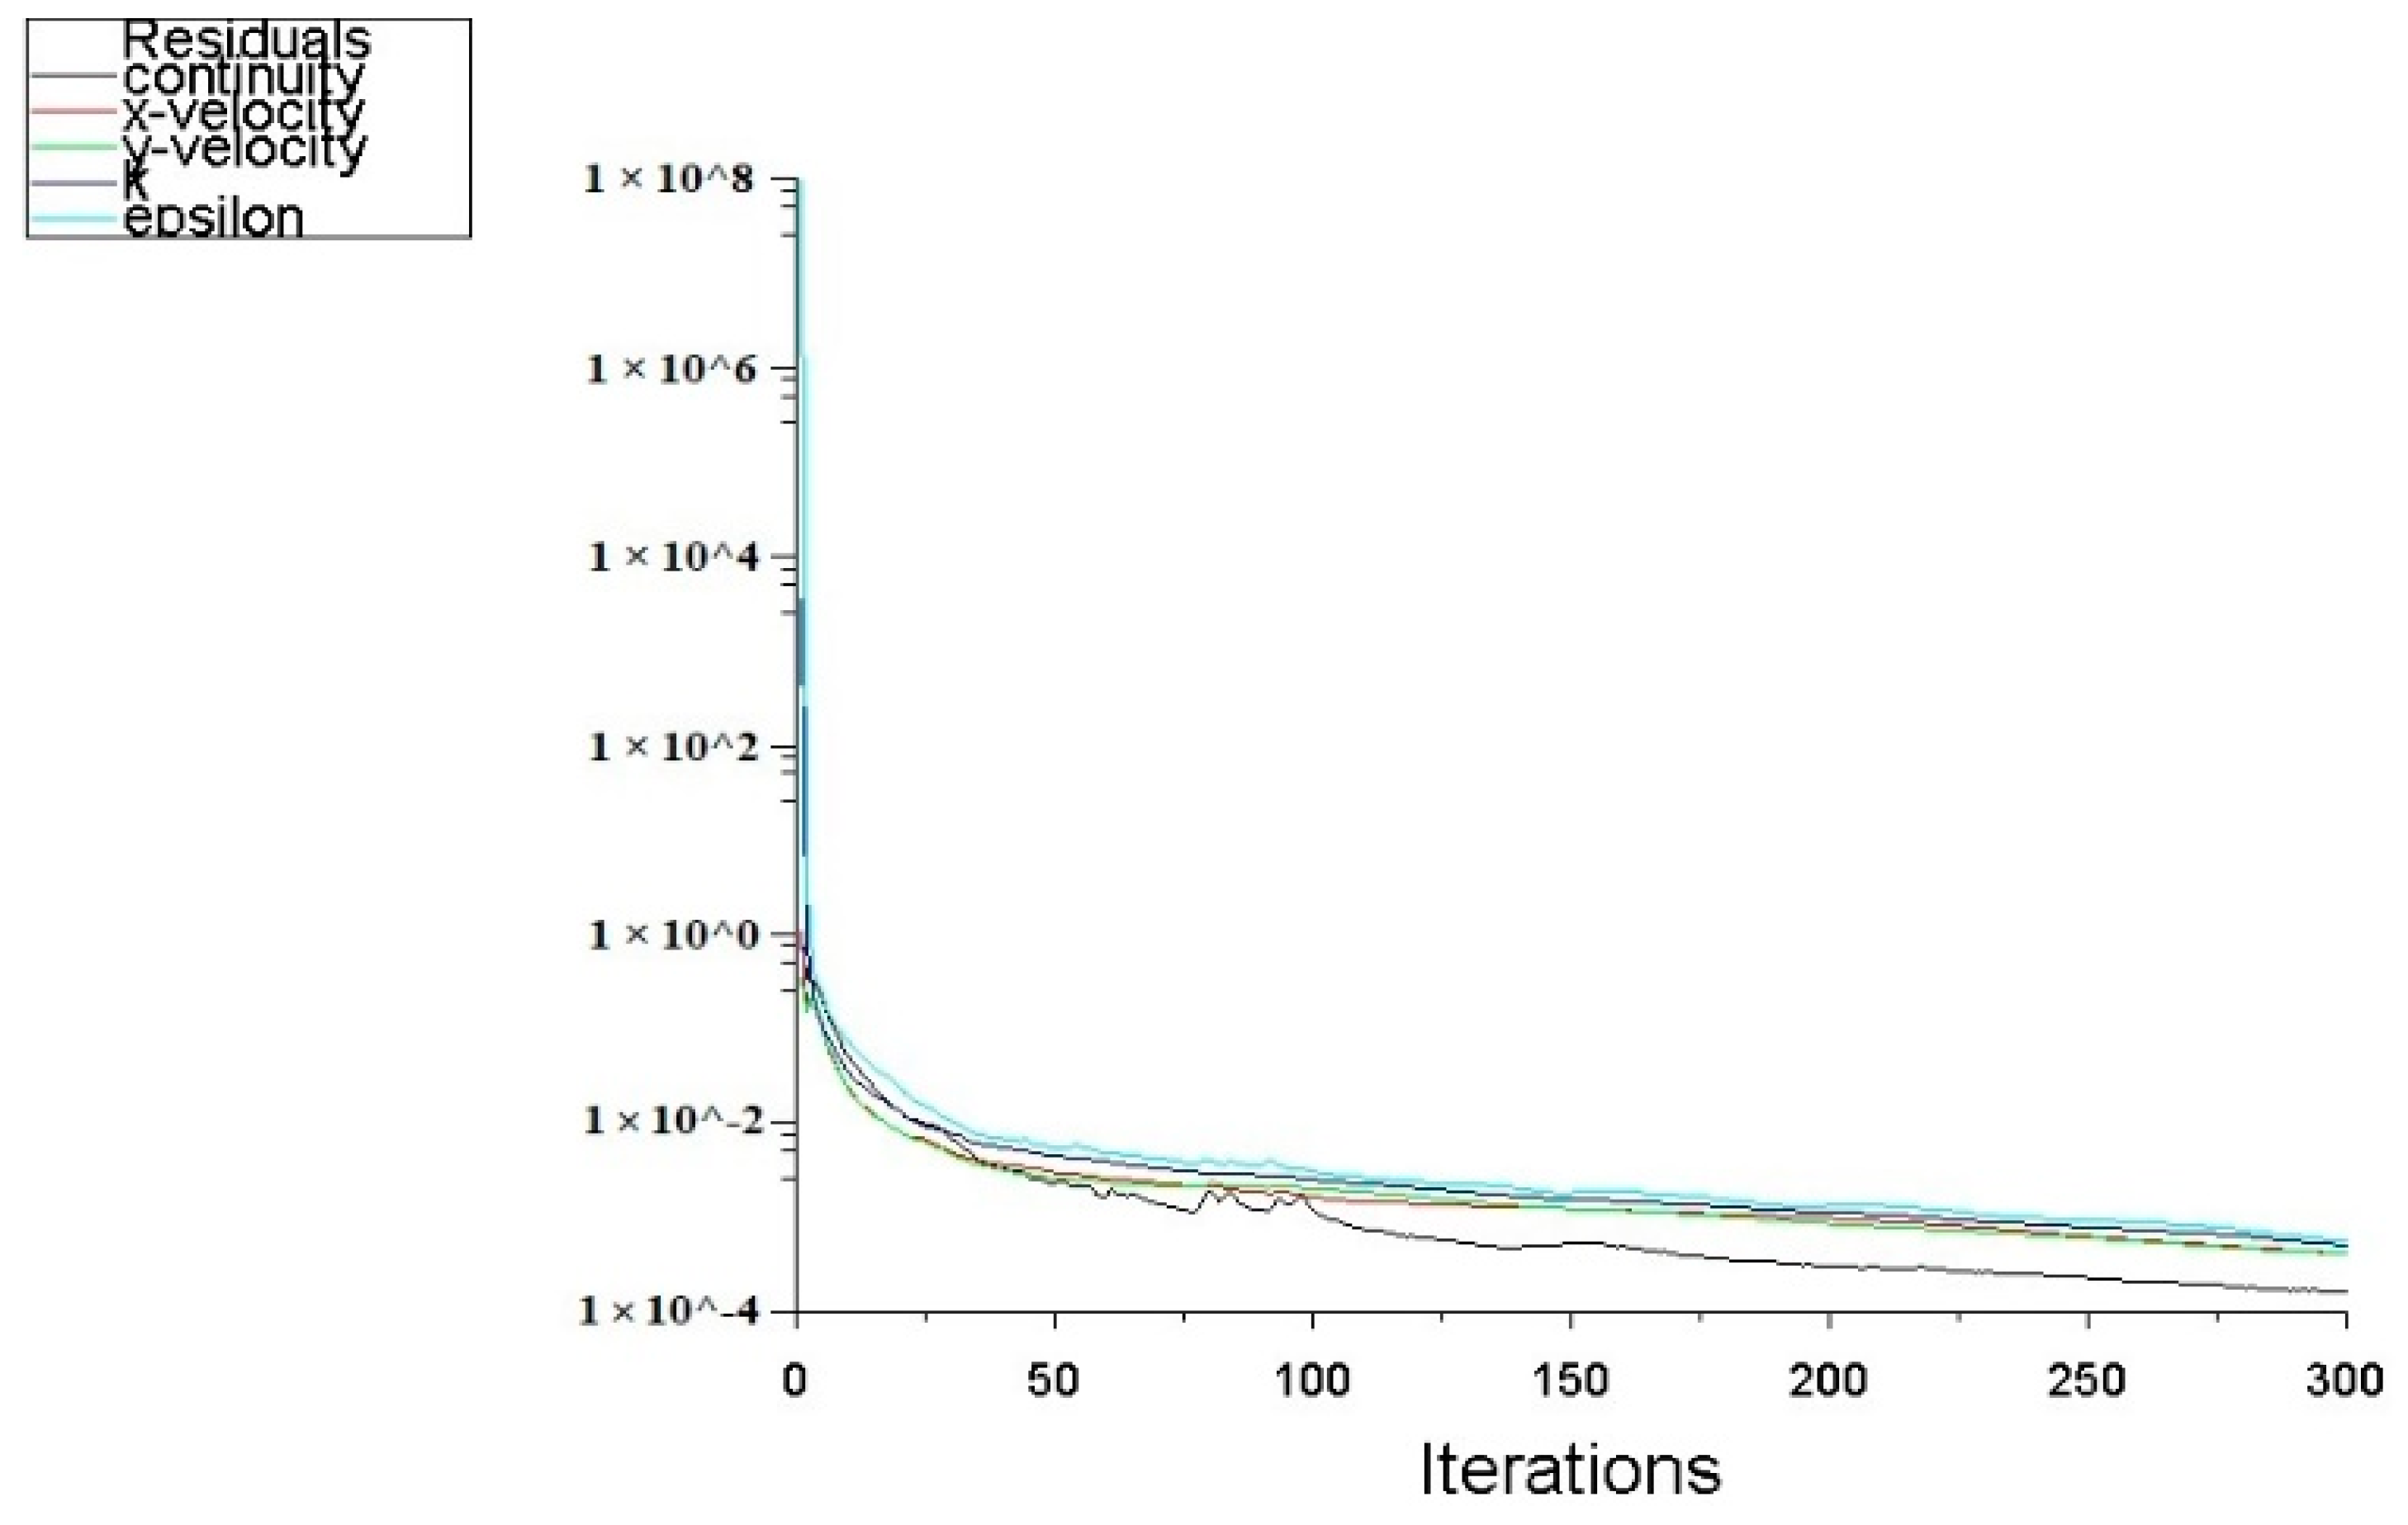
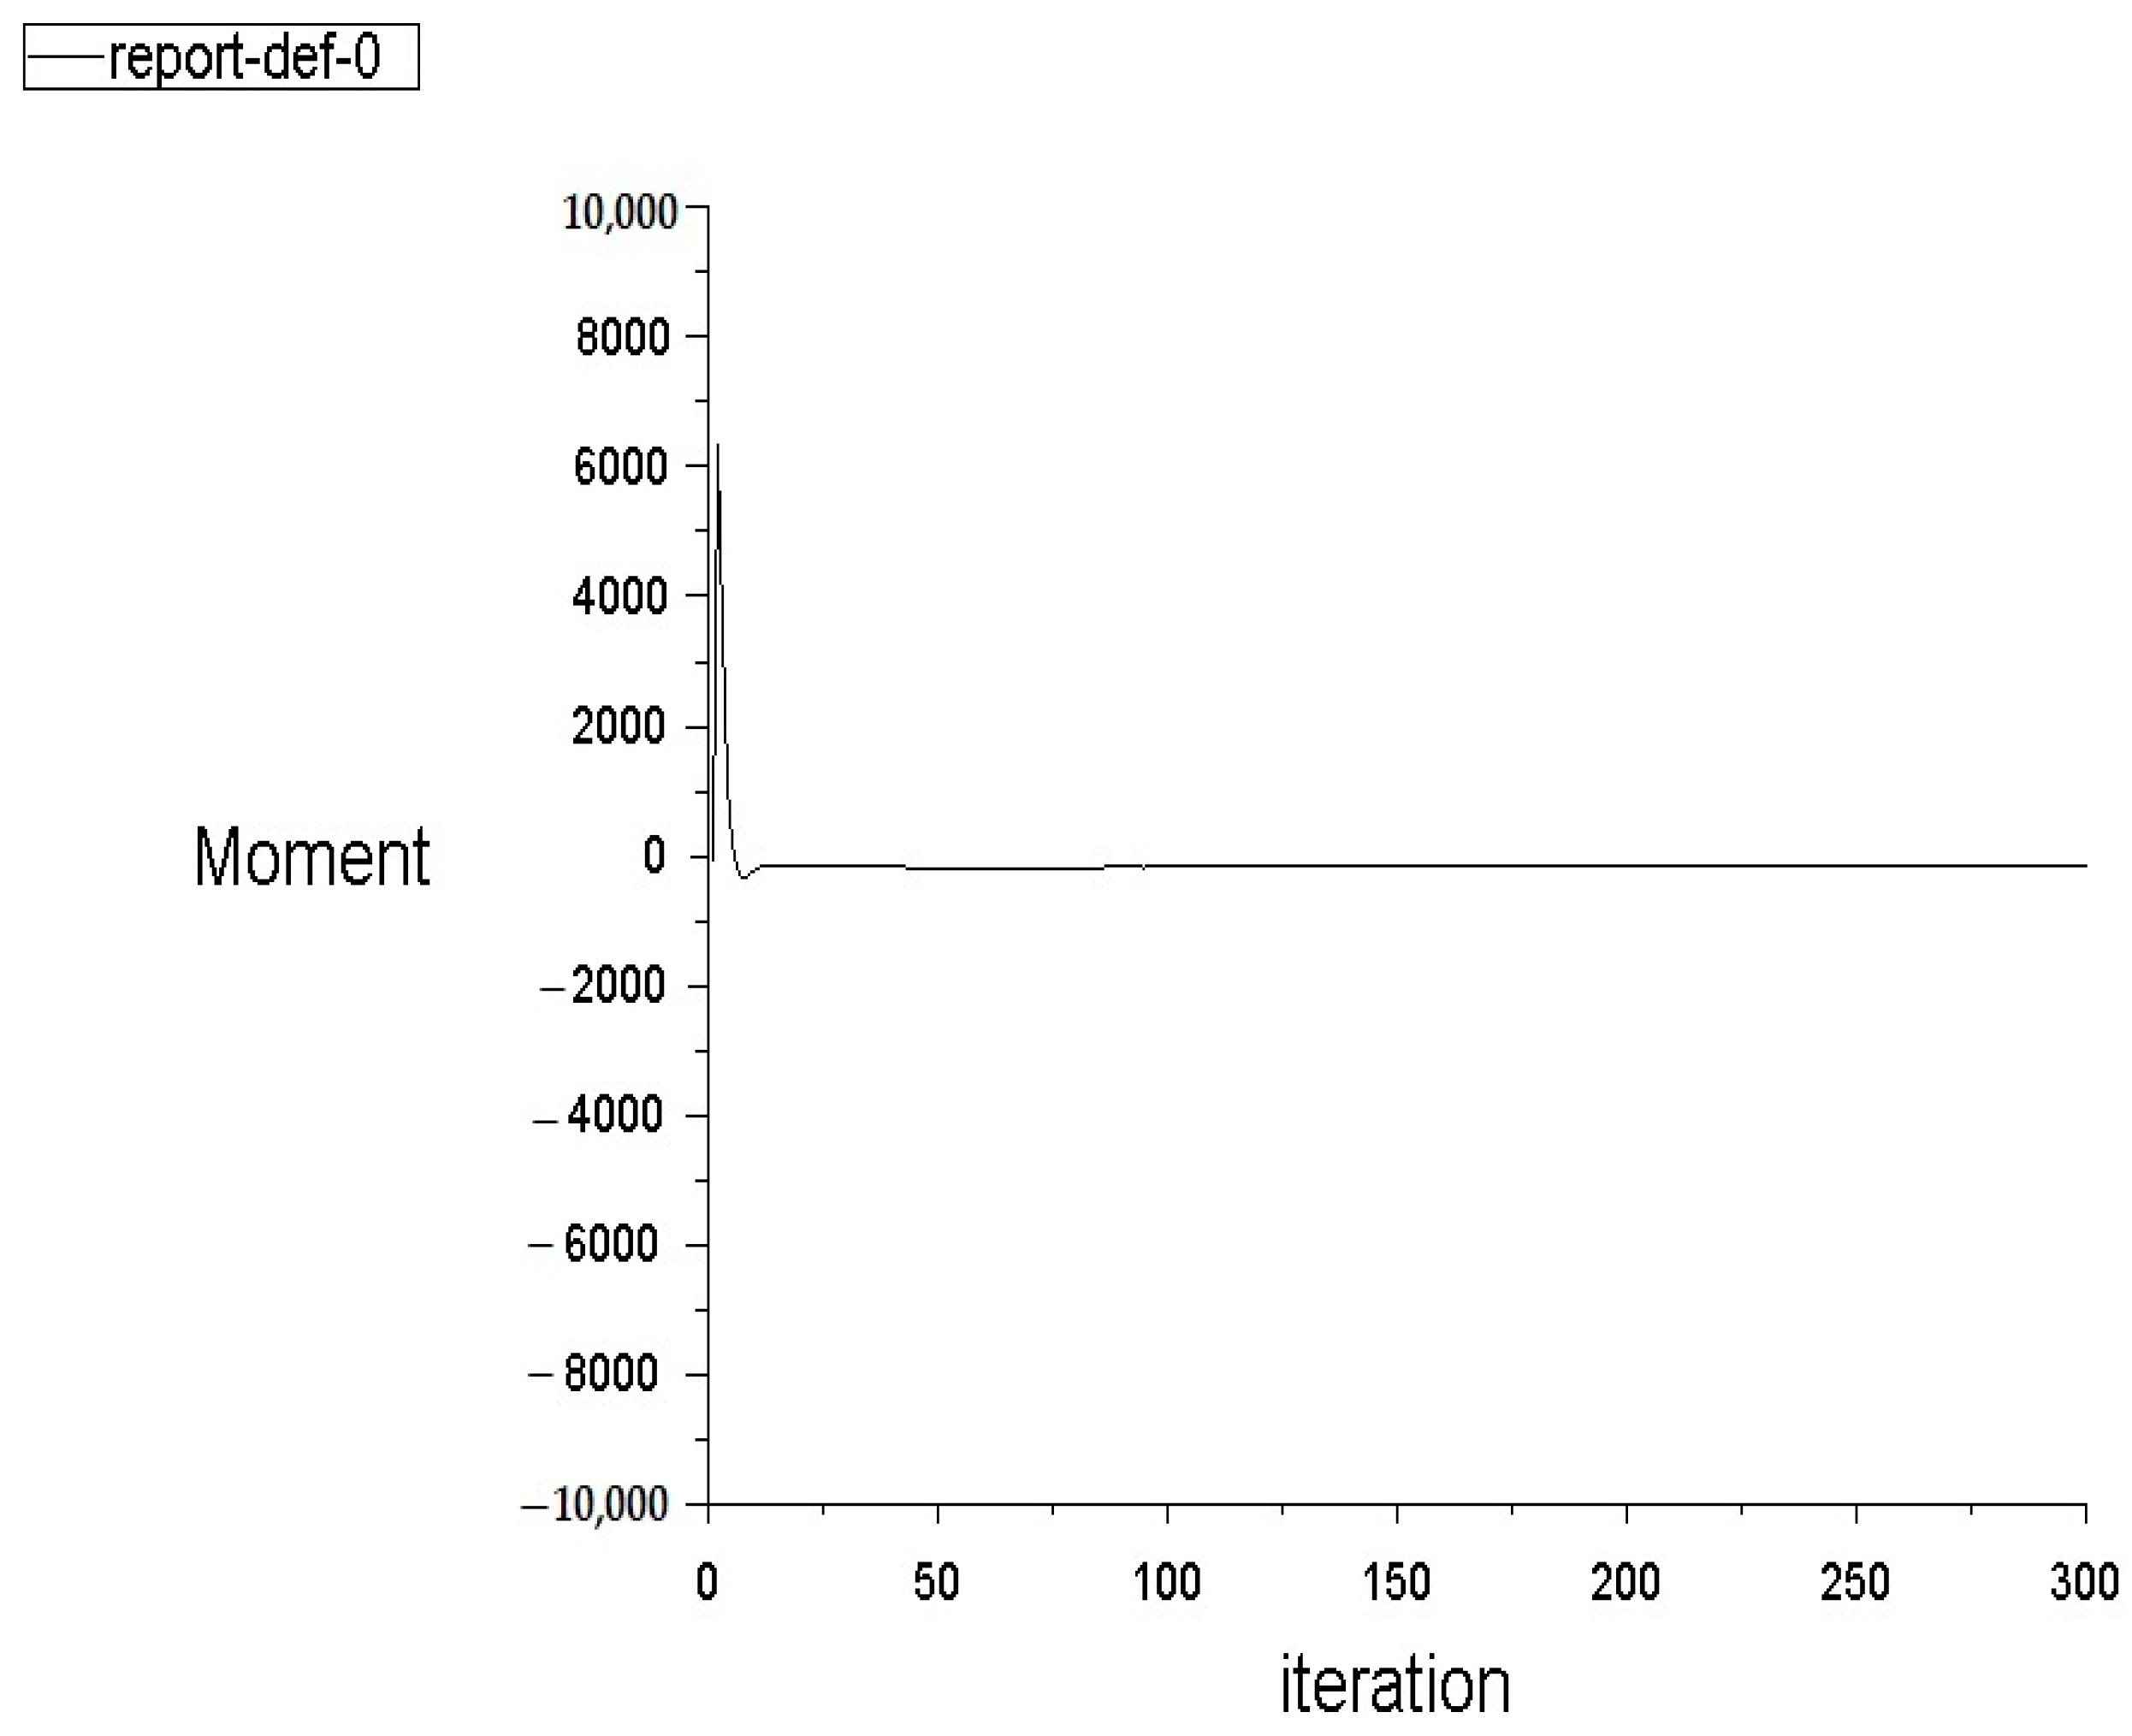
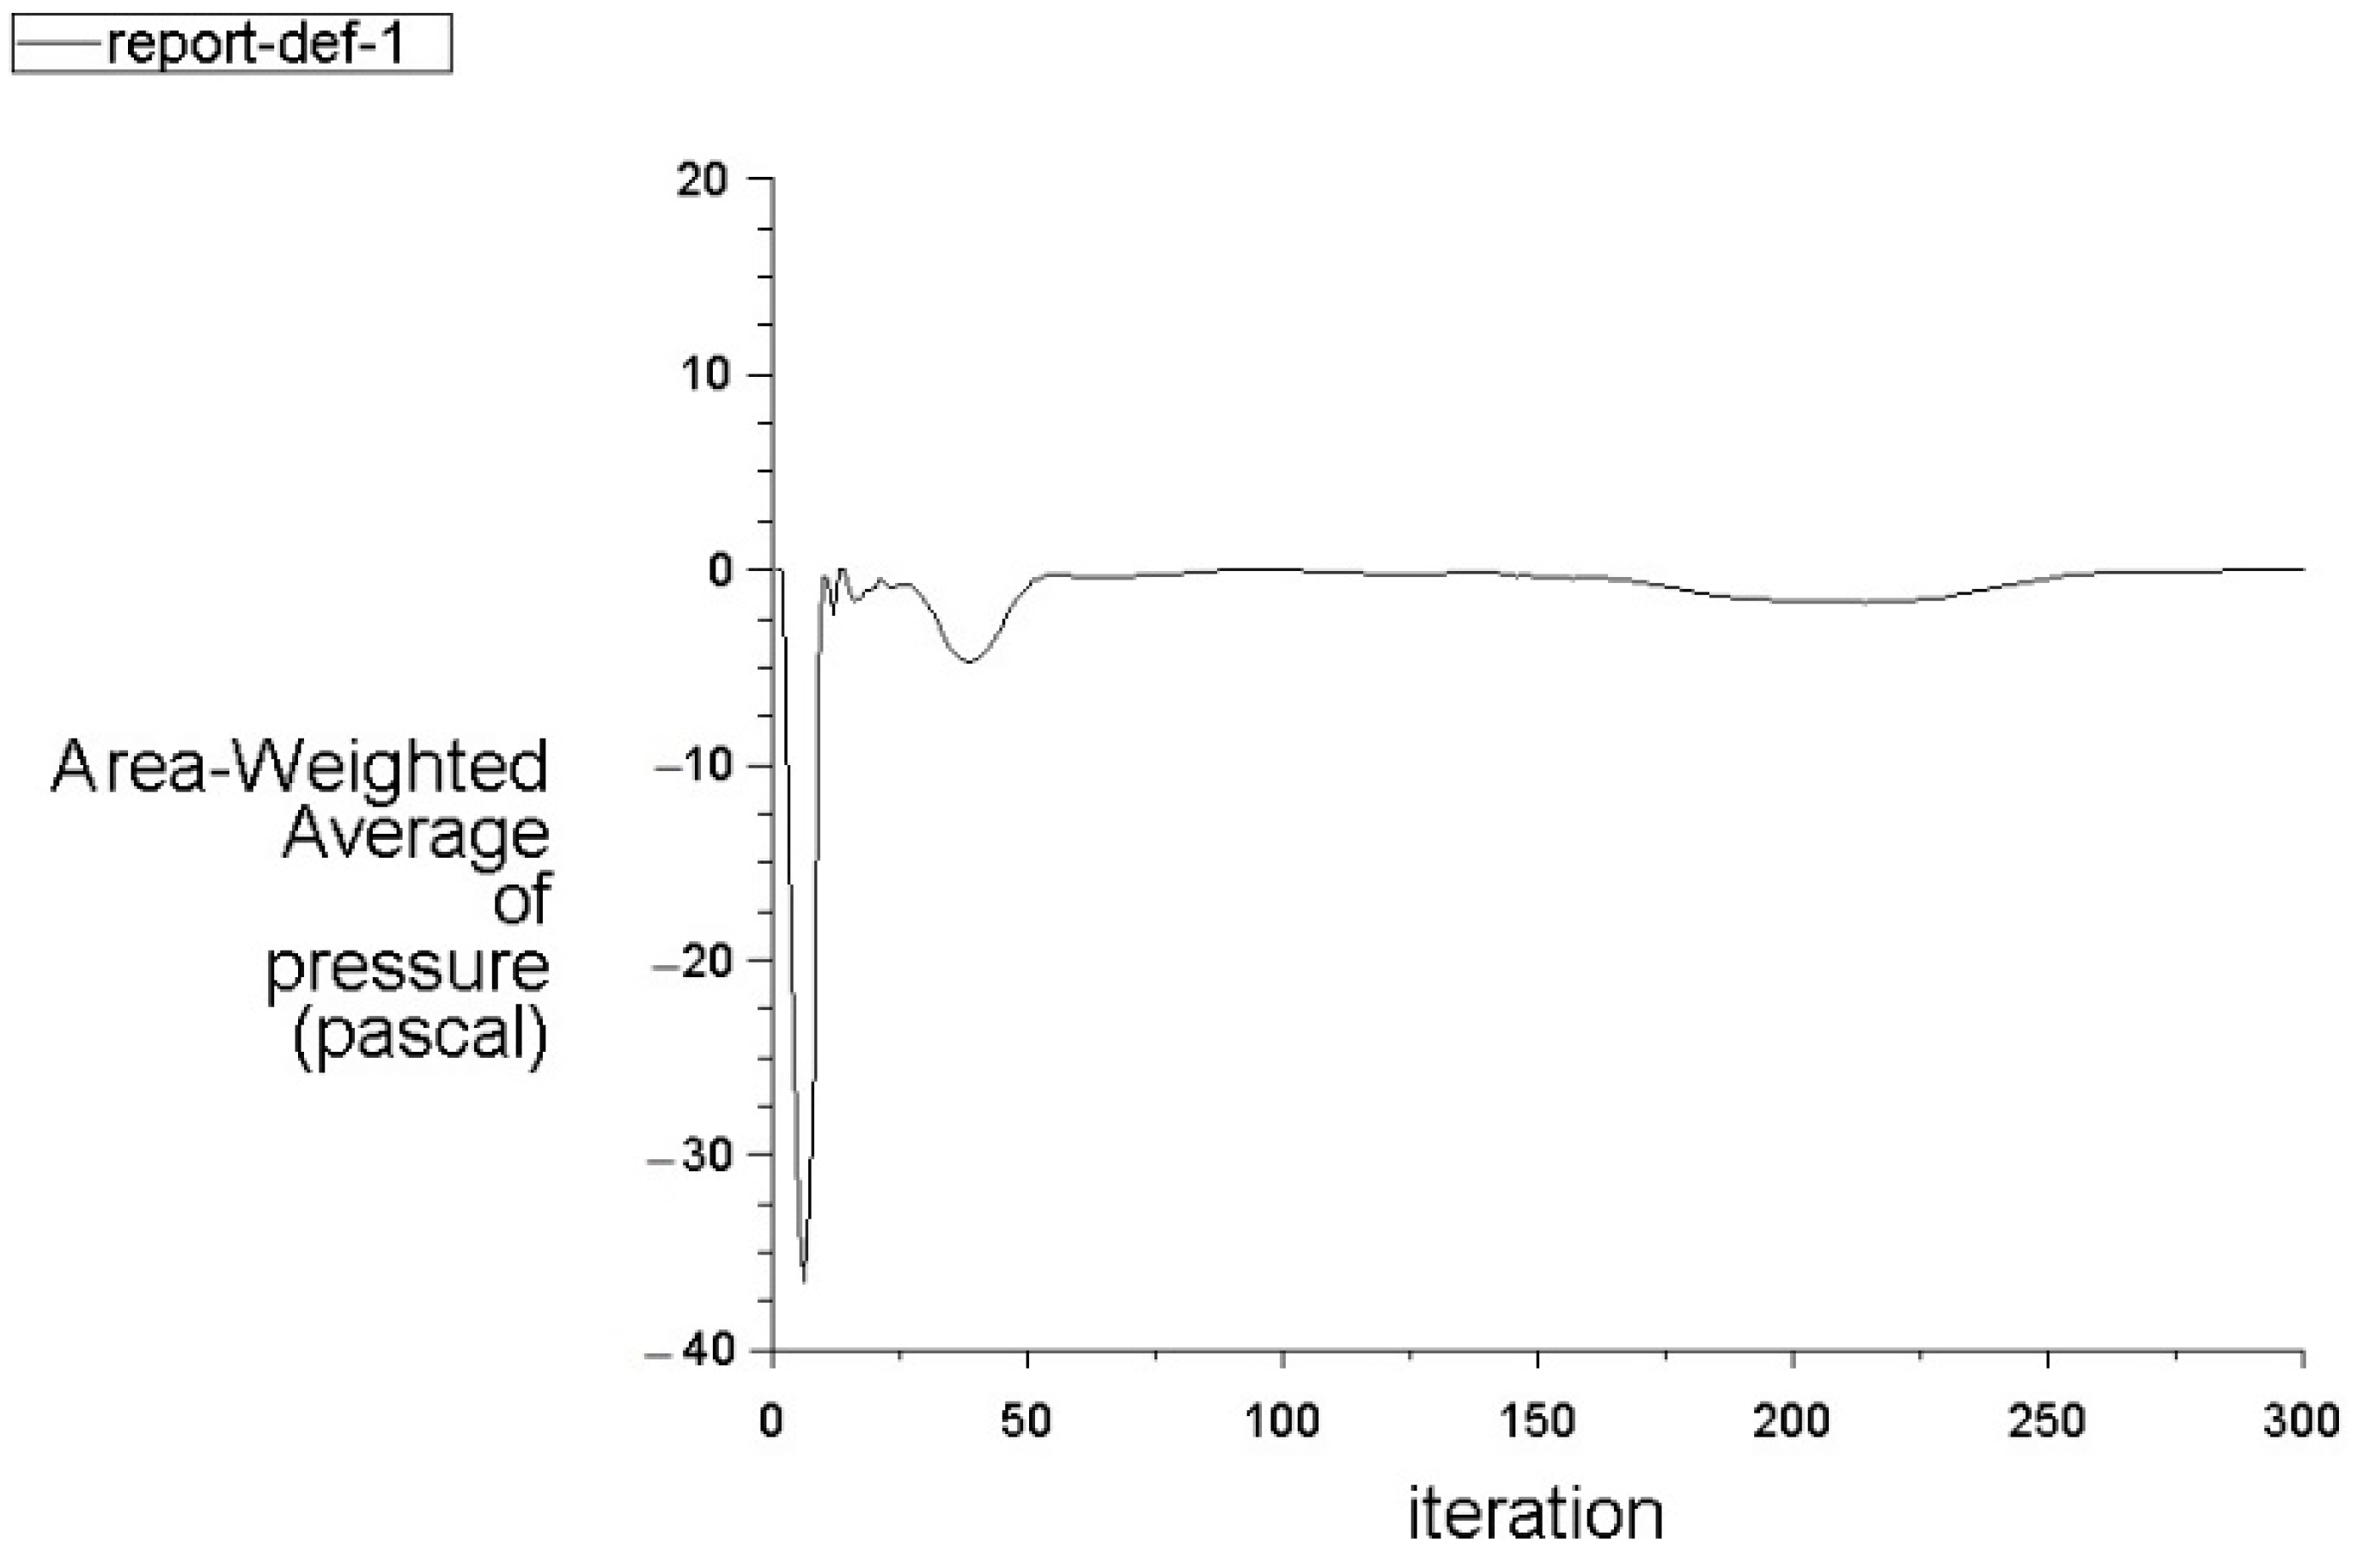
3.1. Mesh and Monitoring the Convergence of the Model

Determination of mesh independence is one of the most important steps in analysis of any numerical simulation. It provides the basis for developing a reasonable level of accuracy for a particular case of a turbulent flow model while conserving computational resources. Discrete element methods have been widely used to solve some CFD numerical models since a continuous solution space can be estimated. This enables capture of the flow features under investigation [24,25]. In the current study, the Pelton turbine model was analyzed at a 24.5 rad/s rotation rate with five grids, as discussed in the previous section. The torque on the turbine shaft was predicted and plotted against the grid types in Figure 5. This determines when the grid size and quality have an effect on the CFD model results. It can be clearly seen that Grids 4 and 5 have similar results. Therefore, Grid 4 was used in subsequent analyses. This outcome can be utilized in future studies or in developing 3D models that require more computational resources and time.
To check the convergence of the developed model, a residual monitoring convergence test was performed. Computational results were continuously checked until the difference between their values in successive iterations converged to a particular degree. This assumes that no significant changes will be seen in parameter values as a result of subsequent iterations. Figure 6 presents the convergence of the residuals. However, this did not provide satisfactory convergence for some cases of fluid flow in the model. Further monitoring is needed to determine whether the solution converged.
Due to the complexity of the current model, moment convergence monitoring was conducted in the area of interest, in this case the turbine buckets. This is presented in Figure 7 below. Moreover, pressure distribution monitoring was near the outlet to avoid the reverse flow that might occur in this region. These results are presented in Figure 8 below. These figures indicate that the solution converges, showing little further change after about 300 iterations.

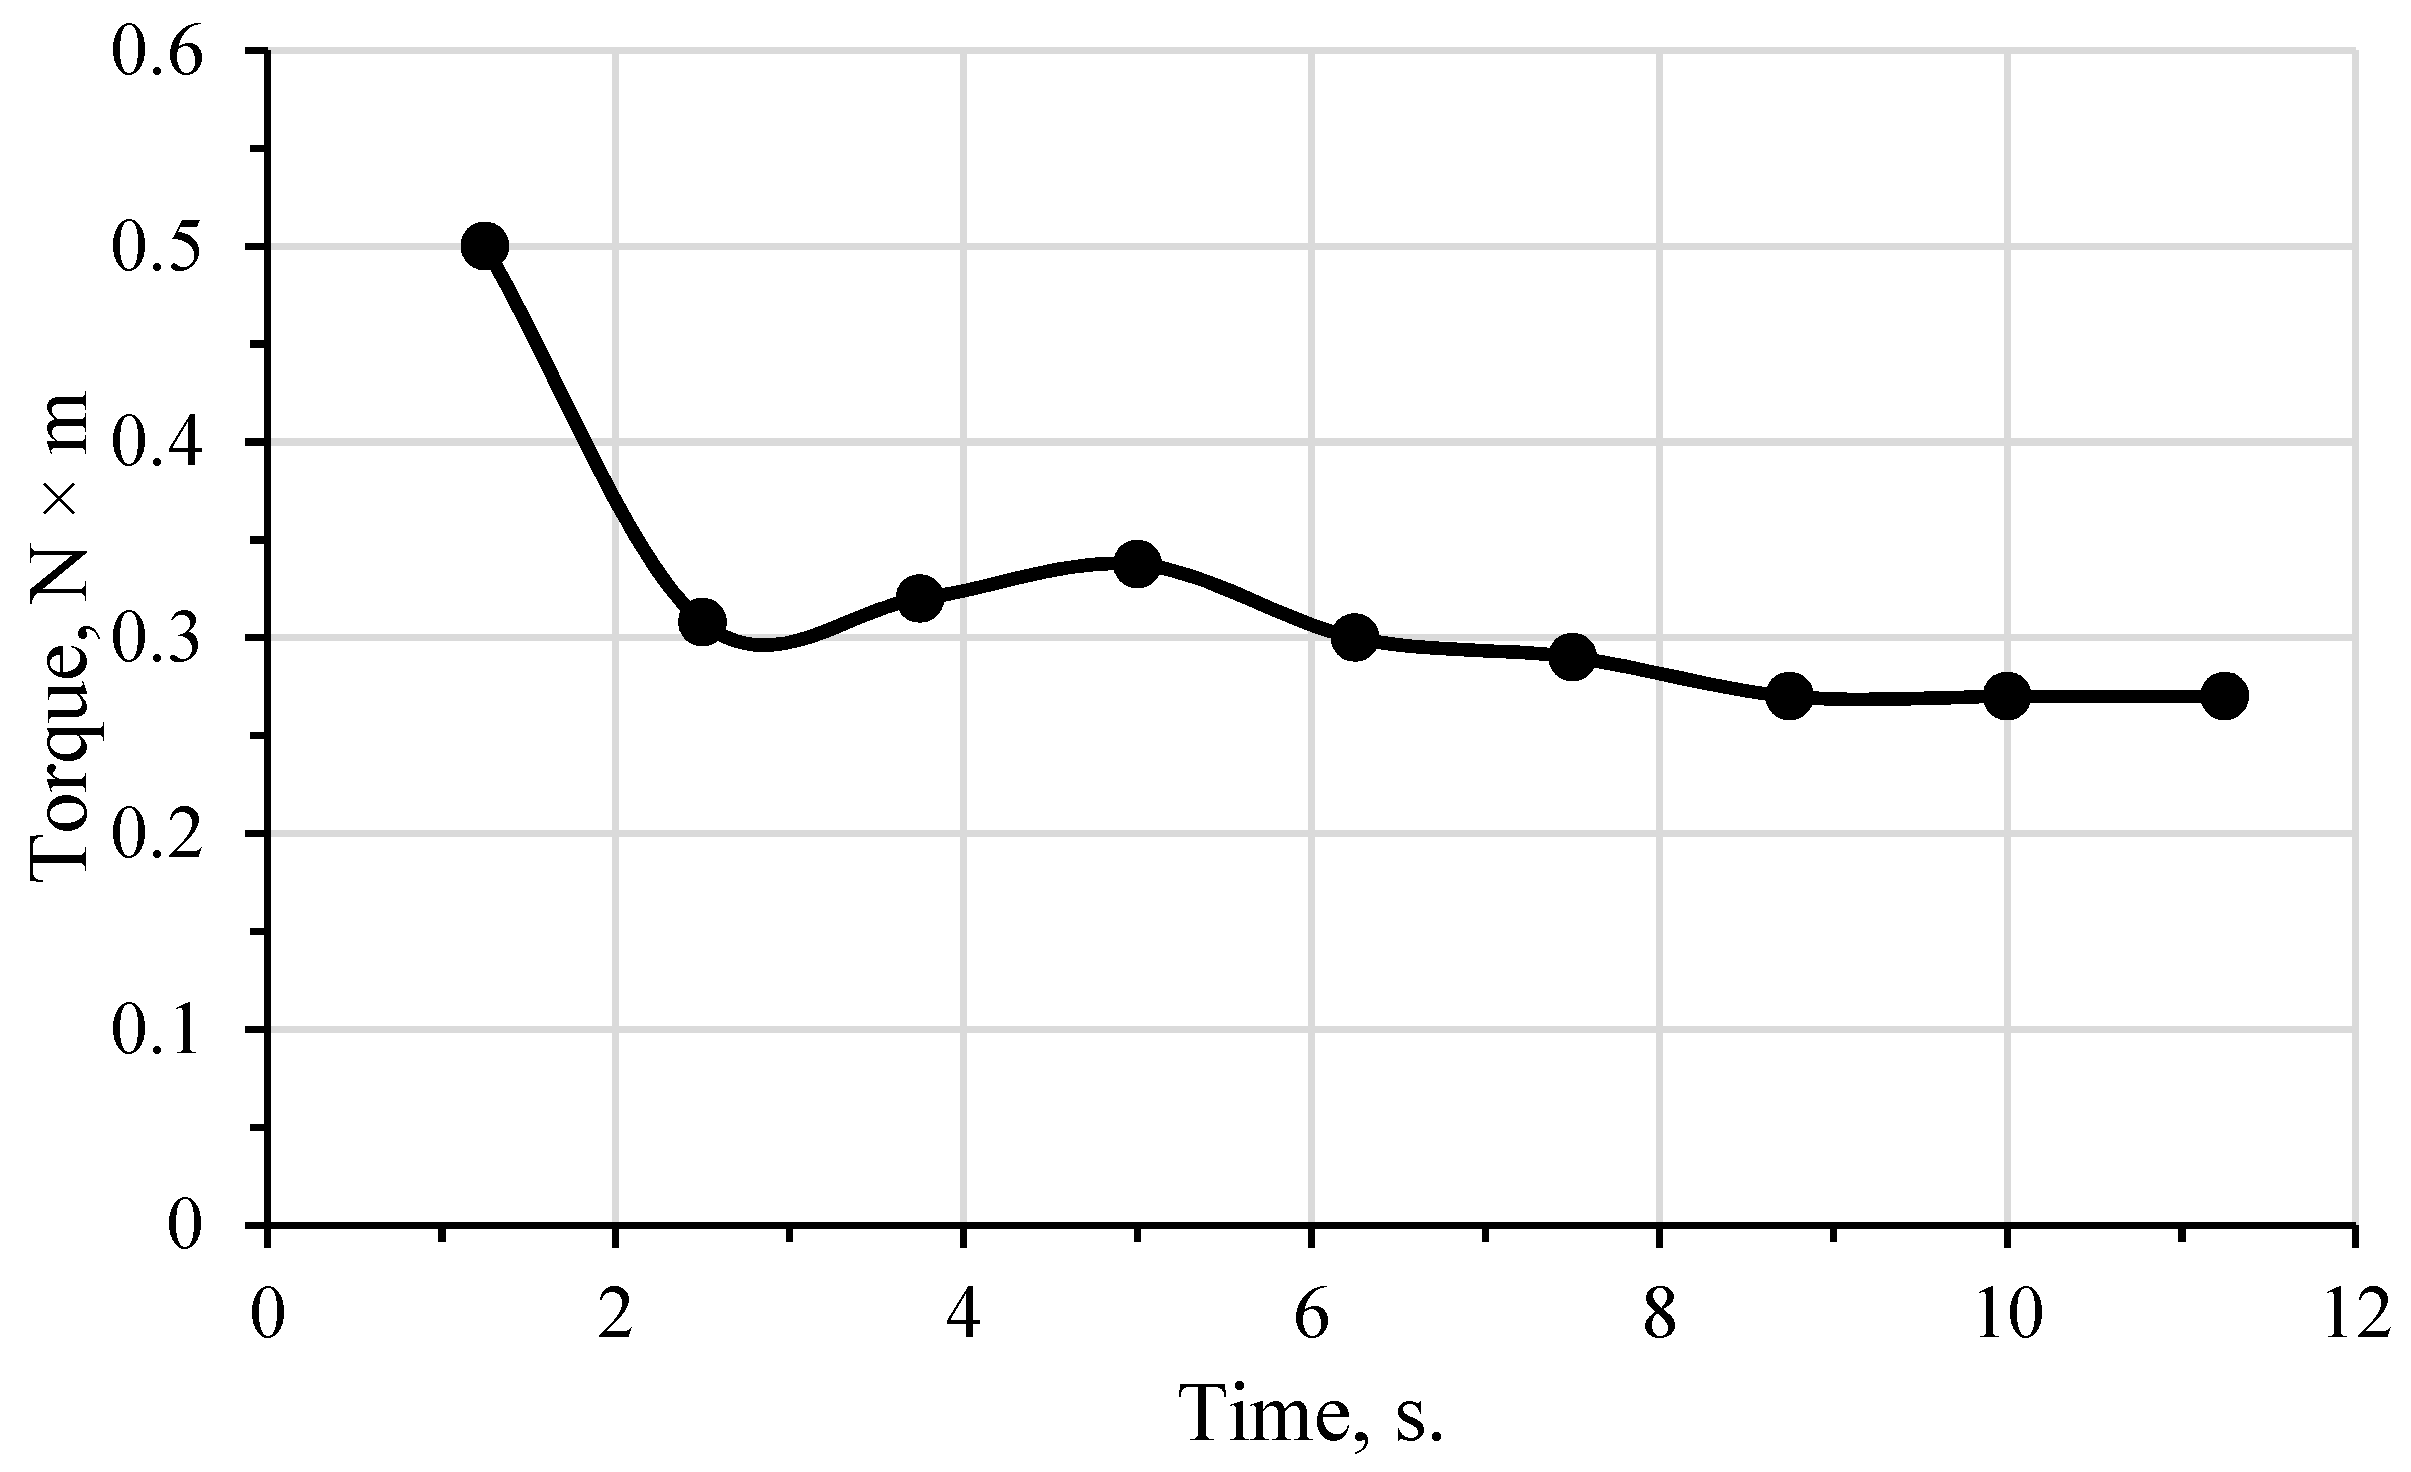
3.2. Model Validation

All CFD numerical simulation models need to be validated to demonstrate their accuracy with consistent results. When a model can successfully reproduce a physical case, its predictions for real cases become more reliable. Consequently, in this study the predicted torque values were compared with the measured values of Obayes and Qasim [15]. These results are shown in Table 3, which indicate that compared differences were reduced with increasing rotation rates. Additionally, this table shows that the average comparison error is approximately 10%, which is quite acceptable in such fluid flow cases. This table can be a useful guide for providing and quantifying potential model inaccuracies. It can be utilized in further experimental testing for this particular design within a range of process parameters.
Figure 9 illustrates the relationship between flow rate and the predicted torque values of the second model. It is clear that within the first five seconds, the torque values are unstable and fluctuate over the range of 0.3 to 0.5 N × m. After six seconds, the plot approaches stability until 8.5 s, when no further change can be seen and the predicted values tend to remain unchanged. It is noteworthy that this time to reach stability was reported by Obayes and Qasim [15]. Figure 9 demonstrates an important procedure to avoid unnecessary and expensive experiments that require longer time to reach the stability before achieving useful torque predictions.

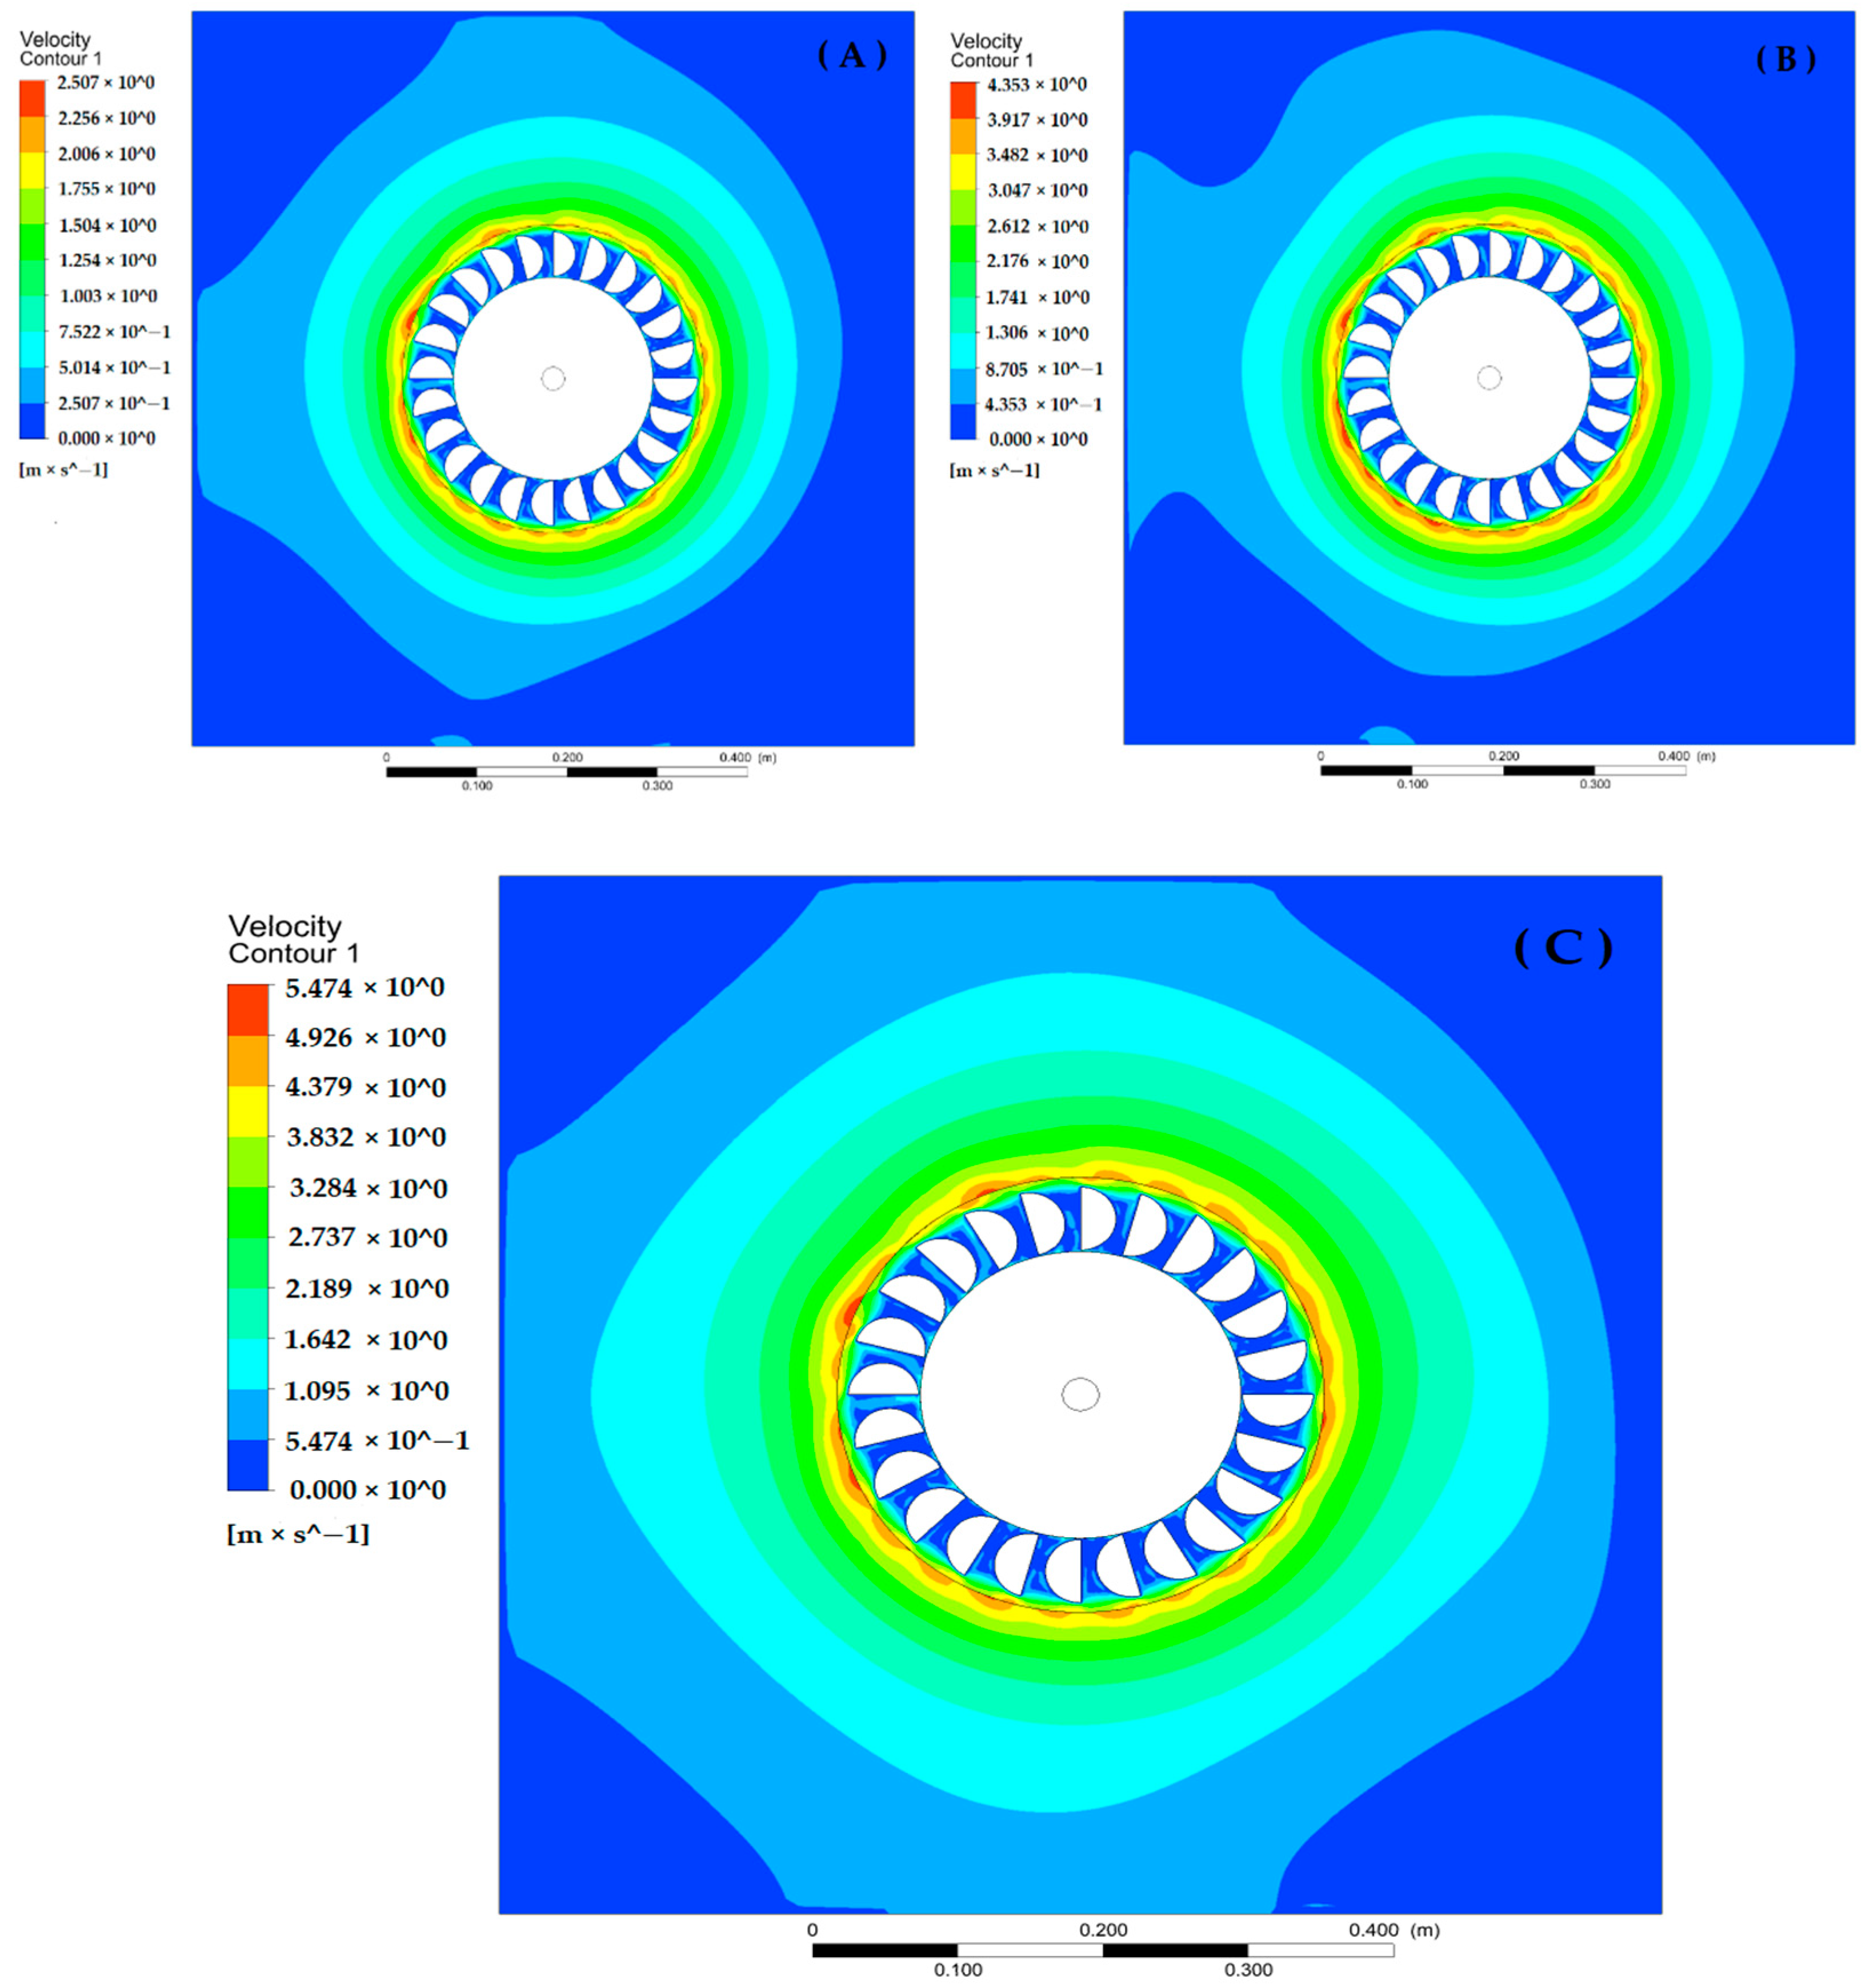
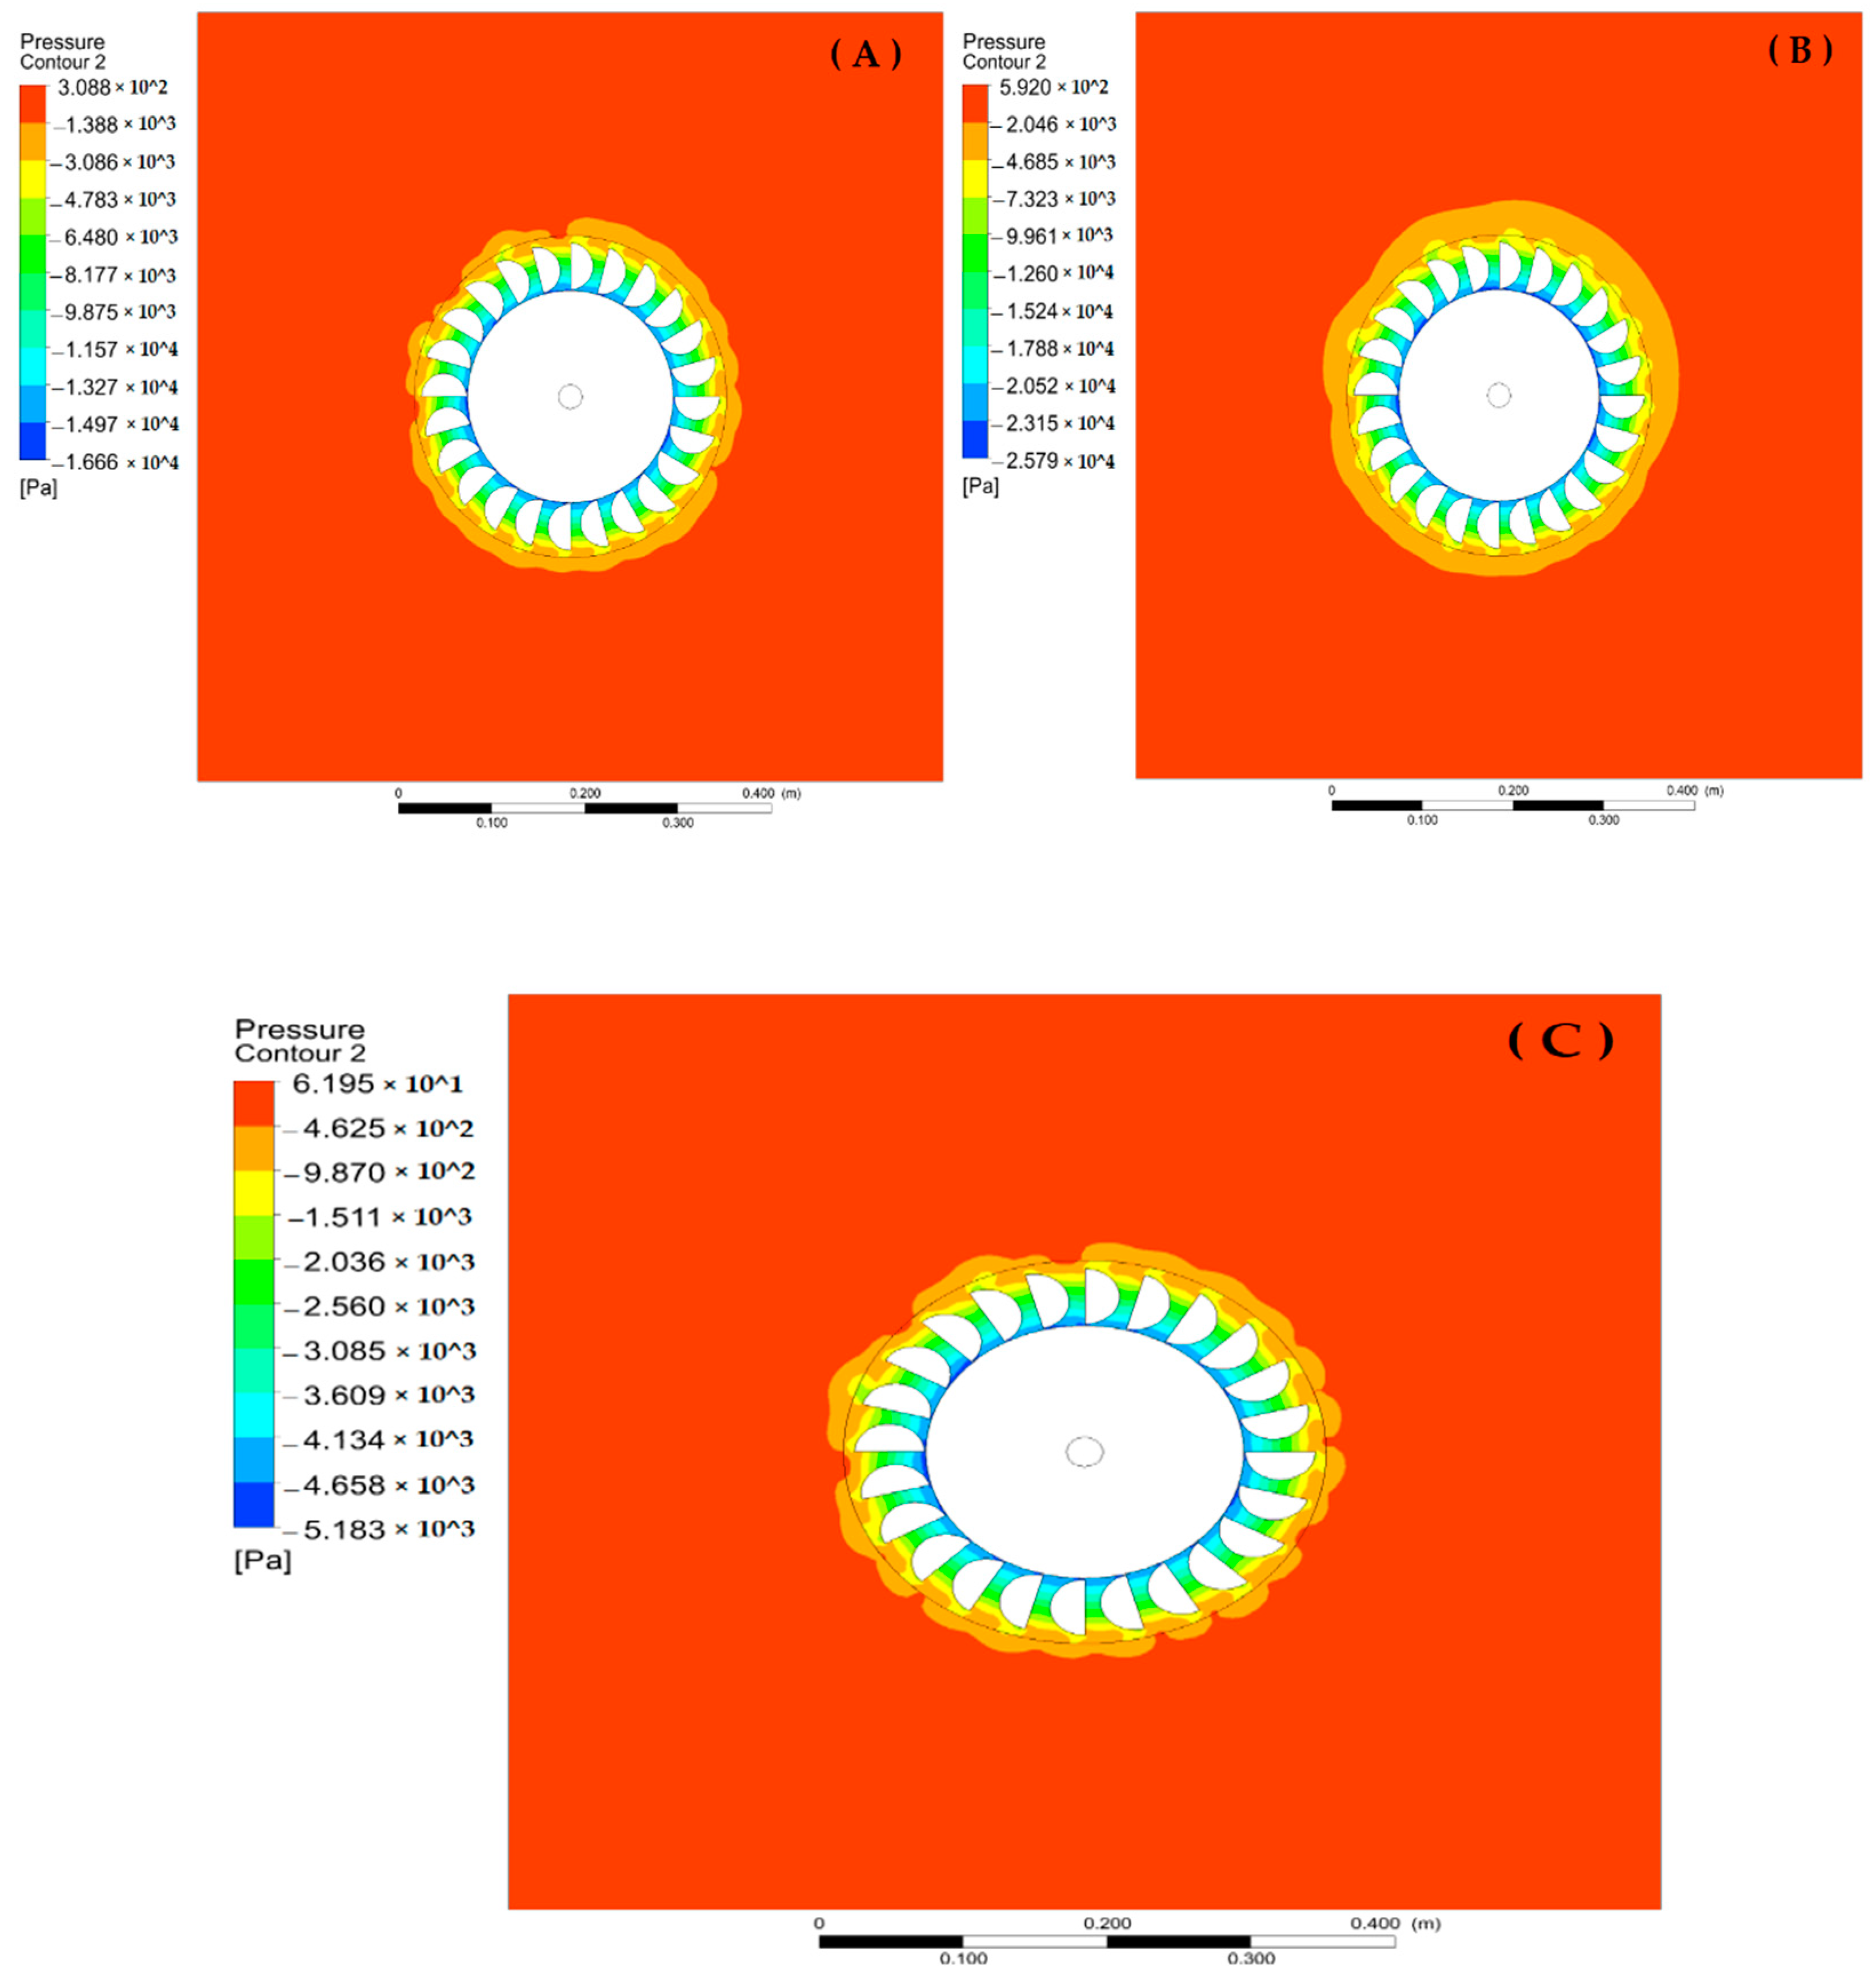
3.3. Fluid Flow Behavior

The fluid properties investigated using the CFD model of the current study are the velocity and pressure profiles. A velocity contour was obtained from the model after the solution satisfied the convergence criteria. Figure 10 presents the velocity contours at three different rotational speeds (24, 44, and 54 rad/s). It was observed that the velocity had higher values (2.5, 4.35, and 5.47 m/s, respectively) at the outer edges of the Pelton buckets. Moreover, when the fluid reached the inner side of the turbine buckers, the fluid velocity near the shaft clearly decreased.
Generally speaking, as the rotation rate increased, the velocity values of the rotating parts near the outer edge increased and had the highest values at the outer edges of the turbine buckers. This is the region in contact with the outer domain. Moreover, another interesting point in this study is that the flow behavior seems to be similar to that around rotating cylinders [26]. On the contrary, Figure 11 shows a pressure drop at the outer edges of the buckers due to fluid separation. This behavior is discussed in the literature. It is one of the important fluid flow characteristics. The velocity profile is directly proportional to the pressure [27].

4. Conclusions

In the current study, a CFD model for Pelton turbine flow parameters was developed. The model is based on the principles of conservation of mass, Newton’s second law, and the first law of thermodynamics to predict the torque produced by the turbine at different rotational speeds. This Pelton turbine model was analyzed at a 24.5 rad/s rotation rate with five grids. The torque on the turbine shaft was predicted. This determines when the grid size and quality have an effect on the CFD model results. It can be clearly seen that Grids 4 and 5 have similar results. Therefore, Grid 4 was used in subsequent analyses. These outcomes can be utilized in future studies or in developing 3D models that require more computational resources and time.
The robustness of the model was demonstrated by comparing its outcomes with published experimental results for a similar turbine under the same operating conditions. The validation process revealed that the model was able to precisely predict the experimentally measured quantities. This makes the developed model an effective tool for design and modification processes.

Author Contributions

Conceptualization, M.A.Q. and V.I.V.; methodology, M.A.Q., A.O.H., T.Z.F. and F.A.E.; software, M.A.Q.; validation, M.A.Q., S.E.S. and V.I.V.; formal analysis, M.A.Q.; investigation, M.A.Q.; resources, S.E.S., V.I.V., F.A.E., T.Z.F. and M.A.Q.; data curation, M.A.Q. and A.O.H.; writing—original draft preparation, M.A.Q.; writing—review and editing, M.A.Q.; visualization, M.A.Q., supervision, V.I.V.; project administration, M.A.Q.; funding acquisition, M.A.Q. All authors have read and agreed to the published version of the manuscript.

Funding

This research received no external funding.

Data Availability Statement

All important data is included in the manuscript.

Acknowledgments

The authors extend their appreciation to Mustafa F. Mohammed and Jeffrey C. Nash, as well as to our university library (URFU), for their support in completing this research.

Conflicts of Interest

The authors declare no conflict of interest.

References

  1. Fortaleza, B.N.; Juan, R.O.S.; Tolentino, L.K.S. IoT-based pico-hydro power generation system using Pelton turbine. J. Telecommun. Electron. Comput. Eng. (JTEC) 2018, 10, 189–192. [Google Scholar]
  2. Dehghani, M.; Riahi-Madvar, H.; Hooshyaripor, F.; Mosavi, A.; Shamshirband, S.; Zavadskas, E.K.; Chau, K.W. Prediction of hydropower generation using grey wolf optimization adaptive neuro-fuzzy inference system. Energies 2019, 12, 289. [Google Scholar] [CrossRef] [Green Version]
  3. Serpoush, B.; Khanian, M.; Shamsai, A. Hydropower plant site spotting using geographic information system and a MATLAB based algorithm. J. Clean. Prod. 2017, 152, 7–16. [Google Scholar] [CrossRef]
  4. De Faria, F.A.; Davis, A.; Severnini, E.; Jaramillo, P. The local socio-economic impacts of large hydropower plant development in a developing country. Energy Econ. 2017, 67, 533–544. [Google Scholar] [CrossRef]
  5. Kadier, A.; Kalil, M.S.; Pudukudy, M.; Hasan, H.A.; Mohamed, A.; Hamid, A.A. Pico hydropower (PHP) development in Malaysia: Potential, present status, barriers and future perspectives. Renew. Sustain. Energy Rev. 2018, 81, 2796–2805. [Google Scholar] [CrossRef]
  6. Gupta, V.; Prasad, V.; Khare, R. Numerical simulation of six jet Pelton turbine model. Energy 2016, 104, 24–32. [Google Scholar] [CrossRef]
  7. Bajracharya, T.R.; Shrestha, R.; Timilsina, A.B. A Methodology for Modelling of Steady State Flow in Pelton Turbine Injectors. J. Inst. Eng. 2019, 15, 246–255. [Google Scholar] [CrossRef]
  8. Popovski, B.; Lipej, A.; Markov, Z.; Popovski, P. Optimisation of Pelton turbine jet deflector using CFD analysis. In IOP Conference Series: Earth and Environmental Science; IOP Publishing: Kyoto, Japan, 2019; p. 022031. [Google Scholar]
  9. Kumashiro, T.; Alimirzazadeh, S.; Maertens, A.; Jahanbakhsh, E.; Leguizamón, S.; Avellan, F.; Tani, K. Numerical investigation of the jet velocity profile and its influence on the Pelton turbine performance. In IOP Conference Series: Earth and Environmental Science; IOP Publishing: Kyoto, Japan, 2019; p. 072006. [Google Scholar]
  10. Petley, S.; Aggidis, G.A. Transient CFD and experimental analysis for improved Pelton turbine casing designs. In IOP Conference Series: Earth and Environmental Science; IOP Publishing: Kyoto, Japan, 2019; p. 022005. [Google Scholar]
  11. Messa, G.V.; Mandelli, S.; Malavasi, S. Hydro-abrasive erosion in Pelton turbine injectors: A numerical study. Renew. Energy 2019, 130, 474–488. [Google Scholar] [CrossRef]
  12. Zhang, Z. Pelton Turbines; Springer: Berlin/Heidelberg, Germany, 2016. [Google Scholar]
  13. Židonis, A.; Aggidis, G.A. Pelton turbine: Identifying the optimum number of buckets using CFD. J. Hydrodyn. Ser. B 2016, 28, 75–83. [Google Scholar] [CrossRef]
  14. Wahyudi, R.W. Performance of Pelton Turbine utilizing the Variations of Bucket Number, Nozzle Number, and Nozzle Diameter Using Computational Fluid Dynamics. Mater. Sci. Eng. 2019, 694, 012017. [Google Scholar]
  15. Obayes, S.; Qasim, M. Effect of Flow Parameters on Pelton Turbine Performance by Using Different Nozzles. Int. J. Modeling Optim. 2017, 7, 128–133. [Google Scholar] [CrossRef] [Green Version]
  16. Rai, A.K.; Kumar, A.; Staubli, T. Effect of concentration and size of sediments on hydro-abrasive erosion of Pelton turbine. Renew. Energy 2020, 145, 893–902. [Google Scholar] [CrossRef]
  17. Din, M.Z.U.; Harmain, G. Assessment of Erosive Wear of Pelton Turbine Injector: Nozzle and Spear Combination-A Study of Chenani Hydro-Power Plant. Eng. Fail. Anal. 2020, 116, 104695. [Google Scholar] [CrossRef]
  18. Okdinata, E.; Hasan, A.; Sitompul, C. Performance Test of Pelton Micro-Hydro Turbine with the Variations of Parameter to Produce the Maximum Output Power. J. Phys. Conf. Ser. 2019, 1167, 012025. [Google Scholar] [CrossRef]
  19. Zidonis, A.; Benzon, S.; Panagiotopoulos, A.; Petley, S.; Aggidis, G.A.; Anagnostopoulos, I.; Papantonis, D. Experimental investigation and analysis of the spear valve design on the performance of Pelton turbines: 3 case studies. HYRDO 2017 2017, 1–17. [Google Scholar]
  20. Dellinger, G.; Garambois, P.-A.; Dellinger, N.; Dufresne, M.; Terfous, A.; Vazquez, J.; Ghenaim, A. Computational fluid dynamics modeling for the design of Archimedes Screw Generator. Renew. Energy 2018, 118, 847–857. [Google Scholar] [CrossRef]
  21. ANSYS R18.0, INSYS, Inc. Available online: https://www.ansys.com/ (accessed on 3 January 2022).
  22. Ansys, I. ANSYS Meshing User’s Guide; INSYS, Inc.: Rochelle Park, NJ, USA, 2010; Volume 15317, pp. 724–746. [Google Scholar]
  23. Petley, S.; GA, A. Estimating the energy loss in Pelton turbine casings by transient CFD and experimental analysis. Int. J. Fluid Mach. Syst. 2019, 12, 400–417. [Google Scholar] [CrossRef] [Green Version]
  24. Kulkarni, S.S.; Chapman, C.; Shah, H. Computational Fluid Dynamics (CFD) Mesh Independency Study of A Straight Blade Horizontal Axis Tidal Turbine. Preprints 2016, 1–11. [Google Scholar]
  25. Mahdi, M.S.; Mahood, H.B.; Hasan, A.F.; Khadom, A.A.; Campbell, A.N. Numerical study on the effect of the location of the phase change material in a concentric double pipe latent heat thermal energy storage unit. Therm. Sci. Eng. Prog. 2019, 11, 40–49. [Google Scholar] [CrossRef]
  26. Mittal, S.; Kumar, B. Flow past a rotating cylinder. J. Fluid Mech. 2003, 476, 303–334. [Google Scholar] [CrossRef] [Green Version]
  27. Aldoss, T.; Abou-Arab, T. Experimental study of the flow around a rotating cylinder in crossflow. Exp. Therm. Fluid Sci. 1990, 3, 316–322. [Google Scholar] [CrossRef]
Figure 1. Pelton turbine system diagram.
Inventions 07 00022 g001
Figure 2. Pelton turbine geometry.
Inventions 07 00022 g002
Figure 3. Turbine runner model (A) detail geometry, (B) outer domain, and (C) boundary condition.
Inventions 07 00022 g003
Figure 4. Mesh geometry.
Inventions 07 00022 g004
Figure 5. Grid independence of the current study.
Inventions 07 00022 g005
Figure 6. Residual monitoring during the simulation.
Inventions 07 00022 g006
Figure 7. Monitoring the convergence of the moment at the turbine parts.
Inventions 07 00022 g007
Figure 8. Monitoring the convergence of pressure near the outlet.
Inventions 07 00022 g008
Figure 9. Torque vs. time relationship for a transient model at a rotation rate of 24.5 rad/s and 0.05 m/s inlet velocity.
Inventions 07 00022 g009
Figure 10. Flow velocity contours (A) rotational speed at 24 rad/s, (B) rotational speed at 44 rad/s and (C) rotational speed at 54 rad/s.
Inventions 07 00022 g010
Figure 11. Pressure contours (A) rotational speed at 24 rad/s, (B) rotational speed at 44 rad/s and (C) rotational speed at 54 rad/s.
Inventions 07 00022 g011
Table 1. Geometric dimensions and flow parameters of the Pelton turbine.
Turbine geometryNumber of buckets24
Turbine tip diameter (mm)269.89
Turbine hub diameter (mm)245.59
Bucket width (mm)61.6
Cup height (mm)48.6
Nozzle length (mm)70.5
Nozzle inlet diameter (mm)18.13
Nozzle outlet diameter (mm)8.87
Central hole diameter (mm)25.4
Flow parametersFlow head (m H2O)15
Flow rate (L × min−1)59
Table 2. Details of the mesh study using five grids.
Grid No. 1Grid No. 2Grid No. 3Grid No. 4Grid No. 5
Elements size at the turbine9 mm7 mm5 mm3 mm1 mm
Elements size at the outer domain12 mm10 mm8 mm6 mm3 mm
Number of elements6203754411,17820,13192,276
Average aspect ratio1.171.101.091.061.04
Table 3. Validation set of data using different values of the rotation rate.
Ω (rad/s)T (N × m)v (m/s)Diff (%)
MeasuredPredicted
24.5140.28985610.2495430.0513.90797
440.42985460.3809220.06511.38352
53.9520.5915430.54262450.0098.269644
59.9240.67238720.62026080.0097.752445
Publisher’s Note: MDPI stays neutral with regard to jurisdictional claims in published maps and institutional affiliations.

