Article

Influence of Dimple Height on Turbulent Heat Transfer of Fin Array with Alternate Convex/Concave Dimples

Department of Systems and Naval Mechatronic Engineering, National Cheng Kung University, Tainan 701, Taiwan
*
Author to whom correspondence should be addressed.
Inventions 2020, 5(3), 33; https://doi.org/10.3390/inventions5030033
Submission received: 17 May 2020 / Revised: 14 July 2020 / Accepted: 16 July 2020 / Published: 18 July 2020
(This article belongs to the Special Issue Fluid Mechanics and Transport Phenomena)

Abstract

:
This study analyzes transient turbulent modeling of three-dimensional multiple dimpled fin array using large eddy simulation (LES). The Navier–Stokes equations as well as the energy equation were constructed by the finite volume method and then discretized to form algebraic equations, which were solved by semi-implicit method for pressure-linked equation (SIMPLE). The solutions of temperature and velocity were obtained by iterating computation until it converged within each step. This simulation places nine fins on the bottom surface of a channel and changes the height of the dimple (0.4, 0.8, and 1.2 mm) with three different levels of Reynolds number (Re) (3500, 5000, and 6500) to investigate the temperature and flow field without gravity in forced convection. The results indicate that the dimpled fin array can generate vortices between the convex/concave dimples and the fin base and increase the influences of the height of the dimple on the flow field around the fin array. The averaged time-mean of the Nusselt number (Nu) for the dimple height of 0.8 mm is higher than that of the no-dimple case up to 14.4%, while the averaged time-mean Nu for the dimple height of 1.2 mm is lower than that of the no-dimple case up to 11.6%.

Graphical Abstract

1. Introduction

When the electronic components or other electronic devices work, they always generate heat. It is important to remove the heat to the surrounding to control the temperature in the range of the operating temperature. To remove the heat effectively and economically, the thermal engineers adopt forced convection to cool components and maintain the stability of the system using the heat sink to increase the area of heat dissipation. Therefore, to satisfy the demand, they have modified the shape of the heat sink, material, and manufacturing process.
Taking account of the lower levels of pressure loss using heat sink, many researchers employed fin array or dimpled surfaces or dimpled fin array for taking away heat from heat sources favorably. Zografos and Sunderland [1] experimented on pin fin with different heat sources in line and staggered arrangement and discussed the adequate diameter of pin and pitch for better performance. The pin fin exhibited higher heat transfer than the plate fin under the same conditions. For different levels of Raleigh number (Ra) and geometry, they developed an empirical formula to predict the performance of the pin fin; it had a better performance as its pitch was 1/3. Ledezma and Bejan [2] used numerical simulation and experiment to investigate the natural convection and forced convection induced by different shapes of fin and directions of fin with the distribution of temperature at different positions and Nu with different Ra levels. They discovered that the vertical fin cooled better than the horizontal one with different geometries, and forced convection had a better cooling effect than natural convection. Moreover, the study also discussed the effects of the slope of the side fin on heat transfer. The heat transfer rate obviously increased with increasing slopes. Goshayeshi et al. [3] examined the influence of fins’ distance (S) on the temperature distribution of fins and boundary layer in natural convection by numerical analysis. Their results displayed that Nu increased with increasing Ra and S. According to these results, the heat resistance was at a minimum, and the best cooling performance occurred at S = 6.85. Chang et al. [4] numerically explored natural convection of vertical fin channels, smooth nine-fin channel, smooth thirteen-fin channel, seven-fin channel with convex/concave dimples, and nine-fin channel with convex/concave dimples having the same fin base area and fin-channel volume. The nine-fin array with convex/concave dimples exhibited the greatest heat transfer enhancement among all the vertical fin channels. Afanasyev et al. [5] investigated how shaped surface (spherical cavities) changed the friction factor as well as turbulent heat transfer by an experiment. Nine of ten plates were arranged in staggered fashion with spherical cavities at different geometries and densities, and the other one was a smooth plate. The depth of dimple to diameter of dimple ratio was about 0.04. They concluded that the spherical cavities’ surface raised heat transfer less than or equal to 30–40%. A slight reduction in the viscous sublayer thickness increased heat transfer because of concavities’ depth being consistent with the sublayer thickness. Such cavities produced a pressure drop along the wall determining the heat transfer mechanism. Chang et al. [6] experimented on four sets of a combination of concave and convex fins in a single fin channel with Re = 1500–11000 to decide how Re and relative fin length to channel hydraulic diameter affected the heat transfer of the fin channel under dimple placement. The relative dimple depth to dimple diameter was 0.3. The local friction factor and centerline averaged mean friction factor increased with increasing Re or decreasing relative dimple depth to dimple diameter. The convex/convex dimpled fin channel offered the greater averaged Nu as well as thermal performance. Ligrani et al. [7] experimentally investigated the flow velocity of a channel placing dimples on one surface, protrusions, and no protrusions for the same configurations with the dimples on the opposed surface. The depth of dimple to diameter of dimple ratio was 0.2. They found that the protrusions augmented the heat transfer because a separated shear layer attached again, and the strong secondary flow occurred owing to vertical fluid and vortex pairs driven out from each dimple. The friction factor value of the fin with dimples as well as protrusions on the opposite surface was higher than that of the one with dimples and no dimpled surface on the opposed wall. Fazli and Raisee [8] evaluated the heat transfer coefficient of various ducts with repeated dimple/protrusion surfaces under turbulent flow. They found that using the nonlinear k- ε model attained a greater recirculation zone within the dimple via larger impact and upward flow than the linear k- ε model as well as the zonal k- ε model.
Luo et al. [9] determined the optimum geometry parameters of pin fins and dimple/protrusion channel with respect to higher Nu and lower friction. They found that the Nu was large on the back of the dimple, whereas it was small on the front of the dimple. Sobhani et al. [10] numerically investigated how dimple geometric parameters in the blade′s configuration of a vertical-axis wind turbine affected aerodynamic performance of turbine under turbulent flow. They reported that the efficiency increased up to 18% and average efficiencies of the turbine up to 25% for the airfoil with a dimple in comparison with the original airfoil. Jung and Kim [11] numerically examined the effect of multi-jets impinging on the concave-dimples’ surface on the thermal performance of the diverter in a nuclear fusion reactor applying the shear stress transport turbulent modeling. They discovered that the heat transfer rate with concave-dimple array was raised up to 2.62%. In addition, the heat transfer rate as well as pressure drop rose with rising the dimple diameter and dimple height. Kim et al. [12] evaluated the heat transfer rate of the heat exchangers with different dimple patterns employing the shear stress transport turbulence model. They observed that the lined and staggered patterns exhibited the greatest temperature variations at all Dean number levels. While the staggered patterns exhibited the greatest heat transfer performance, the lined pattern showed the second greatest performance. Zhou et al. [13] studied how the dimple bionic structure inserted in the circumferential grooves’ surface influenced fluid resistance by comparing the drag coefficient of dimple bionic structure with that of smooth structure. They found that the dimple bionic structure could reduce fluid resistance because the dimple bionic structure decreased the pressure drop because of driving fluid to raise the velocity. Xie et al. [14] numerically examined the thermal performance of a rectangular duct with internal-extruded dimples array mounted on the channel middle wall. Their results displayed that the dimple center with internal extrusion acquired the greatest thermal performance. Rao et al. [15] experimentally and numerical studied the flow velocity and heat transport of a duct with dimples inserted transversely or transversely as well as streamwisely in the midst of the pin fins. The experimental results indicated that dimples inserted transversely between the pin fin-dimple channel increased heat transfer by 8.0% and decreased the friction factor by 18.0%; and dimples inserted transversely as well as streamwisely between the pin fins increased heat transfer by 20.0% and raised the friction factor by 6.0%. The numerical results illustrated the dimples substantially raised the near-wall turbulent kinetic energy, in particular dimples inserted transversely as well as streamwisely between the pin fins, and thus distinctly promoted the thermal convection in the duct. Sethi et al. [16] explored how the arc angle ratio and roughness pitch ratio influenced heat transfer as well as the friction factor of rectangular channel. They concluded that the roughness pitch ratio of 10 achieved the maximum thermal performance. Lan et al. [17] employed large eddy simulation (LES) to study how the boundary layer thickness of leading edge affected flow separation inside the dimple. Their results indicated that the upper part of horseshoe vortex was further away from the plate surface with an increase in the relative boundary layer thickness of the leading edge to dimple depth. Hairpin vortexes due to the wake behind dimple were generated by the horseshoe vortex. Dees et al. [18] experimentally explored how the dimple configuration changed heat transport inside the suction area of a gas turbine blade. They found that all the dimple configurations augmented heat transfer by 20% in comparison with the smooth suction area. Mitsudharmadi et al. [19] experimentally investigated how the rounded dimple arrays with various dimple depth ratios changed the turbulent flow field. The spanwise mean wall shear stress varied little with dimple depth and increased by 45% compared with the smooth surface. The deeper dimple was subject to flow separation different from the shallowest ones. Won et al. [20] examined how dimple depth caused the flow pattern in a duct. When the dimple depth was large, it generated greater main vortex pairs with larger turbulence extents. Ejection frequencies of main vortex pair ranged from 7 to 9 Hz independent of dimple depth. Rao et al. [21] experimentally explored how dimple depth changed pressure loss as well as heat transfer within a duct, where dimples were inserted transversely in the midst of the pin fins. The pin fin/dimple channels attained the maximum heat transport of 19.0%, and Nu rose as the dimple depth increased. Li et al. [22] utilized LES to analyze how dimples and extrusions affected turbulent heat transport of a rectangular duct when Re was between 5600 and 22,000. Thermal performances rose greatly with an increase in Re or a decrease in the gap ratio; however, the flow pattern was only dependent on Re. The combined effect of vortical structure, the turbulent kinetic energy, and shedding frequency from dimples generated asymmetric profiles of Nu inside the wake in the rear of the dimple. Elyyan and Tafti [23] performed LES for heat transfer in a duct with dimples and protrusions on opposite surfaces at Re levels of 220, 940, and 9300. Their results displayed heat transfer enhancement ratios of 0.99 at Re of 220, 2.9 at Re of 940, and 2.5 at Re of 9300. Friction coefficient enhancement ratios of 1.67 occurred at Re of 220, 4.82 at Re of 940, and 6.37 at Re of 9300. It could be found that dimples and protrusions might not be feasible heat transfer enhancement surfaces when the flow was steady and laminar. Sato et al. [24] utilized LES to realize how the Prandtl number influenced heat and fluid flow in a dimpled channel at Re between 1000 and 10,600. The temperature gradient rose with increasing the Prandtl number because the fluid thermal diffusivity decreased. The thermal performance parameter had a maximum value of 1.22 for Re of 2000 and Pr of 3.0.
Torregrosa et al. [25] investigated the turbulent flow and the pressure coefficient fluctuations downstream for a plate with surface-mounted obstacle. The surface-mounted obstacle generated great turbulent structures to excite unsteady flow and the pressure coefficient fluctuations downstream. Hocine et al. [26] employed Reynolds stress models and LES to analyze the turbulent flow past a D-pattern non-streamlined body. The k-ω turbulence model best captured the intensive shear layer on the upper area of the D-pattern among all the Reynolds stress modellings. The LES with a suitable orthogonal decomposition could extract the mean flow feature as well as the coherent structure. Alam et al. [27] applied LES to study a turbulent flow past the block array of a similar building. The presented stress modelling including the strain and rotation tensors was accurate for analyzing vertical distributions of variance and average, and unsteady coherent structures. Lu et al. [28] employed LES to investigate how cube-obstacles influenced turbulent channel flow. The von Karman constant decreased as roughness height rose. The surface cube-obstacles caused greater quasi-streamwise vortices and stronger discharge. Saeedi et al. [29] performed LES to explore turbulent flow characteristics of a flat plate with a square cylinder mounted on a wall. The greatest level of the mean dissipation rate was near the recirculation region. The peak relative sub-grid scale (SGS) viscosity over the kinematic viscosity dropped when the distance from the cylinder rose. The ratio distribution spanwisely expanded more broadly because the turbulent wake grew. Hao et al. [30] utilized LES to explore thermal convection in a pin fin array by formerly examining eddy-viscosity turbulences. Reynolds stresses predicted by LES showed different characteristics in these different flows, which were not reflected in those predicted by the shear stress transport model. The analysis provided some perception to correct the Reynolds stress tensor. Toubiana et al. [31] compared LES and the Reynolds stress model for turbulent flow in staggered plate arrays. Employing the results of LES realized the development of the turbulence structure with Re and estimated the effectiveness of every turbulence model prediction. The k-ω modelling underestimated the turbulent kinetic energy, while the k-ε model overestimated it. Paniagua et al. [32] compared three subgrid-scale models for turbulent heat transfer inside a surface-mounted cylindrical pin array on a plate. The three modellings could predict the bulk unsteady flow generated by vortex shedding behind the pin array. A subgrid-scale model with the invariants of the strain rate tensor better predicted the pressure profile near pins, while the surface-adjusting local eddy viscosity modelling gained the velocity field in better accordance with experimental data. Chen et al. [33] developed a phase-averaging approach to study momentum, vorticity structure, and turbulent heat transfer behind a round cylinder. The presented model described the structures similar to rib in taking away heat in detail and highlighted the half of the spanwisely expanded vortex. Yang et al. [34] used the dynamic subgrid-scale model to simulate the turbulent duct flow with square rib on the surface. The Re was 3210 according to the average velocity above the block and its height. Their results showed better agreement with direct numerical simulation than with LES at the same factors, verifying the value of subgrid-scale model from simulating complex turbulent heat transfer. Franke et al. [35] utilized LES to simulate the turbulence that passed a round cylinder with Re equal to 3900 by a grid centered finite volume scheme for resolving the compressible Navier–Strokes equations. They compared the results with the computational results of Ma et al. [36] and experimental results of Ong et al. [37]. Their study dealt with data by the time averaging method, and the results were close to the reference data. Their study also discussed the subgrid-scale stresses as well as Reynolds stresses modeling.
From the preview studies, fin array still has the advantages of low cost and simplicity. There are some studies about the effect of shape, pitch, height, and thickness of a fin in the vertical or horizontal direction in natural and forced convection. Most articles studied heat transfer of a single dimpled channel or a dimpled plate with changed dimple depth or placed location and direction. However, there are few studies about flow interactions of convex/concave dimples between fin channels under turbulent forced convection. This study is aims to explore how Re and dimple height affect turbulent heat transfer of nine-fin array with alternately convex/concave dimples by using LES. The purpose of this study is to examine temperature and flow field using LES to find the effects of dimple height and to discuss the effects on time-mean drag coefficient and averaged time-mean Nu. At which dimple height the maximum averaged time-mean Nu occurs is to be determined. The enthalpy flow rates of the inlet, the top outlet, and the back outlet are also explored to identify the trend of dimple height with averaged time-mean Nu.

2. Numerical Method

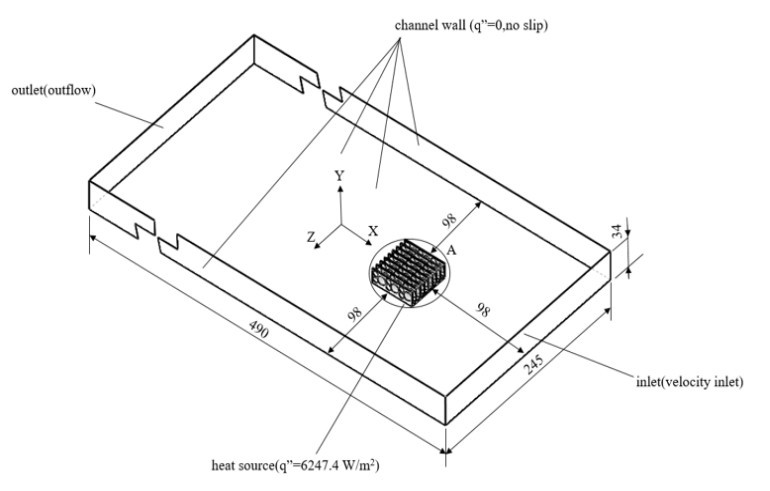
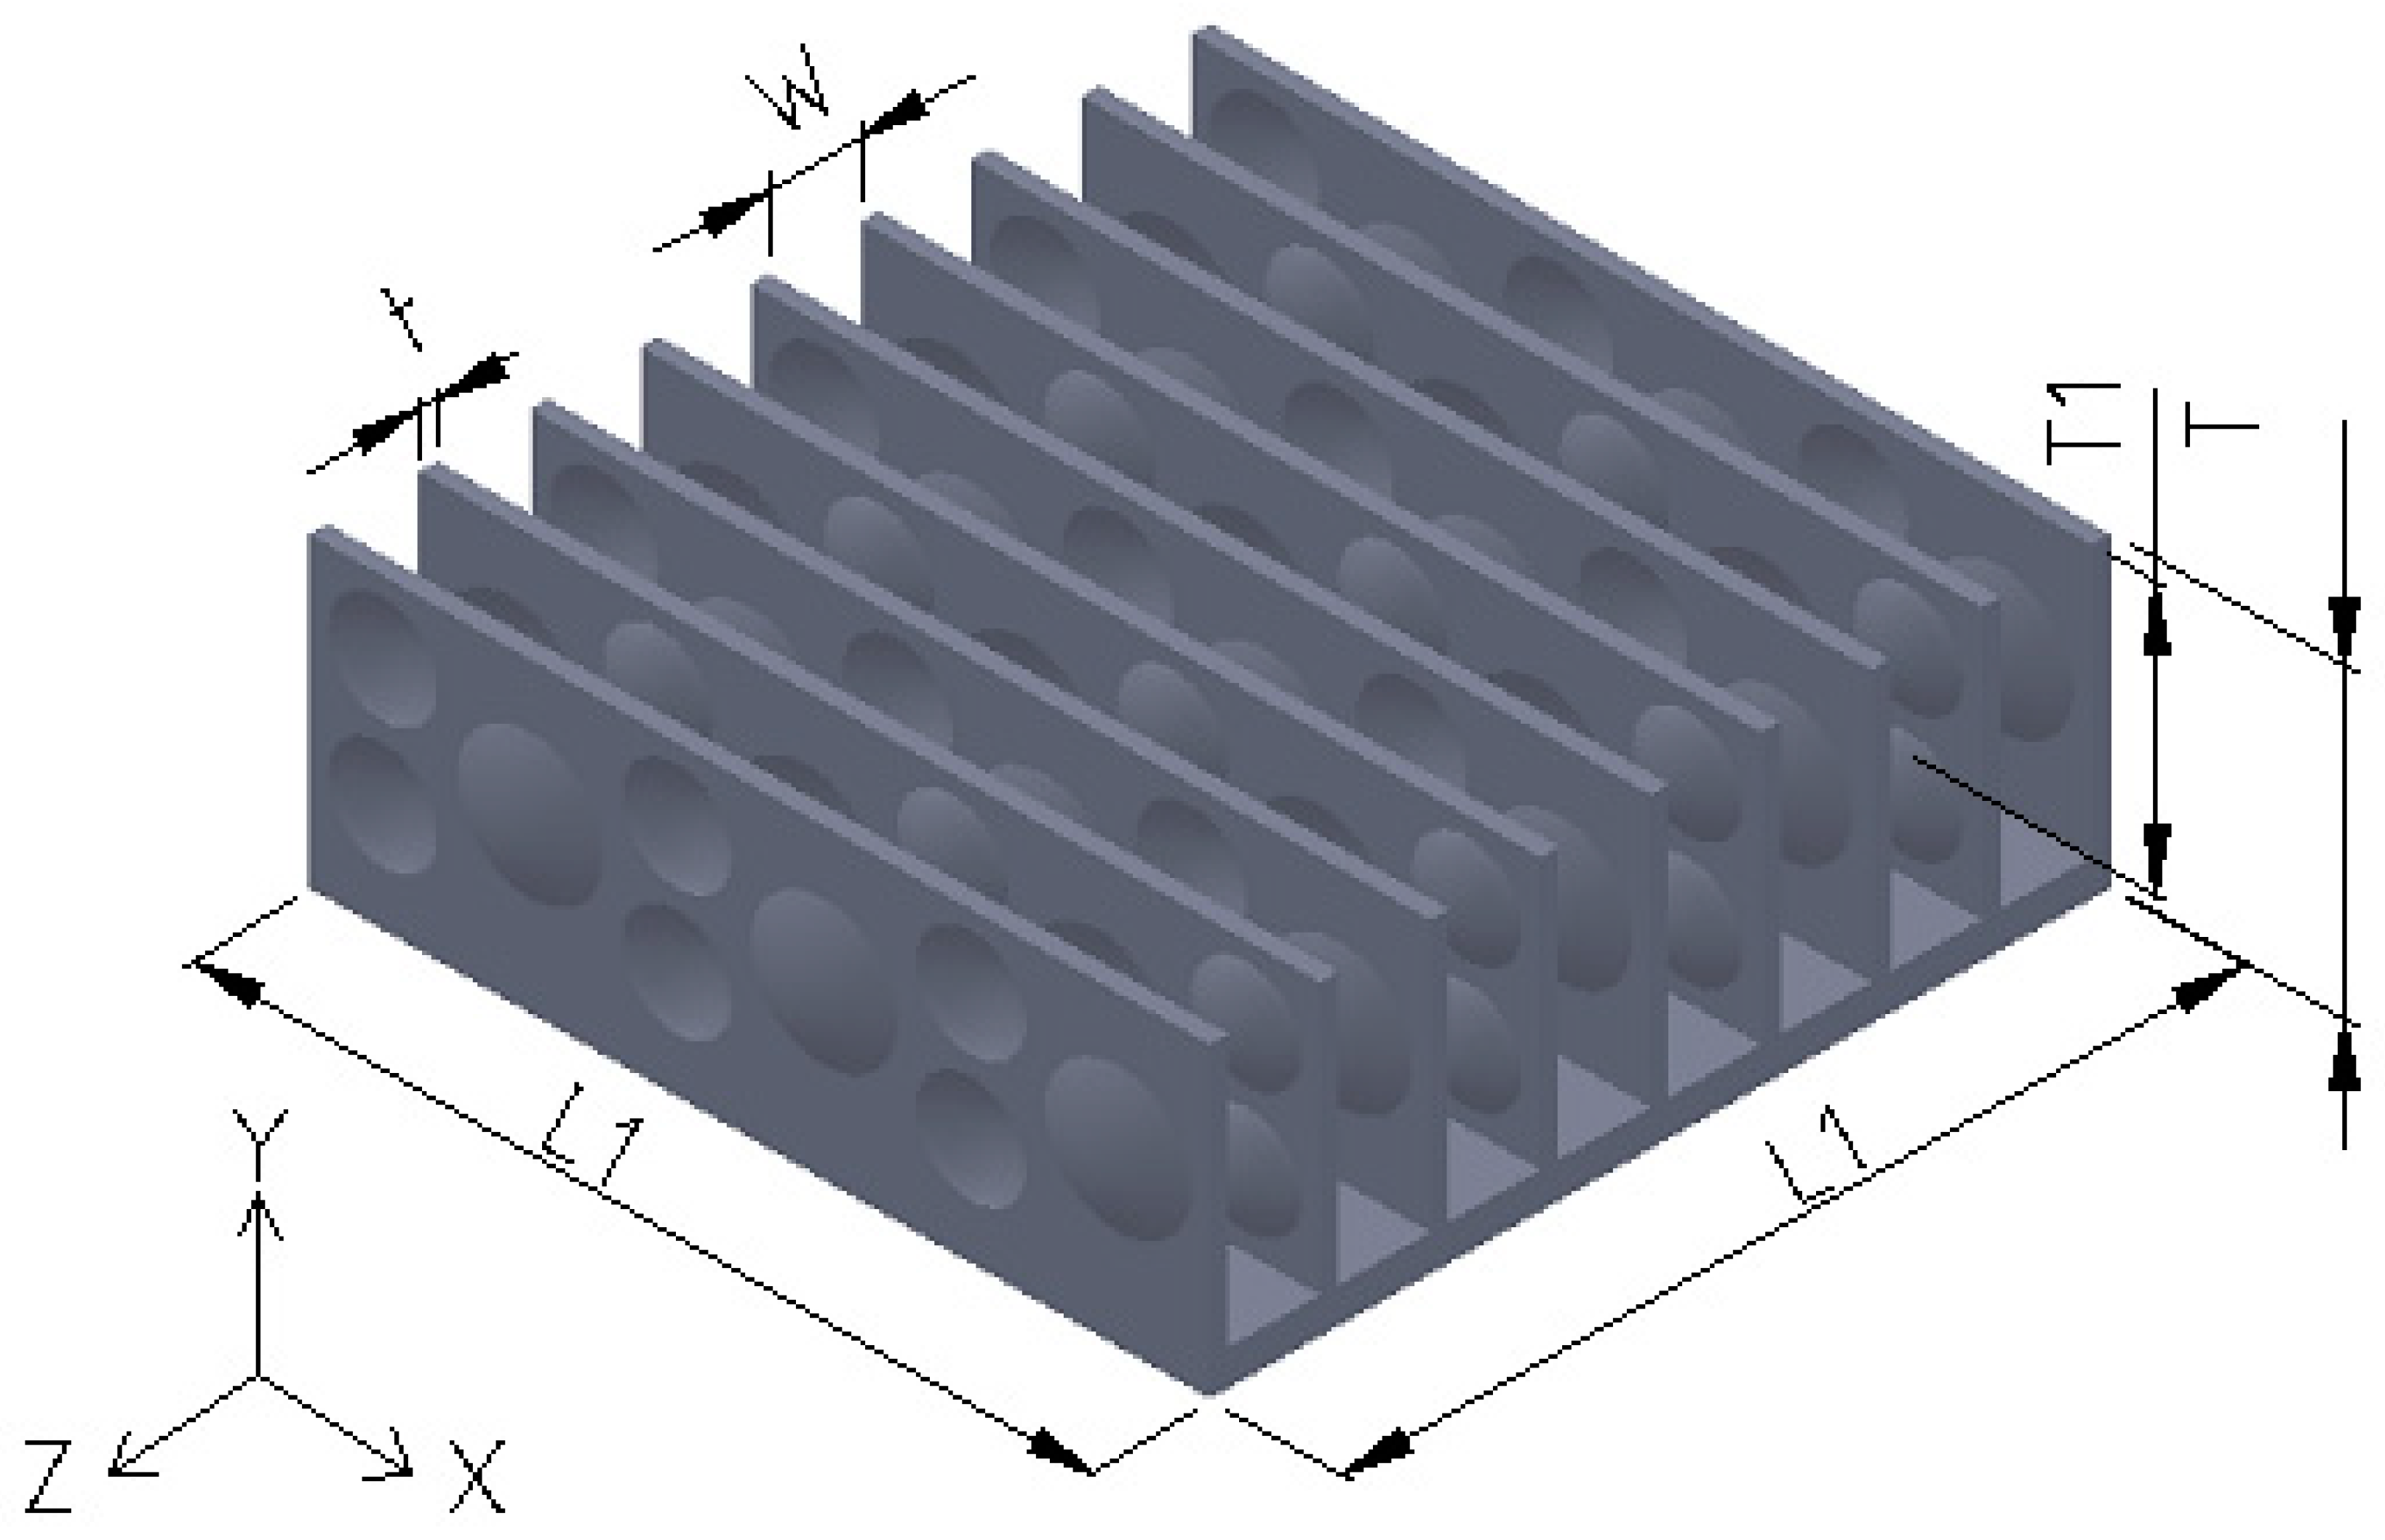
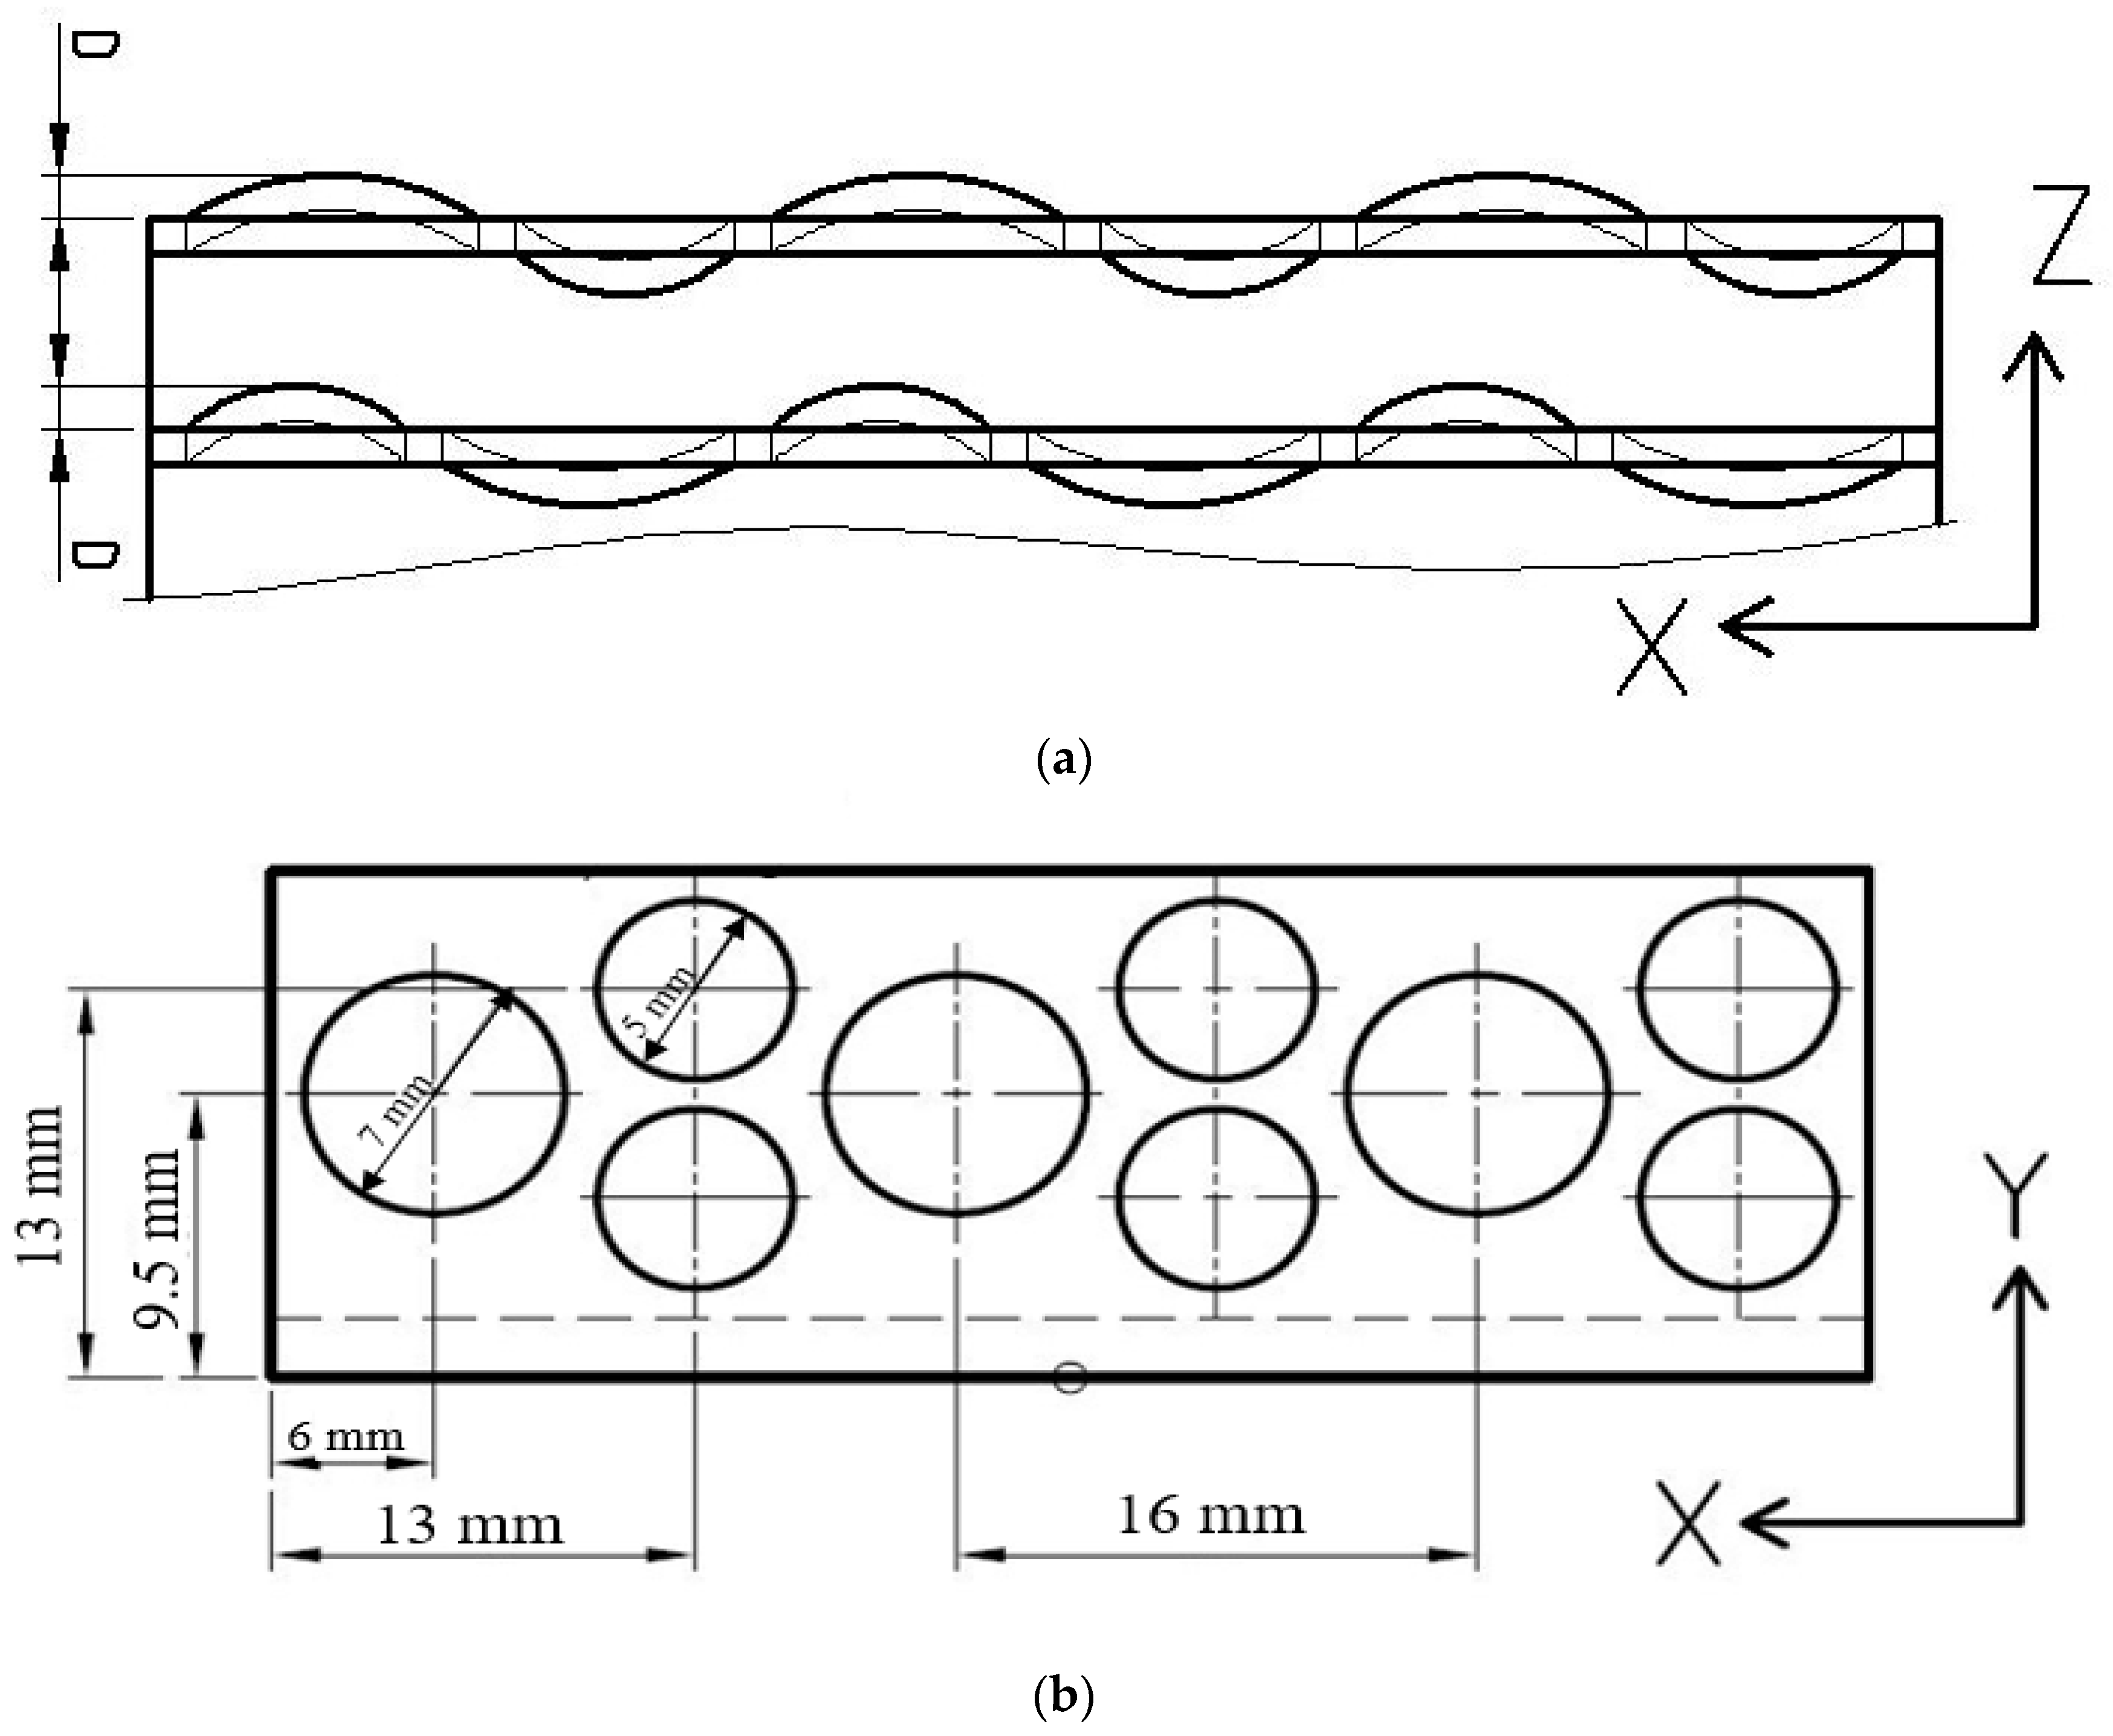
2.1. Geometric Model

The geometry in Figure 1 is a smooth nine-fin channel as well as a nine-fin channel with convex/concave dimples such as F0, F1, F2, and F3, and the size details of a fin are shown in Figure 2. The small dimples of 5 mm inner diameter and large dimples of 7 mm outer diameter are alternately convex and concave on the fin array. For a small dimple, the ratio of dimple height to dimple inner diameter ranges (D/(2R)) from 8% to 24%. For a large dimple, the D/(2R) ranges from 5.7% to 17%. The F0 model uses smooth fin array, the F1 model uses 0.4 mm for the dimple height, the F2 model uses 0.8 mm for the dimple height, and the F3 model uses 1.2 mm for the dimple height. The dimension of the fin is also shown in Figure 2. The heat source is located in a base with nine fins. The base is 49 mm long, 100 mm wide, and 2 mm high. The fin array is 49 mm long, 15 mm high, and 1 mm thick and has three equidistant sets of convex/concave dimples. The fin array is placed in the opposite direction that turns 180° in order for the illustration of Figure 3 to be easily understand. This study changes the height of dimple for its effect on the heat transfer. It needs a computational domain to simulate turbulent flow. The geometry size of the domain is 490 mm long, 245 mm wide, and 34 mm high. The heat source is placed on the bottom of channel from inlet 98 mm in the X direction and 98 mm from both sides of the channel wall. The geometrical details of the channel with boundary conditions are shown in Figure 3.

2.2. Governing Equations

The fluid is assumed to be Newtonian, and it undergoes transient, three dimensional, and turbulent flow. The buoyancy as well as the thermal radiation is neglected. The single-domain approach is employed to deal with the forced convection by considering fluid and multi-fin array as a domain in which no boundary conditions between fluid and fin array are needed. The continuity equation, momentum, and energy balance equations are thus written in Equations (1)–(3).
Filtering the governing equations gives the following equations.
(1) Continuity equation
u ˜ j x j = 0
(2) Momentum-balance equation
u i ˜ t + u i u j ˜ x j = 1 ρ p ˜ x i + ν 2 u i ˜ x j x j
for i = 1–3.
(3) Energy-balance equation
ρ C p T ˜ t + ρ C p x j ( u ˜ j T ˜ ) = P ¯ u ˜ j x j + σ ¯ i j u ˜ j x i + x j ( k ˜ T ˜ x i ) + ρ C p ν t P r t T ˜ x i
where the convective flux terms are decomposed below.
u i u j ˜ = u ˜ i u ˜ j + τ i j
Substituting Equation (4) into Equation (2) yields Equation (5).
u ˜ i t + u ˜ j u ˜ i x j = 1 ρ p ˜ x i + ν 2 u ˜ i x j x j τ i j x j
  • for i = 1–3.
  • where τ i j is the SGS stress tensor [38]:
τ i j = ( u i u j ˜ ˜ u ˜ i u ˜ j ) + u ˜ i u j + u i u ˜ j ˜ + u i u j ˜
where ( u i u j ˜ ˜ u ˜ i u ˜ j ) denotes the Leonard stress; u ˜ i u j + u i u ˜ j ˜ represents the cross stress; and u i u j ˜ denotes the Reynold stress. When time average was applied rather than volume-average filtering, the first two terms are equal to zero, only keeping the Reynold stress.

2.3. Subgrid-Scale (SGS) Model

Employing SGS models illustrates how the SGS motion affects the turbulent flow. Because the small-scale motion tends to be fairly isotropic and universal, there is hope that a relatively simple model will suffice. This study uses the model proposed by Smagorinsky [39]. The length scale, l S = C S Δ , is in proportion to the filter width. Thus, the SGS stress tensor is replaced by Equation (7).
τ ij = 2 μ T S i j
where S i j is the strain tensor rate.
S i j = 1 2 ( u ˜ i x j + u ˜ j x i )
As before, the subgrid-scale turbulent viscosity is modeled by
μ T = ρ L S 2 2 S i j S i j
where L S = C S Δ . The Smagorinsky constant C s is not universal. Values ranging from 0.1 to 0.24 have been reported. For wall shear flow, it is common to multiply the mixing length by a van Driest-type exponential damping function to force the length scale to approach zero at the wall. In this study, the C s is used as 0.1.
As the velocity can change greatly at the near-wall region in turbulent flow, using the following wall function [40] to deal with the region of gradient can save cost and space in the simulation.
When
y n + 11.81   u ˜ u τ = y n +
When
y n + > 11.81   u ˜ u τ = 8.3 y n + 1 / 7
where u τ is the friction velocity and y n + is the dimensionless distance from the wall. The applied near-wall thermal boundary conditions cohere with the above velocity ones. They were formed on the universal temperature profiles of Jayatilleke [41] for a Prandtl number of 0.71.

2.4. Boundary Conditions and Solution Scheme

The following boundary conditions are employed and are shown in Figure 3. Inlet: velocity with Re = 3500 (1.3143 m/s), 5000 (1.8776 m/s), and 6500 (2.4408 m/s), T = 298K (25 ); outlet: outflow; channel wall: adiabatic; heat face: base wall, constant heat flux ( q = 6247.4   W / m 2 ) with total heat of 15W; the Nu is calculated at the fin base. The Nu is defined by ( q L 1 ) / [ k ( T w T ) ] , where q denotes the heat flux, L1 is the characteristic length, k is the thermal conductivity of fluid, T w is the wall temperature, and T is the fluid temperature at inlet. The properties of coolant (air) are adopted including thermal conductivity, kinematic viscosity, and density; the material of fin array is aluminum.
The second-order backward Euler scheme [42] was utilized to discretize the transient term, and the upstream-weighted high-order difference scheme [43] to discretize the convection terms. The staggered control volume was built for velocity. The SIMPLE algorithm [44] was taken to solve the simultaneous algebraic equations iteratively before the relative difference of every variable obtained to the convergence criterion; that is, 10 6 for temperature and 10 3 for velocity. All the calculations were performed using an Intel Xeon W-2125 server at 4.00 GHz, clockspeed: 4.0 GHz, and turbo speed: 4.5 GHz. The Tecplot software was then used to graph the temperature contours and streamlines.

2.5. Grid and Time-Step Independence Test

The time step and mesh play a critical part in the numerical stability. A larger time step will result in divergence and low accuracy of simulation results, and the number of mesh will influence the accuracy and time of calculation. Thus, the time and mesh independent tests have to be done at first, and their results are used to choose an appropriate time and mesh for efficient simulations. The information of mesh and time step for each module is shown in Table 1. The process checks through the error of temperature of a fixed point for each mesh and each time step and finds the efficient module to simulate. The process is indicated below.
  • Run the densest model (M3) with three time intervals (T1, T2, T3).
  • Check the errors if they are less than 1%. If the errors are less than 1%, choose the middle time interval (T2). Otherwise, change the time interval and run the program again.
  • Run the program using the other models (M1, M2) with the chosen time interval (T2).
  • Check if the errors are less than 1%. If the errors are less than 1%, choose the model that has middle number of mesh (M2). Otherwise, change the mesh and run the program again.
  • Run the program using the M2 model with other time interval (T1, T3).
  • Check if the errors of M2 with T1, T2, and T3 are less than 1%. If the errors are less than 1%, the M2 with T1 is the model used for simulating. Otherwise, run steps 1–6 again.
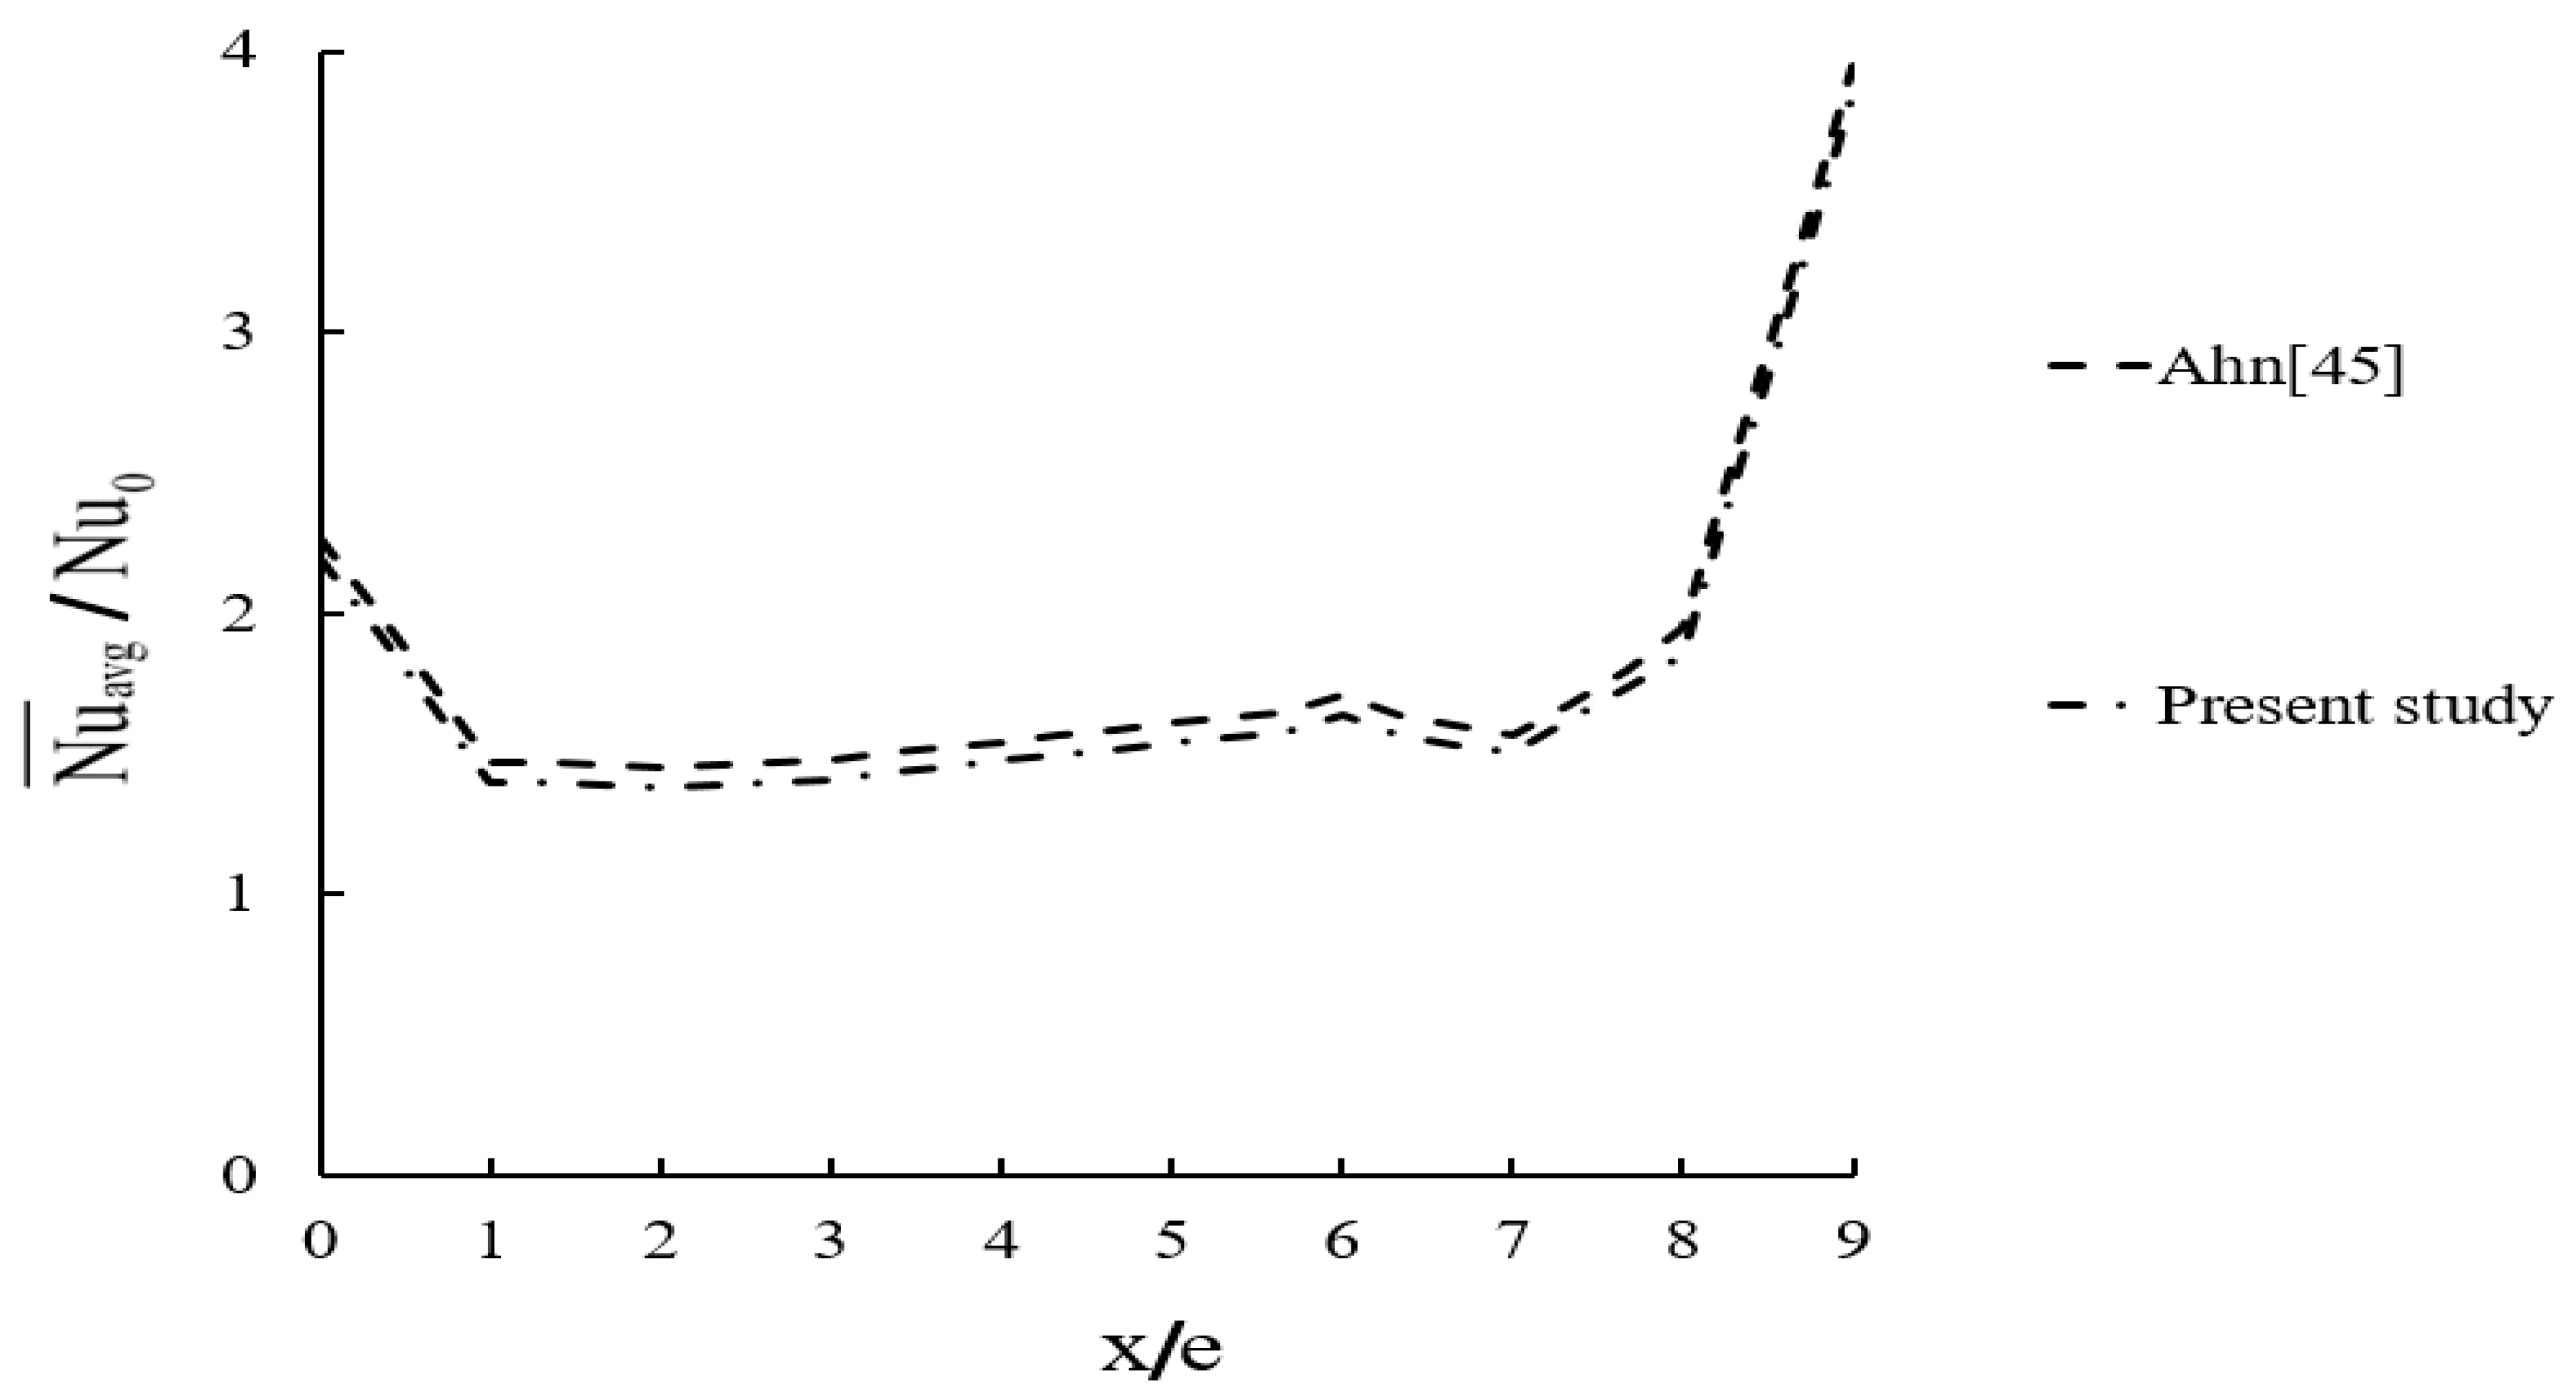
The test condition is at Re = 5000 for 300 s. The temperature of models is compared with that of M3 at T1. From Table 2, the influence of changing mesh is greater than that of changing time step, but the errors are all less than 1%. Therefore, the model for simulation is going to use M2 with T2.

2.6. Verification

To verify the accuracy of the present simulation module, Ahn [45] simulated the turbulent convection of a duct with a disconnected rib array using LES, which was similar to the present study. Hence, the work of [45] was chosen as reference of the present study. The computational model of [45] was numerically rebuilt and verified by the study, as depicted in Figure 4. The results between the study and experiment in [45] are consistent.

3. Results and Discussion

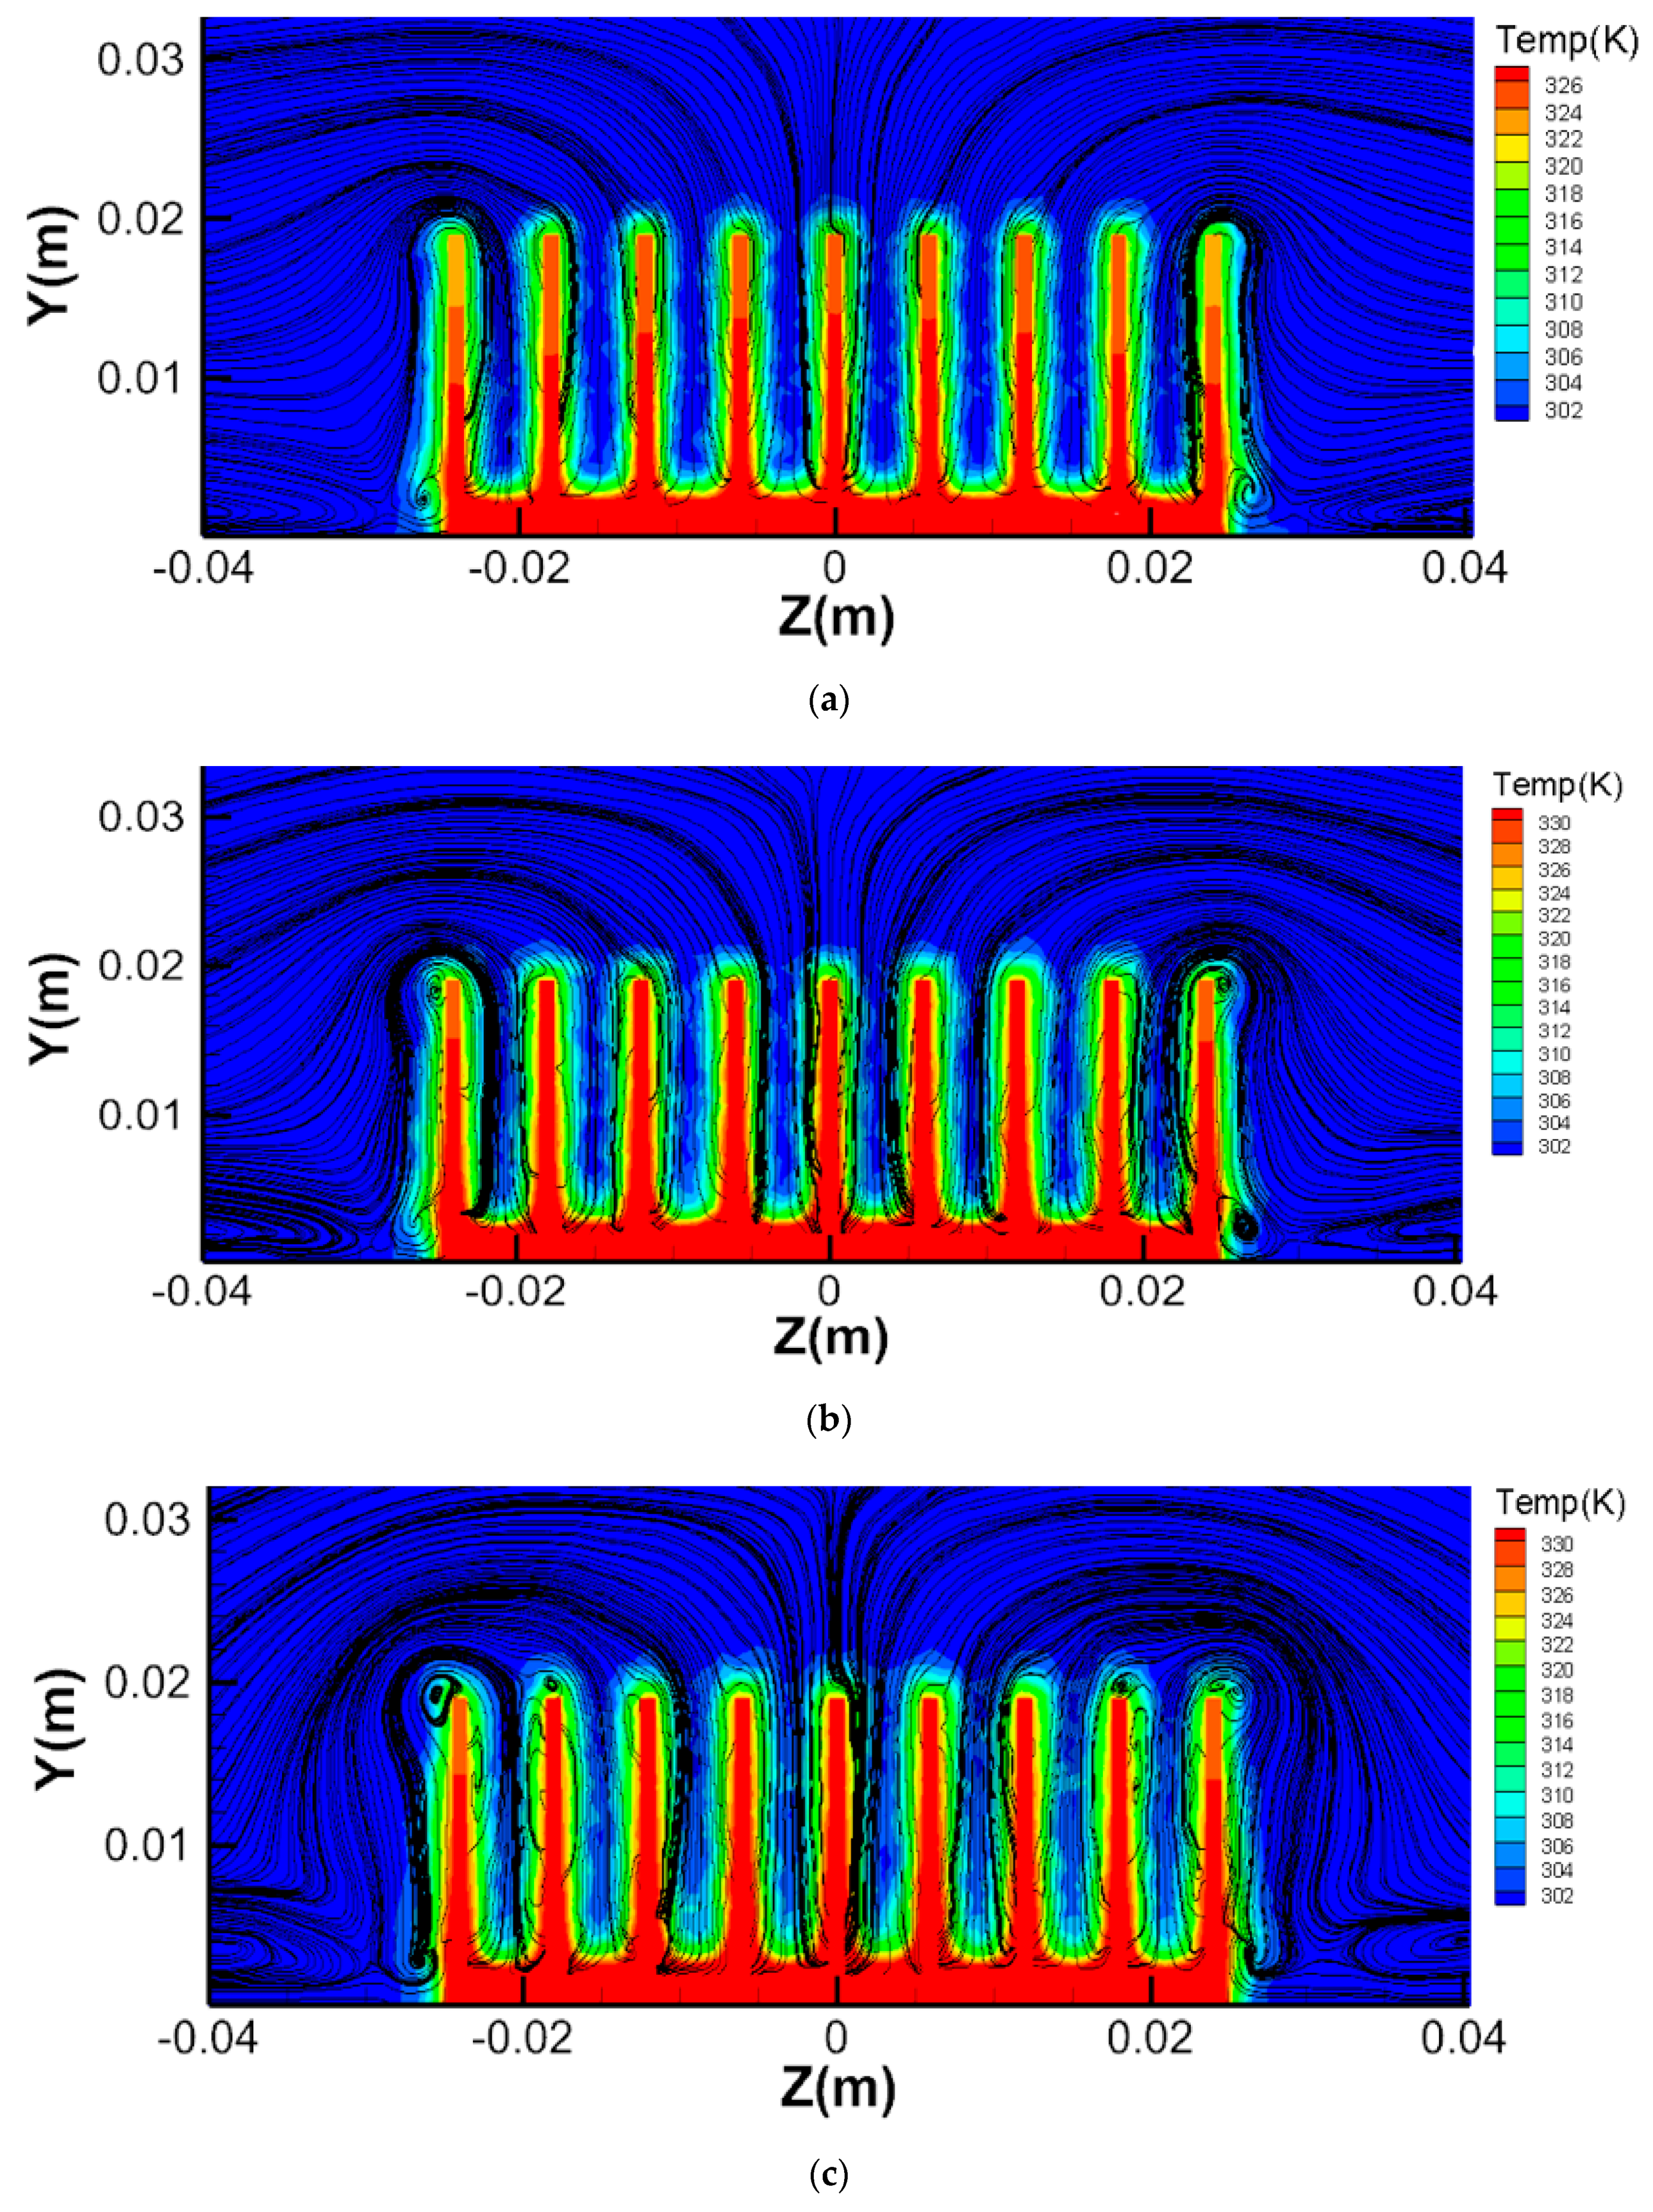
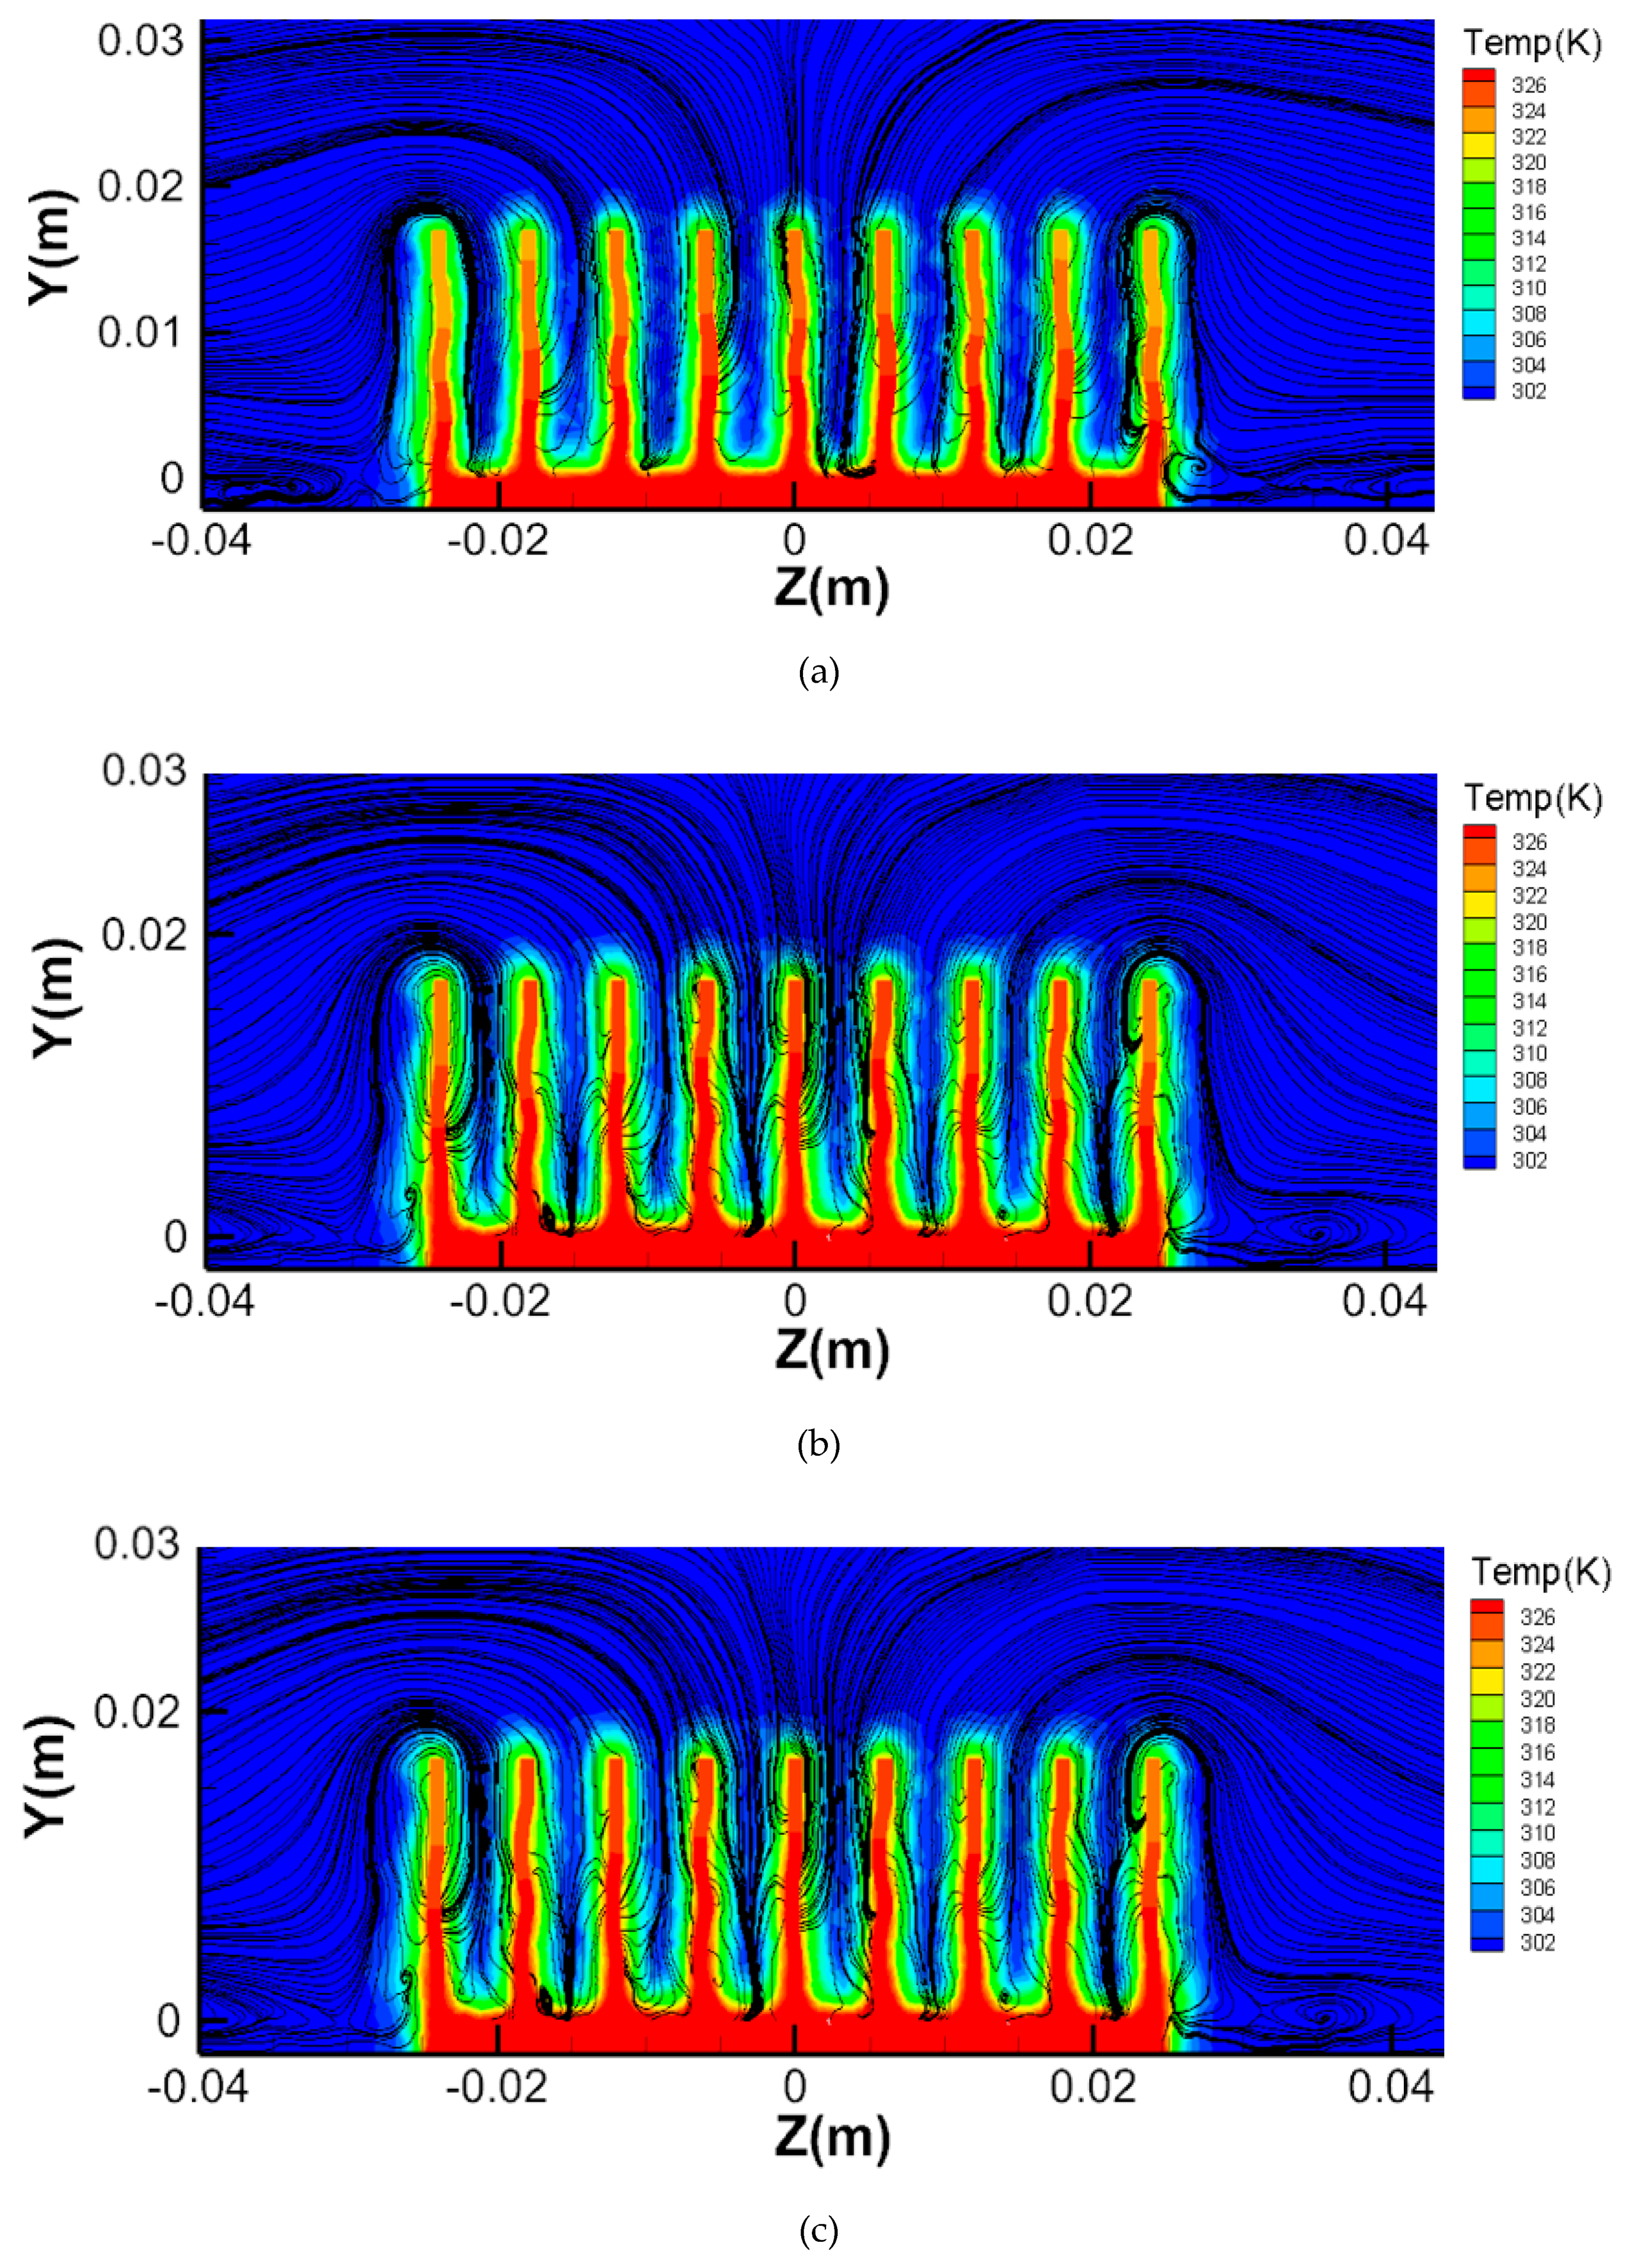
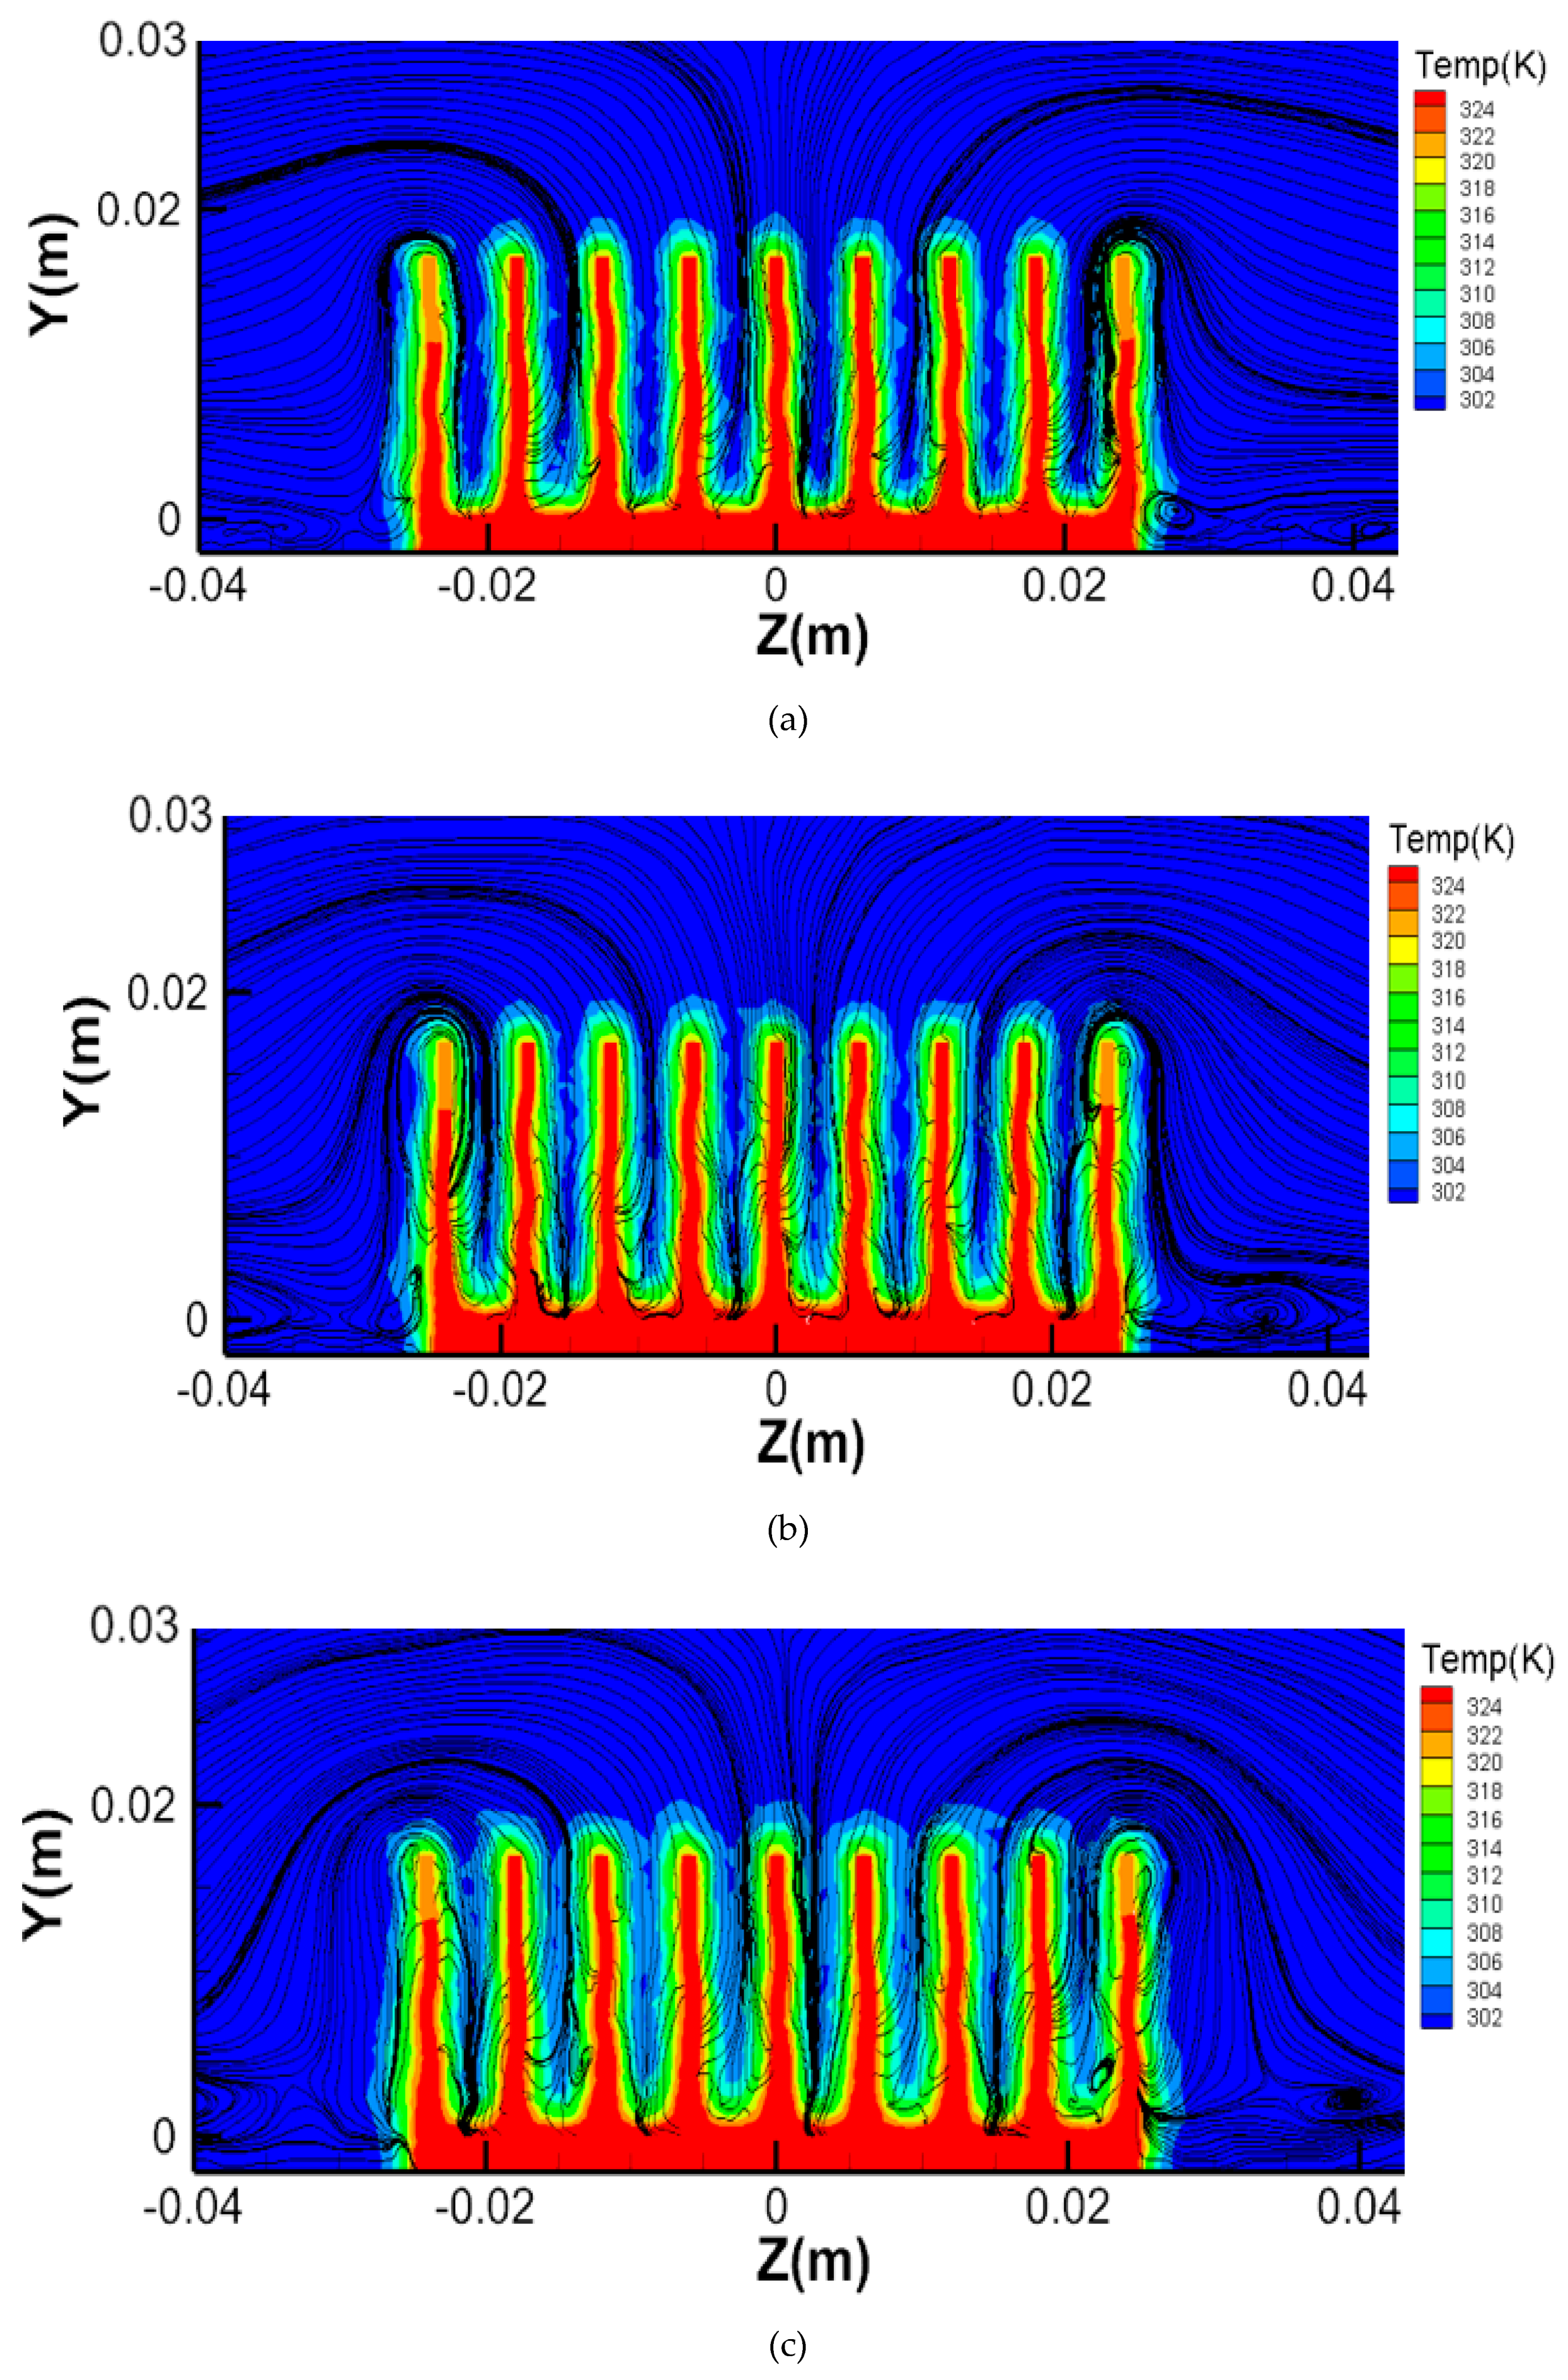
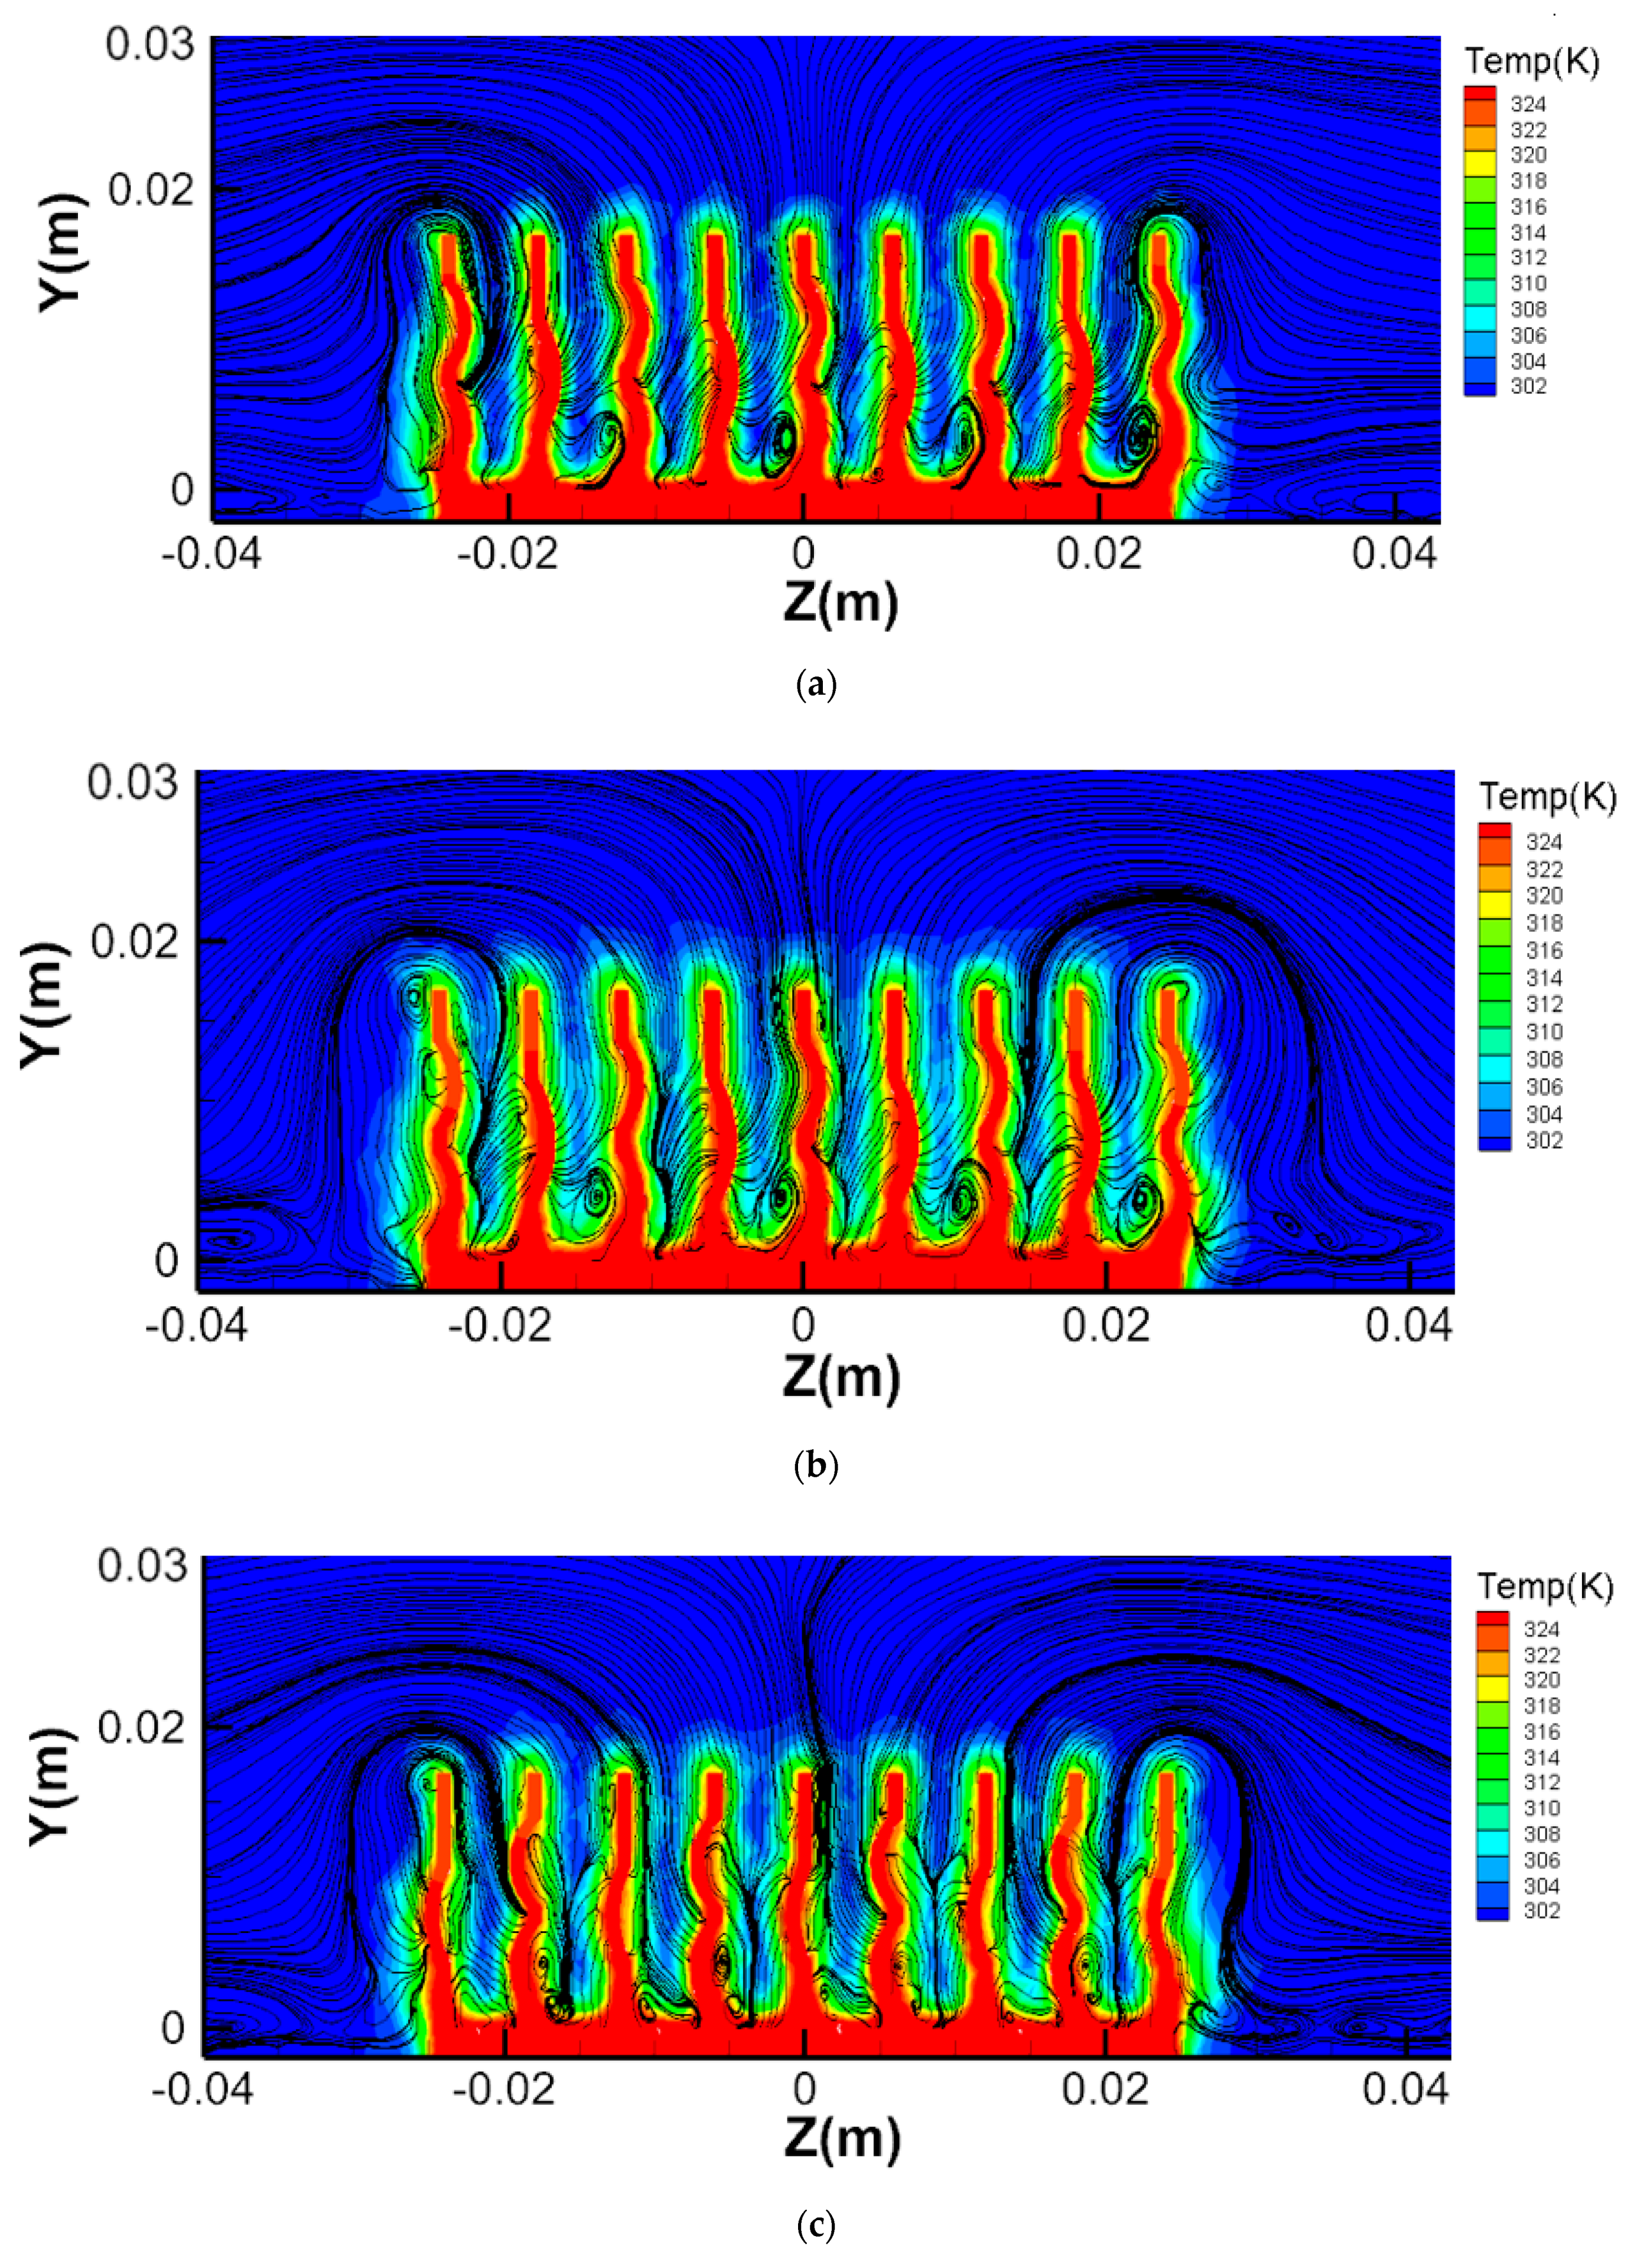
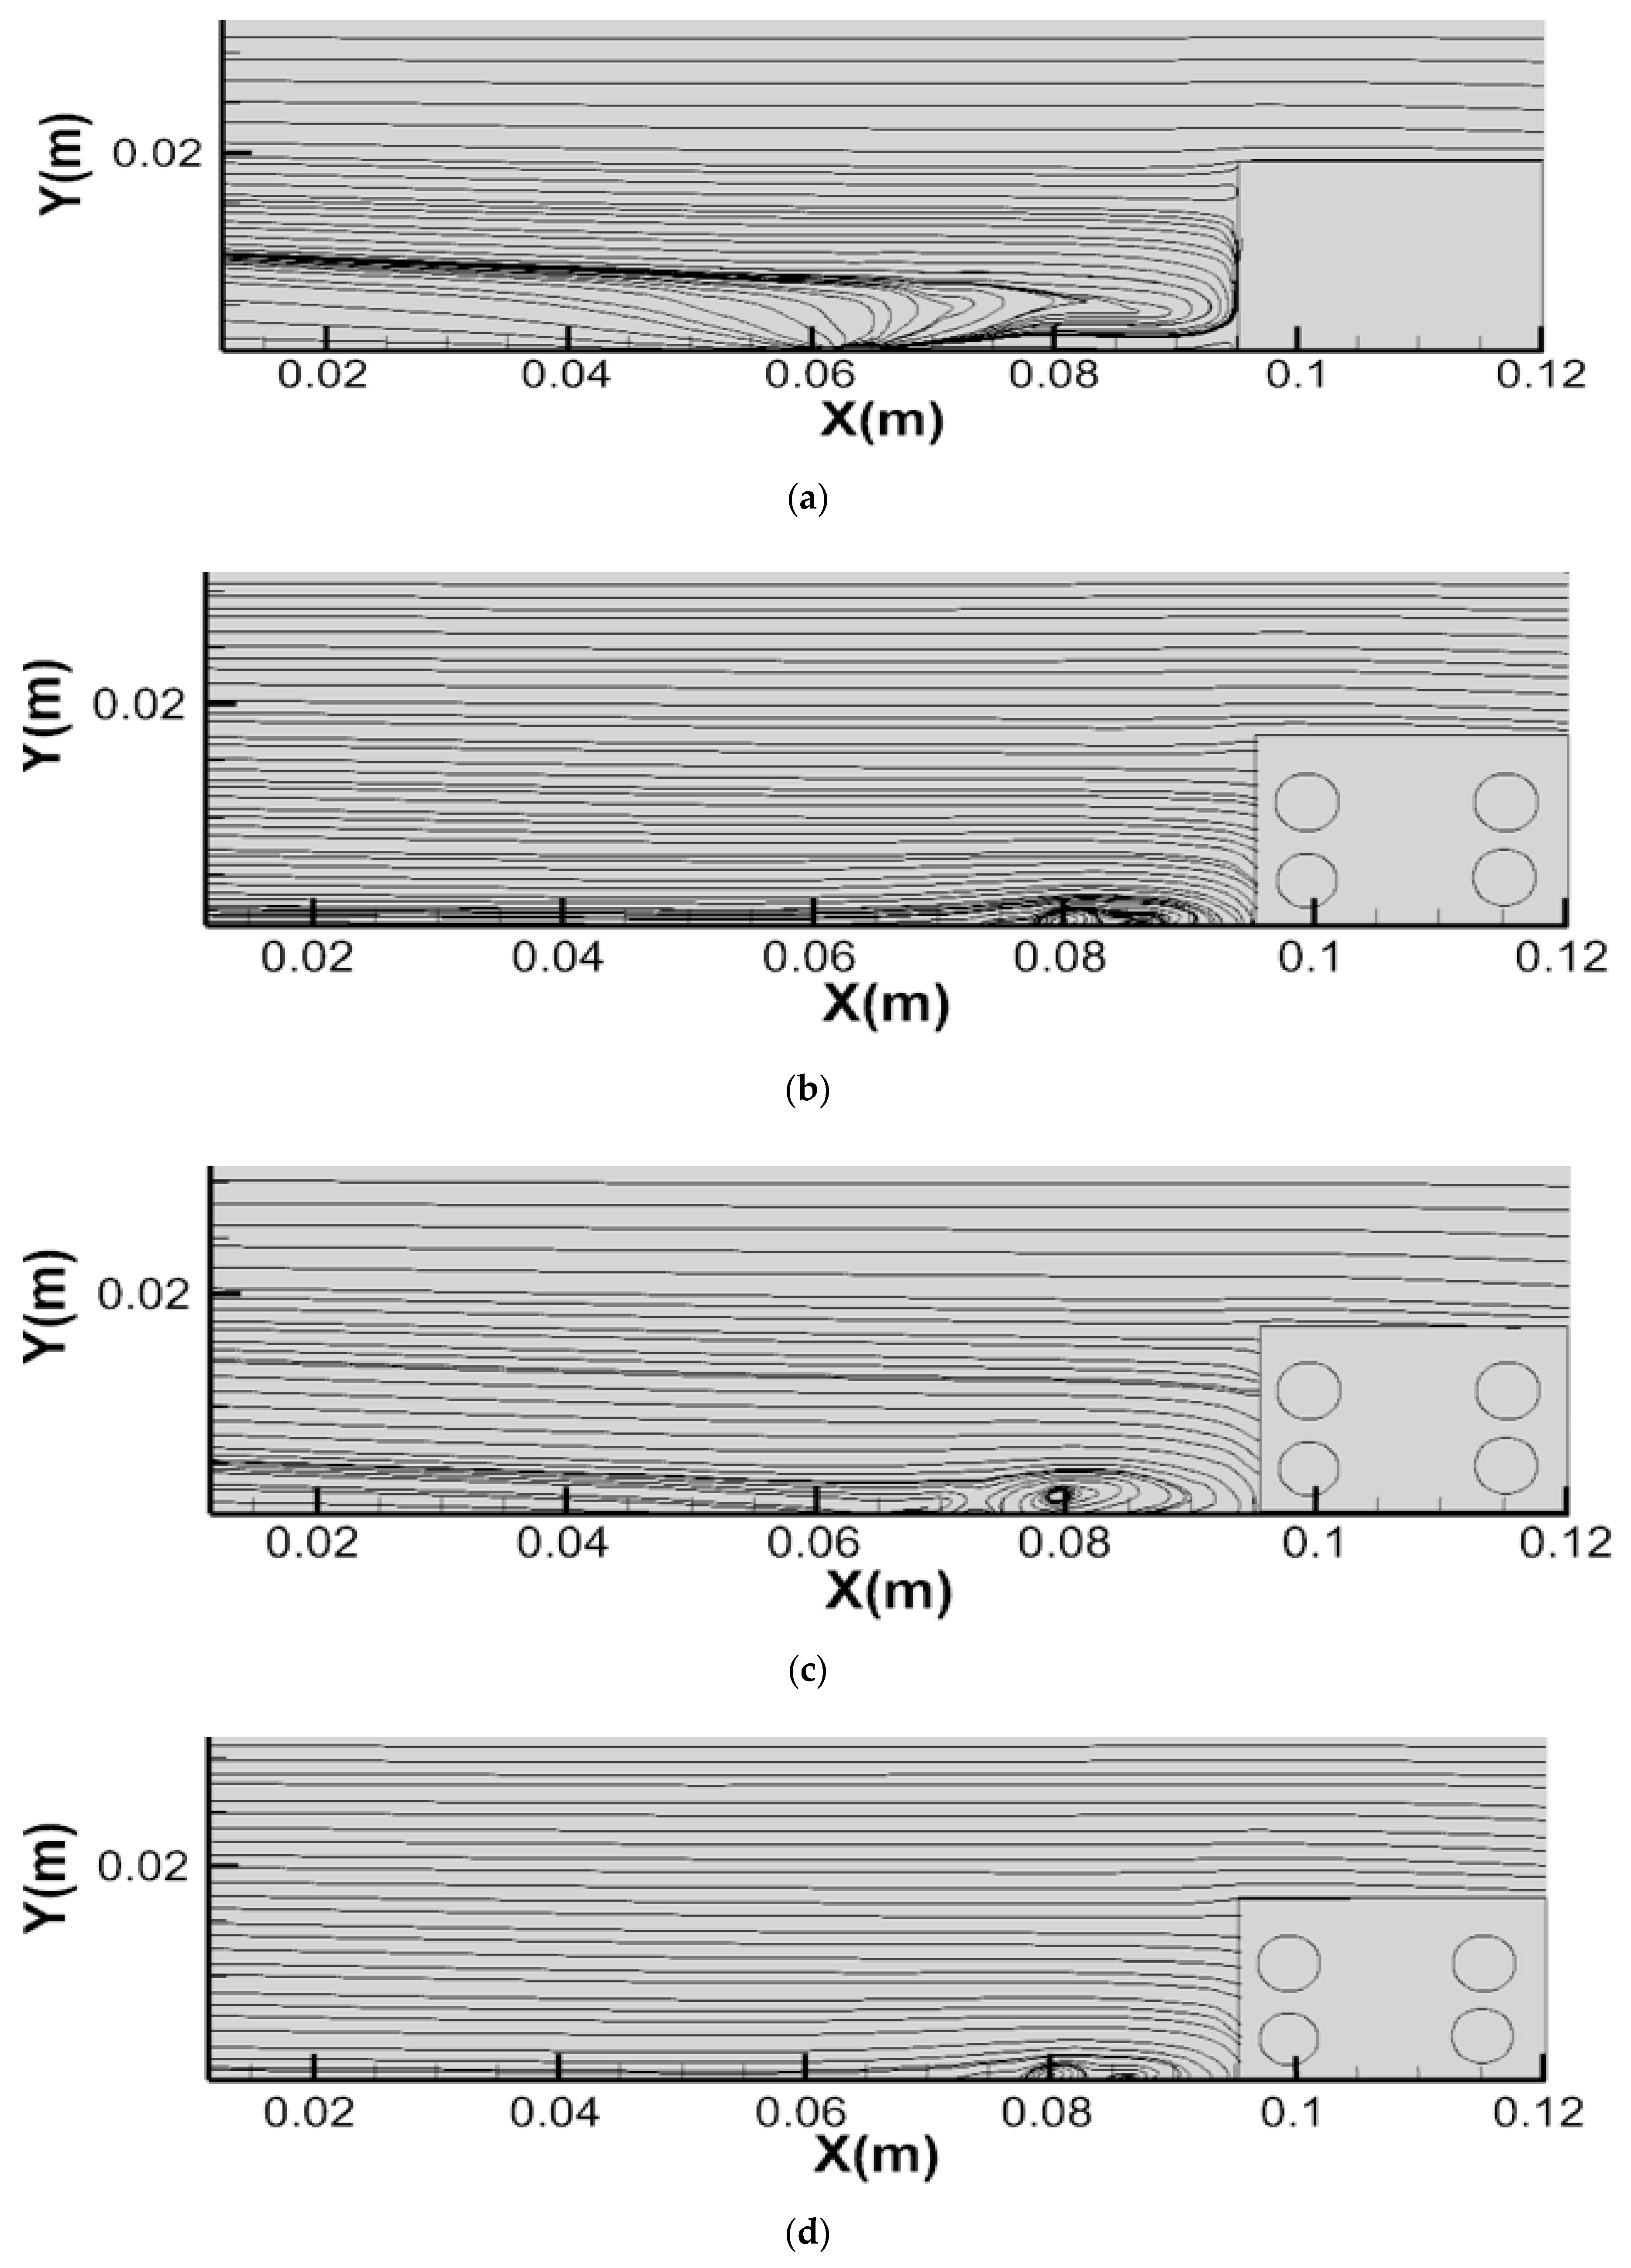
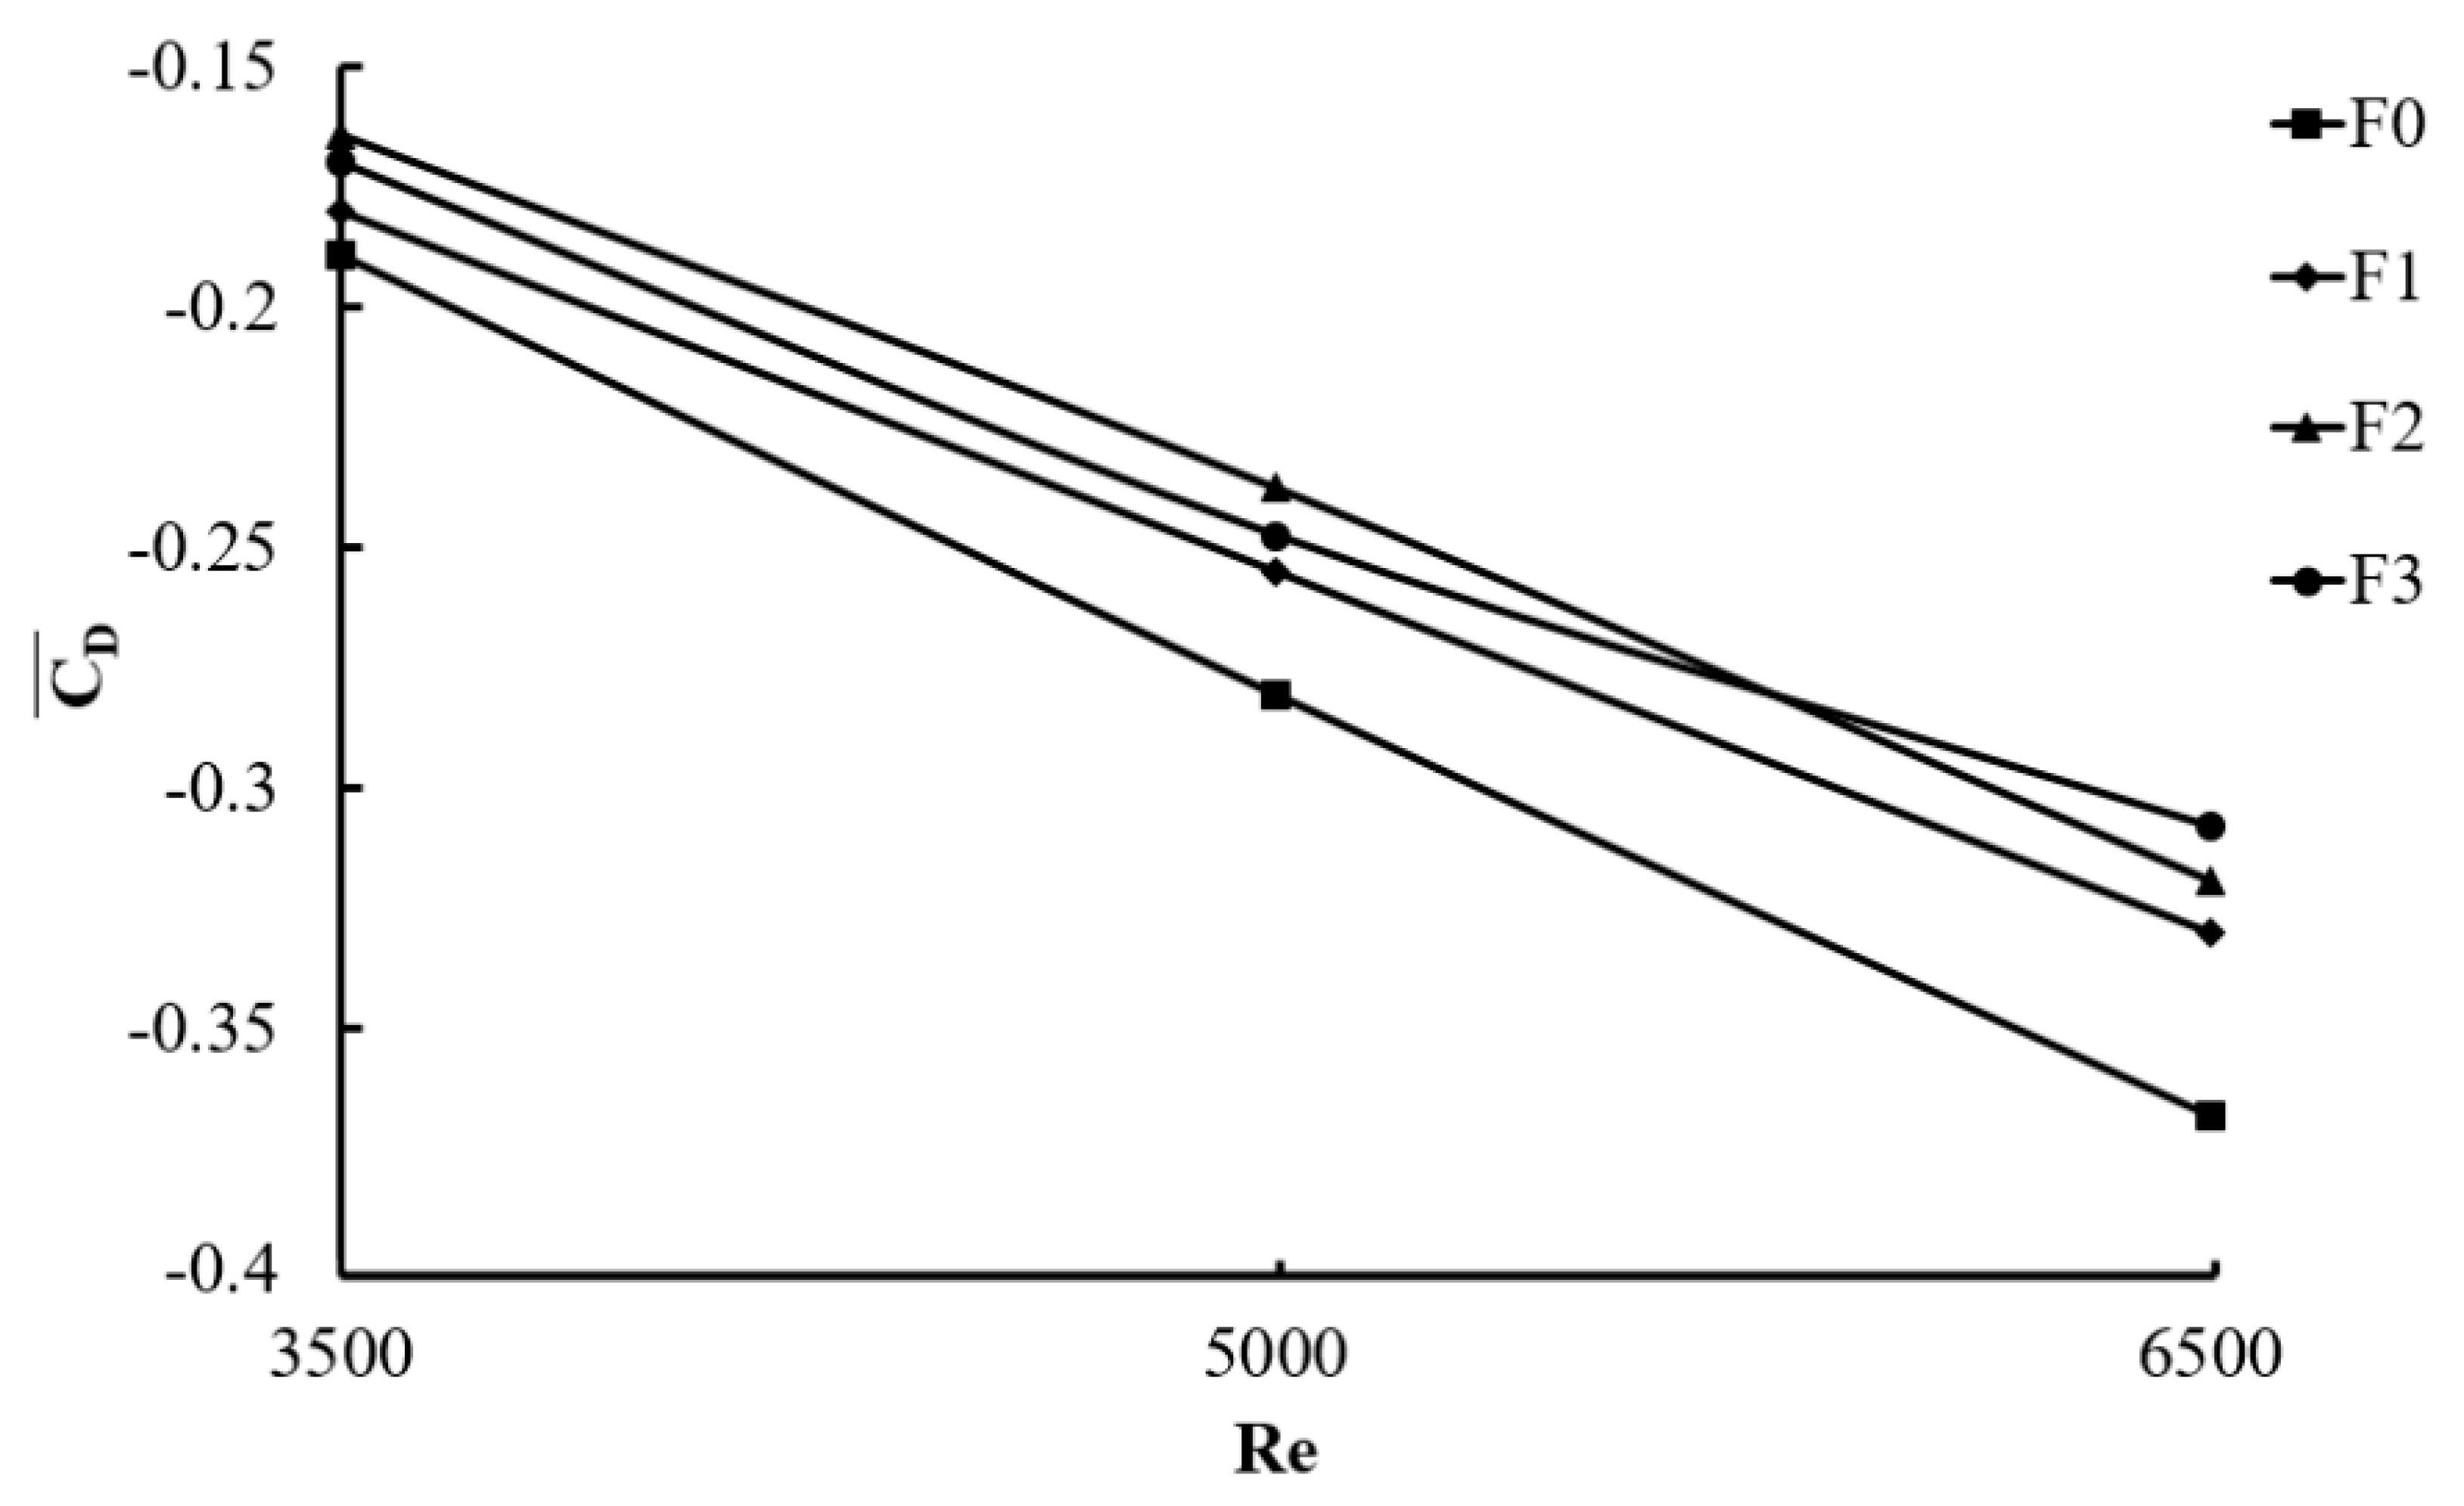
3.1. Influence of Protrusion Height on Flow Field

Figure 5 shows temperature contours as well as streamlines of F0 at Re = 6500 for X/L1 ranging from 2.57 to 2.24. Figure 6 displays temperature contours and streamlines of F1 at Re = 6500 for X/L1 ranging from 2.57 to 2.24. Figure 7 indicates temperature contours and streamlines of F2 at Re = 6500 for X/L1ranging from 2.57 to 2.24. Figure 8 shows temperature contour and streamlines of F3 at Re = 6500 for X/L1 ranging from 2.57 to 2.24. For the same X/L1, F2 case shows the temperature distributions near the base between the fin channels lower than the other cases. From Figure 5c, Figure 6c, Figure 7c and Figure 8c, the streamlines of X–Z cross sections at X = 110 indicate that increasing the dimple height can generate a vortex in the fin tunnel between the fins and produce the vortexes at both sides of the fin close to the base. Figure 9 indicates streamlines in the X–Y plane of F0, F1, F2, and F3 for Z/L1 = 0 and Re = 6500 at 300 s. Increasing the dimple height can influence the formation of vortex behind the fin channel. The vortex disappears in F1, and it appears in F2–F3. Furthermore, the greatest vortex appears in the highest dimple height (F3). The streamlines of F2 become closer than those of any other case; this means that it has the greatest velocity past the fin array.
To calculate the coefficients of drag, the authors need the grids from surface of fins to gain the shear force and pressure. C D is calculated by integrating all fin surfaces. The streamlines of the Z–X plane show that there are some small vortices between the fins. Figure 10 shows C D ¯ for different Re values. The absolute value of C D ¯ for F0 is the highest. With the increasing Re, the absolute values of C D ¯ for all models increase steadily, ranging from 29.3% to 32.4% at Re = 5000 and about 60.8% at Re = 6500. Compared with F0, the increasing rate of absolute value of C D ¯ is 5% for F1 and Re = 6500. Compared with F0, the increasing rate of absolute value of C D ¯ is 13.2% for F2 and 10.2% for F3 at Re = 3500; 9.1% for F1, 15.2% for F2, and 11.8% for F3 at Re = 5000; and 10.3% for F1, 13.1% for F2, and 16.3% for F3 at Re = 6500. This result means that, as the dimple height increases, the shear force exerting on fin array decreases along the negative X direction.

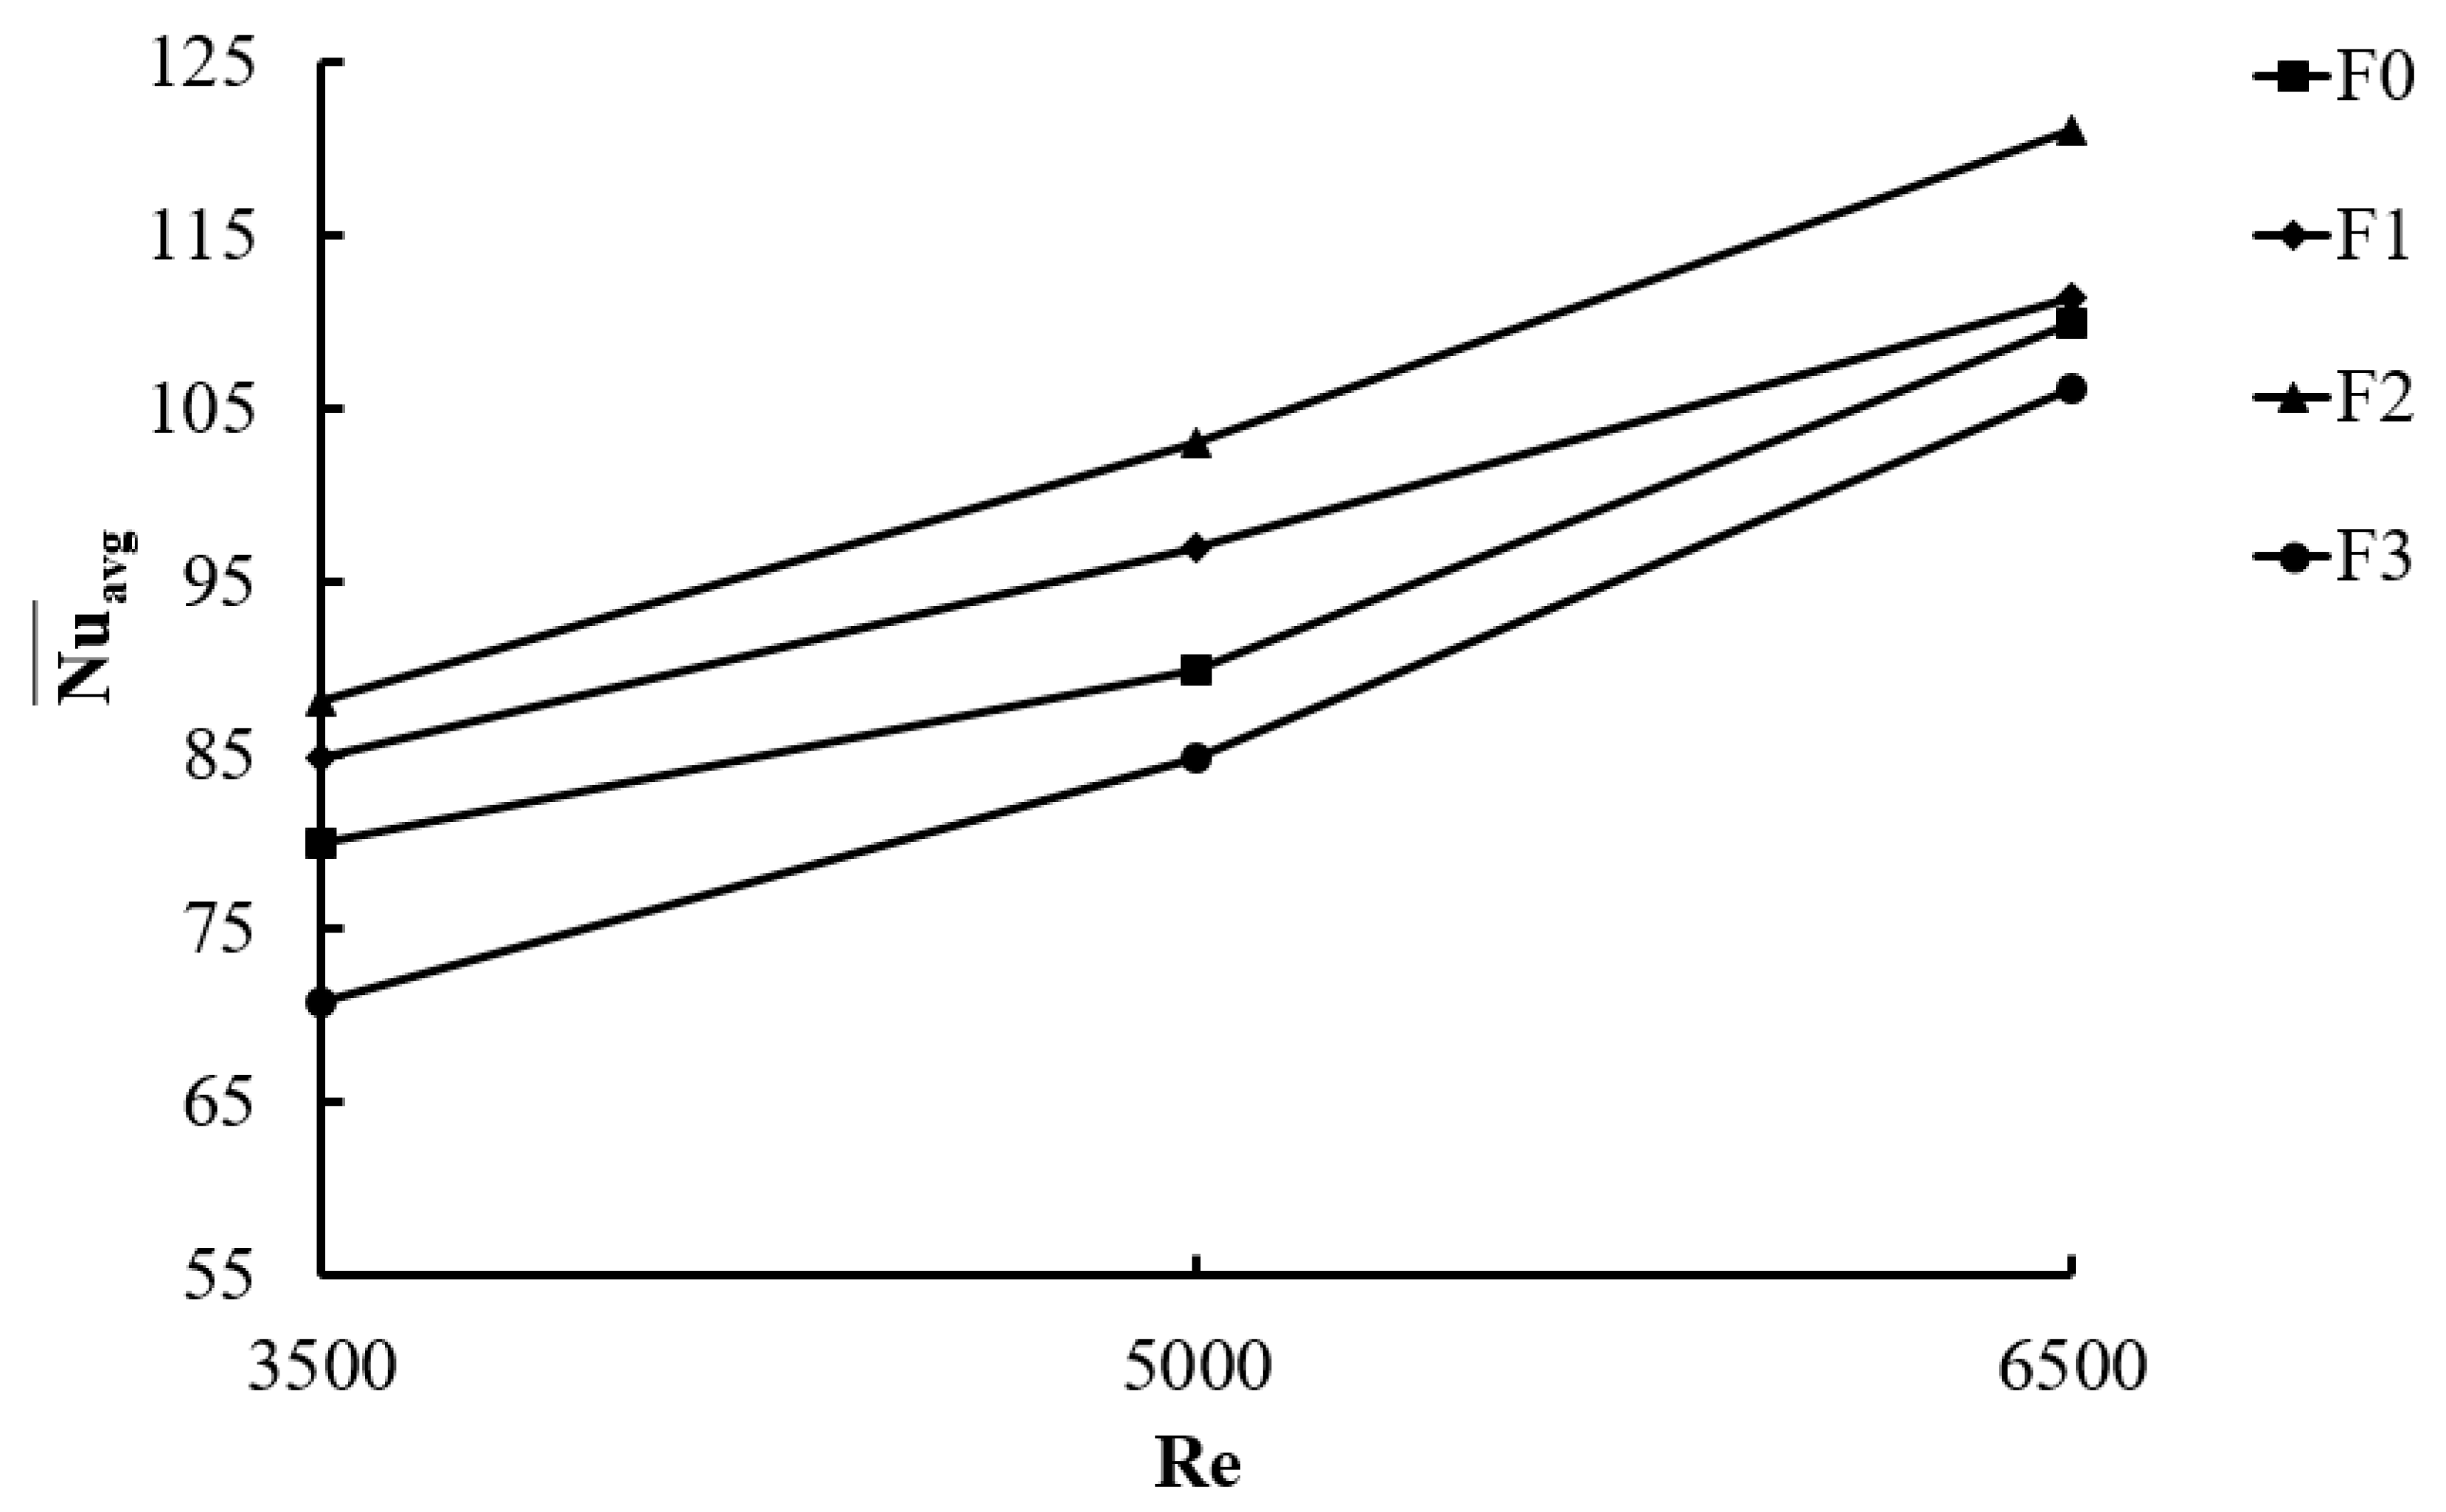
3.2. Influence of Different Heights of Protrusion on Heat Transfer Performance

The time-mean Nu was calculated by taking time mean over Nu in a time period. The averaged time-mean Nu is obtained by the values of the time-mean Nu on all grid points along the heated surface. From Figure 11, the averaged time-mean Nu of F2 is the highest among all cases, and the increase ranges from 10.2% to 14.4% compared with F0. The maximal rise in the averaged time-mean Nu occurs at Re = 5000. Increasing Re can force more air into the fin channels to transfer heat, but increasing the heat transfer area cannot absolutely attain the good heat transfer performance. Increasing dimple height is just like putting a block between fin, and it can then change the flow field. If the air cannot flow away from the surface efficiently, it still can acquire the low Nu, as the averaged time-mean Nu of F3 is smaller that of F0, ranging from 3.5% to 11.6%. The maximal decrease in the averaged time-mean Nu occurs at Re = 3500. From the study, the streamlines (in Figure 8) show that increasing the dimple height can produce vortexes between the convex/concave dimples and the fin base, but the largest dimple height has the strongest vortices and drags the air in the fin channels to gain the poorest heat transfer. Furthermore, the greatest vortex behind the fin channel appears in the largest dimple height (in Figure 9). However, the streamlines of F2 become closer than those of any other case; this means that it has the greatest velocity past the fin array. In this study, 0.8 mm is a proper dimple height to acquire the best heat transfer performance.

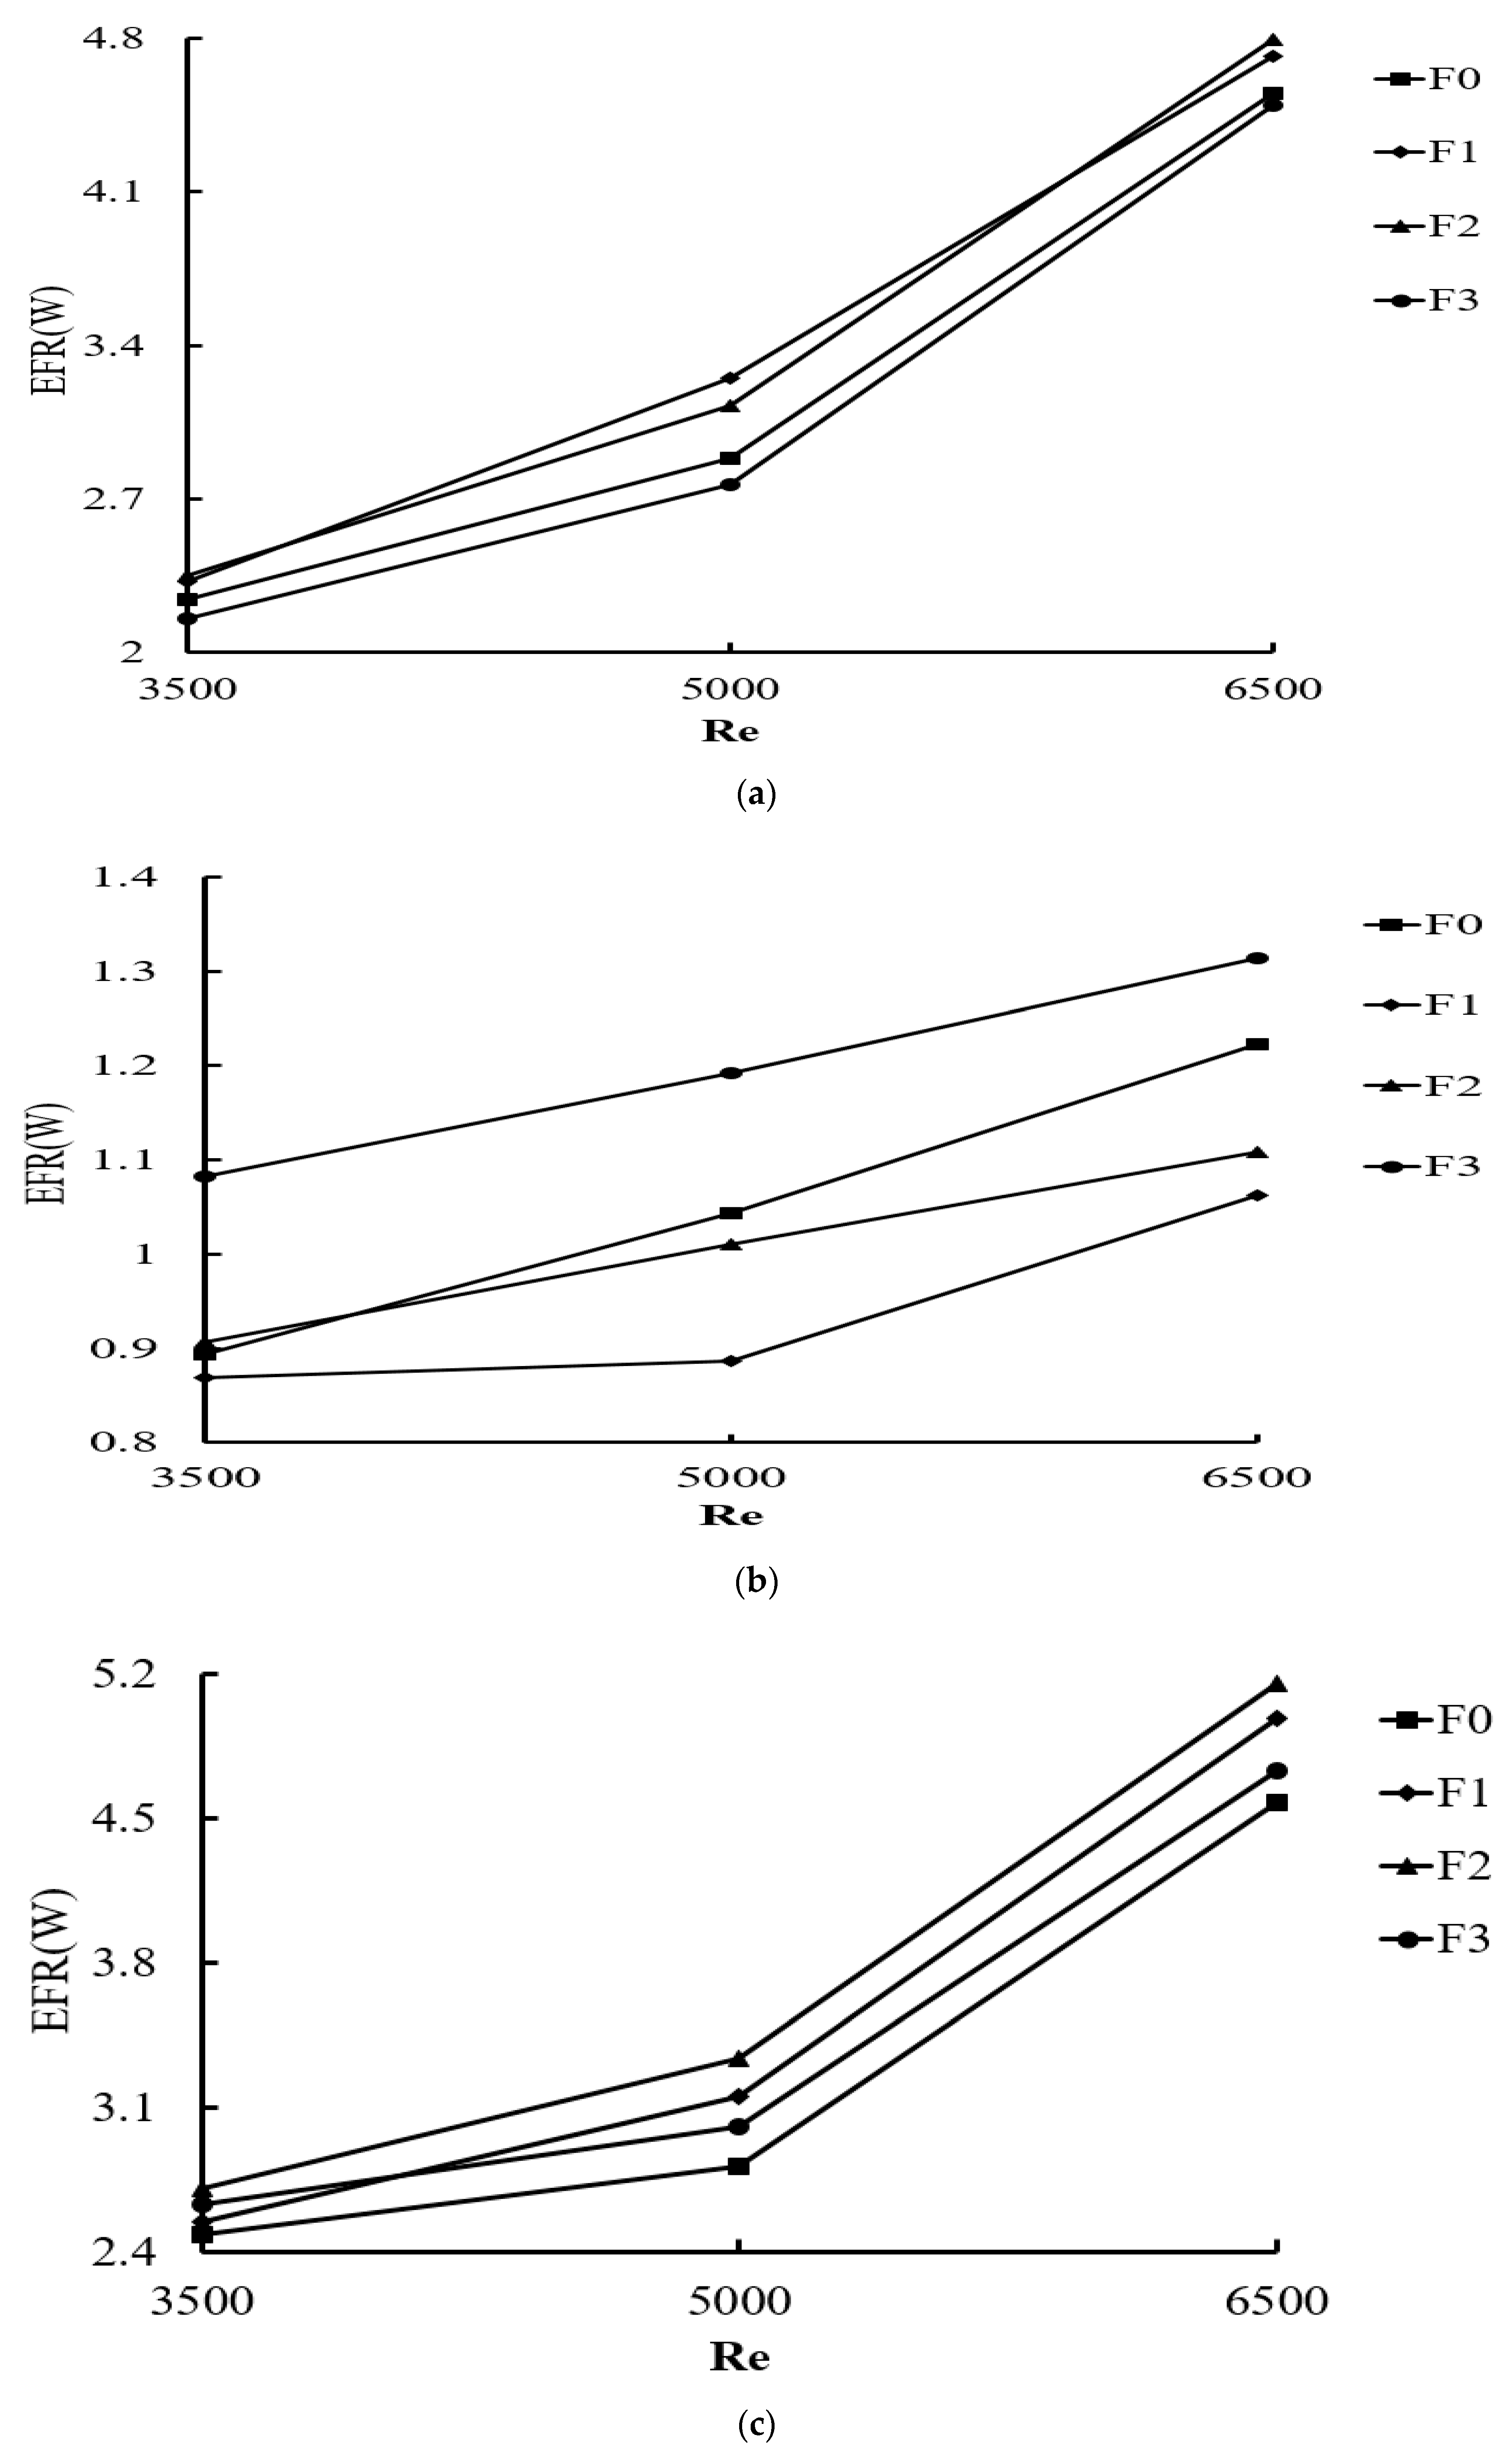
3.3. Analysis of Enthalpy Flow Rate (EFR)

It is known that, for fluid past a finite region, kinetic energy is much smaller than EFR, so this study considers the variation in EFR for simply identifying the effect on averaged time-mean Nu. When the air flows cross a fin array, the velocity and temperature for different outlet sections change so as to obtain different EFRs. The sum of EFR at top outlet and EFR at back outlet is greater than EFR at inlet, so it complies with the conservation of energy excluding the energy released by the heat source. Figure 12a shows that EFR levels at inlet of all models are very close at Re = 3500, and they change slightly with the increasing Re. When the air flows in the channels of fins, the air begins to transfer heat. The Nu of fin downstream is lower than that of fin upstream because the temperature of air increases. This can explain the trend of Nu as the position changes. When the air flows in the channel of fin, the dimple causes air to generate vortexes near the wall of dimple. Increasing the height of dimple can generate more vortexes at the same Re. It also causes the air to flow out from the top side and back side of fins. Figure 12b shows that increasing the height of dimples enhances the Y-axis velocity. This top outflow can help discharge the hot air and entrain the low temperature air surrounding the fins. It also generates the vortex near both sides of the fin array. Figure 12c shows that a dimple height of 0.8 mm exhibits the maximum EFR at back outlet, which is much higher than EFR at top outlet. As the fluid temperature at back outlet is greater than that at top outlet, the back outflow carries larger EFR than the top outflow. A dimple height of 0.8 mm has the greatest sum of EFR at top outlet and that at back outlet, so it leads to the maximum averaged time-mean Nu.

4. Conclusions

A transient three-dimensional turbulent heat transfer in multi-fin array is investigated numerically under three different dimple heights (04, 0.8, and 1.2) compared with the smooth multi-fin array at three different Re levels (3500, 5000, and 6500). This study also provides the temperature contours and streamlines to explain flow characteristic and heat transfer performance. The following conclusions are drawn according to the stated results and discussion.
The maximum temperature of the multi-fin array in four cases is reduced when Re rises. The averaged time-mean Nu then rises with rising Re. Vortex can appear between the convex/concave dimples and the fin base as the dimple height increases, whereas the greatest dimple height has the strongest vortices and drags the air in the fin channels to attain the poorest thermal convection. The dimple height equal to 0.8 mm has closer streamlines in the X–Y plane than any other case; that is, it has the greatest velocity past the fin array. The averaged time-mean Nu of the dimple height equal to 0.8 mm is the highest among all cases, and the increase rate ranges from 10.2% to 14.4% with Re compared with no-dimple multi-fin array. The averaged time-mean Nu of dimple height equal to 1.2 mm is the lowest among all cases, and the reduction rate ranges from 3.5% to 11.6% compared with no-dimple fin array. The trend of enthalpy flow rates with Re for dimple height of 0.8 mm is found to agree with that of averaged time-mean Nu. The dimple height equal to 0.8 mm (D/(2R) = 16% for small dimple and D/(2R) = 11% for large dimple) can obtain the best heat transfer performance.

Author Contributions

Conceptualization, H.-W.W. and T.-H.C.; methodology, T.-H.C.; software, T.-H.C.; validation, D.-A.H. and N.-P.K.; formal analysis, T.-H.C.; investigation, N.-P.K.; resources, H.-W.W.; data curation, D.-A.H.; writing—original draft preparation, T.-H.C.; writing—review and editing, H.-W.W.; visualization, D.-A.H.; supervision, H.-W.W.; project administration, H.-W.W.; funding acquisition, H.-W.W. All authors have read and agreed to the published version of the manuscript.

Funding

The authors wish to express their appreciation to the Ministry of Science and Technology of the Republic of China for the partial financial assistance with grant no. MOST 104-2221-E-006-197-MY3.

Acknowledgments

The authors wish to express their appreciation to the Ministry of Science and Technology of the Republic of China for the partial financial assistance with grant no. MOST 104-2221-E-006-197-MY3.

Conflicts of Interest

The authors declare no conflicts of interest.

Nomenclature

AArea
C D Drag coefficient ( F D / 1 2 ρ V 2 A )
C p Specific heat ( J / k g · K )
C S Smagorinsky constant
DHeight of convex dimple or depth of concave dimple
EFREnthalpy flow rate (kW) (= ρ A i V i h i )
F D Drag force
hSpecific enthalpy
KThermal conductivity ( W / m K )
LLength
L1Length of fin
NuNusselt number ( ( q L 1 ) / [ k ( T w T ) ] )
pPressure ( N / m 2 )
PrPrandtl number ( ν / α )
q Heat flux ( W / m 2 )
RDimple inner radius (mm)
ReReynolds number ( ρ V L 1 / μ )
S ij Rate of strain tensor
TTemperature(K)
TTime(s)
u τ Friction velocity ( τ W ρ ¯ )
y n + Dimensionless distance from the wall ( y w u τ ν )
X, Y, ZCartesian coordinates (m)

Greek Symbols

Δ Filter width
μ Dynamic viscosity ( k g / m s )
ν Kinematic viscosity ( m 2 / s )
α Thermal diffusivity ( m 2 / s )
ρ Density ( k g / m 3 )
σ i j Stress tensor
τ Shear stress
τ i j SGS stress tensor

Superscript

̶Time mean
~Spatial filtering indication

Subscripts

avgAveraged area
iComponent or grid
wWall
TTurbulence
Ambient

References

  1. Zografos, A.I.; Sunderland, J.E. Natural convection from pin fin arrays. Exp. Therm. Fluid Sci. 1990, 3, 440–449. [Google Scholar] [CrossRef]
  2. Ledezma, G.; Bejan, A. Heat sinks with sloped plate fins in natural and forced convection. Int. J. Heat Mass Transf. 1996, 39, 1773–1783. [Google Scholar] [CrossRef]
  3. Goshayeshi, H.R.; Fahiminia, M.; Naserian, M.M. Numerical modeling of natural convection on various configuration of rectangular fin arrays on vertical base plates. World Acad. Sci. Eng. Techno. 2011, 73, 91–96. [Google Scholar]
  4. Chang, S.-W.; Wu, H.W.; Guo, D.-Y.; Shi, J.-J.; Chen, T.-H. Heat transfer enhancement of vertical dimpled fin array in natural convection. Int. J. Heat Mass Transf. 2017, 106, 781–792. [Google Scholar] [CrossRef]
  5. Afanasyev, V.; Chudnovsky, Y.; Leontiev, A.; Roganov, P. Turbulent flow friction and heat transfer characteristics for spherical cavities on a flat plate. Exp. Therm. Fluid Sci. 1993, 7, 1–8. [Google Scholar] [CrossRef]
  6. Chang, S.; Chiang, K.; Yang, T.; Huang, C. Heat transfer and pressure drop in dimpled fin channels. Exp. Therm. Fluid Sci. 2008, 33, 23–40. [Google Scholar] [CrossRef]
  7. Ligrani, P.; Mahmood, G.I.; Harrison, J.; Clayton, C.; Nelson, D. Flow structure and local Nusselt number variations in a channel with dimples and protrusions on opposite walls. Int. J. Heat Mass Transf. 2001, 44, 4413–4425. [Google Scholar] [CrossRef]
  8. Fazli, M.; Raisee, M. Computation of flow and heat transfer through channels with periodic dimple/protrusion walls using low-Reynolds number turbulence models. Int. J. Numer. Methods Heat Fluid Flow 2019, 29, 1178–1207. [Google Scholar] [CrossRef]
  9. Luo, L.; Du, W.; Wang, S.; Wu, W.; Zhang, X. Multi-objective optimization of the dimple/protrusion channel with pin fins for heat transfer enhancement. Int. J. Numer. Methods Heat Fluid Flow 2019, 29, 790–813. [Google Scholar] [CrossRef]
  10. Sobhani, E.; Ghaffari, M.; Maghrebi, M.J. Numerical investigation of dimple effects on darrieus vertical axis wind turbine. Energy 2017, 133, 231–241. [Google Scholar] [CrossRef]
  11. Jung, H.-Y.; Kim, K.-Y. Thermal-hydraulic performance of a multiple jet cooling module with a concave dimple array in a helium-cooled divertor. Fusion Eng. Des. 2017, 114, 102–112. [Google Scholar] [CrossRef]
  12. Kim, S.-M.; Jo, J.-H.; Lee, Y.-E.; Yoo, Y.-S. Comparative study of shell and helically-coiled tube heat exchangers with various dimple arrangements in condensers for odor control in a Pyrolysis System. Energies 2016, 9, 1027. [Google Scholar] [CrossRef] [Green Version]
  13. Zhou, H.; Wang, G.; Ding, Y.; Yang, J.; Zhai, H. Investigation of the effect of dimple bionic nonsmooth surface on tire antihydroplaning. Appl. Bionics Biomech. 2015, 2015, 1–10. [Google Scholar] [CrossRef] [PubMed]
  14. Xie, G.; Liu, J.; Ligrani, P.M.; Zhang, W. Numerical analysis of flow structure and heat transfer characteristics in square channels with different internal-protruded dimple geometrics. Int. J. Heat Mass Transf. 2013, 67, 81–97. [Google Scholar] [CrossRef]
  15. Rao, Y.; Wan, C.; Zang, S. An experimental and numerical study of flow and heat transfer in channels with pin fin-dimple combined arrays of different configurations. J. Heat Transf. 2012, 134, 121901. [Google Scholar] [CrossRef]
  16. Sethi, M. An experimental and numerical study of flow and heat transfer in channels with Pin Fin-dimple combined arrays of different configurations. J. Renew. Sustain. Energy 2012, 4, 023112. [Google Scholar] [CrossRef]
  17. Lan, J.; Xie, Y.; Zhang, D. Effect of leading edge boundary layer thickness on dimple flow structure and separation control. J. Mech. Sci. Technol. 2011, 25, 3243–3251. [Google Scholar] [CrossRef]
  18. Dees, J.E.; Bogard, D.G.; Bunker, R.S. Heat transfer augmentation downstream of rows of various dimple geometries on the suction side of a gas turbine airfoil. J. Turbomach. 2010, 132, 031010. [Google Scholar] [CrossRef]
  19. Mitsudharmadi, H.; Tay, C.M.J.; Tsai, H.M. Effect of rounded edged dimple arrays on the boundary layer development. J. Vis. 2009, 12, 17–25. [Google Scholar] [CrossRef]
  20. Won, S.Y.; Ligrani, P.M. Flow characteristics along and above dimpled surfaces with three different dimple depths within a channel. J. Mech. Sci. Technol. 2007, 21, 1901–1909. [Google Scholar] [CrossRef]
  21. Rao, Y.; Wan, C.; Xu, Y. An experimental study of pressure loss and heat transfer in the pin fin-dimple channels with various dimple depths. Int. J. Heat Mass Transf. 2012, 55, 6723–6733. [Google Scholar] [CrossRef]
  22. Li, M.; Chen, X.; Ruan, X. Investigation of flow structure and heat transfer enhancement in rectangular channels with dimples and protrusions using large eddy simulation. Int. J. Therm. Sci. 2020, 149, 106207. [Google Scholar] [CrossRef]
  23. Elyyan, M.A.; Tafti, D.K. Large eddy simulation investigation of flow and heat transfer in a channel with dimples and protrusions. J. Turbomach. 2008, 130, 041016. [Google Scholar] [CrossRef]
  24. Sato, N.; Inagaki, M.; Kaneda, K.; Horinouchi, N.; Ota, A. Numerical investigation of the effect of Prandtl number on heat transfer in a dimpled-channel flow. Int. J. Heat Fluid Flow 2017, 68, 139–150. [Google Scholar] [CrossRef]
  25. Torregrosa, A.; Gil, A.; Quintero, P.; Ammirati, A.; Denayer, H.; Desmet, W. Prediction of flow induced vibration of a flat plate located after a bluff wall mounted obstacle. J. Wind. Eng. Ind. Aerodyn. 2019, 190, 23–39. [Google Scholar] [CrossRef]
  26. Le Hocine, A.E.B.; Lacey, R.W.J.; Poncet, S. Turbulent flow over a D-section bluff body: A numerical benchmark. Environ. Fluid Mech. 2018, 19, 435–456. [Google Scholar] [CrossRef]
  27. Alam, J.; Fitzpatrick, L.P. Large eddy simulation of flow through a periodic array of urban-like obstacles using a canopy stress method. Comput. Fluids 2018, 171, 65–78. [Google Scholar] [CrossRef]
  28. Lu, H.; Zhao, W.; Zhang, H.; Wang, B.; Wang, X.-L. Three-dimensional turbulent flow over cube-obstacles. Chin. Phys. B 2017, 26, 14703. [Google Scholar] [CrossRef]
  29. Saeedi, M.; Wang, B.-C. Large-eddy simulation of turbulent flow around a finite-height wall-mounted square cylinder within a thin boundary layer. Flow, Turbul. Combust. 2016, 97, 513–538. [Google Scholar] [CrossRef]
  30. Hao, Z.; Gorlé, C. Large eddy simulations of forced heat convection in a pin-fin array with a priori examination of an eddy-viscosity turbulence model. Int. J. Heat Fluid Flow 2019, 77, 73–83. [Google Scholar] [CrossRef]
  31. Toubiana, E.; Russeil, S.; Bougeard, D.; François, N. Large Eddy simulation and Reynolds-averaged Navier–Stokes modeling of flow in staggered plate arrays: Comparison at various flow regimes. Appl. Therm. Eng. 2015, 89, 405–420. [Google Scholar] [CrossRef]
  32. Paniagua, L.; Lehmkuhl, O.; Oliet, C.; Pérez-Segarra, C.D. Large eddy simulations (LES) on the flow and heat transfer in a wall-bounded pin matrix. Numer. Heat Transf. Part B Fundam. 2014, 65, 103–128. [Google Scholar] [CrossRef]
  33. Chen, J.G.; Zhou, Y.; Zhou, T.M.; Antonia, R.A. Three-dimensional vorticity, momentum and heat transport in a turbulent cylinder wake. J. Fluid Mech. 2016, 809, 135–167. [Google Scholar] [CrossRef]
  34. Yang, K.-S.; Ferziger, J.H.; Ferzigert, J.H. Large-eddy simulation of turbulent obstacle flow using a dynamic subgrid-scale model. AIAA J. 1993, 31, 1406–1413. [Google Scholar] [CrossRef]
  35. Franke, J.; Frank, W. Large eddy simulation of the flow past a circular cylinder at ReD= 3900. J. Wind. Eng. Ind. Aerodyn. 2002, 90, 1191–1206. [Google Scholar] [CrossRef]
  36. Ma, X.; Karamanos, G.-S.; Karniadakis, G. Dynamics and low-dimensionality of a turbulent near wake. J. Fluid Mech. 2000, 410, 29–65. [Google Scholar] [CrossRef] [Green Version]
  37. Ong, L.; Wallace, J. The velocity field of the turbulent very near wake of a circular cylinder. Exp. Fluids 1996, 20, 441–453. [Google Scholar] [CrossRef]
  38. Johnson, R.W. The Handbook of Fluid Dynamics; CRC Press: New York, NY, USA, 1998; pp. 1487–1488. [Google Scholar]
  39. Smagorinsky, J. General circulation experiments with the primitive equations. Mon. Weather Rev. 1963, 91, 99–164. [Google Scholar] [CrossRef]
  40. Jayatilleke, C.L.V. The influence of Prandtl number and surface roughness on the resistance of the laminar sublayer to momentum and heat transfer. Prog. Heat Mass Transf. 1969, 1, 193–329. [Google Scholar]
  41. Lockett, J.F. Heat Transfer from Toughened Surfaces Using Laser Interferometers. Ph.D. Thesis, Department of Mechanical Engineering, The City University, London, UK, 1987. [Google Scholar]
  42. Tsui, Y.-Y. A study of upstream-weighted high-order differencing for approximation to flow convection. Int. J. Numer. Methods Fluids 1991, 13, 167–199. [Google Scholar] [CrossRef]
  43. Deng, G.B.; Piquet, J.; Queutey, P.; Visonneau, M. A new fully coupled solution of the Navier-Stokes equations. Int. J. Numer. Methods Fluids 1994, 19, 605–639. [Google Scholar] [CrossRef]
  44. Patankar, S.V. Numerical Heat Transfer and Fluid Flow; Informa UK Limited: London, UK, 2018. [Google Scholar]
  45. Ahn, J.; Lee, J.S. Large eddy simulation of flow and heat transfer in a channel with a detached rib array. Int. J. Heat Mass Transf. 2010, 53, 445–452. [Google Scholar] [CrossRef]
Figure 1. Configuration of fin array with alternate convex/concave dimples.
Inventions 05 00033 g001
Figure 2. Size details of a fin: (a) top view and (b) front view.
Inventions 05 00033 g002
Figure 3. Geometrical model and boundary conditions (size unit: mm).
Inventions 05 00033 g003
Figure 4. Comparison of results between Ahn [45] and the present study.
Inventions 05 00033 g004
Figure 5. Temperature contours and streamlines of F0: (a) X/L1 = 2.57, (b) X/L1 = 2.40, and (c) X/L1 = 2.24 for Re = 6500 at 300 s.
Inventions 05 00033 g005
Figure 6. Temperature contours and streamlines of F1: (a) X/L1 = 2.57, (b) X/L1 = 2.40, and (c) X/L1 = 2.24 for Re = 6500 at 300 s.
Inventions 05 00033 g006
Figure 7. Temperature contours and streamlines of F2: (a) X/L1 = 2.57, (b) X/L1 = 2.40, and (c) X/L1 = 2.24 for Re = 6500 at 300 s.
Inventions 05 00033 g007
Figure 8. Temperature contours and streamlines of F3: (a) X/L1 = 2.57, (b) X/L1 = 2.40, and (c) X/L1 = 2.24 for Re = 6500 at 300 s.
Inventions 05 00033 g008
Figure 9. Streamlines of (a) F0, (b) F1, (c) F2, and (d) F3 for Z/L1 = 0 and Re = 6500 at 300 s.
Inventions 05 00033 g009
Figure 10. Comparison of time-mean drag coefficient with Re.
Inventions 05 00033 g010
Figure 11. Variation of averaged time-mean Nu with Re.
Inventions 05 00033 g011
Figure 12. Enthalpy flow rate (EFR) of (a) the inlet, (b) the top outlet, and (c) the back outlet.
Inventions 05 00033 g012
Table 1. Mesh and time step for each model.
ModelMesh SymbolMeshTime Step SymbolTime Step (Sec)
F0M12,201,819T10.2
M22,969,578T20.3
M33,365,018T30.4
F1M12,054,326T10.2
M22,986,580T20.3
M33,280,354T30.4
F2M12,029,788T10.2
M22,717,655T20.3
M33,258,359T30.4
F3M12,086,485T10.2
M22,820,624T20.3
M33,310,515T30.4
Table 2. Result of the mesh independent test.
F0F1
Symbol M a x | e r r o r | Symbol M a x | e r r o r |
F0M3T10F1M3T10
F0M3T20.0194%F1M3T20.0226%
F0M3T30.0316%F1M3T30.0343%
F0M1T20.0029%F1M1T20.0239%
F0M2T20.0199%F1M2T20.2365%
F0M2T10.0666%F1M2T10.0133%
F0M2T30.0316%F1M2T30.0359%
F2F3
Symbol M a x | e r r o r | Symbol M a x | e r r o r |
F2M3T10F3M3T10
F2M3T20.0259%F3M3T20.0233%
F2M3T30.0389%F3M3T30.0346%
F2M1T20.273%F3M1T20.0246%
F2M2T20.0752%F3M2T20.0066%
F2M2T10.04364%F3M2T10.0663%
F2M2T30.0912%F3M2T30.0353%

